2019 full year results - asx › asxpdf › 20191031 › pdf › 44b2vdjjwrfr17.pdf · res ult s p...
TRANSCRIPT

2019 FULL YEAR RESULTS
—F U L L Y E A R E N D E D 3 0 S E P T E M B E R 2 0 1 9
R E S U LT S P R E S E N TAT I O N &
I N V E S T O R D I S C U S S I O N PA C K
For
per
sona
l use
onl
y

2019 FULL YEAR RESULTS
1
CEO and CFO Results Presentations 2
CEO Presentation 2
CFO Presentation 16
Group & Divisional Financial Performance 35
Group including impact of large / notable items 36
Australia Retail & Commercial 48
Institutional 53
New Zealand Division 60
Wealth Australia 65
Treasury 67
Risk Management 78
Housing Portfolio 91
Royal Commission update & Regulatory reforms 107
Corporate Overview and Sustainability 110
All figures within this investor discussion pack are presented on Cash Profit (Continuing operations) basis in Australian Dollars unless otherwise noted. In arriving at Cash Profit, Statutory Profit has been adjusted to exclude non-core items, further information is set out on page 77-81 of the 2019 Full Year Consolidated Financial Report.
CONTENTS
For
per
sona
l use
onl
y

2019 FULL YEAR RESULTS
—
2
S H AY N E E L L I OT T
C H I E F E X EC U T I V E O F F I C E R
For
per
sona
l use
onl
y

FINANCIAL SNAPSHOT
31. Includes the impact of large / notable items
FY19 FY19 v FY18
Statutory Profit ($m) 5,953 -7%
Cash Profit (continuing operations)1 ($m) 6,470 0%
Return on Equity 10.9% -10bps
Earnings Per Share (cents) 228 +2%
Dividend Per Share (cents) 160 flat
Franking (FY19 avg) 85% -15%
CET1 Ratio (APRA) 11.4% stable
Total Capital (CET1) ($m) 47,355 +6%
Net Tangible Assets Per Share ($) 19.59 +6%
Shares on issue (end of period #m) 2,835 -1%
Risk Weighted Assets ($b) 417 +7%
• Solid result in a challenging environment
• Disciplined approach to balance sheet growth
• Capital management driving real benefits to shareholders
For
per
sona
l use
onl
y

BALANCE SHEET STRENGTH
CET1 RATIO (LEVEL 2) NET ORGANIC CAPITAL GENERATION
NTA PER SHARE CREDIT QUALITY
% bps $ IEL2 bps
4
CAPITAL & CREDIT QUALITY
1. Pro-Forma includes benefits from P&I settlement of ~20bps, partially offset by reduction from AASB16 impacts (~7bps)2. IEL = Internal Expected Loss, long run loss rate as a % of GLA
9.6
10.6
11.4 11.5
Sep-16
Sep-17
Sep-19 Pro-
Forma1
Sep-18
179
229
182
165
158
FY19FY17FY16 FY18
Full Yr. Avg. FY12-FY18
35
32
2726
Sep-18
Sep-17
Sep-16
Sep-19
17.1317.66
18.4719.59
Sep-16
Sep-19
Sep-17
Sep-18
For
per
sona
l use
onl
y

Our Purpose is to shape a world where people and communities thrive
OUR PURPOSE & STRATEGY
5
• Targeted growth • Lower cost • Lower risk • Capital efficient
Our strategy is to generate decent returns by improving the financial well-being of our customers, having the right people who listen, learn and adapt; putting the best tools and insights into their hands, and focusing on those few
things that add value to customers and doing them right the first time
For
per
sona
l use
onl
y

6 POINT PLAN
6
Running the business well
Maintaining discipline within Institutional
Resolving our challenges in NZ
Investing to prepare Australia for growth
Driving further simplification
Building the team’s resilience and capability
1
2
3
4
5
6
FOCUSING RESOURCES TO DELIVER FOR CUSTOMERS, SHAREHOLDERS & THE COMMUNITY
For
per
sona
l use
onl
y

RUN THE BUSINESS WELL
AUSTRALIA RETAIL AND COMMERCIAL
7
Changed our management structure & team
Continuing to invest in process redesign
Refining credit policies within a prudent risk appetite
Delegating more decisions to front line
Monitoring key operational metrics
Focusing on improving operational capacity and approval turnaround time
LAUNCHED A MAJOR HOUSING MARKETING CAMPAIGN
For
per
sona
l use
onl
y

RUN THE BUSINESS WELL
CUMULATIVE CUSTOMER REMEDIATION CHARGE
Pre tax $m
CUSTOMER REMEDIATION
8
51153
220
Mar-17 Sep-17 Sep-19Mar-18 Sep-18 Mar-19
753
928
1,579
Continuing operations Discontinued (Wealth businesses)
>1,000 people progressing remediation activities
For
per
sona
l use
onl
y

RUN THE BUSINESS WELL
GROUP INTERNAL EXPECTED LOSS1 DIVISIONAL INTERNAL EXPECTED LOSS1
bps bps
IMPROVED RISK PROFILE
9
4744
37 3633
35 3532
27 26
Sep-17
Sep-10
Sep-11
Sep-12
Sep-13
Sep-15
Sep-14
Sep-16
Sep-18
Sep-19
0
10
20
30
40
50
60
70
Sep-16
Sep-14
Sep-11
Sep-13
Sep-10
Sep-12
Sep-17
Sep-15
Sep-18
Sep-19
InstitutionalNew Zealand Australia Retail & Commercial
1. IEL = Internal Expected Loss, long run loss rate as a % of GLA
For
per
sona
l use
onl
y

RUN THE BUSINESS WELL
RISK ADJUSTED MARGINS1,2 EXPENSE MANAGEMENT2 CREDIT QUALITY
$m $m
10
MAINTAIN DISCIPLINE WITHIN INSTITUTIONAL
1. Institutional (ex. Markets) net interest income divided by average credit risk weighted assets2. Continuing operations excluding large / notable items3. FY17 has not been restated for AASB 15 impacts
2.04%
2.20%2.28%
FY17 FY18 FY19
2,7722,661
2,575
6,135
5,5665,458
FY19FY18FY173
Expenses FTE #
757
442
265
FY19
0.0%0.1%
FY17 FY18
0.0%
Gross impaired assets
Credit impairment charge as a % of GLA
For
per
sona
l use
onl
y

RUN THE BUSINESS WELL
NEW ZEALAND
11
BS11 (Outsourcing Policy)
Requires all large banks in New Zealand to have compliant outsourcing arrangements
by 2022
To ensure banks can continue to run, manage, and provide banking services to
NZ customers on a standalone basis if required
RBNZ Capital Review Paper 4
Expected to be finalised in Dec 2019
Relates to the amount of regulatory capital required of locally incorporated banks
Impacts Group capital requirements as New Zealand is required to retain earnings & reduce
dividends paid to ANZ parent entity to meet higher capital requirements
For
per
sona
l use
onl
y

INVESTING FOR GROWTH
GROUP INVESTMENT SPEND1 PREPARING FOR CHANGE
$m
12
1. Prior periods restated from previously reported information to include technology infrastructure spend, property projects and scaled agile delivery
LAST DECADE NEXT DECADE?
Universal services Specialisation
Mass share Targeted share
One price for all Risk based pricing
Transactions Discussions
Value from branches Value from data
High system growth Low system growth
Bank competition Experience competition
Hardware Software
Waterfall Agile
More capital More compliance
Enforceable undertakings Court action
Falling credit costs Rising credit costs
Globalisation Protectionism
Financial risk Non-financial risk
804 743 706 727839
430410 473 491
564
FY15
1,153
FY16 FY17
1,179
FY18 FY19
1,234 1,218
1,403
Rest of Group
Australia Retail & Commercial
For
per
sona
l use
onl
y

CAPITALISED SOFTWARE BALANCE1
13
$b
1. Source: Capitalised software balances sourced from publicly available company financials; 2019 numbers are based on the most recently disclosure financial statements
0
1
2
3
Sep-08 Sep-14Sep-10 Sep-12 Sep-16 Sep-18 Sep-19
ANZ Peer 2Peer 3 Peer 1
For
per
sona
l use
onl
y

SIMPLIFICATION
14
$8.6b cost base, lowest since 2013
Revenue $450m higher than 2013, despite selling 23 businesses
Focused on simplifying key customer & enablement processes that represent 70% of our cost base
Improving franchise strength
For
per
sona
l use
onl
y

CAPABILITY
EMPLOYEE ENGAGEMENT1
%
151. ANZ ‘My Voice’ Staff Surveys
7273
77
20182017 2019
93% consider ANZ’s purpose when making decisions
86% are confident ANZ treats customers fairly
86% say ANZ demonstrates respect for our employees
73% say they have access to opportunities to help them grow
For
per
sona
l use
onl
y

2019 FULL YEAR RESULTS
—
16
M I C H E L L E JA B L KO
C H I E F F I N A N C I A L O F F I C E R
For
per
sona
l use
onl
y

OVERVIEW
CASH PROFIT1,2 CASH EPS1,2 ROE1,2 CET1 RATIO (LEVEL 2)
$m cents % %
171. Cash Profit from continuing operations2. FY17 has not been restated for AASB15 impacts
6,8096,487 6,470
FY17 FY18 FY19
233223 228
FY17 FY18 FY19
11.7
11.0 10.9
FY19FY17 FY18
10.6
11.4 11.4
Sep-17 Sep-18 Sep-19
For
per
sona
l use
onl
y
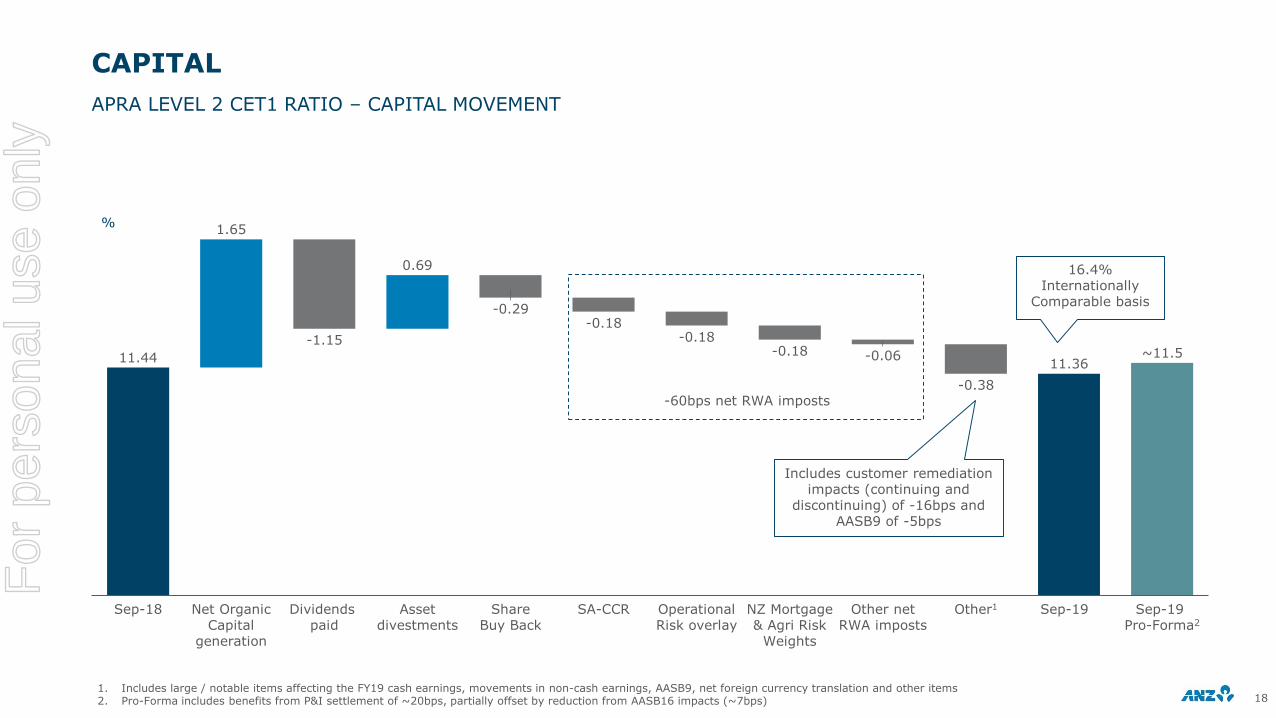
CAPITAL
%
APRA LEVEL 2 CET1 RATIO – CAPITAL MOVEMENT
181. Includes large / notable items affecting the FY19 cash earnings, movements in non-cash earnings, AASB9, net foreign currency translation and other items2. Pro-Forma includes benefits from P&I settlement of ~20bps, partially offset by reduction from AASB16 impacts (~7bps)
11.44 11.36
1.65
0.69
-0.18
NZ Mortgage & Agri Risk
Weights
-0.06
Asset divestments
Other1
-0.18
Sep-18 Sep-19 Sep-19 Pro-Forma2
Dividends paid
SA-CCRShare Buy Back
Net Organic Capital
generation
-0.29
Operational Risk overlay
-1.15 -0.18
-0.38
~11.5
Other net RWA imposts
Includes customer remediation impacts (continuing and
discontinuing) of -16bps and AASB9 of -5bps
16.4% Internationally
Comparable basis
-60bps net RWA imposts
For
per
sona
l use
onl
y
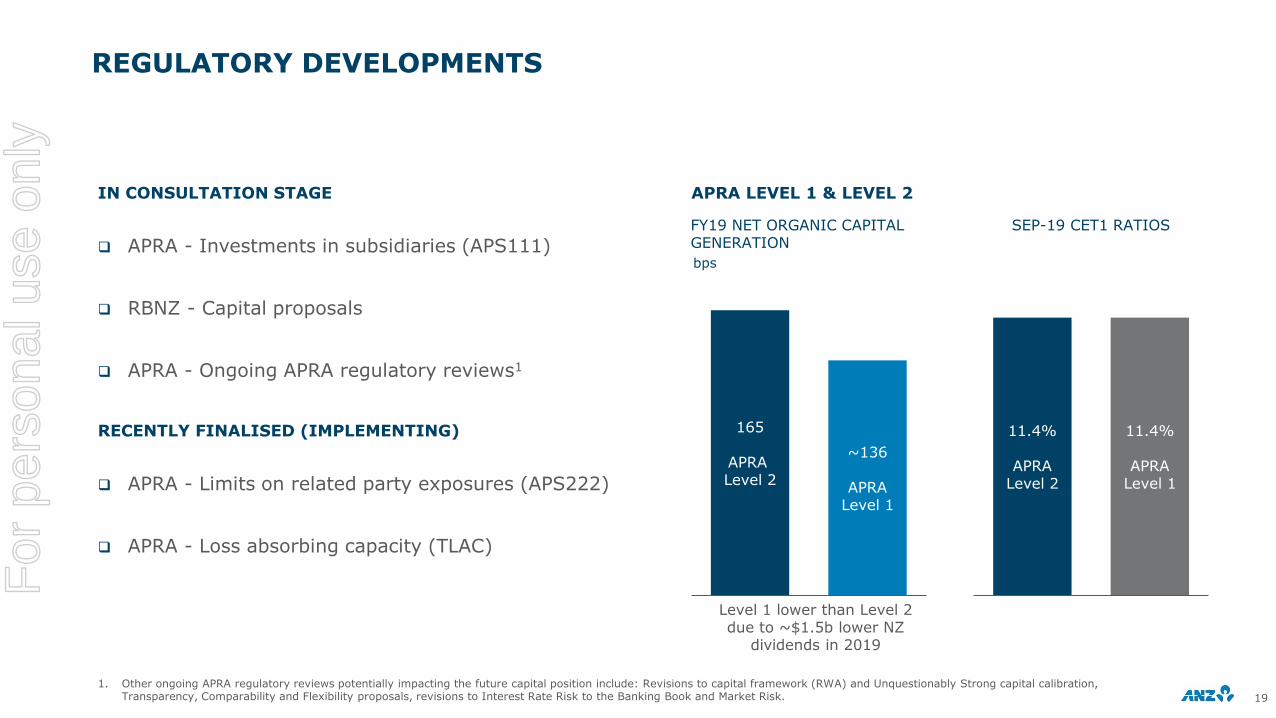
REGULATORY DEVELOPMENTS
APRA LEVEL 1 & LEVEL 2
19
1. Other ongoing APRA regulatory reviews potentially impacting the future capital position include: Revisions to capital framework (RWA) and Unquestionably Strong capital calibration, Transparency, Comparability and Flexibility proposals, revisions to Interest Rate Risk to the Banking Book and Market Risk.
11.4%
APRALevel 2
11.4%
APRALevel 1
IN CONSULTATION STAGE
APRA - Investments in subsidiaries (APS111)
RBNZ - Capital proposals
APRA - Ongoing APRA regulatory reviews1
RECENTLY FINALISED (IMPLEMENTING)
APRA - Limits on related party exposures (APS222)
APRA - Loss absorbing capacity (TLAC)
~136
APRALevel 1
165
APRA Level 2
FY19 NET ORGANIC CAPITAL GENERATION
SEP-19 CET1 RATIOS
Level 1 lower than Level 2 due to ~$1.5b lower NZ
dividends in 2019
bps
For
per
sona
l use
onl
y

6,487 6,470
79
131
RevenueLarge / Notable items after tax1
FY18 Expenses Provisions Tax & NCI FY19
-94
1
-134
FINANCIAL PERFORMANCE
CASH PROFIT DRIVERS
CASH PROFIT DIVISIONAL PERFORMANCE
$m
$m
20
CASH PROFIT CONTINUING OPERATIONS
-21% 0% 0% 20% -5%
1. Details of large / notable items provided in the investor discussion pack – additional financials section
6,487 6,47079
172 14151
FY18 Large / Notable items
after tax1
Australia Retail & Comm.
-22
FY19NZInstitut. (ex.
Markets)
Markets Other
-411
Includes $79m from share of associates profit
FY19 v FY18Australia Retail &
CommercialInstitutional NZ (NZD)
Income -6% 5% 2%
Expenses 0% -3% 5%
Cash Profit -10% 11% -4%For
per
sona
l use
onl
y

AUSTRALIA RETAIL & COMMERCIAL
INCOME COMPOSITION HOUSING PORTFOLIO1,2
$m $b
21
INCOME EXCLUDING LARGE / NOTABLE ITEMS AND HOUSING PORTFOLIO
1. Includes Non Performing Loans2. The current classification of Investor vs Owner Occupier is based on ANZ’s product category, determined at origination as advised by the customer and the ongoing precision relies
primarily on the customer’s obligation to advise ANZ of any change in circumstances
6,9276,461
3,238
3,114
FY18
9,575
FY19
10,165
Retail Commercial
3,217 3,244
1,590 1,524
4,7684,807
1H19 2H19
134
164
39
Sep-17
7
49
156
33
9
49
22
272
37
8
Sep-18 Sep-19
54
14
26
264 265
OO P&I Inv P&I Equity ManagerOO I/O Inv I/O
For
per
sona
l use
onl
y

0
10
20
30
40
50
60
70
80
90
100
110
Sep-17
Dec-18
Sep-18
Dec-17
Mar-18
Jun-18
Mar-19
Jun-19
Sep-19
AUSTRALIA RETAIL & COMMERCIAL - HOUSING MOMENTUM
22
IMPROVING MOMENTUM
Clarity and consistency on policy and risk settings
Approval turnaround times
Industry conditions
OUTLOOK
Pick up in application volumes in 4Q19
Improved momentum into 1Q20
Faster loan amortisation in a low rate environment
HOME LOAN APPLICATION TREND
3 month rolling average (Index Sep 2017 = 100)
“Offer So Good” campaign – July 2 to
August 31
For
per
sona
l use
onl
y

INSTITUTIONAL
MARKETS INCOME COMPOSITION
$m $m
23
INCOME CONTINUING OPERATIONS EXCLUDING LARGE / NOTABLE ITEMS
1. L&SF: Loans & Specialised Finance; PCM: Payments & Cash Management; Trade: Trade & Supply Chain2. Derivative valuation adjustments
880 921
271361
566446
63
FY18
38
FY19
1,780 1,766
-1%
Franchise Sales Franchise Trading Balance Sheet DVA2
INSTITUTIONAL INCOME COMPOSITION1
1,521 1,625
1,1731,296
448470
1,7801,766
48
FY18
42
FY19
4,9705,198
+5%
L&SF PCM Trade OtherMarkets
815 810
644 652
236 234
940 826
23
1H19
19
2H19
2,6572,541
-4%
459 463
235126
256
190
1H19
48
-10
2H19
940
826
-12%
For
per
sona
l use
onl
y

180
175
172
21
DepositsTreasury1H19 Asset & Funding Mix
Wholesale Funding Cost
2H19 Underlying1
Assets Markets Balance Sheet
Activities2
-2
Large / Notable Items
2H19
-4
-2
-2
-1
NET INTEREST MARGIN
CONTINUING OPERATIONS
24
GROUP NET INTEREST MARGIN (NIM)
bps
1. Excluding large / notable items and Markets Balance Sheet activities2. Includes the impact of growth in discretionary liquid assets and other balance sheet activities
-5bps
-8bps
-6bps impact of lower rates
For
per
sona
l use
onl
y

MARGIN ENVIRONMENT
LOW RATE ENVIRONMENT SWITCHING FROM INTEREST ONLY TO PRINCIPAL & INTEREST
BILLS/OIS SPREAD
$b
$b
bps
25
0
15
30
45
60
75
Apr-18
Jul-18
Oct-17
Jan-18
Jan-19
Oct-18
Jan-19
Apr-19
Sep-19
Spot 3mth Bills/OIS Spread Rolling 90 days
13 16 14
16
117 6
108
6
FY22FY17
23
FY18 FY20FY19 FY21 FY23+
2420
Early conversions Contractual conversions Contractual (still to convert)
~110
Low rate deposits <25bps Capital (excluding intangibles) and other non interest bearing liabilities
~53
Sensitivity to a 25bps drop in AUD, NZD and USD interest rates
Deposits & earnings on capital ~3 bps
1H19 average 48 bps
2H19 average 27 bps
10 bps mvmt. in BBSW/OIS 1 bp NIM
Sep-19
For
per
sona
l use
onl
y

8,563 8,562
136
170
FY19FY18 InvestmentFX BAU D&A
-259
-48
EXPENSES
CONTINUING OPERATIONS EXCLUDING LARGE / NOTABLE ITEMS
26
FY19 EXPENSE DRIVERS
$m
Includes Regulatory & Compliance
$125m
Includes Personnel &
Property productivity
(net of $160m inflation)
-1.6%
0%For
per
sona
l use
onl
y

INVESTMENT SPEND
TOTAL INVESTMENT SPEND BY DIVISION1
Capex and Opex $m
CONTINUING OPERATIONS
271. Prior periods restated from previously reported information to include technology infrastructure spend, property projects and scaled agile delivery
430 410473 491
564
176 177135 144
164164 187
204204
197
252175
164169
160
127
129137
150
20485
7566
61
113
FY19
1,234 1,218
FY15 FY18FY16
1,153
FY17
1,179
1,403
Australia Retail & Commercial Digital, Data & PaymentsTechnology InfrastructureProperty & Enablement Institutional New Zealand
For
per
sona
l use
onl
y

INVESTMENT SPEND
TOTAL INVESTMENT SPEND1 CAPITALISED SOFTWARE BALANCE
Capex and Opex $m $m
CONTINUING OPERATIONS
281. Prior periods restated from previously reported information to include technology infrastructure spend, property projects and scaled agile delivery
2,893
2,202
1,856
1,4211,323
Sep-19Sep-15 Sep-16 Sep-17 Sep-18FY16
67%
FY15
33%
58%
41%
FY18
42%
59%
1,153
FY17
65%
35%
70%
30%
FY19
1,2341,179
1,218
1,403
Investment expensed Investment capitalised
For
per
sona
l use
onl
y

CREDIT QUALITY
CREDIT IMPAIRMENT CHARGE INDIVIDUAL PROVISION CHARGE
$m $m
PROVISION CHARGE
291. Increase to New and Increased Individual Provisions and Writebacks & Recoveries compared to prior half is largely related to the home loan portfolio in Australia Retail and Commercial
following the implementation of a more market responsive collateral valuation methodology
892
380
1H16 2H16 1H17 2H17 1H191H18 2H18 2H191
1,047
787
554
430 343 398
New Increased Writebacks & Recoveries
FY18FY16
0.34%
0.21%
FY17
0.12% 0.13%
FY19
1,956
1,199
688 795
IP Charge CP Charge CIC as % Avg. GLA
For
per
sona
l use
onl
y

CREDIT QUALITY
GROSS IMPAIRED ASSETS NEW IMPAIRED ASSETS
AUSTRALIAN HOUSING 90+ DAYS PAST DUE2
$b
%
30
1. New Impaired Assets in 2H19 includes a $167m uplift on 1H19 in Australia home loans following the implementation of revised provisioning and impairment processes (including a more market responsive collateral valuation methodology). The increase in new impairments was largely offset by the return of previously impaired Home Loan assets to a past due but not impaired status
2. As a % of Gross Loans and Advances. Includes Non Performing Loans. ANZ 90+ days past due calculated on a missed payment basis
$b
Sep-19Sep-18
2.03
Sep-16
2.38
Sep-17
3.17
2.14
Australia Retail & Commercial New Zealand Institutional Other
3
0
1
2
4 3.63
FY17FY16 FY18 FY191
3.21
2.11 2.01
Australia Retail & Commercial New Zealand OtherInstitutional
0.6
1.0
0.7
1.1
0.9
0.8
1.2
Mar-18
Sep-16
Mar-17
Sep-17
Sep-18
Mar-19
Sep-19
For
per
sona
l use
onl
y

CUSTOMER REMEDIATION
311. Salaried Financial Planner fee for no service addressed in prior years (>$150m cumulative pre-tax charges).
TOTAL REMEDIATION – P&L IMPACT
4072
45250
70
405
127
53
154
2H17 1H181H17
377
2H192H18 1H19
123
559Financial impact
$826m ($682m post tax) charge in FY19
$1,579m ($1,216m post tax) charges since 1H17
$1,139m provisions on balance sheet at 30 Sep 2019
Progress to date1
Banking product & service review well progressed
Remediation of advice & other wealth products continue
Over 1,000 staff progressing remediation activities
TOTAL REMEDIATION - POST TAX IMPACT
$m
Discontinued Continuing
52% 43% 32%61%
19% 41% 55%21%
28% 16% 18%
1H19
13%
1H18 2H18 2H19
Net interest income Other operating income Expenses
For
per
sona
l use
onl
y

DIVIDEND
DIVIDEND PER SHARE SHARES ON ISSUE1
#m
321. Cash Continuing weighted average number of ordinary shares
2,9262,903
2,843
FY17 FY18 FY19
80 80 80
80 80 80
160 160
FY19FY18FY17
160
Interim Final
Benefiting from $3b buy-back & 6 consecutive halves of DRP neutralisation
PROPOSED 2019 FINAL DIVIDEND 80 CPS, 70% FRANKED
cents
For
per
sona
l use
onl
y

DIVIDEND
AUSTRALIA GEOGRAPHY EARNINGS & DPOR1 GEOGRAPHIC EARNINGS1
% of total Group Statutory Profit
GEOGRAPHIC EARNINGS
331. Statutory Profit basis 2. DPOR: Dividend payout ratio
FY15 FY16 FY19FY18
55%
FY17
69%
82%
62%64%
73%
64%
72%
61%
76%
DPOR Australia Geography earnings (% of total statutory earnings)
62% 64% 64% 61%55%
22%25% 26%
28%
29%
16%11% 10% 11%
16%
FY15 FY17FY16 FY18 FY19
Australia New Zealand International
For
per
sona
l use
onl
y

1H20 CONTEXT
34
Home loan momentum
Low interest rate environment
Markets
Costs
Regulatory capital
For
per
sona
l use
onl
y

2019 FULL YEAR RESULTS
—I N V E S TO R D I S C U S S I O N PA C K
G R O U P & D I V I S I O N A L P E R F O R M A N C E
For
per
sona
l use
onl
y

FINANCIAL PERFORMANCE – STATUTORY TO CASH PROFIT
STATUTORY PROFIT CASH PROFIT REPORTED CASH PROFIT CONTINUING OPERATIONS
$m $m $m
361. FY16 and FY17 have not been restated for AASB15 impacts2. FY16 has not been restated to reflect discontinued operations
5,709
6,406 6,4005,953
FY18FY161 FY171 FY19
-7%
Cash profit represents ANZ’s preferred measure of the result of the ongoing business activities of the Group, enabling readers to assess Group and Divisionalperformance against prior periods and against peer institutions.
To calculate cash profit, the Group excludes non-core items from statutory profit. Cash Profit continuing operations excludes the financial results of the WealthAustralia businesses being divested and associated Group reclassification and consolidation impacts treated as discontinued operations from a financial reportingperspective.
5,889
6,938
5,8056,161
FY161 FY18FY171 FY19
+6%
5,889
6,8096,487 6,470
FY171FY161,2 FY19FY18
0%
STATUTORY TO CASH ADJUSTMENTS
For
per
sona
l use
onl
y

LARGE / NOTABLE (L/N) ITEMS1
371. Large / notable items exclude the gain / (loss) on sale and divested business results of OnePath Life and One Path P&I, both accounted for as discontinued businesses.
1H17 2H17 1H18 2H18 1H19 2H19
Cash Profit Continuing Operations ($m) 3,355 3,454 3,493 2,994 3,564 2,906
Gain / (Loss) on sale from divestments -284 14 138 53 187 18
Divested business results 274 187 70 56 25 7
Customer remediation -40 -72 -45 -250 -70 -405
Restructuring -25 -18 -55 -104 -36 -18
Royal Commission legal costs 0 0 -11 -27 -9 -1
Gain on sale of 100 Queen St. Melbourne 112 0 0 0 0 0
Accelerated software amortisation 0 0 0 -206 0 0
Total L/N within Cash Continuing Profit 37 111 97 -478 97 -399
Cash Profit ex L/N 3,318 3,343 3,396 3,472 3,467 3,305
Cash Profit ex L/N Growth HOH 0.75% 1.59% 2.24% -0.14% -4.67%
Cash Profit ex L/N Growth PCP 2.35% 3.86% 2.09% -4.81%
1H17 2H17 1H18 2H18 1H19 2H19
Gain / (Loss) on Sale from divestments ($m)
Asia Retail
MCC
SRCB
UDC
Cambodia JV
OPL NZ
PNG Retail, Com, SME
Paymark
Divested Business Results ($m)
SRCB
Asia Retail
MCC
OPL NZ
Paymark
Cambodia JV
PNG Retail, Com, SME
For
per
sona
l use
onl
y

CUSTOMER REMEDIATION
CUSTOMER REMEDIATION CONTINUING OPERATIONS CUMULATIVE CUSTOMER REMEDIATION
PRE TAX $m PRE TAX $m
POST TAX $m
38
35
156
36
337
110
42
29
19
86
22
119
100
13
1H18 2H18 2H191H19
67
352
485
Other operating incomeNet interest income Expenses
51153
220 572 672
1,157181
256
422
1H191H17
928
2H182H17 1H18
753
2H19
1,579
Discontinued (Wealth businesses) Continuing operations
40112 157 407 477
882127180
334
2H181H17 2H192H17 1H18
534
1H19
657
1,216
For
per
sona
l use
onl
y

6,868
6,7721 131
FY18 Revenue Provisions FY19Expenses Tax & NCI
-94
-134
FINANCIAL PERFORMANCE
FY19 FY19 CASH PROFIT DRIVERS
2H19 2H19 CASH PROFIT DRIVERS
2019 SECOND HALF PERFORMANCE $m
39
CONTINUING OPERATIONS EXCLUDING LARGE / NOTABLE ITEMS
$m FY18 FY19 FY19 v FY18
Cash Profit 6,487 6,470 0%
Large/Notable items (L/N) -381 -302
Cash Profit ex L/N 6,868 6,772 -1%
Australia Retail & Commercial 3,992 3,581 -10%
Institutional 1,666 1,852 +11%
New Zealand (NZD) 1,597 1,526 -4%
0% 0% +20% -1%
$m 2H18 1H19 2H19 2H19 v 1H19
Cash Profit 2,994 3,564 2,906 -18%
Large/Notable items (L/N) -478 97 -399
Cash Profit ex L/N 3,472 3,467 3,305 -5%
Australia Retail & Commercial 1,959 1,786 1,795 1%
Institutional 911 1,004 848 -16%
New Zealand (NZD) 817 782 744 -5%
3,467
3,30556
1H19 ExpensesRevenue Provisions Tax & NCI 2H19
-130
-82 -6
$m
-1% +2% +2% -5%For
per
sona
l use
onl
y

BALANCE SHEET STRENGTH
CAPITAL REALLOCATION1
%
40
CAPITAL REALLOCATION & FLEXIBILITY
1. Allocation based on Regulatory Capital. Institutional shown under 2015 IIB Structure, including Institutional, Asia Partnerships and Asia Retail & Pacific 2. Pro-Forma adjusted for all announced Asset disposals – OnePath P&I. 3. ANZ lenders mortgage insurance, ANZ share investing, general insurance distribution and Wealth continuing operations (collectively ~1% of Group Capital) included in Retail and Commercial
WealthInstitutional1 Retail & Commercial
SEPTEMBER 2015 PRO-FORMA SEPTEMBER 20192,3
INCLUDING ANNOUNCED ASSET DISPOSALS
CAPITAL FLEXIBIILTY
3.0
4.5
2.5
7.4
Source
5.6
0.8
Use
11.9 11.9
Institutional reshaping
Announced asset sales Cash not yet
received
Retained for growth and capital management
Announced buy-back completed
CET1 CAPITAL FREED UP FROM TRANSFORMATION
$b
Net Imposts
For
per
sona
l use
onl
y
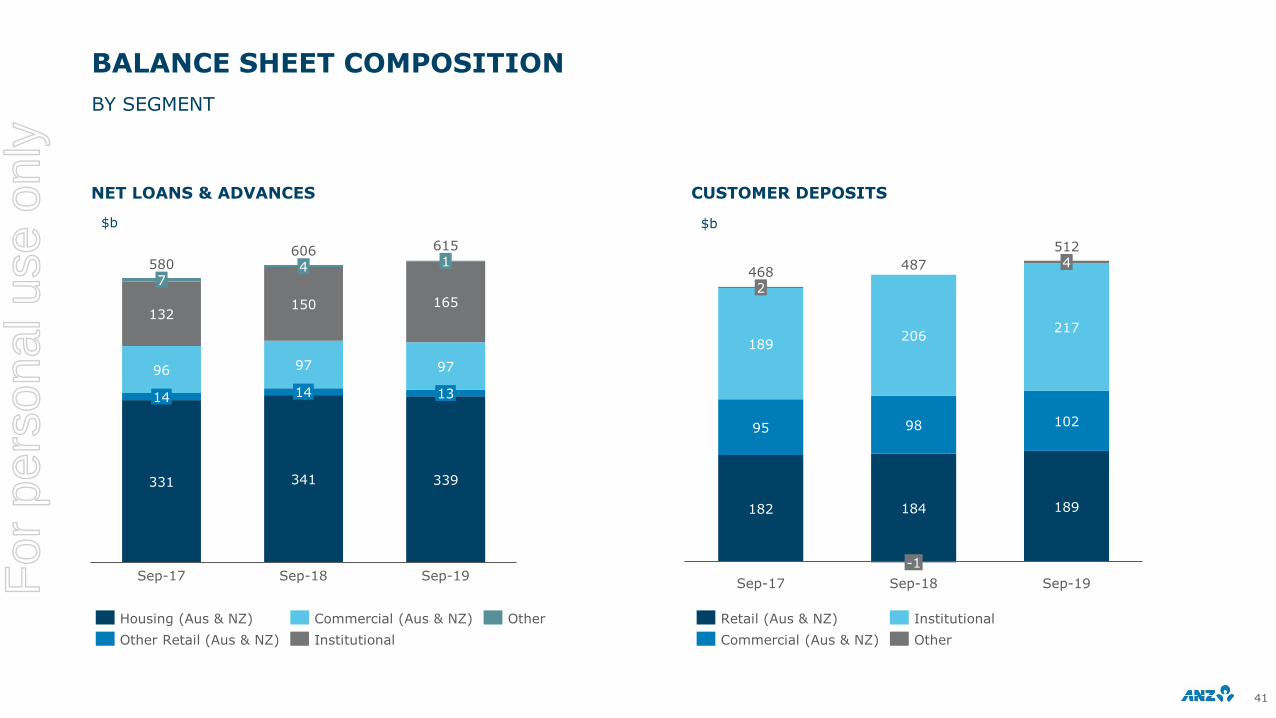
BALANCE SHEET COMPOSITION
NET LOANS & ADVANCES CUSTOMER DEPOSITS
$b $b
BY SEGMENT
41
331 341 339
96 97 97
132150 165
14
Sep-17
14
74
Sep-18
1
13
Sep-19
580606 615
182 184 189
95 98 102
189206
217
Sep-18
2
Sep-17
-1
Sep-19
4468
487
512
Institutional
Housing (Aus & NZ) Commercial (Aus & NZ)
Other Retail (Aus & NZ)
Other Retail (Aus & NZ)
Commercial (Aus & NZ) Other
Institutional
For
per
sona
l use
onl
y

REVENUE PERFORMANCE
TOTAL REVENUE OTHER OPERATING INCOME
CONTINUING OPERATIONS
$b
EX LARGE / NOTABLE ITEMS
$b
CONTINUING OPERATIONS
$b
42
CONTINUING OPERATIONS
1. FY17 has not been restated for AASB15 impacts
14.4
FY19FY171
4.5
14.5
FY18
4.5
19.0 18.919.1
14.4
4.7
0%
EX LARGE / NOTABLE ITEMS
$b
19.4
4.9
14.9 14.3
4.9
FY171
14.5
4.7
19.8
FY18 FY19
19.0
-2%
Net interest income Other operating income
0.9
1.41.1
0.3
2.4
0.8
FY171
0.6
0.2
2.6
FY18
2.5
0.3
1.3
FY19
4.74.9 4.9
-3%
Markets Fee & comm. Other Assoc. profit
FY171
0.4
0.3
2.7
0.2
0.5
1.1
FY18
2.5
1.3
4.5
FY19
0.2 4.54.7
1.4
2.2
0.8
0%
For
per
sona
l use
onl
y

EXPENSE MANAGEMENT
TOTAL EXPENSES FULL TIME EQUIVALENT STAFF
CONTINUING OPERATIONS
$b
EX LARGE / NOTABLE ITEMS
$b #‘000s
43
CONTINUING OPERATIONS
1. FY17 has not been restated for AASB15 impacts
1.7
FY171
1.5
0.1
1.6
0.9
4.9
0.2
1.9
0.8
4.8
FY18
1.9
0.1
1.5
0.8
4.8
FY19
9.09.4
9.1
-4%
Personnel Premises RestructuringTechnology Other
Sep-19
15%
29%
16%
3% 3%
28%
16%
37%
Sep-18
16%
37%
37.9 37.6
Australia R&C TSO & Group Centre
PacificInstitutional
NZ
4.7
0.9
1.4
1.6
FY171
0.8
1.5
1.6
4.6
FY18
1.5
1.5
0.8
4.7
FY19
8.5 8.6 8.6
0%
37.9 37.6
Sep-16Sep-15
42.9
Sep-18Sep-17 Sep-19
50.2
46.644.9
39.9 39.1
Discontinued Business
Continuing Business
CONTINUING OPERATIONS
#‘000s
For
per
sona
l use
onl
y

NET INTEREST MARGINS
GROUP AUSTRALIA RETAIL & COMMERCIAL
INSTITUTIONAL NEW ZEALAND
GROUP AUSTRALIA RETAIL & COMMERCIAL
INSTITUTIONAL NEW ZEALAND
bps
bps
bps
bps
bps
bps
bps
bps
44
GROUP & DIVISIONAL MARGIN PERFORMANCE CONTINUING OPERATIONS
199 187 176
FY19FY17 FY18
274 269 259
FY17 FY18 FY19
236 242 233
FY17 FY18 FY19
10188 82
FY17 FY19FY18
182 180 172
2H18 2H191H19
261 261 258
1H192H18 2H19
241 239 227
2H18 1H19 2H19
86 85 80
2H18 1H19 2H19
FULL YEAR
HALF YEAR
For
per
sona
l use
onl
y
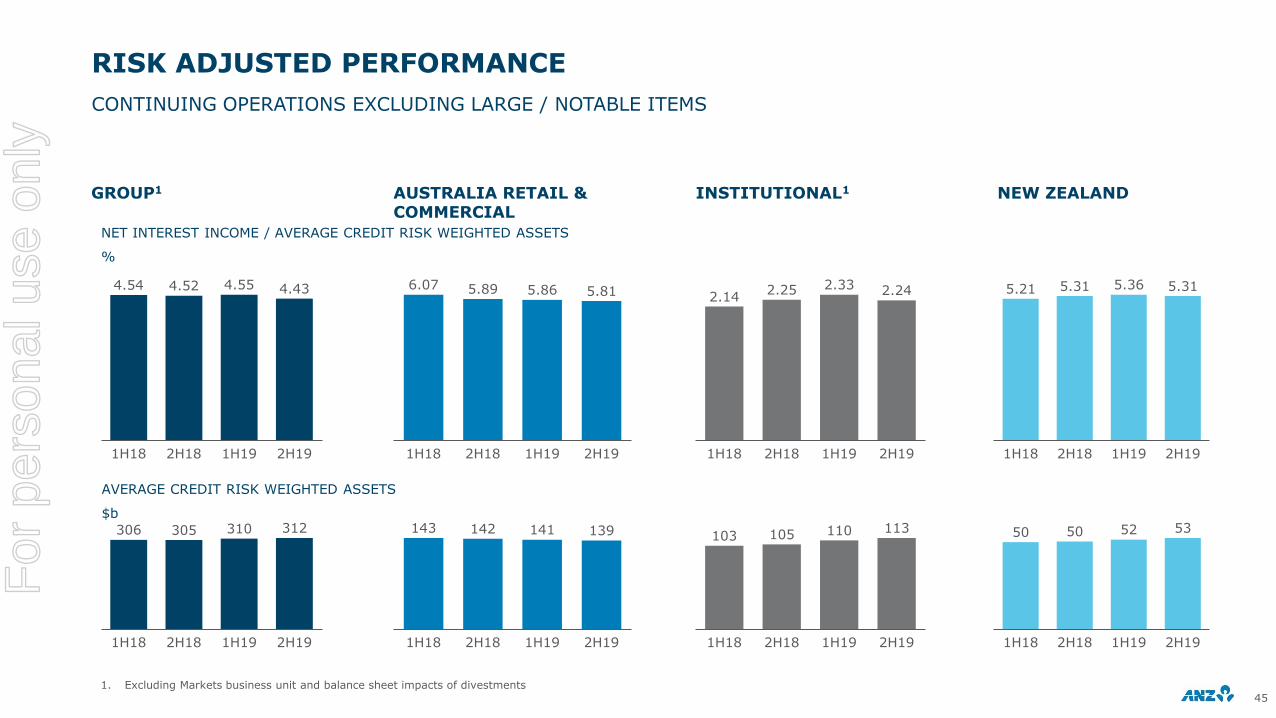
RISK ADJUSTED PERFORMANCE
GROUP1 AUSTRALIA RETAIL & COMMERCIAL
INSTITUTIONAL1 NEW ZEALAND
NET INTEREST INCOME / AVERAGE CREDIT RISK WEIGHTED ASSETS
%
AVERAGE CREDIT RISK WEIGHTED ASSETS
$b
45
CONTINUING OPERATIONS EXCLUDING LARGE / NOTABLE ITEMS
1. Excluding Markets business unit and balance sheet impacts of divestments
4.54 4.52 4.55 4.43
1H18 2H18 1H19 2H19
6.07 5.89 5.86 5.81
1H191H18 2H18 2H19
2.142.25 2.33 2.24
1H18 2H18 1H19 2H19
5.21 5.31 5.36 5.31
1H18 2H18 1H19 2H19
1H18
310
2H18 1H19
305306
2H19
312 139141
2H181H18
143
2H191H19
142103
113105
1H18 2H18 2H191H19
110
1H18
5250
1H19 2H192H18
50 53
For
per
sona
l use
onl
y

DIVISIONAL PERFORMANCE
CONTINUING OPERATIONS CONTINUING OPERATIONS EX LARGE / NOTABLE ITEMS
REVENUE
$b
EXPENSES
$b
46
CASH PROFIT
5.3
1.0
3.3
5.1
3.3
1.0
10.0
FY18
9.4
FY19
19.4 19.0
InstitutionalAustralia Retail & Commercial NZ Other
1.0
2.7
1.3
1.2
FY18
4.1
1.2
2.9
4.1
FY19
9.4 9.1
REVENUE
$b
EXPENSES
$b
FY19
0.80.6
3.33.2
5.25.0
10.2 9.6
FY18
19.0 18.9
InstitutionalAustralia Retail & Commercial OtherNZ
1.0
FY18
2.6
1.2
2.7
3.8
1.0
1.3
3.7
FY19
8.6 8.6
For
per
sona
l use
onl
y

DIVISIONAL GROWTH RATES
CONTINUING OPERATIONS EXCLUDING LARGE / NOTABLE ITEMS
47
FY19 v FY18 Revenue Expenses Pre Provision Profit Cash Profit FY19 Cash Profit ($m)
Australia Retail & Commercial -6% 0% -9% -10% 3,581
Institutional 5% -3% 14% 11% 1,852
New Zealand (NZD) 2% 5% -1% -4% 1,526
Other 19% 0% -35% -59% -104
2H19 v 1H19 Revenue Expenses Pre Provision Profit Cash Profit 2H19 Cash Profit ($m)
Australia Retail & Commercial -1% 1% -2% 1% 1,795
Institutional -4% -1% -8% -16% 848
New Zealand (NZD) 1% 8% -2% -5% 744
Other 0% 4% 20% -32% -42
For
per
sona
l use
onl
y

$m FY18 FY19 FY19 v FY18 1H19 2H19 2H19 v 1H19
Income 10,165 9,575 -6% 4,807 4,768 -1%
Net interest income 8,540 8,178 -4% 4,114 4,064 -1%
Other operating income 1,625 1,397 -14% 693 704 2%
Expenses 3,756 3,743 -0% 1,858 1,885 1%
Profit before provisions 6,409 5,832 -9% 2,949 2,883 -2%
Provisions 698 712 2% 396 316 -20%
Cash profit continuing 3,992 3,581 -10% 1,786 1,795 1%
Return on Avg RWAs 2.48% 2.25% -23bps 2.24% 2.26% +2bps
Operating expense to operating income 37.0% 39.1% +214bps 38.7% 39.5% +88bps
Total credit impairment charge/Avg GLAs 0.21% 0.21% 0bps 0.23% 0.19% -4bps
AUSTRALIA RETAIL & COMMERCIAL
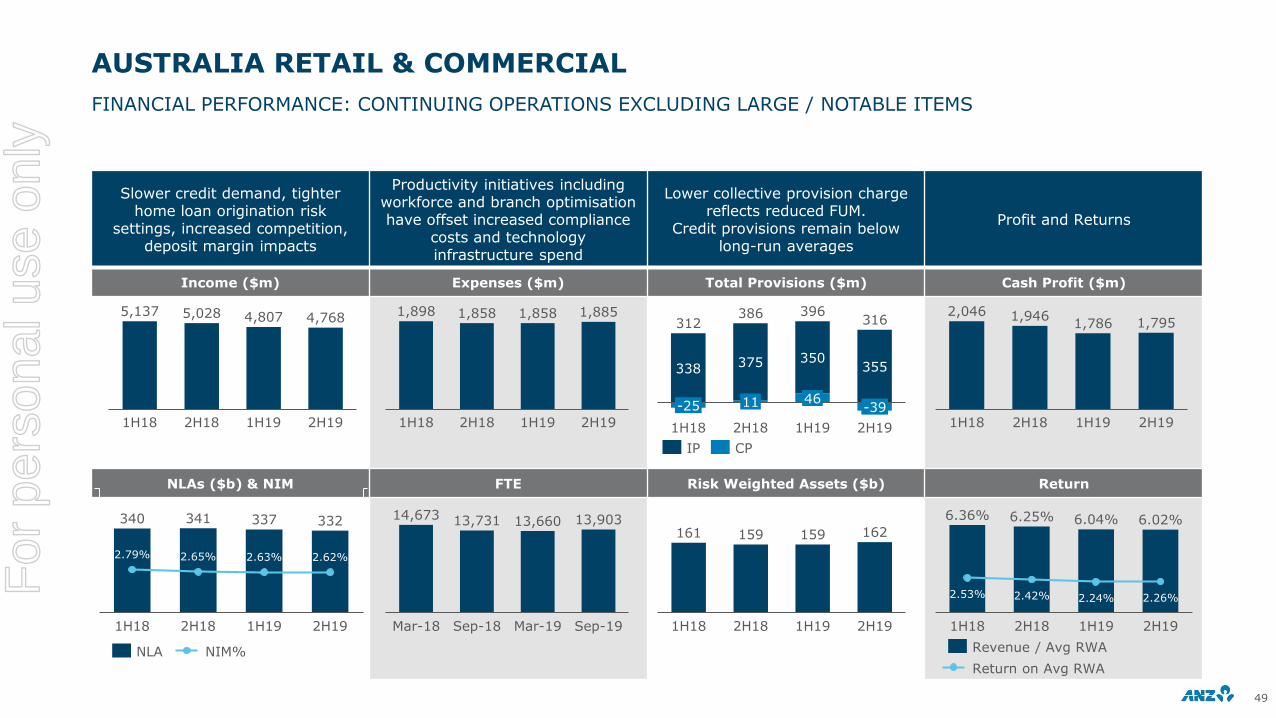
INCOME DRIVERS FY19 V FY18 (YOY) INCOME DRIVERS 2H19 V 1H19 (HOH)
$m$m
48
FINANCIAL PERFORMANCE: CONTINUING OPERATIONS EXCLUDING LARGE / NOTABLE ITEMS
10,1659,575
Comm. Fee
income
FY18
-307
Volumes Margin Retail Fee Income
Other FY19
-57-189 -39
2
FY19 v FY18 $m %
Net interest income -362 -4%
Retail NII -277 -5%
Commercial NII -85 -3%
Other operating income -228 -14%
4,807 4,7687 22
-13
Volumes1H19 Comm. Fee
income
Margin Retail Fee Income
Other 2H19
-59
4
2H19 v 1H19 $m %
Net interest income -50 -1%
Retail NII +21 +1%
Commercial NII -71 -5%
Other operating income +11 +2%For
per
sona
l use
onl
y
AUSTRALIA RETAIL & COMMERCIAL
49
FINANCIAL PERFORMANCE: CONTINUING OPERATIONS EXCLUDING LARGE / NOTABLE ITEMS
Slower credit demand, tighter home loan origination risk
settings, increased competition, deposit margin impacts
Productivity initiatives including workforce and branch optimisationhave offset increased compliance
costs and technology infrastructure spend
Lower collective provision charge reflects reduced FUM.
Credit provisions remain below long-run averages
Profit and Returns
Income ($m) Expenses ($m) Total Provisions ($m) Cash Profit ($m)
NLAs ($b) & NIM FTE Risk Weighted Assets ($b) Return
5,137 5,028 4,807 4,768
1H18 2H18 2H191H19
1,898 1,858 1,858 1,885
2H181H18 1H19 2H19
338 355375 350
11
1H18
-25
1H192H18
396
46
2H19
-39
312386
316
IP CP
2,046 1,9461,786 1,795
2H191H192H181H18
161 159 159 162
1H18 2H18 1H19 2H19
14,673 13,731 13,660 13,903
Mar-19Mar-18 Sep-19Sep-18
6.36% 6.25% 6.04% 6.02%
2.53% 2.42% 2.24% 2.26%
1H18 2H18 1H19 2H19
Revenue / Avg RWA
Return on Avg RWA
340 341 337 332
2.79% 2.65% 2.63% 2.62%
1H19 2H191H18 2H18
NIM%NLA
For
per
sona
l use
onl
y

AUSTRALIA - RETAIL
NET INTEREST INCOME OTHER OPERATING INCOME
NET LOANS & ADVANCES CUSTOMER DEPOSITS
$m
$b
$m
$b
50
CONTINUING OPERATIONS EXCLUDING LARGE / NOTABLE ITEMS
1. Digitally active customers & Digital Sales are inclusive of both Retail and Commercial customers
Financial performance ($m) 2H18 1H19 2H192H19 v 1H19
Revenue 3,391 3,217 3,244 1%
Expenses 1,287 1,250 1,312 5%
Profit Before Provisions 2,104 1,967 1,932 -2%
Provisions 201 230 162 -30%
NPAT 1,330 1,215 1,238 2%
Operational metrics 2H18 1H19 2H192H19 v 1H19
FTE 11,320 11,150 11,287 2%
Branches 629 593 577 -3%
Digital Branches 114 128 142 11%
Total Retail customers (#m) 5.74 5.80 5.87 1%
Retail customers > 1 product (#m) 4.81 4.87 4.90 1%
Digitally active customers (#m)1 3.50 3.56 3.60 1%
Digital sales (% of sales)1 25.2 27.3 30.0 268bps
Supported wallet transactions (#m) 38.2 51.0 69.0 35%
• Lower lending volumes with slower system credit growth, competition and tighter home loan origination risk settings
• NIM impacted by home loan mix changes and higher discounting, the impact of deposit rates and regulatory impact on credit card pricing. This was partially offset by home loans re-pricing
• Other operating income impacted by removal of fees and lower volumes
• Significant progress in 2H19 on lifting momentum in home loans with applications up half-on-half
279
2H18 1H19 2H19
283 275
2,812 2,757 2,778
1H192H18 2H19
579460 466
1H192H18 2H19
1H19
117120
2H18 2H19
121
For
per
sona
l use
onl
y

AUSTRALIA – COMMERCIAL
CONTINUING OPERATIONS EXCLUDING LARGE / NOTABLE ITEMS
51
1. NLA FUM growth in specialised businesses (Health, Property, Agribusiness & Emerging Corporate)
Financial performance ($m) 2H18 1H19 2H192H19 v 1H19
Revenue 1,637 1,590 1,524 -4%
Expenses 571 608 573 -6%
Profit Before Provisions 1,066 982 951 -3%
Provisions 185 166 154 -7%
NPAT 616 571 557 -2%
Operational metrics 2H18 1H19 2H192H19 v 1H19
FTE 2,411 2,510 2,616 4%
Total Commercial customers (#k) 490.9 490.2 495.6 1%
Comm Customers > 1 product (#k) 218.8 217.9 218.9 0%
RWA Intensity (Avg RWA / Avg GLA) 104% 102% 99% -270bps
Credit impairment / Avg GLA (%) 0.71 0.64 0.59 -5bps
Growth in specialist channels1 6% 3% 4% 116bps
• Revenue performance impacted by subdued credit growth, volume reductions, competition and deposit margin compression
• Commercial lending volumes flat half-on-half, down 2% year-on-year, with reduction in Small Business Banking volumes, subdued Business Banking growth and Asset Finance run off
• Commercial deposit growth up 5% year-on-year, driven by Small Business Banking (+5%), Business Banking (+3%) and Private Bank (+8%). Commercial Deposit to Loan ratio now above 1.5:1
NET INTEREST INCOME OTHER OPERATING INCOME
NET LOANS & ADVANCES CUSTOMER DEPOSITS
$m
$b
$m
$b
1,385 1,357 1,286
2H18 1H19 2H19
252 233 238
2H18 1H19 2H19
5758
1H192H18 2H19
57
2H18 1H19
87
2H19
83 86
For
per
sona
l use
onl
y

AUSTRALIA RETAIL & COMMERCIAL
BALANCE SHEET
5252
NET LOANS & ADVANCES1
$b
1. Housing - OO includes Equity Manager; Other retail includes Australia Wealth retained
177 183 186 185 185
87 87 86 83 80
58 58 58 57 57
13 11
332
Sep-17
335
12
Mar-18
11
Mar-19Sep-18
10
Sep-19
337340 341
Commercial Subdued system growth & increased competition offset by specialist segment growth Retail - HousingRefer ‘Housing section’ for further detail
Comm Housing - InvOther Retail Housing - OO
CUSTOMER DEPOSITS
$b
92 92 89 87 93
56 58 58 6158
27 27 28 27 27
26 27 28 28 30
204
Sep-17 Sep-19
201
Mar-18 Mar-19Sep-18
203 203208
Transact Offset Term Deposit Savings
Customer preferences favouring saving products in low rate environment and transactional digital payments offering
For
per
sona
l use
onl
y

INSTITUTIONAL
INCOME DRIVERS FY19 V FY18 (YOY)1 INCOME DRIVERS 2H19 V 1H19 (HOH)1
$m $m
53
FINANCIAL PERFORMANCE: CONTINUING OPERATIONS EXCLUDING LARGE / NOTABLE ITEMS
1. L&SF = Loans and Specialised Finance; Trade = Trade and Supply Chain; PCM = Payments and Cash Management
4,9705,198
22122 104
FY18 PCM OtherMarkets Trade L&SF FY19
-6-14
2,657
2,5418
L&SFTrade1H19 Markets PCM Other 2H19
-114 -2 -5 -3
-1% +5% +10% +7% -12% -1% +1% -1%
$m FY18 FY19 FY19 v FY18 1H19 2H19 2H19 v 1H19
Income 4,970 5,198 5% 2,657 2,541 -4%
Net interest income 2,934 3,025 3% 1,548 1,477 -5%
Other operating income 2,036 2,173 7% 1,109 1,064 -4%
Expenses 2,661 2,575 -3% 1,293 1,282 -1%
Profit before provisions 2,309 2,623 14% 1,364 1,259 -8%
Provisions -46 -3 Large -34 31 Large
Cash profit continuing 1,666 1,852 11% 1,004 848 -16%
Return on Avg RWAs 1.03% 1.10% +7 bps 1.22% 0.99% -23 bps
Operating expense to operating income 53.5% 49.5% -402 bps 48.7% 50.4% +178 bps
Total credit impairment charge / Avg GLAs -0.03% 0.00% +3 bps -0.04% 0.04% +8 bps
For
per
sona
l use
onl
y

INSTITUTIONAL
541. Institutional ex-Markets net interest income divided by average credit risk weighted assets 2. Cash profit divided by average risk weighted assets3. FY17 has not been restated for AASB15 impacts
FY19 FINANCIAL PERFORMANCE: CONTINUING OPERATIONS EXCLUDING LARGE / NOTABLE ITEMS
Continued momentum and customer revenue growth
Productivity focus maintained, absolute cost reduction
Credit charges remained belowlong run trend
Targeted profitable growth andimproved returns
Income ($m) Expenses ($m) Total Provisions ($m) Cash Profit ($m)
Risk Adjusted Margin FTE Avg. Risk Weighted Assets ($b) Return
89
-46
-3
FY17 FY18 FY19
1,8771,666
1,852
FY173 FY18 FY19
170162 168
FY18FY17 FY19
5,5014,970 5,198
4,061 4,057 4,341
FY18FY173 FY19
Revenue Customer Revenue
2,772 2,661 2,575
54%50%
FY173 FY19FY18
50%
Expenses Cost-to-income ratio
6,1355,566 5,458
Sep-19Sep-17 Sep-18
2.04% 2.20% 2.28%
FY19FY17 FY18
Risk adjusted NIM1
FY173
1.1% 1.0%
3.24%
FY18
1.1%
FY19
3.07% 3.09%
Revenue / Avg RWA
Return on Avg RWA2
For
per
sona
l use
onl
y

INSTITUTIONAL
551. Institutional ex-Markets net interest income divided by average credit risk weighted assets 2. Cash profit divided by average risk weighted assets
2H19 FINANCIAL PERFORMANCE: CONTINUING OPERATIONS EXCLUDING LARGE / NOTABLE ITEMS
Subdued market environment resulted in lower 2H19 revenue
Seventh consecutive half of absolute cost reduction
Low credit charges indicate continued portfolio health
Economic conditions in 2H19 impacted returns
Income ($m) Expenses ($m) Total Provisions ($m) Cash Profit ($m)
Risk Adjusted Margin FTE Avg. Risk Weighted Assets ($b) Return
48
-94
-34
31
1H191H18 2H18 2H19
756910
1,004848
1H18 1H192H18 2H19
160 163 166 171
1H191H18 2H18 2H19
2,459 2,511 2,657 2,541
1,981 2,076 2,168 2,174
2H181H18 2H191H19
Revenue Customer Revenue
1,3471,314
1,293 1,282
55%
1H18
50%49%52%
2H18 2H191H19
Expenses Cost-to-income ratio
5,879
5,566 5,469 5,458
Mar-19Mar-18 Sep-18 Sep-19
2.14% 2.25% 2.33% 2.24%
2H181H18 1H19 2H19
Risk adjusted NIM1
0.99%0.95%
1H18 1H19
1.11%
2H18
1.22%
2H19
3.08% 3.07% 3.22%2.97%
Return on Avg RWA2
Revenue / Avg RWA
For
per
sona
l use
onl
y

INSTITUTIONAL
REVENUE BY PRODUCT1,2 AVERAGE CREDIT RWA1,2
CUSTOMER REVENUE1 REVENUE BY REGION1
$m $b
$m $m
56
TOTAL REVENUE REDUCED IN 2H19 IN MARKETS AND INTERNATIONAL, CUSTOMER REVENUE REMAINED STABLE
1. All numbers are excluding large / notable items 2. L&SF = Loans and Specialised Finance; Trade = Trade and Supply Chain; PCM = Payments and Cash Management
732 789 815 810
578 595 644 652
896 884 940 826
2H181H18 1H19 2H19
224
192,459
236
2,511 2,657 2,541
224
23
234
30 18
-4%
L&SF TradePCM Markets Other
543 579 649 606
1,227 1,292 1,314 1,342
2H192H18
211 205
1H18
204
1H19
225
1,981 2,076 2,168 2,174
0%
825 801 948 801
1,355 1,450 1,443 1,445
2H19
266279
1H18
260
2H18 1H19
295
2,657 2,5412,459 2,511
-4%
International NZ Aus & PNGInternational NZ Aus & PNG
82 85 89 91
19 18 18 1832 33 33 35
2H181H18
147
2
1H19 2H19
135 138 142
2 24
+4%
L&SF Trade Markets Other
For
per
sona
l use
onl
y

571. All numbers are excluding large / notable items 2. Deutsche Bank Currency Volatility Index – avg for each period shown 3. CBOE Interest Rate Volatility Index – avg for each period shown4. AUD vs. USD 3 month at-the-money implied volatility – average for each period shown
477 445 430 449 459 463
368190 162 235 126
349
276 292 274256
190
162
67 11 52
-10
48
1H17 2H182H17 1H18
110
1H19 2H19
1,355
977896 884 940
826
-12%
Franchise Sales Balance SheetFranchise Trading Derivative valuation adj.
921 880 921
557 361
625566 446
229
63
271
FY17 FY18
2,332
38
FY19
1,780 1,766
-1%
INSTITUTIONAL MARKETS INCOME
MARKETS INCOME COMPOSITION1 YOY MARKETS AVERAGE VALUE AT RISK (99% VAR)
MARKETS INCOME COMPOSITION1 HOH VOLATILITY
$m $m
$m Indexed: rebased to 100 (1H17)
LOWER INCOME FROM BALANCE SHEET TRADING PARTLY OFFSET BY STRENGTH IN THE FRANCHISE BUSINESS
0
10
20
30
40
2H191H17 1H182H17 2H18 1H19
Traded Non-traded
60
80
100
2H18 2H191H191H181H17 2H17
Currencies (CVIX)2 Rates (SR VIX)3 AUD/USD Vol4
Franchise Sales Derivative valuation adj.Franchise Trading Balance Sheet
Lower revenue in 2H19 impacted by:• Flattening &
inverting yield curves
• Lower volatility in FX and rates markets
Customer Franchise Sales remains stableF
or p
erso
nal u
se o
nly
INSTITUTIONAL
EXPENSE CONTRIBUTION1 FY19 EXPENSE DRIVERS1
$m $m
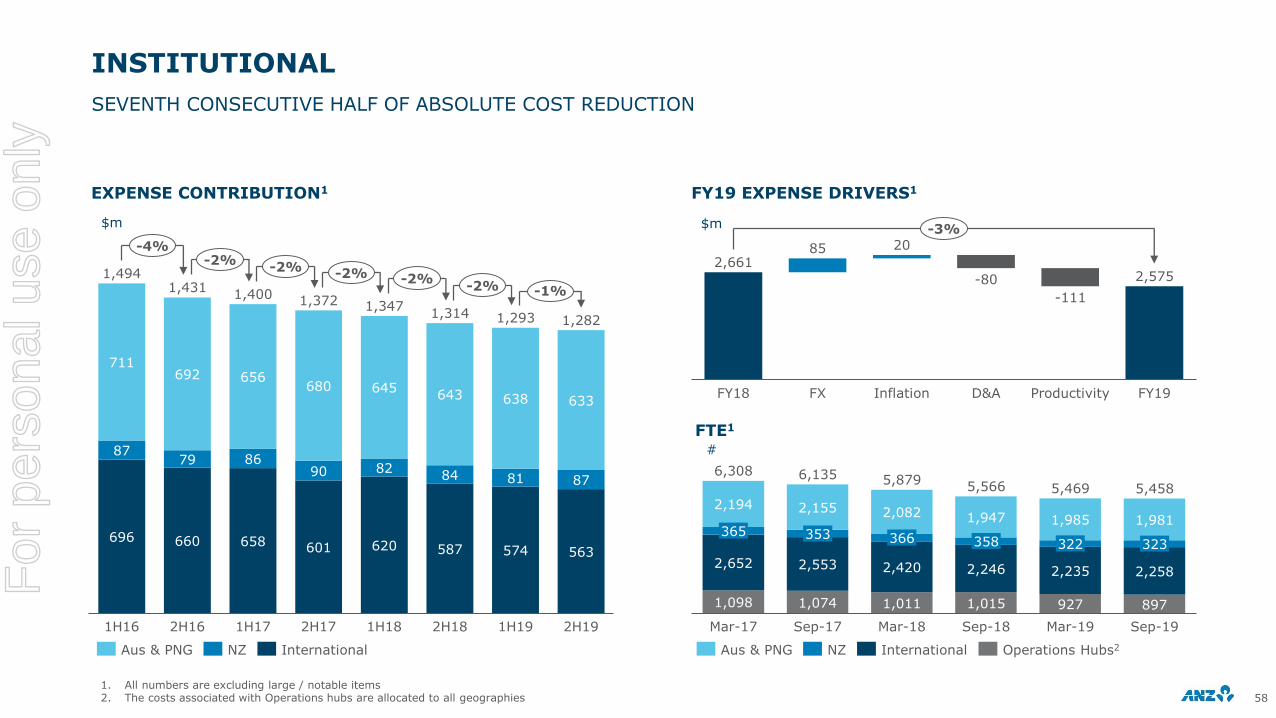
SEVENTH CONSECUTIVE HALF OF ABSOLUTE COST REDUCTION
581. All numbers are excluding large / notable items 2. The costs associated with Operations hubs are allocated to all geographies
696 660 658 601 620 587 574 563
8779 86
90 8284 81 87
711692 656
680 645643 638 633
2H16
1,314
1,494
2H171H17
1,347
1H181H16 2H18 1H19 2H19
1,2821,293
1,4311,400 1,372
-4%-2%
-2% -2% -2%-2% -1%
Aus & PNG NZ International
1,098 1,074 1,011 1,015 927 897
2,652 2,553 2,420 2,246 2,235 2,258
2,194 2,155 2,082 1,947 1,985 1,981
5,879
Sep-19Mar-17 Sep-18Sep-17 Mar-18 Mar-19
6,308 6,1355,566 5,469 5,458
323365 353 366 358 322
Aus & PNG NZ Operations Hubs2International
2,6612,575
85 20
Inflation D&AFY18 FX Productivity FY19
-111
-80
-3%
FTE1
#
For
per
sona
l use
onl
y

INSTITUTIONAL
VOLUMES1 NIM BY REGION3
AVERAGE CREDIT RWA2 RISK ADJUSTED NIM4
$b bps
$b bps
VOLUME & MARGINS: CONTINUING OPERATIONS EXCLUDING LARGE / NOTABLE ITEMS
238 241235
231
2H191H18 2H18 1H19
Aus & PNG
145 149139 138
2H191H18 1H192H18
NZ
156 158 161147
2H181H18 1H19 2H19
International
206 208 207199
1H191H18 2H18 2H19
Institutional
246 260 268 262
1H18 1H192H18 2H19
Aus & PNG
256 269 256 252
1H182H18 2H191H19
NZ
161 171 181 168
2H192H181H18 1H19
International
214 225 233 224
2H181H18 1H19 2H19
Institutional
1. Average Gross Loans & Advances for L&SF and Trade; average customer deposits for Payments and Cash Management 2. Trade = Trade and Supply Chain L&SF = Loans and Specialised Finance 3. Institutional ex-Markets net interest margin 4. Institutional ex-Markets net interest income divided by average credit risk weighted assets
82 85 89 91
19 18 18 1832 33 33 35
2 2
1H18 2H18
42
1H19 2H19
135 138 142 147
Markets L&SFTrade Other
105112
122 125
2H191H18 2H18 1H19
Gross Loans & Advances
95 97 98 104
1H18 2H18 1H19 2H19
Customer Deposits
59
For
per
sona
l use
onl
y

NZDm FY18 FY19 FY19 v FY18 1H19 2H19 2H19 v 1H19
Income 3,483 3,538 2% 1,756 1,782 1%
Net interest income 2,881 2,939 2% 1,460 1,479 1%
Other operating income 602 599 0% 296 303 2%
Expenses 1,257 1,326 5% 638 688 8%
Profit before provisions 2,226 2,212 -1% 1,118 1,094 -2%
Provisions 6 92 large 31 61 97%
Cash profit continuing 1,597 1,526 -4% 782 744 -5%
Return on Avg RWAs 2.61% 2.47% -14 bps 2.54% 2.40% -14 bps
Operating expense to operating income 36.1% 37.5% 139 bps 36.3% 38.6% 228 bps
Total credit impairment charge / Avg GLAs 0.01% 0.07% 6 bps 0.05% 0.10% 5 bps
NEW ZEALAND DIVISION
INCOME DRIVERS FY19 V FY18 (YOY) INCOME DRIVERS 2H19 V 1H19 (HOH)
NZDm NZDm
60
FINANCIAL PERFORMANCE: CONTINUING OPERATIONS EXCLUDING LARGE / NOTABLE ITEMS
3,483 3,538120 15
MarginVolumesFY18 Retail Fee Income
-62 -2
Comm. Fee
income
-16
Other FY19
FY19 v FY18 $m %
Net interest income 58 2%
Retail NII 1 0%
Commercial NII 52 5%
Central Functions NII 5
Other operating income -3 0%
1,756
1,78234 8 1
Volumes1H19 Margin 2H19Comm. Fee
income
Retail Fee Income
Other
-15 -2
2H19 v 1H19 $m %
Net interest income 19 1%
Retail NII -3 0%
Commercial NII 22 4%
Central Functions NII 0
Other operating income 7 2%
For
per
sona
l use
onl
y

NEW ZEALAND DIVISION
61
FINANCIAL PERFORMANCE: CONTINUING OPERATIONS EXCLUDING LARGE / NOTABLE ITEMS
Solid home lending growth within a competitive environment
Increased regulatory compliance requirements
Provisions returning to more normalised levels
Margin compression, compliance costs and provisions impacting
returns
Income (NZDm) Expenses (NZDm) Total Provisions (NZDm) Cash Profit (NZDm)
NLAs (NZDb) & NIM FTE1 Risk Weighted Assets (NZDb) Return
1,731 1,752 1,756 1,782
1H191H18 2H18 2H19
625 632 638688
1H18 2H18 2H191H19
36 3719
-32
42
2H19
-14
-16
22
1H18
16
61
2H18
-6
1H19
31
780 817 782 744
1H18 2H18 1H19 2H19
61 62 6271
Sep-19Mar-18 Sep-18 Mar-19
6,319 6,165 6,003 6,121
Mar-18 Sep-19Sep-18 Mar-19
2.40%
2H18 2H19
2.54%2.55%
1H18
2.67%
1H19
5.67% 5.72% 5.71% 5.75%
Revenue / Avg RWA
Return on Avg RWA
119 122 124 126
2H19
2.35%2.38%2.42% 2.41%
1H18 2H18 1H19
NLAs NIM
IP CP
1. On a Continuing Operations basis
For
per
sona
l use
onl
y

NEW ZEALAND DIVISION – RETAIL
62
Financial performance (NZDm) 2H18 1H19 2H192H19 v 1H19
Revenue 1,232 1,223 1,228 0%
Expenses 493 507 546 8%
Profit before provisions 739 716 682 -5%
Provisions 17 29 16 -45%
NPAT 520 495 480 -3%
Operational metrics 2H18 1H19 2H192H19 v 1H19
FTE 3,751 3,700 3,686 0%
Branches 179 170 164 -6
Total retail customers (#m) 2.10 2.12 2.12 0%
Retail customers > 1 product 67% 67% 67% 0%
Digitally active customers (#m) 1.43 1.47 1.50 2%
Digital sales (% of retail sales) 23 25 29 360 bps
1. Source: RBNZ, Mortgage and Household deposits market share as at August 2019, KiwiSaver FUM market share as at June 20192. Source: McCulley Research (first choice or seriously considered); six month rolling average, September 2019 (major four banks)
FINANCIAL PERFORMANCE: CONTINUING OPERATIONS EXCLUDING LARGE / NOTABLE ITEMS
Peer 3ANZ Peer1 Peer 2
49.4% 46.1%37.0% 36.3%
30.7% 33.6% 23.5%
MortgagesHousehold deposits
KiwiSaver
946 936 933
1H192H18 2H19
286 287 295
1H19 2H192H18
79.1 81.1 82.5
Mar-19Sep-18 Sep-19
70.3 71.9 73.9
Sep-18 Mar-19 Sep-19
NET INTEREST INCOME
NZDm
NET LOANS & ADVANCES
NZDb
OTHER OPERATING INCOME
NZDm
CUSTOMER DEPOSITS
NZDb
BRAND CONSIDERATION2MARKET SHARE1
For
per
sona
l use
onl
y

NEW ZEALAND DIVISION - COMMERCIAL
63
1 Source: RBNZ2 Gross impaired assets as a % of gross loans and advances
FINANCIAL PERFORMANCE: CONTINUING OPERATIONS EXCLUDING LARGE / NOTABLE ITEMS
Financial performance (NZDm) 2H18 1H19 2H192H19 v 1H19
Revenue 519 527 547 4%
Expenses 130 127 141 11%
Profit before provisions 389 400 406 1%
Provisions -33 2 45 Large
NPAT 303 287 260 -9%
Operational metrics 2H18 1H19 2H192H19 v 1H19
FTE 957 910 905 -1%
Return on Avg RWA 1.97% 1.86% 1.66% -20 bps
Revenue per Avg RWA 3.38% 3.42% 3.50% 8 bps
Total loss rate -0.16% 0.01% 0.21% 20 bps
Individual provision loss rate -0.05% 0.06% 0.09% 3 bps
STABLE RISK PROFILE2AGRI LENDING MARKET SHARE1
NET INTEREST INCOME
NZDm
NET LOANS & ADVANCES
NZDb
OTHER OPERATING INCOME
NZDm
CUSTOMER DEPOSITS
NZDb
509 517 539
2H18 1H19 2H19
10 108
2H18 1H19 2H19
39.1%32.4% 28.1%
17.318.5
Sep-10 Sep-14
17.8
Aug-19
16.8 17.2 16.1
Sep-18 Mar-19 Sep-19
0.52%
Sep-17 Mar-18 Sep-18
0.50%
Sep-19Mar-19
0.68%
0.47% 0.50%
42.5 42.9 43.5
Sep-18 Sep-19Mar-19
ANZ market share (%) ANZ Agri Lending (NZDb)
For
per
sona
l use
onl
y

NEW ZEALAND DIVISION
GROSS LOANS & ADVANCES CUSTOMER DEPOSITS
NZDb NZDb
BALANCE SHEET
64
32%
2%
53%
Sep-19
14%12%
32%
Sep-17
52%
2%
13%
Mar-18
54%
31%
3%
Sep-18
11%
56%
122
31%
10%
2%
Mar-19
57%
31%
2%
118 119124 126
OtherHousing variable Housing fixed Non-housing
49%
87
82
50%
30%29%
Sep-19
21% 21%
Sep-17 Mar-18
29%
89
84
51%
20% 19%
Sep-18
30%
51%
Mar-19
31%
50%
19%
90
Savings Term Deposit Transact
For
per
sona
l use
onl
y

WEALTH AUSTRALIA
FINANCIAL PERFORMANCE GROSS MARGIN2
AVERAGE FUM3 GUIDE TO FINANCIAL PERFORMANCE
$m $m
$b
65
DIVESTED BUSINESSES - PENSIONS AND INVESTMENTS (P&I)
1. Pro forma NPAT is prepared on a consistent basis as the Underlying Profit After Tax Pre-amortisation (UNPAT) disclosed by IOOF on 17 October 2017 transaction announcement. This excludes DAC/DEF related net charges, ANZ consolidation adjustments and amortisation of acquisition related intangibles. This includes normalisation and market pricing adjustments
2. Gross margin excludes DAC/DEF related net charges and includes normalisation3. Average Funds Under Management (FUM) excludes legacy run-off portfolio of P&I products acquired by Zurich and FUM related to ANZ Private Bank trusts (Average FUM 1H18 : $1.1b, 2H18 :
$1.4b, 1H19 : $1.6b, 2H19 : $1.8b)
104912
ExpenseFY18 Pro-forma NPAT1
FY19 Pro-forma NPAT1
-15
Income
48.7 49.0 47.0 48.4
1H18 2H18 1H19 2H19
-1%
• Prepared on a standalone pro forma basis1 and excludes ANZ Group consolidation adjustments
• Is not comparable with financial performance as reported within ANZ discontinued operations
• The sale of Aligned Dealer Groups completed on 1 October 2018 and is excluded from the above results
163 164 154 151
1H18
55.8%61.0%57.5%56.2%
2H192H18 1H19
Cost-To-Income ratio (%)
For
per
sona
l use
onl
y

WEALTH AUSTRALIA
INFLOWS AND OUTFLOWS BY SOLUTION FY19 NET FLOWS BY SOLUTION
AVERAGE FUM BY SOLUTION1 GUIDE TO FUM AND FLOW DISCLOSURES
$b
$b
66
DIVESTED BUSINESSES – P&I FUM AND FLOWS
1.Average FUM excludes legacy run-off portfolio of Pension and Investment products acquired by Zurich and FUM related to ANZ Private Bank trusts ( Average FUM 1H18 : $1.1b, 2H18 : $1.4b, 1H19 : $1.6b, 2H19 : $1.8b). NOTE: The sum of inflows and outflows by solution may not align to total due to rounding.
-204-332
-1,127
-1,492
-317
Legacy Employer
Legacy RetailANZ Smart Choice
Wrap OneAnswer Frontier
Open solutions Closed solutions$m
• Definition of open and closed solutions is consistent with the classification disclosed by IOOF on 17 October 2017 ASX announcement and it is not comparable with Funds Management cash flows by product historically published in ANZ results
• FUM and flows information presented herein is not comparable with industry data as it excludes products not acquired by IOOF
• FUM outflows include pension payments
• This analysis has been prepared on a standalone pro forma basis17 17 17 18
11 12 11 12
7 7 7 7
3735
1H18
36
1H19 2H192H18
35
+2%
Wrap
OneAnswer Frontier
ANZ Smart Choice
11 11 10 10
3 22 2
2H181H18 1H19 2H19
14 1312 12
-10%
Legacy Employer Legacy Retail
Open solutions Closed solutions
FY18 FY19Inflows Outflows Inflows Outflows
Open solutions 4.2 -4.5 3.4 -5.1ANZ Smart Choice 2.2 -2.1 2.0 -2.2Wrap 0.8 -1.0 0.7 -1.0One Answer Frontier 1.3 -1.4 0.8 -1.9
Closed solutions 0.4 -1.9 0.4 -2.2Legacy Retail 0.3 -1.6 0.4 -1.8Legacy Employer 0.1 -0.4 0.1 -0.4
Total 4.6 -6.4 3.9 -7.3
For
per
sona
l use
onl
y

2019 FULL YEAR RESULTS
—I N V E S TO R D I S C U S S I O N PA C K
T R E A S U RY
For
per
sona
l use
onl
y

REGULATORY CAPITAL
CAPITAL UPDATE APRA LEVEL 2 COMMON EQUITY TIER 1 (CET1)
APRA Level 2 CET1 ratio of 11.4% (16.4% on an Internationally Comparable basis1), which is in excess of APRA’s ‘unquestionably strong’ benchmark2.
APRA Level 1 CET1 ratio of 11.4%. Level 1 consolidation primarily comprises ANZ BGL (the Parent including offshore branches) but excludes offshore banking subsidiaries3.
APRA Leverage ratio of 5.6% (or 6.2% on an Internationally Comparable basis).
Asset divestments contributed ~$2b in 2H19 (mainly divestment of OPL Australia)
Pro-forma adjusted CET1 ratio of ~11.5%, including benefits from P&I divestment (~20bps), partially offset by IFRS16 impacts (~-7bps)
Organic Capital Generation
Net organic capital generation of 75bps for 2H19 – in line with historical averages of ~80bps (excluding Institutional rebalancing)
Capital Outlook – Regulatory Development
RBNZ capital proposal – Potential impact of NZ$6b to NZ$8b for ANZ NZ (from Sep-18). Final impact depends on the outcome of the RBNZ consultation.
APRA loss absorbing capacity (TLAC) – Total Capital requirements increased by 3% of RWA (~$12b in Tier 2 based on Sep-19 position) by January 2024.
Revisions to treatment of equity investments in subsidiaries - in the absence of any offsetting management actions, this implies a reduction in ANZ’s Level 1 CET1 capital ratio of up to approximately $2.5b (75bps). However, ANZ believes that this outcome is unlikely and, post implementation of management actions, the net capital impact could be minimal.
Other ongoing APRA regulatory reviews potentially impacting the future capital position include: Revisions to capital framework (RWA), Unquestionably Strong capital calibration, and the Transparency, Comparability and Flexibility proposals.
%
LEVEL 2 BASEL III CET1
%
68
1. Internationally Comparable methodology aligns with APRA’s information paper entitled International Capital Comparison Study (13 July 2015). Basel III Internationally Comparable ratios do not include an estimate of the Basel I capital floor 2. Based on APRA information paper “Strengthening banking system resilience – establishing unquestionably strong capital ratios” released in July 2017 3. Refer to ANZ Basel III APS330 Pillar 3 disclosures 4. Cash NPAT excludes ‘Large/notable’ items’ and one-off items 5. Mainly comprises the movement in retained earnings in deconsolidated entities and capitalised software 6. Includes SA-CCR (-18bps); APRA Operational Risk overlay (-18bps); and RWA floors for NZ housing/farm exposures (-18bps) 7. Other impacts include movements in non-cash earnings and net foreign currency translation
Net Organic Capital Generation +75bps
11.44 11.49 11.36
0.83 0.02 0.52
Cash NPAT4
Mar-19 RWA Business growth
Sep-18 Dividends
-0.20-0.51
Capital Deduc-tions5
Asset Divest-ments
Net Imposts6
Reme-diation
Other7 Sep-19
-0.10-0.56 -0.13
11.4 11.5 11.4
16.8 16.9 16.4
Sep-19Mar-19Sep-18
APRA Internationally Comparable1
For
per
sona
l use
onl
y

REGULATORY CAPITAL GENERATION
HISTORICAL NET ORGANIC CAPITAL GENERATION
69
1. Cash NPAT excludes ‘large/notable items’ & one off items (which are included as “other non-core and non-recurring items”)2. Represents movement in retained earnings in deconsolidated entities, capitalised software, expected losses in excess of eligible provisions shortfall and other intangibles3. Includes Bonus Option Plan
Organic Capital Generation
Net organic capital generation of +165bps for FY19 and +75bps for 2H19
Excluding Institutional portfolio rebalancing period, FY19 net organic capital generation is stronger by +24bps
COMMON EQUITY TIER 1 GENERATION (bps)
2H averages 2H12-2H18
2H19Full Year average
FY12-FY18FY19
Cash NPAT1 95 83 189 172
RWA movement 1 (10) (13) (7)
Capital Deductions2 (6) 2 (18) -
Net capital generation 90 75 158 165
Gross dividend (61) (57) (128) (117)
Dividend Reinvestment Plan3 10 1 19 2
Core change in CET1 capital ratio 39 19 49 50
Other non-core and non-recurring items (2) (32) 7 (58)
Net change in CET1 capital ratio 37 (13) 56 (8)
bps
119 128 144 130
179
229
182165
FY14 FY19FY16 FY18FY12 FY13 FY15 FY17
bps
Avg +204bpsInstitutional portfolio
rebalancing
Avg +141bps(ex. Institutional portfolio rebalancing FY16 & FY17)
For
per
sona
l use
onl
y

INTERNATIONALLY COMPARABLE1 REGULATORY CAPITAL POSITION
70
1. Internationally Comparable methodology aligns with APRA’s information paper entitled International Capital Comparison Study (13 July 2015). Basel III Internationally Comparable ratios do not include an estimate of the Basel I capital floor
APRA Level 2 CET1 – 30 September 2019 11.4%
Corporate undrawn EAD and unsecured LGD adjustments
Australian ADI unsecured corporate lending LGDs and undrawn CCFs exceed those applied in many jurisdictions 1.6%
Equity Investments & DTAAPRA requires 100% deduction from CET1 vs. Basel framework which allows concessional threshold prior to deduction
0.9%
MortgagesAPRA requires use of 20% mortgage LGD floor vs. 10% under Basel framework. Additionally, APRA also requires a higher correlation factor vs 15% under Basel framework.
1.2%
Specialised LendingAPRA requires supervisory slotting approach which results in more conservative risk weights than under Basel framework
0.7%
IRRBB RWA APRA includes in Pillar 1 RWA. This is not required under the Basel framework 0.2%
OtherIncludes impact of deductions from CET1 for capitalised expenses and deferred fee income required by APRA, currency conversion threshold and other retail standardised exposures
0.4%
Basel III Internationally Comparable CET1 16.4%
Basel III Internationally Comparable Tier 1 Ratio 18.8%
Basel III Internationally Comparable Total Capital Ratio 21.4%
For
per
sona
l use
onl
y

CET1 AND LEVERAGE IN A GLOBAL CONTEXT
CET1 RATIOS1 LEVERAGE RATIOS1,2
71
1. CET1 and leverage ratios are based on ANZ estimated adjustment for accrued expected future dividends where applicable. ANZ ratios are on an Internationally Comparable basis. All data sourced from company reports and ANZ estimates based on last reported half/full year results assuming Basel III capital reforms fully implemented 2. Includes adjustments for transitional AT1 where applicable. Exclude US banks as leverage ratio exposures are based on US GAAP accounting and therefore incomparable with other jurisdictions which are based on IFRS.
LeverageANZ compares equally well
on leverage, however international comparisons are more difficult to make
given the favourable treatment of derivatives
under US GAAP
15%5% 10% 20%
Raiffeisen Bank International (RBI)
ANZ
JP Morgan
Svenska HandelsbankenSEB
Swedbank
Danske BankMorgan Stanley
RabobankGroupe BPCE
Citibank
Credit Agricole Group
Societe Generale
ING GroupNordea
BBVA
OCBCHSBC
BMO
UBS
Standard CharteredDBS
Goldman SachsErste Bank
Deutsche BankBarclays
Intesa SanpaoloCommerzbank
Wells FargoCredit Suisse
Santander
BNP ParibasUniCredit
Bank of America
UOB
State Street
RBC
Scotia
ABN Amro
RBS
TD
2% 8%4% 6%
ING Group
Svenska Handelsbanken
DBSBBVA
Intesa Sanpaolo
BMO
Erste BankRaiffeisen Bank International (RBI)
HSBCRabobank
Credit Agricole GroupStandard Chartered
UBSCredit Suisse
ANZ
ABN Amro
Groupe BPCENordea
BarclaysSantanderUniCredit
Societe Generale
Swedbank
SEB
BNP Paribas
CommerzbankDanske Bank
RBC
Scotia
Deutsche BankTD
OCBCUOB
RBS
For
per
sona
l use
onl
y

BALANCE SHEET STRUCTURE1
BALANCE SHEET COMPOSITION
72
Corporate, PSE & Operational Deposits
21%
Mortgages40%
Liquid and Other Assets29%
Retail & SME Deposits 31%
FI Lending6%
Non-FI Lending25%
Assets
Short Term Wholesale Debt & Other Funding2
25%
Long Term Wholesale Debt14%
Capital Incl. Hybrids & T2 9%
Funding
NSFR COMPOSITION
Sep 2019
Capital
Other Loans5
Retail/SME
Residential Mortgages6,7
<35%
Non Financial Corporates
Liquids and Other Assets4
Wholesale Funding & Other3
Available Stable Funding
RequiredStable Funding
$515b
$443b
1. NSFR Required Stable Funding (RSF) and Available Stable Funding (ASF) categories and all figures shown are on a Level 2 basis per APRA prudential standard APS210 2. Includes FI/Bank deposits, Repo funding and other short dated liabilities 3. ‘Other’ includes Sovereign, and non-operational FI Deposits 4. ‘Other Assets’ include Off Balance Sheet, Derivatives, Fixed Assets and Other Assets 5. All lending >35% Risk weight 6. Includes NSFR impact of self-securitised assets backing the Committed Liquidity Facility (CLF) 7. <35% Risk weighting as per APS 112 Capital Adequacy: Standardised Approach to Credit Risk 8. Net of other ASF and other RSF
NSFR MOVEMENT
Sep 2018 v Sep 2019
Retail/Corp/Operational
Deposits
Sep-18 Loans Wholesale Debt, SHE & Hybrids
LiquidAssets
Sep-19
0.8%
Other8Bank Deposits & Repo Funding
116.4%-0.6%
114.6%
2.6%
-0.2%
0.2%
-1.0%
~115% adjusted for CLF reduction from 1 Jan 2020
For
per
sona
l use
onl
y

LIQUIDITY COVERAGE RATIO (LCR) SUMMARY1
LCR COMPOSITION (AVERAGE) MOVEMENT IN AVERAGE LCR SURPLUS ($b)
FY19 FY18 v FY19
73
1. All figures shown on a Level 2 basis as per APRA Prudential Standard APS210 2. Comprised of assets qualifying as collateral for the Committed Liquidity Facility (CLF), excluding internal RMBS, up to approved facility limit; and any assets contained in the RBNZ’s liquidity Policy – Annex: Liquidity Assets – Prudential Supervision Department Document BS13A 3. ‘Other’ includes off-balance sheet and cash inflows 4. RBA CLF increased by $1.1b from 1 January 2019 to $48.0b (2018: $46.9b, 2017: $43.8b) 5. ‘Other’ includes off-balance sheet and cash inflows
Wholesale funding
$134b
Customer deposits& other3
Net Cash Outflow
HQLA1
HQLA2
Internal RMBS
Other ALA2
Liquid Assets
$188b
FY18LCR 138%
FY19LCR 140%
LCR Surplus LCR Surplus
5354
2
1
0
6
CLF4 Liquid Assets
FY18
-4
Retail/SME Corp/FI/PSE
Other5Wholesale Funding
FY19
-4
For
per
sona
l use
onl
y

TERM WHOLESALE FUNDING PORTFOLIO1
ISSUANCE MATURITIES
PORTFOLIO PORTFOLIO BY CURRENCY
$b
74
1. All figures based on historical FX and exclude AT1. Includes transactions with an original call or maturity date greater than 12 months as at the respective reporting date. Tier 2 maturity profile is based on the next callable date
19
FY13 FY14 FY15 FY18 FY20
27
FY17FY16 FY19 FY21 FY22 FY23 FY24 FY25 FY26+
24 232421
32
22 2224
2
14
18
11
75%
16%
7%2%
Senior Unsecured
Covered Bonds
Tier 2
RMBS
38%
34%
23%
5%
UK & Europe (£, €, CHF)
Domestic (AUD, NZD)
North America (USD, CAD)
Asia (JPY, HKD, SGD, CNY)
Senior Unsecured Covered Bonds Tier 2 RMBS
$14.5b in AUD and NZD
Domestic portfolio up from 33% in
FY18
• ANZ’s term funding requirements depend on market conditions, balance sheet needs and exchange rates, amongst other factors
• ANZ estimates an FY20 funding requirement broadly consistent with previous years at ~$25b
For
per
sona
l use
onl
y

ANZ’S TIER 2 CAPITAL PROFILE1
ANZ’S TIER 2 CAPITAL REQUIREMENT TO PROGRESSIVELY INCREASE POST TLAC ANNOUNCEMENT
TIER 2 CAPITAL
FUNDING PROFILE CAPITAL AMORTISATION PROFILE2
Notional amount
Notional amount, $m $m
75
1. Profile is AUD equivalent based on historical FX, excluding Perpetual Floating rate notes issued 30 October 1986 (which loses Basel III transitional relief in 2021). Any call is subject to APRA’s prior written approval and note holders should not expect approval to be given
2. Amortisation profile is modelled based on scheduled first call date for callable structures and in line with APRA’s amortisation requirements for bullet structures
By Format By Currency
46%
54%
Bullet
Callable
43%
32%
6%
7%
6%6%
USD
SGD
AUD Domestic
AUD Offshore
JPY
CNY
498831
674
131
2,937
2,282
225
FY24FY22FY20 FY21 FY25FY23 FY27FY26
0
Scheduled Bullet and Call Date Profile
FY20 FY27FY21 FY22 FY26FY24FY23 FY25
735
1,0681,368
824
2,444
456 456225
Bullet Amortisation Callable
• Issued AUD $1.75b in July 2019
• Current portfolio includes 38% in AUD (32% domestic AUD) – strong capacity remaining in AUD
• Annual total T2 issuance expected to be ~$4b
• Required portfolio increase from $7.6b to ~$20b by January 2024
• Planned issuance in multiple currencies in both callable and bullet format
• Capacity in EUR T2 with no current outstandings following recent Sep-19 maturity
• No AUD retail T2 outstanding
• Extensive global USD T2 investor base
• ANZ has historically had strong support from Asian local currency markets, both in benchmark and Private Placement format
• Increased T2 issuance expected to be offset by reduction in other senior unsecured funding
• Well managed amortisation profile provides flexibility regarding issuance tenor
For
per
sona
l use
onl
y

IMPACTS OF RATE MOVEMENTS
BILLS/OIS SPREAD CAPITAL & REPLICATING DEPOSITS PORTFOLIO (AUSTRALIA)
CAPITAL2 & REPLICATING DEPOSITS PORTFOLIO
bps %
76
1. 90 day rolling average of spot 3mth Bills/OIS spread2. Includes other Non-Interest Bearing Assets & Liabilities
0
5
10
15
20
25
30
35
40
45
50
55
60
65
Jan-19
Jul-18
Oct-17
Sep-19
Jan-18
Apr-18
Oct-18
Jan-19
Apr-19
Spot 3mth Bills/OIS Spread Rolling 90 days
0.5
1.0
1.5
2.0
2.5
3.0
Jul-18
Oct-16
Jan-17
Jul-17
Apr-17
Oct-17
Oct-18
Jan-18
Apr-18
Jan-19
Apr-19
Jul-19
Sep-19
Portfolio Earnings Rate3mth BBSW (Monthly Average)
FY18 Ave1: 36.3bps
1H18 Ave: 24.4bps 2H18 Ave: 48.1bps
FY19 Ave1: 37.5bps
1H19 Ave: 48.0bps 2H19 Ave: 27.0bps
FY18 Ave: 2.29%
1H18 Ave: 2.29% 2H18 Ave: 2.28%
FY19 YTD Ave: 2.08%
1H19 Ave: 2.21% 2H19 Ave: 1.95%
AUST NZ APEA
Volume ($A) ~60bn ~20bn ~10bn
Target Duration Rolling 3 to 5 years Various
Proportion Hedged ~70% ~75% Various
For
per
sona
l use
onl
y

CAPITAL FRAMEWORK
CURRENT REGULATORY PROPOSALS AND RECENT FINALISATION1
77
1. Timeline is based on APRA’s 2019 Policy Agenda (published February 2019) 2. RBNZ is expected to finalise reforms towards the end of 2019 calendar year 3. Implementation 1 July 20194. Only in relation to the 3% of RWA increase in Total Capital requirements announced in July 2019
1H19 2H19 2020 2021 2022 2023 2024
RBNZ capital framework Consultation Finalise2 Implementation
Counterparty Credit Risk3 Implementation
Leverage ratio Consultation Finalise Implementation
Advanced approach to credit risk
Consultation Implementation
Standardised approach to credit risk
Consultation Finalise Implementation
Operational risk Consultation Finalise Implementation
Interest rate risk in the banking book
Consultation Implementation
Loss absorbing capacity (LAC)4 Consultation Finalise Implementation
Related party exposures Consultation Finalise Implementation
Capital treatment for Investments in subsidiaries (Level 1)
Consultation Implementation
Transition
Transition
For
per
sona
l use
onl
y

2019 FULL YEAR RESULTS
—I N V E S TO R D I S C U S S I O N PA C K
R I S K M A N A G E M E N T
For
per
sona
l use
onl
y

KEY RISK METRICS
CREDIT IMPAIRMENT CHARGE
$m
INDIVIDUAL PROVISION (IP) CHARGE
$m
COLLECTIVE PROVISION (CP) BALANCE & COVERAGE
$m
GROSS IMPAIRED ASSETS
$m
NEW IMPAIRED ASSETS
$m
AUSTRALIA MORTGAGES 90DPD (INCL NPL)
$m
79
1. Increase to New and Increased Individual Provisions and Writebacks & Recoveries compared to prior half is largely related to the home loan portfolio in Australia Retail and Commercial following the implementation of a more market responsive collateral valuation methodology
2. New Impaired Assets in 2H19 includes a $167m uplift on 1H19 in Australia home loans following the implementation of revised provisioning and impairment processes (including a more market responsive collateral valuation methodology)
CREDIT RWA
$b
EXPOSURE AT DEFAULT (EAD)
$b
INTERNAL EXPECTED LOSS (IEL)
$m
380
1H18
787
1H191H17 2H17
554
2H18 2H191
430 343 3982,785 2,662 2,579 2,523
3,378 3,376
Mar-17
0.81% 0.75%0.79%
Sep-17
0.75%
Sep-18Mar-18
0.98%
Mar 19
0.94%
Sep-19
CP Balance CP/CRWA
Sep-17Mar-17 Sep-19
2,139
Sep-18Mar-18 Mar-19
2,9402,384
2,034 2,128 2,029
1H19
890
2H171H17
1,787
1H18 2H1922H18
1,425
9631,145 1,117
Australia New Zealand OtherInstitutional
899 903 930 944 968 977
Mar-17 Mar-19Sep-17 Sep-18Mar-18 Sep-19
1,983 1,870 1,780 1,666 1,659 1,605
1H18
0.35%0.27%
1H17
0.32%
2H17
0.30%
2H18
0.27%
1H19
0.26%
2H19
IEL IEL/GLA
IncreasedNew Writebacks & Recoveries
OtherAustralia New Zealand Institutional
2,013 2,226 2,401 2,3732,696
3,071
0.86%
Mar-19
0.84%
Mar-17
0.79%
Mar-18
0.89%
Sep-17 Sep-18
1.00%1.16%
Sep-19
% Total Portfolio90DPD (Incl. NPL)
342 337 343 338 346 358
35.8%36.9%38.0%
Mar-17 Sep-17
37.3%
Mar-18 Sep-18
35.7%
Mar-19
36.7%
Sep-19
CRWA CRWA/EAD
CP Balance (AASB9)
720
479408
280393 402
2H17 2H19
0.16%0.14%
1H19
0.25%
1H17 1H18
0.09%
2H18
0.13% 0.13%
CIC as % Avg.GLA Total Provision Charge
Sep-19 CP/CRWA impacted -3bps by increase in CRWA’s from regulatory & methodology changes (incl. SA-CCR)
For
per
sona
l use
onl
y

RISK MANAGEMENT
CREDIT IMPAIRMENT CHARGE
INDIVIDUAL PROVISION CHARGE LONG RUN LOSS RATE (INTERNAL EXPECTED LOSS)
$m bps
$m %
80
PROVISIONS
IP: Individual Provision charge; CP: Collective Provision charge; CIC: Total Credit Impairment charge1. Increase to New and Increased Individual Provisions and Writebacks & Recoveries compared to prior half is largely related to the home loan portfolio in Australia Retail and Commercial
following the implementation of a more market responsive collateral valuation methodology
-300
0
300
600
900
1,200
1,500
280
1H16 2H182H16 1H17 2H17 1H18 2H19
720
1H19
9181,038
479408 393 402
Consumer Commercial Institutional CP Charge
0
50
100
150
200
250
Sep02
Sep90
Sep93
Sep08
Sep14
Sep99
Sep05
Sep96
Sep11
Sep17
Sep18
Sep19
IP Loss Rate Median Annual IP Loss Rate (excl. current period)
Division Mar-16 Sep-16 Mar-17 Sep-17 Mar-18 Sep-18 Mar-19 Sep-19
Australia 0.35 0.33 0.33 0.33 0.31 0.29 0.29 0.29
New Zealand 0.25 0.26 0.26 0.22 0.21 0.19 0.19 0.18
Institutional 0.37 0.36 0.35 0.30 0.32 0.27 0.27 0.25
Other 1.47 1.79 1.60 1.69 1.95 1.78 1.60 1.40
Subtotal 0.34 0.33 0.33 0.30 0.30 0.27 0.27 0.26
Asia Retail 1.50 1.51 1.51 2.75 0 0 0 0
Total 0.37 0.35 0.35 0.32 0.30 0.27 0.27 0.26
229495
153 136 157
922
826
969812
612 594 532592
-259 -274 -335 -394 -298 -373 -245 -351
1H171H16 2H16 1H18
93
2H182H17 1H19 2H191
892
1,047
787
554
430 343380
398
116 122
New Increased Writebacks & Recoveries
ANZ HISTORICAL LOSS RATES
For
per
sona
l use
onl
y

COLLECTIVE PROVISION
COLLECTIVE PROVISION BALANCE COLLECTIVE PROVISION CHARGE1
COLLECTIVE PROVISION BALANCE PROVISION BALANCE/COVERAGE RATIO
$m
BY DIVISION ($m) AASB9 BY STAGES ($m) AASB9
81
1. Change in methodology introduced in 2H19 to measure components of CP charge2. Coverage ratio calculated as Provision Balance to Gross Loans & Advances for on-balance sheet exposures. Reduction in 2H19 stage 2 coverage ratio is a result of (a) Denominator effect:
increased stage 2 GLA in Australian home loans due to implementation of a revised provisioning model plus higher delinquency levels, and (b) Numerator effect: stable stage 2 ECL with the home loan ECL increase offset by decreases for other Australian portfolios and Institutional
2,523
3,376813 90 27 23
Sep-18 Other charge
Transition to AASB 9
Volume / Mix
Change in Risk
Economic Outlook
Sensitivity
FX/Other B’sheet
Sep-19
-79 -21
CP charge 17
AASB9
$m 1H19 2H19 FY19
CP charge 13 4 17
Volume/Mix -28 -51 -79
Change in Risk -40 19 -21
Economic outlook sensitivity
73 17 90
Other 8 19 27
1,788 1,834 1,795
1,142 1,132 1,169
358 369 37448 43 38
3,3763,3783,336
Mar-19 Sep-19Sep-18
OtherNZInsto.AUS
1,412 1,530
814
434
Stage 1 Stage 3Stage 2
1,415 1,568
891
395
Stage 2Stage 1 Stage 3
31 Mar-19 30 Sep-19
Coverage ratio by stage2
1 2 3
0.19% 3.31% 20.76%
Coverage ratio by stage2
1 2 3
0.17% 2.40% 18.03%
Stage 1 CP Stage 2 CP Stage 3 CP Stage 3 IP
For
per
sona
l use
onl
y

RISK MANAGEMENT
CONTROL LIST GROSS IMPAIRED ASSETS BY DIVISION
NEW IMPAIRED ASSETS BY DIVISION GROSS IMPAIRED ASSETS BY EXPOSURE SIZE3
Index Sep 09 = 100
$m $m
82
IMPAIRED ASSETS
1. Other includes Retail Asia & Pacific and Australian Wealth2. New Impaired Assets in 2H19 includes a $167m uplift on 1H19 in Australia home loans following the implementation of revised provisioning and impairment processes (including a more
market responsive collateral valuation methodology)3. The increase referred to in footnote 2 has been largely offset in Gross Impaired Assets by the return of previously impaired home loans to a past due but not impaired status
$m
0
50
100
150
Sep 14
Sep 15
Sep 09
Sep 13
Sep 16
Sep 10
Sep 19
Sep 11
Sep 12
Sep 17
Sep 18
Control List by Limits Control List by No. of Groups
0
1,000
2,000
3,000
Mar-16
0.51%
Mar-17
0.55% 0.41%
Sep-16 Mar-19Sep-17
0.51% 0.34%
2,029
Mar-18
2,139
0.33%
2,883
Sep-18
0.33% 0.33%
2,034
Sep-19
3,1732,940
2,3842,128
New Zealand
Group GIA/GLA (EOP)Australia3 Institutional
Other1
0
500
1,000
1,500
2,000
2H161H16 2H171H17 2H192
1,787
1H18 2H18 1H19
1,784 1,844
1,425
9631,145
8901,117
Australia2 New Zealand OtherInstitutional
0
1,000
2,000
3,000
4,000
Mar-17 Mar-18 Sep-18Sep-17Sep-16Mar-15 Sep-15
2,940
Mar-16 Mar-19 Sep-19
2,708 2,719 2,8833,173
2,3842,034 2,139 2,128 2,029
10m to 100m< 10m > 100m
For
per
sona
l use
onl
y

RISK MANAGEMENT
TOTAL RISK WEIGHTED ASSETS CRWA MOVEMENT
GROUP EAD & CRWA GROWTH MOVEMENT1,2
$b $b
Sep-19 v Sep-18
$b
83
RISK WEIGHTED ASSETS
1. Post CRM EAD, net of credit risk mitigation such as guarantees, credit derivatives, netting and financial collateral. Excludes amounts for ‘Securitisation’ and ‘Other Assets’ Basel asset classes 2. Refers to FX adjusted lending movement, excluding Methodology Review and Risk
337.6
358.1
4.5 0.4
14.3 1.3
FX Impact RiskSep-18 Lending Mvmt.
MethodologyReview
Sep-19
-6.5-3.4
3.30.6
21.9
-1.8 -2.7
0.3
-1.3
5.9
OtherAUS HL AUS Non HL NZ Institutional
EAD growth CRWA growth
334352 342 337 343 338 346 358
1618
17 17 16 16
38
3939 37 37 38 38
47388
Sep-18Mar-17Mar-16 Sep-16 Sep-17 Mar-19
12
Mar-18
13
Sep-19
409397 391 396 391 396
417
CRWA Mkt. & IRRBB RWA Op-RWA
202
156
358
Sep-19
CRWA (ex. Insto)
CRWA (Insto)
2H19 increase includes op. risk modelled increase of +$3b combined with an overlay +$6.25b and
+$11.8b of CRWA methodology changes
Increase driven by SA-CCR implementation, a regulatory overlay for Australia Home Loans as well as
implementation of APRA Risk Weight floors for New Zealand Home Loan and Farm Lending Portfolios
For
per
sona
l use
onl
y

Category % of Group EAD% of Portfolio in Non
PerformingPortfolio Balance
in Non Performing
Sep-18 Mar-19 Sep-19 Sep-18 Mar-19 Sep-19 Sep-19
Consumer Lending 39.7% 38.8% 37.6% 0.2% 0.2% 0.1% $549m
Finance, Investment & Insurance 19.6% 20.2% 20.3% 0.0% 0.1% 0.0% $73m
Property Services 6.8% 7.0% 7.0% 0.3% 0.3% 0.2% $158m
Manufacturing 4.6% 4.7% 5.1% 0.4% 0.3% 0.3% $138m
Agriculture, Forestry, Fishing 3.7% 3.7% 3.6% 1.1% 1.1% 1.1% $373m
Government & Official Institutions 6.9% 6.8% 7.3% 0.0% 0.0% 0.0% $0m
Wholesale trade 3.0% 3.0% 3.0% 0.3% 0.3% 0.3% $78m
Retail Trade 2.2% 2.2% 2.2% 0.9% 0.7% 0.7% $157m
Transport & Storage 2.0% 2.1% 2.2% 0.2% 0.2% 0.3% $75m
Business Services 1.6% 1.6% 1.6% 0.9% 1.0% 1.0% $166m
Resources (Mining) 1.6% 1.6% 1.8% 0.3% 0.3% 0.2% $40m
Electricity, Gas & Water Supply 1.2% 1.2% 1.3% 0.1% 0.1% 0.1% $17m
Construction 1.4% 1.3% 1.3% 1.7% 1.8% 1.7% $218m
Other 5.7% 5.7% 5.8% 0.4% 0.4% 0.4% $224m
Total 100% 100% 100% $2,267m
Total Group EAD1 $944b $968b $977b
EXPOSURE AT DEFAULT (EAD) DISTRIBUTION
PORTFOLIO COMPOSITION
84
1. EAD excludes amounts for ‘Securitisation’ and ‘Other Assets’ Basel classes. Data provided is on a Post CRM basis, net of credit risk mitigation such as guarantees, credit derivatives, netting and financial collateral
37.6%
20.3%
7.0%
5.1%
3.6%
7.3%
3.0%
5.8%
TOTAL GROUP EAD (Sep-19) = $977b1
RISK MANAGEMENT
For
per
sona
l use
onl
y

RISK MANAGEMENT
COMMERCIAL PROPERTY OUTSTANDINGS BY REGION COMMERCIAL PROPERTY OUSTANDINGS BY SECTOR
$b %
PROPERTY PORTFOLIO MANAGEMENT
COMMERCIAL PROPERTY PORTFOLIO
851. APEA = Asia Pacific, Europe & America
25.7 24.8 25.5 25.4 24.927.5 28.9 29.6
8.8 9.5 9.5 9.7 9.7
9.810.7 10.5
3.9 3.6 2.7 2.4 3.0
2.9
2.8 2.8
6
2
0
1
3
4
5
7
8
9
10
11
12
Mar-19Mar-16
42.9
Sep-16 Mar-18Mar-17 Sep-17 Sep-18 Sep-19
38.4 37.9 37.7 37.5 37.6
40.2
42.4
% of Group GLA (RHS) Australia APEA1New Zealand
40
20
80
60
100
Mar-17 Sep-17 Mar-18 Sep-18 Mar-19 Sep-19
Offices TourismRetail ResidentialIndustrial Other
• Australian exposure increased by 2% HOH driven by higher lending to Funds and REITs in the Industrial sector partly offset by a decline in Residential lending given the slowdown in the residential property market. Retail exposure declined over the half and the Retail portfolio continues to be closely monitored owing to the weak operating environment
• Slight decline in New Zealand exposure was driven by exchange rate movements and some significant repayments occurring during 2H FY19
• APEA exposure remained stable for 2H19 with the portfolio concentrated on large well rated names in Singapore and Hong Kong. The Hong Kong Property market has seen a 1% index decline given current unrest. Market consensus estimates a decline as high of 10-20% if the protests continue through the year. The Hong Kong property portfolio remains subject to close monitoring of internal and external metrics
%
For
per
sona
l use
onl
y

RESIDENTIAL DEVELOPMENT
OVERVIEW PROFILE (SEP-19)
• Average qualifying pre-sales for Inner City Apartment Development loans and corresponding LVRs were 101% and 52%, respectively as at Sep 19 (as compared to presales of 101% and LVR of 49% in Mar 19). These loans remain subject to tight parameters around LVR, presale debt cover and quantum of foreign purchaser presales. Overall appetite for Apartment Development has remained unchanged over the last half. The quality and experience of developers and builders remains a key selection criterion.
• Outside of Inner City locations, development exposures are predominantly in the suburbs of the capital cities of the above listed states.
• Residential Development projects continue to be closely monitored with level of oversight driven by progress of the project vs. plan, industry trends and emerging risks.
861. Other Development primarily comprises Low Rise & Prestige Residential and Multi Project Development
40%
31%
20%
9%
2.1
0.9
Other
NSW and ACT
0.4
0.3
0.2
Bris
QLD
Syd
VIC
0.1
0.3
Melb
Total Residential Limits: $10.6b
Apartment Development
$4.20b
Apartment Development
Residential & Subdivision
Other Development1
Investment
$0.67b inner city apartment development
$3.54b other apartment
development
Sep-18($b)
Sep-19($b)
Total Exposure 10.28 10.60
Apartments (>3 levels) 3.97 4.20
Inner City 0.56 0.70
For
per
sona
l use
onl
y

RISK MANAGEMENT
AGRICULTURE EXPOSURE BY SECTOR (% EAD)
87
GROUP AGRICULTURE PORTFOLIO
1. Security indicator is based on ANZ extended security valuations2. Dairy exposures for all of ANZ New Zealand (includes Commercial and Agriculture, Institutional and Business Banking portfolios)
Total EAD (Sep-19) As a % of Group EAD
A$35.2b 3.6%
35.0%
14.4%9.6%
17.7%
12.8%
10.4%
Dairy Sheep & Other Livestock
Forestry & Fishing/Agriculture Services
Beef
Horticulture/Fruit/Other Crops
Grain/Wheat
56.2%
43.5%
54.9%
0.3%
Sep-18
44.9%
0.2%
Sep-19
Australia
Intl. Markets
New Zealand
98.9%
1.1%
Sep-18 Sep-19
98.9%
1.1%
74.2%
15.9%
3.3%6.6%
Sep-18
6.1% 3.0%14.9%
76.0%
Sep-19
Impaired
Productive
<60% Secured
Fully Secured
60 - <80% Secured
80 - <100% Secured
GROUP AGRICULTURE EAD SPLITS1
NZD $b
NEW ZEALAND2 DAIRY CREDIT QUALITY
12.3 11.9 12.5 13.3 13.3 12.9 12.8 12.8 12.3
2.21%
Sep-14
1.22%
Sep-12
0.90% 0.80%
Sep-15Sep-13
1.14%
Sep-16
1.95%
Sep-17
1.51% 1.91%
Sep-18
1.56%
Mar-19 Sep-19
Wt. Avg. Probability of Default NZ Dairy EAD
FY19 PD increase driven by customer downgrades, reflecting continued headwinds facing the dairy sector
For
per
sona
l use
onl
y

GROUP RESOURCES PORTFOLIO
TOTAL ANZ PORTFOLIO RESOURCES PORTFOLIO THERMAL COAL EXPOSURE
EAD $b EAD $b EAD $b
88
347 363 375 375 367
532 516 515554 593
Sep-16Sep-15
20 16 14
Sep-17 Sep-18
1590317
Sep-19
898
944
895
977
Consumer Lending
Other
Resources
Resources: 1.8% of ANZs total portfolio
Thermal coal
mining: <0.1% of ANZs total portfolio
8.67.8
7.0 7.48.2
4.9
4.0
3.5
4.4
5.2
2.9
1.7
1.4
1.2
1.5
1.3
1.1
1.0
0.9
1.0
0.7
0.7
1.7
1.2
0.8
0.7
0.8
0.6
0.3
Sep-15 Sep-19
0.4
Sep-16 Sep-17 Sep-18
20.0
16.1
14.0
17.3
15.3
Metallurgical Coal Mining
Oil & Gas Extraction
Metal Ore Mining
Other Mining
Services to mining Thermal Coal Mining
0.0
0.5
1.0
1.5
2.0
Sep-17Sep-15 Mar-19Sep-16 Sep-18 Sep-19
Thermal coal Thermal coal (Trendline)
• Portfolio is skewed towards well capitalised and lower cost resource producers. • 32% of the book is less than one year duration.• Investment grade exposures represent 79% of the portfolio vs. 68% at Sep 18. • Increase in total coal mining exposure in FY19 primarily reflects mergers and
acquisitions activity related to existing mines in 1H19, ie predominantly metallurgical coal assets sold by diversified miners to existing customers along with foreign currency exchange movements. Financing is mainly used to support continuing operations, and not mine expansions.
• Thermal coal exposure is currently $838m. We expect our thermal coal exposure to decline over time, as it has since 2015 (reducing by 50% between FY15-FY19). Decreased exposure in 2H19 compared to 1H19 reflects ongoing portfolio management and application of ANZ policies. Our exposures to thermal coal are primarily concentrated in a small number of Australian-based miners.
• Exposure to metallurgical coal mining (used for steel making) is currently $686m.
RESOURCES PORTFOLIO MANAGEMENT
For
per
sona
l use
onl
y

RISK MANAGEMENT
INSTITUTIONAL PORTFOLIO SIZE & TENOR (EAD2) ANZ INSTITUTIONAL INDUSTRY COMPOSITION
$b EAD (Sep-19): A$447b2
ANZ INSTITUTIONAL PRODUCT COMPOSITION
EAD (Sep-19) A$447b2
ANZ INSTITUTIONAL PORTFOLIO (COUNTRY OF INCORPORATION1)
891. Country is defined by the counterparty’s Country of Incorporation 2. Data provided is as at Sep-19 on a Post CRM basis, net of credit risk mitigation such as guarantees, credit derivatives, netting and financial collateral. Position excludes Basel Asset Class ‘Securitisation’, ‘Other Assets’, ‘Retail’ and manual adjustments 3. ~90% of the ANZ Institutional “Property Services” portfolio is to entities incorporated in either Australia or New Zealand 4. Other is comprised of 47 different industries with none comprising more than 2.1% of the Institutional portfolio.
0
50
100
150
200
250
300
350
400
78%
49%
51%
Total Institutional
65%
22%
China
35%
International Asia
85%15%
30%
16%
8%
8%
26%
4%3%3%
2%
Finance (Banks and Central Banks)
Basic Material Wholesaling
Petroleum Coal Chem & Assoc Prod Mnfg
Government Admin.
Services to Fin. & Ins.
Property Services3
Machinery & Equip Mnfg
Electricity & Gas Supply
Other⁴
20%
16%
25%
25%
12%
2%
0%Loans & Advances
Contingent Liabilities & Commitments
Traded Securities (e.g. Bonds)
Derivatives & Money Market Loans
Trade & Supply Chain
Gold Bullion
Other
Tenor < 1 Yr Tenor 1 Yr+
For
per
sona
l use
onl
y

RISK MANAGEMENT
COUNTRY OF INCORPORATION1 ANZ ASIA INDUSTRY COMPOSITION
EAD (Sep-19): A$121b2 EAD (Sep-19): A$121b2
ANZ ASIA PRODUCT COMPOSITION
EAD (Sep-19): A$121b2
ANZ ASIAN INSTITUTIONAL PORTFOLIO (COUNTRY OF INCORPORATION1)
901. Country is defined by the counterparty’s Country of Incorporation 2. Data provided is as at Sep-19 on a Post CRM basis, net of credit risk mitigation such as guarantees, credit derivatives, netting and financial collateral. Position excludes Basel Asset Class ‘Securitisation’, ‘Other Assets’, ‘Retail’ and manual adjustments 3. “Other” within industry is comprised of 43 different industries with none comprising more than 2.2% of the Asian Institutional portfolio; Other product category is predominantly exposure due from other financial institutions
26%
26%18%
8%
6%
5%
3%
5%3%
Hong Kong
China Other
Japan
TaiwanSingapore
South Korea
India
Indonesia
60%
6%
5%
19%
2%
2%
3%2% Property Services
Machinery & Equip Mnfg
Finance (Banks & Central Banks)
Basic Material Wholesaling
Other3
Petroleum,Coal,Chem & Assoc Prod Mnfg
Communication Services
Services To Finance & Insurance
20%
15%
30%
21%
12%
2%
0%Loans & Advances
Trade & Supply Chain
Traded Securities (e.g. Bonds)
Contingent Liabilities & Commitments
Derivatives & Money Market Loans
Gold Bullion
Other
For
per
sona
l use
onl
y

2019 FULL YEAR RESULTS
—I N V E S TO R D I S C U S S I O N PA C K
H O U S I N G P O R T F O L I O
For
per
sona
l use
onl
y

AUSTRALIA HOME LOANS
PORTFOLIO OVERVIEW
Portfolio1 Flow2
FY17 FY18 FY19 FY18 FY19
Number of Home Loan accounts1 1,009k 1,011k 983k 170k3 119k3
Total FUM1 $264b $272b $265b $57b $40b
Average Loan Size4 $262k $269k $270k $382k $378k
% Owner Occupied5 63% 65% 67% 70% 73%
% Investor5 33% 32% 30% 29% 26%
% Equity Line of Credit 4% 3% 3% 1% 1%
% Paying Variable Rate Loan6 83% 84% 84% 84% 78%
% Paying Fixed Rate Loan6 17% 16% 16% 16% 22%
% Paying Interest Only 31% 22% 15% 13% 11%
% Broker originated 51% 52% 52% 55% 53%
Portfolio1
FY17 FY18 FY19
Average LVR at Origination7,8,9 69% 67% 67%
Average Dynamic LVR (excl offset)8,9,10,11,12 55% 55% 57%
Average Dynamic LVR (incl offset)8,9,10,11,12 50% 50% 52%
Market Share (MBS publication)13 15.7% 15.5% n/a
Market share (MADIS publication) n/a n/a 14.3%
% Ahead of Repayments14 71% 72% 76%
Offset Balances15 $27b $28b $27b
% First Home Buyer 7% 7% 8%
% Low Doc16 4% 4% 4%
Loss Rate17 0.02% 0.02% 0.04%
% of Australia Geography Lending18,19 64% 63% 61%
% of Group Lending18 45% 45% 43%
1. Home Loans portfolio (includes Non Performing Loans, excludes Offset balances) 2. YTD unless noted 3. New accounts includes increases to existing accounts and split loans (fixed and variable components of the same loan)4. Average loan size for Flow excludes increases to existing accounts (note the average loan size previously reported in 1H18 and prior included increases to existing accounts) 5. The current classification of Investor vs OwnerOccupier is based on ANZ’s product category, determined at origination as advised by the customer and the ongoing precision relies primarily on the customer’s obligation to advise ANZ of any change in circumstances. 6.Excludes Equity Manager 7. Originated in the respective year 8. Unweighted 9. Includes capitalised LMI premiums 10. Valuations updated to Aug-19 where available 11. Includes Non Performing Loans and excludes accountswith a security guarantee 12. Historical DLVR has been restated as a result of enhancements to methodology 13. APRA Monthly ADI Statistics to Aug-19 – Note APRA changed the underlying market share definition in Jul-19 andhistorical periods (FY17 & FY18) are not comparable to FY19 14. % of Owner Occupied and Investment Loans that have any amount ahead of repayments. Includes Offset balances. Excludes Equity Manager. Includes NonPerforming Loans 15. Balances of Offset accounts connected to existing Instalment Loans 16. Low Doc is comprised of less than or equal to 60% LVR mortgages primarily for self-employed without scheduled PAYG income.However, it also has ~0.1% of less than or equal to 80% LVR mortgages, primarily booked pre-2008 17. Annualised write-off net of recoveries 18. Based on Gross Loans and Advances 19. Australia Geography includesAustralia Division, Wealth Australia and Institutional Australia
92
For
per
sona
l use
onl
y

AUSTRALIA HOME LOANS
HOME LOAN COMPOSITION1,2LOAN BALANCE & LENDING FLOWS1
$b $b
ANZ MORTGAGE LENDING PORTFOLIO CHANGE
PORTFOLIO GROWTH
93
272 265
2916
Sep-18
-50
New Sales exc Refi-In
-2
Net OFI Refi Redraw & Interest
Sep-19Repay / Other
39
26
33
121
269
Sep-17
38
22
54
10
161
Mar-17
134
4931
9 8
146
44
29
Sep-18
43
9
Mar-18 Mar-19
156
49
37
8
52
17
33
7
54
14
Sep-19
164
264 271 265272256
Equity ManagerOO P&I Inv I/OOO I/OInv P&I
1. Includes Non Performing Loans2. The current classification of Investor vs Owner Occupier is based on ANZ’s product category, determined at origination as advised by the customer and the ongoing precision relies primarily on the customer’s obligation to advise
ANZ of any change in circumstances3. Includes Equity Manager
FY19 v FY18 Owner Occupied3 Investor
Housing Portfolio -1% -7%
FY19 v FY18 Principal & interest3 Interest only
Housing Portfolio 6% -33%For
per
sona
l use
onl
y

AUSTRALIA HOME LOANS
TOTAL HOUSING
MARKET SHARE
94
1. APRA MADIS definition: Loans to households: Housing: Owner-occupied are loans to resident households for the purpose of housing, where the funds are used for a residential property that is occupied or to be occupied by the borrower(s) as their principal place of residence. The principal place of residence means the residential property at which an individual resides for the majority of the year. Loans to households: Housing: Investment are loans to resident households for the purpose of housing, where the funds are used for a residential property that is not owner-occupied.
14.4%
June 19 (MBS) June 19 (MADIS)
14.9%
OWNER OCCUPIED INVESTOR
In July 2019 the APRA Monthly Authorised Deposit Institution Statistics (MADIS) publication replaced the APRA Monthly Banking Statistics (MBS) publication. Under the new publication, changes in the market cohort and changes in definitions impacted housing market share for ADIs when compared with the previous MBS publication. With respect to the housing categories, three noteworthy changes included: Inclusion of building societies, credit unions and other ADIs, resulting in an increase in FUM within the total system, consequently reducing market share
of ADIs relative to market share under the MBS publication Change in the definition of what is included within the housing categories (for ANZ total housing reduced by $8.2b (June 2019) within the MADIS
publication compared with the MBS publication) Changes to definition of Owner-Occupied and Investment housing based on housing purpose1
June 19 (MADIS)June 19 (MBS)
14.9%15.6%
June 19 (MBS) June 19 (MADIS)
13.8% 13.6%
MARKET SHARE
For
per
sona
l use
onl
y

AUSTRALIA HOME LOANS
BY PURPOSE BY ORIGINATION LVR4
BY LOCATION BY CHANNEL
95
PORTFOLIO1,2 & FLOW3 COMPOSITION
1. Includes Non Performing Loans. 2. The current classification of Investor vs Owner Occupier is based on ANZ’s product category, determined at origination as advised by the customer and the ongoing precision relies primarily on the customer’s obligation to advise ANZ of any change in circumstances 3. YTD unless noted 4. Includes capitalised LMI premiums
61% 65% 67%
19% 17% 16%
20% 18% 17%
FY17 FY18 FY19
63% 65% 67% 73%
33% 32% 30% 26%
FY19Sep-18
3%4%
Sep-17 Sep-19
3% 1%
32% 33% 33% 40%
31% 32% 32%31%
16% 16% 16%14%
14% 13% 13% 9%
FY19Sep-19
6%7%
Sep-18Sep-17
6%
Portfolio
Owner Occ Investor Equity
WAVIC/TAS NSW/ACT QLD SA/NT
Flow
FlowPortfolio
<80% LVR 80% LVR >80% LVR
Portfolio Flow
48%
Sep-18
$264b
49%
51%
Sep-17
52%
48%
52%
Sep-19
$272b $265b
Broker Proprietary
44%
55%56%
FY17 FY19
45%
FY18
53%
47%
$67b
$57b
$40b
Flow
6%
For
per
sona
l use
onl
y

AUSTRALIA HOME LOANS
HOME LOANS REPAYMENT PROFILE1,2 HOME LOANS ON TIME & <1 MONTH AHEAD PROFILE1,2
76% of accounts ahead of repayments % composition of accounts (September 19)
DYNAMIC LOAN TO VALUE RATIO3,4,6,7
% of portfolio
PORTFOLIO DYNAMICS
96
1. Includes Non Performing Loans 2. % of Owner Occupied and Investment Loans that have any amount ahead of repayments. Includes Offset balances. Excludes Equity Manager. Includes Non Performing Loans 3. Includes capitalised LMI premiums 4. Valuations updated to Aug’19 where available 5. The current classification of Investor vs Owner Occupier, is based on ANZ’s product category, determined at origination as advised by the customer and the ongoing precision relies primarily on the customer’s obligation to advise ANZ of any change in circumstances 6. Historical DLVR has been restated as a result of enhancements to methodology 7. Includes Non Performing Loans and excludes accounts with a security guarantee
4%
20% 21%
9%6% 6% 7%
27%
6-12 months ahead
Overdue On Time <1 month ahead
1-3 months ahead
3-6 months ahead
1-2 years ahead
>2 years ahead
Investment:5 Interest payments may receive negative gearing/tax benefits
New Accounts: Less than 1 year old
Structural: Loans that restrict payments in advance. E.g. fixed rate loans
Residual: Less than 1 month repayment buffer
10
60
0
20
50
30
40
0-60% 61-75% 76-80% 81-90% 91-95% 96-100% 100%+
Mar-17 Sep-17 Mar-18 Sep-18 Mar-19 Sep-19
27 32
14 12
21 19
38 37
Sep-18 Sep-19
91%+ DLVR by State
33%
32%
16%13%
6%
Sep-19
22%
26%
16%
30%
6%
Sep-19
Total Portfolio by FUM
• Represents 4.8% of portfolio
• Skew to mining states – WA, QLD & NT represent 65% of negative equity
• 59% ahead of repayments
• 47% with LMI
Sep-15 Sep-19Sep-16 Sep-17 Sep-18
VIC/TAS
NSW/ACT
QLD
WA
SA/NT
Net of offset balances
NEGATIVE EQUITY
For
per
sona
l use
onl
y

AUSTRALIA HOME LOANS
PRODUCT 90+ DAY DELINQUENCIES1,2,3 HOME LOAN DELINQUENCIES1,2,5
HOME LOANS 90+ DPD BY STATE1,2 HOME LOANS - 90+ DPD (BY VINTAGE)6
% %
% %
97
PORTFOLIO PERFORMANCE
1. Includes Non Performing Loans 2. ANZ delinquencies calculated on a missed payment basis 3. For Personal Loans, a new collections platform was implemented in Aug-18 enabling automated charge-off of late stage accounts. This resulted in a step change to 90+ rates. Following this, compatibility issues between systems resulted in an accumulation of 90+ debt not being charged-off, causing the 90+ rate to increase. This issue has now been resolved and the 90+ rate has returned to expected levels in FY19 4. Retail portfolio (Small Business, Commercial Cards and Asset Finance) 5. The current classification of Investor vs Owner Occupier, is based on ANZ’s product category, determined at origination as advised by the customer and the ongoing precision relies primarily on the customer’s obligation to advise ANZ of any change in circumstances 6. Home loans 90+ DPD vintages represent % ratio of over 90+ delinquent (measured by # accounts), contains at least 6 application months of that fiscal year contributing to each data point
Note: FY14 vintages and prior were impacted by hardship prior to policy solutions put in place and therefore not comparable to FY15 vintages and onwards
0.0
0.5
2.0
1.0
1.5
2.5
VIC & TAS NSW & ACT QLD WA SA & NT Portfolio
Sep-13
Mar-12
Sep-12
Mar-13 Mar-14
Sep-14
Mar-15
Sep-15
Mar-16
Sep-16
Mar-17
Sep-17
Mar-18
Sep-18
Mar-19
Sep-19
6 8 10 12 14 16 18 20 22 24 26 28 30 32 34 36
2.0
1.5
0.0
0.5
2.5
1.0
Month on book
2.0
5.0
1.0
0.0
3.0
4.0
Sep 13
Sep 12
Sep 14
Sep 17
Sep 15
Sep 16
Sep 18
Sep 19
Corporate & Commercial4
Home Loans Personal Loans
Consumer Cards
2.0
0.0
0.5
1.0
1.5
2.5
Sep 12
Sep 19
Sep 13
Sep 14
Sep 15
Sep 16
Sep 17
Sep 18
30+ DPD %
90+ Owner Occupied
90+ Investor
FY17FY15
FY16 FY18
FY19
For
per
sona
l use
onl
y
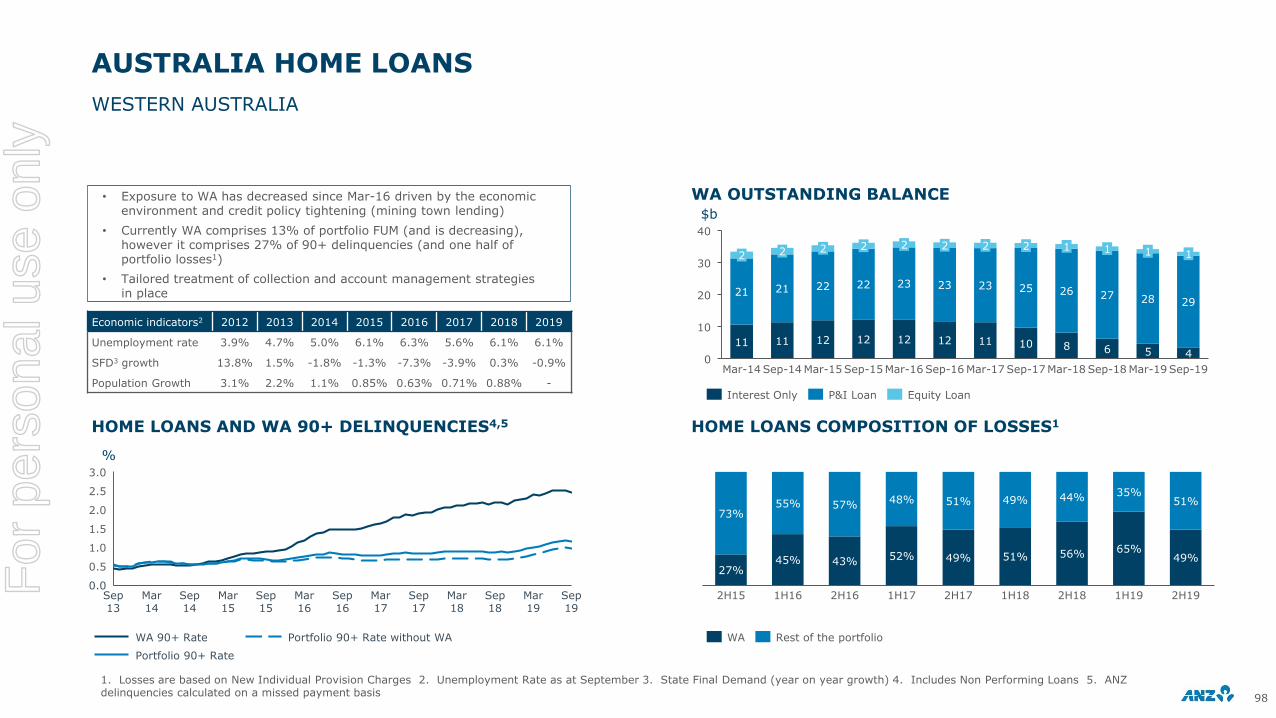
AUSTRALIA HOME LOANS
WA OUTSTANDING BALANCE
HOME LOANS AND WA 90+ DELINQUENCIES4,5 HOME LOANS COMPOSITION OF LOSSES1
$b
%
98
WESTERN AUSTRALIA
1. Losses are based on New Individual Provision Charges 2. Unemployment Rate as at September 3. State Final Demand (year on year growth) 4. Includes Non Performing Loans 5. ANZ delinquencies calculated on a missed payment basis
• Exposure to WA has decreased since Mar-16 driven by the economic environment and credit policy tightening (mining town lending)
• Currently WA comprises 13% of portfolio FUM (and is decreasing), however it comprises 27% of 90+ delinquencies (and one half of portfolio losses1)
• Tailored treatment of collection and account management strategies in place
10
40
0
20
30
12
23
10
22
21
11
Mar-14
2
Sep-15
21
2
11
Sep-14
2
22
1
12
Mar-15 Sep-17Sep-16
2
2722
Mar-18
23
1
812
Mar-16 Sep-18
2
1112
23
Mar-17
2
25
1
26
1
6
28
5
Mar-19
29
4
Sep-19
2H18
45%
2H15
73%57%
49%27%
35%
1H16
55%
43%
2H16 2H19
56%
48%
52%
1H17
51%
65%49%
2H17
49%
51%
1H18
44% 51%
1H19
2.5
0.5
0.0
1.0
1.5
2.0
3.0
Sep 17
Sep 13
Mar 18
Mar 14
Sep 14
Mar 15
Sep 15
Mar 16
Sep 16
Mar 17
Sep 18
Mar 19
Sep 19
Portfolio 90+ Rate without WAWA 90+ Rate
Portfolio 90+ Rate
WA Rest of the portfolio
Interest Only P&I Loan Equity Loan
Economic indicators2 2012 2013 2014 2015 2016 2017 2018 2019
Unemployment rate 3.9% 4.7% 5.0% 6.1% 6.3% 5.6% 6.1% 6.1%
SFD3 growth 13.8% 1.5% -1.8% -1.3% -7.3% -3.9% 0.3% -0.9%
Population Growth 3.1% 2.2% 1.1% 0.85% 0.63% 0.71% 0.88% -
For
per
sona
l use
onl
y

AUSTRALIA HOME LOANS
HOME LOANS AND NSW/ACT 90+ DELINQUENCIES1,2 NSW/ACT DYNAMIC LVR PROFILE – SEPTEMBER 20191,3,4,5
$b
%
99
NEW SOUTH WALES/ACT
1. Includes Non Performing Loans 2. ANZ delinquencies calculated on a missed payment basis 3. Includes capitalised LMI premiums 4. Valuations updated to Aug-19 where available 5. Includes Non Performing Loans and excludes accounts with a security guarantee
Portfolio• NSW/ACT makes up 32% of portfolio FUM and 25% of 90+ days past due.• 76% in advance of repayments which is in line with the total portfolio.• 18% of the portfolio is Interest Only & reducing.
90+ days past due• NSW/ACT at 88bps is similar to VIC/TAS at 86bps & 28bps below national
level.• Increase in the past 6 months, primarily driven by older vintages • Since FY15, credit quality has improved year-on-year, with FY17 & FY18
vintages performing better than FY15 & FY16 vintages.
Dynamic LVR• 12.2% of NSW/ACT portfolio >90% DLVR
0.0
0.5
1.0
1.5
Mar 15
Mar 17
Sep 13
Sep 14
Mar 14
Sep 15
Sep 16
Mar 16
Sep 17
Mar 18
Sep 18
Mar 19
Sep 19
Portfolio 90+ Rate
NSW/ACT 90+ Rate Portfolio 90+ Rate without NSW/ACT
HOUSING PORTFOLIO1
30
40
0
20
10
50
60
0-60% 61-75% 76-80% 81-90% 91-95% 96-100% 100%+
Total Portfolio Total Portfolio (ex WA) NSW/ACT
79 83 87 88 87 86
177 181 184 184 182 179
Sep-19Mar-17
269
Mar-19Sep-17 Mar-18 Sep-18
264256271 272 265
Rest of the Country NSW/ACT
HOUSING FLOW
$b
13 13 11 9 7 6
21 21 2017
14 13
2H19
34
1H181H17 2H17 2H18 1H19
3431
2621
19
%
For
per
sona
l use
onl
y

38 42
27
14 13 12 11
1H192H171H172H16 1H18 2H18 2H19
AUSTRALIA HOME LOANS
INTEREST ONLY FLOW COMPOSITION
SWITCHING INTEREST ONLY TO P&I AND SCHEDULED INTEREST ONLY TERM EXPIRY1,2
%
$b
100
INTEREST ONLY
1. Total portfolio including new flows 2. As at Sep-19 3. Includes Non Performing Loans and excludes accounts with a security guarantee
• Serviceability assessment is based on ability to repay principal & interest repayments calculated over the residual term of loan
• 86% of Interest Only customers have net income >$100k p.a. (portfolio 66%)
• Historical policy & pricing changes have led to a reduction in Interest Only lending. ANZ’s Interest Only flow composition is 11% for 2H19.
• Proactive contact strategies are in place to prepare customers for the change in their repayments ahead of Interest Only expiry
APRA’s 30% limit removed December 2018
6 7 79 8
68 8
74 4 3
6
2
84
43
3
1H20 2H211H17 2H17 1H18 2H18 2H202H191H19 1H21 1H22 2H22 1H23+
Contractual conversions Early conversions Contractual (still to convert)
DYNAMIC LVR PROFILE OF 12 MONTH FORWARD CONVERSIONS3
0-60% 76-80%61-75% 81-90% 91-95%
27
95%+
26
12
18
710
%
For
per
sona
l use
onl
y
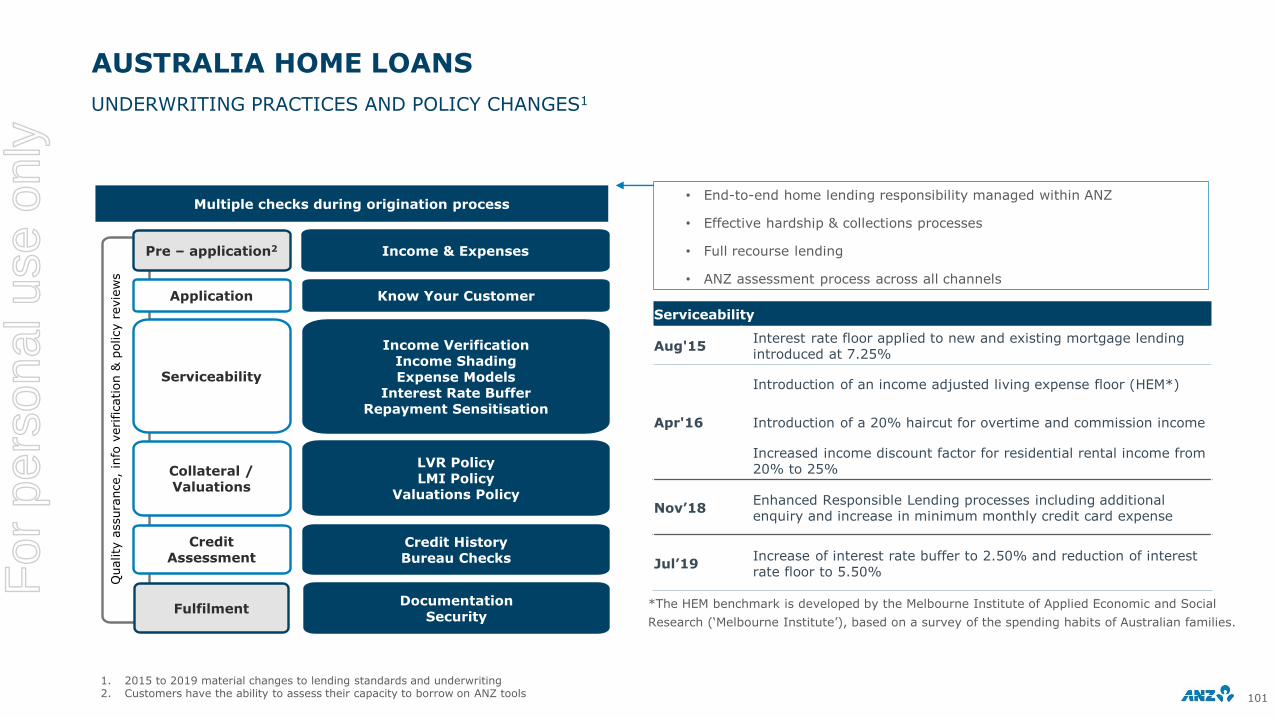
AUSTRALIA HOME LOANS
UNDERWRITING PRACTICES AND POLICY CHANGES1
101
1. 2015 to 2019 material changes to lending standards and underwriting 2. Customers have the ability to assess their capacity to borrow on ANZ tools
• End-to-end home lending responsibility managed within ANZ
• Effective hardship & collections processes
• Full recourse lending
• ANZ assessment process across all channels
Multiple checks during origination process
Quality
assura
nce,
info
veri
fication &
policy r
evie
ws
Know Your CustomerApplication
Income VerificationIncome ShadingExpense Models
Interest Rate BufferRepayment Sensitisation
Serviceability
LVR PolicyLMI Policy
Valuations Policy
Collateral / Valuations
Credit HistoryBureau Checks
Credit Assessment
DocumentationSecurity
Fulfilment
Income & ExpensesPre – application2
Serviceability
Aug'15Interest rate floor applied to new and existing mortgage lending introduced at 7.25%
Apr'16
Introduction of an income adjusted living expense floor (HEM*)
Introduction of a 20% haircut for overtime and commission income
Increased income discount factor for residential rental income from 20% to 25%
Nov’18Enhanced Responsible Lending processes including additional enquiry and increase in minimum monthly credit card expense
Jul’19Increase of interest rate buffer to 2.50% and reduction of interest rate floor to 5.50%
*The HEM benchmark is developed by the Melbourne Institute of Applied Economic and Social
Research (‘Melbourne Institute’), based on a survey of the spending habits of Australian families.
For
per
sona
l use
onl
y

AUSTRALIA HOME LOANS
UNDERWRITING PRACTICES AND POLICY CHANGES1 - JUNE 2015 TO SEPTEMBER 2019
102
1. 2015 to 2019 material changes to lending standards and underwriting 2. Residential Investment Loans 3. Equity Manager Accounts. 4. ANZ modelled outcome of 4 borrowing scenarios indexed to 2015 and using a customer lending rate of 3.90%: i. Couple, no dependents, ii. Single, no dependents, iii. Couple 2 dependents, iv. Couple, no dependents, higher income earners, where application parameters such as income are held steady while policy components are adjusted based on 2015 and 2019 settings. 5. Based on financial years.
ANZ LVR Caps• LVR cap reduced to 70% in high risk mining towns in June 2015; reduced to 90% for investment loans (July 2015)• Restricted new housing lending (new security to ANZ) to max. 80% LVR for all apartments within 7 inner city Brisbane postcodes (October 2017)• Restricted investment lending (new security to ANZ) to max 80% LVR for all apartments within 4 inner city Perth postcodes (October 2017)• Increase maximum LVR on interest only investment loans from 80% to 90% in March 2019 (excluding Mining towns and Apartment restrictions)
ANZ Assessment• Interest rate floor (new & existing lending) at 7.25% (August 2015) • Income adjusted living expense floor (HEM); 20% haircut for overtime & commission; Increased income discount factor for residential rental income from 20%
to 25% (April 2016)• Limited acceptance of foreign income to demonstrate serviceability and tightened controls on verification (September 2016)• Minimum default housing expense (rent/board) applied to all borrowers not living in their own home & seeking RILs2 or EMAs3 (July 2017) • IO renewals became Credit Critical events (full income verification & serviceability test) including P&I to IO & converting to or extending IO term (March 2018)• Enhanced Responsible Lending Requirements including additional enquiry and increase in minimum monthly credit card expense (November 2018)• Interest rate floor (new & existing lending) at 5.50% and interest rate buffer of 2.50% (July 2019)
ANZ Product and Other Limitations• Decreased max. IO term of owner occupied loans to 5 years (January 2017)• Withdrew lending to non-residents (September 2016); tightened acceptances for guarantees (December 2016); clarified residential lending to trading
companies is not acceptable (December 2017)• Increased maximum term of interest only investment loans from 5 to 10 years (from March 2019)
DRIVERS OF REDUCTION IN CUSTOMER BORROWING CAPACITY (v 2015)4
ANZ PORTFOLIO BORROWING CAPACITY SUMMARY5
FY17FY16 FY19FY18
Customers with additional borrowing capacity Customers borrowing at maximum capacity
10% of customers
borrowing at their
maximum capacityContribution
to reduction in borrowing
capacity
Sep-19Sep-18
HEM changes Servicing rate floor or buffer Income haircuts
30% reduction in borrowing capacity
>20% reduction in borrowing capacity
For
per
sona
l use
onl
y

AUSTRALIAN HOME LOANS
STRESS TESTING THE AUSTRALIAN MORTGAGE PORTFOLIO
1031. Based on mortgage exposure at default and conditions as at 31 March 2019
• ANZ conducts regular stress tests of its loan portfolios to meet risk management
objectives and satisfy regulatory requirements.
• Stress tests are highly assumption-driven; results will depend on economic assumptions,
on modelling assumptions, and on assumptions about actions taken in response to the
economic scenario.
• This illustrative recession scenario assumes significant reductions in consumer spending
and business investment, which lead to eight consecutive quarters of negative GDP
growth. This results in a significant increase in unemployment and material nationwide
falls in property prices.
• Estimated portfolio losses under these stressed conditions are manageable and within the
Group’s capital base, with cumulative total losses at $2.7b over three years (net of LMI
recoveries).
• The results have marginally improved from the stress test six months ago. Key reason for
the stressed losses reduction is the improved property price outlook and the impact of the
three rate cuts since May 2019, which are reflected in the underlying scenario.
Assumptions Base1 Year 1 Year 2 Year 3
Unemploymentrate
5.1% 5.5% 9.8% 10.5%
Cash Rate 1.5% 0.25% 0% 0%
Real GDP yearended growth
1.9% 0% -4.7% -0.6%
Cumulativereduction in house prices
- -32.3% -38.8% -31.7%
Portfolio size ($b) 295 294 287 278
Outcomes Year 1 Year 2 Year 3
Net Losses ($m) 286 1,282 1,141
Net losses (bps) 10 45 41
For
per
sona
l use
onl
y

LENDERS MORTGAGE INSURANCE
SEPTEMBER FULL YEAR 2019 RESULTS LMI & REINSURANCE STRUCTURE
ANZLMI MAINTAINED STABLE LOSS RATIOS1
104
1. Negative Loss ratios are the result of reductions in outstanding claims provisions. Source: APRA general insurance statistics (loss ratio net of reinsurance) 2. Aggregate Stop Loss arrangement –reinsurer indemnifies ANZLMI for an aggregate (or cumulative) amount of losses in excess of a specified aggregate amount. When the sum of the losses exceeds the pre-agreed amount, the reinsurer will be liable to pay the excess up to a pre-agreed upper limit 3. Quota Share arrangement - reinsurer assumes an agreed reinsured % whereby reinsurer shares all premiums and losses accordingly with ANZLMI
Gross Written Premium ($m) $80.7m
Net Claims Paid ($m) $31.4m
Loss Rate (of Exposure - annualised) 12.0bps
-50
0
50
100
150
FY11 FY12FY06 FY08FY07 FY09 FY10 FY13 FY14 FY15 FY16 FY17 FY18
Industry Insurer 3ANZ LMI Insurer 1 Insurer 2
Australian Home Loan portfolio LMI and Reinsurance Structure at 30 Sep 19 (% New Business FUM Oct-18 to Sep-19)
ANZLMI uses a diversified panel of reinsurers (10+) comprising a mix of APRA authorised reinsurers and reinsurers with highly rated security
Reinsurance is comprised of a Quota Share arrangement3 with reinsurers for mortgages 90% LVR and above and in addition an Aggregate Stop Loss arrangement2 for policies over 80% LVR
Quota Share3
Arrangement(LVR > 90%)
Aggregate Stop Loss2
Arrangement on Net Risk Retained
(LVR > 80%)
LVR 80% to 90% LMI Insured LVR > 90% LMI Insured
2019 Reinsurance Arrangement
7%9%
LVR<80% Not LMI Insured
86%
%
For
per
sona
l use
onl
y

NEW ZEALAND HOME LOANS
PORTFOLIO OVERVIEW1
105
Portfolio Flow
FY17 FY18 FY19 FY19
Number of Home Loan Accounts 520k 526k 527k 118k
Total FUM NZD77b NZD81b NZD85b NZD19b
Average Loan Size2 NZD148k NZD153k NZD161k NZD157k
% Owner Occupied 73% 74% 75% 77%
% Investor 27% 26% 25% 23%
% Paying Variable Rate Loan3 21% 18% 15% 14%
% Paying Fixed Rate Loan3 79% 82% 85% 86%
% Paying Interest Only 22% 21% 19% 19%
% Paying Principal & Interest 78% 79% 81% 81%
% Broker Originated4 35% 36% 38% 40%
Portfolio
FY17 FY18 FY19
Average LVR at Origination2 59% 58% 56%
Average Dynamic LVR2 43% 41% 42%
Market Share5 31.1% 30.9% 30.7%
% Low Doc6 0.44% 0.38% 0.34%
Home Loan Loss Rates (0.01%) 0.00% 0.00%
% of NZ Geography Lending 61% 62% 63%
1. New Zealand Geography2. Average data as of September 20193. Flow excludes revolving credit facilities4. Flow FY19 11 months to August 20195. Source: RBNZ, FY19 share of all banks as at August 20196. Low documentation (low doc) lending allowed customers who met certain criteria to apply for a mortgage with reduced income confirmation requirements. New low doc lending ceased in 2007
For
per
sona
l use
onl
y

NEW ZEALAND HOME LOANS
HOUSING FLOWS2 HOUSING PORTFOLIO
MARKET SHARE3 HOUSING PORTFOLIO BY REGION ANZ HOME LOAN LVR PROFILE5
106
HOME LENDING & ARREARS TRENDS1
1. New Zealand Geography 2. Flow FY19 11 months to August 2019 3. Source: RBNZ, 2H19 market share as at August 2019 4. Other includes loans booked centrally (Business Direct, Contact Centre, Lending Services, Property Finance) 5. Dynamic basis
66% 61% 60%
34% 39% 40%
FY17 FY18 FY19
Proprietary Broker
79% 82% 85%
21% 18% 15%
Sep-17 Sep-18 Sep-19
Fixed Variable
31.1% 31.0% 30.9% 30.9% 30.7%
2.9%
2H17 1H18
2.8%2.7% 2.4%2.8% 2.9%
2.0%
2H18
3.0%3.0%
1H19
2.8%
2H19
ANZ market share System growth
ANZ growth
46% 46% 46%
10%7% 7% 7%
21% 20% 20%
5% 5%
11%
5%
Sep-17
11%
11%
Sep-18
11%
11%
Sep-19
Auckland
Wellington
Christchurch Other Nth Is.
Other Sth Is. Other4
62% 64% 60%
19% 18% 19%
13% 13%4% 3% 4%
2% 2%
15%
Sep-18Sep-17
2%
Sep-19
0-60%
61-70%
90%+71-80%
81-90%
NZ DIVISION 90+DAYS DELINQUENCIES
%
0.0
1.5
0.5
1.0
Sep-17
Sep-08
Sep-16
Sep-09
Sep-10
Sep-11
Sep-12
Sep-13
Sep-14
Sep-15
Sep-18
Home Loans AgriCommercial
Sep-19
For
per
sona
l use
onl
y

2019 FULL YEAR RESULTS
—I N V E S TO R D I S C U S S I O N PA C K
R OYA L C O M M I S S I O N U P DAT E & R EG U L ATO RY R E F O R M S
For
per
sona
l use
onl
y

ROYAL COMMISSION
OUR APPROACH, OUR RESPONSE
WE ARE RESPONDING TO THE ‘SPIRIT AND THE LETTER’ OF THE ROYAL COMMISSION.
Initial response
• Committed in February 2019 to sixteen actions that we can take now including:
• removing overdrawn and dishonour fees on our Pensioner Advantage account
• improving our service to Indigenous customers in remote communities by setting up a dedicated phone service and giving them easier options to prove their identity
• publishing principles to help family farming customers in financial distress
• publishing principles on acting as a model litigant in disputes with our customers
• implementing pay reforms that replace individual-based bonuses for most of our employees with an incentive based on the overall performance of the Group
• Reviewed individual cases highlighted at the Commission and taken action where appropriate to resolve the matters
• Reported to Government that we have made significant progress on the RC recommendations directed at banks, concerning distressed agricultural loans, remuneration of front line staff, the Sedgwick Review and changing culture and governance
Lessons from our experience
• Identified eight lessons from our misconduct and failures to meet community standards and expectations to inform our response to the ‘spirit and letter’ of the Royal Commission
• Now identifying measures that will allow us to be confident that these lessons have been acted on
Governance – aligned to the APRA self-assessment
• Established a Royal Commission and Self-Assessment Oversight Group to oversee an integrated response to the Royal Commission and Self-Assessment. The Oversight Group is chaired by the Deputy Chief Executive Officer and includes the Group Chief Risk Officer
Constructive engagement with reform
• Engaging constructively with Government and its agencies as they implement the recommendations directed at them
• Government has indicated that majority of its reforms will be consulted on and introduced into Parliament by the end of 2020
108
For
per
sona
l use
onl
y

STRENGTHENING OUR RISK CULTURE
109
SENIOR LEADER CONSEQUENCES IN 2019*
Remuneration consequence 23
Warning/advice 12
No longer employed 7
• We have strengthened the way we deal with risk events
through an enhanced Accountability and Consequence
Framework, which is applicable to all of our people.
• In 2019 across the Group, 151 employees were dismissed
for breaches of our Code of Conduct. A further 516
employees received a formal disciplinary outcome, with
managers required to apply impacts to their performance
and remuneration outcomes as part of the annual review
process.
• At the senior leadership level, 30 current or former senior
leaders (senior executives, executives and senior managers)
received a consequence in 2019 for Code of Conduct
breaches or findings of accountability for a material event,
or otherwise left the bank after an investigation had been
initiated.
• The 30 employees represent ~ 1% of the senior leader
population. The consequences applied included warnings,
impacts to performance and/or remuneration outcomes and
cessation of employment.
* Individuals are included under all categories that are relevant, meaning one individual may be reflected in multiple categories.
For
per
sona
l use
onl
y

2019 FULL YEAR RESULTS
—I N V E S TO R D I S C U S S I O N PA C K
C O R P O R AT E OV E RV I E W &
E N V I R O N M E N T, S O C I A L A N D G OV E R N A N C E ( E S G )
For
per
sona
l use
onl
y

ESG – GOVERNANCE OVERVIEW
111
Ethics and Responsible Business Committee
(ERBC)
Chaired by Shayne Elliott, CEO
Customer Fairness Advisor, Australia
Reports to Shayne Elliott, CEO
Royal Commission & Self-Assessment Oversight
Group
Chaired by Kevin Corbally, CRO and Alexis George, DCEO
Customer Advocate, Australia
Reports to Mark Hand, Group Executive, Australia Retail and
Commercial Banking
Audit Committee
Chair: Paula Dwyer
Risk Committee
Chair: Graeme Liebelt
Ethics, Environment, Social
and Governance Committee
Chair: David Gonski
Digital Business and Technology
Committee
Chair: Jane Halton
Human Resources Committee
Chair: Ilana Atlas
Nomination and Board Operations
Committee
Chair: David Gonski
BOARD OF DIRECTORS
Chaired by David Gonski, Chairman
For
per
sona
l use
onl
y

BOARD AND EXECUTIVE COMMITTEES WORK TOGETHER
112
INDICATIVE RESPONSIBILITIES DEMONSTRATE HOW COMMITTEES MANAGE ESG
Ethics, Environment, Social and Governance Board committee
Oversight and approval of ESG reporting and targets
Oversight of measures to advance Purpose and the Ethics and Responsible Business Committee
Code of Conduct review
Ethics and Responsible Business Management committee
Set Social and Environmental Risk policy
and monitor implementation
Examine complaints themes and potential
systemic issues
Purpose, reputation and values review
Monitor and determine sensitive customer
transactions
Consider and decide on ethical, environmental,
social and governance risks and opportunities
Review and monitor ethical, environmental,
social and governance risks and opportunities
Oversight and approval of corporate governance
policies, principles, regulatory and policy
responses
Set ESG targets and monitor progress
Review of complaints themes and potential
systemic issues
Purpose: Establish ethical and ESG guidelines and principles
Purpose: Operationalise Board objectives and make decisions on issues and policies
For
per
sona
l use
onl
y
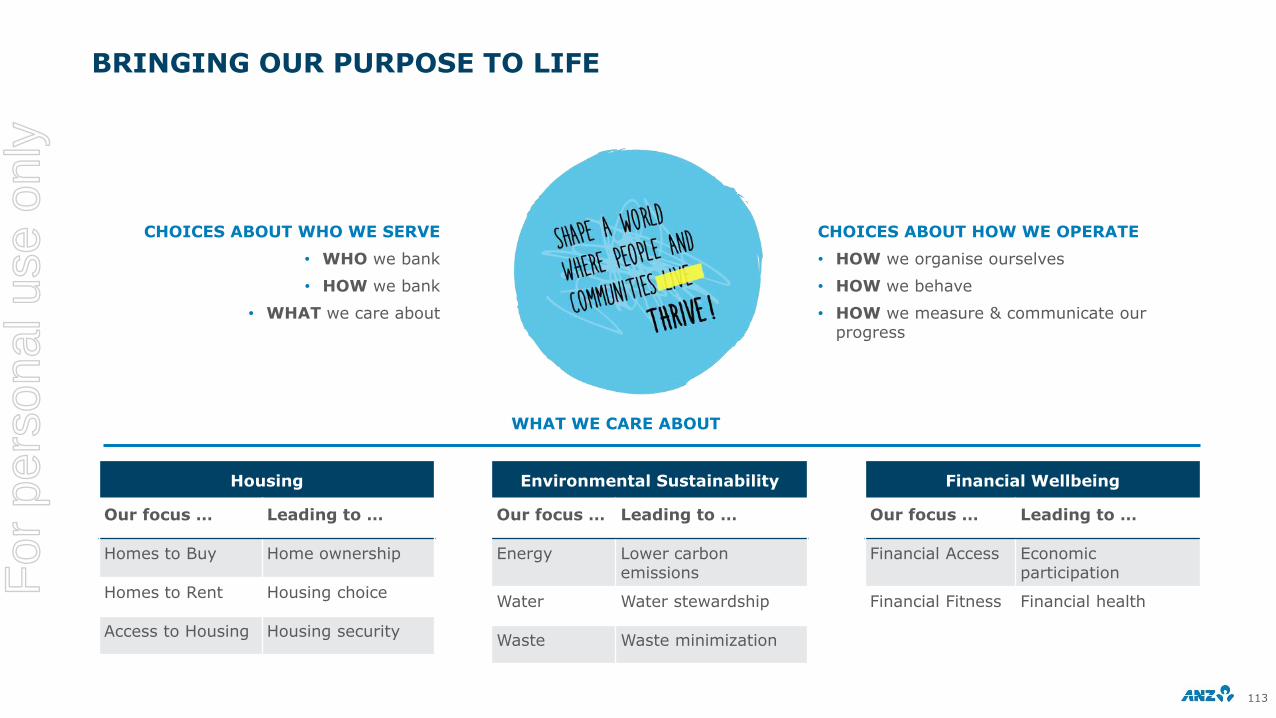
BRINGING OUR PURPOSE TO LIFE
113
CHOICES ABOUT WHO WE SERVE
• WHO we bank
• HOW we bank
• WHAT we care about
CHOICES ABOUT HOW WE OPERATE
• HOW we organise ourselves
• HOW we behave
• HOW we measure & communicate our progress
Housing
Our focus … Leading to …
Homes to Buy Home ownership
Homes to Rent Housing choice
Access to Housing Housing security
Environmental Sustainability
Our focus … Leading to …
Energy Lower carbon emissions
Water Water stewardship
Waste Waste minimization
Financial Wellbeing
Our focus … Leading to …
Financial Access Economic participation
Financial Fitness Financial health
WHAT WE CARE ABOUT
For
per
sona
l use
onl
y

‘WHAT WE CARE ABOUT MOST’ – A YEAR IN REVIEW
More Australians and New Zealanders have access to affordable, liveable, sustainable housing
• Joint Lead Manager on $315m National Housing Finance and Investment Corporation bond, and NZD$500m and NZD$600m bonds for Housing New Zealand to provide new and upgraded social housing
• Provided >1,800 interest-free loans to improve the health of New Zealand households through our New Zealand ‘Healthy Homes’ initiative
The food, beverage and agricultural sector is more sustainable and financially resilient
• Supported the purchase of the Great Cumbung Swamp - Australia’s largest purchase of mixed-use conservation and agricultural property by dollar value
• Advisor and Joint Lead Manager on $400m green bond for Woolworths Group to improve energy efficiency (solar, lighting, refrigeration systems) in its supermarkets
Australia’s energy supply, transmission and distribution is more efficient, cleaner and affordable
• Project finance commitment to renewable energy increased ~27% from FY18 $1,076m to FY19 $1,371m (figure quoted is project finance made on a non or limited recourse basis and excludes corporate debt facilities)
Build leadership in key areas
Ensure ANZ is living up to its
commitments
Continue to improve housing, environment and financial wellbeing outcomes for the
community
Improve our standards and practices • Established a $100m Housing ‘Virtual Fund’ to support the financing of more affordable, secure and sustainable homes
• Committed to 100% renewable electricity across our global premises by 2025
Develop products and services • Expanded sustainable finance offering to establish sustainability-linked loans market in Australia and New Zealand
• Continued expansion of Home Buyers Coach training, currently >3,300 home coaches active in Australia and New Zealand
Use insights, advocacy and partnerships
• Delivered new housing market insights with bi-annual ANZ-Core Logic Housing Affordability Report• Conducted research to assess the impact of Money Minded on financial wellbeing
Alleviate homelessness • Supported youth employment through the opening of two social enterprise cafés: Home.Two and STREAT• Raised >$150k for the St Vincent de Paul ‘CEO Sleepout’ - equivalent to providing >5,000 meals for those
experiencing homelessness
Connect to the environment • Over 18,000 hours volunteered by employees towards environmental sustainability• More than 1,250 employees volunteered with Sustainable Coastlines New Zealand collecting more than
10,000 litres of rubbish
Facilitate financial inclusion • Through ANZ Technology ‘Return to Work’ program we employed 30 women who had been out of the workforce for an extended period
• Improved the financial literacy of >87,500 people through our Money Minded program
For
per
sona
l use
onl
y

CREATING VALUE FOR OUR STAKEHOLDERS
115
1. Peter Lee Associates Large Corporate and Institutional Transactional Banking Surveys, Australia 2004-2019 and New Zealand 2005-2019 2. Measures representation at the Senior Manager, Executive and Senior Executive Levels. Includes all employees regardless of leave status but not contractors (which are included in FTE) 3. Figure includes foregone revenue of $109 million 4. Total taxes borne by the Group, includes unrecovered GST/VAT, employee related taxes and other taxes. Inclusive of discontinued operations 5. Through our initiatives to support financial wellbeing including financial inclusion, employment and community programs, and targeted banking products and services for small businesses and retail customers 6. On a cash profit continuing operations basis 7. FY19 franking average 85%
CUSTOMERS
EMPLOYEES
COMMUNITY
SHAREHOLDERS
• 8.7m total retail, commercial and Institutional customers
• $291b in retail & commercial customer deposits in Australia and New Zealand
• $339b in home lending in Australia and New Zealand
• Full mobile wallet offering, including Apple PayTM, GooglePayTM, Samsung PayTM, FitBit PayTM and Garmin PayTM
• #1 Lead bank for trade services1
• 39,060 people employed (FTE)
• 734 people recruited from under-represented groups, including refugees, people with disability and Indigenous Australians since 2016
• 32.5% of women in leadership, increase from 27.9% in Sep 20142
• ~1.5m hours of training undertaken
• $142m contributed in community investment3
• 134,930 volunteering hours completed by employees
• $3.2b in taxes incurred; money used by governments to provide public services and amenities4
• >998k people reached through our target to help enable social and economic participation5
• >500,000 Retail & Institutional shareholders
• $6.5b6 cash profit reported
• 227.6 cents earnings per share
• 160 cents per share dividend for FY197
• 10.9% return on average ordinary shareholders equity
All financial metrics are as at 30 September 2019 (P&L growth metrics for the full year ended 30 September 2019) unless otherwise stated.
For
per
sona
l use
onl
y

FY19 ESG TARGET PERFORMANCE
SCORECARD SNAPSHOT
116
1. Including renewable energy generation, green buildings and less emissions intensive manufacturing and transport 2. Through our initiatives to support financial wellbeing including financial inclusion, employment and community programs, and targeted banking products and services for small businesses and retail customers 3. FY18-FY20 target is defined as Women in Leadership which measures representation at the Senior Manager, Executive and Senior Executive levels
For detailed performance information refer to the 2019 ESG Supplement available in December 2019 anz.com/cs.
Achieved In progress Not achieved
ESG target Progress Outcome Relevant SDGs
FAIR AND RESPONSIBLE BANKING
Implement new Dispute Resolution Principles in Australia Implemented
Communicate with >700,000 of our retail and commercial customers by 2019 to help them get more value from our products and services and establish positive financial behaviours
>1 million
ENVIRONMENTAL SUSTAINABILITY
Fund and facilitate at least $15 billion by 2020 towards environmentally sustainable solutions for our customers including initiatives that help lower carbon emissions, improve water stewardship and minimise waste1
$19.1 billion
Reduce the direct impact of our business activities on the environment by reducing scope 1 & 2 emissions by 24% by 2025 and 35% by 2030 (against a 2015 baseline)
-25%
FINANCIAL WELLBEING
Help enable social and economic participation of 1 million people by 20202 >998k
Increasing women in leadership to 33.1% by 2019 (34.1% by 2020)3 32.5%
Recruiting >1,000 people from under-represented groups by 2020 734
HOUSING
Provide NZ$100 million of interest free loans to insulate homes for ANZ mortgage holders (New Zealand)
NZ$6.3 million
Offer all ANZ first home buyers access to financial coaching support >3.3k coaches trained
We are committed to the United Nations Sustainable Development Goals (SDGs). Our ESG targets support 10 of the 17 SDGs.
For
per
sona
l use
onl
y
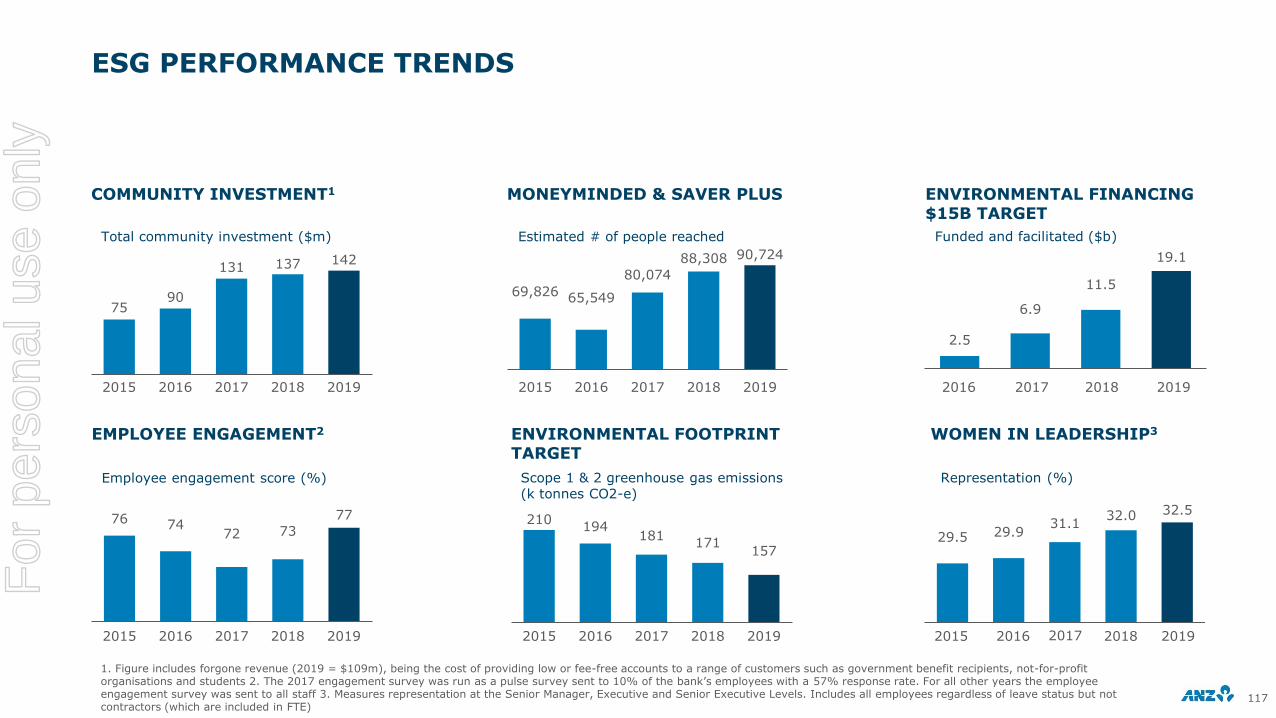
29.5 29.931.1
32.0 32.5
20192015 2016 2017
ESG PERFORMANCE TRENDS
COMMUNITY INVESTMENT1 ENVIRONMENTAL FINANCING $15B TARGET
MONEYMINDED & SAVER PLUS
EMPLOYEE ENGAGEMENT2 ENVIRONMENTAL FOOTPRINT TARGET
WOMEN IN LEADERSHIP3
Total community investment ($m)
Employee engagement score (%)
Funded and facilitated ($b)
Scope 1 & 2 greenhouse gas emissions (k tonnes CO2-e)
Estimated # of people reached
Representation (%)
117
1. Figure includes forgone revenue (2019 = $109m), being the cost of providing low or fee-free accounts to a range of customers such as government benefit recipients, not-for-profit organisations and students 2. The 2017 engagement survey was run as a pulse survey sent to 10% of the bank’s employees with a 57% response rate. For all other years the employee engagement survey was sent to all staff 3. Measures representation at the Senior Manager, Executive and Senior Executive Levels. Includes all employees regardless of leave status but not contractors (which are included in FTE)
7590
131 137 142
2015 20182016 2017 2019
210194
181171
157
201920162015 2017 2018
2.5
6.9
11.5
19.1
20182016 2017
69,826 65,549
80,074
88,308 90,724
201920162015 2017 2018
76 7472 73
77
2015 20172016 2018 2019
2019
2018
For
per
sona
l use
onl
y

EXTERNAL REPORTING
RECOGNITION
FRAMEWORKS
118
We achieved a CDP climate disclosure score
of A- in 2018
Member of the FTSE4Good Index
We have been a signatory to the United Nations Global
Compact since 2010
As an Equator Principles Financial Institution signatory
we report on our implementation of the Principles
in our Sustainability Review
We report in line with using the recommendations of the
Financial Stability Board’s (FSB) Task Force on Climate-Related Disclosures (TCFD)
Second ranked Australian bank on the Dow Jones
Sustainability Index, scoring 82/100 in 2019
Our sustainability reporting is prepared in accordance with the
Global Reporting Initiative Standards
(Comprehensive level)
2018-19 leader in workplace gender
equality
Platinum Status LGBTIEmployer of Choice for
longevity in high performance (2015 to 2019)
For
per
sona
l use
onl
y

2019 FULL YEAR RESULTS
—C L I M AT E - R E L AT E D F I N A N C I A L D I S C LO S U R E SF
or p
erso
nal u
se o
nly

CLIMATE-RELATED FINANCIAL DISCLOSURES (TCFD)1
1201. A Financial Stability Board TaskForce released recommendations on financial disclosures in June 2017 to help investors better understand climate-related risks and opportunities. ANZ supports the TCFD recommendations and is using them to guide its disclosures 2 United Nations Environmental Programme for Financial Institutions
Governance Strategy Risk Management Metrics & targets
• Board Risk Committee oversees management of climate-relatedrisks
• Board Ethics, Environment, Social and Governance Committee oversees and approves climate-related objectives, goals and targets
• Ethics and Responsible Business Committee (executive management) oversees our approach to sustainability and reviews climate-related risks
• Low carbon financial products and services
• Staff training on transition planning
• Reducing our own operational footprint
• Focus on a ‘just and orderly’ low carbon transition
• UNEP FI2 TCFD group that issued recommendations on portfolio transition and physical risks
• Analysis of flood-related risks for home loan portfolio in a major regional location of Australia
• Flood-related analysis and test-pilot of socio-economic indicators for customer financial resilience
• Climate-related risks identified as potential credit risk
• Climate change risk added to Group and Institutional Risk Appetite Statements
• Climate change identified as a Principal Risk and Uncertainty in our UK Disclosure and Transparency Rules Submission
• Guidelines and training provided to 1,000 of our Institutional bankers on customer transition plans
• Enhanced analysis and credit terms applied to agricultural purchases in certain regions
• New agribusiness customers assessed for climate resilience
• 29 engagements with large emitting customers to establish transition plans – targeting 100 customers by 2021
• $19.1 billion funded and facilitated in environmentally sustainable solutions
• Declining exposure to the most carbon-intensive energy; thermal coal mining exposures halved since 2015
• 100% renewable electricity for our operations by 2025, with ouremissions targets aligned with Paris Agreement goals
For
per
sona
l use
onl
y

SUPPORTING OUR CUSTOMERS AND TRAINING OUR STAFF ON THE DEVELOPMENT OF LOW CARBON TRANSITION PLANS
1211. 2019 focus on ANZ staff managing specific higher carbon emitting customers
ANZ customer management informed by climate-relatedengagement
• We have identified carbon-intensive sectors most likely to be impacted by climate change
• There are 100 of our largest emitting business customers in those sectors
• We are supporting these customers to establish, or strengthen their low carbon transition plans
• We will use the results of this engagement to inform our risk assessment of customers in these sectors
Training our staff to engage with customers on climate-risk
• This year we provided training to over 1,000 bankers in our Institutional and Corporate businesses. The training covered:
• how climate-related risks and opportunities might manifest for our customers
• what elements we would expect to see in a robust transition plan
• market and regulatory drivers that are focusing stakeholder attention on our customers
• whether they have plans in place to manage their climate-related risks and opportunities
BHP has an integrated strategy including:
• Targets to hold net operational emissions at or below FY2017 levels by FY2022 while continuing to grow their business.
• Active stewardship role working with customers, suppliers and other value chain participants to influence reductions in scope 3 including:
• A commitment to spend US$400m to develop technology to reduce emissions.
CUSTOMER EXAMPLE: BHP’S TRANSITION PLANNINGCUSTOMER MANAGEMENT AND STAFF TRAINING
HOW WE SUPPORT OUR CUSTOMERS – INCLUDING INCORPORATION OF CLIMATE-RISK MANAGEMENT
For
per
sona
l use
onl
y

122
FURTHER INFORMATION
Equity Investors
Jill CampbellGroup General Manager Investor Relations+61 3 8654 7749+61 412 047 [email protected]
Cameron DavisExecutive Manager Investor Relations+61 3 8654 7716+61 421 613 [email protected]
Harsh VardhanManager Investor Relations+61 3 8655 0878+61 466 848 [email protected]
Retail Investors Debt Investors
Michelle WeerakoonManager Shareholder Services & Events+61 3 8654 7682+61 411 143 [email protected]
Scott GiffordHead of Debt Investor Relations +61 3 8655 5683+61 434 076 [email protected]
Mary MakridisAssociate DirectorDebt Investor Relations +61 3 8655 4318
Our Shareholder information anz.com/shareholder/centre/
DISCLAIMER & IMPORTANT NOTICE: The material in this presentation is general background information about the Bank’s activities current at the date of the presentation. It is information given in summary form and does not purport to be complete. It is not intended to be relied upon as advice to investors or potential investors and does not take into account the investment objectives, financial situation or needs of any particular investor. These should be considered, with or without professional advice when deciding if an investment is appropriate
This presentation may contain forward-looking statements including statements regarding our intent, belief or current expectations with respect to ANZ’s business and operations, market conditions, results of operations and financial condition, capital adequacy, specific provisions and risk management practices. When used in this presentation, the words “estimate”, “project”, “intend”, “anticipate”, “believe”, “expect”, “should” and similar expressions, as they relate to ANZ and its management, are intended to identify forward-looking statements. Readers are cautioned not to place undue reliance on these forward-looking statements, which speak only as of the date hereof. Such statements constitute “forward-looking statements” for the purposes of the United States Private Securities Litigation Reform Act of 1995. ANZ does not undertake any obligation to publicly release the result of any revisions to these forward-looking statements to reflect events or circumstances after the date hereof to reflect the occurrence of unanticipated events.
For
per
sona
l use
onl
y