2019 mlp & energy infrastructure ... - genesis energy, lp
TRANSCRIPT
2019 MLP & Energy Infrastructure Conference
May 2019
1
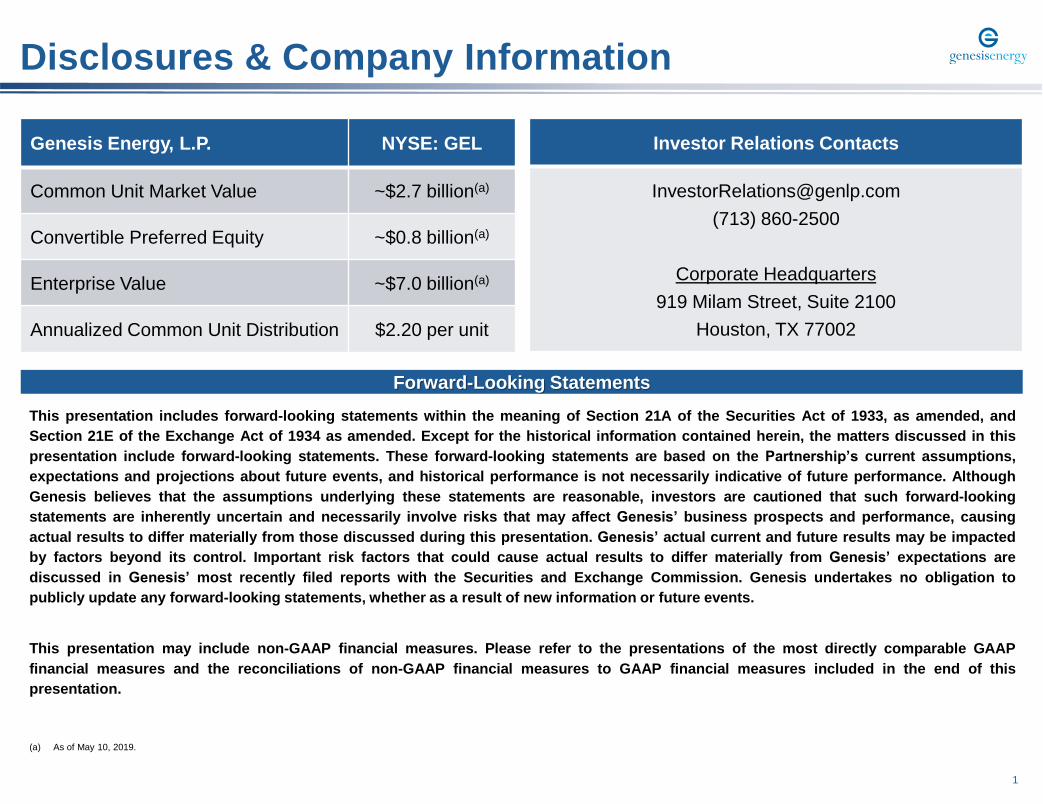
Genesis Energy, L.P. NYSE: GEL
Common Unit Market Value ~$2.7 billion(a)
Convertible Preferred Equity ~$0.8 billion(a)
Enterprise Value ~$7.0 billion(a)
Annualized Common Unit Distribution $2.20 per unit
This presentation includes forward-looking statements within the meaning of Section 21A of the Securities Act of 1933, as amended, and
Section 21E of the Exchange Act of 1934 as amended. Except for the historical information contained herein, the matters discussed in this
presentation include forward-looking statements. These forward-looking statements are based on the Partnership’s current assumptions,
expectations and projections about future events, and historical performance is not necessarily indicative of future performance. Although
Genesis believes that the assumptions underlying these statements are reasonable, investors are cautioned that such forward-looking
statements are inherently uncertain and necessarily involve risks that may affect Genesis’ business prospects and performance, causing
actual results to differ materially from those discussed during this presentation. Genesis’ actual current and future results may be impacted
by factors beyond its control. Important risk factors that could cause actual results to differ materially from Genesis’ expectations are
discussed in Genesis’ most recently filed reports with the Securities and Exchange Commission. Genesis undertakes no obligation to
publicly update any forward-looking statements, whether as a result of new information or future events.
This presentation may include non-GAAP financial measures. Please refer to the presentations of the most directly comparable GAAP
financial measures and the reconciliations of non-GAAP financial measures to GAAP financial measures included in the end of this
presentation.
Disclosures & Company Information
Forward-Looking Statements
Investor Relations Contacts
(713) 860-2500
Corporate Headquarters
919 Milam Street, Suite 2100
Houston, TX 77002
(a) As of May 10, 2019.
2
Key Investment Considerations
1
2
3
4
5
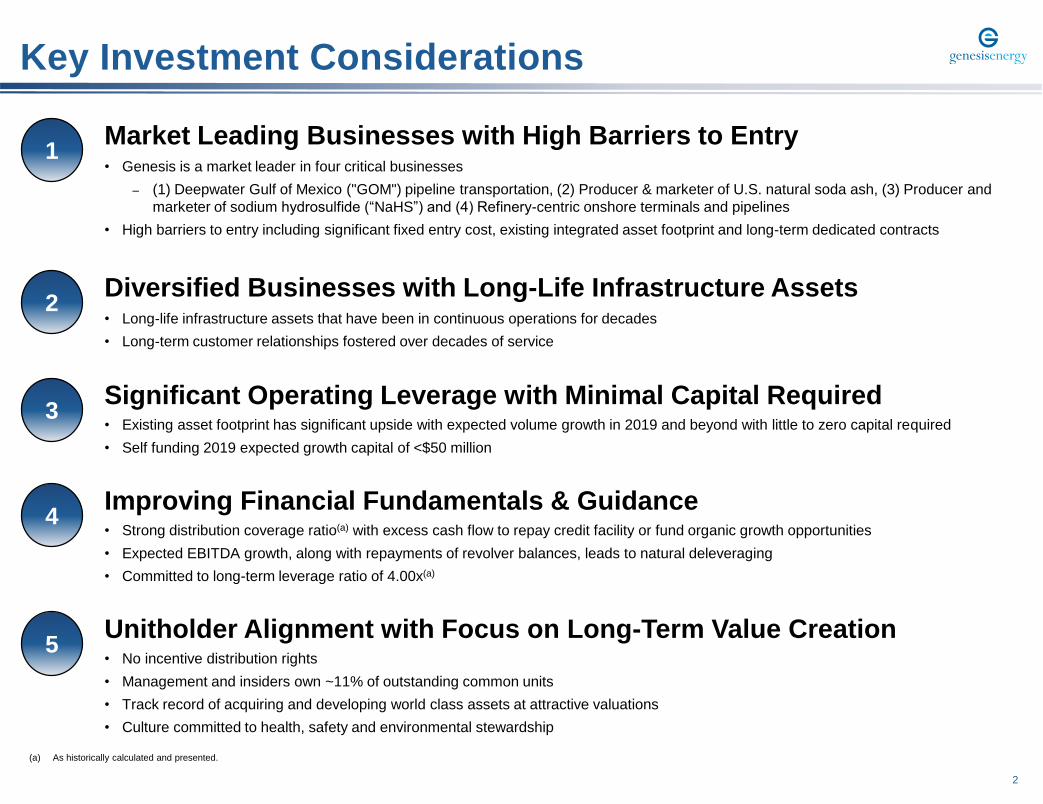
Market Leading Businesses with High Barriers to Entry• Genesis is a market leader in four critical businesses
– (1) Deepwater Gulf of Mexico ("GOM") pipeline transportation, (2) Producer & marketer of U.S. natural soda ash, (3) Producer and
marketer of sodium hydrosulfide (“NaHS”) and (4) Refinery-centric onshore terminals and pipelines
• High barriers to entry including significant fixed entry cost, existing integrated asset footprint and long-term dedicated contracts
Diversified Businesses with Long-Life Infrastructure Assets• Long-life infrastructure assets that have been in continuous operations for decades
• Long-term customer relationships fostered over decades of service
Significant Operating Leverage with Minimal Capital Required• Existing asset footprint has significant upside with expected volume growth in 2019 and beyond with little to zero capital required
• Self funding 2019 expected growth capital of <$50 million
Improving Financial Fundamentals & Guidance• Strong distribution coverage ratio(a) with excess cash flow to repay credit facility or fund organic growth opportunities
• Expected EBITDA growth, along with repayments of revolver balances, leads to natural deleveraging
• Committed to long-term leverage ratio of 4.00x(a)
Unitholder Alignment with Focus on Long-Term Value Creation• No incentive distribution rights
• Management and insiders own ~11% of outstanding common units
• Track record of acquiring and developing world class assets at attractive valuations
• Culture committed to health, safety and environmental stewardship
(a) As historically calculated and presented.
3
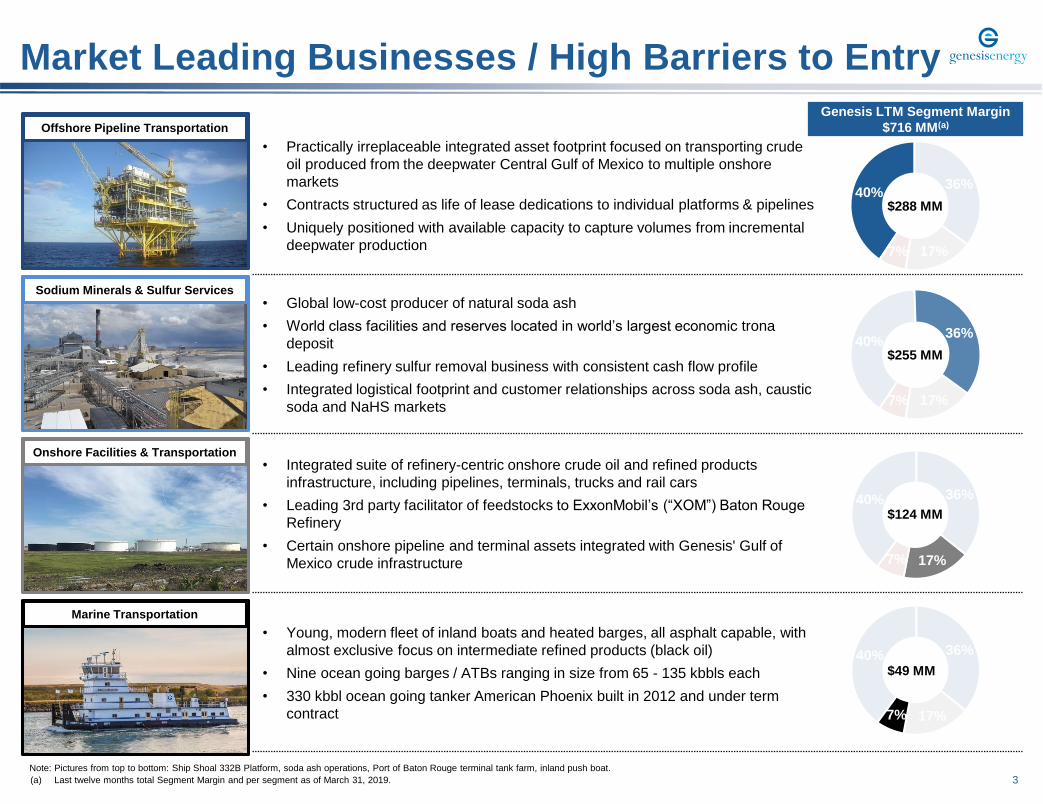
• Practically irreplaceable integrated asset footprint focused on transporting crude
oil produced from the deepwater Central Gulf of Mexico to multiple onshore
markets
• Contracts structured as life of lease dedications to individual platforms & pipelines
• Uniquely positioned with available capacity to capture volumes from incremental
deepwater production
• Global low-cost producer of natural soda ash
• World class facilities and reserves located in world’s largest economic trona
deposit
• Leading refinery sulfur removal business with consistent cash flow profile
• Integrated logistical footprint and customer relationships across soda ash, caustic
soda and NaHS markets
• Integrated suite of refinery-centric onshore crude oil and refined products
infrastructure, including pipelines, terminals, trucks and rail cars
• Leading 3rd party facilitator of feedstocks to ExxonMobil’s (“XOM”) Baton Rouge
Refinery
• Certain onshore pipeline and terminal assets integrated with Genesis' Gulf of
Mexico crude infrastructure
• Young, modern fleet of inland boats and heated barges, all asphalt capable, with
almost exclusive focus on intermediate refined products (black oil)
• Nine ocean going barges / ATBs ranging in size from 65 - 135 kbbls each
• 330 kbbl ocean going tanker American Phoenix built in 2012 and under term
contract
40% 36%
17% 7%
40% 36%
17% 7%
Offshore Pipeline Transportation
Sodium Minerals & Sulfur Services
Marine Transportation
Market Leading Businesses / High Barriers to Entry
Genesis LTM Segment Margin
$716 MM(a)
Note: Pictures from top to bottom: Ship Shoal 332B Platform, soda ash operations, Port of Baton Rouge terminal tank farm, inland push boat.
(a) Last twelve months total Segment Margin and per segment as of March 31, 2019.
Onshore Facilities & Transportation
$288 MM
$255 MM
$124 MM
$49 MM
40% 36%
17% 7%
40% 36%
17% 7%
4
Offshore Pipeline Transportation
Sodium Minerals & Sulfur Services
Onshore Facilities & Transportation
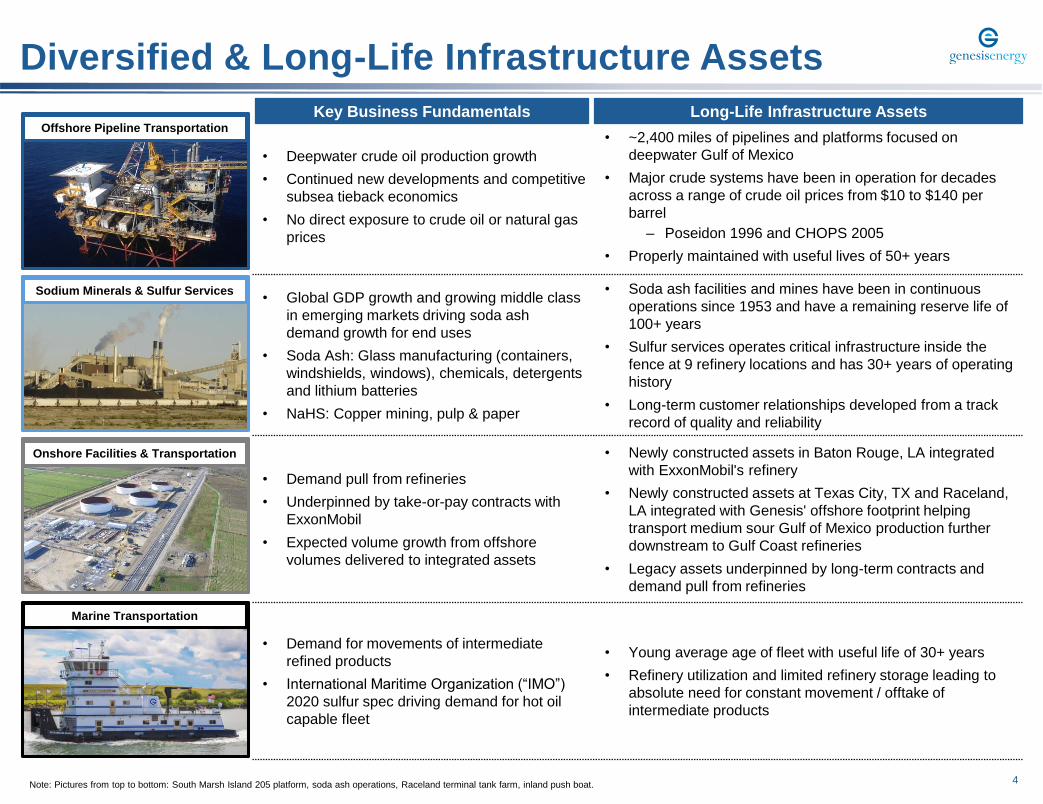
Diversified & Long-Life Infrastructure Assets
• Deepwater crude oil production growth
• Continued new developments and competitive
subsea tieback economics
• No direct exposure to crude oil or natural gas
prices
• ~2,400 miles of pipelines and platforms focused on
deepwater Gulf of Mexico
• Major crude systems have been in operation for decades
across a range of crude oil prices from $10 to $140 per
barrel
‒ Poseidon 1996 and CHOPS 2005
• Properly maintained with useful lives of 50+ years
• Global GDP growth and growing middle class
in emerging markets driving soda ash
demand growth for end uses
• Soda Ash: Glass manufacturing (containers,
windshields, windows), chemicals, detergents
and lithium batteries
• NaHS: Copper mining, pulp & paper
• Soda ash facilities and mines have been in continuous
operations since 1953 and have a remaining reserve life of
100+ years
• Sulfur services operates critical infrastructure inside the
fence at 9 refinery locations and has 30+ years of operating
history
• Long-term customer relationships developed from a track
record of quality and reliability
• Demand pull from refineries
• Underpinned by take-or-pay contracts with
ExxonMobil
• Expected volume growth from offshore
volumes delivered to integrated assets
• Newly constructed assets in Baton Rouge, LA integrated
with ExxonMobil's refinery
• Newly constructed assets at Texas City, TX and Raceland,
LA integrated with Genesis' offshore footprint helping
transport medium sour Gulf of Mexico production further
downstream to Gulf Coast refineries
• Legacy assets underpinned by long-term contracts and
demand pull from refineries
• Demand for movements of intermediate
refined products
• International Maritime Organization (“IMO”)
2020 sulfur spec driving demand for hot oil
capable fleet
• Young average age of fleet with useful life of 30+ years
• Refinery utilization and limited refinery storage leading to
absolute need for constant movement / offtake of
intermediate products
Long-Life Infrastructure AssetsKey Business Fundamentals
Marine Transportation
Note: Pictures from top to bottom: South Marsh Island 205 platform, soda ash operations, Raceland terminal tank farm, inland push boat.
5
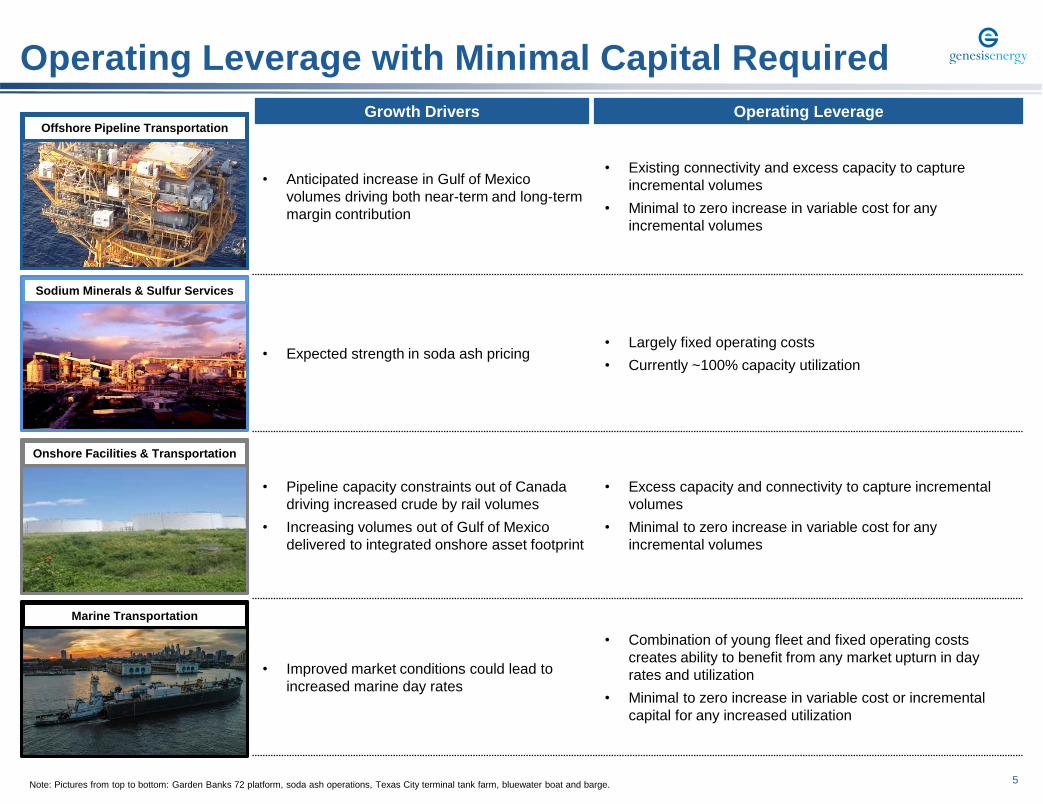
Operating Leverage with Minimal Capital Required
Offshore Pipeline Transportation
Sodium Minerals & Sulfur Services
Onshore Facilities & Transportation
Marine Transportation
Note: Pictures from top to bottom: Garden Banks 72 platform, soda ash operations, Texas City terminal tank farm, bluewater boat and barge.
• Anticipated increase in Gulf of Mexico
volumes driving both near-term and long-term
margin contribution
• Existing connectivity and excess capacity to capture
incremental volumes
• Minimal to zero increase in variable cost for any
incremental volumes
• Expected strength in soda ash pricing• Largely fixed operating costs
• Currently ~100% capacity utilization
• Pipeline capacity constraints out of Canada
driving increased crude by rail volumes
• Increasing volumes out of Gulf of Mexico
delivered to integrated onshore asset footprint
• Excess capacity and connectivity to capture incremental
volumes
• Minimal to zero increase in variable cost for any
incremental volumes
• Improved market conditions could lead to
increased marine day rates
• Combination of young fleet and fixed operating costs
creates ability to benefit from any market upturn in day
rates and utilization
• Minimal to zero increase in variable cost or incremental
capital for any increased utilization
Operating LeverageGrowth Drivers

6
Improving Financial Fundamentals & Guidance
Current Business Segment Outlook
Offshore Pipeline
Transportation
Sodium Minerals &
Sulfur Services
Onshore Facilities &
Transportation
Marine
Transportation
• Expected continued volume growth
• Receiving volumes on Poseidon and
CHOPS from a 3rd party pipeline
with insufficient capacity to deliver all
of its committed volumes to shore
• Remain on track to exit 2019 with
40-50 kbd of additional volumes
• Finalizing agreements for
incremental volumes approaching:
‒ 80 kpd in 2020 (Inc. Atlantis 3)
‒ 70 kbd in 2021
‒ 150 kbd in 2022 (Inc. Mad Dog 2)
• Sodium Minerals remains on track
for full year guidance for 2019
‒ Expect international market
supply / demand balance to
remain tight
‒ International pricing likely to
strengthen with no appreciable
supply additions in coming years
• Both the U.S. (natural) and China
(synthetic) are net exporters of
soda ash
• Sulfur Services business continues
to perform as expected
• Current spreads between Canada
and the Gulf Coast indicate
tightening in take away capacity,
making rail movements economical
to our Scenic Station rail facility
• May & June volumes at our Scenic
Station rail facility expected to
exceed take-or-pay levels
• Expect to see continued volume
increases at our Scenic Station rail
facility in 2H 2019
• Legacy onshore facilities and
Transportation business continues
to perform as expected
• Continues to perform as expected
• Continued belief that we are at or
near the bottom of the cycle
• Beginning to see strengthening of
day rates and utilization
• Encouraged about IMO 2020 with
hot-oil capable fleet
(a) As historically calculated and presented.
(b) We are unable to provide a reconciliation of the forward-looking Adjusted EBITDA, a non-GAAP financial measure, to the most directly comparable GAAP
financial measure without unreasonable efforts. The probable significance is that such comparable GAAP financial measure may be materially different.
Financial Guidance
2019E
Adjusted EBITDA
4Q 2019E Annualized
Adjusted EBITDA
2018A
Adjusted EBITDA
$663.6
$685.0
$715.0 $720.0
$760.0
2019E Adjusted EBITDAKey Metrics Guidance Notes
Long-Term Target
Leverage Ratio4.00x
Common Unit Distribution $0.55 per quarterTo remain flat for foreseeable future; intend to use
capital for highest and best use for all stakeholders
Target Common Unit
Distribution Coverage(a) 1.40x – 1.60x
Use excess Available Cash as equity and/or to pay
down debt
2019E Adjusted EBITDA(b) $685 – $715 million ~3% – 7% increase from 2018
4Q 2019E Adjusted EBITDA(b) $180 – $190 million
Assumes reasonable recovery in crude by rail
volumes and expected growth in offshore segment
2019E Expected Growth Capital <$50 million Self funding growth capital in 2019
7
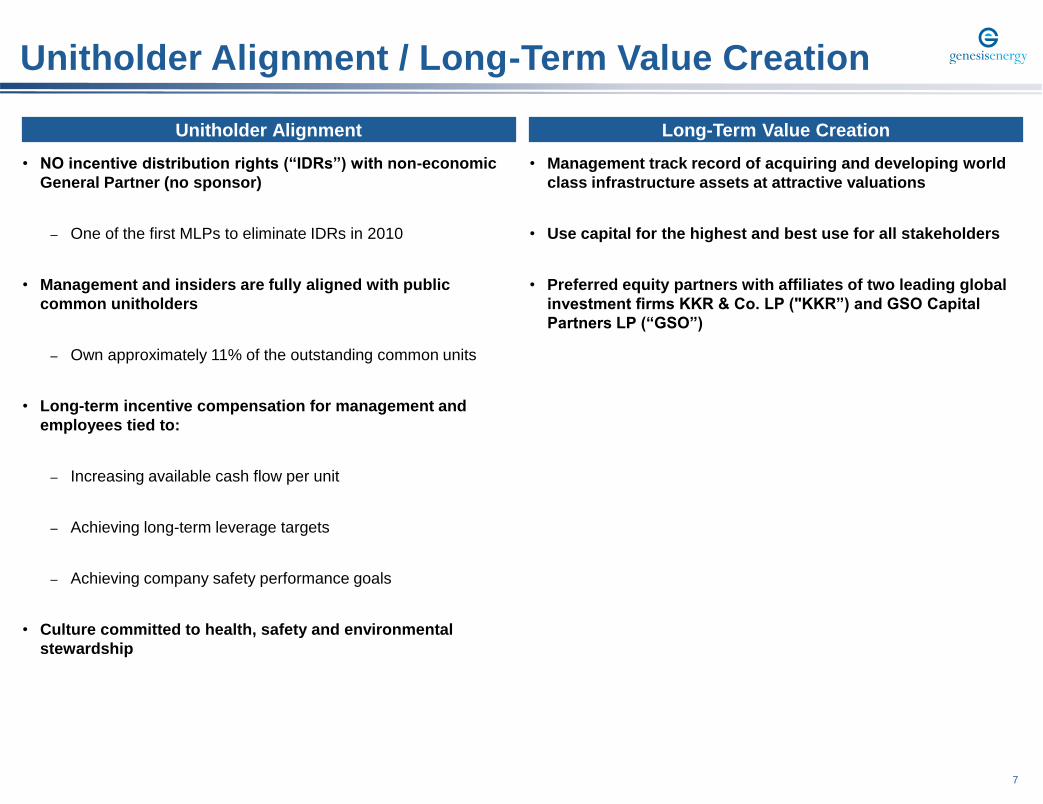
• Management track record of acquiring and developing world
class infrastructure assets at attractive valuations
• Use capital for the highest and best use for all stakeholders
• Preferred equity partners with affiliates of two leading global
investment firms KKR & Co. LP ("KKR”) and GSO Capital
Partners LP (“GSO”)
Unitholder Alignment / Long-Term Value Creation
• NO incentive distribution rights (“IDRs”) with non-economic
General Partner (no sponsor)
– One of the first MLPs to eliminate IDRs in 2010
• Management and insiders are fully aligned with public
common unitholders
– Own approximately 11% of the outstanding common units
• Long-term incentive compensation for management and
employees tied to:
– Increasing available cash flow per unit
– Achieving long-term leverage targets
– Achieving company safety performance goals
• Culture committed to health, safety and environmental
stewardship
Long-Term Value CreationUnitholder Alignment

8
Business Segment Detail
9
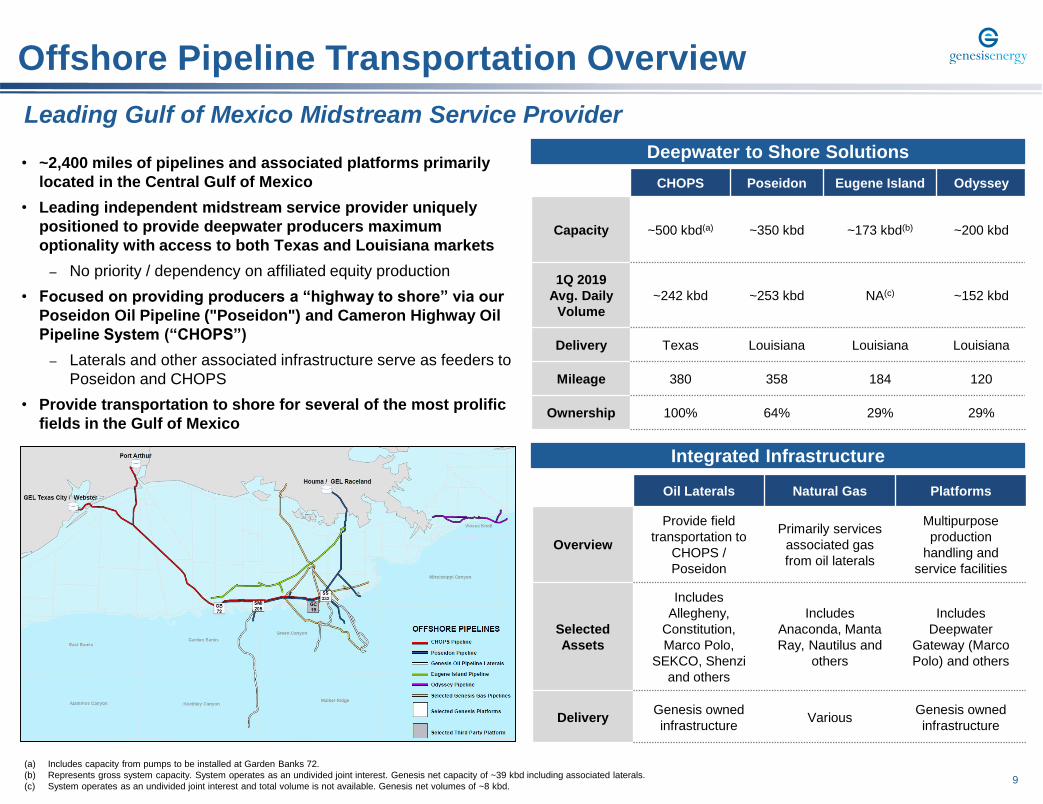
Offshore Pipeline Transportation Overview
CHOPS Poseidon Eugene Island Odyssey
Capacity ~500 kbd(a) ~350 kbd ~173 kbd(b) ~200 kbd
1Q 2019
Avg. Daily
Volume
~242 kbd ~253 kbd NA(c) ~152 kbd
Delivery Texas Louisiana Louisiana Louisiana
Mileage 380 358 184 120
Ownership 100% 64% 29% 29%
Oil Laterals Natural Gas Platforms
Overview
Provide field
transportation to
CHOPS /
Poseidon
Primarily services
associated gas
from oil laterals
Multipurpose
production
handling and
service facilities
Selected
Assets
Includes
Allegheny,
Constitution,
Marco Polo,
SEKCO, Shenzi
and others
Includes
Anaconda, Manta
Ray, Nautilus and
others
Includes
Deepwater
Gateway (Marco
Polo) and others
DeliveryGenesis owned
infrastructureVarious
Genesis owned
infrastructure
• ~2,400 miles of pipelines and associated platforms primarily
located in the Central Gulf of Mexico
• Leading independent midstream service provider uniquely
positioned to provide deepwater producers maximum
optionality with access to both Texas and Louisiana markets
– No priority / dependency on affiliated equity production
• Focused on providing producers a “highway to shore” via our
Poseidon Oil Pipeline ("Poseidon") and Cameron Highway Oil
Pipeline System (“CHOPS”)
– Laterals and other associated infrastructure serve as feeders to
Poseidon and CHOPS
• Provide transportation to shore for several of the most prolific
fields in the Gulf of Mexico
Deepwater to Shore Solutions
Integrated Infrastructure
Leading Gulf of Mexico Midstream Service Provider
(a) Includes capacity from pumps to be installed at Garden Banks 72.
(b) Represents gross system capacity. System operates as an undivided joint interest. Genesis net capacity of ~39 kbd including associated laterals.
(c) System operates as an undivided joint interest and total volume is not available. Genesis net volumes of ~8 kbd.

10
Gulf of Mexico Production
Gulf of Mexico Production(a)
• Deepwater Gulf of Mexico production has increased by ~59%
since 2013
• Production increase has been primarily driven by producers’
ability to leverage existing infrastructure, improved drilling
efficiency and lower costs
– Existing platforms provide installed production processing
capacity with existing pipeline connectivity to shore
– New discoveries within ~30 miles of existing production
facilities are often subsea "tied back" to existing infrastructure
• 29 new fields have started producing since 2015
– 20 of these fields are tiebacks to existing production facilities
• New developments and subsea tiebacks continue to drive
increasing deepwater production
Select Platform & Field Development History
Continued Growth in the Deepwater
Field, First Oil
Constitution, 2007
Ticonderoga, 2007
Caesar/Tonga, 2013
Constellation 2019
Field, First Oil
Lucius, 2014
Hadrian North, 2019
Buckskin, 2019
Field, First Oil
Marco Polo, 2004
K2, 2005
Field, First Oil
Shenzi, 2009
Field, First Oil
Son of Bluto, 2015
Marmalard, 2015
Otis, 2016
Blue Wing Olive,
2018
La Femme, 2018
Red Zinger, 2018
Nearly Headless
Nick, 2019(a) Source: BSSE and EIA’s March 2019 short term energy outlook forecast.
(b) Conference call quotes per Seeking Alpha.
(kb
d)
($ / b
bl)
Producing
Planned tiebacks
“The teams are now working to commission and safely bring Appomattox
on-stream later this year. And since we made the investment decision in
Appomattox, we have reduced costs of that project with 40% further
improving the competitiveness of that project…"
Select Producer Commentary(b)
“We continue to build on the many accomplishments that we have achieved
at LLOG in the deepwater Gulf of Mexico. We had a number of significant
achievements in 2018, including bringing on eight new wells, continued
exploration successes and being named operator in new projects."
“We are still dedicated to the deepwater. We think we have expertise in the
deepwater. We picked up a significant number of leases in the Gulf of
Mexico deepwater as well as offshore Mexico and Brazil as well. So we're
still invested in the deepwater.”
“Overall across the Gulf, we see six to seven projects that quite frankly we
didn't see just 18 months ago….And I think I would say from a development
cost per barrel perspective, we're continuing to drive it down. In our overall
portfolio, our cost per barrel are down by 20% over the last couple of years”
GEL Lateral
to CHOPS /
Poseidon
Constitution Delta House Lucius Marco Polo Shenzi
GEL Lateral
to CHOPS /
Poseidon
GEL Lateral
to CHOPS /
Poseidon
GEL Lateral
to CHOPS /
PoseidonOdyssey
5 additional prospects located
within 30 miles
1 additional
prospect located
within 30 miles
2 additional
prospects located
within 30 miles
$-
$20
$40
$60
$80
$100
$120
0
500
1,000
1,500
2,000
2,500
2013 2014 2015 2016 2017 2018 2019E 2020E
Non-Deepwater Deepwater (>1,000 ft.) Avg. Crude Price (WTI)
11
• Caesar / Tonga
• Calpurnia
• Genghis Khan
• Holstein
• K2
• Marco Polo
• Tahiti
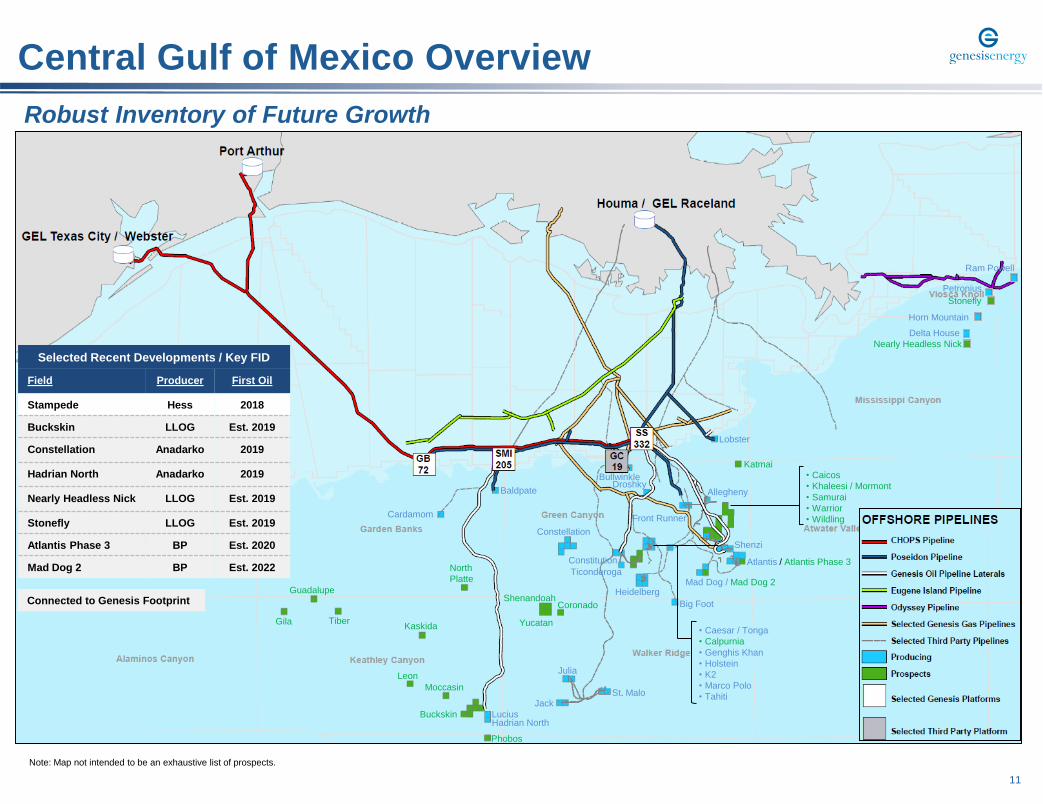
Central Gulf of Mexico Overview
Note: Map not intended to be an exhaustive list of prospects.
Robust Inventory of Future Growth
Buckskin
• Caicos
• Khaleesi / Mormont
• Samurai
• Warrior
• Wildling
Atlantis / Atlantis Phase 3
Constellation
Mad Dog / Mad Dog 2
Katmai
Phobos
Moccasin
Hadrian North
Leon
Kaskida
North
Platte
Gila
Guadalupe
Tiber
Shenandoah
Yucatan
Coronado
Selected Recent Developments / Key FID
Field Producer First Oil
Stampede Hess 2018
Buckskin LLOG Est. 2019
Constellation Anadarko 2019
Hadrian North Anadarko 2019
Nearly Headless Nick LLOG Est. 2019
Stonefly LLOG Est. 2019
Atlantis Phase 3 BP Est. 2020
Mad Dog 2 BP Est. 2022
Lucius
JackSt. Malo
Julia
Big Foot
Bullwinkle
Lobster
Cardamom
Baldpate
Constitution
Ticonderoga
Heidelberg
Shenzi
AlleghenyDroshky
Front Runner
Delta House
Horn Mountain
Ram Powell
Petronius
Nearly Headless Nick
Stonefly
Connected to Genesis Footprint

12
Central Gulf of Mexico Midstream Dynamics
TX City, TX /
Port Arthur, TX
Houma, LA /
Raceland, LAFourchon, LAGibson, LA
CHOPS/
Poseidon
Platform
SS 332 A&B
Poseidon
Platform
SMI 205
Am
be
rja
ck
24
”
Am
be
rjack
Sh
enzi
Ma
rco
Po
lo
Co
nstitu
tion
Alle
gheny
Ca
esar
SE
KC
O
Green Canyon / Walker Ridge VolumesAlaminos Canyon / Garden Banks /
Keathley Canyon Volumes
Deepwater
Production
Integrated
Infrastructure
/ Laterals
Strategic
Junction
Platforms
Paths to
Shore
Delivery
Locations
EIP
S 2
0”
Au
ge
r 2
0”
CH
OP
S 3
0”
Po
se
ido
n 2
4”
CHOPS / Poseidon Available Capacity to Shore(a)
Central Gulf of Mexico Deepwater to Shore Solutions
• Uniquely positioned with maximum optionality and available capacity to
provide a “highway to shore” for deepwater producers
– Integrated system allows producer to choose transportation to either
Texas or Louisiana via CHOPS / Poseidon to take advantage of
premium pricing
– CHOPS is only system in the Central Gulf of Mexico with delivery
onshore to Texas
• Laterals and additional infrastructure well positioned to capture future
volumes
• CHOPS / Poseidon have ample capacity to service the continued
growth in Central Gulf production with a shore based solution
Uniquely Positioned with Available Capacity to Capture Additional Volumes
Direct connectivity to GEL Texas City and GEL Raceland facilities(a) Includes capacity from pumps to be installed at GB 72.
CHOPS/
Poseidon
Platform
GB 72
CHOPS 30”
Poseidon 16” Poseidon 20”
-
250
500
750
1,000
2Q18 3Q18 4Q18 1Q19
kb
d
CHOPS Poseidon Available Capacity
Genesis owned infrastructure
GC 19
13
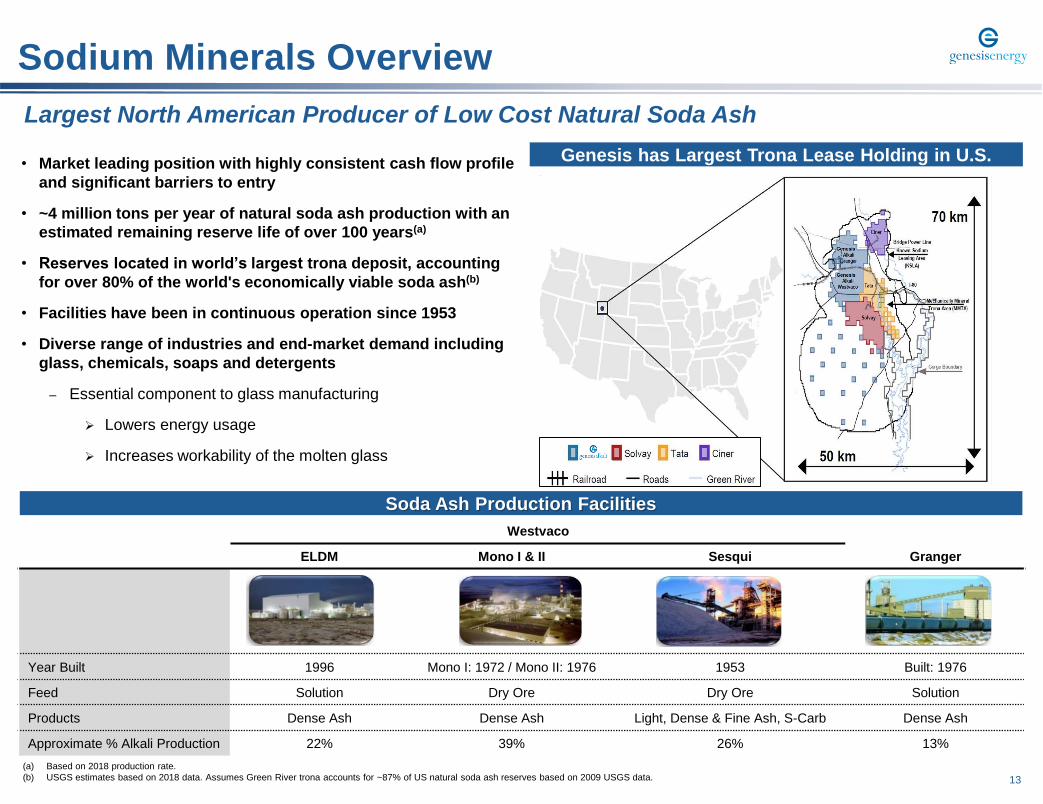
Sodium Minerals Overview
• Market leading position with highly consistent cash flow profile
and significant barriers to entry
• ~4 million tons per year of natural soda ash production with an
estimated remaining reserve life of over 100 years(a)
• Reserves located in world’s largest trona deposit, accounting
for over 80% of the world's economically viable soda ash(b)
• Facilities have been in continuous operation since 1953
• Diverse range of industries and end-market demand including
glass, chemicals, soaps and detergents
– Essential component to glass manufacturing
Lowers energy usage
Increases workability of the molten glass
Westvaco
ELDM Mono I & II Sesqui Granger
Year Built 1996 Mono I: 1972 / Mono II: 1976 1953 Built: 1976
Feed Solution Dry Ore Dry Ore Solution
Products Dense Ash Dense Ash Light, Dense & Fine Ash, S-Carb Dense Ash
Approximate % Alkali Production 22% 39% 26% 13%
Soda Ash Production Facilities
(a) Based on 2018 production rate.
(b) USGS estimates based on 2018 data. Assumes Green River trona accounts for ~87% of US natural soda ash reserves based on 2009 USGS data.
Largest North American Producer of Low Cost Natural Soda Ash
Genesis has Largest Trona Lease Holding in U.S.
Genesis
14
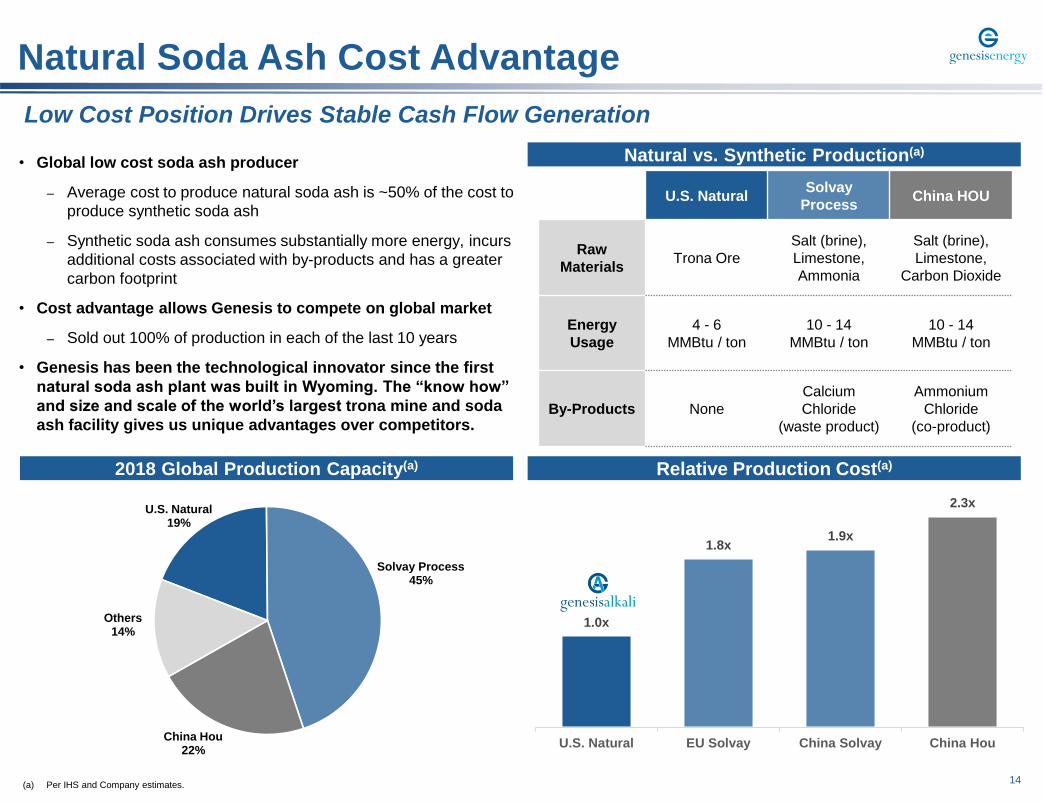
1.0x
1.8x1.9x
2.3x
U.S. Natural EU Solvay China Solvay China Hou
Natural Soda Ash Cost Advantage
Natural vs. Synthetic Production(a)
2018 Global Production Capacity(a) Relative Production Cost(a)
Low Cost Position Drives Stable Cash Flow Generation
(a) Per IHS and Company estimates.
U.S. NaturalSolvay
ProcessChina HOU
Raw
MaterialsTrona Ore
Salt (brine),
Limestone,
Ammonia
Salt (brine),
Limestone,
Carbon Dioxide
Energy
Usage
4 - 6
MMBtu / ton
10 - 14
MMBtu / ton
10 - 14
MMBtu / ton
By-Products None
Calcium
Chloride
(waste product)
Ammonium
Chloride
(co-product)
U.S. Natural19%
Solvay Process45%
China Hou22%
Others14%
• Global low cost soda ash producer
– Average cost to produce natural soda ash is ~50% of the cost to
produce synthetic soda ash
– Synthetic soda ash consumes substantially more energy, incurs
additional costs associated with by-products and has a greater
carbon footprint
• Cost advantage allows Genesis to compete on global market
– Sold out 100% of production in each of the last 10 years
• Genesis has been the technological innovator since the first
natural soda ash plant was built in Wyoming. The “know how”
and size and scale of the world’s largest trona mine and soda
ash facility gives us unique advantages over competitors.

15
CAGR
'13-'17 '17-'21
1.5% 2.1%
5.6% 4.1%
0.9% 1.1%
2.8% 2.2%
2.9% 2.5%
3.2% 2.9%
2013 2017 2021
Latin America Asia (Ex-China)(b)MEA EuropeIndian Subcontinent Turkey
Note: MEA stands for Middle East and Africa. EMEA stands for Europe, Middle East and Africa.
(a) In millions of metric tons. Per IHS, Company estimates and USGS. Ex-China, Ex-US and Canada
(b) Includes Australia, Hong Kong, Indonesia, Japan, Malaysia, Myanmar, New Zealand, North Korea, Other Southeast Asia, Philippines, Singapore, South Korea, Taiwan, Thailand and Vietnam
Soda Ash Supply / Demand Outlook
• Turkey expansion (Kazan) ~2.5 million metric tons per year
fully absorbed by market as evidenced by continued rise in
export pricing
• No significant natural supply expected to be online for 3+
years
• U.S. demand is relatively stable
• Domestic soda ash competitively positioned vs. high cost
synthetic to supply export growth in freight advantaged
markets of Asia and Latin America
• Global demand (ex-China) expected to grow 800-900K MT per
year
– Driven by emerging middle class and increasing per capita
consumption in Asia and Latin America
• Both the U.S. (natural) and China (synthetic) are net exporters
of soda ash
Soda Ash Demand by Geography(a)
Global Supply Sources(a) 2018 Genesis Sale Volume by Geography
25.227.8
30.9
2013 - 2017 CAGR:
2.5%
2017 - 2021 CAGR:
2.6%
Supply / Demand Balance Expected to Remain Tight
High Cost Synthetic
74%
Low Cost Natural
Production26%
North America43%
Latin America24%
Asia-Pacific29%
EMEA4%

16
Sulfur Services Overview
• Market leading position with highly consistent cash flow profile
and significant barriers to entry to replicate both asset and
marketing footprint
• Consistent cash flow generation through all economic cycles
• Long-term relationships with both refineries and customers
spanning 30+ years
• Sour “Gas Processing” units inside the fence at 9 refineries
play integral role in sulfur removal for each refinery
– Run in parallel or in lieu of traditional sulfur removal units
– Reliable and trusted operator of owned assets inside refinery
fence
• Produce NaHS through proprietary process utilizing Caustic
Soda (“NaOH”) reacted with high H2S gas
• Take NaHS in kind as compensation for sulfur removal
services and sell NaHS primarily to large mining, pulp & paper
and other customers:
– ~80% of our cost of goods is NaOH
– ~75% of the Company’s sales contracts are indexed to caustic
soda prices (cost-plus)
– Remaining ~25% of contracts are adjustable (typically 30 days
advance notice)
Sulfur Removal Units
NaHS End Markets
Chemical
Tanning
Environmental
Refiners
Nat Gas
H2S
Nat Gas
NaHS Unit
"Gas Processing"
Trucks
Barges & Ships
Terminals
Rail Cars
Mining (54%) Pulp & Paper (31%) Others (15%)
NaHS
Refinery Operator Location
Relationship
History
Capacity
(DST)
Phillips 66 Westlake, LA 25 Years 110,000
Holly Refinery Tulsa, OK 5 Years 24,000
Holly Refinery Salt Lake City, UT 9 Years 21,000
Citgo Corpus Christi, TX 15 Years 20,000
Delek El Dorado, AR 35 Years 15,000
Chemtura El Dorado, AR 15 Years 10,000
Albemarle Magnolia, AR 35 Years 8,000
Ergon Refinery Vicksburg, MS 35 Years 6,000
Cross Oil Smackover, AR 25 Years 3,000
Ergon Refinery Newell, WV 35 Years 2,800
Production Process and Sales Overview
Market Leader of NaHS Production and Leading Provider of Sulfur Removal Services
17
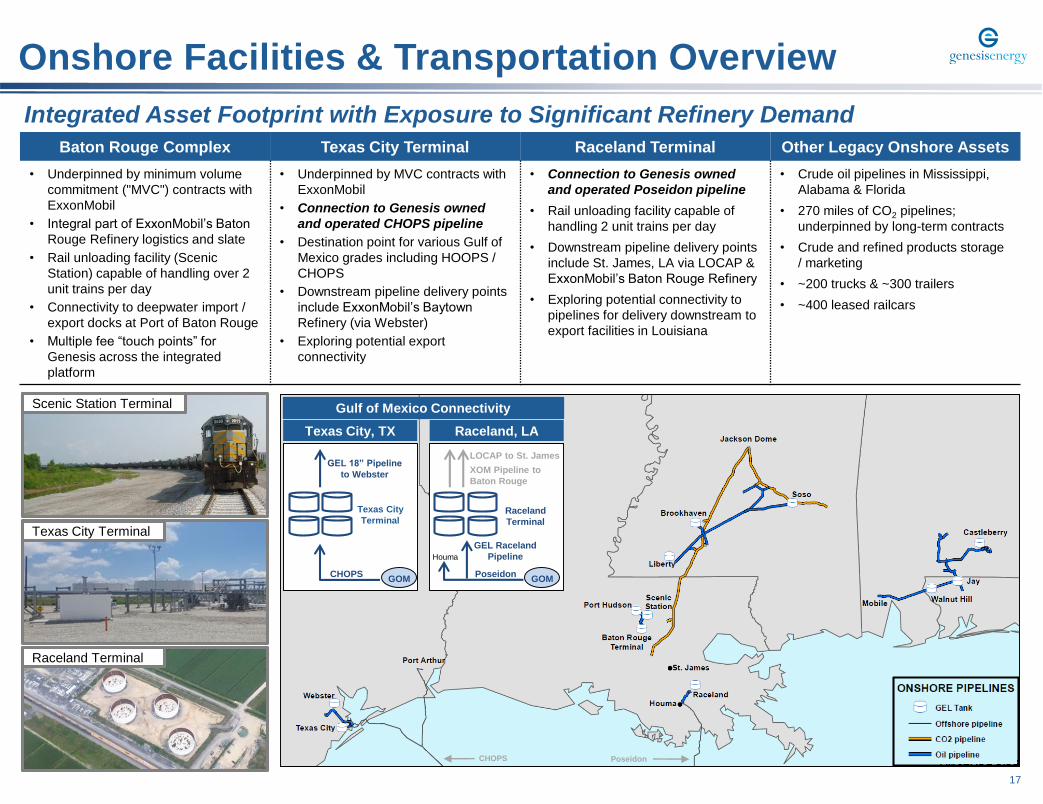
Onshore Facilities & Transportation Overview
Baton Rouge Complex Texas City Terminal Raceland Terminal Other Legacy Onshore Assets
• Underpinned by minimum volume
commitment ("MVC") contracts with
ExxonMobil
• Integral part of ExxonMobil’s Baton
Rouge Refinery logistics and slate
• Rail unloading facility (Scenic
Station) capable of handling over 2
unit trains per day
• Connectivity to deepwater import /
export docks at Port of Baton Rouge
• Multiple fee “touch points” for
Genesis across the integrated
platform
• Underpinned by MVC contracts with
ExxonMobil
• Connection to Genesis owned
and operated CHOPS pipeline
• Destination point for various Gulf of
Mexico grades including HOOPS /
CHOPS
• Downstream pipeline delivery points
include ExxonMobil’s Baytown
Refinery (via Webster)
• Exploring potential export
connectivity
• Connection to Genesis owned
and operated Poseidon pipeline
• Rail unloading facility capable of
handling 2 unit trains per day
• Downstream pipeline delivery points
include St. James, LA via LOCAP &
ExxonMobil’s Baton Rouge Refinery
• Exploring potential connectivity to
pipelines for delivery downstream to
export facilities in Louisiana
• Crude oil pipelines in Mississippi,
Alabama & Florida
• 270 miles of CO2 pipelines;
underpinned by long-term contracts
• Crude and refined products storage
/ marketing
• ~200 trucks & ~300 trailers
• ~400 leased railcars
Integrated Asset Footprint with Exposure to Significant Refinery Demand
Texas City Terminal
Raceland Terminal
Scenic Station Terminal
Texas City
Terminal
CHOPS
GEL 18” Pipeline
to Webster
Raceland
Terminal
GEL Raceland
Pipeline
LOCAP to St. James
XOM Pipeline to
Baton Rouge
Houma
PoseidonGOMGOM
Gulf of Mexico Connectivity
Texas City, TX Raceland, LA
PoseidonCHOPS

18
Asset Snapshot: Baton Rouge Complex
• Integral part of day-to-day refinery logistics and feedstocks for
Exxon Mobil's Baton Rouge Refinery (4th largest U.S. Refinery
with 503 kbd of capacity)
• Scenic Station is the primary home for Imperial / ExxonMobil's
equity Canadian production (Kearl, Cold Lake) that moves via
rail
– Portion of volume is consumed at the refinery and remainder is
exported via Port Hudson / Baton Rouge Terminal (“BRT”)
• Baton Rouge Terminal activity driven by (i) steady supply of
vacuum gas oil (VGO) imports consumed by the Refinery, (ii)
distressed opportunistic crude imports consumed by the
refinery and (iii) rail exports from Scenic Station
Port
Hudson
Terminal
Scenic
Station
Terminal
Baton
Rouge
Terminal
Scenic
Station
Terminal
• Deliver barrels by pipeline to XOM Refinery / Port Hudson / BRT
• 440 kbbls total shell tank storage capacity
• Unload 100+ car unit trains from Alberta & other markets
• Connected to Canadian National (direct) & Canadian Pacific (via KCS)
Railroads
• Capable of receiving and unloading over 2 unit trains per day
Baton
Rouge
Terminal
• Receive barrels by pipeline from Scenic Station & load ships for export
• Receive barrels by ship & deliver barrels by pipeline to XOM Refinery
• 1,700 kbbls total shell tank storage capacity
• Connectivity to 2 deepwater docks (Port of Baton Rouge)
• Import / export capabilities for both crude oil and intermediates
Port
Hudson
Terminal
• Receive barrels by barge / truck
• Pipeline delivery to XOM Refinery / other area refineries
• Receive barrels by pipeline from Scenic Station & loads barges
• 556 kbbls total shell tank storage capacity
• Origination of bi-directional 18 mile, 24” pipeline to Scenic Station / XOM
Refinery
XOM
Refinery
Terminaling Fee
Paid to GEL
Pipeline Fee
Paid to GEL
Integrated Crude & Intermediates Logistics Platform
Value Proposition – Multiple “Touch Points” for Genesis to Earn Fees
Port Hudson
Scenic Station
Baton Rouge
Terminal
XOM Refinery
Baton Rouge Complex
19
38
48
123
36
21
92
12
0
40
80
120
160
0 to 5 5 to 10 10 to 15 15 to 20 20 to 25 25 to 30 30 to 35 35+
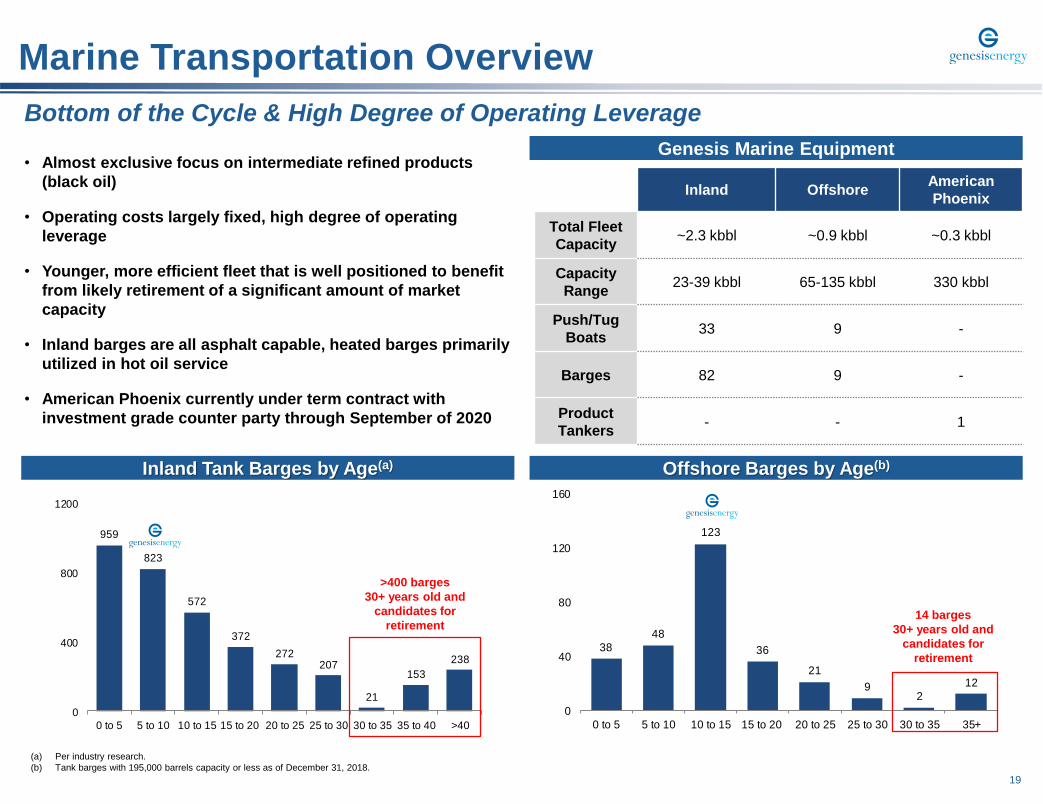
Marine Transportation Overview
959
823
572
372
272207
21
153
238
0
400
800
1200
0 to 5 5 to 10 10 to 15 15 to 20 20 to 25 25 to 30 30 to 35 35 to 40 >40
>400 barges
30+ years old and
candidates for
retirement14 barges
30+ years old and
candidates for
retirement
(a) Per industry research.
(b) Tank barges with 195,000 barrels capacity or less as of December 31, 2018.
• Almost exclusive focus on intermediate refined products
(black oil)
• Operating costs largely fixed, high degree of operating
leverage
• Younger, more efficient fleet that is well positioned to benefit
from likely retirement of a significant amount of market
capacity
• Inland barges are all asphalt capable, heated barges primarily
utilized in hot oil service
• American Phoenix currently under term contract with
investment grade counter party through September of 2020
Bottom of the Cycle & High Degree of Operating Leverage
Offshore Barges by Age(b)Inland Tank Barges by Age(a)
Inland OffshoreAmerican
Phoenix
Total Fleet
Capacity~2.3 kbbl ~0.9 kbbl ~0.3 kbbl
Capacity
Range23-39 kbbl 65-135 kbbl 330 kbbl
Push/Tug
Boats33 9 -
Barges 82 9 -
Product
Tankers- - 1
Genesis Marine Equipment

20
Appendix & Reconciliations
21
$-
$200
$400
$600
$800
$1,000
$1,200
$1,400
$1,600
$1,800
2019 2020 2021 2022 2023 2024 2025 2026
Senior Notes Revolving Credit Facility
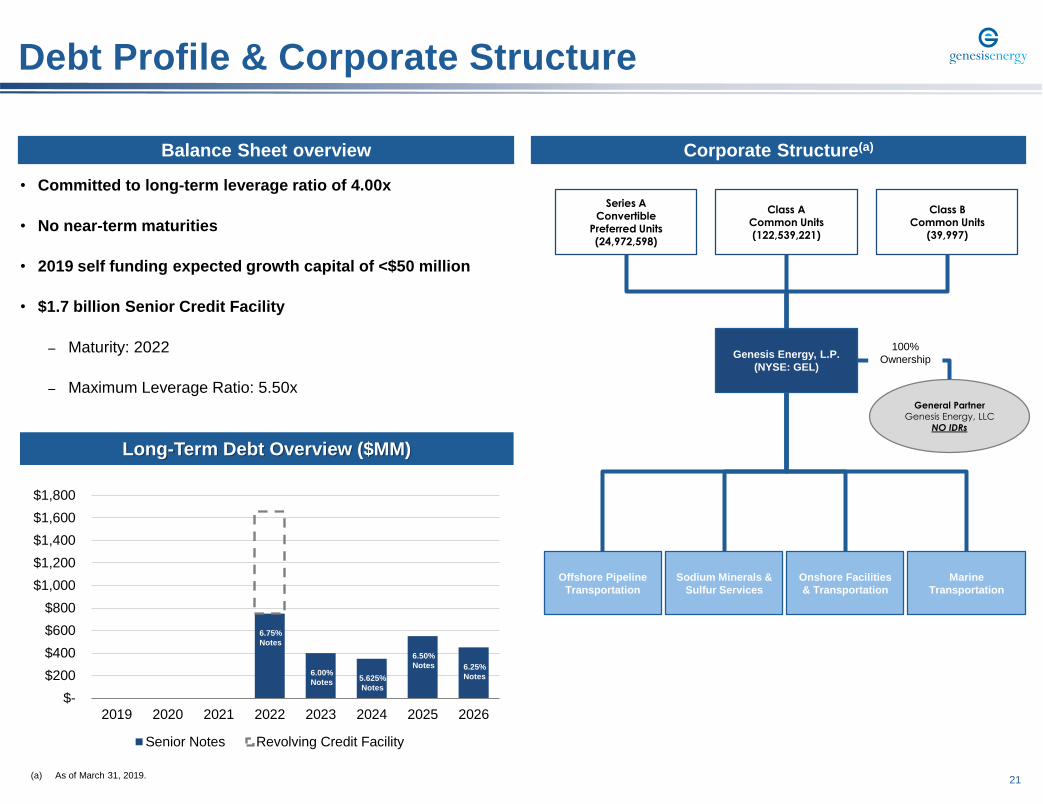
• Committed to long-term leverage ratio of 4.00x
• No near-term maturities
• 2019 self funding expected growth capital of <$50 million
• $1.7 billion Senior Credit Facility
– Maturity: 2022
– Maximum Leverage Ratio: 5.50x
Debt Profile & Corporate Structure
Long-Term Debt Overview ($MM)
Genesis Energy, L.P.
(NYSE: GEL)
General Partner
Genesis Energy, LLC
NO IDRs
Sodium Minerals &
Sulfur Services
Series AConvertible
Preferred Units(24,972,598)
Class ACommon Units(122,539,221)
Class BCommon Units
(39,997)
Offshore Pipeline
Transportation
100%
Ownership
Marine
Transportation
Onshore Facilities
& Transportation
Corporate Structure(a)Balance Sheet overview
6.75%
Notes
6.00%
Notes5.625%
Notes
6.50%
Notes 6.25%
Notes
(a) As of March 31, 2019.
22
Balance Sheet & Credit Profile
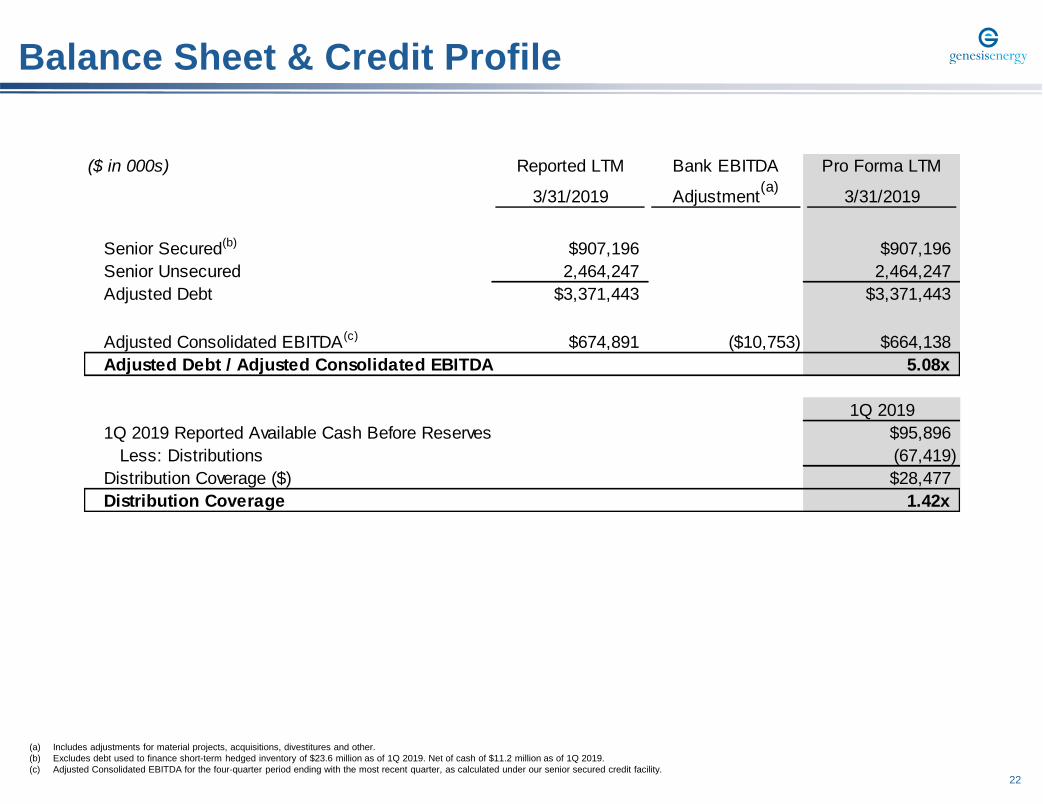
(a) Includes adjustments for material projects, acquisitions, divestitures and other.
(b) Excludes debt used to finance short-term hedged inventory of $23.6 million as of 1Q 2019. Net of cash of $11.2 million as of 1Q 2019.
(c) Adjusted Consolidated EBITDA for the four-quarter period ending with the most recent quarter, as calculated under our senior secured credit facility.
($ in 000s) Reported LTM Bank EBITDA Pro Forma LTM
3/31/2019 Adjustment(a)
3/31/2019
Senior Secured(b) $907,196 $907,196
Senior Unsecured 2,464,247 2,464,247
Adjusted Debt $3,371,443 $3,371,443
Adjusted Consolidated EBITDA(c) $674,891 ($10,753) $664,138
Adjusted Debt / Adjusted Consolidated EBITDA 5.08x
1Q 2019
1Q 2019 Reported Available Cash Before Reserves $95,896
Less: Distributions (67,419)
Distribution Coverage ($) $28,477
Distribution Coverage 1.42x
23
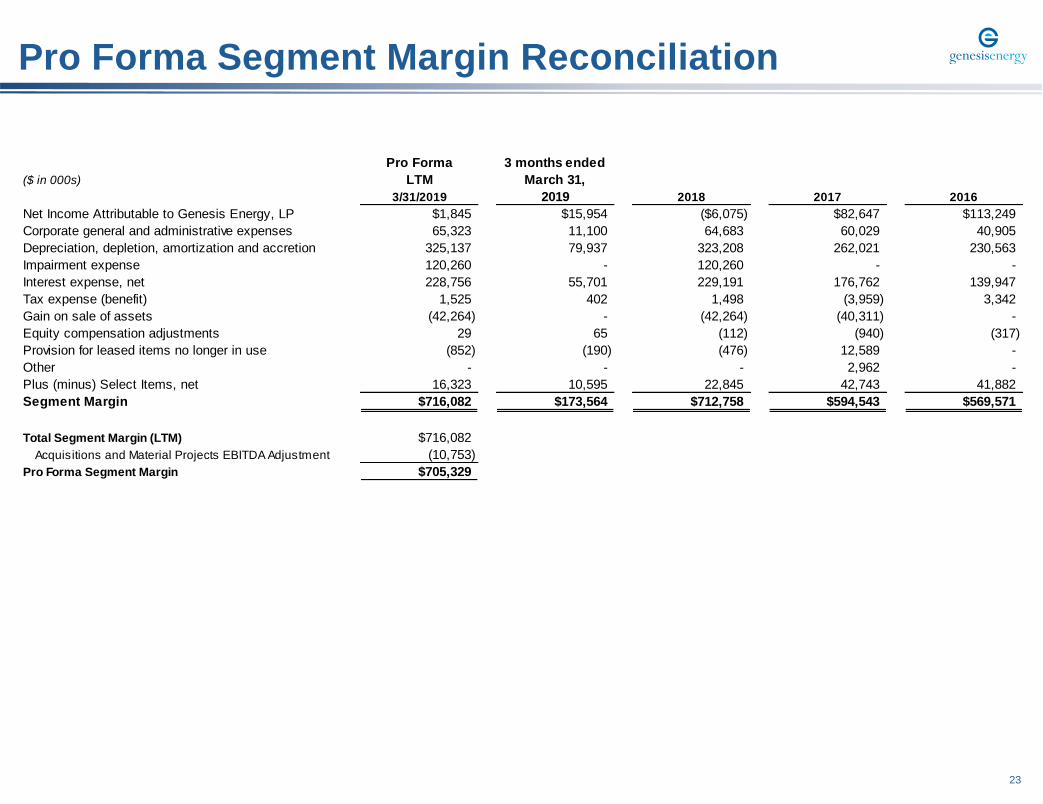
Pro Forma Segment Margin Reconciliation
Pro Forma
($ in 000s) LTM
3/31/2019 2019 2018 2017 2016
Net Income Attributable to Genesis Energy, LP $1,845 $15,954 ($6,075) $82,647 $113,249
Corporate general and administrative expenses 65,323 11,100 64,683 60,029 40,905
Depreciation, depletion, amortization and accretion 325,137 79,937 323,208 262,021 230,563
Impairment expense 120,260 - 120,260 - -
Interest expense, net 228,756 55,701 229,191 176,762 139,947
Tax expense (benefit) 1,525 402 1,498 (3,959) 3,342
Gain on sale of assets (42,264) - (42,264) (40,311) -
Equity compensation adjustments 29 65 (112) (940) (317)
Provision for leased items no longer in use (852) (190) (476) 12,589 -
Other - - - 2,962 -
Plus (minus) Select Items, net 16,323 10,595 22,845 42,743 41,882
Segment Margin $716,082 $173,564 $712,758 $594,543 $569,571
Total Segment Margin (LTM) $716,082
Acquisitions and Material Projects EBITDA Adjustment (10,753)
Pro Forma Segment Margin $705,329
3 months ended
March 31,
24
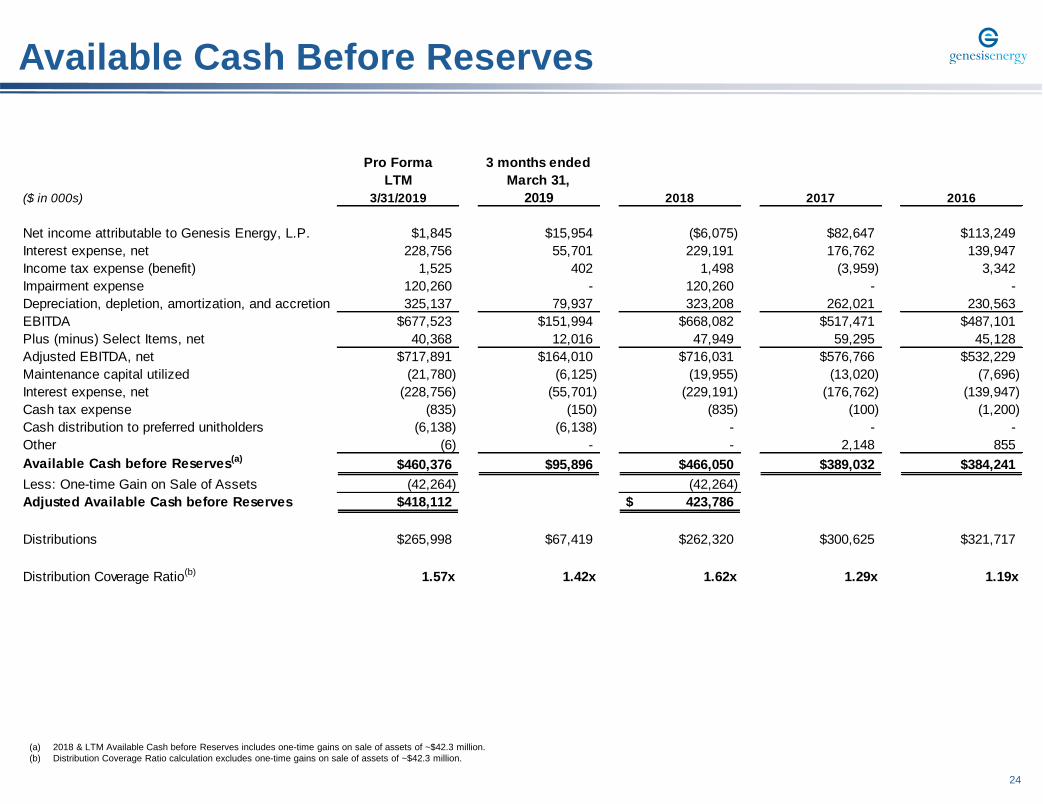
Available Cash Before Reserves
(a) 2018 & LTM Available Cash before Reserves includes one-time gains on sale of assets of ~$42.3 million.
(b) Distribution Coverage Ratio calculation excludes one-time gains on sale of assets of ~$42.3 million.
Pro Forma
LTM
($ in 000s) 3/31/2019 2019 2018 2017 2016
Net income attributable to Genesis Energy, L.P. $1,845 $15,954 ($6,075) $82,647 $113,249
Interest expense, net 228,756 55,701 229,191 176,762 139,947
Income tax expense (benefit) 1,525 402 1,498 (3,959) 3,342
Impairment expense 120,260 - 120,260 - -
Depreciation, depletion, amortization, and accretion 325,137 79,937 323,208 262,021 230,563
EBITDA $677,523 $151,994 $668,082 $517,471 $487,101
Plus (minus) Select Items, net 40,368 12,016 47,949 59,295 45,128
Adjusted EBITDA, net $717,891 $164,010 $716,031 $576,766 $532,229
Maintenance capital utilized (21,780) (6,125) (19,955) (13,020) (7,696)
Interest expense, net (228,756) (55,701) (229,191) (176,762) (139,947)
Cash tax expense (835) (150) (835) (100) (1,200)
Cash distribution to preferred unitholders (6,138) (6,138) - - -
Other (6) - - 2,148 855
Available Cash before Reserves(a)$460,376 $95,896 $466,050 $389,032 $384,241
Less: One-time Gain on Sale of Assets (42,264) (42,264)
Adjusted Available Cash before Reserves $418,112 423,786$
Distributions $265,998 $67,419 $262,320 $300,625 $321,717
Distribution Coverage Ratio(b) 1.57x 1.42x 1.62x 1.29x 1.19x
3 months ended
March 31,
25
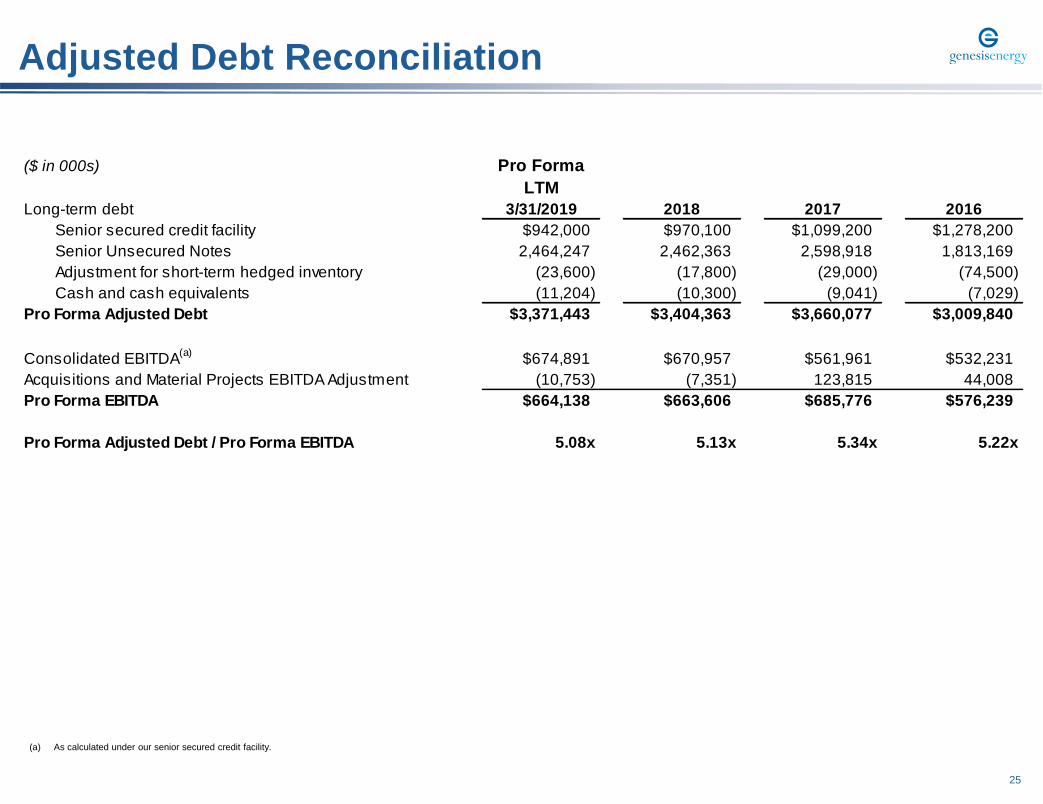
Adjusted Debt Reconciliation
(a) As calculated under our senior secured credit facility.
($ in 000s) Pro Forma
LTM
Long-term debt 3/31/2019 2018 2017 2016
Senior secured credit facility $942,000 $970,100 $1,099,200 $1,278,200
Senior Unsecured Notes 2,464,247 2,462,363 2,598,918 1,813,169
Adjustment for short-term hedged inventory (23,600) (17,800) (29,000) (74,500)
Cash and cash equivalents (11,204) (10,300) (9,041) (7,029)
Pro Forma Adjusted Debt $3,371,443 $3,404,363 $3,660,077 $3,009,840
Consolidated EBITDA(a)
$674,891 $670,957 $561,961 $532,231
Acquisitions and Material Projects EBITDA Adjustment (10,753) (7,351) 123,815 44,008
Pro Forma EBITDA $664,138 $663,606 $685,776 $576,239
Pro Forma Adjusted Debt / Pro Forma EBITDA 5.08x 5.13x 5.34x 5.22x
26
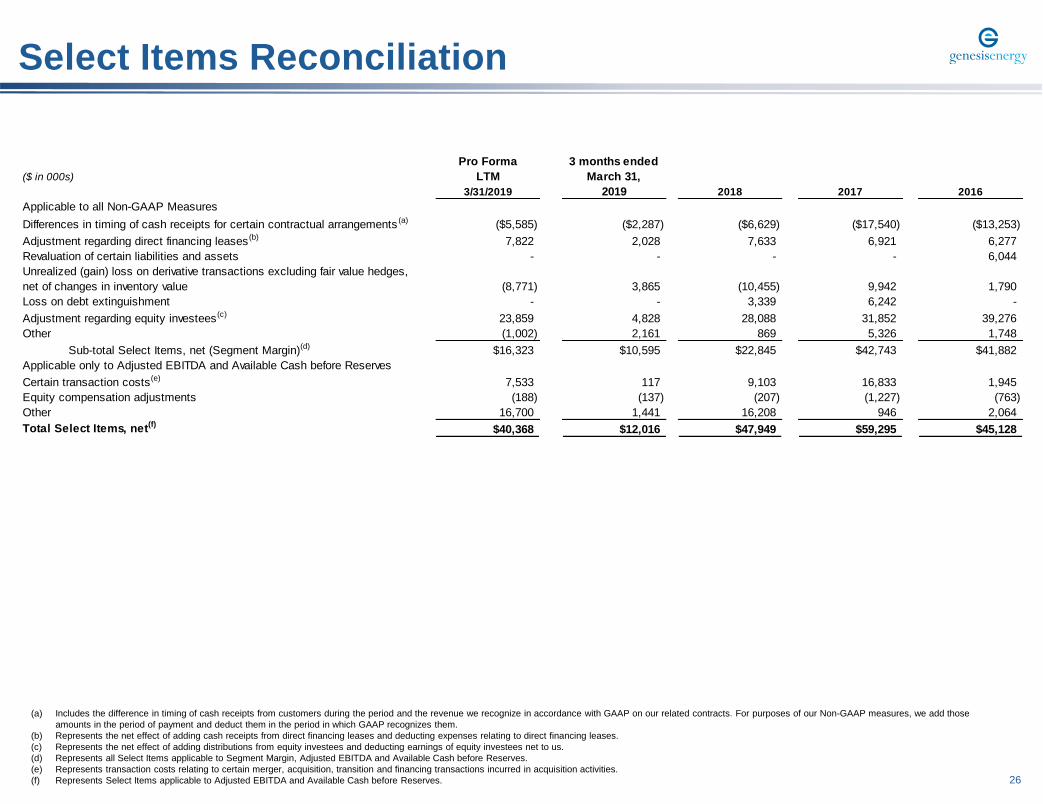
Select Items Reconciliation
(a) Includes the difference in timing of cash receipts from customers during the period and the revenue we recognize in accordance with GAAP on our related contracts. For purposes of our Non-GAAP measures, we add those
amounts in the period of payment and deduct them in the period in which GAAP recognizes them.
(b) Represents the net effect of adding cash receipts from direct financing leases and deducting expenses relating to direct financing leases.
(c) Represents the net effect of adding distributions from equity investees and deducting earnings of equity investees net to us.
(d) Represents all Select Items applicable to Segment Margin, Adjusted EBITDA and Available Cash before Reserves.
(e) Represents transaction costs relating to certain merger, acquisition, transition and financing transactions incurred in acquisition activities.
(f) Represents Select Items applicable to Adjusted EBITDA and Available Cash before Reserves.
Pro Forma
($ in 000s) LTM
3/31/2019 2019 2018 2017 2016
Applicable to all Non-GAAP Measures
Differences in timing of cash receipts for certain contractual arrangements (a) ($5,585) ($2,287) ($6,629) ($17,540) ($13,253)
Adjustment regarding direct financing leases (b) 7,822 2,028 7,633 6,921 6,277
Revaluation of certain liabilities and assets - - - - 6,044
Unrealized (gain) loss on derivative transactions excluding fair value hedges,
net of changes in inventory value (8,771) 3,865 (10,455) 9,942 1,790
Loss on debt extinguishment - - 3,339 6,242 -
Adjustment regarding equity investees(c) 23,859 4,828 28,088 31,852 39,276
Other (1,002) 2,161 869 5,326 1,748
Sub-total Select Items, net (Segment Margin)(d) $16,323 $10,595 $22,845 $42,743 $41,882
Applicable only to Adjusted EBITDA and Available Cash before Reserves
Certain transaction costs(e) 7,533 117 9,103 16,833 1,945
Equity compensation adjustments (188) (137) (207) (1,227) (763)
Other 16,700 1,441 16,208 946 2,064
Total Select Items, net(f)$40,368 $12,016 $47,949 $59,295 $45,128
3 months ended
March 31,