2019 rural development report. chapter 5
TRANSCRIPT


Capturing the demographic dividend for rural youth
Chapter 5

146 2019 Rural Development Report Creating opportunities for rural youth
Three interlinked demographic processes have major effects on rural livelihoods: urbanization, rural densification and the demographic transition. More than 50 per cent of the population in lower- and middle-income countries now live in “urban” areas, yet the rural population has increased around fourfold since
the 1950s (UNDESA, 2017b). Urbanization (including the expansion of secondary cities), rural densification and the growth of rural towns are reducing the literal and figurative distance between urban and rural areas and increasing opportunities in rural areas as they become more connected to markets thanks to increased mobility and migration, among other factors.
The demographic transition is closely linked to the processes that lie at the heart of structural transformation and may deeply affect rural young people’s lives and opportunities (Stecklov and Menashe-Oren, 2018). The demographic transition is the process whereby initial declines in mortality (primarily infant and child mortality) generate rapid population growth and younger population age structures. After some time – in some cases quite rapidly and in others following substantial delays – fertility begins to decline and, eventually, populations begin to age.
The term “demographic dividend” refers to the potential for increased economic growth that arises during the phase of the demographic transition – at some point after the onset of the decline in fertility – when the proportion of the total population represented by the working-age population is large; with more people working per each non-working person (i.e. with a low dependency ratio), average output should rise (Bloom et al. 2003; Lee and Mason, 2010). If the right investments are made at this juncture, then this period can also be a time of higher educational attainment, better health outcomes and improved employment opportunities for women. All of this will increase the size of the (first) demographic dividend.
The dividend thus arises during what is a unique and temporary window of opportunity for economic growth. It can make a large, sustained contribution to growth if the transition is fast and if governments make the needed investments to increase the productivity of the workforce during the period when the dependency ratio is low. If the transition is slow, or if needed investments are not made, long-term growth can be undermined.
Rural areas generally lag behind in the demographic transition, which is why it is so important for investments to be made in improving the health, education and productive employment of rural youth in those areas. Such investments will speed up the transition and increase the size and durability of the dividend.
The pace of the demographic transition needs to accelerate in sub-Saharan Africa (SSA) because this region is at risk of missing out on the dividend. The average fertility rate in SSA remains stubbornly high at 5.1 live births per woman, while in Asia it has declined from almost 6 to around 2 births per woman in the past 40 years (UNDESA, 2017a). SSA currently hosts 20 per cent of the youth population of the world’s low- and middle-income countries, and its share is projected to rise to between 30 and 50 per cent by 2100. If
147Chapter 5 Capturing the demographic dividend for rural youth
fertility does not decline faster in SSA and young people do not participate productively in the economy, more people are likely to remain poor, especially in rural areas. This is already reflected in slowing rates of poverty reduction and increasing numbers of poor people in the continent in recent years (World Bank, 2018a).
Investments aimed at incorporating young rural women into the workforce, while taking the reproductive sphere of life into account, are of key importance in capturing the demographic dividend. The contributions of female labour force participation to the demographic dividend are twofold. First, participation in the workforce encourages young women to delay childbearing and can contribute to fertility reduction. Second, it increases the productivity of the rural sector and thus speeds up the structural transformation process. Bringing young rural women into school and work will improve their livelihoods and (rural) economies as a whole.
Investments that will encourage savings by upgrading the performance of financial institutions can drive a second demographic dividend. This happens when the working population makes up a large share of the total population, has low fertility rates and then increases its retirement savings. The resulting upswing in aggregate savings raises investment levels and contributes to long-term economic growth. Achieving this second dividend requires stable institutions that incentivise private savings. Even countries that (almost) missed the first demographic dividend can grasp the second one if they manage to bring their youth into employment and create a functioning financial system. With the right institutions put in place now, today’s young generations can become the drivers and beneficiaries of the second demographic dividend.
The demographic transition is closely tied, as both a cause and a consequence, to the rural transformation process. It thus plays a central role in determining the prospects for sustained and inclusive rural transformation and in our understanding of these dynamics. This chapter lays out what the demographic transition is, explains the closely related concepts of the first and second demographic dividends, and highlights their relationship to the rural transformation process. It also offers a review of the status of the transition in the various regions of the developing world and looks at some of the reasons for the uneven pace of progress; in that connection, it also focuses on the very slow transition occurring in Africa and the concerns which that raises. It then goes on to discuss how investments in rural youth can help to accelerate the transition in the countries that stand in greatest need of the demographic dividend.
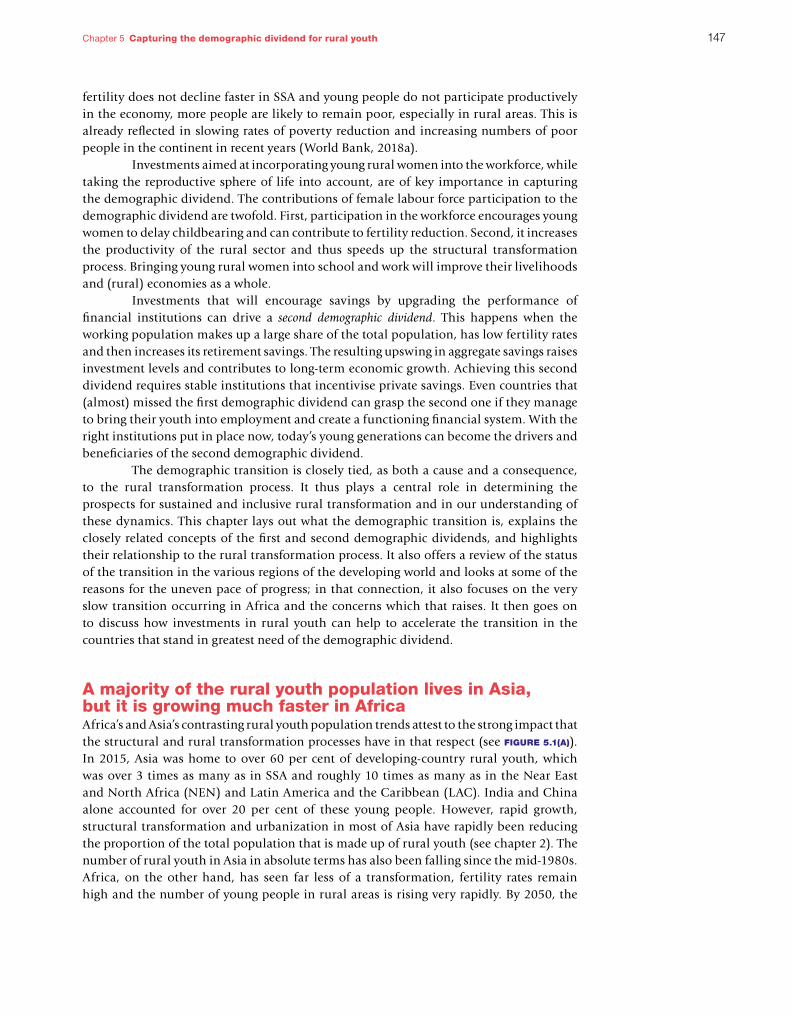
A majority of the rural youth population lives in Asia, but it is growing much faster in AfricaAfrica’s and Asia’s contrasting rural youth population trends attest to the strong impact that the structural and rural transformation processes have in that respect (see figure 5.1(a)). In 2015, Asia was home to over 60 per cent of developing-country rural youth, which was over 3 times as many as in SSA and roughly 10 times as many as in the Near East and North Africa (NEN) and Latin America and the Caribbean (LAC). India and China alone accounted for over 20 per cent of these young people. However, rapid growth, structural transformation and urbanization in most of Asia have rapidly been reducing the proportion of the total population that is made up of rural youth (see chapter 2). The number of rural youth in Asia in absolute terms has also been falling since the mid-1980s. Africa, on the other hand, has seen far less of a transformation, fertility rates remain high and the number of young people in rural areas is rising very rapidly. By 2050, the

148 2019 Rural Development Report Creating opportunities for rural youth
figure 5.1.a A disproportionate share of rural youth today are in Asia, but Africa’s share is projected to rise rapidly
Note: This map is an equal-area cartogram (also known as a density-equalizing map) of the share of global rural youth, by country. The cartogram resizes each country according to its share of the global rural youth population. The seven different colours shown on the map differentiate the various categories of countries according to their shares. The projected increase in Africa’s share of rural youth by 2050 is represented by the larger size of that continent relative to the others. Source: Authors’ calculations using the Gastner-Newman method (2004) based on spatially disaggregated population data for 2015 and projections for 2050 from the United Nations Department of Economic and Social Affairs. The rural youth projections are created by applying the projected share of the rural population to the total projected youth population. This is based on the assumption that age structures in rural and urban areas will remain the same. Potential deviations from this assumption are not expected to have a noticeable effect on overall trends in rural youth populations across regions.
Percentage share of global rural youth, 2015 Percentage share of global rural youth, 2050
figure 5.1.b The majority of countries with large youth populations have high rural poverty rates
Notes: APR: Asia and the Pacific; LAC: Latin America and the Caribbean; NEN: Near East, North Africa, Europe and Central Asia; SSA: sub-Saharan Africa; PPP: purchasing power parity.Source: Authors’ calculations based on United Nations World Population Prospects: The 2017 Revision. The dataset covers 75 low- and middle-income countries (based on the World Bank definitions of these categories and data for 2018). The numbers in parentheses represent millions of rural youth in each country. A zero signifies that the rural youth population is less than 1 million.
10
0
30
50
70
90
0 5 000 10 000 15 000 20 000 25 000
Rur
al p
over
ty r
ate
($1.
25 a
day
(201
1 P
PP
))
Gross national income (GNI) per capita, PPP
Togo (1)
Uganda (6)
Madagascar (3)Liberia (0)
Burundi (2)Congo (0)
Zambia (2)
Malawi (3)
Nigeria (16)
Eswatini (0)
Mali (2)
Rwanda (2)
Mozambique (3)Sierra Leone (1)
Central African Republic (1)
Ethiopia (17)
Senegal (2)Gambia (0)
Chad (2) Côte d’Ivoire (2)Ghana (2)
Congo, Dem.Rep. (7)
Niger (3)
Guinea-Bissau (0)
Cameroon (2)
Burkina Faso (2)
Guinea (1)Tanzania (6)
Kenya (7)
South Africa (4)
Tajikistan (1)
Mauritania (0)Kyrgyzstan (1)
Morocco (3)
Jordan (0)
Georgia (0)
Iraq (2)
Egypt (9)
Tunisia (1) Azerbaijan (1) Iran (4) Kazakhstan (1)
Turkey (3)Mexico (5)
Malaysia (2)
Brazil (5)
Dominican Republic (0)
Costa Rica (0)
Colombia (2)
Peru (1)Ecuador (1)
Namibia (0)
Belize (0)
Bolivia (1)
Guatemala (2)
El Salvador (0)
Paraguay (1)
Nicaragua (1)
Honduras (1)India (150)
Lao PDR (1) Timor-Leste (0)
Nepal (5)
Cambodia (2)
Philippines (11)
China (76)
Indonesia (19)
Sri Lanka (3)Buthan (0)
Viet Nam (10)
Pakistan (22)
Thailand (4)
Lesotho (0)
Bangladesh (21)
Benin (1)
Number of rural youth (in millions)
NEN SSALACAPR
0.51-1.000.21-0.500.00-0.20 4.11-14.002.01-4.10 14.01-27.501.01-2.00

149Chapter 5 Capturing the demographic dividend for rural youth
number of rural youth in Africa is expected to nearly double to about 180 million, while the size of the young rural population in Asia will fall rapidly from 340 million to about 230 million.
Apart from China and India, the vast majority of these rural youth live in low-income countries with high rural poverty rates, mostly in Africa (see figure 5.1(b)). Of all the countries in the world with rural poverty rates of 30 per cent or above, all but two – Bangladesh and Tajikistan – are in Africa. These basic numbers lead to a startling observation: if growth and transformation in Asia and Africa continue over the coming decades at the rates seen in recent decades, then by 2050 Africa will account for almost all the world’s poor rural youth. A key contribution of the rest of this chapter is to explain why this is the case and how Africa may avoid it.
The first demographic dividend is a one-time opportunity
The demographic transition is both a cause and a consequence of structural and rural transformation processes
The demographic transition starts with declines in mortality (primarily infant and child mortality), which generate rapid population growth and younger population age structures. In modern times, this decline in mortality typically starts in urban areas and later spreads to rural areas.41 After some time – in some cases quite rapidly and in others following substantial delays – fertility begins to decline, which leads to an ageing population. This decline in fertility also typically starts in urban areas and then spreads to rural areas.
The demographic transition can drive structural and rural transformations in the following way. Falling fertility in urban areas raises labour productivity and incomes in the cities. These rising incomes drive changes in expenditure patterns that shift spending away, in relative terms, from food and towards non-food items, thus starting off the process of structural change in the economy. Rising urban incomes also draw increasing numbers of rural people – many of whom are young – to urban areas in search of better opportunities.42 When fertility rates start to decline in rural areas while rural-urban migration continues, falling population growth rates in rural areas relative to urban population growth rates boost labour productivity and incomes in rural areas, both in farming and in non-farm activities. Expenditure patterns then begin to change in rural areas, which increases the overall pace of structural change, especially in rural zones. Without a demographic transition, or with a very slow one, this process slows down significantly and economic opportunities stagnate.
The demographic transition is also a consequence of structural and rural transformations because declines in fertility – the engine of the transition – depend
41 In pre-industrial Europe, poor hygiene caused urban areas to become hotbeds of disease, resulting, initially, in higher mortality rates there than in rural areas. This is no longer the case even in the urban areas of the world’s poorest countries.42 While the contribution of migration to total urban growth is smaller in today’s developing world than it was in industrializing Europe, this is primarily an effect of the much lower death rates found in urban areas today. This means that the rates of natural population growth in today’s urban populations are much higher. Absolute rates of migration throughout the developing world are now equal to or higher than they were in Europe during much of the period when it was industrializing. Also, although rural-urban migration clearly declined throughout the developing world between the 1960s and the 1990s, so did death rates. The result is that, with variations across countries and regions, rural-urban migration continues to contribute almost as much to urban population growth as does the natural increase in urban populations, while the reclassification of rural areas as urban areas contributes the most of all. See Jedwab, Christiaensen and Gindelsky (2017), especially figure 4.

150 2019 Rural Development Report Creating opportunities for rural youth
crucially on key elements of the structural transformation process. Rising incomes driven by the structural transformation lead women to change their behaviour in ways that reduce fertility. This is especially the case in urban areas, where the increased opportunity cost of time is more noticeable and there is a much greater degree of exposure to information, ideas and possibilities than in rural areas (although the digital revolution is changing this; see chapter 8). Stagnant income growth in rural areas, or at the lower ends of the income distribution in urban areas, can stymie income growth and slow the decline in fertility. Here, governments’ economic policies and investments in fundamental capabilities play a crucial role.
At the same time, income growth and urbanization can contribute to a shift in men’s attitudes and to broader changes in social norms that allow women to take more control over their lives in many spheres (Heath and Jayachandran, 2018). Increased agency among young women drives further declines in fertility, leads more women to invest in themselves through education and can lead more of them to reap the returns to education by entering the labour force. All these factors combine to create a virtuous cycle between demographic transition and the structural and rural transformation of the economy.
The demographic transition generates demographic dividends that can drive economic transformation and growth
The demographic transition and the structural and rural transformation processes are also bound up with one another as both cause and effect in what have come to be called the first and second demographic dividends. The first demographic dividend can be reaped during a window of opportunity that is opened up by the demographic transition. Once youth populations begin to decline relative to the rest of the population, countries enter a period during which each dependant (most of them are children at this point) is supported by more and more people who are working and creating wealth. Even if labour productivity were to remain stagnant (which is historically very unusual), this simple fact would drive increases in average incomes which would then fuel changes in the expenditure patterns that drive, to some extent, the structural and rural transformation of the economy. The faster the demographic transition, the higher the potential dividend that can be captured with the right investments.
The second demographic dividend can be far larger and longer lasting. It depends on two factors: the rise in savings levels as the relative size of the working population increases, and the investment of these savings in the fundamental capabilities of the country. If a country succeeds in doing this, then the temporary first demographic dividend can become a permanent and potentially self-sustaining increase in the rate of economic growth. Capturing these savings and investing them properly, however, depends on whether there is an enabling environment and a constructive relationship between the public and private sectors. The reader will recall, as discussed in chapter 2, that government effectiveness – a proxy measure of institutional quality – is much higher in more transformed and higher-income countries. So, while the first demographic dividend fuels some growth and some structural and rural transformation, the second is very dependent on those transformations. It can also be far larger and last much longer and can thus have a much more transformative impact on an economy and society.
The logic of a temporary window for capturing the demographic dividend is clear. Imagine a drop in mortality followed by a slow decline in fertility. Populations would expand rapidly. Eventually, fertility decline would catch up, but the age structure of the population would have grown a great deal younger, and the rapid growth of the

151Chapter 5 Capturing the demographic dividend for rural youth
total population would have put stress on infrastructure and perhaps on society that would be hard to cope with. The young age structure of the population would ensure many years of rapid population growth, even as fertility continued to decline. Unless the drop in fertility were to speed up dramatically, the demographic transition would unfold slowly: the size of the youth population relative to the total population would fall, but only haltingly, over decades. With an extended period of time during which there are relatively few workers to support each person who is not working, the first demographic dividend would emerge slowly and be quite small. Income growth would also be slow, meaning that people would not be able to ramp up their savings, and governments would have little ability to promote and capture what savings they could generate. The prospects for the potentially much larger, longer lasting and transformational second dividend would not be as bright. Thus, the speed of the demographic transition can have a very strong influence on the size of the demographic dividends and, consequently, on economic growth over the long run.
Sub-Saharan Africa is lagging behind in the demographic transition and risks missing the demographic dividendThe share of rural youth in the overall population is a good indicator of where a country stands in the demographic transition. The most transformed low- and middle-income countries have a smaller share of rural youth in their populations, and this share is expected to continue to shrink (see chapter 2). In contrast, the share of rural youth in the least transformed countries – 80 per cent of which are in Africa – is declining much more slowly owing to their persistently high fertility rates, especially – but not only – in rural areas. Thus, these countries need to act now to speed up their demographic transitions so that they can capture demographic dividends that will fuel their structural transformation.
Asia captured sizeable demographic dividends. Latin America had done so to a lesser extent
The first demographic dividend made a major contribution to growth in many countries of Asia and Latin America. That contribution was driven in part by supportive policies, although the types of policies that were used were very different in the two regions. The East Asian economic growth “miracle” is partially accounted for by trade openness, high savings rates, human capital accumulation in the areas of health and education, and macroeconomic policy, but rapid demographic change has also been a major factor (Bloom and Finlay, 2009). Declines in fertility and the resulting increase in the share of the working-age population triggered behavioural changes: more women entered the labour force, people saved more as life expectancy rose, and investment rose as well (Lee et al., 2000; Bloom et al., 2007; Bloom et al., 2009). This kind of demographic shift has fuelled a similar economic growth spurt in south-central Asian countries in more recent years (Bloom and Finlay, 2009).
Family planning programmes and investments in maternal and child health care have helped to drive the demographic transition in Latin America. Countries in this region appear to have underinvested in education, however, leaving them with a smaller demographic dividend than would have been possible. Furthermore, the economic policies in the region have neglected trade as an important engine of growth (Gribble and Bremner, 2012a; Mason, 2005).

152 2019 Rural Development Report Creating opportunities for rural youth
Africa’s current population structure differs dramatically from that of the rest of the developing world
The population pyramids for 2015 of low- and middle-income countries illustrate the regional contrasts to be observed in the stages of the fertility transition reached by the various regions (see figure 5.2). Despite gender differences in population structures, the pyramids reflect broadly consistent differentials between the rural and urban sectors. In APR and LAC, the population pyramids indicate the existence of low fertility rates, with smaller proportions of the population under age 25, particularly in the urban sector. Young men comprise 18 per cent of the rural population in LAC and 16 per cent in APR. Rural areas in both regions have higher fertility rates than urban areas. However, in APR, a bulge is evident in the urban population between the ages of 20 and 34, possibly as a result of rural-urban migration combined with steep past declines in urban fertility rates.
The population pyramids of APR and LAC contrast dramatically with that of SSA. The population of SSA in both the rural and urban sectors is young: 65 per cent of the rural male population is under the age of 25 and 19 per cent is between the ages of 15 and 24. In the Near East, North Africa and Europe (NEN), the rural male population in the 15-24 age group is the same relative size (19 per cent) as in SSA, but the lower average fertility rate in NEN is evident in the narrower base of its population pyramid as compared to that of SSA.
figure 5.2 Africa’s current population structure differs dramatically from that of the rest of the developing world
Note: APR: Asia and the Pacific; LAC: Latin America and the Caribbean; NEN: Near East, North Africa, Europe and Central Asia; SSA: sub-Saharan Africa. These figures depict the mean population pyramids for the countries in each region in 2015, by rural and urban sector.Source: United Nations Department of Economic and Social Affairs (UNDESA), Urban and rural population by age and sex; Stecklov and Menashe-Oren (2018).
Rural and urban populations, by age group and continent
Rural Urban Rural Urban
Rural Urban Rural Urban
15 10 10 1505 50 15 10 10 1505 50
Male
% %
LAC
0-45-9
10-1415-1920-2425-2930-3435-3940-4445-4950-5455-5960-6465-6970-7475-7980+
AgeNEN
0-45-9
10-1415-1920-2425-2930-3435-3940-4445-4950-5455-5960-6465-6970-7475-7980+
Age Male FemaleMale Female
SSA
0-45-9
10-1415-1920-2425-2930-3435-3940-4445-4950-5455-5960-6465-6970-7475-7980+
Age
% %15 10 10 1505 50 15 10 10 1505 50
Male FemaleAPR
0-45-9
10-1415-1920-2425-2930-3435-3940-4445-4950-5455-5960-6465-6970-7475-7980+
Age Female

153Chapter 5 Capturing the demographic dividend for rural youth
box 5.1 The Republic of Korea’s path to a demographic dividend
The countries commonly referred to as the “Asian Tigers” have long been known for the rapid transition that they made from agriculture-based to technology-based economies. The Republic of Korea was particularly successful in capitalizing on its demographic dividend. With an annual growth rate in GDP per capita of 6.7 per cent between 1960 and 1990, it is an exceptional example of an aid recipient that turned into a high-income country. And with gross national income (GNI) per capita soaring from US$67 in the early 1950s to US$22,670 in 2012 (World Bank, 2018b), the country made a rapid transition from high to low fertility rates. The Republic of Korea’s success was made possible by the fact that it addressed population issues while also investing in reproductive health programmes and education and while pursuing economic policies designed to create infrastructure, attract foreign investment, promote exports of locally manufactured goods and set a minimum wage to help raise living standards (Gribble and Bremner, 2012b). Together, these orchestrated policies laid a solid foundation for a demographic dividend.
As a result, the country’s total fertility rate dropped from 5.4 children per woman in 1950 to 2.9 in 1975 and to 1.2 in 2005 (UNDESA, 2011). Although family planning was already being promoted in the 1960s, the larger reductions in fertility were attributable to home visits conducted by field workers – a more effective strategy for reaching women than clinic-based services. In 1950, 42 per cent of the Republic of Korea’s population was under the age of 15 and the working-age population represented 55 per cent of the total population; by 2010, its population structure was radically different, with children under the age of 15 representing only 16 per cent and the working-age population representing 74 per cent of the population (Mason, 1997).
figure 5.3 Demographic pyramid of the Republic of Korea: 1960, 1985 and 2017
Source: United Nations Department of Economic and Social Affairs (UNDESA) population data: https://www.populationpyramid.net/.
Investments in improved health infrastructure and increases in the number of health-care providers and facilities per capita, along with greater access to health care through government-sponsored insurance programmes, further spurred the expansion of economic opportunities. By 2010, the Republic Korea had a life expectancy of 81 years and an infant mortality rate of 4 per 1,000 live births (UNDESA, 2011), with both of those indicators being among the best in the world.
Furthermore, in the 1950s and 1960s, the country’s educational strategy changed from an emphasis on compulsory primary education to “production-oriented” education that focused on the knowledge and skills needed for economic development. Thanks to the shift in focus and an increased commitment to education, among other factors, by 1990, 97 per cent of school-age children were attending school (Mason, 1997). The smaller number of children attending school (thanks to a drop in the country’s total fertility rate), the rise in disposable income at the household level and sustained investment in education contributed to the emergence of a better-educated population, and that population, in the form of a skilled labour force, contributed to rapid economic development.
20171960
0-45-9
10-1415-1920-2425-2930-3435-3940-4445-4950-5455-5960-6465-6970-7475-79
1985
0-45-9
10-1415-1920-2425-2930-3435-3940-4445-4950-5455-5960-6465-6970-7475-79
80-84 80-84
Male Female
Male Female
8 04 40 8 8 04 40 88 804 40
0-45-9
10-1415-1920-2425-2930-3435-3940-4445-4950-5455-5960-6465-6970-7475-7980-8485-8990-9495-99100+
AgeMale Female
75-79
85-8990-9495-99100+
AgeMale Female
85-8990-9495-99100+
Age

154 2019 Rural Development Report Creating opportunities for rural youth
Africa’s high fertility rate is not confined to remote rural areasAfrica’s mortality rates have come down, but fertility remains higher than in other regions. figure 5.4 gives the age-specific fertility rates by region and along the rural-urban gradient. Women in SSA have higher fertility rates than in other regions in all age groups (including women over the age of 25) and all sectors aside from young women in big cities. In all regions, fertility is highest in rural areas and declines with population density but, in SSA, fertility also remains relatively high in small towns and cities and does not decline to the same extent in major cities as it does in other regions. As a result, the share of children and adolescents in the population of countries in SSA has remained high and per capita income growth is slow.
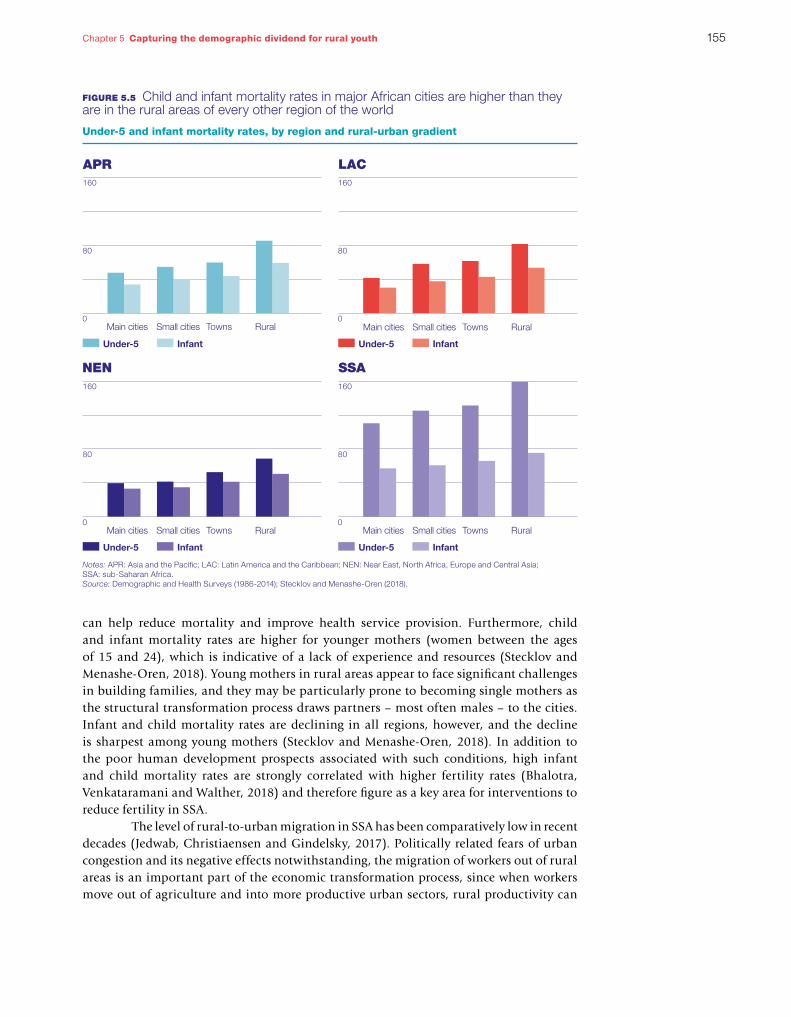
One reason for the persistently high fertility rates in SSA is that the region has the highest under-5 and infant mortality rates in the world (see figure 5.5). In rural areas, 150 out of every 1,000 children do not survive to their fifth birthday. While the rate in the main cities of SSA is still high in global terms, it is significantly lower than in small towns and the rural hinterland. The under-5 mortality rate is sensitive to particular types of health investments that have an impact on children after the first year of life. Life in urban areas appears to be more beneficial for children in part because they enjoy access to better health care and primary health services. Thus, despite the fact that slums and overcrowding are more common in cities, under-5 and infant mortality rates are lower in cities than in rural areas (Fink, Günther and Hill, 2014). Investments in rural infrastructure
figure 5.4 Africa’s high fertility rates are not confined to remote rural areas
Notes: Each age specific rate presented in the figure represents the number of births expected by a woman in that age group over the course of one year. Women spend 5 years in each age group so that the Total Fertility Rate (TFR) is calculate by the sum of the multiplication of each of the age specific rates by a factor of five. SSA: sub-Saharan Africa; NEN: Near East, North Africa, Europe and Central Asia; APR: Asia and the Pacific; LAC: Latin America and the Caribbean. Source: Demographic and Health Surveys (DHS); Stecklov and Menashe-Oren (2018).
Main cities Small cities
Age-speci�c fertility rates, by sector and region, 1986-2014
Age
-spe
ci�c
fert
ility
rate
Age
-spe
ci�c
fert
ility
rate
Age group Age group
Towns Rural
APR LAC NEN SSA
Age
-spe
ci�c
fert
ility
rate
Age
-spe
ci�c
fert
ility
rate
Age group Age group
0,0
0.1
0.2
0.3
0.0
0.1
0.2
0.3
0.0
0.1
0.2
0.3
45-4940-4435-3930-3425-2920-2415-19
45-4940-4435-3930-3425-2920-2415-19
0.0
0.1
0.2
0.3
45-4940-4435-3930-3425-2920-2415-19
45-4940-4435-3930-3425-2920-2415-19
155Chapter 5 Capturing the demographic dividend for rural youth
can help reduce mortality and improve health service provision. Furthermore, child and infant mortality rates are higher for younger mothers (women between the ages of 15 and 24), which is indicative of a lack of experience and resources (Stecklov and Menashe-Oren, 2018). Young mothers in rural areas appear to face significant challenges in building families, and they may be particularly prone to becoming single mothers as the structural transformation process draws partners – most often males – to the cities. Infant and child mortality rates are declining in all regions, however, and the decline is sharpest among young mothers (Stecklov and Menashe-Oren, 2018). In addition to the poor human development prospects associated with such conditions, high infant and child mortality rates are strongly correlated with higher fertility rates (Bhalotra, Venkataramani and Walther, 2018) and therefore figure as a key area for interventions to reduce fertility in SSA.
The level of rural-to-urban migration in SSA has been comparatively low in recent decades (Jedwab, Christiaensen and Gindelsky, 2017). Politically related fears of urban congestion and its negative effects notwithstanding, the migration of workers out of rural areas is an important part of the economic transformation process, since when workers move out of agriculture and into more productive urban sectors, rural productivity can
figure 5.5 Child and infant mortality rates in major African cities are higher than they are in the rural areas of every other region of the world
Notes: APR: Asia and the Pacific; LAC: Latin America and the Caribbean; NEN: Near East, North Africa, Europe and Central Asia; SSA: sub-Saharan Africa. Source: Demographic and Health Surveys (1986-2014); Stecklov and Menashe-Oren (2018).
Under-5 Infant Under-5 Infant
Under-5 Infant Under-5 Infant
RuralTownsSmall citiesMain cities
RuralTownsSmall citiesMain cities RuralTownsSmall citiesMain cities
RuralTownsSmall citiesMain cities0 0
0 0
80
160
80
160
80
160
80
160
Under-5 and infant mortality rates, by region and rural-urban gradient
SSA
APR
NEN
LAC

156 2019 Rural Development Report Creating opportunities for rural youth
increase (Harris and Todaro, 1970). If the number of people leaving the rural sector is small relative to the rural population, then the growth of per capita income will be slow (de Brauw, Mueller and Lee, 2014). High urban and rural fertility rates combined with low rural-urban migration rates are associated with congested cities and low productivity in both rural and urban sectors, which impedes rural and structural transformations (Fay and Opal, 2000).
The rising rural population in SSA is, however, expected to lead to an increase in the demographically driven rural-urban migration of young people. figure 5.6 shows the projected rural-urban migration rates for young people and adults, by region, based on population projections. In comparison to other regions, migration rates in SSA have been relatively low. Given its demographic structure, however, SSA is the only region where youth are more likely to move from rural to urban areas than adults are and at an increasing rate. However, the migration rates as such fail to reflect the fact that the number of people in rural areas is still growing, with the result that, in absolute terms, more young people are projected to migrate within SSA than in other regions of the world.
Young men in SSA are more likely to migrate to urban areas than young women, resulting in what is referred to in the literature as “feminized” rural areas (Menashe-Oren and Stecklov, 2017). The difference between urban and rural sex ratios is higher in SSA than in other low- and middle-income countries (see figure 5.7), with many more
figure 5.6 Rural-to-urban migration rates of young people and adults, by region, projected to 2050
Notes: Produced using locally weighted scatterplot smoothing (LOWESS) methods.Source: Arslan, Egger and Winters (2018), based on United Nations Department of Economic and Social Affairs (UNDESA), Urban and rural population by age and sex.
Rural to urban migration rate of youth and adults by region, 1985-2050
Youth migration rate Adult migration rate
World
Mig
ratio
n ra
te
Year
0.1
0.2
0.4
0.3
1985 2005 2025 2045
SSA
Mig
ratio
n ra
te
Year
0.1
0.2
0.4
0.3
1985 2005 2025 2045
APR
Mig
ratio
n ra
te
Year
0.1
0.2
0.4
0.3
1985 2005 2025 2045
LAC
Mig
ratio
n ra
te
Year
0.1
0.2
0.4
0.3
1985 2005 2025 2045
NENM
igra
tion
rate
0.1
0.2
0.4
0.3
Year
1985 2005 2025 2045

157Chapter 5 Capturing the demographic dividend for rural youth
men beyond the age of 15 living in urban areas.43 These imbalances in rural and urban sex ratios have implications for job creation policies and investments. The demographic dividend cannot be fully captured if women are not incorporated into the labour force or are relegated to low-productivity activities. Another implication of rural poverty is that people in those areas will not be saving and contributing to a second demographic dividend unless conditions are altered. If sex ratios remain unbalanced, the demographic shift may entail increasingly gendered poverty in the rural sector.
Missing the dividend could have enormous negative long-term consequences for rural development in Africa – and for the economic future of (rural) youth
Low levels of rural and structural transformation, combined with stubbornly high fertility rates, limit Africa’s ability to invest in the dividend. For rural youth, this translates into limited prospects for employment and income growth. Ethnically fractionalized rural areas with limited resources may face social unrest as a result of the circumstances associated with rural youth bulges in the population pyramid (Stecklov and Menashe-Oren, 2018). And the stakes for Africa’s youth are high. Because the transition is particularly slow in rural areas, rural youth face the greatest challenges, but the right investments in rural areas could also yield the highest pay-offs.
In urban areas, the youth bulge triggers fears of social unrest, crime and violence if young people cannot find employment (Cincotta, Engelman and Anastasion, 2003; Goldstone, 2002; Mesquida and Wiener, 1999; Urdal, 2004 and 2008). As rural-urban youth migration increases in the context of conflict-affected rural areas, the challenges faced in urban areas could be exacerbated if more rural youth, especially young men, migrate to the cities. So far, however, the anticipated impact in terms of social unrest has not materialized (Menashe-Oren, 2017).
43 The sex ratio is the ratio of males to females in a population; globally, it is estimated at 1.05 males to females at birth.
figure 5.7 Young men in SSA are more likely to migrate to urban areas than young women, resulting in “feminized” rural areas
Note: The figure depicts rural and urban sex ratios (male over female), by age group, in SSA compared to those for all least developed countries (LDCs), based on population data for 2015.Source: United Nations Department of Economic and Social Affairs (UNDESA), Urban and rural population by age and sex; Stecklov and Menashe-Oren (2018).
Rural and urban sex ratios, by age group
Sex
rat
ios
AgeLDCs Urban LDCs Rural SSA Urban SSA Rural
302520151050 35 40 45 50 55 60+0.8
1.0
1.1
0.9

158 2019 Rural Development Report Creating opportunities for rural youth
Countries in other regions have an opportunity to increase the first dividend and prepare for a second oneSome regions and countries have already gone through the demographic transition that yields the first demographic dividend but did not make the investments needed to reap its full benefits. For example, in the Near East and North Africa (NENA), the population structure is such that a large proportion of young people have just reached working age or will reach that age in the next few years, which will lower the dependency ratio (see figure 5.2). However, a larger share of these young people are neither working nor in education than in other regions of the world (ILO, 2018). If those young people could be engaged in productive employment, then the NENA region could reap a demographic dividend. Missing this opportunity may slow down its structural and rural transformation processes while at the same time increasing the risk posed by a large proportion of the population being made up of frustrated young people in a highly fragile region where conflict is already present (Kabbani, 2018).
Within countries, the demographic transition proceeds at different paces. For example, in a large country such as India, some states have already attained low fertility rates and are enjoying the fruits of the first demographic dividend. Their socio-economic outcomes are thus demonstrably better than in those states that have persistently high fertility rates (Haub, 2009). Within most developing countries, rural areas lag behind in the demographic transition. In order for a youth-inclusive rural transformation process to become a reality, the demographic transition in rural areas has to be stepped up.
Countries have to prepare for the second dividendWhile the first demographic dividend is transitory due to a discrete period of low dependency ratios, the second demographic dividend, which stems from low fertility rates and longer life expectancies that induce asset accumulation, may take the form of permanently higher levels of income (Stecklov and Menashe-Oren, 2018; Mason and Lee, 2006). The realization of this second dividend is enabled by policies that encourage the emergence of stable, efficient financial markets and by regulatory and legislative structures that encourage higher rates of savings among working-age populations (Mason, 2005; Mason et al., 2017). Because of its potential long-term impact, the second demographic dividend may be leveraged even more effectively by investments in the rural areas that are lagging behind the most.
Investments are needed in two areas in order to capture the second dividend. One is the expansion and improvement of the human capital of young populations. A larger working-age population with more and better skills increases productivity and drives up per capita incomes, eventually leading to higher saving rates for a larger share of the population (Loayza, Schimdt-Hebbel and Servén, 2000; Ahmed et al., 2016). Human capital investments include investments in education and health, which together lead to a higher life expectancy and incentivize people to save for their old age. Such investments can also increase the first demographic dividend. The other area is investment in stable and well-functioning institutions to incentivise savings. Because saving assumes trust in long-run economic stability, both financial markets and government economic policies have to be stable and trustworthy (Dupas et al., 2012). Rent-seeking and corruption can drain away the savings generated in rural economies (Bloom, Kuhn and Prettner, 2017). Changing institutions takes time and thus requires far-sighted investments.

159Chapter 5 Capturing the demographic dividend for rural youth
Effective investments for reaping the demographic dividend(s) prioritize rural youth – especially young rural womenRural youth play a crucial role in a region’s ability to reap the demographic dividend(s) for two reasons. First, rural areas in all regions – even in more transformed economies – lag behind in the demographic transition. Speeding up their transition will significantly increase the first dividend and improve prospects for a second one. Second, as young people join the working-age population, they automatically increase the first dividend – if they work. If they do not work or do so in low-productivity activities, then the dividend may remain small. Countries whose populations contain a very large share of young people – most of which are in SSA – will see that even a small increase in youth productivity translates into large productivity gains (Stecklov and Menashe-Oren, 2018).
Because rural areas lag behind in the demographic transition, investments in these areas will have the largest impact
The first step in speeding up the demographic transition in rural areas is to reduce fertility. This can be achieved by reducing child and infant mortality, especially in SSA, through the provision of better and more widely available health-care facilities. The introduction of antibiotics in the United States in 1937 led to a dramatic decline in child mortality and a significant reduction in fertility (Bhalotra, Venkataramani and Walther, 2018). Evidence from South Africa shows that the removal of user fees for maternal and child health care reduced fertility and improved children’s educational outcomes (Ito and Tanaka 2018). Contraception is a necessary component of successful family planning, yet contraceptives are not widely (or easily) available in many countries (Bradley et al. 2012). While family planning tools and reproductive health education should be made more accessible in rural areas, their accessibility alone will not change social norms about family size (Miller, 2010; Casterline and Agyei-Mensah, 2017). Enrolling rural girls in school, facilitating their continued attendance and bringing young rural women into the workforce can substantially reduce fertility (Martin, 1995; Bongaarts, 2010; Keats, 2014; Cannonier and Mocan, 2014; Lavy and Zablotsky, 2011).
Investments aimed at increasing rural productivity cannot ignore differences in age and sex structures along the rural-urban gradient. If, as in SSA, for example, relatively more women remain in rural areas due to male out-migration, their productive engagement in the rural economy may require different types of interventions than would be effective in a male-dominated labour force. Agricultural extension or training programmes have to be adjusted in line with the specific constraints and needs of female farmers, which may vary by age group as well (Quisumbing et al., 2014). Unbalanced sex ratios across rural and urban areas may also increase the time burden for women who work and continue to shoulder most domestic duties. Therefore, improving the supply of basic time-saving services in rural areas or extending care services or other types of family support to less connected areas can help reduce this burden (Stecklov and Menashe-Oren, 2018; see also chapter 3).
Fundamental capabilities must be strengthenedThe fundamental capabilities of a country are its human capital, strong and competitive markets, high-quality physical infrastructure such as roads, electricity and water distribution systems, and the policies and regulatory structures that make these possible. Physical infrastructure improvements enhance market connectivity and thus

160 2019 Rural Development Report Creating opportunities for rural youth
the productivity of rural economies and their ability to drive the structural and rural transformation processes and create more opportunities for rural youth. Simulations indicate that, unless large sectors of the youth population are able to find jobs, the demographic transition may not yield a dividend, especially in SSA (Drummond, Thakoor and Yu, 2014).
To avoid missing out on the dividend, investment in the human capital of rural youth must dramatically increase and be made more effective. Learning outcomes must improve, especially in less transformed countries and in less densely populated areas. Making education more accessible will be of critical importance in boosting young workers’ productivity and facilitating their transition into higher-value-added sectors. Especially in SSA, simulations show that higher educational levels would have a significant positive effect on the size of the demographic dividend (Drummond, Thakoor and Yu, 2014). In order for it to have such marked productivity-enhancing effects, however, education has to go beyond basic technical skills and encompass the non-cognitive skills needed for successful youth employment as well (Fox, 2018).
More fully incorporating young women into the workforce will speed up the demographic transition and substantially increase the demographic dividend
Young women’s participation in the labour force has a fertility-reducing effect which will help to speed up the demographic transition. Delayed marriage, delayed first childbirth and wider birth spacing all reduce fertility. Evidence shows that the provision of more schooling to young women (Osili and Long, 2008; Lavy and Zablotsky, 2011; Keats, 2018) and their inclusion in the labour force (Jensen, 2012; Sivansankaran, 2014; Heath and Mobarak, 2015) significantly reduce fertility through these channels.
Reducing the constraints on productive participation by young rural women in rural economies will improve their livelihoods and contribute to more productive rural economies (Doss et al., 2018). While more transformed countries have been able to close the gender gap in educational attainment, less transformed countries still leave girls and young women at a disadvantage in terms of human capital accumulation (see chapter 3). These types of exclusion will hinder their efforts to reap the full potential of the demographic dividend. The dividend may be further reduced if demand-side discrimination as well as societal norms restrict young rural women’s participation in the labour force (Desai, 2010; Stecklov and Menashe-Oren, 2018). This is the case even in more transformed countries, where the educational attainment of young women does not lag behind that of young men (Doss et al., 2018) but participation in the workforce does. Investments should connect young rural women to markets and social networks in order to increase their participation and productivity and empower them to gain agency and control over their life choices, especially regarding the ages at which they marry and have their first child.
Governments should improve and expand institutions and financial markets in anticipation of the second demographic dividend
Countries whose populations have already transitioned need to give priority to putting the kinds of financial institutions in place that will help them to achieve and prolong the second demographic dividend. Countries at earlier stages in the demographic transition should place priority on investments in human capital that increase the first demographic dividend and also future returns. To realize the second demographic dividend, the

161Chapter 5 Capturing the demographic dividend for rural youth
working population has to be encouraged to save. One important incentive for saving for retirement is if people are not relying on their children or the government to support them. Pension systems that rely on the pay-as-you-go approach (paying current retirement benefits by taxing the current generation) may be counterproductive as they do not increase savings rates (Mason and Lee, 2006; Samwick, 2000), whereas mandatory fully funded pension systems can raise private savings rates significantly, depending on how they are introduced. Tax incentives for private savers do not seem to be effective (Loayza, Schimdt-Hebbel and Servén, 2000). Any such policy will be successful only if people are not afraid that their savings could be lost to corrupt or unstable governments, which poses a challenge in fragile situations.
For rural households to raise their savings levels, market connections have to be improved. Without these connections, farmers have little incentive to invest in order to improve their productivity. Rural areas are often subject to market failures and the consequent mistrust in institutions, especially in the least transformed countries. Evidence from rural Kenya shows that, owing to such a lack of trust, neither uptake nor savings levels increased after potential users were provided with access to savings instruments (Dupas et al., 2012). However, a meta-analysis of 27 studies in SSA found that savings promotion programmes had a strong positive effect on total savings rates and fostered pro-savings attitudes, which indicates that supply-enhancing programmes are more effective than demand-driven ones, such as financial education programmes (Steinert et al., 2018). These results suggest that, in order for programmes to be successful, people have to trust the implementing organizations and institutions. Incorporating rural youth into such programmes, especially by harnessing the potential of ICTs in facilitating access to financial and savings instruments (see chapter 8), is therefore of critical importance in ensuring the realization of both the first and the second demographic dividends.

162 2019 Rural Development Report Creating opportunities for rural youth
SpoTlighT Rural youth mobility
Migration forms part of the livelihood choices that
are particular to (rural) youth in their transition into
adulthood. People between the ages of 15 and 24 are going
through an important phase of life in which they, either
on their own or with their families, make critical decisions
about their future that will have a strong impact on their life
course. These decisions involve such matters as education,
employment and family planning. All of these questions
entail a choice as to the place where they will put those
decisions into effect, which in turn raises the possibility of
migrating to another village or city or to a foreign country
(de Brauw, Mueller and Lee, 2018; Crivello, 2011). Secondary
schooling is in many cases available only in larger towns
and cities, so if rural youth want to further their education,
they need to move (Litchfield, 2018; Gavonel, 2017). Seeking
employment can often be a reason for youth migration,
especially if the availability of land is limited and off-farm
opportunities in rural areas are lacking (Kosec et al., 2017;
Yeboah et al., 2018). Family reunification and marriage also
constitute important reasons for migrating, especially for
young rural women. In India, two thirds of all women have
migrated for the purpose of marriage, which amounts to
approximately 20 million women moving each year (Fulford,
2013). In all of these cases, constraints in terms of agency
that are specific to youth and to women, in particular,
become evident and shape these migration decisions
and outcomes.
Rural youth are more likely to migrate to urban areas
than adults in sub-Saharan Africa. Rural-urban migration
is an important part of a country’s structural transformation
process (FAO, 2018). Countries that underwent a rapid
transformation in the past experienced a similarly steep
increase in the migration rate during that transformation;
projections indicate that the same pattern can be expected
to emerge in the slow transformers in the coming decades,
which points to some degree of convergence (Arslan, Egger
and Winters, 2018). This expected upswing in rural-to-urban
migration is likely to be marked by a youth migration rate that
outpaces the adult migration rates seen in slow-transforming
countries so far, most of which are in sub-Saharan Africa
(see figure 5.6). The nature of these trends will depend
heavily on how fast the demographic transition takes place.
In the case of international migration, youth are not the
most likely to migrate, but the probability that they will
do so is greater in lower-income countries. The median
age of international migrants from developing countries
is 34, but from the least developed countries it is only 29.
Thus, young people do not make up the largest share of
international migrants, but youth migration becomes more
likely in lower-income countries. In these countries, women
are also slightly less likely to make an international move
than men (UNDESA, 2017).
Dynamics of change as potential drivers of rural youth migrationThe rural transformation process decreases the
distances between rural and urban areas, and
particularly between rural areas and small towns,
allowing for more connectivity and access to more
off-farm employment opportunities. In this context,
migration becomes a more fluid form of mobility involving
more seasonal, circular and thus temporary moves. This
type of migration offers an opportunity to diversify income
sources in situations of economic stress, to adapt to
weather variations and external shocks and to raise average
household income levels. Rural and secondary towns
have been shown to mediate the flow of inputs, goods
and services between rural hinterlands and larger urban
centres, thereby generating accessible non-farm forms
of employment for rural people (Haggblade, Hazell, and
Reardon, 2007). This contributes to poverty reduction and to
positive spillovers from urban centres through consumption
linkages, urban-rural remittances and upward pressure on
agricultural wages (Lanjouw and Murgai, 2009; Cali and
Menon, 2013). Rural diversification and secondary town
expansion have been found to have yielded, on average,
faster reductions in poverty and more inclusive growth
patterns than metropolitization did in Tanzania and India,
respectively (Christiaensen, De Weerdt and Todo, 2013;
Gibson et al., 2017). As the transformation of agrifood
systems proceeds, mobility is expected to play an important
part in the livelihood choices of rural youth.
The digital revolution is expected to influence
rural youth aspirations and associated migration
intentions. Global evidence on international migration
intentions covering the period from 2010 to 2015 indicates
that migration intentions are highest among young people,
although those intentions are not necessarily realized
(Mendola, 2018). The digital revolution has made much
more and better information available and has lowered the
opportunity costs of leaving known social and economic
networks behind. Mobile money transfers reduce transaction

163
costs and thus can broaden the scope of the gains realized
from migration to include the household and communities of
origin (see spotlight entitled “Remittances”).
Climate change is expected to further amplify
migration trends. Rigaud et al. (2018) estimate that, by
2050, slow-onset impacts of climate change will have forced
around 143 million people to have moved to other locations
within their countries if no action is taken to counteract
this phenomenon. The evidence that weather variability is
a main driver of migration, especially from agriculturally
dependent countries or areas, is rapidly mounting (Missirian
and Schlenker, 2017; Cattaneo and Peri, 2016; Cai et al.,
2016; Barrios et al., 2006; Jessoe, Manning and Taylor, 2018;
Mastrorillo et al., 2016; Dallmann and Millock, 2017). These
are the same countries in which the rural youth population
is also the largest in relative terms, making climate-related
migration pressures particularly relevant for this segment of
the population (see chapter 7). An analysis of eight countries
in Central America found that young people are more likely
to migrate than adults in response to natural disasters,
especially droughts (Báez et al. 2016). Furthermore, such
weather shocks have been identified as robust drivers of
the onset of conflicts and as potential triggers for migration
(Hsiang, Burke and Miguel, 2013; Burke at al., 2010;
O’Laughlin et al., 2012; Tol and Wagner, 2010; Raleigh and
Urdal, 2007).
Investment in rural development can make migration a choice rather than a necessity for rural youthRural development that fosters productive and well-
connected rural markets can improve opportunities for rural
youth. For rural youth to navigate the opportunities that
arise, they need access to information and the skills required
to identify feasible mobility options. Targeted investments
that address the constraints that hinder rural youth from
engaging productively in rural economies have the potential
to make rural youth out-migration a choice rather than
a necessity (FAO, 2018). In the case of climate-related
threats specifically, policymakers need to assess whether
rural areas face unavoidable risks that call for safe and
orderly migration management or whether the risks can be
addressed by means of investments in adaptation, resilience
and mitigation (Rigaud et al., 2018). For public policies to
enhance the positive developmental impacts of migration
and reduce its negative effects on rural communities, the
interrelationships between public policies and migration
decisions and outcomes need to be assessed throughout
the policy design process (OECD, 2017). Embedding
migration in broader rural development strategies will be of
key importance in making mobility a viable option for rural
youth who are striving to become productive, connected and
empowered.
Chapter 5 Capturing the demographic dividend for rural youth

164 2019 Rural Development Report Creating opportunities for rural youth
References
Ahmed, S. A., Cruz, M., Go, D. S., Maliszewska, M. and Osorio-Rodarte, I. 2016. How Significant Is Sub-Saharan Africa’s Demographic Dividend for Its Future Growth and Poverty Reduction? Review of Development Economics, 20 (4): 762-793.
Arslan, A., Egger, E.M., Winters, P. 2018. Migration, Demography, and Agri-Food Systems: Challenges and opportunities. In: Agriculture and Food Systems to 2050 – Global trends, challenges and opportunities, pp: 87-135. Serraj, R. and Pingali, P. (eds.). World Scientific Publishing Co. Pte. Ltd.
Báez, J. E., Lucchetti, L., Genoni, M.E. and Salazar, M. 2016. Gone with the Storm: Rainfall shocks and household well-being in Guatemala. Journal of Development Studies, 53 (8): 1253-1271 (available at: http://dx.doi.org/10.1080/00220388.2016.1224853).
Barrios, S., Bertinelli, L. and Strobl, E. 2006. Climatic Change and Rural–Urban Migration: The case of sub-Saharan Africa. Journal of Urban Economics, 60 (3): 357-371.
Barsbai T., Steinmayr, A., Yang, D., Tiongson, E. and Licuanan, V. 2017. Harnessing the Development Benefits of International Migration: A randomized evaluation of enhanced pre departure orientation seminars for migrants from the Philippines. IFW Kiel Institute for the World Economy.
Becker, G. S. and Lewis, H. G. 1973. On the Interaction between the Quantity and Quality of Children. Journal of Political Economy, 81 (2): S279-S288.
Bhalotra, S., Venkataramani, A. and Walther, S. 2018. Fertility and Labor Market Responses to Reductions in Mortality (mimeo), August.
Bloom, D. E., Canning, D. and Sevilla, J. 2003. The Demographic Dividend. Rand.
Bloom, D.E., Canning, D., Fink, G. and Finlay, J. 2009. Fertility, Female Labor Force Participation, and the Demographic Dividend. Journal of Economic Growth, 14: 79-101.
Bloom, D.E., Canning, D., Mansfield, R.K. and Moore, M. 2007. Demographic Change, Social Security Systems, and Savings. Journal of Monetary Economics, 54: 92-114.
Bloom, D.E. and Finlay, J. 2009. Demographic Change and Economic Growth in Asia. Asian Economic Policy Review, 4: 45-64.
Bloom, D.E., Kuhn, M. and Prettner, K. 2017. Africa’s Prospects for Enjoying a Demographic Dividend. Journal of Demographic Economics, 83 (1): 63-76.
Bradley, S.E.K., Croft, T.N., Fishel, J.D. and Westoff, C.F. 2012. Revising Unmet Need for Family Planning. DHS Analytical Studies No. 25, Calverton, MD: ICF International.
Bongaarts, J. 2010. The Causes of Educational Differences in Fertility in Sub-Saharan Africa. Vienna Yearbook of Population Research 2010: 31-50.
Burke, M.B., Miguel, E., Satyanath, S., Dykema, J.A. and Lobell, D. B. 2010. Reply to Sutton et al.: Relationship between temperature and conflict is robust. Proceedings of the National Academy of Sciences, 107 (25): E103-E103.
Cai, R., Feng, S., Oppenheimer, M. and Pytlikova, M. 2016. Climate Variability and International Migration: The importance of the agricultural linkage. Journal of Environmental Economics and Management, 79 (I): 135-151.
Cali, M. and Menon, C. 2013. Does urbanization Affect Rural Poverty? Evidence from Indian districts. Policy Research Working Paper No. 6338, World Bank.
Cannonier, C. and Mocan, N. 2014. Empowering Women Through Education: Evidence from Sierra Leone (mimeo).
Casterline, J. B. and Agyei-Mensah, S. 2017. Fertility Desires and the Course of Fertility Decline in Sub-Saharan Africa. Population and Development Review, 43 (2008): 84-111 (available at: doi:10.1111/padr.12030).
Cattaneo, C and Peri, G. 2016. The Migration Response to Increasing Temperatures. Journal of Development Economics, 122 (C): 127-146.
Christiaensen, L., De Weerdt, J., and Todo, Y. 2013. Urbanization and Poverty Reduction: The role of rural diversification and secondary towns. Agricultural Economics, 44 (4-5): 435-447.
Cincotta, R., Engelman, R. and Anastasion, D. 2003. The Security Demographic: Population and civil conflict after the Cold War. Washington, D.C.: Population Action International.
Clemens, M.A. and Postel, H.M. 2018. Deterring Emigration with Foreign Aid: An overview of evidence from low-income countries. CGD Policy Paper 119. Washington, D.C.: Center for Global Development.
Clemens, M.A. and Postel, H.M. 2017. Temporary Work Visas as US-Haiti Development Cooperation: A preliminary impact evaluation, IZA Journal of Labor & Development, 6: 4.

165Chapter 5 Capturing the demographic dividend for rural youth
Crivello, G.2011. Becoming Somebody: Youth transitions through education and migration in Peru. Journal of Youth Studies, 14 (4): 395-411.
Dallmann, I. and Millock, K. 2017. Climate Variability and Inter-State Migration in India. CESifo Economic Studies, 63 (4): 560-594 (available at: https://doi.org/10.1093/cesifo/ifx014).
De Brauw, A. 2018. Rural Youth: Determinants of migration throughout the world, Background paper for the Rural Development Report 2018. Rome: IFAD.
De Brauw, A., Mueller, V. and Lee, H. L. 2014. The Role of Rural-Urban Migration in the Structural Transformation of Sub-Saharan Africa. World Development, 63: 33-42 (available at: doi:10.1016/j.worlddev.2013.10.013).
De la Croix, D. and Gobbi, P.E. 2017. Population Density, Fertility, and Demographic Convergence in Developing Countries. Journal of Development Economics, 127: 13-24.
Desai, S. 2010. The Other Half of the Demographic Dividend. Economic and Political Weekly, 45 (40): 12-14.
Doss, C., Heckert, J., Myers, E., Pereira, A. and Quisumbing, A. 2018. Gender, Rural Youth, and Structural Transformation. Background paper for the Rural Development Report 2019. Rome: IFAD.
Drummond, M. P., Thakoor, V. and Yu, S. 2014. Africa Rising: Harnessing the demographic dividend. International Monetary Fund (IMF).
Dupas, P. and Robinson, J. 2013. Savings Constraints and Microenterprise Development: Evidence from a field experiment in Kenya. American Economic Journal: Applied Economics, 5 (1): 163-192.
Dupas, P., Green, S., Keats, A. and Robinson, J. 2012. Challenges in Banking the Rural Poor: Evidence from Kenya’s Western Province, NBER Working Paper 17851. National Bureau of Economic Research.
Dyson, T. 2011. The Role of the Demographic Transition in the Process of Urbanization. Population and Development Review, 37 (Suppl 1): 34-54.
FAO (Food and Agriculture Organization of the United Nations). 2018. The State of Food and Agriculture 2018. Migration and rural development. Rome: FAO.
Fay, M. and Opal, C. 2000. Urbanization Without Growth: A not so uncommon phenomenon. World Bank, Policy Research Working Paper No. 2412.
Fink, G., Günther, I. and Hill, K. 2014. Slum Residence and Child Health in Developing Countries. Demography, 51 (4): 1175-1197 (available at: doi:10.1007/s13524-014-0302-0).
Fox, L. 2018. Economic Participation of Rural Youth: What matters? Background paper for the Rural Development Report 2019. Rome: IFAD.
Fulford, S. 2013. The Puzzle of Marriage Migration in India, Working Paper 820, Boston College.
Gamso, J. and Yuldashev, F. 2018. Does Rural Development Aid Reduce International Migration? World Development, 110: 268-282.
Gastner M.T. and Newman, M.E.J. 2004. From The Cover: Diffusion-based method for producing density-equalizing maps. Proceedings of the National Academy of Sciences (available at: doi:10.1073/pnas.0400280101).
Gavonel, M.F. 2017. Patterns and Drivers of Internal Migration Among Youth in Ethiopia, India, Peru and Vietnam, Working Paper 169, Young Lives Project, Oxford, UK: University of Oxford.
Gibson, J., Datt, G., Murgai, R. and Ravallion, M. 2017. For India’s Rural Poor, Growing Towns Matter More than Growing Cities. World Development, 98: 413-429.
Goldstone, J. A. 2002. Population and Security: How demographic change can lead to violent conflict. Journal of International Affairs, 56 (1): 3-22.
Gollin, D., Jedwab, R. and Vollrath, D. 2016. Urbanization With and Without Industrialization. Journal of Economic Growth, 21(1): 35-70 (available at: doi:10.1007/s10887-015-9121-4).
Gribble, J.N. and Bremner, J. 2012a. Achieving a Demographic Dividend. Population Bulletin, 67 (2).
Gribble, J.N. and Bremner, J. 2012b. The Challenge of Attaining a Demographic Dividend, Policy Brief. Washington, D.C.: Population Reference Bureau.
Haggblade, S., Hazell, P.B. and Reardon, T. 2007. Transforming the Rural Nonfarm Economy: Opportunities and threats in the developing world. Washington, D.C.: International Food Policy Research Institute.
Harris, J. and Todaro, M. 1970. Migration, Unemployment and Development: A two-sector analysis. American Economic Association, 60 (1): 126-142.
Haub, C. 2009. Fertility in India: Trends and prospects (available at: www.un.org/esa/population/meetings/EGM-Fertility2009/Haub.pdf, on Sep. 26 2018).

166 2019 Rural Development Report Creating opportunities for rural youth
Heath, R. and Mobarak, A.M. 2015. Manufacturing Growth and the Lives of Bangladeshi Women. Journal of Development Economics, 115 (2015): 1-15.
Heath, R. and Jayachandran, S. 2018. The Causes and Consequences of Increased Female Education and Labor Force Participation in Developing Countries, NBER Working Papers 22766, Cambridge, MA: National Bureau of Economic Research.
Hsiang, S. M., Burke, M. and Miguel, E. 2013. Quantifying the Influence of Climate on Human Conflict. Science, 341 (6151): 1235367.
ILO (International Labour Organization). 2018. ILOStat Database (available at: https://www.ilo.org/ilostat/faces/ilostat-home/home?_adf.ctrl-state=2svbrv43i_4&_afrLoop=1241336397918337. Accessed 30 June 2018).
Ito, T. and Tanaka, S. 2018. Abolishing User Fees, Fertility Choice, and Educational Attainment, Journal of Development Economics, 130: 33-44.
Jedwab, R., Christiaensen, L. and Gindelsky, M. 2017. Demography, Urbanization and Development: Rural push, urban pull and … urban push? Journal of Urban Economics, 98: 6-16.
Jensen, R. 2012. Do Labor Market Opportunities Affect Young Women’s Work and Family Decisions? Experimental evidence from India. Quarterly Journal of Economics, 127 (2): 753-792.
Jessoe, K., Manning, D.T. and Taylor, J.E. 2018. Climate Change and Labour Allocation in Rural Mexico: Evidence from annual fluctuations in weather. The Economic Journal, 128: 230-261.
Kabbani, N. 2018. Investing in Rural Youth in the Near East, North Africa, Europe and Central Asia Region. Regional background paper for the Rural Development Report 2019. Rome: IFAD.
Keats, A. 2014. Women’s Schooling, Fertility, and Child Health Outcomes: Evidence from Uganda’s free primary education program (mimeo).
Kosec, K., Ghebru, H., Holtemeyer, B., Mueller, V. and Schmidt, E. 2017. The Effect of Land Access on Youth Employment and Migration Decisions: Evidence from rural Ethiopia. Working Paper, Washington, D.C.: International Food Policy Research Institute.
Lanjouw, P. and Murgai, R. 2009. Poverty Decline, Agricultural Wages, and Non-Farm Employment in Rural India 1983-2004. Policy Research Working Paper, WPS 4858. World Bank.
Lavy, V. and Zablotsky, A. 2011. Mother’s Schooling, Fertility, and Children’s Education: Evidence from a natural experiment. NBER Working Paper 16856. National Bureau of Economic Research.
Lee, R. and Mason, A. 2010. Fertility, Human Capital, and Economic Growth over the Demographic Transition. European Journal of Population, 26 (2): 159-182 (available at: doi:10.1007/s10680-009-9186-x).
Lee, R., Mason, A. and Miller, T. 2000. Life Cycle Saving and Demographic Transition: The case of Taiwan. Population and Development Review, 26 (Suppl): 194-219.
Litchfield, J. 2018. Drivers of Intra-Regional and Inter-Regional Migration in Africa: A synthesis from the Migrating out of Poverty surveys. Working Paper 53, Migrating out of Poverty Research Programme Consortium. Falmer, UK: University of Sussex.
Loayza, N., Schimdt-Hebbel, K. and Servén, L. 2000. Saving in Developing Countries: An overview. The World Bank Economic Review, 14 (3): 393-414.
Martin, T.C. 1995. Women’s Education and Fertility: Results from 26 Demographic and Health Surveys. Studies in Family Planning, 26 (4): 187-202.
Mason, A. 2005. Demographic Transition and Demographic Dividends in Developed and Developing Countries. United Nations expert group meeting on social and economic implications of changing population age structures. Mexico City.
Mason, A. 1997. Population and the Asian Economic Miracle. Asia-Pacific Population and Policy. Honolulu: East-West Center, Program on Population.
Mason, A. and Lee, R. 2006. Reform and Support Systems for the Elderly in Developing Countries: Capturing the second demographic dividend. Genus, 62: 11-35.
Mason, A., Lee, R., Abrigo, M. and Lee, S.-H. 2017. Support Ratios and Demographic Dividends: Estimates for the world. Technical Paper No. 2017/1. New York: United Nations Population Division.
Mastrorillo, M., Licker, R.Bohra-Mishra, P., Fagiolo, G., Estes, L.D. and Oppenheimer, M. 2016. The Influence of Climate Variability on Internal Migration Flows in South Africa. Global Environmental Change, 39: 155-169.
Menashe-Oren, A. 2017. Social Conflict and the Urban Youth Bulge in Sub-Saharan Africa, Joint Conference of Young Researchers in European Studies and African Studies in Israel: Immigration. Beer Sheva, Israel: Ben-Gurion University of the Negev.

167Chapter 5 Capturing the demographic dividend for rural youth
Menashe-Oren, A. and Stecklov, G. 2017. Population Age Structure and Sex Composition in Sub-Saharan Africa: A rural-urban perspective, IFAD Research Paper Series, Rome: IFAD.
Mendola, M. 2018. Global Evidence on Prospective Migrants from Developing Countries. Background paper for the State of Food and Agriculture 2018, Rome: FAO.
Mesquida, C. G. and Wiener, N. I. 1999. Male Age Composition and Severity of Conflicts. Politics and the Life Sciences, 18 (2): 181-189.
Miller, G. 2010. Contraception as Development? New evidence from family planning in Colombia. Economic Journal, 120 (545): 709-736.
Missirian, A. and Schlenker, W. 2017. Asylum Applications and Migration Flows. American Economic Review, 107 (5): 436-40.
O’Loughlin, J., Witmer, F.D., Linke, A.M., Laing, A., Gettelman, A. and Dudhia, J. 2012. Climate Variability and Conflict Risk in East Africa, 1990-2009. Proceedings of the National Academy of Sciences, 109 (45): 18344-18349.
OECD (Organisation for Economic Co-operation and Development). 2017. Interrelations between Public Policies, Migration and Development. Paris: OECD Publishing.
Osili, U.O. and Long, B.T. 2008. Does Female Schooling Reduce Fertility? Evidence from Nigeria. Journal of Development Economics, 87 (1): 57-75.
Quisumbing, A.R., Meinzen-Dick, R., Raney, T.L., Croppenstedt, A., Behrman, J.A. and Peterman A. (eds.). 2014. Gender in Agriculture. Closing the knowledge gap. Rome and Dordrecht, NL: Food and Agriculture Organization of the United Nations and Springer Science + Business Media B.V.
Raleigh, C. and Urdal, H. 2007. Climate Change, Environmental Degradation and Armed Conflict. Political Geography, 26 (6): 674-694.
Reuveny, R. 2007. Climate Change-Induced Migration and Violent Conflict. Political Geography, 26 (6): 656-673.
Rigaud, K.K., de Sherbinin, A., Jones, B., Bergmann, J., Clement, V., Ober, K., Schewe, J., Adamo, S., McCusker, B., Heuser, S. and Midgley, A. 2018. Groundswell: Preparing for Internal Climate Migration. Washington, D.C.: World Bank.
Samwick, A. 2000. Is Pension Reform Conducive to Higher Saving? Review of Economics and Statistics, 82 (2): 264-272.
Stecklov, G. and Menashe-Oren, A. 2018. The Demography of Rural Youth in Developing Countries. Background Paper for the Rural Development Report 2019. Rome: IFAD.
Steinert, J.I., Zenker, J., Filipiak, U., Movsisyan, A., Cluver, L.D. and Shenderovich, Y. 2018. Do Saving Promotion Interventions Increase Household Savings, Consumption, and Investments in Sub-Saharan Africa? A systematic review and meta-analysis. World Development, 104: 238-256 (available at: doi:10.1016/j.worlddev.2017.11.018).
Tol, R.S. and Wagner, S. 2010. Climate Change and Violent Conflict in Europe over the Last Millennium. Climatic Change, 99 (1-2): 65-79.
UNDESA (United Nations Department of Economic and Social Affairs ), Population Division. 2017. International Migration Report 2017: Highlights (ST/ESA/SER.A/404).
UNDESA (United Nations Department of Economic and Social Affairs), Population Division. 2017a. World Population 2017 – Wall Chart (ST/ESA/SER.A/378).
UNDESA (United Nations Department of Economic and Social Affairs), Population Division (2017b). Household Size and Composition Around the World 2017 – Data Booklet (ST/ESA/ SER.A/405).
UNDESA (United Nations Department of Economic and Social Affairs), Population Division. 2011. World Population Prospects: The 2010 Revision. New York.
Urdal, H. 2008. Population, Resources, and Political Violence A subnational study of India, 1956-2002. Journal of Conflict Resolution, 52 (4): 590-617.
Urdal, H. 2004. The Devil in the Demographics: The effect of youth bulges on domestic armed conflict, 1950-2000. World Bank.
Ware, H. 2005. Demography, Migration and Conflict in the Pacific. Journal of Peace Research, 42 (4): 435-454.
World Bank. 2018a. Ending Global Poverty. Washington, D.C.: World Bank.
World Bank. 2018b. Country profile of the Republic of Korea (available at: http://www.worldbank.org/en/country/korea/overview. Accessed on 20 December 2018).
Yeboah, F.K, Jayne, T.S., Muyanga, M. and Chamberlin. J. 2018. The Intersection of Youth Access to Land, Migration, and Employment Opportunities: Evidence from sub-Saharan Africa. Background paper for Rural Development Report 2019, Rome: IFAD.