2019 third quarter results - cemex
TRANSCRIPT
Exupery International School and Kindergarten, LatviaSalesforce Tower, USA
2019Third Quarter Results

This presentation contains forward-looking statements within the meaning of the U.S. federal securities laws. CEMEX, S.A.B. de C.V. and its direct and indirect subsidiaries(“CEMEX”) intend, but are not limited to, these forward-looking statements to be covered by the safe harbor provisions for forward-looking statements in the U.S. federalsecurities laws. In some cases, these statements can be identified by the use of forward-looking words such as “may,” “assume,” “should,” “could ,”“continue,” “would,”“can,” “consider,” “anticipate,” “estimate,” “expect,” “plan,” “believe,” “foresee,” “predict,” “potential,” “guidance,” “target,” “strategy” and “intend” or other similar words. Theitems presented on the slide “2019 guidance” are forward-looking and difficult to forecast. These forward-looking statements, and in particular in the case of CEMEX’s newplan, “A Stronger CEMEX”, reflect CEMEX’s current expectations and projections about future events based on CEMEX’s knowledge of present facts and circumstancesand assumptions about future events, as well as CEMEX’s current plans based on such facts and circumstances. These statements necessarily involve risks anduncertainties that could cause actual results to differ materially from CEMEX’s expectations. Some of the risks, uncertainties and other important factors that could causeresults to differ, or that otherwise could have an impact on CEMEX or its subsidiaries, include, but are not limited to: the cyclical activity of the construction sector; CEMEX’sexposure to other sectors that impact its business, such as, but not limited to, the energy sector; competition; availability of raw materials and related fluctuating prices;general political, social, economic and business conditions in the markets in which CEMEX operates or that affects its operations and any significant economic, political orsocial developments in those markets, including any nationalization or privatization of any assets or operations; the regulatory environment, including environmental, tax,antitrust and acquisition-related rules and regulations; CEMEX’s ability to satisfy its obligations under CEMEX’s material debt agreements, the indentures that governCEMEX’s outstanding senior secured notes and CEMEX’s other debt instruments; availability of short-term credit lines, which can assist us in connection with marketcycles; the impact of CEMEX’s below investment grade debt rating on its cost of capital; loss of reputation of our brands; CEMEX’s ability to consummate asset sales, fullyintegrate newly acquired businesses, achieve cost-savings from its cost-reduction initiatives and implement its global pricing initiatives for CEMEX’s products, includingCEMEX’s “A Stronger CEMEX” plan; the increasing reliance on information technology infrastructure for CEMEX’s operations, sales in general, sales invoicing, procurement,financial statements and other processes that can adversely affect CEMEX’s sales and operations in the event that the infrastructure does not work as intended,experiences technical difficulties or is subject to cyber-attacks; changes in the economy that affect demand for consumer goods, consequently affecting demand for ourproducts; weather conditions; trade barriers, including tariffs or import taxes and changes in existing trade policies or changes to, or withdrawals from, free tradeagreements; terrorist and organized criminal activities as well as geopolitical events; declarations of insolvency of bankruptcy, or becoming subject to similar proceedings;natural disasters and other unforeseen events; and the other risks and uncertainties described in CEMEX’s public filings. Readers are urged to read this presentation andcarefully consider the risks, uncertainties and other factors that affect CEMEX’s business. The information contained in this presentation is subject to change withoutnotice, and CEMEX is not obliged to publicly update or revise forward-looking statements. CEMEX’s “A Stronger CEMEX” plan is designed based on CEMEX’s currentbeliefs and expectations. Readers should review future reports filed by CEMEX with the U.S. Securities and Exchange Commission. Unless the context indicates otherwise,all references to pricing initiatives, price increases or decreases, refer to CEMEX’s prices for CEMEX’s products.
UNLESS OTHERWISE NOTED, ALL FIGURES ARE PRESENTED IN DOLLARS,BASED ON INTERNATIONAL FINANCIAL REPORTING STANDARDS, AS APPLICABLE
Copyright CEMEX, S.A.B. de C.V. and its subsidiaries 2
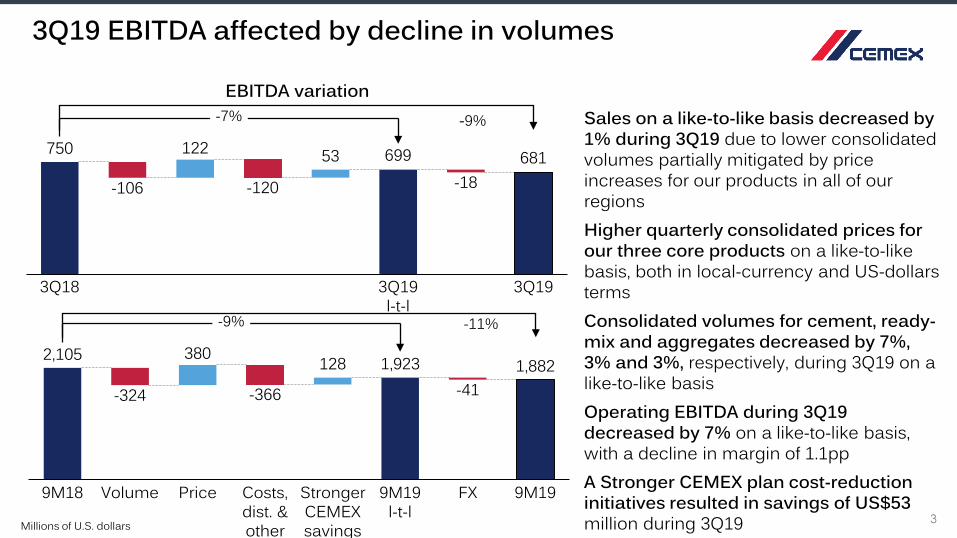
3
Sales on a like-to-like basis decreased by 1% during 3Q19 due to lower consolidated volumes partially mitigated by price increases for our products in all of our regionsHigher quarterly consolidated prices for our three core products on a like-to-like basis, both in local-currency and US-dollars termsConsolidated volumes for cement, ready-mix and aggregates decreased by 7%, 3% and 3%, respectively, during 3Q19 on a like-to-like basisOperating EBITDA during 3Q19 decreased by 7% on a like-to-like basis, with a decline in margin of 1.1ppA Stronger CEMEX plan cost-reduction initiatives resulted in savings of US$53 million during 3Q19
3Q19 EBITDA affected by decline in volumes
EBITDA variation
Millions of U.S. dollars
2,105 1,923 1,882380 128
FXStronger CEMEX savings
9M19 l-t-l
-366
9M18 PriceVolume Costs, dist. & other
9M19
-324 -41
-9%
750 122 53
3Q18 3Q19 l-t-l
3Q19
-106 -120
699-18
681
-7%
-11%
-9%
4
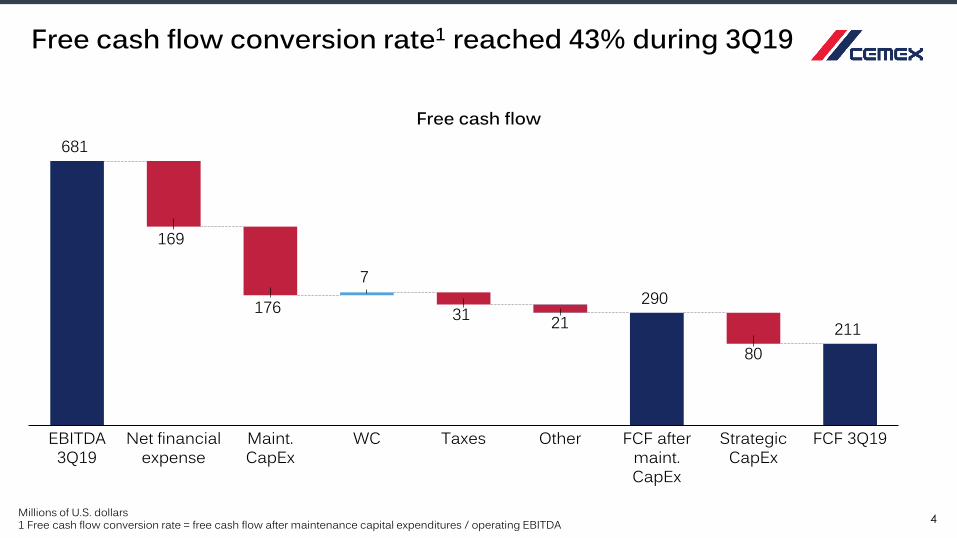
Free cash flow conversion rate1 reached 43% during 3Q19
Free cash flow
Millions of U.S. dollars1 Free cash flow conversion rate = free cash flow after maintenance capital expenditures / operating EBITDA
211
EBITDA 3Q19
169
Taxes FCF after maint. CapEx
FCF 3Q19Strategic CapEx
80
31
WC
7
176
Maint. CapEx
Net financial expense
Other
681
29021
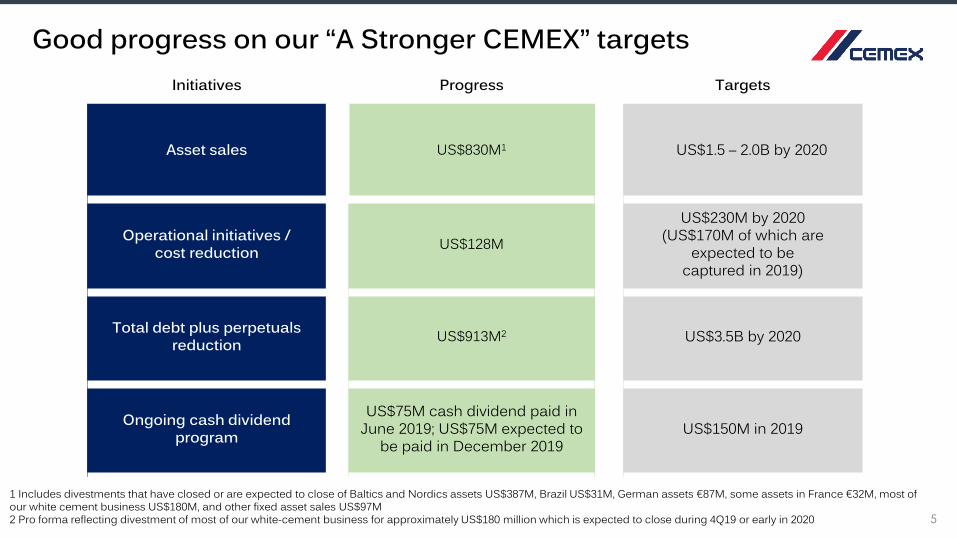
Good progress on our “A Stronger CEMEX” targetsInitiatives Progress Targets
Asset sales US$830M1 US$1.5 – 2.0B by 2020
Operational initiatives / cost reduction US$128M
US$230M by 2020(US$170M of which are
expected to be captured in 2019)
Total debt plus perpetuals reduction US$913M2 US$3.5B by 2020
Ongoing cash dividend program
US$75M cash dividend paid in June 2019; US$75M expected to
be paid in December 2019US$150M in 2019
5
1 Includes divestments that have closed or are expected to close of Baltics and Nordics assets US$387M, Brazil US$31M, German assets €87M, some assets in France €32M, most of our white cement business US$180M, and other fixed asset sales US$97M2 Pro forma reflecting divestment of most of our white-cement business for approximately US$180 million which is expected to close during 4Q19 or early in 2020

Torre Reforma, Mexico
Regional Highlights
7
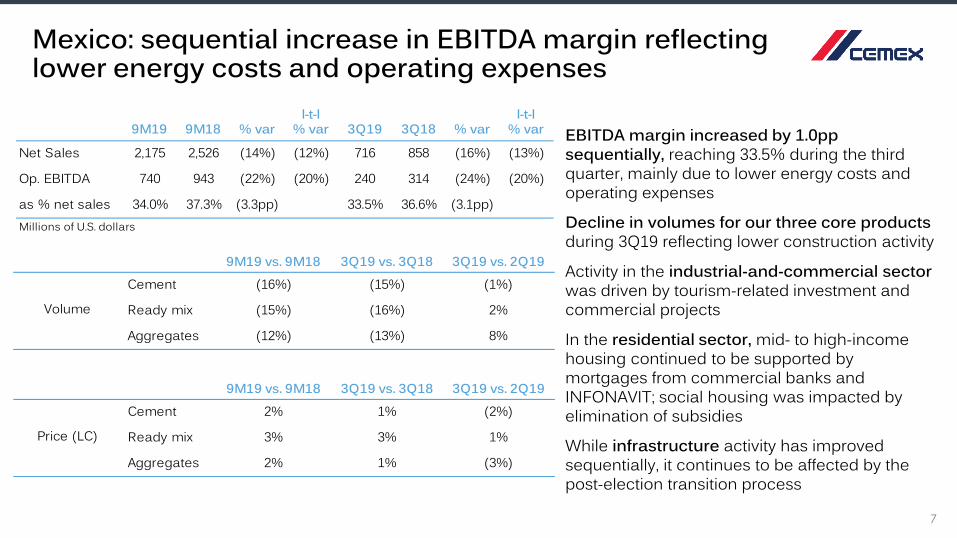
Mexico: sequential increase in EBITDA margin reflecting lower energy costs and operating expenses
l-t-l l-t-l% var % var
Net Sales 2,175 2,526 (14%) (12%) 716 858 (16%) (13%)
Op. EBITDA 740 943 (22%) (20%) 240 314 (24%) (20%)
as % net sales 34.0% 37.3% (3.3pp) 33.5% 36.6% (3.1pp)Millions of U.S. dollars
3Q19 3Q18 % var 9M19 9M18 % var
9M19 vs. 9M18 3Q19 vs. 3Q18 3Q19 vs. 2Q19Cement (16%) (15%) (1%)
Ready mix (15%) (16%) 2%
Aggregates (12%) (13%) 8%
Volume
9M19 vs. 9M18 3Q19 vs. 3Q18 3Q19 vs. 2Q19Cement 2% 1% (2%)
Ready mix 3% 3% 1%
Aggregates 2% 1% (3%)
Price (LC)
EBITDA margin increased by 1.0pp sequentially, reaching 33.5% during the third quarter, mainly due to lower energy costs and operating expenses
Decline in volumes for our three core products during 3Q19 reflecting lower construction activity
Activity in the industrial-and-commercial sector was driven by tourism-related investment and commercial projects
In the residential sector, mid- to high-income housing continued to be supported by mortgages from commercial banks and INFONAVIT; social housing was impacted by elimination of subsidies
While infrastructure activity has improved sequentially, it continues to be affected by the post-election transition process
9M19 vs. 9M18 3Q19 vs. 3Q18 3Q19 vs. 2Q19Cement 4% 4% (0%)
Ready mix 3% 3% 2%
Aggregates 3% 4% 2%
Price (LC)
9M19 vs. 9M18 3Q19 vs. 3Q18 3Q19 vs. 2Q19Cement (3%) (1%) 3%
Ready mix 2% 1% (1%)
Aggregates 6% 3% (5%)
Volume
l-t-l l-t-l% var % var
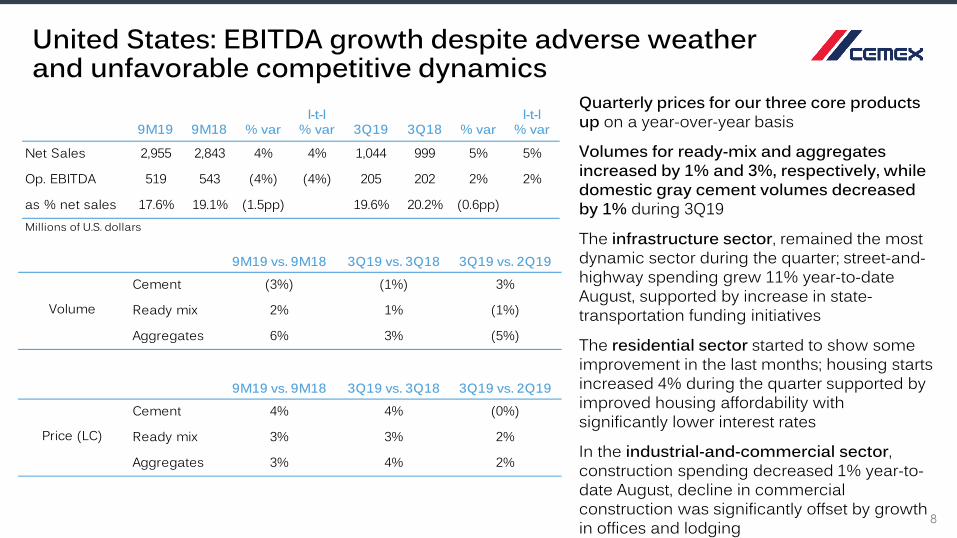
Net Sales 2,955 2,843 4% 4% 1,044 999 5% 5%
Op. EBITDA 519 543 (4%) (4%) 205 202 2% 2%
as % net sales 17.6% 19.1% (1.5pp) 19.6% 20.2% (0.6pp)
3Q19 3Q18 % var 9M19 9M18 % var
Millions of U.S. dollars
United States: EBITDA growth despite adverse weather and unfavorable competitive dynamics
8
Quarterly prices for our three core products up on a year-over-year basis
Volumes for ready-mix and aggregates increased by 1% and 3%, respectively, while domestic gray cement volumes decreased by 1% during 3Q19
The infrastructure sector, remained the most dynamic sector during the quarter; street-and-highway spending grew 11% year-to-date August, supported by increase in state-transportation funding initiatives
The residential sector started to show some improvement in the last months; housing starts increased 4% during the quarter supported by improved housing affordability with significantly lower interest rates
In the industrial-and-commercial sector, construction spending decreased 1% year-to-date August, decline in commercial construction was significantly offset by growth in offices and lodging
9M19 vs. 9M18 3Q19 vs. 3Q18 3Q19 vs. 2Q19Cement 2% 2% (0%)
Ready mix (0%) (0%) (1%)
Aggregates 3% 2% 5%Price (LC) calculated on a volume-weighted-average basis at constant foreign-exchange rates
Price (LC)
9M19 vs. 9M18 3Q19 vs. 3Q18 3Q19 vs. 2Q19Cement (1%) 1% 1%
Ready mix (6%) (6%) 2%
Aggregates (11%) (7%) (1%)
Volume
l-t-l l-t-l% var % var
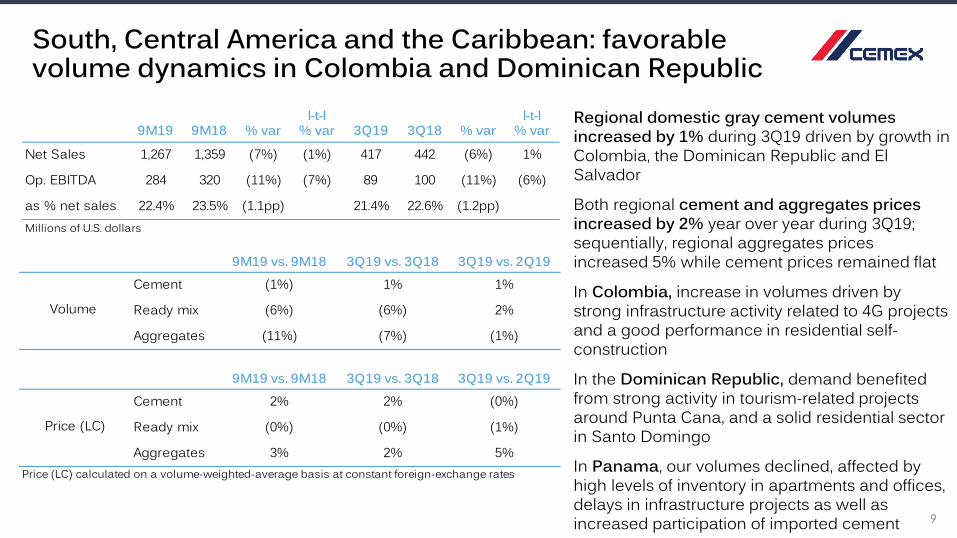
Net Sales 1,267 1,359 (7%) (1%) 417 442 (6%) 1%
Op. EBITDA 284 320 (11%) (7%) 89 100 (11%) (6%)
as % net sales 22.4% 23.5% (1.1pp) 21.4% 22.6% (1.2pp)Millions of U.S. dollars
3Q19 3Q18 % var 9M19 9M18 % var Regional domestic gray cement volumes increased by 1% during 3Q19 driven by growth in Colombia, the Dominican Republic and El Salvador
Both regional cement and aggregates prices increased by 2% year over year during 3Q19; sequentially, regional aggregates prices increased 5% while cement prices remained flat
In Colombia, increase in volumes driven by strong infrastructure activity related to 4G projects and a good performance in residential self-construction
In the Dominican Republic, demand benefited from strong activity in tourism-related projects around Punta Cana, and a solid residential sector in Santo Domingo
In Panama, our volumes declined, affected by high levels of inventory in apartments and offices, delays in infrastructure projects as well as increased participation of imported cement
South, Central America and the Caribbean: favorable volume dynamics in Colombia and Dominican Republic
9
9M19 vs. 9M18 3Q19 vs. 3Q18 3Q19 vs. 2Q19Cement 6% 7% (1%)
Ready mix 4% 4% (1%)
Aggregates 3% 2% (0%)Price (LC) calculated on a volume-weighted-average basis at constant foreign-exchange rates
Price (LC)
9M19 vs. 9M18 3Q19 vs. 3Q18 3Q19 vs. 2Q19Cement (0%) (0%) 4%
Ready mix 1% (2%) (1%)
Aggregates 3% (2%) (2%)
Volume
l-t-l l-t-l% var % var
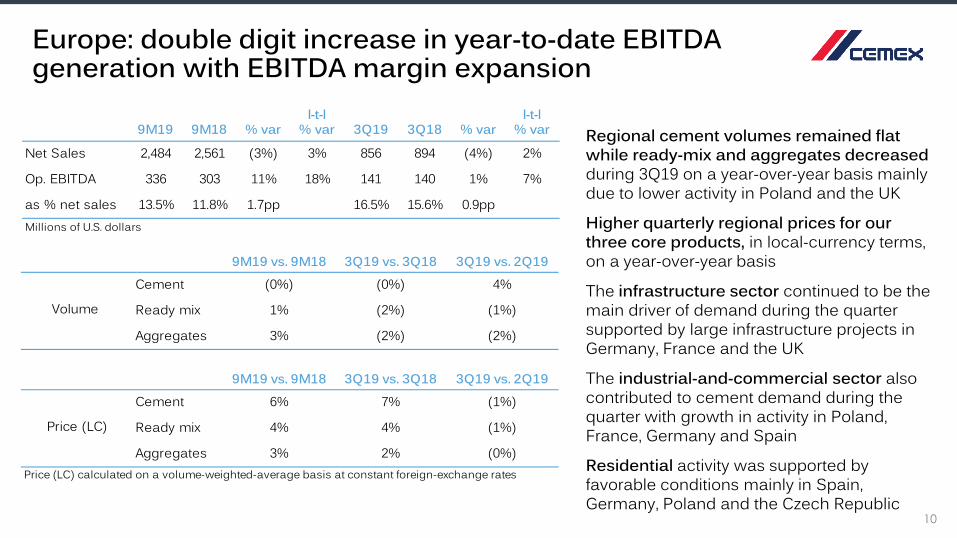
Net Sales 2,484 2,561 (3%) 3% 856 894 (4%) 2%
Op. EBITDA 336 303 11% 18% 141 140 1% 7%
as % net sales 13.5% 11.8% 1.7pp 16.5% 15.6% 0.9ppMillions of U.S. dollars
3Q19 3Q18 % var 9M19 9M18 % var
Europe: double digit increase in year-to-date EBITDA generation with EBITDA margin expansion
10
Regional cement volumes remained flat while ready-mix and aggregates decreased during 3Q19 on a year-over-year basis mainly due to lower activity in Poland and the UK
Higher quarterly regional prices for our three core products, in local-currency terms, on a year-over-year basis
The infrastructure sector continued to be the main driver of demand during the quarter supported by large infrastructure projects in Germany, France and the UK
The industrial-and-commercial sector also contributed to cement demand during the quarter with growth in activity in Poland, France, Germany and Spain
Residential activity was supported by favorable conditions mainly in Spain, Germany, Poland and the Czech Republic
9M19 vs. 9M18 3Q19 vs. 3Q18 3Q19 vs. 2Q19Cement 8% 5% (2%)
Ready mix 2% 3% 0%
Aggregates 5% 8% 4%Price (LC) calculated on a volume-weighted-average basis at constant foreign-exchange rates
Price (LC)
9M19 vs. 9M18 3Q19 vs. 3Q18 3Q19 vs. 2Q19Cement (15%) (16%) 0%
Ready mix (2%) 6% 15%
Aggregates (5%) (4%) 2%
Volume
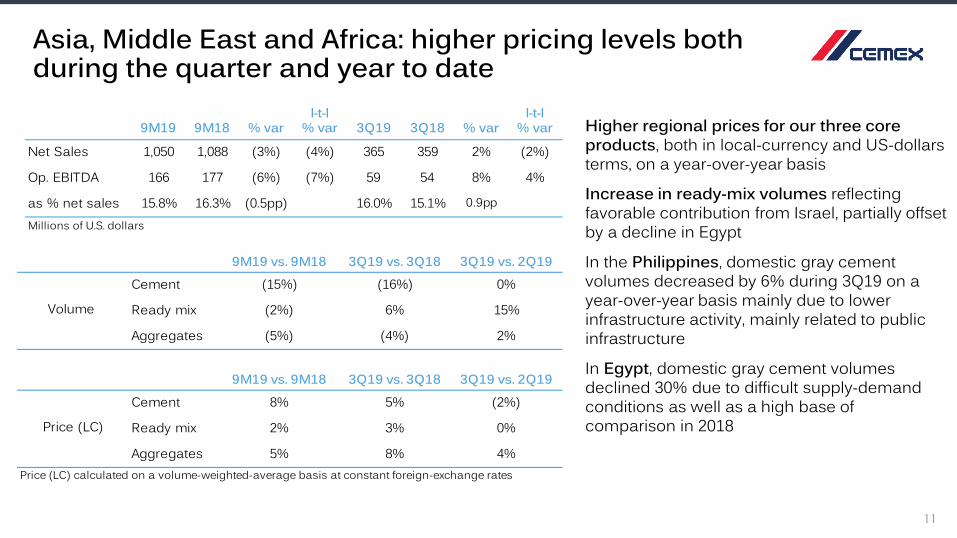
Asia, Middle East and Africa: higher pricing levels both during the quarter and year to date
11
l-t-l l-t-l% var % var
Net Sales 1,050 1,088 (3%) (4%) 365 359 2% (2%)
Op. EBITDA 166 177 (6%) (7%) 59 54 8% 4%
as % net sales 15.8% 16.3% (0.5pp) 16.0% 15.1% 0.9pp
Millions of U.S. dollars
3Q19 3Q18 % var 9M19 9M18 % var Higher regional prices for our three core products, both in local-currency and US-dollars terms, on a year-over-year basis
Increase in ready-mix volumes reflecting favorable contribution from Israel, partially offset by a decline in Egypt
In the Philippines, domestic gray cement volumes decreased by 6% during 3Q19 on a year-over-year basis mainly due to lower infrastructure activity, mainly related to public infrastructure
In Egypt, domestic gray cement volumes declined 30% due to difficult supply-demand conditions as well as a high base of comparison in 2018
Concretus House, Spain
3Q19 Results
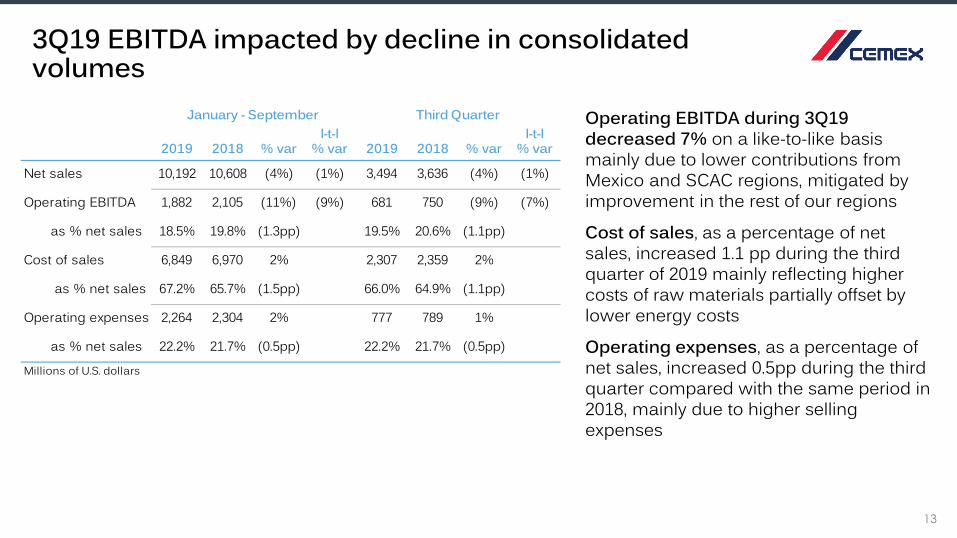
Operating EBITDA during 3Q19 decreased 7% on a like-to-like basis mainly due to lower contributions from Mexico and SCAC regions, mitigated by improvement in the rest of our regions
Cost of sales, as a percentage of net sales, increased 1.1 pp during the third quarter of 2019 mainly reflecting higher costs of raw materials partially offset by lower energy costs
Operating expenses, as a percentage of net sales, increased 0.5pp during the third quarter compared with the same period in 2018, mainly due to higher selling expenses
3Q19 EBITDA impacted by decline in consolidated volumes
l-t-l l-t-l% var % var
Net sales 10,192 10,608 (4%) (1%) 3,494 3,636 (4%) (1%)
Operating EBITDA 1,882 2,105 (11%) (9%) 681 750 (9%) (7%)
as % net sales 18.5% 19.8% (1.3pp) 19.5% 20.6% (1.1pp)
Cost of sales 6,849 6,970 2% 2,307 2,359 2%
as % net sales 67.2% 65.7% (1.5pp) 66.0% 64.9% (1.1pp)
Operating expenses 2,264 2,304 2% 777 789 1%
as % net sales 22.2% 21.7% (0.5pp) 22.2% 21.7% (0.5pp)
January - September Third Quarter
Millions of U.S. dollars
2019 2018 % var 2019 2018 % var
13
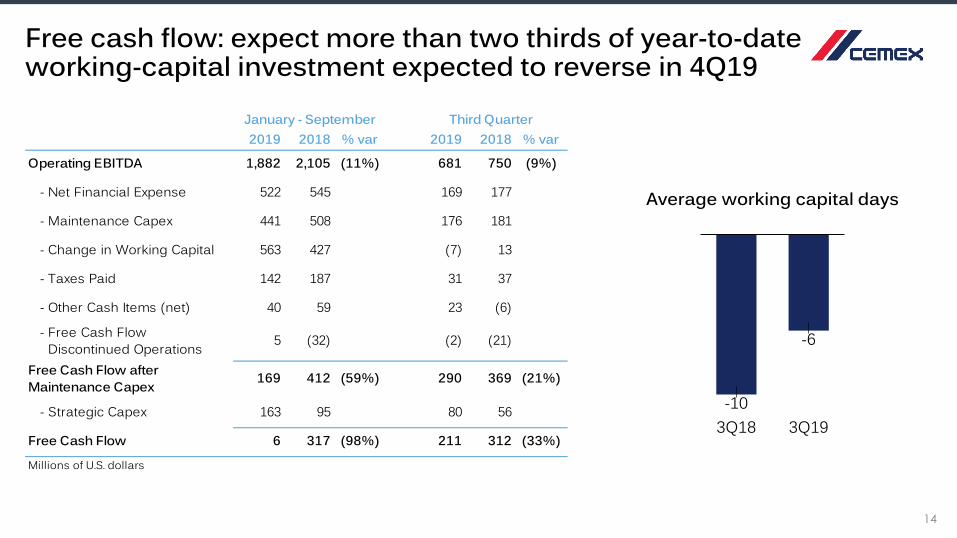
Free cash flow: expect more than two thirds of year-to-date working-capital investment expected to reverse in 4Q19
2019 2018 % var 2019 2018 % var
Operating EBITDA 1,882 2,105 (11%) 681 750 (9%)
- Net Financial Expense 522 545 169 177
- Maintenance Capex 441 508 176 181
- Change in Working Capital 563 427 (7) 13
- Taxes Paid 142 187 31 37
- Other Cash Items (net) 40 59 23 (6)
- Free Cash Flow Discontinued OperationsFree Cash Flow afterMaintenance Capex
- Strategic Capex 163 95 80 56
Free Cash Flow 6 317 (98%) 211 312 (33%)
Millions of U.S. dollars
Third QuarterJanuary - September
5 (32) (2) (21)
(21%)169 412 (59%) 290 369
14
3Q18-10
-6
3Q19
Average working capital days
15
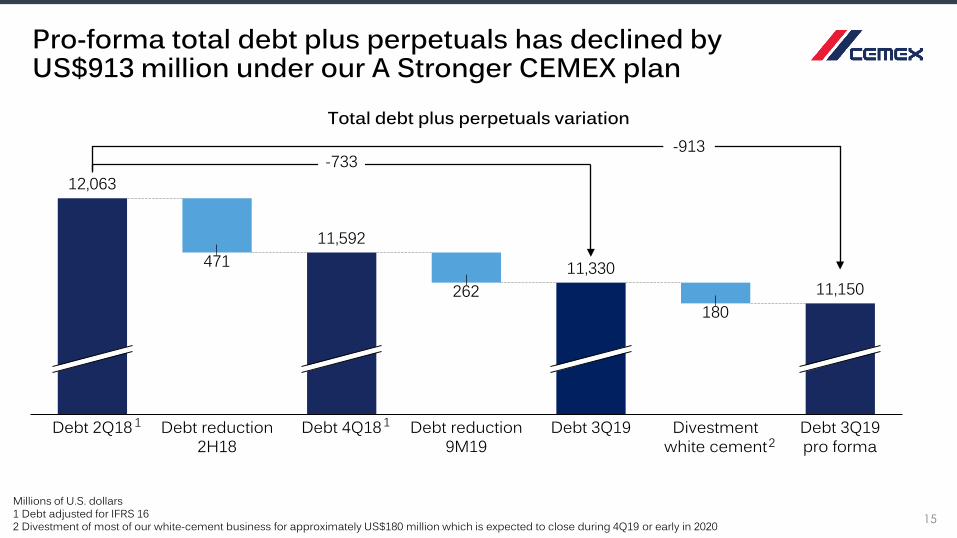
Pro-forma total debt plus perpetuals has declined by US$913 million under our A Stronger CEMEX plan
12,063
262
Debt 2Q18 Debt 3Q19 pro forma
Debt reduction 9M19
Debt 4Q18
11,592
11,15011,330
Debt reduction 2H18
471
180
Divestment white cement
Debt 3Q19
-733
Millions of U.S. dollars1 Debt adjusted for IFRS 16 2 Divestment of most of our white-cement business for approximately US$180 million which is expected to close during 4Q19 or early in 2020
Total debt plus perpetuals variation-913
1 12

Millions of U.S. dollars1 Convertible Subordinated Notes include only the debt component of US$518 million; total notional amount is about US$521 million
Avg. life of debt: 4.1 years
Healthy consolidated debt maturity profile
Total debt excluding perpetual notes as of September 30, 2019: US$10,889 million
16
2022 > 20262019 20212020 2023 2024 2025
295
1,596
867 876 785
2,758
2,0791,635
Fixed IncomeOther bank debt
Convertible Subordinated Notes1
2017 Facilities Agreement
Leases
Lumina, USAC-17 House, Colombia
2019 Outlook
18
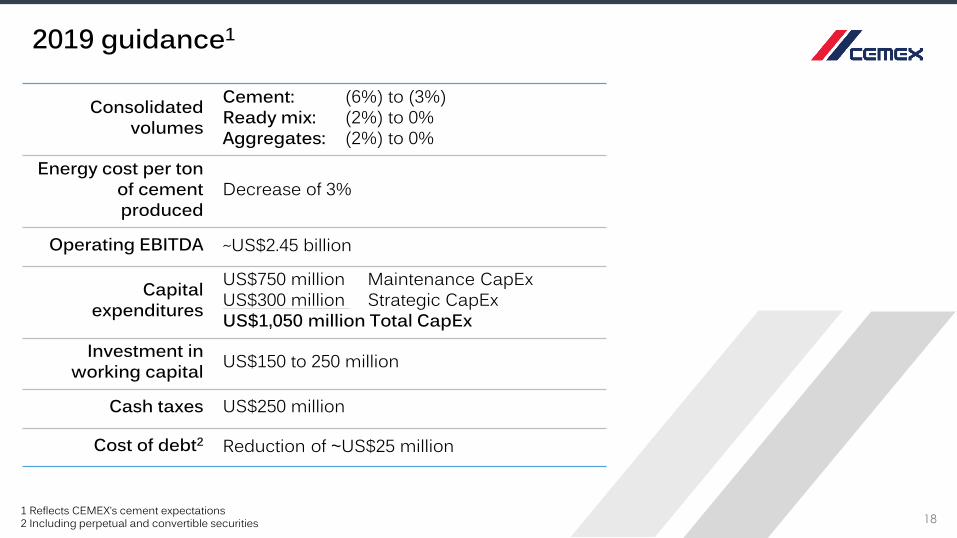
2019 guidance1
1 Reflects CEMEX’s cement expectations 2 Including perpetual and convertible securities
Consolidatedvolumes
Cement: (6%) to (3%)Ready mix: (2%) to 0%Aggregates: (2%) to 0%
Energy cost per ton of cement produced
Decrease of 3%
Operating EBITDA ~US$2.45 billion
Capital expenditures
US$750 million Maintenance CapExUS$300 million Strategic CapExUS$1,050 million Total CapEx
Investment in working capital US$150 to 250 million
Cash taxes US$250 million
Cost of debt2 Reduction of ~US$25 million
Therapeutic pools for the school La Esperanza, Puerto RicoDubai International Airport, United Arab Emirates
Appendix
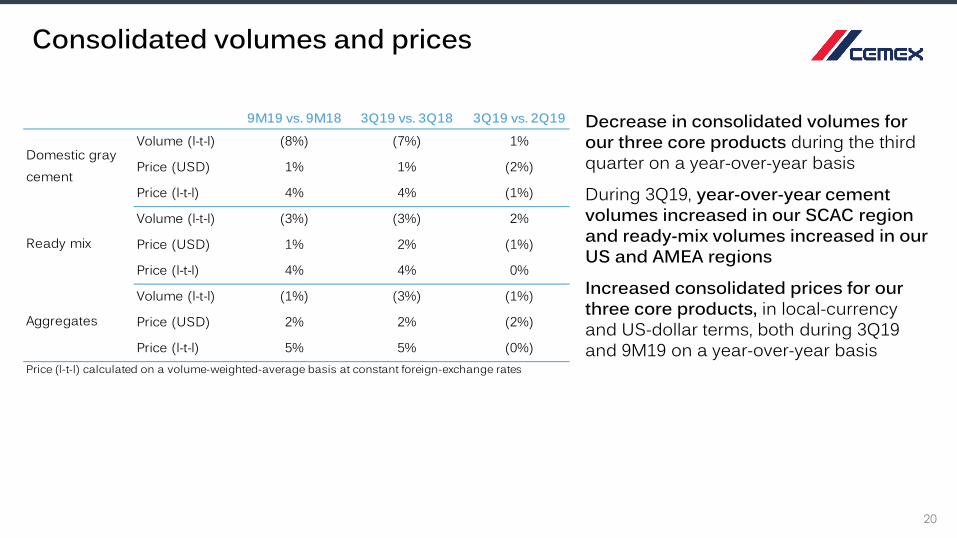
Decrease in consolidated volumes for our three core products during the third quarter on a year-over-year basis
During 3Q19, year-over-year cement volumes increased in our SCAC region and ready-mix volumes increased in our US and AMEA regions
Increased consolidated prices for our three core products, in local-currency and US-dollar terms, both during 3Q19 and 9M19 on a year-over-year basis
Consolidated volumes and prices
20
9M19 vs. 9M18 3Q19 vs. 3Q18 3Q19 vs. 2Q19Volume (l-t-l) (8%) (7%) 1%
Price (USD) 1% 1% (2%)
Price (l-t-l) 4% 4% (1%)
Volume (l-t-l) (3%) (3%) 2%
Price (USD) 1% 2% (1%)
Price (l-t-l) 4% 4% 0%
Volume (l-t-l) (1%) (3%) (1%)
Price (USD) 2% 2% (2%)
Price (l-t-l) 5% 5% (0%)Price (l-t-l) calculated on a volume-weighted-average basis at constant foreign-exchange rates
Aggregates
Domestic gray cement
Ready mix

21
Other income statement items during 3Q19
Other expenses, net, of US$45 million, mainly due to severance payments and impairment of assets
Loss on financial instruments of US$5 million, mainly resulting from the derivatives related to GCC shares
Foreign-exchange gain of US$2 million resulting mainly from the fluctuation of the Mexican peso versus the U.S. dollar, partially offset by the fluctuation of the Euro versus the U.S. dollar
Controlling interest net gain of US$187 million in 3Q19 versus a gain of US$169 million in 3Q18
• The higher gain primarily reflects lower financial expenses and income tax; positive variations in foreign exchange fluctuations, equity in gain of associates and non-controlling interest net income; partially offset by lower operating earnings, a loss in financial instruments and a negative variation in discontinued operations
22
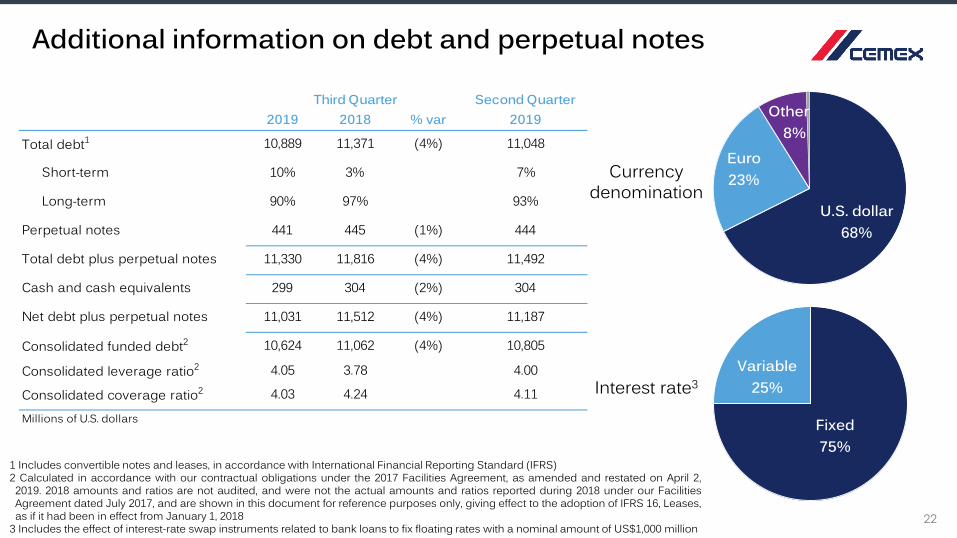
Additional information on debt and perpetual notes
U.S. dollar68%
Euro23%
Other8%
Fixed75%
Variable25%
Currency denomination
Interest rate3
1 Includes convertible notes and leases, in accordance with International Financial Reporting Standard (IFRS)2 Calculated in accordance with our contractual obligations under the 2017 Facilities Agreement, as amended and restated on April 2,2019. 2018 amounts and ratios are not audited, and were not the actual amounts and ratios reported during 2018 under our FacilitiesAgreement dated July 2017, and are shown in this document for reference purposes only, giving effect to the adoption of IFRS 16, Leases,as if it had been in effect from January 1, 2018
3 Includes the effect of interest-rate swap instruments related to bank loans to fix floating rates with a nominal amount of US$1,000 million
Second Quarter2019 2018 % var 2019
Total debt1 10,889 11,371 (4%) 11,048
Short-term 10% 3% 7%
Long-term 90% 97% 93%
Perpetual notes 441 445 (1%) 444
Total debt plus perpetual notes 11,330 11,816 (4%) 11,492
Cash and cash equivalents 299 304 (2%) 304
Net debt plus perpetual notes 11,031 11,512 (4%) 11,187
Consolidated funded debt2 10,624 11,062 (4%) 10,805
Consolidated leverage ratio2 4.05 3.78 4.00
Consolidated coverage ratio2 4.03 4.24 4.11
Third Quarter
Millions of U.S. dollars
23
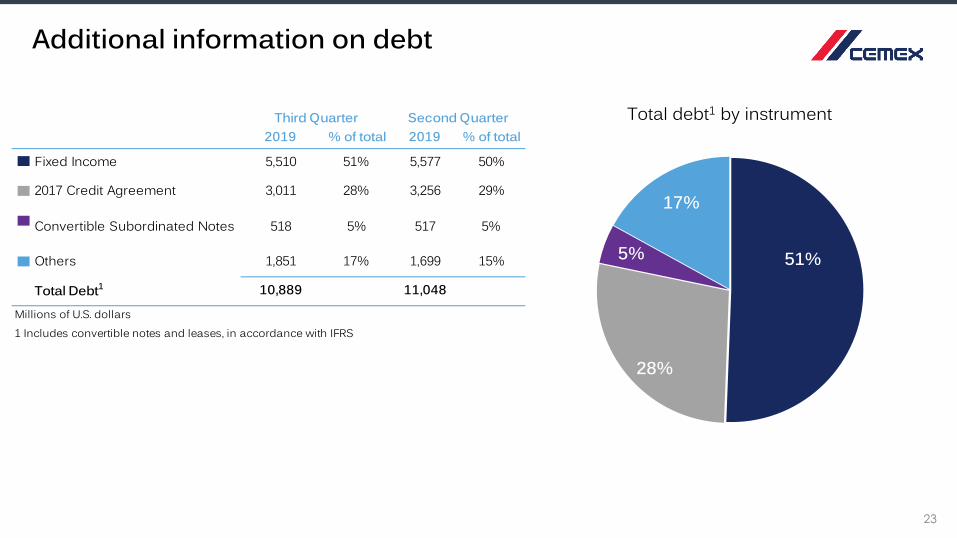
Additional information on debt
51%
28%
5%
17%
Total debt1 by instrument2019 % of total 2019 % of total
Fixed Income 5,510 51% 5,577 50%
2017 Credit Agreement 3,011 28% 3,256 29%
Convertible Subordinated Notes 518 5% 517 5%
Others 1,851 17% 1,699 15%
Total Debt1 10,889 11,048
Millions of U.S. dollars1 Includes convertible notes and leases, in accordance with IFRS
Second QuarterThird Quarter
24
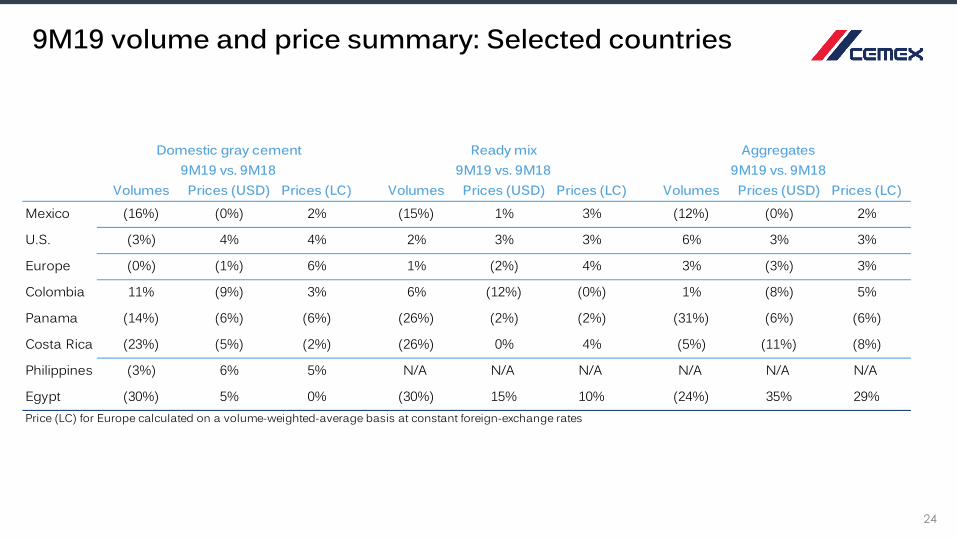
9M19 volume and price summary: Selected countries
Volumes Prices (USD) Prices (LC) Volumes Prices (USD) Prices (LC) Volumes Prices (USD) Prices (LC)Mexico (16%) (0%) 2% (15%) 1% 3% (12%) (0%) 2%
U.S. (3%) 4% 4% 2% 3% 3% 6% 3% 3%
Europe (0%) (1%) 6% 1% (2%) 4% 3% (3%) 3%
Colombia 11% (9%) 3% 6% (12%) (0%) 1% (8%) 5%
Panama (14%) (6%) (6%) (26%) (2%) (2%) (31%) (6%) (6%)
Costa Rica (23%) (5%) (2%) (26%) 0% 4% (5%) (11%) (8%)
Philippines (3%) 6% 5% N/A N/A N/A N/A N/A N/A
Egypt (30%) 5% 0% (30%) 15% 10% (24%) 35% 29%
Aggregates9M19 vs. 9M18
Domestic gray cement 9M19 vs. 9M18
Ready mix 9M19 vs. 9M18
Price (LC) for Europe calculated on a volume-weighted-average basis at constant foreign-exchange rates
25
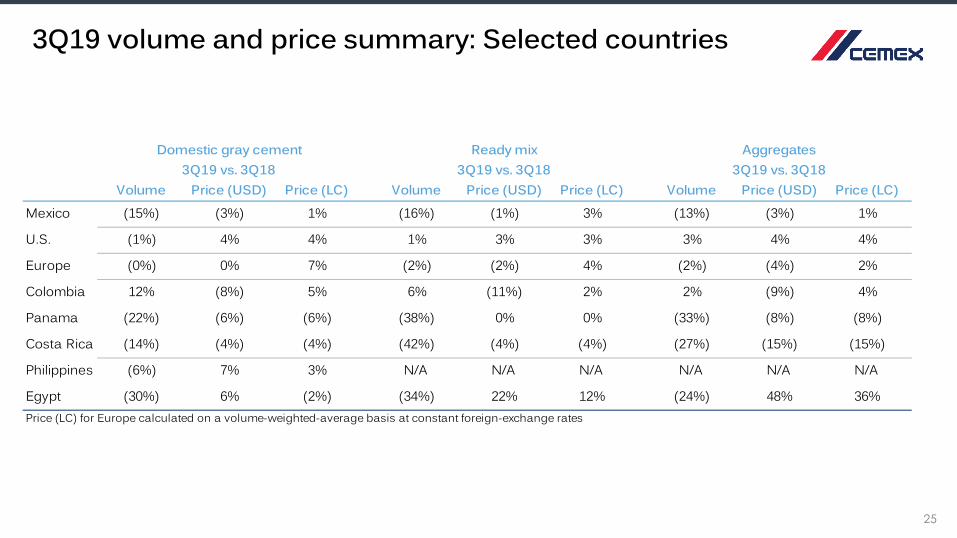
3Q19 volume and price summary: Selected countries
Volume Price (USD) Price (LC) Volume Price (USD) Price (LC) Volume Price (USD) Price (LC)Mexico (15%) (3%) 1% (16%) (1%) 3% (13%) (3%) 1%
U.S. (1%) 4% 4% 1% 3% 3% 3% 4% 4%
Europe (0%) 0% 7% (2%) (2%) 4% (2%) (4%) 2%
Colombia 12% (8%) 5% 6% (11%) 2% 2% (9%) 4%
Panama (22%) (6%) (6%) (38%) 0% 0% (33%) (8%) (8%)
Costa Rica (14%) (4%) (4%) (42%) (4%) (4%) (27%) (15%) (15%)
Philippines (6%) 7% 3% N/A N/A N/A N/A N/A N/A
Egypt (30%) 6% (2%) (34%) 22% 12% (24%) 48% 36%
Ready mix Aggregates3Q19 vs. 3Q18 3Q19 vs. 3Q18
Domestic gray cement 3Q19 vs. 3Q18
Price (LC) for Europe calculated on a volume-weighted-average basis at constant foreign-exchange rates

26
2019 expected outlook: Selected countries
Domestic gray cement Ready mix AggregatesVolumes Volumes Volumes
Consolidated1 (6%) - (3%) (2%) - 0% (2%) - 0%
Mexico (15%) - (12%) (15%) - (12%) (15%) - (12%)
United States (2%) -0% 2% - 4% 2% - 4%
Europe 0% - 2% 0% - 2% 0% - 2%
Colombia 8% - 9% 3% - 4% 0% - 1%
Panama (15%) - (14%) (27%) - (26%) (25%) - (24%)
Costa Rica (22%) - (21%) (30%) - (29%) (9%) - (7%)
Philippines 0% N/A N/A
Egypt (25%) - (20%) (30%) - (25%) N/A
1 On a like-to-like basis for the ongoing operations
9M18 originally reported1
9M18 restated2
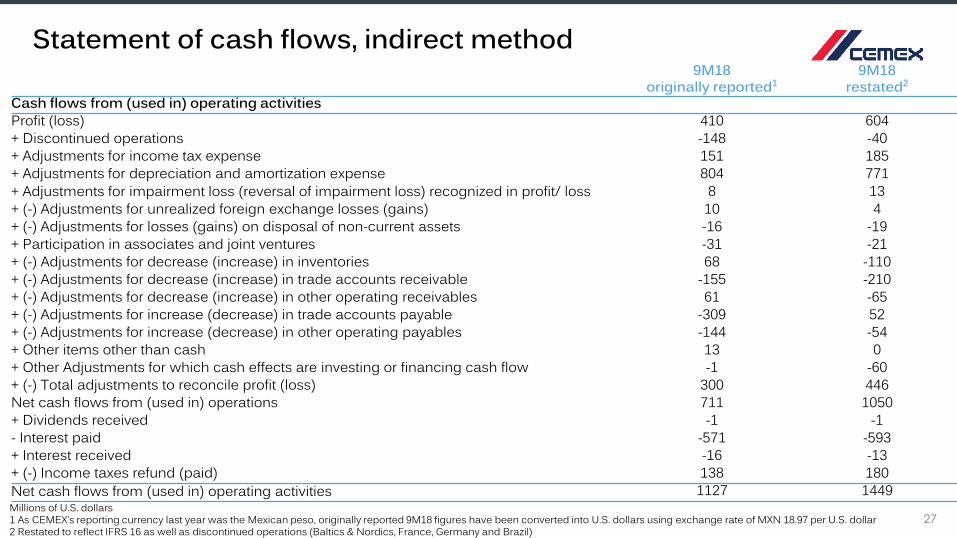
Cash flows from (used in) operating activitiesProfit (loss) 410 604+ Discontinued operations -148 -40+ Adjustments for income tax expense 151 185+ Adjustments for depreciation and amortization expense 804 771+ Adjustments for impairment loss (reversal of impairment loss) recognized in profit/ loss 8 13+ (-) Adjustments for unrealized foreign exchange losses (gains) 10 4+ (-) Adjustments for losses (gains) on disposal of non-current assets -16 -19+ Participation in associates and joint ventures -31 -21+ (-) Adjustments for decrease (increase) in inventories 68 -110+ (-) Adjustments for decrease (increase) in trade accounts receivable -155 -210+ (-) Adjustments for decrease (increase) in other operating receivables 61 -65+ (-) Adjustments for increase (decrease) in trade accounts payable -309 52+ (-) Adjustments for increase (decrease) in other operating payables -144 -54+ Other items other than cash 13 0+ Other Adjustments for which cash effects are investing or financing cash flow -1 -60+ (-) Total adjustments to reconcile profit (loss) 300 446Net cash flows from (used in) operations 711 1050+ Dividends received -1 -1- Interest paid -571 -593+ Interest received -16 -13+ (-) Income taxes refund (paid) 138 180Net cash flows from (used in) operating activities 1127 1449
27
Statement of cash flows, indirect method
Millions of U.S. dollars1 As CEMEX’s reporting currency last year was the Mexican peso, originally reported 9M18 figures have been converted into U.S. dollars using exchange rate of MXN 18.97 per U.S. dollar2 Restated to reflect IFRS 16 as well as discontinued operations (Baltics & Nordics, France, Germany and Brazil)
28
9M18 originally reported1
9M18 restated2
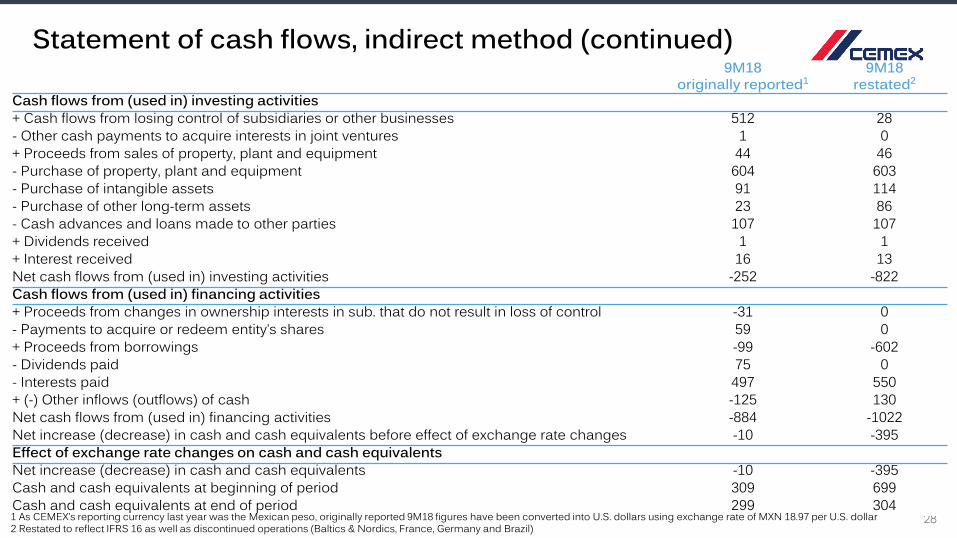
Cash flows from (used in) investing activities + Cash flows from losing control of subsidiaries or other businesses 512 28- Other cash payments to acquire interests in joint ventures 1 0+ Proceeds from sales of property, plant and equipment 44 46- Purchase of property, plant and equipment 604 603- Purchase of intangible assets 91 114- Purchase of other long-term assets 23 86- Cash advances and loans made to other parties 107 107+ Dividends received 1 1+ Interest received 16 13Net cash flows from (used in) investing activities -252 -822Cash flows from (used in) financing activities+ Proceeds from changes in ownership interests in sub. that do not result in loss of control -31 0- Payments to acquire or redeem entity’s shares 59 0+ Proceeds from borrowings -99 -602- Dividends paid 75 0- Interests paid 497 550+ (-) Other inflows (outflows) of cash -125 130Net cash flows from (used in) financing activities -884 -1022Net increase (decrease) in cash and cash equivalents before effect of exchange rate changes -10 -395Effect of exchange rate changes on cash and cash equivalents Net increase (decrease) in cash and cash equivalents -10 -395Cash and cash equivalents at beginning of period 309 699Cash and cash equivalents at end of period 299 304
Statement of cash flows, indirect method (continued)
1 As CEMEX’s reporting currency last year was the Mexican peso, originally reported 9M18 figures have been converted into U.S. dollars using exchange rate of MXN 18.97 per U.S. dollar2 Restated to reflect IFRS 16 as well as discontinued operations (Baltics & Nordics, France, Germany and Brazil)
29
Definitions
9M19 / 9M18 Results for the first nine months of the years 2019 and 2018, respectively
AMEA Asia, Middle East and Africa
Cement When providing cement volume variations, refers to domestic gray cement operations (starting in 2Q10, the base for reported cement volumes changed from total domestic cement including clinker to domestic gray cement)
LC Local currency
l-t-l (like to like) On a like-to-like basis adjusting for currency fluctuations and for investments/divestments when applicable
Maintenance capital expenditures
Investments incurred for the purpose of ensuring the company’s operational continuity. These include capital expenditures on projects required to replace obsolete assets or maintain current operational levels, and mandatory capital expenditures, which are projects required to comply with governmental regulations or company policies
Operating EBITDA Operating earnings before other expenses, net plus depreciation and operating amortization
pp Percentage points
Prices All references to pricing initiatives, price increases or decreases, refer to our prices for our products
SCAC South, Central America and the Caribbean
Strategic capital expenditures
Investments incurred with the purpose of increasing the company’s profitability. These include capital expenditures on projects designed to increase profitability by expanding capacity, and margin improvement capital expenditures, which are projects designed to increase profitability by reducing costs
TCL Operations Trinidad Cement Limited includes Barbados, Guyana, Jamaica and Trinidad and Tobago
% var Percentage variation
30
Contact information
Stock InformationNYSE (ADS): CX
Mexican Stock Exchange: CEMEXCPO
Ratio of CEMEXCPO to CX: 10 to 1
Investor Relations
In the United States+1 877 7CX NYSE
In Mexico+52 81 8888 4292