202 887 0200 | dragon · pdf file2 the fat tech dragon funding various...
TRANSCRIPT

China InnovationPolicy Series
The Fat Tech Dragon
author Scott Kennedy
Benchmarking China’s Innovation Drive
A U G U S T 2 0 1 7
A Joint Project of the
CSIS FREEMAN CHAIR IN CHINA STUDIES AND
THE CSIS TECHNOLOGY POLICY PROGRAM
COVER PHOTO ADOBE STOCK
1616 Rhode Island Avenue NW
Washington, DC 20036
202 887 0200 | www.csis.org

Blank

A U G U S T 2 0 1 7
The Fat Tech DragonBenchmarking China’s Innovation Drive
AUTHOR
Scott Kennedy
China Innovation Policy Series
A JOINT PROJ ECT OF THE CSIS FREEMAN CHAIR IN CHINA STUDIES
AND THE CSIS TECHNOLOGY POLICY PROGRAM
594-71093_ch00_4P.indd 1 8/29/17 9:50 AM

About CSIS
For over 50 years, the Center for Strategic and International Studies (CSIS) has worked
to develop solutions to the world’s greatest policy challenges. Today, CSIS scholars are
providing strategic insights and bipartisan policy solutions to help decisionmakers chart a
course toward a better world.
CSIS is a nonprofit organ ization headquartered in Washington, D.C. The Center’s 220 full-
time staff and large network of affiliated scholars conduct research and analy sis and develop
policy initiatives that look into the future and anticipate change.
Founded at the height of the Cold War by David M. Abshire and Admiral Arleigh Burke, CSIS
was dedicated to finding ways to sustain American prominence and prosperity as a force for
good in the world. Since 1962, CSIS has become one of the world’s preeminent international
institutions focused on defense and security; regional stability; and transnational challenges
ranging from energy and climate to global health and economic integration.
Thomas J. Pritzker was named chairman of the CSIS Board of Trustees in November 2015.
Former U.S. deputy secretary of defense John J. Hamre has served as the Center’s president
and chief executive officer since 2000.
CSIS does not take specific policy positions; accordingly, all views expressed herein should
be understood to be solely those of the author(s).
© 2017 by the Center for Strategic and International Studies. All rights reserved.
Center for Strategic & International Studies
1616 Rhode Island Ave nue, NW
Washington, DC 20036
202-887-0200 | www.csis . org
594-71093_ch00_4P.indd 2 8/29/17 9:50 AM

Contents
iv The China Innovation Policy Series
v Executive Summary
1 CHAPTER 1 | Introduction: From Innovation Policy to Innovation
8 CHAPTER 2 | General Trends in Innovation
18 CHAPTER 3 | Financing Innovation
26 CHAPTER 4 | Creating Valuable Knowledge
32 CHAPTER 5 | Commercial Per for mance
39 CHAPTER 6 | Implications
42 About the Author
594-71093_ch00_4P.indd 3 8/29/17 9:50 AM

The purpose of the China Innovation Policy Series (CIPS) is to analyze trends in technology inno-
vation in China and consider the implications for government policies and business strategies. The
series examines general trends as well as a range of strategic sectors that have diff er ent economic
dynamics, including: the Internet, new- generation vehicles (electric and autonomous vehicles),
semiconductors, artificial intelligence, commercial aircraft, and phar ma ceu ti cals. Over the life of
the two- year proj ect, reports are being issued on each sector, and CSIS is hosting events to dis-
cuss these reports and the broader issues that will shape China’s innovation path and how others
in government and industry should respond.
CIPS is a joint proj ect of the Freeman Chair in China Studies and the Technology Policy Program
at CSIS. The principal investigators are: Scott Kennedy, deputy director of CSIS’s Freeman Chair in
China Studies and director of the Proj ect on Chinese Business and Po liti cal Economy; Denise
Zheng, director of CSIS’s Technology Policy Program; and James Lewis, se nior vice president at
CSIS. Research support is headed by Qiu Mingda of the Freeman Chair in China Studies and Will
Car ter of the Technology Policy Program. Administrative support is provided by Maria Sinclair of
the Freeman Chair and Alvaro Genie of the Technology Policy Program. We appreciate the contri-
butions of interns in both programs to the initiative, including (to date): Lin Xuefen, Jonathan
Hall- Eastman, Mark Akpaninyie, and Frank Zhao.
We gratefully acknowledge the generous support of our partners: Microsoft Corporation, the Gen-
eral Electric Foundation, the United States Chamber of Commerce, the Semiconductor Industry
Association, and the Japan External Trade Organ ization (JETRO).
For more information, visit the CIPS microsite at: https:// www.csis - cips . org / .
The China Innovation Policy Series
Iv
594-71093_ch00_4P.indd 4 8/29/17 9:50 AM

v
The purpose of this report is to develop a benchmark analy sis of innovation in China by systemati-
cally examining national trends in China while placing the country in comparative perspective. The
report pres ents data on innovation inputs, such as finance, as well as several types of innovation
outputs, such as intellectual property and commercial per for mance. This study relies primarily on
broad quantitative mea sures because they facilitate mea sur ing trends over time and engaging in
cross- national comparison. The numerical data are supplemented by interviews with business
executives, industry analysts, investors, and government officials in the United States and in China.
Broadly speaking, whether one looks at China in isolation or puts the country in comparative
perspective, China’s innovation per for mance has gradually improved over the last de cade along a
number of indicators, separating China from other major emerging economies. Yet China still has
a substantial distance to travel before it approaches the level of innovation found in the world’s
most advanced economies. Most importantly, the level of inputs China is mobilizing is not consis-
tently and smoothly translating into successful technology innovation outputs. This low “meta-
bolism” of inputs into successful high- tech advancement is why we characterize China as a “fat”
tech dragon.
China is dedicating an unpre ce dented amount of funding to research and development (R&D).
Old- school banks and new- school investment vehicles are all getting in on the action. No longer
are funds just being tossed at large- scale white elephants. Commercial competitiveness is now a
central part of the decision calculus. Although this is a definite improvement over the earlier
financing system, China may have overcorrected. By avoiding spending on basic research and
foundational technologies, income is being generated less as a result of novel technologies and
more as a result of new applications or business models.
China’s embrace of intellectual property (IP) is highly positive when contrasted with the country’s
original disdain for property rights of any sort and widespread violation of IP rights. However,
China’s efforts to develop and obtain more IP is driven heavi ly by bureaucratic imperatives as
opposed to market incentives. Moreover, China may now be a “large” IP country, but it is still a
Executive Summary
594-71093_ch00_4P.indd 5 8/29/17 9:50 AM
Executive SummaryvI
“weak” one. Whether one is discussing licensing and royalties, mergers and acquisitions, or dispute
settlement, Chinese patents still have little commercial value.
China’s commercial success has outstripped its pro gress in technology innovation. Chinese com-
panies are acquiring greater market share in high tech, particularly in the most commodified
segments of sectors. The value- added contribution to manufacturing is growing in absolute terms,
and domestic companies are contributing a growing share to China’s high- tech exports.
Overall, China’s high- tech drive may be characterized as “good- enough innovation.” From a nega-
tive perspective, China is investing— and may be wasting— a great deal of human capital and fund-
ing, but is still far from a leader in high tech. From a more positive perspective, China is achieving
incremental pro gress by benefiting from its strong capacity in manufacturing, the accumulation
and diffusion of tacit knowledge, and the opportunities provided by such a large market.
Regardless of the level of support they receive from their government, Chinese companies will
face growing challenges in their interactions with multinational businesses and in overseas mar-
kets. Foreign governments and multinational businesses likewise need to decide how to strategi-
cally respond to China’s approach. They could take a firm stand in opposition, try to influence
China’s approach at the margins, or go along with the strategy as best they can. In any case, if they
are not careful, they could end up under the heavy foot of a fat tech dragon.
594-71093_ch00_4P.indd 6 8/29/17 9:50 AM
1
01
Introduction: From Innovation Policy to Innovation
INTRODUCTION
The most problematic issue in the U.S.- China economic relationship is China’s unpre ce dented
drive to become a technology power house. China’s aspirations are not per se novel or objection-
able. Overcoming technological inferiority has been a central goal of every Chinese leader since at
least the conclusion of the Opium War in the middle of the nineteenth century, and it is entirely
reasonable for any country, especially one as proud as China, to pursue technological advance-
ment as part of its effort to further economic development and strengthen national security.
Except for some limited breakthroughs, China’s previous efforts have largely failed, particularly
when mea sured on commercial grounds. And so it makes sense that China would intensify its
efforts.
For the last de cade China’s technology policy has been recast in a broader framework of promot-
ing innovation, which is defined as the development and application of novel technologies, prod-
ucts, and ser vices to address societal and economic challenges. China’s leadership has identified
creating an innovative society as key to achieving sustainable growth over the coming de cades
and avoiding falling into the middle- income trap. “Innovation” (chuangxin 创新) has become one of
the most ubiquitous buzzwords in the entire country, uttered often by central and local officials,
companies, and schoolchildren.1
What is concerning is not China’s ambition to become an innovator, but its par tic u lar strategy. The
People’s Republic of China (PRC) is pursuing a techno- nationalist approach that supports domes-
tic industry at the expense of its foreign competitors. The 2006 Medium to Long- Term Plan for the
Development of Science and Technology (2006–2020) embraced the concept of “indigenous
innovation” (zizhu chuangxin 自主创新), which guides policy to this day. Soon after, China began
1. The Communist Party has even released a booklet of President Xi’s statements on the topic. See Chinese Commu-
nist Party Central Document Research Office, ed., Excerpted Comments of Xi Jinping on Science & Technology
Innovation (Beijing: Central Document Press, 2016).
594-71093_ch01_4P.indd 1 8/29/17 9:50 AM
The Fat Tech Dragon2
funding vari ous “megaprojects” to develop impor tant technologies, and in 2010 the central gov-
ernment identified seven major “strategic emerging industries” (SEI) that were to receive special
support.2 The 13th Five- Year Plan, adopted in March 2016, turbocharges these efforts by identify-
ing an even wider range of technologies to receive the full backing of the Chinese state.3 The
current centerpiece of China’s innovation drive is its “Made in China 2025” (MC2025) plan, which
sets as its goal the localization of entire supply chains in a wide range of industries. MC2025 and
the other initiatives utilize a full array of policies: government and state- directed financing, strate-
gic mergers and acquisitions (M&As), deft use of competition policy to promote domestic national
champions and constrain foreign competitors, distinctive technical standards, aggressive protec-
tion of Chinese- owned intellectual property, buy- domestic government procurement directives,
and broad assertion of national security needs to justify reliance on home- grown technologies
and burdensome constraints on the be hav ior of foreign companies.4 China is also increasingly
integrating efforts to develop technologies in the civilian and military spheres.
Although the Chinese government asserts that its intervention does not discriminate against
foreign industry, the evidence compiled by many observers points to the contrary. Surveys of
American and Eu ro pean companies indicate a worsening business climate in China, particularly for
high- tech firms.5 Individual foreign companies rarely criticize Chinese policy in public, but confi-
dential interviews with dozens of industry representatives and analysts yielded an array of specific
complaints of unfair treatment even more critical than the comments reflected in the general
surveys.
From a global perspective, China’s approach to high tech carries potential major risks because of
the country’s unique size and unparalleled ability to mobilize resources. Chinese companies that
receive extensive state support are eating into the market share of international competitors, both
2. Chen Ling and Barry Naughton, “The Emergence of Chinese Techno- Industrial Policy: From Megaprojects to
Strategic Emerging Industries, 2003–2011,” Instituto Nacional de Ciéncia e Tecnologia em Politicas Públicas, Estraté-
gias e Desenbolvimento (INCT/PPED), January 2013, http:// inctpped.ie . ufrj . br / spiderweb / pdf / Chen _ Ling _ and _ Barry
_ Naughton . pdf; Yu Zhou and Xielin Liu, “Evolution of Chinese State Policies on Innovation,” in China as an Innovation
Nation, ed. Yu Zhou, William Lazonick, and Yifei Sun (Oxford: Oxford University Press, 2016), 33–67; and Scott Ken-
nedy, “Indigenous Innovation: Techno- Nationalist Retreat?,” GKDragonomics, China Policy Watch Series, March 2,
2012.
3. Scott Kennedy and Christopher K. Johnson, Perfecting China, Inc.: The 13th Five- Year Plan (Washington, DC: CSIS,
May 2016), https:// csis - prod.s3 . amazonaws . com / s3fs - public / publication / 160521 _ Kennedy _ PerfectingChinaInc _ Web
. pdf. The central government has updated its strategic emerging industries list on at least two occasions, and provinces
maintain their own lists of strategic emerging industries.
4. Jost Wubbeke et al., Made in China 2025: The Making of a High- Tech Superpower and Consequences for Industrial
Countries (Berlin: Mercator Institute for China Studies, December 2016); China Manufacturing 2025: Putting Industrial
Policy Ahead of Market Forces (Beijing: Eu ro pean Union Chamber of Commerce in China, March 2017); Made in China
2025: Global Ambitions Built on Local Protections (Washington, DC: U.S. Chamber of Commerce, 2017); and Robert D.
Atkinson, Nigel Cory, and Stephen Ezell, “Stopping China’s Mercantilism: A Doctrine of Constructive, Alliance- Backed
Confrontation,” Information Technology & Innovation Foundation, March 2017.
5. 2017 American Business in China White Paper (Beijing: American Chamber of Commerce in China, 2017); and
Eu ro pean Business in China: Business Confidence Survey 2017 (Beijing: Eu ro pean Union Chamber of Commerce in
China, May 2017).
594-71093_ch01_4P.indd 2 8/29/17 9:51 AM
Scott Kennedy 3
in China and elsewhere. More importantly, if left unchecked, it is pos si ble that this frenzy of cheap
financing and other industrial policies could imperil not only individual companies, but long-
standing supply chains and business models that would make it more difficult for companies with
bud get constraints to continue investing in the research and development (R&D) that is a key
source of continued pro gress in sector after sector. To put it plainly, China could do to semi-
conductors, artificial intelligence, and phar ma ceu ti cals what it has done to steel and aluminum.
This could, in turn, result in a downturn in overall productivity, the most impor tant source of
growth for countries and the global economy.
ANOTHER METRIC: INNOVATION PER FOR MANCE
A conversation about China’s innovation drive should not only be rooted in issues of legal compli-
ance, reciprocity, or ideological arguments about the benefits of free markets. Allegations and
even proof of unjust tactics by China show how the country’s approach is potentially dangerous
for others, but not necessarily for China itself. Moreover, not all government intervention is illegal
or eco nom ically misguided. Governments in Eu rope and East Asia have intervened in a variety of
industries over the years.6 The United States has supported infant high- tech industries, and re-
cently there has been a vigorous domestic debate about whether the U.S. government should
itself have a robust industrial policy. The Obama administration developed a national innovation
strategy that identified key sectors that should receive priority support.7 Legal arguments are often
met by Chinese interlocutors with denials, but just as often with the retort, “You and others have
done this, too.”
Hence, a central part of the discussion should be about the economic efficiency and effectiveness
of what China is doing. Is China’s techno- nationalist strategy working? More specifically, is China
generating sufficient successes that yield improved commercial per for mance, raising the country’s
productivity and providing benefits to consumers and the broader society? If so, no amount of
legal wrangling and lecturing will be persuasive. But if not, there is a greater chance China and its
trading partners can have a more productive conversation about the best way to move forward.
HOT AND COLD VIEWS
In the last few years, along with reports critiquing Chinese government policies, there has si mul ta-
neously emerged an equally massive wave of breathless popu lar commentary highlighting the
accomplishments of Chinese researchers and companies. China now boasts the world’s fastest
6. Alice H. Amsden, The Rise of “The Rest”: Challenges to the West from Late- Industrializing Economies (Oxford:
Oxford University Press, 2008); Ha- Joon Chang, Bad Samaritans: The Myth of Free Trade and the Secret History of
Capitalism (New York: Bloomsbury Press, 2008).
7. National Economic Council and Office of Science and Technology Policy, “A Strategy for American Innovation,”
October 2015.
594-71093_ch01_4P.indd 3 8/29/17 9:51 AM

The Fat Tech Dragon4
supercomputer and the world’s largest telescope.8 Alibaba and its founder, Jack Ma, are the most
identifiable icons of China’s emerging innovation prowess, but far from the only ones. The emer-
gence of well- recognized Chinese companies such as Tencent, Xiaomi, BYD, and Huawei provides
support for the argument that China’s approach is bearing fruit.9
Yet a few notable companies and entrepreneurs are insufficient proof that China has genuinely
turned the corner and is on the right path. The scholarly research shows an improving, though still
highly mixed, picture. The notion that innovation in China is impossible has long since passed, and
the debate now is about how vari ous factors help or hinder innovation and what the pattern of
success and failure is.10 Achieving innovation requires human talent, financing, protection of
intellectual property rights (IPR), and some sort of diffusion channel, usually a commercial market
but in some cases a government procurement system, so that novel creations can reach end
users in society. There are weaknesses in each of these areas in China that act as a drag on inno-
vation, including an education system that encourages deference to authority and does not pre-
pare students to be creative and take risks, a financial system that disproportionately funnels funds
to undeserving state- owned enterprises (SOEs), weak protection of IPR, and a market structure
where profits can be made through a low- margin, high- volume strategy or through po liti cal
connections.11
At the same time, experts point to pro gress in each of these areas. China annually gradu ates the
world’s largest pool of scientists and engineers, and though not encouraged to be creative in
school, Chinese workers can learn on the job, either through training by their employers or in their
own start- ups. An increasing percentage of bank loans has started to flow to private companies,
and new sources of financing, such as venture capital, have emerged. The legal environment and
funding to protect IPR has expanded. Moreover, China’s large market size offers the economies of
scale to reward successful innovation as well as provide a large user base against which to test and
refine products and ser vices.12
8. Zhang Min and Ma Si, “Tianhe-3 to Offer Faster, Sharper Data Pro cessing,” China Daily, May 17, 2017, http:// www
.chinadaily . com . cn / business / tech / 2017 - 05 / 17 / content _ 29376120 . htm; Chris Buckley and Adam Wu, “China Hunts for
Scientific Glory, and Aliens, With New Telescope,” New York Times, September 25, 2016.
9. Duncan Clark, Alibaba: The House That Jack Ma Built (New York: HarperCollins, 2016); Edward Tse, China’s Disrup-
tors: How Alibaba, Xiaomi, Tencent, and Other Companies are Changing the Rules of Business (New York: Portfolio,
2015); and Shaun Rein, The End of Copycat China: The Rise of Creativity, Innovation, and Individualism in Asia
(Hoboken, NJ: Wiley, 2014).
10. Useful summaries are Andrew B. Kennedy, “Power houses or Pretenders? Debating China’s and India’s Emergence
as Technological Powers,” Pacific Review 28, no. 2 (2015): 281–302; and William Lazonick, Yu Zhou, and Yifei Sun,
“Introduction: China’s Transformation to an Innovation Nation,” in Yu Zhou, William Lazonick, and Yifei Sun, eds., China
as an Innovation Nation, 1–32.
11. Linda Jakobson, “China Aims High in Science and Technology: An Overview of the Challenges Ahead,” in Innova-
tion with Chinese Characteristics: High- Tech Research in China, ed. Linda Jakobson (New York: Palgrave Macmillan,
2007); and Regina M. Abrami et al., “Why China Can’t Innovate,” Harvard Business Review (March 2014), https:// hbr.org
/ 2014 / 03 / why - china - cant - innovate .
12. Loren Brandt and Eric Thun, “The Fight for the Middle: Upgrading, Competition, and Industrial Development in
China,” World Development 38, no. 11 (2010): 1155–1174; Angang Hu, China in 2020: A New Type of Superpower
(Washington, DC: Brookings Institution Press, 2011).
594-71093_ch01_4P.indd 4 8/29/17 9:51 AM

Scott Kennedy 5
Under lying the strengths and weaknesses of each of these factors is a broader debate about two
larger forces, the Chinese state and globalization. One’s expectations about China’s ability to
innovate turns substantially on one’s confidence in the Chinese party- state’s leadership, their
policies, and the country’s po liti cal institutions. Those who believe the government can and has
played a productive role are more optimistic than those who see state intervention as a major
hindrance.13 At the same time, there is an emerging view among those critical of state intervention
that some of the resulting prob lems have to some extent been ameliorated by China’s extensive
engagement with the world economy. The paths to pro gress via globalization have been many
and include: (1) sending millions of students to study abroad; (2) attracting foreign investors who
share technology with local partners, create R&D centers, and train their Chinese employees; and (3)
Chinese industry setting up shop in Silicon Valley and other high- tech hubs, acquiring technology
through M&As, and hiring talent away from their Western competitors.14
Given this mix of factors, it is not surprising that the most common conclusion reached by schol-
ars is that innovation success in China is partial and varied. Some highlight the differences across
regions, recognizing that variation in local industry structures— the types of firms and networks—
yields diff er ent approaches to technology development and commercialization.15 Others empha-
size the relative strength of multinationals, with par tic u lar emphasis recently being placed on
transnational ethnic Chinese companies that help nurture local talent and technology develop-
ment.16 But the most common recent finding is that Chinese industry has had more success with
innovations of technology applications and the integration of previously separate technologies—
what some call “second- generation innovations”— than with original basic- technology
breakthroughs.17
13. For negative critiques, see Jakobson, Innovation with Chinese Characteristics; George J. Gilboy, “The Myth Behind
China’s Miracle,” Foreign Affairs 83, no. 4 (July/August 2004): 33–48; Ernst Preeg, India and China: An Advanced Technology
Race and How the United States Should Respond (Washington, DC: CSIS/Manufacturers Alliance for Productivity and
Innovation, 2008); Barry Naughton, “China’s Economic Policy Today: The New State Activism,” Eurasian Geography and
Economics 52, no. 3 (2011): 313–329; and Anil Gupta and Haiyan Wang, “How China’s Government Helps— and Hinders—
Innovation,” Harvard Business Review (November 2016). For more positive assessments, see Can Huang and Naubahar
Sharif, “Global Technology Leadership: The Case of China,” Science and Public Policy 43, no. 1 (2015): 62–73; Sebastian
Heilmann, “From Local Experiments to National Policy: The Origins of China’s Distinctive Policy Pro cess,” China
Journal, no. 59 (January 2008): 1–30.
14. Gert Bruche, “The Emergence of China and India as New Competitors in MNCs’ Innovation Networks,” Competi-
tion & Change 13, no. 3 (2009): 267–288; Denis Fred Simon and Cong Cao, China’s Emerging Technological Edge:
Assessing the Role of High- End Talent (Cambridge: Cambridge University Press, 2009); McKinsey & Com pany, “Three
Snapshots of Chinese Innovation,” McKinsey Quarterly (February 2012); and Douglas B. Fuller, Paper Tigers, Hidden
Dragon: Firms and the Po liti cal Economy of China’s Technology Development (Oxford: Oxford University Press, 2016).
15. Adam Segal, Digital Dragon: High- Technology Enterprises in China (Ithaca, NY: Cornell University Press, 2003); and
Eric Thun, Changing Lanes in China: Foreign Direct Investment, Local Governments, and Auto Sector Development
(Cambridge: Cambridge University Press, 2006).
16. Fuller, Paper Tigers, Hidden Dragons.
17. Dan Breznitz and Michael Murphree, Run of the Red Queen: Government, Innovation, Globalization, and Economic
Growth in China (New Haven, CT: Yale University Press, 2011); The China Effect on Global Innovation, McKinsey Global
Institute, October 2015; and Yu Zhou, China as an Innovation Nation.
594-71093_ch01_4P.indd 5 8/29/17 9:51 AM

The Fat Tech Dragon6
OUR PROJ ECT AND THIS REPORT
The wave of flashy corporate portraits and more staid research has uncovered emerging areas of
pro gress as well as identified strengths and weaknesses that are likely to shape China’s path going
forward. Nevertheless, our picture of China’s innovation drive still needs to be more fully sketched
out. Much of the work has involved case studies, and so we still do not have a clear sense of China’s
overall pro gress. We need to have a better sense of whether the success stories are representative of
broader trends and part of a larger productive ecosystem or whether they are the exceptions to
the rule. Relatedly, there is insufficient understanding of how extensive government intervention
has helped and hindered corporate per for mance and broader trends in innovation. Equally impor-
tant, we also need a better sense of where China stands relative to other countries, a question only
rarely touched upon by previous analyses.
The purpose of CSIS’s China Innovation Policy Series (CIPS) is to build on existing research by
providing answers to these questions in ways that are helpful to scholars, policymakers, and busi-
ness leaders. The current report, the first in the series, begins the pro cess by developing a bench-
mark analy sis of innovation in China by systematically examining national trends in China as well as
placing the country in comparative perspective. The current report pres ents data on both innova-
tion inputs as well as several types of innovation outputs, including intellectual property and
commercial per for mance. This study relies primarily on broad quantitative mea sures because they
facilitate mea sur ing trends over time and engaging in cross- national comparison. The numerical
data are supplemented by several dozen interviews with business executives, industry analysts,
investors, and government officials carried out in the United States in China in late 2016 and the
first half of 2017.18 The quantitative data and interviews serve as complementary sources of infor-
mation. Often the two kinds of information align with each other, but when they do not, these
are welcomed as opportunities to challenge assumptions and conventional wisdom.
This report begins with an analy sis of China- specific and cross- national innovation indices, which
are used to establish the initial baseline of Chinese per for mance. Broadly speaking, whether one
looks at China in isolation or puts the country in comparative perspective, China’s innovation
per for mance has gradually improved over the last de cade along a number of indicators, moving
China ahead of other countries with a similar level of per capita income. The discussion then turns
to analyzing data on the most impor tant input, funding, and two kinds of outputs, intellectual
property and commercial per for mance. The result of this more discrete analy sis shows that inputs
such as spending have improved more quickly than outputs, which suggests a highly inefficient
pro cess that has yielded a disproportionate degree of false starts, failures, and waste. Although
there are more positive ways to interpret the data, our conclusion is that the commercial success
of China’s high- tech sector is not always the result of technology innovations, but of other factors.
In addition, pro gress appears to be quite uneven across sectors and types of companies.
18. In order to encourage open and frank dialogue about these impor tant issues, interview subjects were promised
anonymity and are only occasionally described in general terms in this report’s text. The author is grateful to the many
experts in government, business, the media, and other spheres who took time out of their busy schedules to share
their views.
594-71093_ch01_4P.indd 6 8/29/17 9:51 AM

Scott Kennedy 7
The report’s final section considers the implications of these findings for governments and indus-
try. These results could be varyingly interpreted, with some concluding that China’s efforts are
expensive yet sufficiently successful, and others finding that there is so little bang for the buck that
China should rethink its entire approach. As such, the significance of China being a “fat” high- tech
dragon could mean diff er ent things to diff er ent stakeholders.
594-71093_ch01_4P.indd 7 8/29/17 9:51 AM

8
02
General Trends in Innovation
INTRODUCTION
China has never been a place Americans could imagine being a hotbed of innovation. Although
the reasons have changed over the years— a Confucian deference to authority, a state socialist
regime supported by loyalists, and an education system that discourages creativity— the expected
outcome has been the same: China can copy but not create.
That’s why I was somewhat taken aback by a recent encounter with a taxi driver. Every
China expert secretly depends on taxi drivers to understand China. They are as talkative as
anyone we meet and willing to share their views on almost anything. I’ve spoken to several
Chinese taxi drivers about innovation, but I was shocked to discover that my most impor tant
taxi source was the driver who brought me home from Dulles Airport in Virginia. When I told
him I had just visited China, he responded without any sense of sarcasm, “Oh, the high- tech
superpower!” It turns out he was born in Ukraine, but his belief was far from alone among
Americans I spoke with over the last year. This impression is quite diff er ent from the long-
dominant conventional wisdom, in which China has been synonymous with counterfeits and
poor quality.
Other conversations I have had in the past several months with seasoned experts about China’s
innovation abilities touched off spirited arguments, with just as many boosters as critics. In inter-
views with experts in both China and global technology dynamics, observers offered widely
varying impressions of how much China has progressed. Some stressed how diff er ent China had
become from just a de cade ago as a result of more innovative domestic companies, while others
were more skeptical, pointing to poorly prepared engineers and scientists who do not know how
to operate in a corporate environment and are not focused on exacting standards of quality. One
veteran investor stressed a weak ethical environment in which shortcuts, shirking responsibility,
and deception are all too common; his investment strategy focuses heavi ly on breaking this
pattern.
594-71093_ch01_4P.indd 8 8/29/17 9:51 AM
Scott Kennedy 9
As these encounters suggest, mea sur ing innovation per for mance is not simple.1 These conflicting
impressions are highly suggestive of a continuing lack of consensus as well as a complex and evolv-
ing environment. A firmer conclusion about China’s trajectory would benefit from more systematic
sources of data. In this section, we pres ent and analyze quantitative data that are used to construct
broad indices of innovation per for mance. Some sources utilize large- scale surveys, but most
depend on physical mea sures related to vari ous ele ments of innovation, from education and
financing to IP and product sales. Having cross- national data is particularly helpful in obtaining a
clearer sense of China’s pro gress and continuing challenges. No one index or approach is perfect,
but a comparison of the vari ous indices yields significant findings, which will be explored further in
subsequent sections.
FINDING THE RIGHT INDEX
There are approximately a dozen cross- national comprehensive indices that speak to countries’
abilities to innovate, but this report focuses on five well- known sources that are particularly sug-
gestive. Indices are typically reported in two ways: basic scores mea sured in absolute numbers and
rankings based on countries’ relative per for mance against the others in the sample.2 As one can
see from Figures 1 and 2, diff er ent indices yield differing pictures of China’s innovation per for-
mance over the last several years.
The brightest assessment, not surprisingly, is presented by an index developed by China’s own
Ministry of Science and Technology (MOST), called the National Innovation Index (NII).3 This
mea sure is biased upward because the score depends heavi ly on gross figures in which China has
excelled: R&D spending, student enrollments in science and engineering programs, the number of
published scientific papers, the number of patents, high- tech exports, and government procure-
ment of technology. These gaudy numbers look impressive, but they may not translate into novel
technologies that shape markets or society. Moreover, the NII only ranks 40 countries, and so
China clearly sits in a higher position compared to other indices with larger samples.
Another index where China scores amazingly high is the recently created Bloomberg Innovation
Index (BII).4 In this case, there are only seven components of the index, and China scores well in
several of these areas, including R&D spending, manufacturing value added, and, in par tic u lar,
patent activity. In the most recent survey, China ranks 21st (out of 69 countries), ahead of every
other developing country in the world, with the only three Asian countries ahead of it being South
1. Christopher Mackie, rapporteur, Advancing Concepts and Models for Mea sur ing Innovation: Proceedings of a
Workshop (Washington DC: National Academies Press, 2017).
2. Some indices pres ent scores using a scale of 1–100, and others use a scale of 1–7. To permit comparability, we
normalized all scores into a 1–100 scale.
3. “2015 National Innovation Index Report,” Chinese Acad emy of Science and Technology for Development, China
Ministry of Science and Technology, http:// www.most . gov . cn / cxdc / cxdcpjbg / 201607 / P020160706603195938182 . pdf .
4. Michelle Jamrisko and Wei Lu, “ These Are the World’s Most Innovative Economies,” Bloomberg, January 19, 2016,
https:// www.bloomberg . com / news / articles / 2016 - 01 - 19 / these - are - the - world - s - most - innovative - economies .
594-71093_ch01_4P.indd 9 8/29/17 9:51 AM

The Fat Tech Dragon10
Korea (ranked 1st), Singapore (6th), and Japan (7th). Besides the small number of variables, another
reason to be concerned about the index is how young it is, with only three years of data.
At the other end of the spectrum is the Global Creativity Index (GCI). Developed by the Martin Pros-
perity Institute at the University of Toronto’s Rotman School of Management, China ranked only
62nd out of 139 countries in the index’s most recent version.5 China did raise its overall absolute score
in between the two times the index was mea sured (2011 and 2015), primarily due to greater R&D
spending and a growing number of researchers. However, China’s high ranking on technology (14th)
was counterbalanced by very poor per for mance in the other two components of the index, talent
(87th) and tolerance (96th). Talent is mea sured as the proportion of the workforce in the “creative
class” and the share of adults with higher education. Even though China has many scientists, artists,
and others who count as part of the creative class, as well as millions of college gradu ates annually,
these people still account for such a small percentage of the overall population that this component
drags down China’s score. The tolerance score is based on answers to a global survey conducted by
Gallup that asks whether people believe their own communities to be hospitable to minorities and gay
people, and Chinese respondents gave low marks on these questions. This index is rooted in a vision of
innovation that emerges from a progressive climate, for which con temporary China is a poor fit. The
5. “The Global Creativity Index 2015,” Martin Prosperity Institute, http:// martinprosperity.org / content / the - global
- creativity - index - 2015 / .
Figure 1. Innovation Indices: China’s Score
Global Innovation Index
Bloomberg Innovation Index
Global Creativity Index
National Innovation Index
Global Competitiveness Index
20
30
40
50
60
70
80
2009 2010 2011 2012 2013 2014 2015 2016
Source: See citations for each index for their respective sources.
594-71093_ch01_4P.indd 10 8/29/17 9:51 AM

Scott Kennedy 11
question is whether technology innovation can be produced in more closed social environments. If
so, this index understates China’s potential for successful innovation.
Sandwiched in between the extreme poles are two indices that may be more balanced. The first is
the Global Competitiveness Index (GCI). Developed by the World Economic Forum, the GCI is based
on an annual survey of almost 14,000 respondents in 135 countries from a wide range of small- to
large- sized companies who answer questions about economic and business issues in their own
countries.6 In its latest iteration, 355 valid surveys were collected from Chinese respondents. The
World Economic Forum draws on two parts of the survey, those addressing scientific innovation and
business sophistication, to calculate a score that serves as a good proxy for what we are examining in
this study. The survey questions on innovation ask respondents to judge China’s capacity for inno-
vation, the quality of its research institutions, com pany spending on R&D, university- industry colla-
boration, government procurement, the availability of scientists and engineers, and the quality of
IPR protection in the country.7 These mea sures are then combined with others mea sur ing business
sophistication, which ask about supplier quality, development clusters, marketing, and other factors.
6. The Global Competitiveness Report 2016–17 (Geneva, Switzerland: World Economic Forum, 2017), http:// www3
.weforum . org / docs / GCR2016 - 2017 / 05FullReport / TheGlobalCompetitivenessReport2016 - 2017 _ FINAL . pdf .
7. The innovation component also includes one physical mea sure, that of filed patents per million people in the population.
Figure 2. Innovation Indices: China’s Rank
Source: See citations for each index for their respective sources.
Global Innovation Index
Bloomberg Innovation Index
Global Creativity Index
National Innovation Index
Global Competitiveness Index
0
10
20
30
40
50
60
702009 2010 2011 2012 2013 2014 2015 2016
594-71093_ch01_4P.indd 11 8/29/17 9:51 AM

The Fat Tech Dragon12
The result yields a relatively positive picture, with China performing somewhat better on basic
innovation issues than on core aspects of business sophistication. Whether mea sured by the raw
score or relative rank, China’s position has generally remained relatively steady since 2009. To its
credit, the index benefits from the perspectives of a large number of business respondents, who
not only may be immune to hype or alarmism but also have a good sense of what innovation
means in commercial terms and not just as a po liti cal slogan. To the index’s detriment, respondents
only answer questions about their own country, and so cross- national comparison is not based on
actual common physical mea sures between diff er ent countries, leaving the possibility that the
index does not account for any potential gaps between subjective impressions and actual
per for mance.
THE GOLD STANDARD
The true gold standard of indices is the Global Innovation Index (GII), jointly published since 2007
by the World Intellectual Property Organ ization (WIPO), Cornell University’s SC Johnson College
of Business, and the Eu ro pean business school INSEAD.8 As shown in Table 1, with 103
8. For details about the Global Innovation Index’s history, methodology, and data, see its website, https:// www
.globalinnovationindex . org. Tellingly, as of mid-2017 the most recent report listed at the top of the website displays
Table 1. Global Innovation Index: China across Main Components, 2016
Number of Indicators China’s Score China’s Rank
Total 103 50.6 25
Institutions 11 55.2 79
Human Capital and Research
15 48.1 29
Infrastructure 13 52.0 36
Market Sophistication 13 56.6 21
Business Sophistication 18 53.8 7
Knowledge & Technology Outputs
17 53.3 6
Creative Outputs 16 42.7 30
Source: Global Innovation Index.
594-71093_ch01_4P.indd 12 8/29/17 9:51 AM

Scott Kennedy 13
Figure 3. GII: Scores of Selected Countries
Source: Global Innovation Index.
Note: There was a two- year gap (2007–2009) between the first and second reports.
China
Brazil
India
U.S.
Japan
Germany
South Korea
20
30
40
50
60
70
80
90
2007 2008 2009 2010 2011 2012 2013 2014 2015 2016
components in seven categories, the GII is far more comprehensive and balanced than any other
index. The individual components are primarily physical mea sures, but they also include some
survey responses because judgments about innovation also matter. The categories cover a range
of areas, beginning with the general environment, such as po liti cal institutions and infrastructure,
that can affect the potential for innovation. The index then moves on to more specific inputs
such as human capital and R&D. Fi nally, the index incorporates data from a range of outputs,
from those associated with basic knowledge and technologies to vari ous kinds of “creative out-
puts,” such as industrial designs, creative goods and ser vices, national feature films, and online
creativity. The 2016 index was calculated for 128 countries, giving it broad coverage over every
continent.
Looking specifically at China (see Figure 3), we see that its overall raw score actually peaked in
2009. It fell in the first few years after the global financial crisis and has recovered most of its value
since reaching its nadir in 2013. In China’s case, the drop was likely the result of the massive ex-
pansion of spending needed to generate continued economic growth in the short term, with less
focus on the quality of the investments; the result was a weakening of the input components of its
score. (For most countries, though, the likely cause was recession and an absolute decline in
links for both the En glish and Chinese versions. Until 2010, the index was calculated on a scale of 1–7, and since 2011
on a scale of 1–100. To allow for comparison, we normalized the earlier scores to the new scale.
594-71093_ch01_4P.indd 13 8/29/17 9:51 AM

The Fat Tech Dragon14
Figure 4. GII: Ranks of Selected Countries
Source: Global Innovation Index.
Note: There was a two- year gap (2007–2009) between the first and second reports.
China
Brazil
India
U.S.
Japan
Germany
South Korea
0
10
20
30
40
50
60
70
80
902007 2008 2009 2010 2011 2012 2013 2014 2015 2016
economic activity.) China’s total score in 2016 of 50.6 (out of 100) reflects relatively similar raw
scores across each of the seven categories, with market sophistication being the strongest (56.6)
and creative outputs the lowest (42.7).
China’s innovation picture, however, looks somewhat more positive when viewed in comparative
perspective. Figures 3 and 4 pres ent the overall score and rank of China and several other repre-
sentative countries. Regardless of which yardstick is used, China is distancing itself from other
emerging economies, such as Brazil and India, and gradually approaching more advanced
industrialized economies known for their innovation prowess. Even though its absolute score
has only risen five points since 2013, China’s global rank has jumped 10 places over the same
period.
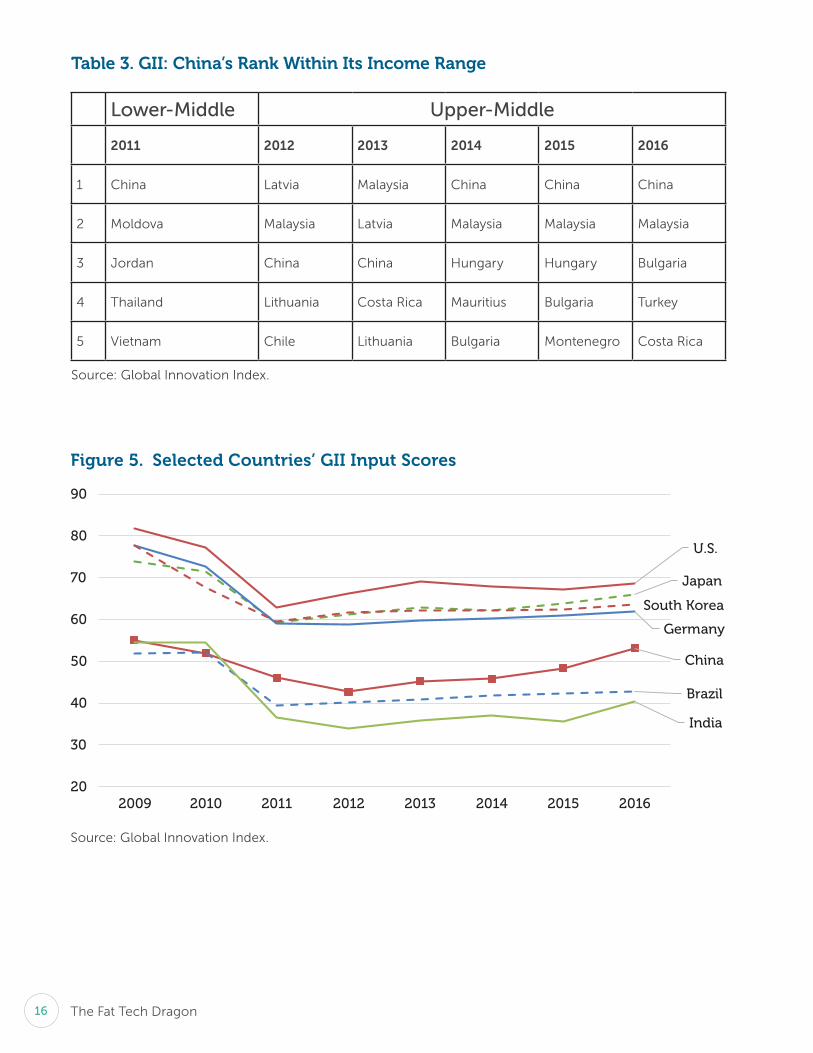
As Table 2 shows, China’s rank among Asian countries has remained steady over the past few
years, holding at seventh. More impressive is China’s standing among countries at a similar level of
development, based on World Bank classification standards (see Table 3). In 2011 China ranked first
among lower- middle income countries. China was reclassified as an upper- middle income coun-
try in 2012; since 2014 it has ranked first among this group.
594-71093_ch01_4P.indd 14 8/29/17 9:51 AM

Scott Kennedy 15
REASONS FOR CONCERN
This positive trend is clear, but there are signs of concern for China as well. The most impor tant is
that when one separates the scores into their components for inputs and outputs, China’s input
score (Figure 5) has been rising, but its output score (Figure 6) has fluctuated within a narrow
range. Relatedly, even though the absolute scores for output are closer to those of the world
leaders, it is still not clear that inputs in China translate into outputs in an efficient manner or
whether there is a longer time lag between inputs and outputs in China compared to other more
marketized economies.
Moreover, although the GII is the best cross- national index that currently exists, it is not perfect,
as it relies on data from many other sources, including the surveyed countries. It is likely that
China’s data on inputs and outputs is inflated. While this could be the case in all of the surveyed
countries, this possibility means that we should not accept the data as sacrosanct and that we
need to investigate both sides of the input- output equation more closely. This is the task of the
next three sections of the report.
Table 2. GII Rankings: China & the Asia- Pacific Region
2011 2012 2013 2014 2015 2016
1 Singapore Singapore Hong Kong Singapore Singapore Singapore
2 Hong Kong Hong Kong Singapore Hong Kong Hong Kong South Korea
3 New Zealand New Zealand New Zealand South Korea South Korea Hong Kong
4 South Korea South Korea South Korea Australia New Zealand Japan
5 Japan Australia Australia New Zealand Australia New Zealand
. . .
China 7 8 8 7 7 7
Source: Global Innovation Index.
594-71093_ch01_4P.indd 15 8/29/17 9:51 AM
The Fat Tech Dragon16
Table 3. GII: China’s Rank Within Its Income Range
Lower- Middle Upper- Middle
2011 2012 2013 2014 2015 2016
1 China Latvia Malaysia China China China
2 Moldova Malaysia Latvia Malaysia Malaysia Malaysia
3 Jordan China China Hungary Hungary Bulgaria
4 Thailand Lithuania Costa Rica Mauritius Bulgaria Turkey
5 Vietnam Chile Lithuania Bulgaria Montenegro Costa Rica
Source: Global Innovation Index.
Figure 5. Selected Countries’ GII Input Scores
Source: Global Innovation Index.
China
Brazil
India
U.S.
Japan
Germany
South Korea
20
30
40
50
60
70
80
90
2009 2010 2011 2012 2013 2014 2015 2016
594-71093_ch01_4P.indd 16 8/29/17 9:51 AM

Scott Kennedy 17
Figure 6. Selected Countries’ GII Output Scores
Source: Global Innovation Index.
China
Brazil
India
U.S.
Japan
Germany
South Korea
20
30
40
50
60
70
2009 2010 2011 2012 2013 2014 2015 2016
594-71093_ch01_4P.indd 17 8/29/17 9:51 AM

18
03
Financing Innovation
INTRODUCTION
There is no perfect recipe for innovation, but we do know what some of the main ingredients are:
human talent and funding. Without ideas, there can be nothing new, and without funding, these
creative ideas cannot be put into practice. Developing talent and directing funds to the right
targets depends on a host of other factors as well, among them vibrant educational and training
systems, a mature financial system, reliable physical infrastructure, sound po liti cal institutions, and
smart policies.
The human capital situation in the People’s Republic of China (PRC) is fascinating, but we will not
focus on it much here, as the story is already pretty well known. China gradu ates massive numbers
of scientists and engineers who have excellent basic technical skills but are not highly creative
risk- takers. China’s K-12 educational system, though highly meritocratic, is geared to preparing
students for the college entrance exam. Universities face a variety of social and po liti cal con-
straints in encouraging creativity, and students have limited opportunities for genuine exploratory
research in science and technology. One interview source who oversees his com pany’s training
programs noted that his firm has internship programs around the world; in the United States, one
in 20 interns are retained for permanent employment, but in China the figure is only one in 500.1
China compensates for the weaknesses in its domestic educational system by sending a huge
number of students to study abroad each year and then enticing them to return home, as well as
by hiring well- trained non- Chinese to work in their companies.
The picture on finance inputs is evolving in new and surprising ways and so is given more attention
here. By any mea sure, Chinese spending on technology development is increasing rapidly. And the
sources of funding are also diversifying. China’s financial system is no longer synonymous with its
1. Other interview sources challenged this example as not representative of their own experiences, particularly
recently, where they have encountered a growing number of talented and creative Chinese scientists, engineers, and
businesspeople. Hence, it is impor tant to be careful about how to interpret anecdotal evidence such as this.
594-71093_ch01_4P.indd 18 8/29/17 9:51 AM

Scott Kennedy 19
large state- owned banks; there are now regional banks, foreign banks, stock markets, purely
online investment vehicles (such as Alibaba’s Yu’e Bao money market ser vice), crowdfunding, bond
markets, commodity markets, venture cap i tal ists, and private equity investors. This expanding
panoply of investment channels should be welcomed, but it is worth examining toward what kinds
of initiatives all of this spending flows, and whether it is translating into innovation outputs that
raise productivity and serve society.
THE SHIFT TOWARD CORPORATE SPENDING
Spending on R&D has risen steadily, from 0.9 percent of gross domestic product (GDP) in 2000 to
2.1 percent in 2016, placing China in the com pany of other advanced industrialized economies
(see Figure 7). In absolute terms, the rise is far larger, from $10.9 billion in 2000 to $232 billion in
2016.2 The sources of funding have also diversified. As Figure 8 shows, government and academic
research institutes play a much smaller role in R&D than they did prior to the Reform Era or even
in 2000. Companies now account for 77 percent of all R&D activity, and the share taken on by
2. “MOST: Expects 2016 Annual Society R&D Expenditures to Be RMB 1,554 Billion,” CCTV, January 11, 2017, http://
news.cctv . com / 2017 / 01 / 11 / ARTIGl2OPlQWMEXQJvYr71H1170111 . shtml .
Figure 7. Total Expenditures on R&D in China (Percent of GDP)
Sources: For 2000 to 2014, the World Bank; for 2015 and 2016, China National Bureau of Statistics, China
Ministry of Science and Technology, and China Ministry of Finance.
0.0%
0.5%
1.0%
1.5%
2.0%
2.5%
2000 2002 2004 2006 2008 2010 2012 2014 2016
594-71093_ch01_4P.indd 19 8/29/17 9:51 AM

The Fat Tech Dragon20
government has been cut in half.3 To put this figure in comparative context, the proportion of R&D
carried out by the government in China is lower than in the United States (24 percent), the United
Kingdom (28 percent), and Germany (30 percent).4
The shift in China toward corporate use of R&D funds has also been accompanied by a transition
away from spending on basic science and toward applied research and development, with an
emphasis on investments that can be easily commercialized. To put it simply, there is much more
spending on “D” (development) than “R” (research) in China. According to China’s National Bureau
of Statistics, in 2015, out of the RMB 1.4 trillion ($209 billion) spent on R&D, just over 5 percent
went toward basic research, 10.8 percent toward applied research, and a whopping 84.2 percent
was directed toward development.5
In addition to looking at macro data from the Chinese government and international institutions,
another way to drill down on this question is to look at it in a bottom-up manner. We examined
Bloomberg data on all listed companies over the last de cade. We calculated the “R&D intensity” of
3. The figures on sources (government, companies, etc.), also from the OECD, track very closely with the data on
usage, and hence, are not presented here. See Main Science and Technology Indicators, vol. 2016, no. 2, (Paris: OECD,
2017), http:// www.oecd - ilibrary . org / science - and - technology / main - science - and - technology - indicators _ 2304277x .
4. Ibid. These figures are for 2015. The figure for Japan is 15 percent.
5. China National Bureau of Statistics, accessed August 1, 2017, http:// data.stats . gov . cn / easyquery . htm ? cn=C01.
Figure 8. Usage of R&D Funds in China
Source: OECD’s Main Science and Technology Indicators database.
0%
20%
40%
60%
80%
100%
2000 2002 2004 2006 2008 2010 2012 2014
Business Government Academic
594-71093_ch01_4P.indd 20 8/29/17 9:51 AM

Scott Kennedy 21
each firm based on its reported R&D expenditures and revenues to see not only how much Chi-
nese companies are spending, but if they are doing so at rates similar to or diff er ent from listed
companies in other countries.6
As shown in Figure 9, the data show that R&D spending among Chinese companies rose during
the 2000s, then fell after the global financial crisis, and then began rising again, reaching
1.50 percent of revenues in 2015. These findings are consistent with the macro data and indices,
which show China’s R&D spending to be somewhat below leading innovators but ahead of other
large developing countries. Since 2012 Chinese companies have begun separating themselves
6. The data include companies from several countries regardless of where the stock market is located on which they
are listed. We only include data from companies that report figures on both R&D and total revenues.
Figure 9. Corporate R&D Intensity (R&D/Revenue)
Source: Author’s calculations from Bloomberg database.
China
Germany
JapanSouth Korea
U.K.
U.S.
Brazil India Russia0%
1%
2%
3%
4%
5%
6%
7%
8%
9%
2005 2006 2007 2008 2009 2010 2011 2012 2013 2014 2015
594-71093_ch01_4P.indd 21 8/29/17 9:51 AM

The Fat Tech Dragon22
from those in other emerging economies such as Brazil, Rus sia, and India. Nevertheless, Chinese
companies still invest less in R&D than their corporate cousins in the United States, the United
Kingdom, Germany, South Korea, and Japan.
An impor tant caveat is that business spending is influenced by the Chinese government in other
ways than direct bud get allocations. State- owned banks typically adhere to industrial policy guide-
lines when issuing loans, and stock market IPOs and some kinds of corporate bonds can also be
subject to approval, at least informally, based on state priorities. The same can be true for move-
ment of funds in and out of the country for M&A deals. In addition, the central government and
local authorities have created general and sector- specific investment funds in the past few years
that are used to invest in priority areas. By the end of 2015, there were at least 780 such funds with
RMB 2.2 trillion ($328 billion) in capital.7 The largest component is in the semiconductor industry,
with the vari ous related funds totaling at least $120 billion.8 Private capital accounts for a large
share of these funds, but according to several interview sources, state guidance at the national
and local levels has a profound effect on actual investment decisions.
NEW GENERATION OF FINANCING INNOVATION
Despite the continued long reach of the state, an undeniably impor tant shift in China’s innovation
investment picture is the rise of genuine alternative sources of funding, such as venture capital
(VC) and private equity (PE). The level of VC activity has exploded. In 2000 there were 249 VC firms
with total capital of RMB 51.2 billion ($7.6 billion); by 2015, there were 1,775 VC firms with total
capital of RMB 665 billion ($99 billion). When Chinese VC was in its infancy, the large majority of
deals were in high tech. That figure gradually fell, reaching only 46 percent of investment in 2011,
but recovered to 60 percent of investment (and 65 percent of proj ects) by 2015.
The private equity sector is likewise booming and is even larger in absolute terms. By 2016, China
had 46,505 PE funds with RMB 7.89 trillion ($1.18 trillion) in capital under management.9 Over
time, PE funds have increasingly shifted their attention toward supporting advanced technology. In
terms of the number of individual proj ects, the Internet and IT were the top two targeted sectors
in 2015, whereas machinery manufacturing and chemical pro cessing were the leading recipi-
ents in 2011. In terms of overall investment levels, the financial sector is still the largest target, but
it is followed, in order, by the Internet, real estate, telecom, and biomedicine.10
VC and PE executives are highly enthusiastic about China, but they are also highly pragmatic. One
investor who has done business across Asia reflected widespread sentiment when he said that
7. Made in China 2025: Global Ambitions Built on Local Protections (Washington, DC: U.S. Chamber of Commerce
2017), 18n37.
8. Bob Davis and Eva Dou, “China’s Next Target: U.S. Microchip Hegemony,” Wall Street Journal, July 27, 2017, https://
www.wsj . com / articles / chinas - next - target - u - s - microchip - hegemony - 1501168303 .
9. Private Equity Capital Comprehensive Filed Case Situation [私募资金整体备案情况] (Beijing: China Securities Regula-
tory Commission, 2016), http:// www.csrc . gov . cn / pub / zjhpublic / G00306226 / 201701 / t20170109 _ 309140 . htm .
10. 2015 China Private Equity Investment Annual Research Report [2015 年中国私募股权投资年度研究报告] (Beijing:
Qingke/Simutong, February 23, 2016), cited in http:// pe.pedaily . cn / 201601 / 20160113392457 . shtml .
594-71093_ch01_4P.indd 22 8/29/17 9:51 AM

Scott Kennedy 23
Beijing unequivocally is currently the “most exciting location for VC in the world.” He and others
breathlessly described a variety of proj ects they had launched that had generated double- digit
returns. Another industry observer held that the quality of technologies investors were considering
had risen substantially over the last de cade and were now in some sectors on par with those in
Silicon Valley and other famous technology hubs.
VC and PE investors in China are also highly realistic and, despite their reputation, less adventurous
than one might expect. Hence, they typically avoid entirely untested technologies and garage-
style techies with good ideas but little business experience. True angel investors are rare in China.
Instead, investors prefer to support technologies that have already shown commercial promise. As
one told me, “We don’t invest in zero to one, we invest in one to one hundred.” That is, they avoid
getting an entirely new technology off the ground and instead focus on helping a business scale
up. Hence, they are drawn toward commercially viable applications and customizations for the
China market.
The general quantitative data reflect these sentiments. Around half of all VC proj ects that receive
funds are beyond the start-up phase, are either growing or mature, and in some cases, are being
restructured. From 2004 to 2016, the percentage of VC deals invested in at the seed/angel level in
the United States grew from 9 percent to 50.6 percent of the total.11 By contrast, in China only
18.2 percent of VC investment in 2015 was in seed- level proj ects.
11. Yuan Wang et al., China Venture Capital Yearbook (Beijing: Economy and Management Press, vari ous years).
Figure 10. Venture Capital Distribution of Investment
Source: China Venture Capital Yearbook, vari ous years.
0%
10%
20%
30%
40%
50%
60%
70%
80%
90%
100%
2003 2004 2005 2006 2007 2008 2009 2010 2011 2012 2013 2014
High-Technology Industries Traditional Industries
594-71093_ch01_4P.indd 23 8/29/17 9:51 AM

The Fat Tech Dragon24
Another clear sign of investors’ reticence in going too far out on a limb is that the proportion of
proj ects in high- tech industries that yield a profit has been almost identical to that in traditional
industries. In 2014, the last year for which data are available, 47.8 percent of high- tech proj ects
were profitable, compared to only 38.5 percent in traditional industries. If investors were embrac-
ing a lot of novel technologies, the likelihood of success would be lower than in other sectors. By
contrast, in the United States, the likelihood of success for VC proj ects is somewhat lower; only
35 percent of VC investment made in the United States between 2004 and 2013 was profitable.12
CONCLUSION
The amount of funds that China has dedicated to developing advanced technologies is staggering.
Old- school banks and new- school investment vehicles are all getting in on the action. No longer
are funds just being tossed at large- scale white elephants. Commercial competitiveness is now a
12. Seth Levine, “Venture Outcomes Are Even More Skewed Than You Think,” VC Adventure, August 12, 2014, http://
www.sethlevine . com / archives / 2014 / 08 / venture - outcomes - are - even - more - skewed - than - you - think . html .
Figure 11. Stages of VC Proj ects Invested in China
Source: China Venture Capital Yearbook, vari ous years.
0%
20%
40%
60%
80%
100%
2003 2005 2007 2009 2011 2013 2015
Seed Start-Up Growth Mature Restructure
594-71093_ch01_4P.indd 24 8/29/17 9:51 AM

Scott Kennedy 25
central part of the decision calculus. Although this is a definite improvement over the earlier
financing system, it is reasonable to consider whether China has overcorrected. By avoiding
spending on basic research and foundational technologies, income is being generated less as a
result of novel technologies and more as a result of new applications or business models. These
are reasonable strategies, but they suggest that China differs from more established technology
leaders.
One paradox is that despite an investment focus on non- core technologies, patenting activity in
China has risen dramatically. The next section seeks to explain this puzzle by suggesting that
perhaps there is less novel knowledge creation in China than meets the eye.
Figure 12. VC Per for mance: Proportion of Profitable Proj ects
Source: China Venture Capital Yearbook, vari ous years.
High-Tech Industries
Traditional Industries
0%
20%
40%
60%
80%
100%
2006 2007 2008 2009 2010 2011 2012 2013 2014
594-71093_ch01_4P.indd 25 8/29/17 9:51 AM

26
04
Creating Valuable Knowledge
INTRODUCTION
An impor tant mea sure of whether China’s innovation drive is paying dividends is to assess the
value the country places on intellectual property (IP). Some innovations are not associated with
any par tic u lar IP, but typically innovators file for patent, copyright, or trademark protection to
protect their contribution and increase the likelihood that they can generate sufficient returns to
recoup the original investment and generate profits. China has been the largest source of IP
violations globally, a place where counterfeits and pirated goods seemed in endless supply.
China’s relationship with IP has evolved substantially in the last two de cades as the government
and businesses have recognized that developing, utilizing, and leveraging IP is central to the coun-
try becoming a high- tech power. To some extent, this shift was borne out of admiration of the
world’s leading innovators in industry and academia, but it also emerged out of the jealousy
created in the 1990s when China first started paying steep royalties to IP holders in the United
States, Eu rope, and Japan. Particularly ingrained in China’s memory was what was perceived as
exorbitant royalties paid to Qualcomm for its CDMA technology used in second- generation cellu-
lar technology and to the DVD Forum for DVD players that Chinese companies assembled.
As a result, China has shifted its overall posture from seeing itself as a consumer of IP who stresses
its diffusion, legal and illegal, to seeing itself as an IP creator who emphasizes the need to protect
IP rights and reward the work of innovators. China has joined all of the world’s impor tant IP trea-
ties, drafted and updated its vari ous IP statutes, strengthened its IP bureaucracy, encouraged the
filing of IP, and created IP courts to handle legal disputes.1 China has also ramped up its efforts to
set novel domestic technology standards and shape international standards based on proprietary
1. See Bruce Reynolds and Susan K. Sell, “China’s Role in Global Governance: A Comparison of Foreign Exchange and
Intellectual Property,” in Global Governance and China: The Dragon’s Learning Curve, ed. Scott Kennedy (New York:
Routledge, 2017), 132–157.
594-71093_ch01_4P.indd 26 8/29/17 9:51 AM
Scott Kennedy 27
Chinese technology.2 IP theft is still a massive prob lem, and has moved from the street to online,
but there has been pro gress in some significant ways. The Business Software Alliance estimates
that in 2015, 70 percent of installed software in China was pirated, down from 79 percent in 2009,
and 93 percent in 2003. This is still far higher than piracy rates in the United States and Eu rope, but
the trajectory is clear.3
Integral to this transition has been the increase in IP filing activity, particularly patents, which is the
focus of this section of the report. As with the analy sis on financial inputs, the current picture for
IP is decidedly mixed. Although patent filing has risen dramatically, the actual commercial value of
Chinese patents is still extremely low. This outcome raises questions about the efficacy of the R&D
spending and efforts documented in the preceding section.
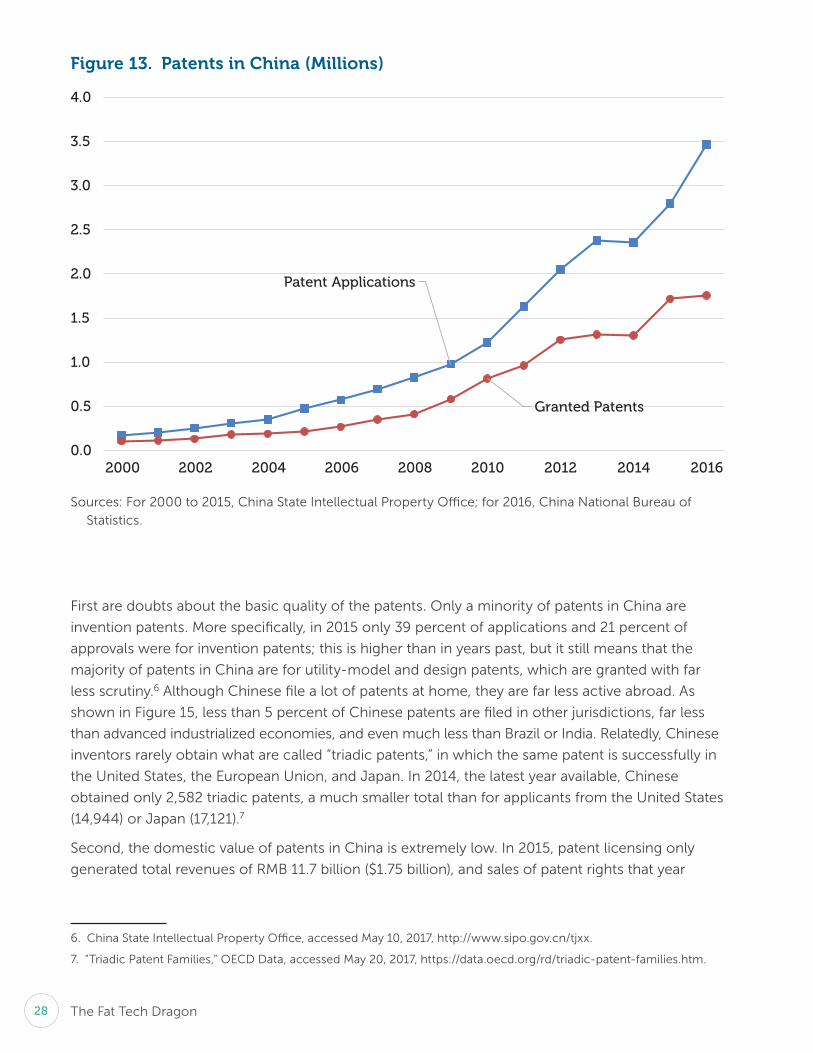
PATENT AWAY!
The growth of patent filing in China is astounding. Chinese applied for only 170,000 patents in
2000, but in 2015 submitted almost 2.8 million applications. The number of granted patents is
somewhat lower, but the trajectory is the same (see Figure 13). The vast majority of patent applica-
tions, over 93 percent, are filed by permanent residents of China, not foreigners.4
According to the World Intellectual Property Organ ization (WIPO), China has also moved up in
terms of filing international patent applications. The country now files far more international
patents than Germany or South Korea and almost as many as Japan and the United States (see
Figure 14). In fact, in 2008 Huawei became the first Chinese com pany to be the world’s single largest
patent filer. Since then Huawei and ZTE have held the number one spot for six of nine years, with
ZTE at the head of the pack in 2016.5
PATENT PROB LEMS
Despite the about- face in attitude towards IP, it is unclear that this activity has translated into
technological innovations with equally impressive commercial value. The further one digs, the
weaker China’s patent credentials appear.
2. Scott Kennedy, Richard P. Suttmeier, and Jun Su, “Standards, Stakeholders, and Innovation: China’s Evolving Role in
the Global Knowledge Economy,” NBR Special Report, no. 15 (Seattle: National Bureau of Asian Research, Septem-
ber 2008).
3. Software piracy has been reduced by the movement away from sales to licensing and from boxed software to
cloud- based applications. Seizing Opportunity Through License Compliance: BSA Global Software Survey, Business
Software Alliance, May 2016, http:// globalstudy.bsa . org / 2016 / downloads / studies / BSA _ GSS _ US . pdf .
4. World Intellectual Property Organ ization (WIPO), “Intellectual Property Statistics,” database, accessed April 30, 2017,
http:// www.wipo . int / ipstats / en / .
5. World Intellectual Property Organ ization, “Rec ord Year for International Patent Applications in 2016; Strong Demand
Also for Trademark and Industrial Design Protection,” March 15, 2017, http:// www.wipo . int / pressroom / en / articles / 2017
/ article _ 0002 . html; and WIPO, “World Intellectual Property Indicators,” vari ous years, http:// wipo . int .
594-71093_ch01_4P.indd 27 8/29/17 9:51 AM
The Fat Tech Dragon28
First are doubts about the basic quality of the patents. Only a minority of patents in China are
invention patents. More specifically, in 2015 only 39 percent of applications and 21 percent of
approvals were for invention patents; this is higher than in years past, but it still means that the
majority of patents in China are for utility- model and design patents, which are granted with far
less scrutiny.6 Although Chinese file a lot of patents at home, they are far less active abroad. As
shown in Figure 15, less than 5 percent of Chinese patents are filed in other jurisdictions, far less
than advanced industrialized economies, and even much less than Brazil or India. Relatedly, Chinese
inventors rarely obtain what are called “triadic patents,” in which the same patent is successfully in
the United States, the Eu ro pean Union, and Japan. In 2014, the latest year available, Chinese
obtained only 2,582 triadic patents, a much smaller total than for applicants from the United States
(14,944) or Japan (17,121).7
Second, the domestic value of patents in China is extremely low. In 2015, patent licensing only
generated total revenues of RMB 11.7 billion ($1.75 billion), and sales of patent rights that year
6. China State Intellectual Property Office, accessed May 10, 2017, http:// www.sipo . gov . cn / tjxx .
7. “Triadic Patent Families,” OECD Data, accessed May 20, 2017, https:// data.oecd . org / rd / triadic - patent - families . htm .
Figure 13. Patents in China (Millions)
Sources: For 2000 to 2015, China State Intellectual Property Office; for 2016, China National Bureau of
Statistics.
Patent Applications
Granted Patents
0.0
0.5
1.0
1.5
2.0
2.5
3.0
3.5
4.0
2000 2002 2004 2006 2008 2010 2012 2014 2016
594-71093_ch01_4P.indd 28 8/29/17 9:51 AM

Scott Kennedy 29
totaled RMB 9.25 billion ($1.38 billion).8 By contrast, in the United States in 2012 (the most recent
year data are available), IP licensing revenue totaled $115.2 billion. The American economy is
approximately six times the size of China’s, but IP’s direct value to the United States is roughly 100
times greater.9 Similarly, although domestic mergers and acquisitions have skyrocketed, according
to an IP lawyer, patent and copyright portfolios are given short shrift when determining both
parties’ valuations and usually have little to no effect on the terms of the deal. Fi nally, although
Chinese are taking each other to court for IP infringement in rec ord numbers, the average award
in a patent infringement case is puny, in 2016 reaching only RMB 98,000 ($14,627). By contrast,
the median patent damage award in the United States over the last few years has been $7.3
million.10 The U.S. figures may seem excessive, but the typical award in China is far from a disin-
centive to appropriate someone else’s invention. Another sign of the low value of patent awards in
China not dependent on external comparisons is the relatively higher awards given in competition
cases. According to the London- based firm Rouse, the average award for competition cases in
8. China Science & Technology Yearbook 2016 (Beijing: China Statistics Press, 2016), 208.
9. U.S. Patent & Trademark Office, “Intellectual Property and the U.S. Economy: 2016 Update,” September 2016,
https:// www.uspto . gov / sites / default / files / documents / IPandtheUSEconomySept2016 . pdf .
10. Chris Barry et al, “2016 Patent Litigation Study: Are We at an Inflection Point?,” Pricewater houseCoopers, May 2016,
https:// www.pwc . com / us / en / forensic - services / publications / assets / 2016 - pwc - patent - litigation - study . pdf .
Figure 14. International Patent Applications (Thousands)
Source: World Intellectual Property Organ ization.
Note: International patent applications filed under the Patent Cooperation Treaty (PCT).
China
Germany
Japan
South Korea
U.S.
0
10
20
30
40
50
60
70
2001 2003 2005 2007 2009 2011 2013 2015
594-71093_ch01_4P.indd 29 8/29/17 9:51 AM
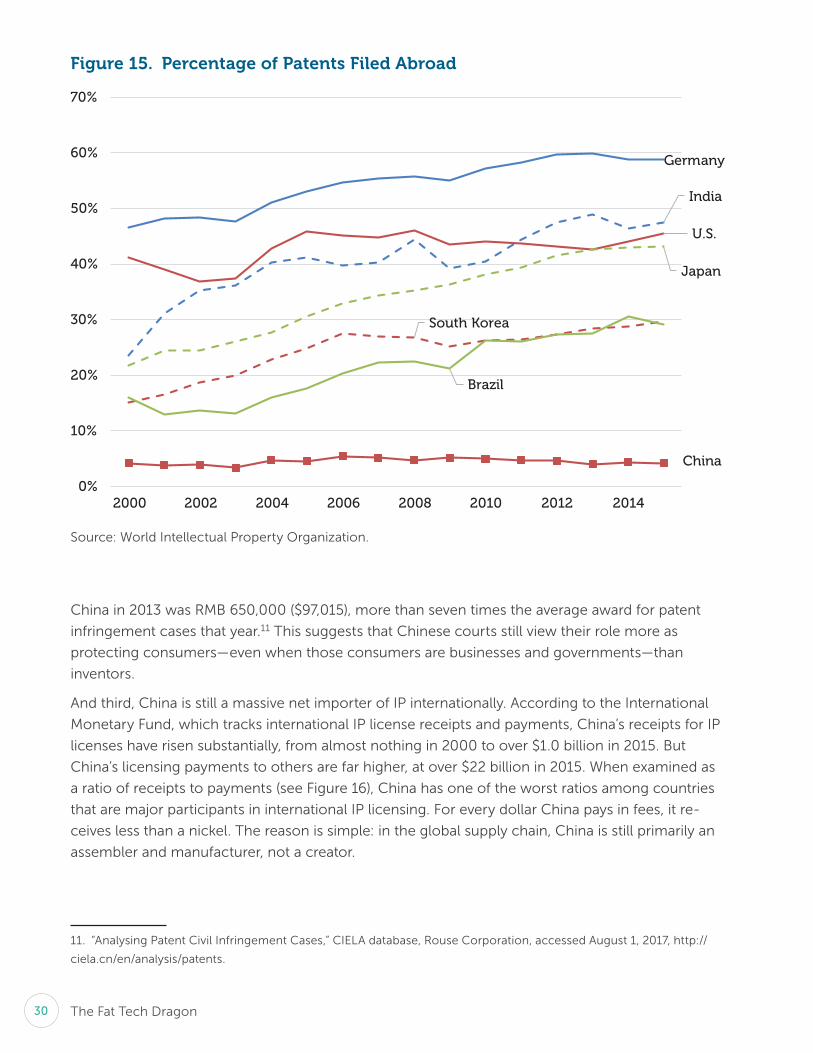
The Fat Tech Dragon30
China in 2013 was RMB 650,000 ($97,015), more than seven times the average award for patent
infringement cases that year.11 This suggests that Chinese courts still view their role more as
protecting consumers— even when those consumers are businesses and governments— than
inventors.
And third, China is still a massive net importer of IP internationally. According to the International
Monetary Fund, which tracks international IP license receipts and payments, China’s receipts for IP
licenses have risen substantially, from almost nothing in 2000 to over $1.0 billion in 2015. But
China’s licensing payments to others are far higher, at over $22 billion in 2015. When examined as
a ratio of receipts to payments (see Figure 16), China has one of the worst ratios among countries
that are major participants in international IP licensing. For every dollar China pays in fees, it re-
ceives less than a nickel. The reason is simple: in the global supply chain, China is still primarily an
assembler and manufacturer, not a creator.
11. “Analysing Patent Civil Infringement Cases,” CIELA database, Rouse Corporation, accessed August 1, 2017, http://
ciela.cn / en / analysis / patents .
Figure 15. Percentage of Patents Filed Abroad
Source: World Intellectual Property Organ ization.
China
U.S.
Japan
South Korea
Germany
Brazil
India
0%
10%
20%
30%
40%
50%
60%
70%
2000 2002 2004 2006 2008 2010 2012 2014
594-71093_ch01_4P.indd 30 8/29/17 9:51 AM

Scott Kennedy 31
CONCLUSION
China’s embrace of IP is positive when contrasted with the country’s original disdain for property
rights of any sort and widespread violation of IP rights. However, China’s about- face is incomplete.
The Chinese state is not entirely withdrawing, but is, in fact, strengthening its role in some regards.
China’s efforts to develop and obtain more IP are driven heavi ly by bureaucratic imperatives as
opposed to market incentives. Authorities do not believe that IP should be created, traded, and
defended on pure commercial princi ples. As China’s own IP strategy documents make clear, IP is
meant to serve national goals, and the government is expected to continue to play a major role in
every facet of the pro cess.
Hence, China may now be a “large” IP country, but it is still a “weak” one. Chinese annually apply
for and receive as many patents as are given to any other country, yet Chinese patents often have
little commercial value. Whether one is discussing licensing and royalties, mergers and acquisi-
tions, or dispute settlement, patents do not get the re spect they receive in other countries. This
reflects the fact that much of the initiative to patent comes from the government and not the
market. And without sufficient market support for patents and other types of IP, deep technology
innovation will be hard to sustain.
Figure 16. IP International Licensing Ratio: Receipts- to- Payments, 2015
Source: International Monetary Fund.
China
India
Brazil
Russia
Singap
ore
South
Kore
aIsr
eal
U.K.
Germ
any
Japan U.S.
0.5
1.0
1.5
2.0
2.5
3.0
3.5
594-71093_ch01_4P.indd 31 8/29/17 9:51 AM

32
05
Commercial Per for mance
INTRODUCTION
The best mea sure of whether all of the efforts to mobilize resources to generate innovation is the
effect this activity has on commercial per for mance and overall trends in the economy. Training in
math and science, funding for R&D, and patents mean little—to people other than bureaucrats, at
least—if they do not translate into novel products that are successfully designed, built, and sold.
The question this section attempts to answer is to what extent China’s intensive policy focus on
advanced technology is paying off and resulting in more successful Chinese companies. To do so,
this section first considers broad gauges of technology’s contribution to China’s economy; it then
turns to a more micro company- based perspective. The discussion concludes by seeking to
explain the reasons for the emergence of a coterie of more vis i ble Chinese companies in a range
of sectors.
THE MACRO VIEW
The official analy sis put forward by the Chinese government is that its focus on indigenous inno-
vation is working exceedingly well. In addition to the National Innovation Index introduced earlier
in this report, authorities marshal an array of evidence to support their claim. The core statistic
they cite is the Science & Technology Pro gress Contribution Rate (STPCR), which essentially
mea sures the proportion of the economy supported by science and technology in one way or
another. Not surprisingly, the STPCR has risen almost continuously since it was first calculated in
2005 (see Figure 17). China’s 13th Five- Year Plan set the target of the STPCR reaching 60 percent
by 2020.1 To be frank, this statistic is essentially meaningless. It is constructed in such a way that it
1. Scott Kennedy and Christopher K. Johnson, Perfecting China, Inc.: The 13th Five- Year Plan (Washington, DC: CSIS,
May 2016), 25, https:// csis - prod.s3 . amazonaws . com / s3fs - public / publication / 160521 _ Kennedy _ PerfectingChinaInc
_ Web . pdf.
594-71093_ch01_4P.indd 32 8/29/17 9:51 AM

Scott Kennedy 33
would be almost impossible to fall unless there was a massive economic contraction (such as the
one that occurred in late 2008 and early 2009). Moreover, it offers no insight into whether the econ-
omy as a whole is becoming more productive. Chinese experts themselves recognize the STPCR’s
weaknesses, but many want to keep using it because it is easy to calculate and its continued
upward rise reflects positively on the Ministry of Science and Technology.
Others are not bound by such constraints. Instead, a better approach would be to look at trends in
value added and exports. These broad mea sures paint a more complex picture than the STPCR.
Manufacturing value added (MVA) has risen continuously over the past 15 years, from only $385
billion in 2000 to over $3.3 trillion in 2015. However, as Figure 18 shows, the overall economy has
grown so fast that MVA has actually fallen as a proportion of the entire economy over the past
de cade.2 Similarly, China’s high- tech exports have grown rapidly in absolute terms, but have
remained steady as a share of total exports (see Figure 19).
There are, though, other reliable indicators that show a more unambiguous positive change. High
tech’s contribution to manufacturing value added has increased somewhat, rising from 8.8 percent
in 2010 to 14.2 percent in 2014.3 In addition, the share of high- tech sector income generated from
domestic Chinese enterprises has climbed continuously since 2008, reaching 46.6 percent in
2. “World Bank National Accounts Data, and OECD National Accounts,” World Bank World Development Indicators,
accessed June 1, 2017, http:// data.worldbank . org / indicator / NV . IND . MANF . ZS; and “National Accounts Main Aggregates
Database,” UN, last updated December 2016, https:// unstats . un . org / unsd / snaama / cList . asp .
3. China’s Science and Technology Statistics, accessed June 1, 2017, http:// www.sts . org . cn / .
Figure 17. China’s Sci- Tech Pro gress Contribution Rate (STPCR)
Source: China National Bureau of Statistics, Xin hua News Agency.
Note: Percentage rates are calculated based on indices in the National Innovation Index.
40%
45%
50%
55%
60%
2005 2006 2007 2008 2009 2010 2011 2012 2013 2014 2015 2016
594-71093_ch01_4P.indd 33 8/29/17 9:51 AM

The Fat Tech Dragon34
2014, the most recent year for which we have available data.4 More telling is the picture that
emerges when looking at the contribution domestic companies make to high- tech exports (see
Table 4). In comparative terms, foreign- invested companies contribute a much larger share to
China’s high- tech exports than in just about any other country in the world, which is the result of
the rush of investment in China after the PRC joined the WTO in late 2001. However, over the last
de cade the share of high- tech exports from domestic companies has gradually climbed, reaching
19 percent in 2015. This trend is widespread, as the domestic share of exports has risen over the
last few years for a large number of products.
This is a mixed picture, indeed. Domestic companies seem to be raising their contribution to the
economy relative to foreign- invested firms, but the contribution of manufacturing value added
and high- tech exports to the economy had not grown at an equal pace. Could it be that China is
just running in place?
4. The Ministry of Science and Technology also reports that income from high- tech sectors has grown as a share of
total manufacturing, from 12.0 percent in 2011 to 13.0 percent in 2014. “2014 Analy sis of Our Country’s Hi- Tech
Industry Development Situation,” Ministry of Science and Technology, accessed June 30, 2017, http:// www.sts . org . cn
/ tjbg / gjscy / gjindex . asp ? Page=1.
Figure 18. China’s Manufacturing Value Added ( Percent of GDP)
Sources: For 2000 to 2013, the World Bank World Development Indicators; for 2014 and 2015, UN National
Accounts Main Aggregates Database.
20%
25%
30%
35%
40%
2000 2002 2004 2006 2008 2010 2012 2014
594-71093_ch01_4P.indd 34 8/29/17 9:51 AM
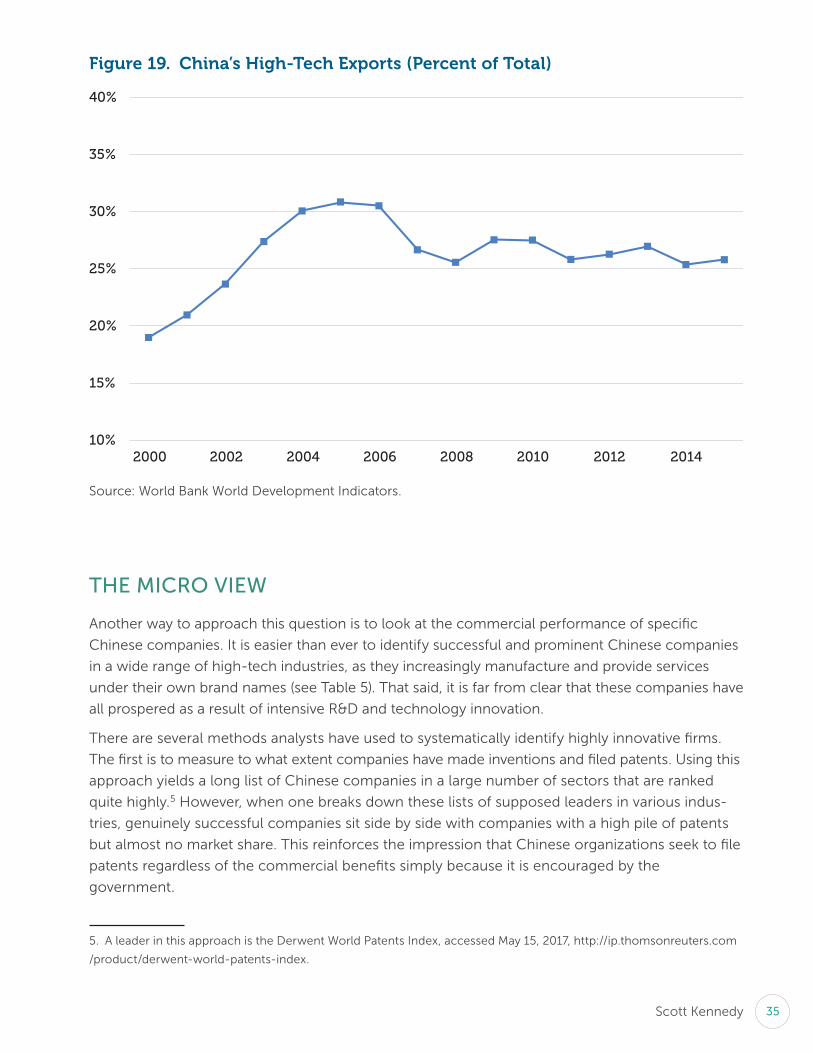
Scott Kennedy 35
THE MICRO VIEW
Another way to approach this question is to look at the commercial per for mance of specific
Chinese companies. It is easier than ever to identify successful and prominent Chinese companies
in a wide range of high- tech industries, as they increasingly manufacture and provide ser vices
under their own brand names (see Table 5). That said, it is far from clear that these companies have
all prospered as a result of intensive R&D and technology innovation.
There are several methods analysts have used to systematically identify highly innovative firms.
The first is to mea sure to what extent companies have made inventions and filed patents. Using this
approach yields a long list of Chinese companies in a large number of sectors that are ranked
quite highly.5 However, when one breaks down these lists of supposed leaders in vari ous indus-
tries, genuinely successful companies sit side by side with companies with a high pile of patents
but almost no market share. This reinforces the impression that Chinese organ izations seek to file
patents regardless of the commercial benefits simply because it is encouraged by the
government.
5. A leader in this approach is the Derwent World Patents Index, accessed May 15, 2017, http:// ip.thomsonreuters . com
/ product / derwent - world - patents - index .
Figure 19. China’s High- Tech Exports ( Percent of Total)
Source: World Bank World Development Indicators.
10%
15%
20%
25%
30%
35%
40%
2000 2002 2004 2006 2008 2010 2012 2014
594-71093_ch01_4P.indd 35 8/29/17 9:51 AM
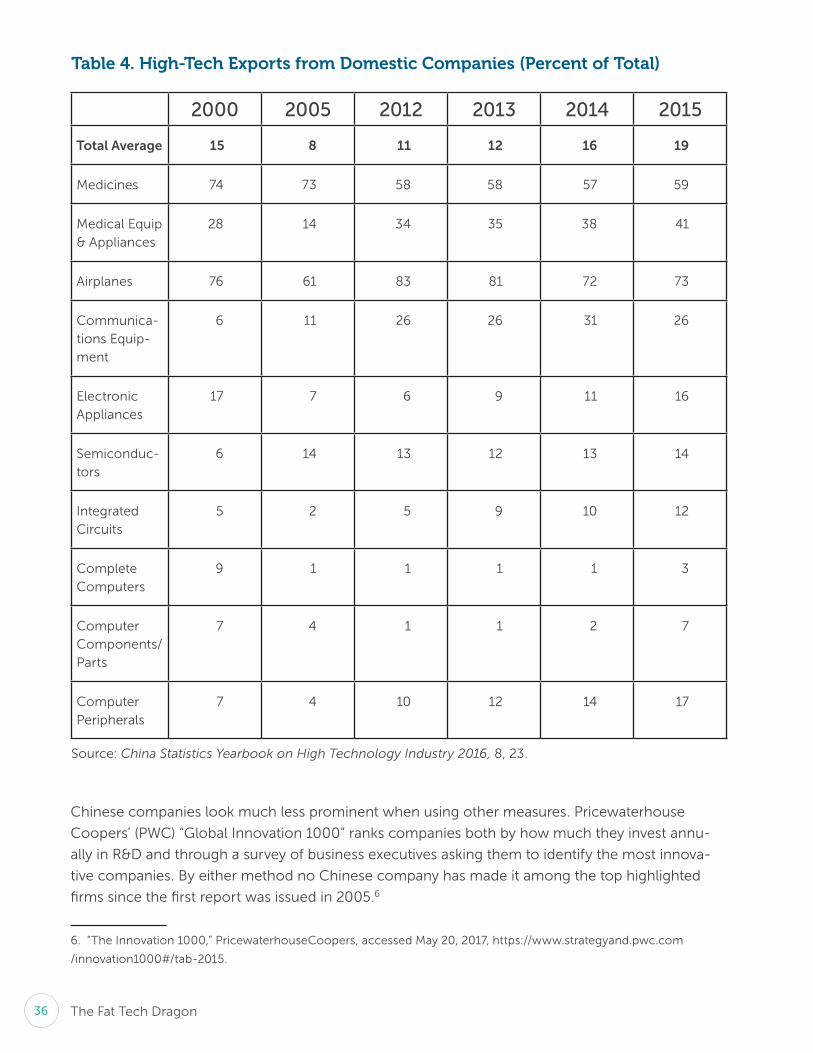
The Fat Tech Dragon36
Chinese companies look much less prominent when using other mea sures. Pricewater house
Coopers’ (PWC) “Global Innovation 1000” ranks companies both by how much they invest annu-
ally in R&D and through a survey of business executives asking them to identify the most innova-
tive companies. By either method no Chinese com pany has made it among the top highlighted
firms since the first report was issued in 2005.6
6. “The Innovation 1000,” Pricewater houseCoopers, accessed May 20, 2017, https:// www.strategyand . pwc . com
/ innovation1000# / tab - 2015 .
Table 4. High- Tech Exports from Domestic Companies ( Percent of Total)
2000 2005 2012 2013 2014 2015
Total Average 15 8 11 12 16 19
Medicines 74 73 58 58 57 59
Medical Equip & Appliances
28 14 34 35 38 41
Airplanes 76 61 83 81 72 73
Communica-tions Equip-ment
6 11 26 26 31 26
Electronic Appliances
17 7 6 9 11 16
Semiconduc-tors
6 14 13 12 13 14
Integrated Cir cuits
5 2 5 9 10 12
Complete Computers
9 1 1 1 1 3
Computer Components/Parts
7 4 1 1 2 7
Computer Peripherals
7 4 10 12 14 17
Source: China Statistics Yearbook on High Technology Industry 2016, 8, 23.
594-71093_ch01_4P.indd 36 8/29/17 9:51 AM

Scott Kennedy 37
The most prominent way that Chinese companies stand out in any commercially meaningful
sense is by their growing market share, mainly in China but also on occasion in other markets in
developing countries and advanced industrialized economies.7 However, their commercial promi-
nence does not appear to be based on intensive R&D spending or pursuit of patents. This is not
out of the ordinary; PWC analyzed data on approximately 10,000 companies worldwide, and it
found no statistical relationship between R&D spending and any kind of commercial metric,
including sales growth, profits, and shareholder returns.8
EXPLAINING CORPORATE SUCCESS AND FAILURE IN CHINA
The story that emerges from the combined picture of the macro and micro views, particularly in
light of the data about cautious spending by investors and the low value of patents, is that Chinese
companies have not risen to prominence on a wave of deep- rooted technology innovation.
Instead, it appears their growing prosperity is the result of three factors. The first is incremental
innovations involving applications and customization. Chen and Wen’s description of “good-
enough innovation” in China’s mobile phone market could apply to many sectors.9
7. For example, Nikkei releases an annual survey that covers 55 major products and ser vices. See “More Chinese
Companies Becoming Global Market Leaders,” Nikkei, July 4, 2016, http:// asia.nikkei . com / Business / Trends / More
- Chinese - companies - becoming - global - market - leaders .
8. “The Innovation 1000.”
9. Shin- Horng Chen and Pei- Chang Wen, “The Evolution of China’s Mobile Phone Industry and Good- Enough
Innovation,” in China As an Innovation Nation, ed. Yu Zhou, William Lazonick, and Yifei Sun (Oxford: Oxford University
Press, 2016), 261–282.
Table 5. Prominent High- Tech Chinese Companies
Companies Product Companies Product
Vivo, Oppo, Xiaomi Mobile phones Goldwind Wind turbines
Lenovo Laptops & PCs Trina Solar Solar cells
Huawei, ZTE Telecom equipment HikVision Security cameras
Midea, Haier Home appliances Geely, BYD Autos
Alibaba, Tencent, JD E- commerce DJI Innovations Drones
Baidu Search China Railway Corp High- speed rail
Didi Ridesharing Tsing hua Unigroup Semiconductors
594-71093_ch01_4P.indd 37 8/29/17 9:51 AM
The Fat Tech Dragon38
The second source of commercial success is effectively taking advantage of China’s scale, both in
terms of pursuing a low- margin, high- volume pricing strategy and utilizing the massive amounts of
data that come from having so many customers in multiple localities, let alone in a single country.
Despite rising costs, China is still the world’s most competitive manufacturing country, a prerequi-
site to this strategy’s continued success.10
The third and final source of recent Chinese corporate success is protectionism. Although many
Chinese companies have genuinely improved their per for mance, they have done so under the
protective umbrella of an assertive government that has restrained competition from foreign rivals
in many of the sectors mentioned in this report. Multinational corporations not only have highly
advanced technologies, they appreciate the need to “build to market” and likely would gain market
share if barriers were lowered further.
In short, China’s commercial success has outstripped its pro gress in technology innovation. This
outcome has come at a substantial cost in terms of extravagant R&D spending and underutilized
patenting activity, not to mention the strains placed on China’s diplomatic relationship with its
trading partners. The final section summarizes the findings of this report and considers the impli-
cations for foreign businesses and governments.
10. “2016 Global Manufacturing Competitiveness Index,” Deloitte Touche Tohmatsu, September 2016, https:// www2
.deloitte . com / us / en / pages / manufacturing / articles / global - manufacturing - competitiveness - index . html .
594-71093_ch01_4P.indd 38 8/29/17 9:51 AM
39
06
Implications
A FAT TECH DRAGON
These are fat years for innovation in China. The campaign to spur innovation has been accompa-
nied by massive spending and intensive bureaucratic activity. This environment provides firms,
investors, and research organ izations with amazing opportunities to feast from a rich buffet of
support. And as whenever the buffet is so plentiful, many will eat a well- balanced meal, but others
will overindulge, resulting in poor health and wasted sustenance that could have been better
managed.
China’s goals are admirable, but its strategy has clear weaknesses. Funding has flowed liberally, but
because the current environment fosters not deep innovation but expanded market share for
domestic firms, innovation has become a secondary concern. The section on general trends
showed that although innovation inputs are gradually rising, there has been less growth in output
per for mance. It is pos si ble that China is following a natu ral pattern in which inputs rise first and
then are met with a parallel rise in outputs. But another, more likely possibility is that this lag is an
abnormal and unnecessary result of China’s government- led effort that is based on massive
spending directed toward undeserving targets.1
There is an alternative, more positive story that could be told and one that we did hear from
several interview sources.2 China’s innovation drive is highly inefficient and not based on new
inventions and technological breakthroughs, but perhaps China is pursuing a diff er ent path to
high- tech success than the current advanced economies. China’s intellectual property may not be
particularly valuable, but there has been a large accumulation of tacit knowledge by Chinese
1. This question was first raised in Linda Jakobson, “China Aims High in Science and Technology: An Overview of the
Challenges Ahead,” in Innovation with Chinese Characteristics: High- Tech Research in China, ed. Linda Jakobson
(New York: Palgrave Macmillan, 2007), 1–36.
2. Some of these points were reinforced and elaborated on by some of the participants at the initial pre sen ta tion of
results of this report, held at CSIS, May 25, 2017, https:// www.csis . org / events / fat - tech - dragon - baseline - trends - chinas
- innovation - drive .
594-71093_ch01_4P.indd 39 8/29/17 9:51 AM
The Fat Tech Dragon40
factories, and these skills are diffused across the supply chain, particularly in industry clusters, such
as the Pearl River Delta.3 Given Chinese consumers’ tastes and consumption capacity, introducing
products that are incrementally better than previous editions may make better business sense than
spending endlessly on R&D to develop the most advanced products that would not be affordable
or useful in China. And although there is a highly vis i ble level of waste created through top- down
initiatives, the campaign- like atmosphere that such action creates spurs greater private activity that
yields results. From this perspective, even large mistakes and waste may facilitate learning that
results in more productive investments down the road. Moreover, given China’s size and financial
resources, it may be able to afford more failures and debt than smaller countries pursuing high-
tech success.
Although this glass half- full story has merit, there is no doubt that China’s approach has been
costly, and that there has been a low rate of metabolism of inputs relative to overall per for mance.
Even if the Chinese state means to create a predictable environment that rewards incremental
pro gress, given the amount of likely waste, it is not clear that this environment has fostered the
kinds of investments that would be most beneficial to the economy. And, of course, this does not
consider the consequences for companies and countries with tighter bud get constraints who have
achieved success through a more competitive innovation environment. China’s size requires
observers to judge the country’s per for mance based on the consequences not only for Chinese
companies, but for entire sectors and the global economy.
LOOKING AHEAD
Despite this somewhat skeptical general conclusion, there is likely to be substantial variation
across sectors. The government’s approach may have diff er ent consequences in diff er ent indus-
tries. China’s chances for innovation success vary across sectors because of its diff er ent eco-
nomic fundamentals. For example, some industries have higher barriers to entry than others, and
some are likely to benefit more than others from China’s large market size. The CIPS proj ect’s
attention to multiple industries, to be shared in forthcoming reports, will allow us to test this
hypothesis and look for patterns of innovation that are harder to detect when looking at the
economy as a whole.
Regardless of the level of support they receive from their government, Chinese companies will
face growing challenges in their interactions with multinational businesses and in overseas mar-
kets. Given the scope and depth of the Chinese government’s support for developing indigenous
technologies, it may be increasingly difficult for outsiders to distinguish between well- run, in de-
pen dent Chinese companies that are entirely successful of their own accord and those that have
benefited heavi ly from state support. Industrial policies do not only benefit SOEs; private Chinese
companies could run into far more obstacles for their exports and outward investment than is
currently the case.
3. See Jacqueline Senker, “The Contribution of Tacit Knowledge to Innovation,” AI & Society 7, no. 3 (September
1993): 208–224.
594-71093_ch01_4P.indd 40 8/29/17 9:51 AM
Scott Kennedy 41
Foreign governments and multinational businesses likewise need to decide how to strategically
respond to China’s approach. They could take a firm stand in opposition, as appears to be the case
with several chambers of commerce and industry associations. They could try to take a more
positive tone but influence the approach at the margins— for example, by advocating for a diff er ent
mix of spending priorities or gradually increasing the pace of market liberalization. Or they could
go along with the strategy as best they can. In short, they need to decide if they want to expand
the size of the cake available to themselves and other foreign market participants at the risk of
losing an opportunity for any piece of the market. Alternatively, they could accept a smaller piece
of the cake, because a thin slice of the China market, even crumbs, adds up to a lot, particularly in
a world where other countries are growing at a much slower place.
This calculus is far from straightforward, and it is not the same for any two countries, sectors, or
companies. Many interview subjects expressed deep concern about the trajectory of Chinese
high- tech policies, but there was no consensus about how to respond. Some welcome a stern
American response even if it results in a trade war. Others are worried about being caught in the
crossfire as victims of retaliation. One of the greatest challenges going forward will be how com-
panies and associations can engage in continued discussion to see if greater consensus is pos si ble,
and if not, what are the ramifications for groups that have diff er ent positions. The answers to these
questions are still far from clear, yet the stakes could not be higher. If others are not careful, they
could end up under the heavy foot of a fat tech dragon.
594-71093_ch01_4P.indd 41 8/29/17 9:51 AM

42
Scott Kennedy is deputy director of the Freeman Chair in China Studies and director of the Proj ect
on Chinese Business and Po liti cal Economy at CSIS. He is a leading authority on China’s economic
policy and its global economic relations. His areas of focus include industrial policy, business
lobbying, multinational business challenges in China, Chinese participation in global economic
regimes, and philanthropy. He is the author of The Business of Lobbying in China (Harvard Univer-
sity Press, 2005), the editor of Beyond the Middle Kingdom: Comparative Perspectives on China’s
Cap i tal ist Transformation (Stanford University Press, 2011), the coauthor (with Christopher K.
Johnson) of Perfecting China, Inc.: China’s 13th Five- Year Plan (Washington, DC: Center for Strate-
gic and International Studies, May 2016), and the editor of Global Governance and China: The
Dragon’s Learning Curve (Routledge, 2017).
Prior to joining CSIS, Kennedy was a professor at Indiana University (IU) for over 14 years. From
2007 to 2014, he was director of the Research Center for Chinese Politics & Business, and he was
founding academic director of IU’s China Office. From 1993 to 1997, he worked at the Brookings
Institution. Kennedy received his PhD in po liti cal science from George Washington University,
his MA in China studies from Johns Hopkins School of Advanced International Studies, and his BA
from the University of Virginia.
About the Author
594-71093_ch01_4P.indd 42 8/29/17 9:51 AM

Blank

China InnovationPolicy Series
The Fat Tech Dragon
author Scott Kennedy
Benchmarking China’s Innovation Drive
A U G U S T 2 0 1 7
A Joint Project of the
CSIS FREEMAN CHAIR IN CHINA STUDIES AND
THE CSIS TECHNOLOGY POLICY PROGRAM
COVER PHOTO ADOBE STOCK
1616 Rhode Island Avenue NW
Washington, DC 20036
202 887 0200 | www.csis.org