2020 annual report - pendragon plc
TRANSCRIPT

2020 ANNUAL REPORT

2 Pendragon PLC Annual Report 2020
Pendragon delivered a strong second half result both operationally and financially, with the
Group’s performance in the period more than offsetting the losses incurred in the first half
driven by the disruption of the COVID-19 pandemic. As a result, the Group reported a full
year underlying profit before tax of £8.2m (FY19: underlying loss before tax of £16.4m).
The Group responded well to the changing trading dynamic over the year, supported by
an incredible response from its people through a period of unprecedented disruption and
change. During the first half, the Group focussed on protecting both its people and the
financial health of the business. In the second half, and following on from work started before
the pandemic, the Group took rapid and decisive action to realise material efficiency gains
resulting in a significantly lower cost base. The Group also accelerated the development
of its underlying digital capabilities improving the ability to trade across both physical and
digital channels.
The Group has made great strides with the new strategy to
‘
transform automotive retail through digital innovation and operational excellence’The strategy includes financial targets intended to restore the Group to sustainable profit
growth and deliver attractive returns for stakeholders, targeting underlying profit before
tax of £85-90m by FY25. The strategy comprises three pillars:
1. Unlock value in the franchised UK motor division
2. Grow and diversify Pinewood
3. Disrupt standalone used cars
IN THIS REPORT

3Pendragon PLC Annual Report 2020
STRATEGIC REVIEW
4 Chief Executive Officer Statement
7 Business Segments
8 Financial Summary
9 Operational and Financial Highlights
9 Performance Indicators
10 s172 Statement
13 Business Profiles
20 Life at Pendragon
22 Industry Insight
OPERATIONAL AND FINANCIAL REVIEW
25 Business Review
36 Financial Review
40 Risk Overview and Management
49 Viability Statement
DIRECTORS REPORT
52 Board of Directors
54 Corporate Governance Report
58 Corporate Social Responsibility Report
61 Audit Committee Report
66 Nomination Committee Report
67 Remuneration Committee Report
68 Directors’ Remuneration Report
83 Directors’ Report
FINANCIAL STATEMENTS
87 Statement of Directors’ Responsibilities in Respect
of the Annual Report and the Financial Statements
88 Independent Auditor’s Report to the Members of
Pendragon PLC
97 Consolidated Income Statement
98 Consolidated Statement of Comprehensive Income
99 Consolidated Statement of Changes in Equity
100 Consolidated Balance Sheet
101 Consolidated Cash Flow Statement
102 Reconciliation of Net Cash Flow to Movement in Net Debt
103 Notes to the Financial Statements
182 Company Balance Sheet
183 Company Statement of Other Comprehensive Income
184 Company Statement of Changes in Equity
185 Notes to the Financial Statements of the Company
194 Advisors, Banks and Shareholder Information
195 5 Year Group Review

4 Pendragon PLC Annual Report 2020
CHIEF EXECUTIVE OFFICER STATEMENT
Bill Berman, Chief Executive Officer
“ It has been a difficult year for many people and I’d like to thank
all of our team who have worked exceptionally hard throughout
the COVID-19 pandemic. Their resilience and dedication meant
we were able to deliver a solid performance in what has been a
particularly challenging period for the car retail industry.
We took early and decisive action to ensure the safety of our
associates and our customers and protect the Group’s financial
position. We also accelerated the development of our digital
capabilities and introduced both click and collect and home
delivery options for our customers. These actions, coupled with
the positive progress made against our new strategy, provide
us with a strong platform for the future and the results for this
period show there is good momentum in the business, despite the
external pressures.
We are confident the improvements made to our business model
over the past year leave us well positioned to navigate this period
and accelerate our strategy during the course of the year and
beyond.”JANUARY AND FEBRUARY TRADING UPDATE
Whilst performance has undoubtedly been impacted by the ongoing third national lockdown, the improvements made to the
Group’s digital proposition have enabled it to trade with a high level of resilience, with over 20,000 vehicles delivered to
customers in the first two months of the year.
Group like-for-like new car volumes are 24.3% lower year on year to the end of February, vs the SMMT reported market reduction
of 38.1%, and used car volumes are down 32.8%. Aftersales has been more resilient, with gross profit down 13.1% vs last year.
Overall, we are pleased with this performance against the challenging conditions of trading in lockdown.
Sales declines have been more than offset by improved gross margins combined with the benefit of a lower cost base, resulting
in an underlying loss before tax of £4.8m, an improvement of £3.4m against the same period in FY20 (FY20: Loss of £8.2m).

5Pendragon PLC Annual Report 2020
2020 was a year unlike any other, and given the circumstances,
I am incredibly pleased with the way our teams have
responded, and proud of the operational and financial results
we delivered. Our performance was quite clearly defined by
the changing external environment and varying restrictions
in place across the two halves of our financial year. In the
first half, our focus was on managing disruption from the
first national lockdown and adjusting to the changing market
dynamics, while the second half saw adaptations to our ways
of working as well as a recovery.
MANAGING THE COVID-19 PANDEMIC
The Group’s primary focus was the health and wellbeing of its
customers and associates, safety measures were put in place
to safeguard both of these groups.
Our ability to operate was impacted by changing regulations
during the year, with full national lockdowns applying between
23 March and 1 June, and again during November. The first
lockdown resulted in restrictions that severely limited trading
activity from the end of March through to the end of April,
followed by a gradual, cautious reopening of service centres
in May.
The business worked hard to safely reopen locations at the
beginning of June and then showed agility in responding to
various geographic tier restrictions across the UK during the
remainder of the year. During the periods where restrictions on
trading were in place, the Group accelerated the development
of its digital capabilities and introduced online payment
functionality, click and collect and home delivery options. This
left the business in a better position going into the second
national lockdown in November, with the Group also carrying
out aftersales services more comprehensively than in the first
lockdown.
At the start of the pandemic, rapid and decisive action was
taken to protect cash. The Group was grateful to be able
to utilise Government support measures via the Coronavirus
Job Retention Scheme (CJRS), through rates holidays
and through the VAT deferral. In total, the Group received
c.£42m of furlough support in FY20 and c.£10m in rates relief
during FY20. In addition to this, the Group took additional
measures to minimise cash outflow, such as reduced capital
expenditure, agreements with OEMs and stocking loan
providers to temporarily extend vehicle payment terms,
voluntary management pay reductions and the temporary
movement to monthly rental payments.
We saw the benefits of our diverse offer in this early phase of
the pandemic as both Pinewood and PVM continued trading
throughout, providing support to their respective customer
bases. Whilst these divisions were able to continue to trade,
there were inevitable impacts on performance as a result of
the disruption. Pinewood in particular was able to support
its customer base through discounts offered during the first
lockdown.
As restrictions were lifted, the Group developed and
implemented a comprehensive reopening plan, with a gradual,
phased return to work for associates based on a data-led
approach of matching resource to an increasing consumer
demand whilst still utilising CJRS where required.
Despite all the available actions taken, COVID-19 had a
material impact on the Group’s reported underlying profit
before tax, with management estimating the financial impact
on H1 FY20 to be approximately £44m. As a result of this
disruption, the Group reported an H1 underlying loss before
tax of £31.0m. After non-underlying items the Group reported
a H1 loss before tax of £52.0m.

6 Pendragon PLC Annual Report 2020
STRONG RECOVERY IN PERFORMANCE IN H2
Work to review the Group’s operating cost base had started
prior to COVID-19, but was accelerated by the pandemic.
During the lockdown periods we saw strong efficiency gains
from a smaller workforce, and, as a result of this and our prior
work, we were able to implement changes to our structure to
maximise these gains, reducing headcount to deliver annual
equivalent savings of £35m.
In addition to reviewing our operating model, we also
successfully concluded a review of our store estate, which led
to a conclusion that a further 15 stores did not form part of our
future estate plan. The closure of these stores was completed
during the second half. Prior to the pandemic, these stores
collectively lost c.£2m per annum.
Good early progress was made with Group strategic initiatives,
such as the review of the store estate and operating structure.
I am also particularly pleased with the developments we have
made to our digital capabilities, which have provided us with
the ability to offer comprehensive click and collect and home
delivery propositions, which supported the performance of
the business during localised tiering restrictions and during
the November national lockdown. We further bolstered our
online offer, by enabling digital finance and insurance sales
as we move to develop an end-to-end online proposition for
those who choose to shop this way. We have also made a
number of efficiency improvements to the vehicle acquisitions
process, which, as they scale, will lead to improved conversion
and better margins.
This investment in digital capabilities ensured the financial
impact of the November national lockdown was significantly
mitigated, with the Group recording a materially lower loss
than seen in the first lockdown period. The Group recorded an
underlying loss of £2.0m in November, which was substantially
lower than the losses in the initial lockdown periods, where
such mitigation was not available and trading levels were
minimal.
More importantly, the Group reported H2 underlying profit
before tax of £39.2m, more than offsetting H1 losses and
resulting in a full year underlying profit before tax of £8.2m.
After non-underlying items the Group reported a full year loss
before tax of £(29.6)m.
GROUP STRATEGY
During FY20 we also completed a review of the Group’s
strategy, and launched our plan to “transform automotive
retail through digital innovation and operational excellence”.
This strategy sets out our ambition to return the Group to
sustainable levels of profit growth, targeting underlying profit
before tax of £85-90m by FY25 and positions us to meet
evolving customer needs.
I believe we are uniquely positioned, given our strong portfolio
of assets and variety of divisions, to deliver on our three
strategic priorities for growth and transformation. These
include taking advantage of a significant opportunity to unlock
the value in the UK motor division, accelerating Pinewood’s
geographic expansion and diversification into new products
and disrupting standalone used car sales in the UK.
Despite the challenges of the pandemic, we have made good
initial progress against this strategy and have delivered a
number of key changes during FY20. We have also been able
to develop our plans in more detail and I remain confident in
the potential of this plan as we continue to implement it during
FY21.
Overall, I am very pleased with the progress the Group has
made during what has undoubtedly been a challenging year.
Our teams have risen to each and every challenge put in front
of them, enabling us to demonstrate the underlying strength in
the organisation during the second half in particular. As well as
dealing with the shifting landscape we have had to operate in,
we have set out a comprehensive plan and started to deliver
against it.
OUTLOOK
We are confident in the opportunity that our strategy provides,
and will continue to make progress against our objectives,
building a strong and profitable business. At this point, we
remain cautious about the shorter-term economic outlook as
Government support is gradually withdrawn, and the Board
notes the potential for short-term constraints in new vehicle
supply, but I am confident our business model has adapted
to be resilient in the current conditions, and that we are well
positioned to capitalise on the potential for any pent-up
demand that may exist as our stores fully reopen in April.
CHIEF EXECUTIVE OFFICER STATEMENT

7Pendragon PLC Annual Report 2020
NEW VEHICLE RETA
ILIN
GV
EH
ICLE SER
VICE & REPAIR
SOFTWA
RE
FLE
ET A
ND
LEASING
Supply of used vehicle invento
ry
from part exchang
es
Tech
nical eq
uipment and expertise
for v
ehicle reconditioning
Market leadin
g sy
stem
fo
reffi cient u
sed c
ar o
per
ati
on
s
Su
pp
ly o
f us
ed v
ehicle in
ventory
fro
m d
efl e
et
ed vehicles
BUSINESS SEGMENTS
USEDVEHICLE
RETAILING
FRANCHISED UK MOTORSale and
servicing of
vehicles in
the UK
SOFTWARELicencing of
Software as
a Service to
global
automotive
business users
CAR STOREOwn brand
proposition for
the sale of used
vehicles in the
UK
LEASINGFleet and
contract hire
provider. Source
of used vehicle
supply
We have five main business divisions that make up our Group:
US MOTOR (Discontinued)
Sale and servicing
of vehicles in the
US

8 Pendragon PLC Annual Report 2020
20202018
100.4
2019
NET DEBT
£100.4M
20202018
45.9
2019
UNDERLYING OPERATING PROFIT
£45.9M
REVENUE
£2,924.6MGROSS PROFIT
£353.2M
20202018 2019
550.5
353.2
GROSS MARGIN
12.8%
20202018 2019
12.8
20202018 2019
UNDERLYING EPS
0.6P
0.6
£8.2M
20202018 2019
8.2
20202018
2,924.6
2019
UNDERLYING PROFIT BEFORE TAX
4,627.0 11.9
76.2 2.847.8
126.1
20202018
9.2
2019
OPERATING (LOSS)/PROFIT
£9.2M
(14.4)
2020
119.7
26.7
472.7 10.5
(1.2)
(16.4)
4,506.1
(71.1)
(114.1)
2018
(29.6)
2019
(LOSS)/PROFIT BEFORE TAX
£(29.6)M
(44.4)
NOTE: Throughout this document, Alternative Performance Measures have been used which are non-GAAP measures that are presented to provide readers with additional financial information that is regularly reviewed by management and should not be viewed in isolation or as an alternative to the equivalent GAAP measure, see note 1 of the Financial Statements for details.
FINANCIAL SUMMARY
9Pendragon PLC Annual Report 2020
OPERATIONAL AND FINANCIAL HIGHLIGHTS
KPI Definition 2020 Performance Change
Underlying EPSUnderlying profit after tax divided by weighted average number of shares
0.6p up 146.2%
Underlying PBT
Underlying profit before tax excludes items that are not incurred in the normal course of business and are sufficiently significant and/or irregular to impact the underlying trends in the business
£8.2m up 150%
UnderlyingOperating Margin
Underlying operating profit divided by revenue 1.6% up 1%
Leverage ratioNet debt : underlying EBITDA is the ratio of our net debt to underlying EBITDA
0.8 up 27%
KEY STRATEGIC MEASURES
KPI Definition 2020 Performance Change
Aftersales Revenue
All aftersales revenues (like-for-like)1 £235.8m down 26.2%
Used Revenue All used vehicle revenues (like-for-like)1 £1,220.9m down 26.9%
KEY FINANCIAL MEASURES
OPERATIONAL AND FINANCIAL HIGHLIGHTS
• Underlying losses before tax of £31.0m in H1 offset by
underlying profit before tax of £39.2m in H2, resulting in FY
underlying profit before tax of £8.2m.
• Group Revenue is down 35.1% to £2,924.6m (FY19: £4,506.1m).
• After non-underlying items the Group reported loss before
tax of £29.6m (FY19: £114.1m).
• New strategy launched and strong early progress made,
including enhanced digital capabilities and developments to
vehicle acquisition processes.
• Organisation structure review completed, delivering annual
equivalent benefit of c.£35m.
• Estate review completed and 15 stores closed, delivering an
annual equivalent benefit of c.£2m.
• Digital capabilities accelerated rapidly. Fully transactional
platforms enabled, offering both click and collect and home
delivery propositions for customers.
PERFORMANCE INDICATORS
1 see section 1 of the notes to the financial statements for like-for-like reconciliations

10 Pendragon PLC Annual Report 2020
s172 STATEMENT
HOW
WE ENGAGE
WHY
WE ENGAGE
WHAT MATTERS
TO THIS GROUP
WHAT DID WE DO
AS A RESULT
CUSTOMERS
We continue to engage with our
customers in a variety of ways,
including:
Measuring customer KPIs from OEM
surveys reported to management
Management and directors continue to
visit dealerships, regularly listening to
customer feedback
Online review of our services through
platforms such as Trust Pilot regularly
monitored by our marketing teams
Undertaking mystery shopping
exercises periodically carried out to
provide insight into the customer
perspective and journey
Our purpose is to
deliver a high quality,
personalised service
to all our customers
across all of our business
divisions: Franchised
UK Motor, Car Store,
Software and Leasing
• Product range, price
and quality
• Convenience and
accessibility
• Ease of transacting
• Customer service
• Responsible use of
personal data
• Prioritisation of
customer safety
following reopening of
operations through the
COVID-19 pandemic
• Improving and
developing the online
customer journey for
ease of transacting
ASSOCIATES
We listen carefully to the views of our
associates across all our businesses.
In 2021, we will be appointing a
chief people officer who will further
innovate and develop our engagement
processes
We continue to operate an
independent whistleblowing helpline,
enabling associates to raise any issues
or matters of concern in confidence
We wish to continue
to be a responsible
employer, both in
terms of continuing
to ensure the health,
safety and wellbeing of
our associates and also
ensuring we maintain a
responsible approach to
the pay and benefits our
associates receive
• Fair employment
• Fair pay and benefits
• Tackling our gender
pay gap
• Diversity and inclusion
• Training, development
and career
opportunities
• Health and safety
• Responsible use of
personal data
• Ensured that associate
safety and wellbeing
was at the forefront
of all decisions taken
during the COVID-19
pandemic, as reported
in our Corporate
Governance Report at
page 54 of this Annual
Report
• We put in place
stringent measures
to protect employee
safety
• Continued to enhance
the range of benefits
available
STATEMENT BY THE DIRECTORS IN PERFORMANCE OF THEIR STATUTORY
DUTIES IN ACCORDANCE WITH s172(1) COMPANIES ACT 2006
The Board of directors of Pendragon PLC confirm that during the year under review, it has acted fairly between members of
the Company to promote the long term success of the Company for the benefit of all shareholders, whilst having regard to the
matters set out in section 172(1)(a)-(f) of the Companies Act 2006 in the decisions taken during the year ended 31 December
2020, further detail of which is set out below and which are incorporated into the Strategic Report.

11Pendragon PLC Annual Report 2020
HOW
WE ENGAGE
WHY
WE ENGAGE
WHAT MATTERS
TO THIS GROUP
WHAT DID WE DO
AS A RESULT
CUSTOMERS
We continue to engage with our
customers in a variety of ways,
including:
Measuring customer KPIs from OEM
surveys reported to management
Management and directors continue to
visit dealerships, regularly listening to
customer feedback
Online review of our services through
platforms such as Trust Pilot regularly
monitored by our marketing teams
Undertaking mystery shopping
exercises periodically carried out to
provide insight into the customer
perspective and journey
Our purpose is to
deliver a high quality,
personalised service
to all our customers
across all of our business
divisions: Franchised
UK Motor, Car Store,
Software and Leasing
• Product range, price
and quality
• Convenience and
accessibility
• Ease of transacting
• Customer service
• Responsible use of
personal data
• Prioritisation of
customer safety
following reopening of
operations through the
COVID-19 pandemic
• Improving and
developing the online
customer journey for
ease of transacting
ASSOCIATES
We listen carefully to the views of our
associates across all our businesses.
In 2021, we will be appointing a
chief people officer who will further
innovate and develop our engagement
processes
We continue to operate an
independent whistleblowing helpline,
enabling associates to raise any issues
or matters of concern in confidence
We wish to continue
to be a responsible
employer, both in
terms of continuing
to ensure the health,
safety and wellbeing of
our associates and also
ensuring we maintain a
responsible approach to
the pay and benefits our
associates receive
• Fair employment
• Fair pay and benefits
• Tackling our gender
pay gap
• Diversity and inclusion
• Training, development
and career
opportunities
• Health and safety
• Responsible use of
personal data
• Ensured that associate
safety and wellbeing
was at the forefront
of all decisions taken
during the COVID-19
pandemic, as reported
in our Corporate
Governance Report at
page 54 of this Annual
Report
• We put in place
stringent measures
to protect employee
safety
• Continued to enhance
the range of benefits
available
HOW
WE ENGAGE
WHY
WE ENGAGE
WHAT MATTERS
TO THIS GROUP
WHAT DID WE DO
AS A RESULT
SUPPLIERS
Regular meetings and updates with
all key suppliers with executive
management, in particular our OEM
partners
Supplier payment terms reported and
published
Although we do not
manufacture the vehicles
we sell, we need to
maintain relationships
with all our OEM
partners to ensure
we can continue to
provide products to our
customers
All our suppliers must be
able to demonstrate that
they take appropriate
action to prevent
involvement in modern
slavery, corruption,
bribery and breaches of
competition law
• Fair trading and
payment terms
• Anti-Bribery
• Anti-Modern Slavery
• Operational
improvement
• We continued to
work closely with
all our suppliers to
deliver operational
improvement and
effective trading
through the COVID-19
pandemic
• We surveyed all key
suppliers for adherence
to anti-slavery
standards
COMMUNITY
Regular involvement in charity appeals
both nationally and locally
As a predominantly retail
operator, with a tangible
nationwide presence
in many communities,
our retail businesses
generate community
involvement through
local engagement,
contributing to local
areas in a variety of ways
• Charitable donations
and support
• Employment
opportunities
• Volunteering
• Fair tax policy
• We supported the NHS
through COVID-19 by
servicing key worker
vehicles at discounted
rates
• We continued other
charitable activities
where possible, as
reported at page
56 of the Corporate
Governance Report

12 Pendragon PLC Annual Report 2020
s172 STATEMENT
HOW
WE ENGAGE
WHY
WE ENGAGE
WHAT MATTERS
TO THIS GROUP
WHAT DID WE DO
AS A RESULT
ENVIRONMENT
Regular re-assessment of the
Group’s environmental policy
We acknowledge the
responsibility we have to
protect the environment
and to minimise the
environmental impact of
our activities
• Minimising atmospheric
emissions, commercial
and industrial waste
• Minimising vehicle
movements causing
nuisance or noise
• Minimising industrial
noise and energy
wastage
• Complying with
statutory requirements
relating to
environmental matters
• Ensuring environmental
priorities are
accounted for
appropriately in
planning and decision
making
• Operate an obsolete asset
disposal policy
• Minimise and where possible,
eliminating pollution
• We continue to reduce
incidences of energy wastage
wherever possible, as reported
in our Corporate Social
Responsibility Report at page
58 of this Annual Report
• We continue to work with
various of our OEM partners
to effect the roll out of PHEV
charging points across our
dealership network and EV
charging points
SHAREHOLDERS AND POTENTIAL SHAREHOLDERS
Annual Report and Accounts
Corporate website
AGM
Results announcements and
presentation
Shareholder and analyst
meeting with management,
followed by feedback from
brokers and financial PR
consultants
Engagement via the directors
and company secretary
We work to ensure our
shareholders and their
representatives have
a good understanding
of our strategy and
business model
• Long term value
creation
• Fair and equal
treatment
• Growth opportunity
• Financial stability
• Transparency
• To share in the success
of our business
• Dividends
• Committed to reducing
pension entitlement of
executive directors to the
workforce average
• The chief executive officer
and chief finance officer
report back to the Board after
the investor roadshows
• The Group’s brokers and
financial advisors provide
detailed feedback after full
and half year announcements
and investor roadshows
to inform the Board about
investor views
• The interim chairman
and senior independent
director are available to
shareholders and respond
on matters relating to
their responsibilities where
requested
• We consulted with all major
shareholders in relation to our
revised remuneration policy
• Due to the loss in the year
and the Government support
received, no 2020 dividend
is proposed. We will be
engaging with shareholders
in the future about when to
resume dividends

13Pendragon PLC Annual Report 2020
14 Franchised UK Motor
16 Software - Pinewood
18 Leasing - Pendragon Vehicle Management
19 Car Store
19 US Motor
BUSINESS PROFILES
HOW
WE ENGAGE
WHY
WE ENGAGE
WHAT MATTERS
TO THIS GROUP
WHAT DID WE DO
AS A RESULT
ENVIRONMENT
Regular re-assessment of the
Group’s environmental policy
We acknowledge the
responsibility we have to
protect the environment
and to minimise the
environmental impact of
our activities
• Minimising atmospheric
emissions, commercial
and industrial waste
• Minimising vehicle
movements causing
nuisance or noise
• Minimising industrial
noise and energy
wastage
• Complying with
statutory requirements
relating to
environmental matters
• Ensuring environmental
priorities are
accounted for
appropriately in
planning and decision
making
• Operate an obsolete asset
disposal policy
• Minimise and where possible,
eliminating pollution
• We continue to reduce
incidences of energy wastage
wherever possible, as reported
in our Corporate Social
Responsibility Report at page
58 of this Annual Report
• We continue to work with
various of our OEM partners
to effect the roll out of PHEV
charging points across our
dealership network and EV
charging points
SHAREHOLDERS AND POTENTIAL SHAREHOLDERS
Annual Report and Accounts
Corporate website
AGM
Results announcements and
presentation
Shareholder and analyst
meeting with management,
followed by feedback from
brokers and financial PR
consultants
Engagement via the directors
and company secretary
We work to ensure our
shareholders and their
representatives have
a good understanding
of our strategy and
business model
• Long term value
creation
• Fair and equal
treatment
• Growth opportunity
• Financial stability
• Transparency
• To share in the success
of our business
• Dividends
• Committed to reducing
pension entitlement of
executive directors to the
workforce average
• The chief executive officer
and chief finance officer
report back to the Board after
the investor roadshows
• The Group’s brokers and
financial advisors provide
detailed feedback after full
and half year announcements
and investor roadshows
to inform the Board about
investor views
• The interim chairman
and senior independent
director are available to
shareholders and respond
on matters relating to
their responsibilities where
requested
• We consulted with all major
shareholders in relation to our
revised remuneration policy
• Due to the loss in the year
and the Government support
received, no 2020 dividend
is proposed. We will be
engaging with shareholders
in the future about when to
resume dividends

14 Pendragon PLC Annual Report 2020
FRANCHISED UK MOTOR
Sale and servicing of vehicles in the UK.
Operating Highlights
• Underlying operating profit up 42.3% to £18.5m (FY19:
£13.0m).
• H1 reported underlying operating loss of £18.1m (H1 FY19:
loss of £7.7m) driven by the impact of the COVID-19
pandemic, strong recovery delivered H2 underlying
operating profit of £36.6m (H2 FY19: £20.7m).
• Revenue and margins recovered against H1 across used,
aftersales and new in H2 FY20.
• Revenue is down 30.5% to £2,591.8m (FY19: £3,730.8m).
• Reported operating losses after non-underlying items was
£10.6m (FY19: operating losses of £96.4m).
• Used car gross margins rose from 7.1% in H1 to 9.7% in H2,
aftersales margins rose from 46.4% in H1 to 51.2% in H2
and new margins rose from 5.9% in H1 to 6.9% in H2.
• FY Used vehicle gross profit per unit increased by £422 to
£1,200 (FY19: £778).
• LFL cost reduction of 20.9%, underpinned by Government
support programmes, and the review of the store estate
and organisational structures.
• Total new car registrations down 29.4% in FY20,
Pendragon new units sold down 29.5% on a like-for-like
basis (down 32.9% total reported).
BUSINESS PROFILES
“Our UK Motor division is recognised through our two main consumer brands in the UK,
Evans Halshaw and Stratstone, complemented by our used car only brand, Car Store”

15Pendragon PLC Annual Report 2020
Evans Halshaw 98
Ford 36
Vauxhall 21
Citroën 12
Renault 6
Dacia 6
Peugeot 4
DAF 4
Nissan 4
Kia 3
Hyundai 2
Stratstone 44
Mercedes-Benz 7
BMW 7
MINI 7
Porsche 6
Land Rover 5
Jaguar 5
Aston Martin 3
Smart 2
Harley-Davidson 1
Ferrari 1
Other Retail Points 11
Car Stores 9
EH Used Car Centres 2
UK RETAIL POINTS153
148K VEHICLES SOLD25MWEBSITEVISITS

16 Pendragon PLC Annual Report 2020
BUSINESS PROFILES
“Our Dealer Management System is
split by role-type, collating common
tasks together to make dealerships
more efficient. With one central
database, all information is shared
throughout the system.”
Personalised video to customers Online payments
Integrated website solution for online buying Integrated website solution for service booking
SOFTWARE - PINEWOOD
Licencing of Software as a Service to global automotive
business users.
Operating Highlights
• Operating profit down 9.7% to £12.1m (FY19: £13.4m).
• Profitability impacted during FY20 by a combination of
discounts to support customers, and lower training and
implementation revenue as a result of the pandemic.
• Pinewood continued to invest in product development to
support its future geographic and product expansion.
• Developments made to software, enabling new-
functionality to be introduced, initially within Pendragon.
• Revenue is down 4.7% to £22.3m (FY19: £23.4m).
Dealer Management System Features
Every part of the business in one place.
From CRM, to workshop workflows and parts processing,
financial analysis and stock management. Pinewood works
with most vehicle manufacturers to provide global solutions.
Our interconnected module structure provides visibility and
access to information across dealership operations, preventing
the need for double keying or multiple add-on systems.
This is a valuable time saving asset for our users, facilitating
increased productivity and reduced inputting time.

17Pendragon PLC Annual Report 2020
Pinewood Apps
Our apps are designed to streamline
processes and improve efficiency across
the whole dealership.
Our fully integrated suite of apps work
seamlessly with our Pinewood DMS.
Our apps are multi-platform and users
can choose their preferred tablet or
mobile, across iOS, Windows and
Android devices.
Sales+ Efficiently manage the vehicle
sales process and provide a great
customer experience - the ultimate
showroom app for sales professionals.
Stock+ Respond to enquiries with
personalised videos, instantly update
stock information and store vehicle
documentation.
Parts+ Issue parts on-the-move, saving
time with our in-built barcode scanner.
Tech+ Improve the service and repair
experience, including video integration
and technician time management.
Host+ Integrated video processes
including 360° tours of a used vehicle
in stock, or visually identifying work
required following a health check.
Integration with over 50 manufacturers
Cars:
Commercial Vehicles: Motorbikes:

18 Pendragon PLC Annual Report 2020
LEASING - PENDRAGON VEHICLE MANAGEMENT
Fleet funding and services provider. Source of used vehicle
supply.
Operating Highlights
• Operating profit up 3.9% to £13.3m (FY19: £12.8m).
• Strong H2 with operating profit of £8.6m (H2 FY19:
£6.5m) due to strong market conditions and pent-up
release of de-fleeted vehicle disposals.
• Revenue is down 1.6% to £86.3m (FY19: £87.7m).
Pendragon Vehicle Management
At Pendragon Vehicle Management our Business to Business
(B2B) brand focuses on comprehensive solutions for fleet
customers. Utilising market leading software, tailored
options are developed for the ever-evolving requirements of
businesses.
From a variety of options on Fleet Management, to all elements
of fleet funding across cars and commercial vehicles, business
solutions are crafted to focus on customer priorities. From
managing uptime to driving cost control, making the switch
to electric vehicles or offering a variety of rental solutions,
Pendragon Vehicle Management can provide comprehensive
and tailored fleet solutions for any business.
Rental Solutions
• Fast response service with over 30,000 vehicles ready to
access.
• Real Time Rental Management system.
• Daily and Flexible (three months and beyond) rental options
available.
• Car, van, electric and specialist vehicle hire, delivered within
four hours.
Personal vehicle solutions and Employee schemes
Pendragon Vehicle Management has also evolved to offer
bespoke Business to Employee (B2E) solutions including
personal contract hire and Salary Sacrifice Car Schemes.
Salary Sacrifice
• Associates offered a brand-new car with no credit check
and no upfront fee.
• Convenient monthly payment deducted from associates’
salaries before tax.
• Choosing low emission vehicles offers savings on BIK tax
and National Insurances payments.
“Pendragon Vehicle Management provide fleet
funding solutions and services to help customers
manage their fleets, improving efficiency,
reducing costs and saving time.”
BUSINESS PROFILES
B V R L AMEMBER
VAN EXCELLENCELOGISTICS UK MEMBER
Fleet Funding
Contract Hire
For Cars
Contract Hire
For Vans
Electric Vehicle
Contract Hire
Salary Sacrifice
Sale and
Leaseback
Contract
Purchase
Telematics
Outsourced
Administration
Risk Management
Maintenance and
Repair
Fuel Cards
Accident
Management
Fleet Management

19Pendragon PLC Annual Report 2020
US MOTOR
Sale and servicing of vehicles in the US.
Operating Highlights
• Los Angeles disposal was completed on 29 January 2021 for
consideration of £16.3m.
• Total current proceeds from all of the US Motor sites
disposals since 2018 of £95.1m.
• Entered agreement to sell the one remaining US Motor
site, Santa Monica for £11.8m (subject to completion
adjustments), which was announced on 15 December 2020
and is expected to complete H1 2021.
Jaguar 2 Land Rover 2
Pendragon North America
Hornburg.com is a local brand that has been serving Southern
California since 1947. Focussed on the sale and service of
premium vehicles, Hornburg represents Jaguar and Land
Rover across two locations.
CAR STORE
Own brand proposition for the sale of used vehicles in the UK.
Operating Highlights
• Underlying operating loss of £1.2m compared to an
underlying loss of £25.2m in FY19.
• Revenue is down 67.3% to £88.5m (FY19: £270.3m).
• Further progress with performance during the second
half resulted in an underlying operating profit of £0.5m in
H2 FY20 (H2 FY19: underlying loss of £6.1m).
• Profitable second half leaves Car Store well-positioned
for future growth ambition.
• Improvement in both gross margins and operating
expenses following the estate restructuring exercise in
H2 FY19. Gross margin of 8.2% in FY20, up from 4.0%
in FY19.
• Gross profit per unit at £865 (FY19: £391).
• Reported operating losses after non-underlying items
was £1.3m (FY19: operating losses of £46.6m).

20 Pendragon PLC Annual Report 2020
LIFE AT PENDRAGON
Our associates are the heart of our business and are what
makes us great. We believe that Pendragon attracts, retains
and develops the best and brightest associates through market
leading recruitment, training and development programmes.
We pride ourselves on seeing the potential of our associates
before they even join the business and then once they have,
providing the support, encouragement and skills needed to
build a long and rewarding career.
Despite the challenges posed by the pandemic, we remain
focussed on making our business and our sector appeal
to future generations and to support this, our Group talent
strategy focusses on:
• Enhancing and empowering career experiences, through
understanding and identifying our skills shortages
• Developing our leadership capability through identifying
and developing our talented associates
• Enriching our early careers offerings by maximising
apprenticeship programmes for all associates
• Optimising our structure by developing career pathways for
all

21Pendragon PLC Annual Report 2020
We review our recruitment strategies to ensure we are
attracting and identifying a diverse range of talent to join and
develop within our business. Over the past twelve months our
resourcing team have been recognised as finalists in the FIRM
awards, for a recruitment effectiveness award, acknowledging
our desire to continually improve our recruitment experience
for our candidates and internal stakeholders.
Associate recognition is a vital part of our culture so
celebrating associates’ success, both individually and as part
of a team, is a daily part of life at Pendragon. Daily peer-to-
peer recognition is actively encouraged and helps everyone
feel valued.
We continue to provide comprehensive training as our
dedicated Learning and Development team has worked
closely with senior Leaders in support of strategic initiatives
worked to rapidly increase the range of online and virtual
courses which include but are not limited to our new Finance
& Insurance products, the Online Finance journey available
through our Learning Management System “Pendragon
Learn”.
Significant focus was also given to ensuring our customers
receive the best possible experience with in-depth call
handling training provided to all customer-facing associates
in our motor retail businesses.
Training takes the form of interactive e-learning courses, live
facilitated webinars and on-demand webcasts, all designed
to provide our teams with engaging and informative content
to help develop their skills and knowledge and support their
career progression.
With dealerships and offices across the UK, we’re in a
unique position to understand and positively impact the
local communities in which we live and work, while offering
the support and backing of a large national business. Our
associates are urged to be active members of the community
and to support both local and national initiatives.
Over the past year, despite the disruption caused by the global
pandemic, Pendragon associates have supported activities
participated in community activities giving time, money and
knowledge to organisations, people and causes both locally
and nationally.

22 Pendragon PLC Annual Report 2020
INDUSTRY INSIGHT
USED CAR MARKET
We believe the UK is the most attractive used car market
globally, with a ratio of over three used cars sold for every
one new. The used car market in FY20 in the UK was 6.5m
units, a fall of 14.9% against 2019. Based on the desired age
and mileage profile for our target market, we believe there is
an addressable market for Pendragon of around three million
cars per annum, which is larger than the total new car market.
The used market is more stable than the new sector, being less
affected by fluctuations in the UK economy and providing a
more reliable supply chain than the new market.
AFTERSALES MARKET
The main determinant of the aftersales market is the number
of vehicles on the road, known as the ‘car parc’. The car parc
in the UK has risen marginally to 35.1m vehicles at FY20, a rise
of 0.2% on the prior year. The car parc can also be segmented
into markets representing different age groups. At the end of
FY20, around 17% of the car parc was represented by less than
three-year-old cars, around 20% by four to six-year-old cars
and 63% is greater than seven-year-old cars. The demand for
servicing and repair activity is less affected than other sectors
by economic conditions, as motor vehicles require regular
maintenance and repair for safety, economy and performance
reasons.
NEW CAR VEHICLE REGISTRATIONS FOR YEAR ENDED 31 DECEMBER ('000)
2020 2019 Change %
UK Retail Registrations 747.5 1,018.3 -26.6%
UK Fleet Registrations 883.6 1,292.8 -31.7%
UK New Registrations 1,631.1 2,311.1 -29.4%
Group Represented* UK Retail Registrations 445.0 634.0 -29.8%
Group Represented* UK Fleet Registrations 514.1 797.8 -35.6%
Group Represented* UK New Registrations 959.1 1,431.8 -33.0%
Source: new car vehicle registrations data from the ‘Society of Motor Manufacturers and Traders’.*Group Represented is defined as national registrations for the franchised brands that the Group represents as a franchised dealer.
UK USED CAR MARKET
Source: GMAP
10.0m
8.0m
6.0m
4.0m
2.0m
02016 2017 2018 2019 2020
7.9m 7.8m7.6m 7.6m
6.5m
Units

23Pendragon PLC Annual Report 2020
NEW CAR MARKET
The UK new car market was 1.6m in FY20 which is a reduction
of 29.4% over the prior year. The UK new car market is divided
into two markets, retail and fleet. The retail market is the direct
selling of vehicle units to individual customers and operates at
a higher margin than the fleet market. The retail market is the
key market opportunity for the Group and represents 46% of
the total market in the year. The fleet market represents the
sale of multiple vehicles to businesses, and is predominately
transacted at a lower margin and consumes higher levels of
working capital than retail, and represents 54% of the market
in the year.
The new retail market was down by 26.6% in FY20, and the
new fleet market fell by 31.7% in the year. All new car market
figures are from the Society of Motor Manufacturers and
Traders (SMMT).
UK CAR PARC BY AGE OF VEHICLE
Source: GMAP
10.0m
9.0m
8.0m
7.0m
6.0m
5.0m
4.0m
3.0m
2.0m
1.0m
0
0-3 YEARS 4-6 YEARS 7-10 YEARS 11-15 YEARS
20
20
20
16
20
17
>15 YEARS
20
18
20
20
20
16
20
17
20
18
20
20
20
16
20
17
20
18
20
20
20
16
20
17
20
18
20
20
20
16
20
17
20
18
20
19
20
19
20
19
20
19
20
19
Units
1.05m
1.32m
1.12m
1.42m
PRIVATE FLEET/BUSINESS FORECAST
UK NEW CAR MARKET
Source: SMMT
3.0m
2.8m
2.6m
2.4m
2.2m
2.0m
1.8m
1.6m
1.4m
1.2m
1.0m
0.8m
0.6m
0.4m
0.2m
020192016 2017 2020
2.31m
1.02m
1.29m
2.69m
1.21m
1.49m
2.54m2.37m
1.63m
2018
Units
2021
1.83m
2022
2.13m
0.75m
0.88m

24 Pendragon PLC Annual Report 2020
25 Business Review
36 Financial Review
40 Risk Overview and Management
49 Viability Statement
OPERATIONAL AND FINANCIAL REVIEW
25Pendragon PLC Annual Report 2020
BUSINESS REVIEW
STRATEGY AND BUSINESS REVIEW
SEGMENTAL PERFORMANCE
Units sold H1 2020 H2 2020 FY20 H1 2019 H2 2019 FY19Change
(%)
LFL Change
(%)
USED UNITS
Franchised UK Motor 38,992 43,953 82,945 76,105 59,102 135,207 -38.7% -33.6%
Car Store 4,321 4,066 8,387 17,474 10,392 27,866 -69.9% -40.4%
US Motor 275 258 533 1,452 1,046 2,498 -78.7% 23.3%
Total 43,588 48,277 91,865 95,031 70,540 165,571 -44.5% -34.1%
NEW UNITS
Franchised UK Motor 21,659 32,981 54,640 43,085 38,338 81,423 -32.9% -29.5%
US Motor 945 1,219 2,164 3,413 2,662 6,075 -64.4% -22.5%
Total 22,604 34,200 56,804 46,498 41,000 87,498 -35.1% -29.2%
(£m)
H1 2020 H2 2020 FY20 H1 2019 H2 2019 FY19Change
(%)
LFL Change
(%)
REVENUE
Franchised UK Motor 1,067.1 1,524.7 2,591.8 1,999.2 1,731.6 3,730.8 -30.5% -26.4%
Software 10.8 11.5 22.3 11.3 12.1 23.4 -4.7% -4.7%
Car Store 43.1 45.4 88.5 170.8 99.5 270.3 -67.3% -35.1%
Leasing 37.3 49.0 86.3 56.3 31.4 87.7 -1.6% -1.6%
US Motor 68.5 89.4 157.9 233.9 188.4 422.3 -62.6% -15.1%
Inter-segment revenue (8.5) (13.7) (22.2) (15.9) (12.5) (28.4) -21.8% -21.8%
Revenue 1,218.3 1,706.3 2,924.6 2,455.6 2,050.5 4,506.1 -35.1% -25.5%
GROSS PROFIT
Franchised UK Motor 108.9 180.9 289.8 182.2 189.4 371.6 -22.0% -18.3%
Software 9.9 10.6 20.5 10.4 11.1 21.5 -4.7% -4.7%
Car Store 2.9 4.4 7.3 5.3 5.6 10.9 -33.5% -9.2%
Leasing 6.7 10.9 17.6 8.4 8.7 17.1 2.9% 2.9%
US Motor 9.0 14.3 23.3 31.4 25.3 56.7 -58.9% -5.8%
Inter-segment gross profit (2.1) (3.2) (5.3) (2.5) (2.6) (5.1) -3.9% -3.9%
Gross Profit 135.3 217.9 353.2 235.2 237.5 472.7 -25.3% -16.0%
UNDERLYING OPERATING PROFIT
Franchised UK Motor (18.1) 36.6 18.5 (7.7) 20.7 13.0 42.3% 13.2%
Software 5.9 6.2 12.1 6.5 6.9 13.4 -9.7% -9.7%
Car Store (1.7) 0.5 (1.2) (19.1) (6.1) (25.2) 95.2% 84.8%
Leasing 4.7 8.6 13.3 6.3 6.5 12.8 3.9% 3.9%
US Motor (1.6) 4.8 3.2 3.3 9.4 12.7 -74.8% -62.1%
Underlying Operating (Loss)/Profit
(10.8) 56.7 45.9 (10.7) 37.4 26.7 71.9% 3.4%
Gross Margin % 11.1% 12.8% 12.1% 9.6% 11.6% 10.5% 1.6% 1.3%
Underlying Operating Margin % (0.9%) 3.3% 1.6% (0.4%) 1.8% 0.6% 1.0% 0.5%
Operating (Loss)/Profit (31.2) 40.4 9.2 (114.1) 43.0 (71.1) 112.9%
The business is organised into 5 segments, analysed as follows:
• Franchised UK Motor – sale and servicing of vehicles in the
UK.
• Software – Licencing of Software as a Service to global
automotive business users
• Car Store – Own brand proposition for the sale of used
vehicles in the UK.
• Leasing – Fleet and contract hire provider. Source of used
vehicle supply
• US Motor – Sale and servicing of vehicles in the US.
26 Pendragon PLC Annual Report 2020
FRANCHISED UK MOTOR
Operating Review
The Franchised UK Motor business operated from 142 franchise
points and two used cars only retail points. The points
represent a range of volume and premium products offering
both sales and service functions.
H1 FY20
H1 FY20 performance reflected the unprecedented impact of
the COVID-19 pandemic and the full national lockdown from
23 March to the end of May.
During the enforced lockdown the Group accelerated the
development of its online capabilities, which were further
advanced throughout the year, including the introduction
of click and collect and home delivery, enabling the Group
to continue trading during subsequent closures. New safe-
working protocols were developed to allow our associates
and customers to work and shop in COVID-19 secure facilities.
The Group was able to access the various Government
measures such as furlough and rates relief, as well as support
from OEM partners and stocking loan providers.
The impact of COVID-19 accelerated a review of the Group’s
future operating model which had already commenced before
the pandemic struck. As a result of the review, and supported
by efficiency gains evidenced during reopening, the Group
took the decision to introduce a leaner operating model with
reduced headcounts. The process was successfully completed
during the second half of FY20, with the total number of roles
reduced by approximately 1,400, delivering annual benefits of
c.£35m when compared to the cost base before the pandemic.
BUSINESS REVIEW
FRANCHISED UK MOTOR (£m)
H1 2020 H2 2020 FY20 H1 2019 H2 2019 FY19Change
(%)
REVENUE
Used 509.2 648.3 1,157.5 959.4 743.0 1,702.4 -32.0%
Aftersales 97.7 128.6 226.3 168.0 158.2 326.2 -30.6%
New 460.2 747.8 1,208.0 871.8 830.4 1,702.2 -29.0%
Revenue 1,067.1 1,524.7 2,591.8 1,999.2 1,731.6 3,730.8 -30.5%
GROSS PROFIT
Used 36.4 63.1 99.5 47.0 58.2 105.2 -5.4%
Aftersales 45.3 65.9 111.2 83.7 77.8 161.5 -31.1%
New 27.2 51.9 79.1 51.5 53.4 104.9 -24.6%
Gross Profit 108.9 180.9 289.8 182.2 189.4 371.6 -22.0%
Gross margin rate 10.2% 11.9% 11.2% 9.1% 10.9% 10.0% 1.2%
Underlying Operating Expenses (127.0) (144.3) (271.3) (189.9) (168.7) (358.6) -24.3%
Underlying Operating (Loss)/ Profit
(18.1) 36.6 18.5 (7.7) 20.7 13.0 42.3%
Underlying Operating margin rate (1.7)% 2.4% 0.7% (0.4)% 1.2% 0.3% 0.4%
Stocking Interest1 (7.4) (5.3) (12.7) (8.5) (7.3) (15.8) -19.6%
Profit after Stocking Interest (25.5) 31.3 5.8 (16.2) 13.4 (2.8) 107.1%
Operating (Loss)/Profit (32.0) 21.4 (10.6) (92.0) (4.4) (96.4) 89%
Total Revenue Change -46.6% -11.9% -30.5%
Like-for-like Revenue Change -43.7% -6.9% -26.4%
Used Units Sold 38,992 43,953 82,945 76,105 59,102 135,207 -38.7%
New Units Sold 21,659 32,981 54,640 43,085 38,338 81,423 -32.9%
Used GPU (£)2 934 1,437 1,200 618 985 778 54.2%
New GPU (£)2 1,256 1,574 1,448 1,195 1,393 1,288 12.4%
Number of Locations 160 144 144 170 165 165 -12.7%
Average Used Selling Price (£)3 12,528 13,613 13,126 11,761 11,785 11,771 11.5%
Average New Selling Price (£)3 21,400 22,689 22,185 20,185 21,982 21,041 5.4%1 Stocking interest. Whilst stocking interest is an interest expense and not part of operating profit, it is a cost directly related to the trading performance of both new and used cars. It is included as an alternative performance measure in the table above for information. 2 GPU = Gross Profit per Unit. It is calculated as total New/Used GP divided by total New/Used retail units sold.3 Trading dealerships only. The used selling price is retail vehicles only and excludes any trade vehicles. The new selling price excludes vehicles sold by our fleet business (National Fleet Solutions).

27Pendragon PLC Annual Report 2020
These cost reductions resulted in a more efficient operating
structure, enabling higher operating margins across new, used
and aftersales divisions.
In line with our strategy, a review of the store estate was also
accelerated (and store closures subsequently completed
during H2), which resulted in the closures of 15 locations
and a reduction of approximately 400 further roles. These
closed stores made a combined cumulative loss of c.£2m in
FY19, prior to the pandemic. These decisions, whilst difficult to
make, put the Group in a stronger position going forward. In
addition to these closures, the Group had already closed five
Vauxhall sites and one Ford site during the first half as a result
of manufacturer estate review.
The UK new car market, as reported by the Society of Motor
Manufactures and Traders (SMMT) volumes were down 48.5%
in H1, with sales severely impacted due to the lockdown. The
Group’s UK new car volumes were broadly in line with the
market and were down 47.9% on a like-for-like basis in the
first half of the year (down 49.7% on a total reported basis).
The used market volumes were down 28.7% in the first half
with like-for-like Franchised UK motor used car volumes
down 47.6%. The Group was down more than the market
from a volume perspective principally as a result of increased
volumes in H1 FY19 driven by the large-scale stock clearance
activity completed.
Aftersales revenue also declined in the period, down by 41.8%,
partially mitigated by the small number of service centres
that were kept open initially during April, ahead of a wider
reopening through May.
H2 FY20
Performance rebounded strongly during the second half,
underpinned by the reduced cost base, higher efficiency
levels, a strong market for used car residual values, focussed
inventory management and a good performance in new car
sales. The Group reopened cautiously through the early
part of the second half, building demand across vehicle sales
and aftersales, and continued to be impacted by tiering
and lockdown restrictions, in particular during the national
lockdown in November.
The improvements made to the Group’s digital offering,
including fully transactional websites, together with improved
operating procedures in stores meant the Group was able to
better mitigate the impact of the November lockdown and
tiering restrictions. In particular in November, the Franchised
UK motor division was able to achieve around 70% of vehicle
sales and over 90% of aftersales gross profit compared to
the same month in FY19. This was a significant improvement
compared to the initial lockdowns in H1, and combined with the
lower cost base, provides improved confidence in the Group’s
resilience to trade through any further lockdown conditions.
New car volumes, which were down 6.3% on a like-for-
like basis during H2, performed in line with the UK new car
market, as reported by the SMMT which was down 6.2% in H2,
however Pendragon outperformed the market in the brands
which it represents, with the market in these brands being
down 10.3%. This robust performance against the market, was
also supported by improved new gross margin, at 6.9% during
H2 (H2 FY19: 6.4%), supported by guaranteed margin targets
from a number of the OEMs.

28 Pendragon PLC Annual Report 2020
BUSINESS REVIEW
Market used car volumes were down 0.5% in the second half
with Franchised UK motor used units down 19.3%. The Group
was down more than the market from a volume perspective
principally as a result of store closures combined with a
focus on the quality of inventory and a cautious approach to
reopening following the first national lockdown. The improved
focus on used car management, both in terms of inventory
turn and resulting from tactical improvements to the Group
sourcing, supported by strong market-led residual values
resulted in a used gross margin of 9.7% in H2 (FY19 H2: 7.8%).
The used gross profit per unit, the key measure of vehicle
margins, improved by £452 per unit in H2, to £1,437.
Aftersales capacity was accelerated gradually as the business
reopened and as demand built during the second half, but
continued to be partially restricted by reduced travel as a result
of ‘stay at home’ messages and restricted capacity in some
sites whilst employing safe working practices. As a result,
aftersales revenue was down 13.2% on a like-for-like basis in
H2. Due to the productivity improvements made aftersales
gross margin was 51.2% in H2, compared to 49.2% in H2 FY19.
Strategic review
In September, the Group launched its revised strategy to
improve performance and unlock significant value in the
franchised UK Motor division through actions to:
1. Accelerate digital innovation
2. Drive operational excellence and embed consistent best
practice
3. Operate from a lean and efficient cost base
These initiatives have been designed to drive improvements
in used car margins, aftersales profitability and operating cost
efficiency.
Accelerate digital innovation
The pandemic has driven a shift in UK consumption habits with
consumers adopting new digital, and low-touch activities. We
responded rapidly by strengthening each of our digital, click
and collect and home delivery capabilities during lockdown so
we could continue to trade. Whilst we fundamentally believe
that there will always be a major role for bricks and mortar
in vehicle purchasing, we expect these shifts in consumption
habits to be permanent and that better digital and fulfilment
experiences will be necessary to augment physical retailing.
In addition to the changes we made to enable online
transactions early in the pandemic we made further progress
in the second half of FY20 to build digital capability which
allows customers to purchase used vehicles with finance
online, complementing the capability that had been built in
H1 to purchase with cleared funds. To date, this capability
has been added to the Car Store business and across Evans
Halshaw. In addition to finance products, we are developing
the capability to purchase general insurance products via
digital channels.
During FY21 we will start work to develop an enhanced used
vehicle acquisition and management platform. By utilising the
Pinewood DMS system, we will build capability to utilise data to
improve the processes for vehicle acquisition, removing manual
processes, improving the efficiency and thereby enhancing
the margin we achieve from used vehicle inventory. We will
also develop automated inventory management capability to
reduce, through better use of data, the average number of
days vehicles are held in stock, also improving margin. Finally,
we will develop dynamic used pricing capability by harnessing
both internal and external data to optimise the pricing of
used vehicle inventory in a timelier manner. Each of these
improvements will ultimately drive higher margins.
Drive operational excellence and best practice
There is further opportunity for us to improve performance
through better operational practice, driving efficiencies. We
are developing focussed internal reporting to improve insight
into performance into areas such as vehicle preparation
efficiency and sales force effectiveness. These improvements
will also reduce costs, and improve profit margins.
In H2, we completed a competitive review of our used car
warranty products, which has resulted in a number of changes.
We have introduced a new three-year product to complement
existing one and two-year offers. We also completed a
review of pricing of these products, identifying opportunities
to increase certain products, when benchmarked against the
market. Over time, we will further develop the offer to provide
customer centric solutions more tailored to the make, model
and age of the vehicle. We also made tactical improvements
to the way used car stock is acquired, driving improvements
to the level of associate utilisation of tools resulting in an
improved customer journey and conversion rates.
During FY21, we will start to implement opportunities and
initiatives to drive substantial improvements to aftersales
gross margin. These will include improvements to the store
process, for example conversion rates of customer vehicle
health checks, in order to improve technician productivity. In
addition, we will introduce changes to improve cross-business
consistency in the application of labour charge-out rates and
use new system capabilities to both improve penetration rates
on service plans and dealer guarantees, together with the
introduction of new ancillary products.

29Pendragon PLC Annual Report 2020
Operate from a lean and efficient cost base
In FY20 we successfully made significant changes to our store
and regional operating teams in order to right-size the model
and to embed the efficiency gains we have delivered during
the COVID-19 pandemic, which will deliver c.£35m of annual
benefit. During FY21 we will continue to explore further cost
base efficiencies across the property portfolio and through the
replacement of manual process with systemic solutions and
through reviewing existing key contracts and services.
Financial Review
Revenue decreased by 30.5% in FY20 (26.4% down on a like-
for-like basis). In the first half of FY20 revenue fell by 46.6%
(43.7% on a like-for-like basis), and by 11.9% (6.9% on a like-for-
like basis) in the second half for the reasons outlined above.
Gross profit fell by 22.0% in FY20 (18.3% down on a like-for-
like basis) to £289.8m. In the first half of FY20 there was a
gross profit reduction of 40.2% (38.3% on a like-for-like basis),
and of 4.5% (an increase of 0.8% on a like-for-like basis) in the
second half. The improvements in gross margin rates across
all of new, used and aftersales in the second half of the year
resulted in a like-for-like increase in gross margin despite the
revenue decline.
Underlying operating expenses have decreased by 24.3%
(20.9% decrease on a like-for-like basis) to £271.3m. Due to the
severe impact of the pandemic, the majority of Government
support, such as the Coronavirus Job Retention Scheme
and the business rates holiday, was required to support the
Franchised UK motor division. This combined with cost actions
taken during the first half, store closures and the restructuring
activity in the second half resulted in an £85m cost reduction
compared to FY19.
In total, the division delivered an £18.5m underlying operating
profit in FY20 (FY19: £13.0m), with the previously reported
first half underlying operating losses of £18.1m (H1 FY19:
£7.7m) offset by the significantly improved performance of
the second half underlying operating profit of £36.6m (H2
FY19: £20.7m).
Reported operating losses after non-underlying items were
£10.6m (FY19: operating losses of £96.4m).

30 Pendragon PLC Annual Report 2020
BUSINESS REVIEW
SOFTWARE (£m)
H1 2020 H2 2020 FY20 H1 2019 H2 2019 FY19Change
(%)
REVENUE
Revenue 10.8 11.5 22.3 11.5 11.9 23.4 -4.7%
Gross Profit 9.9 10.6 20.5 10.4 11.1 21.5 -4.7%
Gross margin rate 91.7% 92.2% 91.9% 90.4% 93.3% 91.9% -
Operating Expenses (4.0) (4.4) (8.4) (3.9) (4.2) (8.1) -3.7%
Operating Profit 5.9 6.2 12.1 6.5 6.9 13.4 -9.7%
Underlying Operating margin rate 54.6% 53.9% 54.3% 56.5% 58.0% 57.3% -3.0%
Total Revenue Change -6.1% -3.4% -4.7%
A more detailed breakdown of the Pinewood financials for FY20 can be seen below:
SOFTWARE
Operating Review
Pinewood, a software business, provides Software as a Service
(“SaaS”) in the UK and in a number of countries worldwide.
The UK Dealer Management Systems (DMS) market for
Franchised Motor Dealers is estimated to be worth over
£100m. Three DMS providers dominate the UK market. The
global DMS market is highly fragmented, with over 50 different
DMS providers within Europe alone.
Pinewood’s unique approach to the DMS market is
characterised by:
• a single product capable of global deployment, which
simplifies future developments to the system and reduces
operating expenses;
• a feature-rich cloud-based solution, with no need for
costly third-party add-ons;
• focus on strong manufacturer partnerships and supporting
dealer profitability; and
• commitment to using the latest technology to reshape
motor retail.
Pinewood was an early adopter of the SaaS business model
and has focussed on developing SaaS revenue streams from
high levels of customer retention. Today around 90% of
Pinewood’s revenues are on SaaS basis. Whilst Pendragon
remains an important customer to Pinewood, as Pinewood
has grown, Pendragon’s proportion of the Pinewood total
customer base has been diluted to c.21%, with intra-group
charging maintained at a competitive market rate.
During FY20, overall net user numbers (excluding Pendragon)
were flat, with 20% increase in international markets offsetting
a 2% reduction in mature markets in challenging, COVID-19
related, market conditions. Pinewood was delighted to
support its user base by offering a discount during the height
of the pandemic.
In addition, Pinewood introduced a number of new capabilities
during the year to enhance capabilities during the pandemic,
including an eLearning platform for all users to support
training whilst many people have been working remotely. It
also introduced an online integrated payment platform for
both Sales and Aftersales invoices, enabling secure online
customer payment. Finally, it developed integration of remote
signature capability of job cards and order documentation,
ensuring compliance whilst maintaining a touchless, remote
experience for customers.
Pinewood delivered a strong performance during the
challenging trading conditions presented by the COVID-19
Contribution from
Pendragon
Contribution from external
customers
Pinewood PLC standalone
result
Share of Pendragon
Group overheads
Pinewood segment as reported in Pendragon
Group accouts
REVENUE
Revenue 5.3 17.0 22.3 - 22.3
Gross Profit 4.8 15.7 20.5 - 20.5
Operating Expenses (1.6) (6.5) (8.1) (0.3) (8.4)
Operating Profit 3.2 9.2 12.4 (0.3) 12.1

31Pendragon PLC Annual Report 2020
pandemic. The Company has been able to ensure full continuity
of its services and has further developed the DMS to assist its
customers in the new retail environment. Despite the travel
limitations arising from the pandemic, Pinewood was able to
grow user numbers in its new international markets by 20%
compared to FY19. In the UK market (excluding Pendragon),
user churn remained in line with historic levels. However, as a
result of the pandemic, new users were added at a slower rate
than planned resulting in a small net reduction in overall UK
user numbers.
Strategic Review
As part of its Group strategy presentation, Pendragon
announced its plan to ‘grow and diversify Pinewood’. This
included the key objectives of:
• Growing the international user base by 80% and the total
user base by 10%; and,
• Further product extension enabling turn-key digital
automotive retail solutions.
In FY21 Pinewood will be focused on both elements of the
‘grow and diversify’ strategy.
• Grow: further growth of the international business is
planned for FY21. This will include expansion of the direct
sales model in Scandinavia, as well as anticipated system
launches in new markets.
• Diversify: development of the core DMS product will
continue in FY21. New products designed to support
digital automotive retail are being developed to initially
benefit Pendragon and, in the longer term, the external
customer base.
Financial Review
Total revenues fell by 4.7% compared to FY19, as due to
COVID-19, discounts offered to customers during the initial
national lockdown. Gross profit also declined by 4.7% to
£20.5m as a result of the COVID-19 discounts offered.
Underlying operating expenses increased by £0.3m, or
3.7%, compared to FY19. The increase was driven by higher
amortisation of the DMS software asset, as well as an increased
development expense, reflecting the continued investment in
the DMS product. These increases were partially offset by cost
savings including support from the CJRS, as well as reduced
travel and office expenditure.
As a result of these movements, operating profit was £12.1m, a
reduction of 9.7%.

32 Pendragon PLC Annual Report 2020
BUSINESS REVIEW
CAR STORE
Operating Review
Despite the impact of the pandemic on the sales performance of
the business, in particular during the first half of FY20, Car Store
has continued to make significant progress with its underlying
performance through both improved stock management and
a reduced operating cost base. Notwithstanding the further
impact of tiering and national lockdown, Car Store recorded
an operating profit in the second half.
H1 FY20
During the first half of FY20 Car Store incurred underlying
operating losses of £(1.7)m compared to underlying operating
losses of £(19.1)m in H1 FY19, an improvement of £17.4m.
£10.0m of this improvement was driven by the closure of the
unviable stores completed during the second half of FY19, with
the remaining £7.4m reduction in losses arising from improved
performance in the like-for-like estate.
H2 FY20
Performance was encouraging during the second half, whilst
revenue and units sold were both down, driven by both the full
year impact of the store closure programme during the second
half of FY19, and from lower levels of inventory held in the
revised store estate, the gross margin rate improved to 9.6%
(H2 FY19: 5.6%). Combined with the reduced cost base from
the smaller estate and more efficient operating model, this
resulted in a second half underlying operating profit of £0.5m.
Further progress has been made with the property
management of the closed store estate. Of the total of 24
sites (22 stores and two preparation centres) closed, 15 have
been either sold, had the lease surrendered or been sublet as
at the end of February 2021. The remaining sites will continue
to be actively marketed, with several of the remaining sites
currently under offer.
Strategic Review - Disrupt standalone used cars
We believe the UK is the most attractive used vehicle market
globally, with a ratio of over three used vehicles sold for every
one new. The overall market for used cars is around eight
million cars sold per annum. Based on the desired age and
mileage profile for our target market, we believe there is an
addressable market for Pendragon of around three million cars
per annum, which is larger than the total new car market.
We also believe that Pendragon is significantly advantaged
today against its peers, with an ability to leverage the
complementary attributes of the wider Group to provide a
steady source of suitable stock, an ability to source parts for
preparation at scale advantaged pricing, a high level of brand-
referrals within the Group and cross-Group technical ability.
In addition, the data capabilities we plan to build will allow
us to leverage further scale advantages into a digitally-led,
standalone used car proposition and drive higher margins.
CAR STORE (£m)
H1 2020 H2 2020 FY20 H1 2019 H2 2019 FY19Change
(%)
REVENUE
Revenue 43.1 45.4 88.5 170.8 99.5 270.3 -67.3%
Gross Profit 2.9 4.4 7.3 5.3 5.6 10.9 -33.5%
Gross margin rate 6.7% 9.6% 8.2% 3.1% 5.6% 4.0% 4.2%
Underlying Operating Expenses (4.6) (3.9) (8.5) (24.4) (11.7) (36.1) 76.6%
Underlying Operating (Loss)/ Profit
(1.7) 0.5 (1.2) (19.1) (6.1) (25.2) 95.2%
Underlying Operating margin rate (3.9)% 1.1% (1.4)% (11.2)% (6.1)% (9.3)% 7.9%
Stocking Interest (0.2) (0.2) (0.4) (0.7) (0.5) (1.2) -66.7%
Profit after Stocking Interest (1.9) 0.3 (1.6) (19.8) (6.6) (26.4) -93.9%
Operating (Loss)/Profit (1.7) 0.4 (1.3) (38.2) (8.4) (46.6) 97.2%
Total Revenue Change 74.8% -54.4% -67.3%
Like-for-like Revenue Change -41.0% -28.4% -35.1%
Units Sold 4,321 4,066 8,387 17,474 10,392 27,866 -69.9%
Used GPU (£)1 671 1,071 865 303 539 391 121.1%
Number of Locations 11 9 9 34 12 12 -25.0%
Average Selling Price (£)2 8,677 9,913 9,278 8,258 8,329 8,292 11.9%1GPU = Gross Profit per Unit. It is calculated as total Used GP divided by total Used retail units sold.2Trading dealerships only. The used selling price is retail vehicles only and excludes any trade vehicles.

33Pendragon PLC Annual Report 2020
To capitalise on this opportunity, we will deliver:
1. Rebranding of the standalone used car proposition
2. Differentiated value proposition
3. A scaled physical estate
Rebrand the standalone used car proposition
Work is currently in progress to develop an appropriate brand
identity to reflect a digitally-led product offer, supported by
physical outlets. This will replace the existing Car Store brand.
Differentiate the value proposition
In addition, we will determine the revised customer proposition
and operating model to underpin the repositioned branding in
order to differentiate the proposition from the franchised used
car model and to appeal to a broader customer base, becoming
an online-led retailer with supporting physical infrastructure.
The used car proposition will benefit from clear operational
separation of the division from the franchised model and will
not be encumbered by the same OEM facility requirements. It
will, however, continue to benefit from the Group synergies
and future digital product development.
Scale the physical estate
Over the next five years we are targeting the development
of eight physical locations at an approximate capital cost
of £7.5m per location. We believe that a combination of a
digital proposition and these physical stores will allow us to
gain a meaningful share of the target market. During FY21 we
expect to commence work on the first of our new standalone
proposition stores.
We have appointed a new managing director to lead our
own brand proposition, Mark Akbar. Mark previously held
the role of Vice President of Sales and F&I Operations with
AutoNation, the major US automotive retailer. Mark brings a
strong pedigree of used car retailing, including supporting the
launch of the AutoNation used car model, as well as experience
in bringing new digital products to the market.
Financial Review
Revenue decreased by 67.3% in FY20 (35.1% down on a like-
for-like basis). In the first half of FY20 revenue fell by 74.8%
(41.0% on a like-for-like basis), and by 54.4% (28.4% on a like-
for-like basis) in the second half.
Gross profit fell by 33.5% in FY20 (9.2% down on a like-for-like
basis) to £7.3m. The improvements in gross margin rate to
8.2% (FY19: 4.0%) partially offset the impact of reduced sales.
Underlying operating expenses have decreased by 76.6%
(43.2% decrease on a like-for-like basis) to £8.5m, driven by
a combination of store closures and Government support
during the year through both the Coronavirus Job Retention
Scheme, and the business rates holiday.
In total, the division delivered a £1.2m underlying operating
loss in FY20 (FY19 underlying operating loss of: £25.2m).
Reported operating losses after non-underlying items were
£1.3m (FY19: £46.6m).
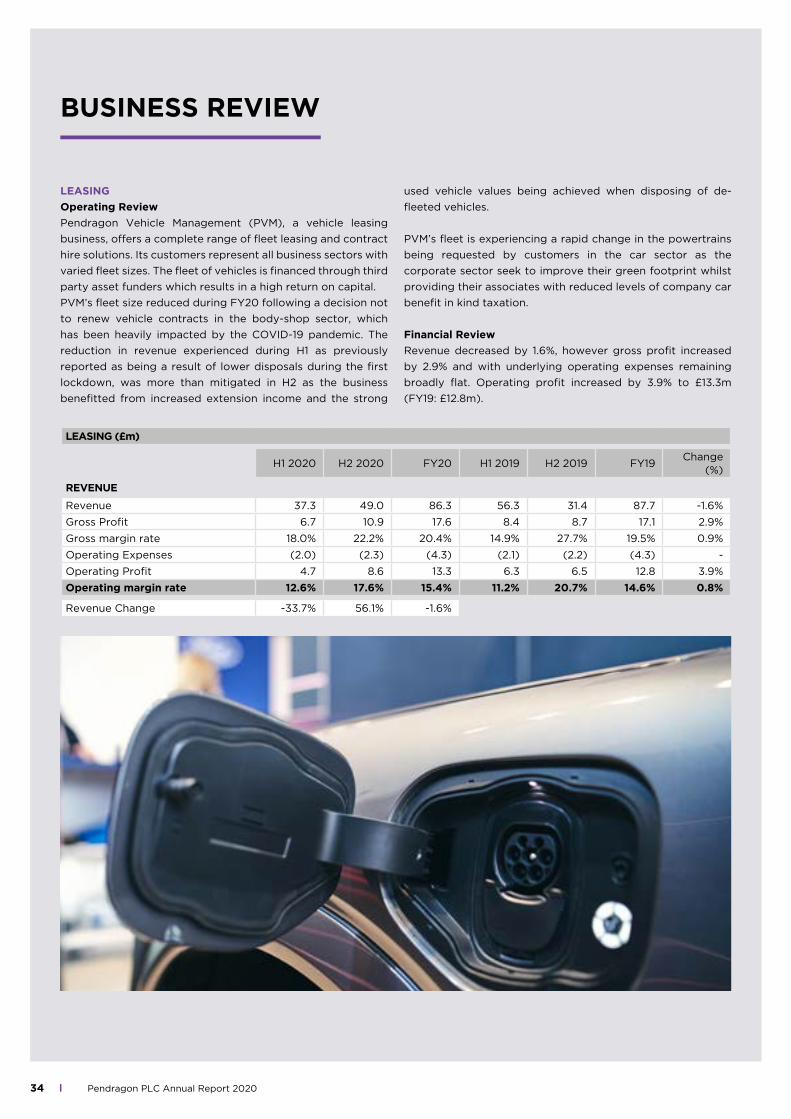
34 Pendragon PLC Annual Report 2020
LEASING
Operating Review
Pendragon Vehicle Management (PVM), a vehicle leasing
business, offers a complete range of fleet leasing and contract
hire solutions. Its customers represent all business sectors with
varied fleet sizes. The fleet of vehicles is financed through third
party asset funders which results in a high return on capital.
PVM’s fleet size reduced during FY20 following a decision not
to renew vehicle contracts in the body-shop sector, which
has been heavily impacted by the COVID-19 pandemic. The
reduction in revenue experienced during H1 as previously
reported as being a result of lower disposals during the first
lockdown, was more than mitigated in H2 as the business
benefitted from increased extension income and the strong
used vehicle values being achieved when disposing of de-
fleeted vehicles.
PVM’s fleet is experiencing a rapid change in the powertrains
being requested by customers in the car sector as the
corporate sector seek to improve their green footprint whilst
providing their associates with reduced levels of company car
benefit in kind taxation.
Financial Review
Revenue decreased by 1.6%, however gross profit increased
by 2.9% and with underlying operating expenses remaining
broadly flat. Operating profit increased by 3.9% to £13.3m
(FY19: £12.8m).
LEASING (£m)
H1 2020 H2 2020 FY20 H1 2019 H2 2019 FY19Change
(%)
REVENUE
Revenue 37.3 49.0 86.3 56.3 31.4 87.7 -1.6%
Gross Profit 6.7 10.9 17.6 8.4 8.7 17.1 2.9%
Gross margin rate 18.0% 22.2% 20.4% 14.9% 27.7% 19.5% 0.9%
Operating Expenses (2.0) (2.3) (4.3) (2.1) (2.2) (4.3) -
Operating Profit 4.7 8.6 13.3 6.3 6.5 12.8 3.9%
Operating margin rate 12.6% 17.6% 15.4% 11.2% 20.7% 14.6% 0.8%
Revenue Change -33.7% 56.1% -1.6%
BUSINESS REVIEW

35Pendragon PLC Annual Report 2020
US MOTOR (£m)
H1 2020 H2 2020 FY20 H1 2019 H2 2019 FY19Change
(%)
REVENUE
Used 10.2 11.8 22.0 43.1 32.6 75.7 -70.9%
Aftersales 7.9 9.4 17.3 22.5 18.2 40.7 -57.5%
New 50.4 68.2 118.6 168.3 137.6 305.9 -61.2%
Revenue 68.5 89.4 157.9 233.9 188.4 422.3 -62.6%
GROSS PROFIT
Used 0.5 1.2 1.7 3.5 2.2 5.7 -70.2%
Aftersales 3.9 5.2 9.1 11.7 9.4 21.1 -56.9%
New 4.6 7.9 12.5 16.2 13.7 29.9 -58.2%
Gross Profit 9.0 14.3 23.3 31.4 25.3 56.7 -58.9%
Gross margin rate 13.1% 16.0% 14.8% 13.4% 13.4% 13.4% 1.4%
Underlying Operating Expenses (10.6) (9.5) (20.1) (28.1) (15.9) (44.0) 54.3%
Underlying Operating (Loss)/Profit
(1.6) 4.8 3.2 3.3 9.4 12.7 -74.8%
Underlying Operating margin rate -2.3% 5.4% 2.0% 1.4% 5.0% 3.0% -1.0%
Operating (Loss)/Profit (8.8) 5.5 (3.3) 3.3 42.4 45.7 -107.2%
Total Revenue Change -70.7% -52.5% -62.6%
Like-for-like Revenue Change -32.1% 3.6% -15.1%
Used Units Sold 275 258 533 1,452 1,046 2,498 -78.7%
New Units Sold 945 1,219 2,164 3,413 2,662 6,075 -64.4%
Used GPU (£)1 1,818 4,651 3,189 2,410 2,103 2,282 39.8%
New GPU (£)1 4,868 6,481 5,776 4,747 5,147 4,992 17.4%
Number of Locations2 4 4 4 9 5 5 -20%
Average Used Selling Price (£)3 32,660 34,686 33,746 32,101 32,076 32,089 5.2%
Average New Selling Price (£)3 56,118 55,966 56,029 51,739 55,864 53,622 4.4%1 GPU = Gross Profit per Unit. It is calculated as total New/Used GP divided by total New/Used retail units sold.2 Represents 4 franchise points across the remaining two dealerships.3 Trading dealerships only. The used selling price is retail vehicles only and excludes any trade vehicles.
US MOTOR
Operating Review
Operations in the US were also impacted by the pandemic,
resulting in the operating losses in H1. The two remaining
stores performed strongly in H2 as the economy reopened and
dealerships were fully functional ahead of the key US trading
period, resulting in a full year operating profit of £3.2m.
The disposal of the US Motor Group is nearing completion
with total proceeds now expected to be c.£107m before tax,
subject to the completion of the last remaining disposal in
Santa Monica. Following the successful completion of the
JLR site in Los Angeles on 29 January 2021 for £16.3m, total
proceeds received before tax to date are £95.1m, with Santa
Monica expected to realise a further £11.8m, as previously
announced.
Financial Review
Revenue is down by 62.6% in the year (15.1% like-for-like
decrease) with new down by 61.2% (-18.9% like-for-like),
aftersales down by 57.5% (-21.7% like-for-like) and used
revenue down by 70.9% (+26.7% like-for-like).
Gross profit decreased by 58.9% (-5.8% like-for-like), with
aftersales gross profit down 56.9% (-16.8% like-for-like), used
gross profit down 70.2% (up 54.5% like-for-like) and new gross
profit down 58.2% (-1.6% like-for-like).
Underlying operating expenses decreased by 54.3% (down
36.0% like-for-like).
Underlying operating profit was down by £9.5m at £3.2m
(FY19: £12.7m), principally driven by the ongoing disposals.
After non-underlying items, the division delivered a £4.1m
operating loss in FY20 (FY19 profit of: £45.7m).

36 Pendragon PLC Annual Report 2020
FINANCIAL REVIEW
CAPITAL ALLOCATION
Net debt* has reduced by £19.3m from £119.7m at 31 December
2019 to £100.4m at 31 December 2020. The net debt to
underlying EBITDA ratio* was 0.8x for the rolling 12 months
to FY20.
The Group expects gross proceeds from the disposal of the
entire US business of around c.£107m before tax. In total to
date, disposal proceeds of £95.1m have been received, which
includes the Los Angeles disposal completed in January 2021.
Agreement has been reached to dispose of the last remaining
US location in Santa Monica, with completion expected in
FY21.
The Group also completed a sale and leaseback of its newly
constructed Porsche Stockport dealership during FY20,
realising proceeds of £10.5m. Disposals of a further five
freeholds, comprising three ex-Car Store locations and two
ex-Vauxhall locations, were completed in FY20, with total
proceeds received of £9.6m. The Group continues to focus on
its vacant property estate following the recently completed
closures.
* This is an Alternative Performance Measure (APM), see page
107 for more detail.
£m H1 2020 H2 2020 FY 2020 FY 2019
Settlement of historic VAT issues - - - 3.5
Impairment of goodwill, property, plant and equipment and assets held for sale
(12.5) (4.0) (16.5) (130.2)
Termination and severance costs (1.2) (5.1) (6.3) (5.5)
(Losses)/gains on the sale of businesses and property, plant and equipment
(5.9) (0.9) (6.8) 33.3
Business closure costs (0.8) (2.0) (2.8) (1.8)
Pension (costs)/income (0.6) (4.8) (5.4) 3.0
Total non-underlying items before tax (21.0) (16.8) (37.8) (97.7)
Non-underlying items in tax 3.4 0.7 4.1 (3.3)
Total non-underlying items after tax (17.6) (16.1) (33.7) (101.0)
NON-UNDERLYING ITEMS
Non-underlying income and expenses are items that are not
incurred in the normal course of business and are sufficiently
significant and/or irregular to impact the underlying trends in
the business. During the year the Group has recognised a net
charge of £37.8m of pre-tax non-underlying items against a
charge of £97.7m in FY19. The current year charge includes
non-cash impairments, principally of goodwill and non-current
assets amounting to £16.5m. There is a £12.5m impairment
of goodwill, a £3.2m impairment of property assets primarily
relating to the previously announced store closures and a
£0.8m impairment of assets held for sale. These have been
necessary following assessments of the carrying value of
those assets which have been compared to the higher of their
value in use or fair value.
Pension costs of £5.4m includes an expense of £3.3m following
the legal precedent which has extended the scope of the
Guaranteed Minimum Pensions equalisation first recognised in
2018 to include previous transfer values paid from the scheme
since 1990, an interest charge on pension scheme obligations
of £1.2m for FY20 and a charge of £1.0m in relation to the levy
into the pension protection fund.
The Group recorded losses on the sale of properties, plant
and equipment and businesses in the period of £6.8m. This
included losses of £6.5m on the disposal of the Puente Hills
Chevrolet location, a net £1.1m profit on the sale of surplus
property during the year and a loss of £1.4m in respect of
losses on the disposal of plant and equipment as a result of
the closure of businesses during the year.
There were termination and severance costs of £6.3m in
FY20, arising from the combination of the 21 store closures
completed during the year and the right-sizing exercise which
resulted in a reduction of c.1,400 roles. In addition to these
termination and severance costs the Group incurred further
costs resulting from their closure of £2.8m.

37Pendragon PLC Annual Report 2020
SUMMARY CASHFLOW AND NET DEBT (£m)
2020 2019
Underlying Operating Profit 45.9 26.7
Depreciation and Amortisation 43.7 44.7
Share Based Payments 1.2 0.6
Non-underlying Items (10.1) (5.7)
Contribution into defined benefit pension scheme (12.5) (7.6)
Working Capital and Contract Hire Vehicle Movements1 (0.7) 5.4
Cash Generated from Operations 67.5 64.1
Capital Expenditure and Fixed Asset Vehicles Net Movement (18.7) (49.4)
Business and Property Disposals 36.7 72.4
Net Capital Income2 18.0 23.0
Tax Paid (4.4) (3.3)
Interest Paid excluding lease interest3 (20.5) (26.8)
Dividends - (9.7)
Share Buybacks - (0.5)
Lease Payments & Receipts4 (39.8) (39.9)
Other (1.5) (0.5)
Decrease in Net Debt 19.3 6.4
Opening Net Debt 119.7 126.1
Closing Net Debt 100.4 119.71 being the change in trade and other receivables, change in trade and other payables and movement in contract hire vehicle balances.2 being the proceeds from sale of businesses, purchase of property, plant, equipment and intangible assets and proceeds from sale of property, plant, equipment and intangible assets.3 being bank and stocking interest paid. 4 being receipts of lease receivables and payment of lease liabilities including lease interest paid and received.
BALANCE SHEET AND CASH FLOW
The following table summarises the cash flows and net debt of the Group for the twelve-month periods ended 31 December
2020 and 31 December 2019 as follows:
RECONCILIATION TO CONSOLIDATED CASH FLOW STATEMENT
2020 2019
Net Cash Flow From Operating Activities 29.6 20.71
Net capital income 18.0 23.0
Receipt of lease receivables 1.9 2.21
Net cash from investing activities 19.9 25.21
Financing cash flows as included above
Dividend - (9.7)
Share buybacks - (0.5)
Payment of lease liabilities (28.7) (28.8)1
Financing cash flows not included above relating to loans
Repayment of loans (40.0) (5.0)
Proceeds from issue of loans (net of directly attributable transaction costs) 18.2 5.4
Net cash outflow from financing activities (50.5) (38.6)1
1 Restated – see section 1.

38 Pendragon PLC Annual Report 2020
The cash generated from operations was an inflow of £67.5m
in FY20 compared to an inflow of £64.1m in FY19 with an
increase in underlying operating profit of £19.2m resulting
from the strong second half trading performance, partially
offset by an increase of £4.4m in cash non-underlying items,
to £10.1m, which principally relate to the estate and operating
model right-sizing exercises, combined with an increase in
pension deficit contribution payments.
The increase in operating profit included an estimated
negative first half impact on operating profit from COVID-19
of approximately £44.1m.
The working capital and contract hire movements cash outflow
of £0.7m was principally driven by a deferred VAT payment
timing benefit under the Government support scheme, of
approximately £30m, largely offset by an underlying outflow
related to the reduction in new car inventory. The deferred
VAT timing benefit is expected to unwind over a 11-month
period from March 2021.
The net capital expenditure inflow of £18.0m (FY19: £23.0m)
was principally due to the £36.7m cash received from business
and property disposals, which more than offset the outgoing
capital expenditure of £18.7m in the period. Disposal proceeds
comprised of £16.6m from the disposal of Puente Hills
Chevrolet in the US, £10.5m from the sale and leaseback of the
newly built Porsche Stockport and £9.6m from the disposal of
vacant property. The level of capital expenditure was reduced
during the year in order to provide mitigation against ongoing
uncertainty caused by the pandemic.
No dividends were paid during FY20.
Lease payments & receipts were flat year on year, with the
timing benefit from the temporary move to monthly rent
payments during the first half unwound by the end of the year,
with normal rental patterns resumed as trading improved.
The impact of annual rent increases and the addition of
rent payments following the sale and leaseback of Porsche
Stockport were largely offset by reductions attributable to
a total of 15 leases that were successfully re-assigned, sublet
or expired during the year, and which will result in an annual
equivalent rent reduction of c.£1.3m.
With effect from 1 April 2021 in respect of light commercial
vehicles, and with effect from 1 July 2021 in respect of passenger
vehicles, the way in which the Group acquires vehicles from
Ford will change. From these two respective dates, the Group
shall become the importer of Ford vehicles into the UK, rather
than acquiring the vehicles from Ford UK. This will lead to
changes in both the amounts ultimately payable to Ford for
vehicles (the liabilities due to Ford shall be lower because
no VAT will be charged) and the removal of VAT recovery in
respect of the acquisition of vehicles. The resulting change
in cashflows is estimated in the range of +£4m to -£23m,
dependant on the month, although the impact on the Group’s
peak borrowing is not expected to be significant. As at 31
December 2021, the impact is expected to increase net debt
by approximately £12m.
BALANCE SHEET SUMMARY
The following table summarises the balance sheet of the Group
at 31 December 2020 and 31 December 2019.
BALANCE SHEET
2020 2019
Property 222.8 237.8
Plant & Equipment 204.0 231.3
Goodwill 150.3 162.8
Intangibles 10.2 9.5
Right of Use Assets 146.0 159.2
Inventories 608.8 839.0
Receivables1 113.2 129.9
Net Assets Held for Resale2 31.7 59.6
Payables3 (1,222.2) (1,504.2)
Retirement Benefit Obligations (75.5) (59.0)
Net Tax Balances4 37.8 22.7
Net Debt5 (100.4) (119.7)
Shareholders’ Funds 126.7 168.91 being trade and other receivables and finance lease receivables 2 being assets classified as held for sale and liabilities directly associated with assets held for sale 3 being trade and other payables, deferred income and lease liabilities 4 being deferred tax assets, current tax assets and current tax payable 5 being cash and cash equivailents and interest bearing loans and borrowings
FINANCIAL REVIEW

39Pendragon PLC Annual Report 2020
Net assets have reduced from £168.9m at 31 December 2019
to £126.7m at 31 December 2020.
At 31 December 2020, the Group had £222.8m (£368.8m
including IFRS16 right of use assets) of land and property
assets (FY19: £237.8m (£397.0m including IFRS16 right of
use assets)). The reduction in property principally reflects
the previously announced sale and leaseback of the Group’s
new Porsche facility in Stockport, combined with the disposal
of excess property as outlined and partially offset by capital
investments. A reduction in the right of use assets of £13.2m
results from a combination of the ongoing depreciation in
association with IFRS 16, combined with the impact of the
reduction in leasehold properties from the 15 exited properties,
partially offset by the addition of Porsche Stockport as an
IFRS 16 property.
The movement in plant and equipment largely reflects the
ongoing depreciation with a lower than planned level of
capital expenditure in the period, combined with the impact of
disposals as a result of store closures.
The reduction in goodwill and intangibles is principally a result
of a goodwill impairment charge of £12.5m for the year which
was all recorded in H1.
Stock has reduced by £230.2m to £608.8m (FY19: £839.0m)
driven by a combination of a reduction in the levels of
both new car stock and used car stock, as well as smaller
reductions in the levels of parts stock. Reductions in used
car stock (c.£70m reduction vs FY19) arose from the impact
of both store closures and a continued focus on inventory
management. New car stock was lower (c.£150m reduction
vs FY19) as a result of closures, combined with a short-term
impact from reduced OEM production during the pandemic,
resulting in higher sales levels from existing store stock. We
currently expect new car stock levels to rebuild through FY21.
As described with the Group’s interim results announcement,
the Group benefitted from a timing benefit from the cash
inflow of receivables of approximately £45m as at 30 June
2020, which largely reversed during the second half of FY20.
Despite this reversal, receivables declined by £16.7m to £113.2m
(FY19: £129.9m), principally as a result of the previously
discussed lower second half new vehicle sales year-on-year.
The reduction in payables of £280.6m principally relates to the
lower vehicle creditors as a result of the reduction in vehicle
inventory. This combined with a lower lease liability associated
with the reduced right of use assets as described above is
partially offset by an increased VAT creditor as described in
the analysis of working capital above.
The net tax balance has increased from £22.7m to £37.8m
primarily as a result of the increased pension obligations,
additional tax losses generated in the year, and the restatement
of UK deferred tax from 17% to 19% following the budget
announcement of 11 March 2020.
The net liability for defined benefit pension scheme obligations
has increased from £59.0m at FY19 to £75.5m at FY20. The
increase of £16.5m comprises of contributions of £12.5m, a
net expense recognised in the income statement of £4.4m
(comprising a past service cost expense of £3.3m and an
interest expense of £1.1m) and a net actuarial loss of £24.6m.
The net actuarial loss has arisen due in part to changes in the
principal assumptions used in the valuation of the scheme’s
assets and liabilities and also the change in value of the
assets held over the year. The Group contributed £12.5m to
the Pension Scheme in the period in line with the Group’s
commitment as agreed in the triennial actuarial valuation of
the company’s pension scheme as at 31 December 2018.
DIVIDEND
The Group is not proposing a final dividend for 2020.
REVOLVING CREDIT FACILITY (RCF)
In March 2021 the maturity date of the Group’s RCF was
extended by 11 months to 1 March 2023, with the facility size
maintained at £175m. The Group has agreed to initially increase
the margin to 4.85% for this extended facility. The £175m RCF
and the £60m Private Placement are both due to mature in
March 2023.
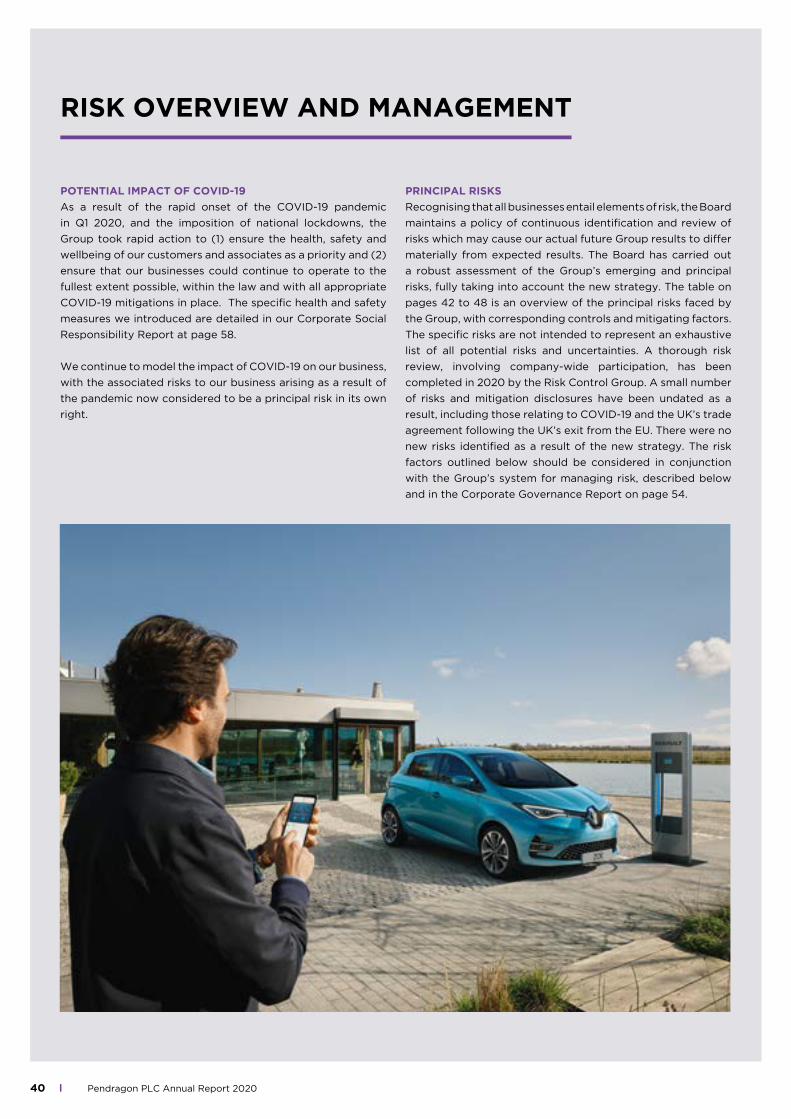
40 Pendragon PLC Annual Report 2020
RISK OVERVIEW AND MANAGEMENT
POTENTIAL IMPACT OF COVID-19
As a result of the rapid onset of the COVID-19 pandemic
in Q1 2020, and the imposition of national lockdowns, the
Group took rapid action to (1) ensure the health, safety and
wellbeing of our customers and associates as a priority and (2)
ensure that our businesses could continue to operate to the
fullest extent possible, within the law and with all appropriate
COVID-19 mitigations in place. The specific health and safety
measures we introduced are detailed in our Corporate Social
Responsibility Report at page 58.
We continue to model the impact of COVID-19 on our business,
with the associated risks to our business arising as a result of
the pandemic now considered to be a principal risk in its own
right.
PRINCIPAL RISKS
Recognising that all businesses entail elements of risk, the Board
maintains a policy of continuous identification and review of
risks which may cause our actual future Group results to differ
materially from expected results. The Board has carried out
a robust assessment of the Group’s emerging and principal
risks, fully taking into account the new strategy. The table on
pages 42 to 48 is an overview of the principal risks faced by
the Group, with corresponding controls and mitigating factors.
The specific risks are not intended to represent an exhaustive
list of all potential risks and uncertainties. A thorough risk
review, involving company-wide participation, has been
completed in 2020 by the Risk Control Group. A small number
of risks and mitigation disclosures have been undated as a
result, including those relating to COVID-19 and the UK’s trade
agreement following the UK’s exit from the EU. There were no
new risks identified as a result of the new strategy. The risk
factors outlined below should be considered in conjunction
with the Group’s system for managing risk, described below
and in the Corporate Governance Report on page 54.
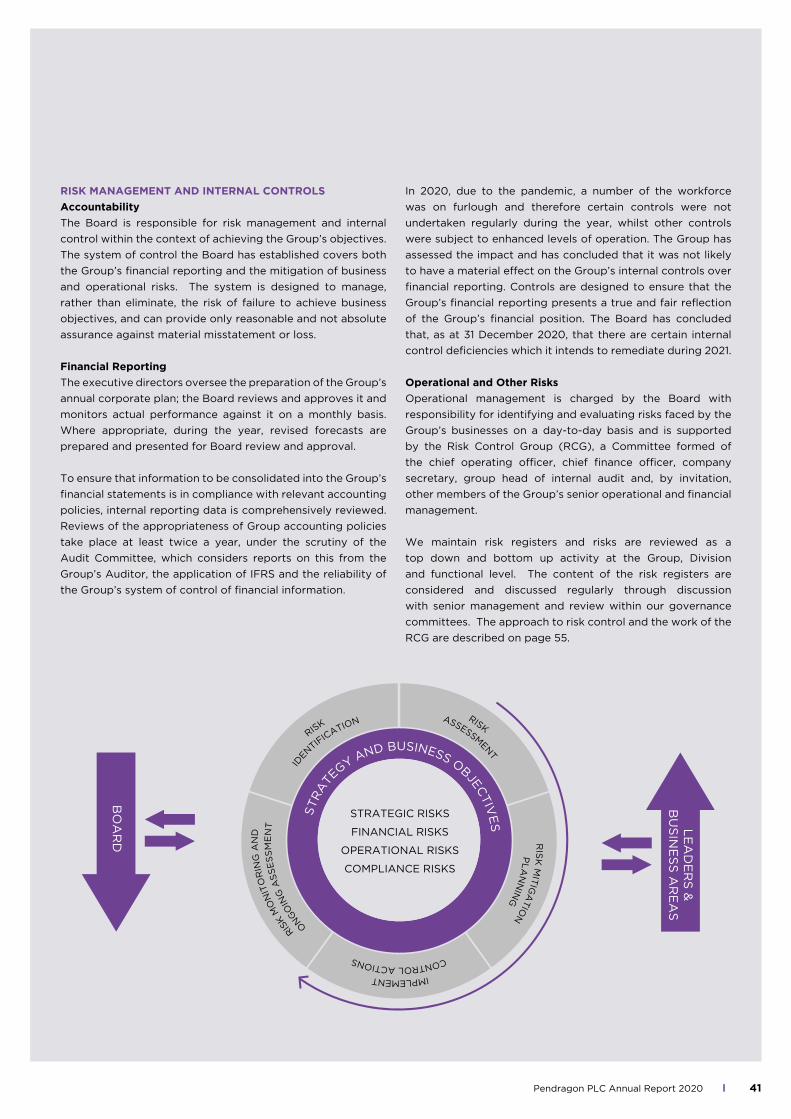
41Pendragon PLC Annual Report 2020
RIS
K M
ON
ITO
RIN
G A
ND
ON
GO
ING
AS
SE
SS
ME
NT
RISK
IDEN
TIFIC
ATION
RIS
K M
ITIG
ATIO
NP
LA
NN
ING
IMPLEMENT
CONTROL ACTIONS
RISK ASSESSM
ENT
STR
ATEGY AND BUSINESS OBJEC
TIV
ES
STRATEGIC RISKS
FINANCIAL RISKS
OPERATIONAL RISKS
COMPLIANCE RISKS
BO
AR
D
LE
AD
ER
S &
B
US
INE
SS
AR
EA
S
RISK MANAGEMENT AND INTERNAL CONTROLS
Accountability
The Board is responsible for risk management and internal
control within the context of achieving the Group’s objectives.
The system of control the Board has established covers both
the Group’s financial reporting and the mitigation of business
and operational risks. The system is designed to manage,
rather than eliminate, the risk of failure to achieve business
objectives, and can provide only reasonable and not absolute
assurance against material misstatement or loss.
Financial Reporting
The executive directors oversee the preparation of the Group’s
annual corporate plan; the Board reviews and approves it and
monitors actual performance against it on a monthly basis.
Where appropriate, during the year, revised forecasts are
prepared and presented for Board review and approval.
To ensure that information to be consolidated into the Group’s
financial statements is in compliance with relevant accounting
policies, internal reporting data is comprehensively reviewed.
Reviews of the appropriateness of Group accounting policies
take place at least twice a year, under the scrutiny of the
Audit Committee, which considers reports on this from the
Group’s Auditor, the application of IFRS and the reliability of
the Group’s system of control of financial information.
In 2020, due to the pandemic, a number of the workforce
was on furlough and therefore certain controls were not
undertaken regularly during the year, whilst other controls
were subject to enhanced levels of operation. The Group has
assessed the impact and has concluded that it was not likely
to have a material effect on the Group’s internal controls over
financial reporting. Controls are designed to ensure that the
Group’s financial reporting presents a true and fair reflection
of the Group’s financial position. The Board has concluded
that, as at 31 December 2020, that there are certain internal
control deficiencies which it intends to remediate during 2021.
Operational and Other Risks
Operational management is charged by the Board with
responsibility for identifying and evaluating risks faced by the
Group’s businesses on a day-to-day basis and is supported
by the Risk Control Group (RCG), a Committee formed of
the chief operating officer, chief finance officer, company
secretary, group head of internal audit and, by invitation,
other members of the Group’s senior operational and financial
management.
We maintain risk registers and risks are reviewed as a
top down and bottom up activity at the Group, Division
and functional level. The content of the risk registers are
considered and discussed regularly through discussion
with senior management and review within our governance
committees. The approach to risk control and the work of the
RCG are described on page 55.

42 Pendragon PLC Annual Report 2020
Residual Risk Trend: Unchanged Increasing Decreasing
NO. PRINCIPAL RISKS IMPACT BEFORE MITIGATION MITIGATION
1 COVID-19 PANDEMIC
New risk: Failure to adapt our
operations to new or
longer-term disruptive
effects arising from the
global pandemic. Factors
could include disruption
to our customers, our
OEM partners, our
suppliers, and our
workforce, which could
adversely affect our
financial condition and
results of operations
Failure to mitigate the
additional business costs
which could arise as a
result of Government
action to address the
national cost of the
pandemic and the further
spending required to
address factors such as
long-term unemployment
We experience issues with
short-term staff shortages if
the virus is allowed to spread
amongst our workforce, or if
large teams are required to
isolate
We experience difficulties in
providing ongoing supplies and
services, leading to customer
dissatisfaction, causing us to
miss our profit targets
We suffer delays or constraints
in delivering our business plan,
which could cause us to fall
behind our competitors or fail
to meet our customers’ future
needs
• We rapidly reviewed our working environment
and introduced robust provision for safe-
working under socially distanced conditions, with
enhanced hygiene protocols and rapid response
to localised issues. Safety remains our number
one priority and is monitored by a centrally
coordinated team
• We have significantly developed our systems
and processes during 2020 to enable our
customers’ needs to be met through a range of
sales channels to suit their needs and to ensure
ongoing compliance to all regulations. These
developments include enhancements to the
online journey, home delivery, click and collect,
and payment processes, as well as providing
customers the benefit of direct interaction
with our associates from their own home by
integrating video calls into our sales process
• We are continuing to develop our sales channels,
in particular our online journey
• We continue to work closely with our OEM
partners and other key suppliers to ensure any
potential disruption or material future change to
operations is factored into our planning
• Executive directors and COVID-19 strategy/
action team of cross-functional leaders meet
regularly to anticipate and plan for any potential
changes
• Our business plan has been fully refreshed in
2020 and has taken into account the latest
economic predictions
RISK OVERVIEW AND MANAGEMENT

43Pendragon PLC Annual Report 2020
NO. PRINCIPAL RISKS IMPACT BEFORE MITIGATION MITIGATION
2 STRATEGY
Failure to adopt
the right strategy,
or
Failure of our
adopted strategy
to deliver the
desired outcomes,
or
Failure to
implement our
strategy effectively
Delay to strategic
delivery and
investment
financial
constraints as a
result of COVID-19
Failure to invest in
the right physical
and digital assets
to meet all future
customer needs
We miss our profit growth and/or
debt management target, alienate
key stakeholders and are unable to
invest adequately in our business
We do not meet our customers’
needs by not achieving a coherent,
connected and engaging customer
journey, leading to us to be less
competitive and losing market share
• Our strategy is informed by significant research and
market data
• We communicate effectively our adopted strategy to
our stakeholders. Our strategic priorities were fully
refreshed during 2020 and full details are included at
page 25 of this report
• We invest appropriately in the technological, physical
and human resources to deliver our strategy, closely
monitor performance against our objectives, and
adjust our actions to meet our strategic goals. We
have appointed a director of strategy & transformation
and other dedicated resources to support the
delivery of our strategic initiatives and provide robust
governance, including financial tracking
• Our sophisticated management information identifies
threats to the success of our strategy both during
the planning and implementation phases, and informs
mitigating actions, both directionally and operationally
• We ensure that we monitor our manufacturer and
third party customer service measures and take action
in the event of low scores
• We focus strongly on efficient use of working capital
through embedded disciplines, especially in relation to
vehicle inventory
• We review capital expenditure plans to ensure our ROI
objectives are achievable
3 MANUFACTURER RELATIONSHIPS
Dependence
on vehicle
manufacturers for
the success of our
business
Failure to maintain
sustainable,
mutually rewarding
relationships with
our manufacturers
Failure of, or weaknesses in, our
vehicle manufacturers’ financial
condition, reputation, marketing,
production and distribution
capabilities (including those
arising from the ongoing effect of
COVID-19) and lack of alignment
with manufacturers’ remuneration
systems for dealers impairs our
investments and prevents us
achieving our profit goals
Failure to maintain good relations
with our franchisors either through
day to day activities or our strategic
decisions impairs our ability to
generate good quality earnings
Failure to positively adapt to OEM
consolidation such as the creation
of multi brand operations and
network rationalisation
Manufacturers change their business
model towards direct sales to
customers
• Our diverse franchise representation avoids over
reliance on any single manufacturer
• Our close contact with our vehicle manufacturers
seeks to ensure our respective goals and strategic
decisions are communicated, understood and aligned,
to deliver mutually acceptable performance
• Our appropriately targeted investment in franchise
assets and our performance maintains our
reputation as a quality representative for our brand
manufacturers
• Our investment in marketing initiatives and our
online presence supplement and enhance our market
presence and offering over and above manufacturers’
marketing efforts
• Our diverse franchise representation ensures new
vehicle inventory is supplied from a wide variety of
sources
• Our model of developing and maintaining revenues
from used vehicles, aftersales, and our software and
leasing segments reduces our overall reliance on new
vehicle franchises
• Our ongoing innovation and investment in customer
choice as to how they wish to purchase a vehicle
makes us an attractive partner to OEMs

44 Pendragon PLC Annual Report 2020
NO. PRINCIPAL RISKS IMPACT BEFORE MITIGATION MITIGATION
4 COMPETITION
Failure to meet
competitive challenges
to our business model or
sector
Customers migrate to
alternative providers
Intermediary companies
establish a barrier between us
and our customers
New forms of competition
would have less barriers to their
entering the market
Revenues and profits could
decrease owing to competitor
action
The market could become
more fragmented as online,
click and collect and home
delivery models become more
attractive ways of purchasing to
customers
• Our detailed market and sector monitoring systems
assist early identification and effective response to
any competitive or intermediary threats
• Our scale, expertise and technological capabilities
enable rapid and flexible response to market
opportunities
• Our well-developed customer relationship
management capabilities and ongoing innovation
and investment in our online platforms, customer
offer and fulfilment tools aim to drive industry-
leading service and attract customer loyalty
• We continually seek to develop new methods
of customer interaction, particularly online. This
enables the business to anticipate changing
customer needs
5 RULES OF ORIGIN AND OTHER OUTCOMES ARISING FROM THE UK’S TRADE DEAL WITH THE EUROPEAN UNION
Failure of our business
or our partners to meet
the EU Trade Deal rules
of origin on vehicle parts
by 2024 could result in
an increase in costs due
to tariffs or disruption
to our supply chain due
to a need for alternative
sources of supply
Parts supply may become
restricted or reduced, affecting
our ability to meet customers’
needs
Vehicle model variants may
be reduced by manufacturers,
affecting customer choice and
satisfaction
• Our close contact with our vehicle manufacturers
ensures we are able to identify potential supply
issues and collaborate to limit any impact on our
customers and our business performance
• Our vehicle manufacturers are strategically focused
on making any necessary adjustments to their
supply chain in order to mitigate the risk of costs
increasing or supply being disrupted
RISK OVERVIEW AND MANAGEMENT

45Pendragon PLC Annual Report 2020
NO. PRINCIPAL RISKS IMPACT BEFORE MITIGATION MITIGATION
4 COMPETITION
Failure to meet
competitive challenges
to our business model or
sector
Customers migrate to
alternative providers
Intermediary companies
establish a barrier between us
and our customers
New forms of competition
would have less barriers to their
entering the market
Revenues and profits could
decrease owing to competitor
action
The market could become
more fragmented as online,
click and collect and home
delivery models become more
attractive ways of purchasing to
customers
• Our detailed market and sector monitoring systems
assist early identification and effective response to
any competitive or intermediary threats
• Our scale, expertise and technological capabilities
enable rapid and flexible response to market
opportunities
• Our well-developed customer relationship
management capabilities and ongoing innovation
and investment in our online platforms, customer
offer and fulfilment tools aim to drive industry-
leading service and attract customer loyalty
• We continually seek to develop new methods
of customer interaction, particularly online. This
enables the business to anticipate changing
customer needs
5 RULES OF ORIGIN AND OTHER OUTCOMES ARISING FROM THE UK’S TRADE DEAL WITH THE EUROPEAN UNION
Failure of our business
or our partners to meet
the EU Trade Deal rules
of origin on vehicle parts
by 2024 could result in
an increase in costs due
to tariffs or disruption
to our supply chain due
to a need for alternative
sources of supply
Parts supply may become
restricted or reduced, affecting
our ability to meet customers’
needs
Vehicle model variants may
be reduced by manufacturers,
affecting customer choice and
satisfaction
• Our close contact with our vehicle manufacturers
ensures we are able to identify potential supply
issues and collaborate to limit any impact on our
customers and our business performance
• Our vehicle manufacturers are strategically focused
on making any necessary adjustments to their
supply chain in order to mitigate the risk of costs
increasing or supply being disrupted
NO. PRINCIPAL RISKS IMPACT BEFORE MITIGATION MITIGATION
6 ENVIRONMENTAL
Progression towards
greener technologies,
autonomous driving,
and/or pay-per-use,
rather than owning a
vehicle
UK taxes change to
penalise road use, fuel
type, vehicle use and to
increase VAT
Failure to adapt to
the changes arising
as a result of the
Government’s future ban
on sale of petrol, diesel
and hybrid powered
vehicles
OEMs restricting
distribution of certain
vehicle models in the UK
in response to emission
targets
Customers choose greener
vehicles we cannot supply
Overall vehicle parc reduces
Vehicle purchase and use
declines, adversely affecting
revenue opportunities
Lower demand for petrol,
diesel and hybrid vehicles and
potential impact on vehicle
residual values
Government policy and
consumer sentiment in respect
of petrol, diesel and/or hybrid
vehicles impacts the sale of one
or all types of these vehicles
Reductions in sales volumes
or margins due to loss of
certain product lines and future
aftersales opportunities
Investment cost to adapt to a
broad range of BEV products
by 2030 and PHEV and MHEV
by 2035 is not adequately
considered
• We represent vehicle brands which are responding
effectively to the greener technology agenda and
latest Government timescales
• We identify trends in demand through our
sophisticated management information and analysis
tools and tailor our model accordingly
• We monitor sales by fuel type to maintain an
appropriate inventory profile
• Our breadth of relationships with asset finance
companies and geographic footprint help us to
provide innovative mobility solutions for private
and business vehicle users, whatever their needs
• We maintain the right level of tax expertise to
interpret and assess proposed changes, respond
with well-informed advice and effectively assist
our strategic planning and the design and
implementation of appropriate mitigating actions
7 REGULATORY AND COMPLIANCE
Failure to comply
with legal and other
requirements and
respond to changes
which could have a
material effect on our
business model, such
as our ability to provide
Finance and Insurance
products to our
customers, or adverse
changes in trade tariffs
This could lead to fines,
criminal penalties, litigation
and an adverse impact on our
reputation, financial results,
and/or our ability to do business
We may be restricted from
continuing certain business
activities, such as those
regulated by the FCA
Resources are diverted to
address urgent remediation, as
well as taking proceedings or
defending legal or regulatory
action
The ability to obtain appropriate
inventory is impeded and/or
purchase costs rise
• We maintain appropriate expertise to interpret,
assess and respond to proposed changes in
regulation, enabling us to adapt our model and
processes to comply with changes in a seamless
manner
• Our culture focuses strongly on good compliance
delivering good performance
• We operate a Finance and Insurance Services
Regulatory Board with a supporting governance
framework and invest in systems and processes
to minimise the risk of non-compliance to FCA
regulations
• Our team of compliance specialists design, and
we communicate effectively, processes that
support our businesses to minimise the risk of non-
compliance
• In the case of new vehicles, our diverse
representation mitigates the risk and for parts
we maintain alternative sources of supply where
possible

46 Pendragon PLC Annual Report 2020
NO. PRINCIPAL RISKS IMPACT BEFORE MITIGATION MITIGATION
8 TECHNOLOGY AND INFORMATION SYSTEMS
Failure of our IT
infrastructure or key
systems, including failure
to maintain and build
resilience to events such
as cyber threat
Failure to invest in
new technologies and
maintain a cohesive
and comprehensive
technological capability
This could lead to an inability
to operate and communicate
effectively, loss of information
and competitive advantage
and potential regulator action
resulting in fines and penalties
• We adopt and regularly update robust disaster
recovery measures, including within our dealer
management systems
• We have appointed a chief information officer who
has reviewed our cyber security measures through
an independent third party. An Information Security
Improvement Plan has been developed and an
external advisor engaged to provide oversight and
direction to remediation activities
• The Information Security Steering Committee
has been established to oversee change and
operational activities relating to information
security
• We have established a Pendragon Group IT
function to set strategy for technology including
cloud-based systems and processes. Disaster
recovery capability and systems availability is in
place for all core systems
• Our Pinewood business monitors cyber security
threats and has systems and processes in place
to deal with incidents relating to the services
they provide. This is demonstrated through their
continued ISO27001 certification
• We have cyber liability insurance in place, that
includes Cyber Incident Response Centre, providing
access to expertise to assist during a crisis
9 DATA SECURITY AND DATA PRIVACY
Failure to comply with
legal or regulatory
requirements relating
to data security or data
privacy in the course of
our business activities
This could lead to data loss or
misuse and have a significant
effect on our reputation. Fines
and criminal penalties could
be imposed and disruption to
business operations and our
ability to serve customers.
Financial results could be
adversely affected
• We regularly review our data protection policies,
controls, associate training and the use of third
party systems
• Our Pinewood business monitors cyber security
threats and has systems and processes in place to
deal with incidents
• We have cyber liability insurance in place
• We have appointed a chief information officer who
has reviewed our cyber security measures through
an independent third party. An Information Security
Improvement Plan has been developed and an
external advisor engaged to provide oversight and
direction to remediation activities
• The Information Security Steering Committee
has been established to oversee change and
operational activities relating to information
security
RISK OVERVIEW AND MANAGEMENT

47Pendragon PLC Annual Report 2020
NO. PRINCIPAL RISKS IMPACT BEFORE MITIGATION MITIGATION
8 TECHNOLOGY AND INFORMATION SYSTEMS
Failure of our IT
infrastructure or key
systems, including failure
to maintain and build
resilience to events such
as cyber threat
Failure to invest in
new technologies and
maintain a cohesive
and comprehensive
technological capability
This could lead to an inability
to operate and communicate
effectively, loss of information
and competitive advantage
and potential regulator action
resulting in fines and penalties
• We adopt and regularly update robust disaster
recovery measures, including within our dealer
management systems
• We have appointed a chief information officer who
has reviewed our cyber security measures through
an independent third party. An Information Security
Improvement Plan has been developed and an
external advisor engaged to provide oversight and
direction to remediation activities
• The Information Security Steering Committee
has been established to oversee change and
operational activities relating to information
security
• We have established a Pendragon Group IT
function to set strategy for technology including
cloud-based systems and processes. Disaster
recovery capability and systems availability is in
place for all core systems
• Our Pinewood business monitors cyber security
threats and has systems and processes in place
to deal with incidents relating to the services
they provide. This is demonstrated through their
continued ISO27001 certification
• We have cyber liability insurance in place, that
includes Cyber Incident Response Centre, providing
access to expertise to assist during a crisis
9 DATA SECURITY AND DATA PRIVACY
Failure to comply with
legal or regulatory
requirements relating
to data security or data
privacy in the course of
our business activities
This could lead to data loss or
misuse and have a significant
effect on our reputation. Fines
and criminal penalties could
be imposed and disruption to
business operations and our
ability to serve customers.
Financial results could be
adversely affected
• We regularly review our data protection policies,
controls, associate training and the use of third
party systems
• Our Pinewood business monitors cyber security
threats and has systems and processes in place to
deal with incidents
• We have cyber liability insurance in place
• We have appointed a chief information officer who
has reviewed our cyber security measures through
an independent third party. An Information Security
Improvement Plan has been developed and an
external advisor engaged to provide oversight and
direction to remediation activities
• The Information Security Steering Committee
has been established to oversee change and
operational activities relating to information
security
NO. PRINCIPAL RISKS IMPACT BEFORE MITIGATION MITIGATION
10 RELIANCE ON ESTIMATES
Failure to maintain
reliable systems and
methods for provision of
financial estimates
Group’s financial statements
will be wrong, affecting
vehicle values where we
have committed to purchase
at a pre-set price, and the
discounted cashflows used to
test impairment of goodwill,
expected profit or loss on sale
of our inventory items and the
retirement benefit obligation
Reputational damage and
inability to raise funding for the
Group’s business
Revenue and profits all suffer
damage
• We assess actual outturns of previous estimates to
test the robustness of adopted assumptions, and
adjust the estimating approach accordingly
• We support estimates with reliable external research
where available
11 PEOPLE
Failure to attract,
motivate, develop and
retain the required
capability and promote
an appropriate culture
Failure to attract the
right talent required
to deliver strategy or
change culture
This could lead to instability,
poor communication and
decision making and an inability
to deliver our strategy and
achieve our business objectives.
We could lose market share and
adversely affect our customers
owing to poor service
• We invest in online means of attraction and
recruitment, targeting the right quality candidates
• We set clear competencies and career goals
• We have a clear performance management
framework in place, linked to competencies and
career pathways
• We continually review and adapt for the market
conditions, our employment terms, salaries and
performance related pay elements at all levels
• We adopt and renew responsive succession plans
for all key roles. Within our Motor Division we
complete a Talent Review twice yearly
• We leverage our scale to afford training
opportunities and progression within the Group
12 MICRO-ECONOMIC, POLITICAL AND ENVIRONMENTAL
European economic
instability and/or UK or
Global economic and
business conditions
deteriorate
UK Governmental
spending constraints
Longer term
unemployment as UK
Government support
for COVID-19 pandemic
unwinds
Fewer purchasers of vehicles
Spend on luxury purchases
reduces due to higher
unemployment and job
insecurity
Vehicle manufacturers
oversupply into UK market or
alterations to supply terms,
damages margins and vehicle
values
Lower demand for vehicle
servicing
• Our business model derives revenues from every
stage of the vehicle’s life-cycle and has expanded
into the older vehicle parc for both vehicle sales and
aftersales
• We carefully control new vehicle inventory to
mitigate effects of overstocking and work closely
with our OEM partners, accessing support through
initiatives such as extended stocking finance
• We have right-sized our cost base, completed a
dealership network review and closed loss-making
operations, and we continue to pursue opportunities
to ensure our business processes are highly efficient
• We invest in and vigorously pursue customer
retention initiatives to secure longer term loyalty
48 Pendragon PLC Annual Report 2020
NO. PRINCIPAL RISKS IMPACT BEFORE MITIGATION MITIGATION
13 FINANCE & TREASURY
Lack of availability of
debt funding
Increasing Pension
liabilities arising from
our defined benefit
scheme
As set out in more detail in note 4.2
the Group has a Revolving Credit
Facility of £175m and a private
placement of £60m, both of which
mature in March 2023. Without the
requisite facilities the Group would
be unable to meet debt obligations
Changes in discount rates, inflation,
asset values, Pension trustees’
investment strategies or mortality
assumptions could lead to a
materially higher deficit than our
current recovery plan is designed
to fund, and a direct impact on
valuation, implied credit rating and
potential additional funding
requirements at subsequent
triennial reviews
• Our business model produces strong free cash flow
generation
• We maintain adequate committed facilities to meet
forecast debt funding requirements
• Diversification of funding sources, monitor daily our
funding requirements
• The Defined Benefit Scheme was closed to new
entrants in 2000 and for future service accrual in
2006
• Regular review by our pension trustees of
investment strategy and liability reduction and risk
mitigation, taking professional advice, including
triennial valuations
• Deficit funding recovery plan in place
14 HEALTH, SAFETY & ENVIRONMENTAL
Failure to provide
safe working and
retail environments
Failure to keep up
to date with and put
in place adequate
procedures to comply
to all Government
COVID-19 laws,
regulations and
guidance, at both
country level and
local/regional level
Failure to control
the environmental
hazards present
within our operations
Failure to keep up
to date with Waste
Packaging and Waste
Recycling Regulations
This could lead to illness and injury,
fatalities, lost working time, civil
claims and clean-up costs
Our reputation could be adversely
affected and regulatory action
could result in prohibition, fines and
criminal penalties and closure of
businesses
This could lead to sanctions
from the Environmental Agency
in respect of harmful substance
emissions/escape into the
atmosphere, which may adversely
affect the efficiency of our Body
Centres and SMART repair
throughput and excessive charging
as “End User Packaging” levy
• We work to the Health & Safety Executive’s ‘Plan,
Do, Check, Act’ framework for managing risk in the
workplace
• We allocate clear responsibilities for delivery of
safe places to work and shop
• In consultation with the business and where
appropriate, external specialists we adopt process-
driven initiatives to mitigate specific risk areas
• We measure and review our performance against
appropriate benchmarks
• We allocate local accountability for sites’
compliance and provide specialist support to
responsible leaders
• We monitor site conditions and drive corrective
action through audit follow-up
• We operate independent routes for the reporting
of any concerns (whistle blowing) and have a
standard procedure for investigation and escalation
of matters of concern
• In response to COVID-19 we have put in place
additional measures to assist our associates in
limiting the risk of spread of infection, including
home working where this is possible and all
Government mandated protocols where it is not
possible. We have specifically considered and
will continue to monitor the potential impact of
COVID-19 on our business in accordance with our
business continuity plans
• Our health and safety response to COVID-19 is
more particularly detailed at page 58 of this report
RISK OVERVIEW AND MANAGEMENT

49Pendragon PLC Annual Report 2020
NO. PRINCIPAL RISKS IMPACT BEFORE MITIGATION MITIGATION
13 FINANCE & TREASURY
Lack of availability of
debt funding
Increasing Pension
liabilities arising from
our defined benefit
scheme
As set out in more detail in note 4.2
the Group has a Revolving Credit
Facility of £175m and a private
placement of £60m, both of which
mature in March 2023. Without the
requisite facilities the Group would
be unable to meet debt obligations
Changes in discount rates, inflation,
asset values, Pension trustees’
investment strategies or mortality
assumptions could lead to a
materially higher deficit than our
current recovery plan is designed
to fund, and a direct impact on
valuation, implied credit rating and
potential additional funding
requirements at subsequent
triennial reviews
• Our business model produces strong free cash flow
generation
• We maintain adequate committed facilities to meet
forecast debt funding requirements
• Diversification of funding sources, monitor daily our
funding requirements
• The Defined Benefit Scheme was closed to new
entrants in 2000 and for future service accrual in
2006
• Regular review by our pension trustees of
investment strategy and liability reduction and risk
mitigation, taking professional advice, including
triennial valuations
• Deficit funding recovery plan in place
14 HEALTH, SAFETY & ENVIRONMENTAL
Failure to provide
safe working and
retail environments
Failure to keep up
to date with and put
in place adequate
procedures to comply
to all Government
COVID-19 laws,
regulations and
guidance, at both
country level and
local/regional level
Failure to control
the environmental
hazards present
within our operations
Failure to keep up
to date with Waste
Packaging and Waste
Recycling Regulations
This could lead to illness and injury,
fatalities, lost working time, civil
claims and clean-up costs
Our reputation could be adversely
affected and regulatory action
could result in prohibition, fines and
criminal penalties and closure of
businesses
This could lead to sanctions
from the Environmental Agency
in respect of harmful substance
emissions/escape into the
atmosphere, which may adversely
affect the efficiency of our Body
Centres and SMART repair
throughput and excessive charging
as “End User Packaging” levy
• We work to the Health & Safety Executive’s ‘Plan,
Do, Check, Act’ framework for managing risk in the
workplace
• We allocate clear responsibilities for delivery of
safe places to work and shop
• In consultation with the business and where
appropriate, external specialists we adopt process-
driven initiatives to mitigate specific risk areas
• We measure and review our performance against
appropriate benchmarks
• We allocate local accountability for sites’
compliance and provide specialist support to
responsible leaders
• We monitor site conditions and drive corrective
action through audit follow-up
• We operate independent routes for the reporting
of any concerns (whistle blowing) and have a
standard procedure for investigation and escalation
of matters of concern
• In response to COVID-19 we have put in place
additional measures to assist our associates in
limiting the risk of spread of infection, including
home working where this is possible and all
Government mandated protocols where it is not
possible. We have specifically considered and
will continue to monitor the potential impact of
COVID-19 on our business in accordance with our
business continuity plans
• Our health and safety response to COVID-19 is
more particularly detailed at page 58 of this report
VIABILITY STATEMENT
VIABILITY STATEMENT
In accordance with provision 31 of the UK Corporate Governance
Code, published by the Financial Reporting Council in July 2018
(the ‘Code’), taking into account the company’s current position
and principal risks, the directors have assessed the viability
and prospects of the company over the three-year period to 31
December 2023.
The Group normally expects to have in place facilities of three-
years and therefore this remains the appropriate time-frame to
assess viability. At this time, the Group’s facility runs until 1 March
2023, so there remains risk that the terms of any refinancing may
be less favourable to the Group. The Group has nominated external
advisers to mitigate this risk and identify the most appropriate
source of financing.
The three-year review considers the Group’s profit and loss, cash
flows, debt and other key financial ratios over the period. These
metrics are subject to a severe but plausible downside scenario
which involves flexing several of the main assumptions underlying
the forecast, including the removal of the disposal of the final US
dealership, assumes two further one-month national lockdowns
without Government support measures in the next 12 months, and
includes the impact of a reasonable downside contraction in sales
volumes and margins which is below that experienced in 2020.
The three-year review also makes certain assumptions about the
normal level of capital recycling likely to occur and considers
whether additional financing facilities will be required. Finally,
the analysis takes into account the capital plans of the Group and
the ability to mitigate downside risk through the cancellation of
these plans.
Based on the results of this analysis, the directors have a reasonable
expectation that the company will be able to continue in operation,
comply with facility covenants and meet its liabilities as they fall
due over the three-year period of their assessment. The directors
consider that the current economic outlook presents significant
challenges in terms of sales volume and pricing and impact from
the ongoing COVID-19 pandemic presents uncertainties to future
trading conditions. Whilst the directors have instituted measures
to preserve cash and improve performance, there remains a level
of uncertainty over future trading results and cash flows.
In addition, further discussion of the principal risks and material
uncertainties affecting Pendragon PLC can be found within
the Annual Report and Accounts on pages 40 to 48. The risk
disclosures section of the consolidated financial statements
set out the principal risks the Group is exposed to, including
strategic, operational, economic, market, environmental, credit,
technological, regulatory and associate resource.
The Board has also considered and will continue to monitor the
threat and implications of COVID-19 and the potential for future
national lockdowns and disruption to trading. The risk disclosure
section also sets out the Group’s policies for monitoring, managing
and mitigating its exposures to these risks. The Board considers
risks on a triannual basis during the year through the Risk Control
Group and annually at a Board meeting with ad hoc reporting as
required.
The principal risks and the mitigation steps that the Board
considered as part of this viability statement were as follows:
The availability of debt funding, in particular, the successful
refinancing of both the revolving credit facility and private
placement, when they expire in 2023. The Board intend to seek the
right external advice to ensure the most appropriate debt funding
sources are identified as part of any refinancing process. It is
possible that the terms of any refinancing may be less favourable
for the Group than the current facility.
The ability to adapt to changing environments outside our direct
control such as macro-economic, political and environmental
factors, regulation changes, manufacturer and competitor
behaviour. The Board has specifically reviewed the potential
impacts and available mitigating actions as a result of a downside
trading scenario in the event of economic challenges resulting
from the currently unknown effect of the COVID-19 pandemic. In
particular the Board reviewed the causes and consequences of
the reduction in profitability year on year in assessing the risks.
We mitigate these risks through the diverse revenue generation
from all parts of the vehicle cycle and wide range of franchise
representation together with regular monitoring to identify
changes quickly.
During 2020, the Board carried out a robust assessment of the
principal risks facing the Group, including those that would threaten
its business model, future performance, solvency or liquidity. The
Directors believe that the Group is able to manage its business
risks successfully, having taken into account the current economic
outlook and the results of the severe but plausible downside
scenario for the three year viability period. Accordingly, the Board
believes that, taking into account the Group’s current position, and
subject to the principal risks faced by the business, the Group will
be able to continue in operation and to meet its liabilities as they
fall due for the period up to 31 December 2023.
Approved by order of the Board
Mark Willis
Chief Finance Officer
24 March 2021

50 Pendragon PLC Annual Report 2020
52 Board of Directors
54 Corporate Governance Report
58 Corporate Social Responsibility Report
61 Audit Committee Report
66 Nomination Committee Report
67 Remuneration Committee Report
68 Directors’ Remuneration Report
83 Directors’ Report
DIRECTORS’ REPORT

51Pendragon PLC Annual Report 2020

52 Pendragon PLC Annual Report 2020
Nikki joined Pendragon on 01 April 2020. She has an extensive executive career across a range of sectors, including retail, utilities and digital, within both regulated and non-regulated environments. Previous roles have included that of Chief Operating Officer of Opus Energy, a wholly owned subsidiary of Drax Group Plc, plus senior non-statutory executive roles at Telefonica, M&S, WH Smith, Centrica and O2. Nikki currently holds an executive position at SSE plc as the Managing Director for the Customer Division. Nikki actively champions inclusion and diversity within the workplace. Her extensive executive experience over a 30 year career enables Nikki to contribute strategic perspectives to the Board.
BOARD OF DIRECTORS
Bill joined Pendragon on 18 April 2019 as a non-executive director, assumed the role of interim executive chairman on 01 October 2019 and became chief executive officer on 19 February 2020. Bill continues to perform the role of interim chairman. Formerly the President and Chief Operating Officer of AutoNation, the largest automotive retailer in America, Bill has extensive executive experience in automotive retail, enabling him to provide effective leadership of Pendragon’s Board and advise in relation to the Company’s future strategy.
Brian joined Pendragon on 10 December 2019, following an extensive executive career in the retail sector, where most recently he held the position of Chief Finance Officer at JD Sports Fashion Plc between 2004 and 2018. Brian is also a Non-Executive Director and Chairman of the Audit Committee at online retailer, Boohoo.com, and a Non-Executive Director and Chairman of the Audit Committee of Mothercare Plc. Brian qualified as a chartered accountant with Price Waterhouse in 1981, and with industry experience across a range of retailers, he brings additional financial and strategic perspectives to the Board.
Mike joined Pendragon on 02 May 2018, following an executive career in the international automotive sector, retiring as Executive Director at Jaguar Land Rover in 2016. Since then he has developed a strong international portfolio of NED, Chair and advising roles in FTSE and North American listed businesses, and the education, sports and arts sectors. His previous automotive sector specific executive experience, over a 40 year career, enables Mike to contribute the industry perspective, and is of significant value to the Board.
Key to memberships, roles and re-election status
* Committee chairman
** Acting Committee chairman
(SID) Senior Independent Director
(A) Audit Committee
(N) Nomination Committee
(R) Remuneration Committee
(F) Audit Committee member with recent and relevant financial experience
More detailed professional biographies of the Directors are on the Company’s website.www.pendragonplc.com
NIKKI FLANDERS Non-Executive Director
(A) (N) (R)
BILL BERMAN Chief Executive Officer
& Interim Chairman
BRIAN SMALL Non-Executive Director
(A*) (N) (R) (F)
MIKE WRIGHT Non-Executive Director
(A) (N**) (R)

53Pendragon PLC Annual Report 2020
Mark joined Pendragon on 08 April 2019 as chief finance officer, from Ten Entertainment Group PLC where he held the position of Chief Finance Officer since taking it through its IPO in April 2017. Prior to this, Mark worked at Home Retail Group PLC, including roles as Argos Finance Director, Director of Group Finance and Investor Relations Director. Since joining Pendragon, Mark’s wealth of accounting, financial and investor relations experience continues to add significant value to the Board.
Having spent his entire career with Pendragon businesses, from apprentice mechanic to group general manager, Martin became operations director in September 1995 and chief operating officer in November 2001. Martin’s extensive knowledge of Pendragon’s operations ensures he continues to be able to advise the Board as to the most appropriate operational action and response to changes in the automotive retail sector.
Company Secretary
Richard Maloney
Registered Office
Loxley House
2 Oakwood Court
Little Oak Drive
Annesley
Nottingham NG15 0DR
Telephone 01623 725200
Registered in England and Wales
Group motor businesses websites
www.evanshalshaw.com
www.stratstone.com
www.carstore.com
Group Support business websites
www.pinewood.co.uk
www.pendragonvehiclemanagement.co.uk
www.quickco.co.uk
Registered number 2304195
MARK WILLIS Chief Finance Officer
MARTIN CASHA Chief Operating Officer
Dietmar joined Pendragon on 20 April 2020, following an extensive executive career including experience in the automotive sector, banking and sports management. Dietmar currently serves as Chief Operating Officer of AMB Sports & Entertainment. Prior to that, he held the position of President and Chief Executive Officer of Mercedes-Benz USA and Head of Region, NAFTA Mercedes-Benz. His previous automotive sector specific executive experience, in particular in relation to automotive financing, enables Dietmar to contribute the industry perspective, and is of significant value to the Board. Dietmar was appointed SID on 24 February 2021.
DIETMAR EXLER Non-Executive Director
(SID) (A) (N) (R)

54 Pendragon PLC Annual Report 2020
The UK Corporate Governance Code (Code) applies to the
Company and is available on the FRC website at https://www.
frc.org.uk. Other than where expressly stated, throughout
the financial year ended 31 December 2020, the Company
complied in full with the applicable provisions of the Code. The
corporate governance statement as required by Disclosure
and Transparency Rule 7.2.1 is set out below.
OUR BOARD
The Board sets our Company’s strategy and ensures we have in
place the financial and human resources we need to meet our
objectives. We take collective responsibility for Pendragon’s
long term success. The executive directors, led by the chief
executive, are responsible for running the Company and our
Group through the executive committee comprising of the
executive directors and members of senior management to
effect that strategy, and work within prescribed delegated
authority, such as capital expenditure limits. The executives
direct and monitor business performance through regular
operational meetings with their respective leadership teams
and set and regularly review the effectiveness of key operating
controls, reporting to the Board on these and any variances.
The Board as a whole reviews management performance.
Although the Board delegates to the chief executive and chief
finance officer responsibility for briefing key stakeholders,
major shareholders and the investor community, the interim
chairman which is continued to be performed by the chief
executive officer on an interim basis, holds himself available
to engage with shareholders, and the senior independent
director, will perform a similar role, where appropriate.
Information from engagement with shareholders is shared
with the entire Board and taken into account in financial
planning and strategy.
The Board has three committees: Audit, Nomination and
Remuneration, each made up entirely of non-executive
directors. The Risk Control Group (RCG) is a committee of the
executive directors, the company secretary and Group head of
internal audit. Other members from the senior management of
the Group’s operating group functions are co-opted onto the
RCG as required from time to time. Each Committee operates
within delegated authority and terms of reference, set by
the Board, reviewed annually and available to view on the
company’s website. Details of each committee’s work appear
on the next few pages of this Report. Executive directors can
attend Board committees at times, to assist their business, but
only with the committee’s prior agreement.
LEADERSHIP AND BOARD COMPOSITION
As at 24 March 2021, the Board is made up of three executive
directors and four non-executive directors. The Board has
recently recommenced the process of actively seeking to
recruit a non-executive chairman, progress on which had
been delayed due to the onset of the COVID-19 pandemic
and its continuation throughout 2020 and our requirement to
focus on the operational needs and management response of
the business. The Board nevertheless continues to recognise
the need for an appropriate level of executive and non-
executive representation on the Board, and a clear division
of responsibilities between the leadership of the Board and
the executive leadership of the business. In this regard,
the respective responsibilities of the Board, the chairman
and the chief executive are clearly defined by the Board in
formal responsibilities documents, which the Board reviewed
and readopted in July 2020. The Board remains committed
to the progressive refreshing of our membership, so as to
maintain the right balance of skills, experience, independence
and knowledge of the Company to enable us to continue to
operate effectively.
On 19 February 2020, Bill Berman was appointed chief
executive officer of the Company, and has also continued to
perform the role of chairman on an interim basis while the
process for the recruitment of a permanent non-executive
chairman was temporarily suspended during the ongoing
COVID-19 pandemic. In this respect, the Company recognises
that for the entirety of 2020 and beyond, we have not complied
with provision 9 of the Code, in that in performing the role of
interim chairman, Bill Berman is effectively exercising both the
role of chairman and chief executive. However, the Company
considers that, given exceptional circumstances, latterly
driven by the ongoing COVID-19 pandemic, the continuation
of Bill Berman in the interim chairman role remains fully
justified. The Board continues to remain fully committed to
ensuring that the Company observes and maintains at all
times the highest standards of corporate governance, and
has since recommenced the process to find, assess and
recruit a candidate with the requisite capabilities, attributes,
skills and experience to hold the non-executive chairman
role. Longwater Partners, an independent external search
consultancy have again been instructed to assist with this
process. Other than concluding the appointment of a non-
executive chairman, the Board considers that an appropriate
combination of executive and non-executive directors is
otherwise in place in accordance with the Code.
CORPORATE GOVERNANCE REPORT
PENDRAGON PLC BOARD
MAIN BOARD COMMITTEES
OPERATIONAL MEETINGS
NOMINATION COMMITTEE
REMUNERATIONCOMMITTEE
AUDIT COMMITTEE
EXECUTIVE COMMITTEE
RISK CONTROL GROUP

55Pendragon PLC Annual Report 2020
In March 2020, Nikki Flanders joined the Board as an additional
non-executive director, and in April 2020, Dietmar Exler joined
the Board as an additional non-executive director. Dietmar
Exler was appointed to the role of senior independent director
on 24 February 2021.
As noted below, in accordance with the Code, all directors
will be subject to annual re-election (or election in the case
of newly joined directors) at the Annual General Meeting of
the Company. Details of the directors offering themselves for
election in 2021, together with directors’ brief biographical
details appear on page 52, and gender balance details are on
page 57.
OTHER NON-COMPLIANCE WITH THE CODE
The chief operating officer currently receives a salary
supplement in lieu of a pension contribution which does
not currently align with the pension contribution available
to the wider workforce, and is therefore not compliant
with provision 38 of the Code. However, as outlined in the
Director’s Remuneration Report at page 68, it is our intention
to ensure the chief operating officer’s salary supplement in
lieu of pension contribution is reduced over the next three
years such that by 2023 it will be aligned to the pension
contribution available to the wider workforce, and compliance
with provision 38 of the Code will be achieved.
HOW THE BOARD MANAGES RISK
The Board and our Committees each operate to a set meeting
agenda which ensures that all relevant risks are identified and
addressed by appropriate controls. We review management
information which helps us to prescribe operating controls and
monitor performance against our strategy and business plans.
The non-executive directors have particular responsibility for
monitoring financial and performance reporting, to ensure that
progress is being made towards our agreed goals. The Board’s
responsibilities also include assessing the effectiveness of
internal controls and the management of risk. Specific areas of
risk assessment and control fall within the remit of committees
of the Board; details of their work in 2020 appear below and in
the Directors’ Remuneration Report on pages 68 to 82.
THE BOARD’S REVIEW OF RISKS AND CONTROLS IN 2020
During the year, the Board considered all strategic matters,
received key performance information on operating,
financial and compliance matters and reviewed the results of
corresponding controls and risk management. We received
from the Audit Committee and from the Risk Control Group
(‘RCG’) timely information and reports on all relevant aspects
of risk and corresponding controls. We reviewed all our key
Company policies and ensured all matters of internal control
received adequate Board scrutiny and debate. At Board
meetings, and informally via the chairman, all directors had
the opportunity to raise matters of particular concern to them.
There were no unresolved concerns in 2020. We concluded
that, with the exception of certain control deficiencies reported
by KPMG LLP and those included within the Risk Overview
and Management section, all appropriate controls are in
place and functioning effectively. The Board considers that
the Group’s systems provide information which is adequate
to permit the identification of key risks to its business and
the proper assessment and mitigation of those risks. Based
on the Audit Committee’s and the RCG’s work, the Board has
performed a high level risk assessment, to ensure that (i) the
principal risks and uncertainties facing the Group’s business
have been identified and assessed, taking into account any
adaptations made to the Group’s business strategies, and (ii)
that appropriate mitigation is in place.
Our Company policies on managing financial risk and
application of hedging are set out in note 4.2 to the financial
statements. The principal risks and uncertainties we have
identified are on page 40 and our viability statement is on
page 49.
WORK OF THE RISK CONTROL GROUP
The accountability framework described on page 41 is
designed to ensure comprehensive management of risk
across the Group’s businesses. A revised, overarching Risk
Management Policy was introduced in October 2019, setting
out the principles and approaches by which we implement
effective enterprise risk management. The RCG, made up
of the chief operating officer, chief finance officer, group
company secretary, group head of internal audit and, by
invitation, other members of the Group’s senior operational
and financial management, meets regularly to consider the
detailed work on risk assessment performed by leaders and
key business areas and oversees the effective implementation
of new measures designed to mitigate or meet any specific
risks or threats. The chair of the Audit Committee, and a
representative of the external auditor attend by invitation. The
RCG reports to the Audit Committee on its work. The Board
and any of its committees is able to refer specific risks to the
RCG for evaluation and for controls to be designed or modified;
this occurs in consultation with operational management.
The executive directors are responsible for communicating
and implementing mitigating controls and operating suitable
systems of check. The RCG met twice in 2020.
In addition to reviewing and refining the Group’s corporate risk
register, for Board review and adoption, the RCG continues to
monitor and review the Group’s anti-bribery controls, including
the development of e-learning, gifts and hospitality training,
Consumer Rights Act 2015 training, Modern Slavery Act 2015
awareness and further initiatives to reduce incidences of theft
and fraud. The RCG ensures any internal control deficiencies
identified are swiftly remediated.

56 Pendragon PLC Annual Report 2020
CORPORATE GOVERNANCE REPORT
NON-EXECUTIVE DIRECTORS AND INDEPENDENCE
The onset of the COVID-19 pandemic in the first quarter of
2020, and its continuation throughout the entirety of the
year has presented a number of unique challenges for the
Board, in particular with the need to rapidly switch to remote
working without effecting the efficacy or the ability of the
Board to function. Bill Berman has continued in the role of
interim chairman, as well as chief executive officer since his
appointment to the latter of these roles on 19 February 2020.
Throughout 2020, Bill ensured that the Board performed
effectively through a well-functioning combination of Board
and committee meetings and other appropriate channels for
strategic input and constructive challenge from non-executive
directors, whilst remaining vigilant of the need to avoid any
conflict of interest in such situations where exercising the
responsibilities or functions ordinarily carried out by the
chairman where they may conflict with the responsibilities or
functions ordinarily carried out by the chief executive officer.
In this respect, the Board and interim chairman, as advised
by the company secretary, has operated conflict management
procedures with intensified and enhanced vigilance, and will
continue to do so until such time as an independent non-
executive chairman is appointed. These procedures were
deemed effective. Although throughout 2020 the Board’s
primary focus was on the effective operational management of
the Company throughout the continuation of the pandemic, it
nevertheless remains the Board’s intention to revert to a Board
structure where the roles of non-executive chairman and chief
executive officer are performed by separate individuals, as
soon as practically possible and in accordance with provision
9 of the Code. Through the conflict management procedures
outlined above, and the evaluations which are described
below, we have concluded that:-
• the Board’s collective skills, experience, knowledge of the
Company and independence allow it and its committees
to discharge their respective duties properly;
• subject to the recruitment of a non-executive chairman,
the Board and each of its committees is of the right size
and balance to function effectively;
• we have satisfactory plans for orderly succession to
Board roles;
• the interim chairman and respective Committee chairmen
are performing their roles effectively;
• all non-executive directors are independent in character
and judgement;
• no director has any relationships or circumstances which
could affect their exercising independent judgement; and
• the interim executive chairman and each of the non-
executive directors is devoting the amount of time
required to attend to the Company’s affairs and their
duties as a Board member.
Between January and April 2020, recruitment of two
additional non-executive directors and the chief executive
officer was ongoing. Following the appointment of Bill
Berman to the role of chief executive officer on 19 February
2020, and the subsequent appointments of Nikki Flanders and
Dietmar Exler as non-executive directors on 13 March 2020
and 20 April 2020 respectively, the Board consisted of seven
directors, consisting of three executive directors and four
non-executive directors, including Bill Berman in the role of
interim executive chairman. The Board considers Bill Berman
to be an executive director for the purposes of this disclosure,
and he will continue to perform the role of chairman on an
interim basis whilst the process of recruiting a permanent
non-executive chairman recommences.
The Board considers that Bill Berman has provided strategic
leadership whilst fulfilling the role of interim executive
chairman, and the Company considers that the Board has
been able to function effectively, notwithstanding ongoing
recruitment activity designed to redress the size and balance
of the same. During 2020, the Board received briefings from
Company executives to familiarise directors with strategic
developments and key aspects of the Group’s business.
BOARD EVALUATION
The Board and its committees conducted formal evaluations
of their effectiveness in 2020, facilitated by the company
secretary, addressing questions based closely on the Code,
applicable good governance topics and drawn from best
corporate practice. The results were reviewed by the
interim chairman, the Committee chairmen and the Board
as a whole and the interim chairman has factored suggested
improvements into our 2021 Board programme. More details
on the Board’s approach to individual and Board evaluation
are on the company’s website.
RE-ELECTION OF DIRECTORS
In accordance with the UK Corporate Governance Code,
all current directors will be subject to annual re-election or
election (in the case of new directors) at the AGM.
INFORMATION AND SUPPORT
To ensure our decisions are fully informed and debated, the
interim chairman ensures our Board’s business agenda is
set timely to allow appropriately detailed information to be
circulated to all directors before meetings. The company
secretary facilitates the flow of information within the Board,
attends all Board meetings and is responsible for advising the
Board and its Committees, through their respective chairmen,
on corporate governance and matters of procedure. All
directors have access to support from the company secretary
on matters of procedure, law and governance and in relation
to their own induction and professional development as Board

57Pendragon PLC Annual Report 2020
members. All directors are entitled to take independent
advice at the Company’s expense, and to have the Company
and other Board members provide the information required
to enable them to make informed judgements and discharge
their duties effectively.
COMMUNICATION
We aim to meet the challenges presented by our size and
geography through innovation in internal communications.
In particular, since the onset of the COVID-19 pandemic, we
have been early adopters of home working practices and
interactive video meeting technologies where practicable
to ensure the uninterrupted continuation of our businesses.
Internal website messaging and electronic newsletters,
together with social media content, are deployed to keep
our associates up-to-date with the Company’s strategy and
performance. At all levels, communications aim particularly
to recognise the achievements of individual associates and
celebrate outstanding personal and business performance,
through peer recognition. Each year we review our incentive
and recognition programmes aligned to the Group’s business
objectives.
DIVERSITY AND EQUALITY OF OPPORTUNITY
We are an equal opportunity employer, committed to ensuring
that our workplaces are free from unfair discrimination,
within the framework of the law. We aim to ensure that our
associates achieve their full potential and that, throughout
all our attraction, recruitment, selection, employment and
internal promotion processes, all employment decisions are
taken without reference to irrelevant or discriminatory criteria.
The Company’s diversity and equal opportunities policy is
available at www.pendragonplc.com
We continue to make appointments at Board and immediately
below Board level in accordance with a formal, rigorous and
transparent procedure. Appointments are based on merit and
objective criteria, and within this context, we aim to promote
diversity of gender, social and ethnic backgrounds, alongside
cognitive and personal strengths in accordance with Principle
J of the Code. In order to further this objective, we have
recently appointed Ruebik, an external recruitment agency
committed to reaching and providing access to diverse talent
pools to assist with these processes. Ruebik have recently led
the process to recruit a chief people officer at below Board
level, and we look forward to continuing to partner with them
to further diversify our talent pool for future appointments.
GENDER BALANCE
We describe our approach to Board composition diversity in
the Nomination Committee’s report on page 66.
GENDER PAY GAP REPORTING
The Company’s annual report containing data on our gender
pay gap will be published in full on our website www.
pendragonplc.com in accordance with the statutory timescale.
Current Directors Board Audit Nomination Remuneration
William Berman (B) 13/13 N/A N/A N/A
Martin Casha 12/13 N/A N/A N/A
Dietmar Exler 1 (I) 08/08 4/4 N/A 3/3
Nikki Flanders 2 (I) 09/09 4/4 N/A 3/3
Brian Small (I) (A) 13/13 5/5 1/1 4/4
Mark Willis 13/13 N/A N/A N/A
Mike Wright (I) (R) (N) 3 13/13 5/5 1/1 4/4
(B) Interim chairman of the Board(I) Considered by the Board to be independent(A) Committee chairman(N) Committee chairman(R) Committee chairman
1 Appointed as a non-executive director on 20 April 20202 Appointed as non-executive director on 13 March 20203 Acting Nomination Committee chairman since 08 November 2019Shows the number of meetings attended out of the total a director was eligible to attend
Number of Group Employees by category
as at 31 December 2020 as at 31 December 2019
Female Male Total Female Male Total
Director 1 6 7 0 5 5
Senior Manager 2 8 10 0 5 5
All Employees 1,393 4,143 5,536 2,084 5,841 7,925
BOARD ATTENDANCE

58 Pendragon PLC Annual Report 2020
CORPORATE SOCIAL RESPONSIBILITY REPORT
HEALTH AND SAFETY
We take seriously our responsibility to our associates,
customers and the public. We aim to ensure that all associates
in the course of their roles, and all who work in or visit our
facilities or receive our services, so far as is reasonably
practicable, experience an environment and practices which
are safe and without risk to their health. Our policy is to identify
and assess all potential risks and hazards presented by our
activities and to provide systems and procedures which allow
all associates in their daily work to take responsible decisions
in relation to their own and others’ health and safety. We
publish a clear hierarchy of responsibility to associates and
reinforce this through regular monitoring by a variety of
means. We promote awareness of potential risks and hazards
and the implementation of corresponding preventative or
remedial actions through our online health and safety systems,
operations manuals and regular communications on topical
issues. Our health and safety management system provides
our UK leadership and associates with detailed access to
information, guidance and control measures.
COVID-19 AND HEALTH AND SAFETY
The Group has taken, and continues to take, a number of
actions to ensure that all businesses and areas remain as fully
prepared as possible for the continued impact of the COVID-19
pandemic. The overarching principles guiding our approach
have been (1) ensuring the health, safety and wellbeing of
our associates and customers as a priority; (2) ensuring that
our businesses can continue to operate to the fullest extent
possible, within the law, and with all appropriate COVID-19
mitigating impacts in place.
In February 2020, the company secretary activated the
Group’s Crisis Management Team (CMT), constituting the
chief executive officer, chief finance officer, chief operating
officer and other members of senior operational leadership to
plan our response and actions to the pandemic. At the height
of the pandemic in March 2020, the CMT met on a daily basis,
and continues to meet as frequently as deemed necessary to
ensure the principles outlined above are met.
In addition, the company secretary regularly reviews
updates and changes to the relevant COVID regulations,
both in England and the devolved regions to ensure that we
continue to operate our businesses within the law, within HM
Government and devolved administration guidelines and in
accordance with COVID-safe systems of work. The company
secretary updates and advises the CMT, the executive
directors and operational leadership as to the prevailing legal
position(s) so we can act accordingly.
Specialists in our Group health and safety team have risk
assessed every dealership and workplace in accordance with
HM Government approved COVID-safe working practices;
dealerships and other working environments have submitted
evidence of COVID-19 safe working practices (including
but not limited to distancing floor markings and signage,
the presence of hand sanitisation stations, distancing of
desking environments, distancing in customer waiting areas,
sanitisation of touch points in vehicles, cleaning regimens)
before receiving a COVID-safe certification from the Group
health and safety team. COVID safe working audits are now
being re-performed by the Group health and safety team
and logged on our MySafeCenta health and safety system to
ensure practices are maintained. We have appointed social
distancing marshalls at each location to advise, re-enforce and
ensure social distancing and COVID-safe working practices
continue to be followed. COVID-19 safe working training
modules have been developed and rolled out in conjunction
with the Pendragon Learning Academy and our health and
safety team collect incident data, allowing a daily COVID-19
Incident Summary to be collated for the Group on a dealership
by dealership basis, ensuring leadership can react and plan
accordingly. Numerous COVID-19 Safe Schemes of Work
were rapidly deployed by the Group health and safety team
from as early as May 2020 in response to the pandemic.
ACCIDENTS AT WORK
Historically, we have assessed our health and safety record
against relevant published benchmarks. In 2019, as a
result of changes to the Health & Safety Executive sector
categorisations, we determined that the natural sector
comparator for our Group is Wholesale and Retail Trade
and Repair of Motor Vehicles and Motorcycles. There has
been a marked decrease in RIDDOR1 reported accidents
in 2020, falling to 18 per 10,000 employees (2019: 34 per
10,000 employees). This reduction could primarily be due to
disruption caused by COVID-19 to our businesses throughout
2020, driven by a reduced workforce, volume and throughput.
We continue to target specific hazards and risks for improved
results through additional monitoring and promotion of safe
working processes. The Company’s health and safety policy
is available at www.pendragonplc.com .
COMMUNITY
We are predominantly a retail operator, with a tangible
presence in the many communities our businesses serve.
During 2020, as a result primarily of the COVID-19 pandemic,
our usual monthly fundraising events supported a range of
national charities have been curtailed, other than continuing
support for the BBC’s Children in Need appeal. However,
during April, we donated 20% of chief executive Bill Berman’s
salary to the NHS to support first responders and frontline
workers at the height of the pandemic and during the first
national lockdown. We aim to return to more widespread
community involvement through local engagement, and by
1RIDDOR: the Reporting of Injuries, Diseases and Dangerous Occurrences Regulations 2013.
59Pendragon PLC Annual Report 2020
contributing to local areas as soon as it is considered safe to do
so, for example by our associates and businesses to organise
charity events to support schools, hospitals and local children’s
and medical charities as well as the Group wide monthly
nominated charity. The Company supports and encourages
these activities and we welcome the opportunities they present
for team-building within our businesses, engagement with the
communities they serve and recognition of charitable causes
with whom our associates and their families have connections.
RESPONSIBLE SOURCING
All our Group’s sites are situated within the UK or US and
at each of them we operate in strict compliance with all
applicable labour relations laws. We have no presence, either
directly or via sub-contractors, in any areas which present
any risk of the exploitation of men, women or children in the
workplace. We work with vehicle manufacturers and other
suppliers who manage their supply chains in a responsible
way, free from the exploitation of labour. We have adopted an
Anti-Slavery and Human Trafficking Policy, available to view
on our website, together with our Anti-Slavery and Human
Trafficking Statement for the year ended 31 December 2020.
CLIMATE CHANGE SUMMARY AND POLICY
Pendragon PLC acknowledges the responsibility it has to
protect the environment and to minimise the environmental
impacts of its activities. In partnership with its associates,
manufacturers, customers and suppliers the Company aims
to operate to high standards of environmental protection
appropriate to its business activities.
Although the retail sector is not generally regarded as a
high environmental impact sector, motor retailing and its
associated aftersales service activities carries with it a range of
responsibilities relating to protection of the environment. Our
policy is to promote and operate processes and procedures
which, so far as is reasonably practicable, avoid or minimise
the contamination of water, air or the ground; and to manage
responsibly the by-products of our activities, such as noise,
waste packaging and substances and vehicle movements.
We actively co-operate with our manufacturing partners in
relation to the move to green technologies, such as supporting
the introduction of infrastructure designed to promote
electric and battery powered vehicle technologies. The
Company’s full statement of Environment Policy is available
at www.pendragonplc.com/-/media/pendragonplc/pdfs/
investors/corporate-responsibilty/environment-policy.www.
pendragonplc.com
The Company will act in a reasonable manner in taking the
steps necessary to control the impact of its activities on the
environment. The principal environmental impacts identified
are:
• atmospheric emissions
• commercial and industrial waste
• vehicle movements causing nuisance or noise
• industrial noise and energy wastage
The Company supports the principle that in the area of
environmental protection, prevention is better than cure.
The Company adopts the principles of best practicable means
and duty of care to establish the standards for all its activities.
Adherence to those standards is mandatory.
1. The Company’s policy is to comply with, or exceed
the statutory requirements (whether local, national or
supra-national) applicable to it relating to environmental
matters.
2. The Company seeks to develop, enhance, and monitor
its operational standards, ensuring that environmental
priorities are accounted for appropriately in planning and
decision making.
3. Prior to implementation, the Company will make an
assessment of the environmental impact of any significant
new developments and cooperate with the relevant
authorities during the planning and development stages.
4. The Company will seek to:
• Ensure that all associates are aware of this statement
of Environment Policy and provide suitable and
sufficient information and instruction to help improve
their environmental awareness
• Delegate specific responsibilities to leaders and
associates where appropriate and carry out regular
reviews of performance
• Operate an Obsolete Asset Disposal Policy to minimise
impact of disposal of assets
• Minimise and where possible, eliminate all forms of
pollution
• Avoid waste and encourage the appropriate
conservation, re-use and recycling of resources
• Properly manage hazardous waste from generation
through to licensed disposal
• Work in partnership with contractors, suppliers and
other to comply with all regulatory requirements in
environmental-related practices
• Protect the health and wellbeing of all associates,
visitors and neighbours
• Safeguard the quality of the environment in the vicinity
of its sites
• Respond promptly and responsibly to instances of
non-compliance and improve performance year on
year
• Monitor, audit and review our energy use and
performance, reducing incidences of energy wastage
wherever possible. In this connection, the Company
participates in the Carbon Reduction Commitment
energy efficiency scheme operated by the Environment
Agency

60 Pendragon PLC Annual Report 2020
Global Greenhouse Gas Emissions Data
Source Tonnes of CO2 per £m
01.01.20 – 31.12.20 01.01.19 – 31.12.19
C02 emitted from facilities 6,128 9,630
C02 emitted from driving activities 4,402 7,934
Intensity ratio(tonnes of CO
2 per £m of revenue)
3.6 3.9
CORPORATE SOCIAL RESPONSIBILITY REPORT
2020 PROGRESS REDUCING CARBON AND WASTE
This section includes our mandatory reporting of greenhouse
gas emissions for the period 01 January 2020 to 31 December
2020, pursuant to the Companies (Directors’ Report) and
Limited Liability Partnerships (Energy and Carbon Report)
Regulations 2018 (SI 2018/1155).
Our methodology to calculate our greenhouse gas emissions
is based on the ‘Environmental Reporting Guidelines: including
mandatory greenhouse gas emissions reporting guidance’
(June 2013) issued by DEFRA using DEFRA’s 2020 conversion
factors. In some cases, we have extrapolated total emissions
by utilising available data from part of the reporting period
and extending it to apply to the full reporting period. We
report our emissions data using an operational control
approach to define our organisational boundary. We have
reported all material emission sources for which we deem
ourselves to be responsible, including both our UK businesses
and estimated usage for our US businesses. We also include
emissions from driving activity, comprising data verified
internally, including estimates of distances travelled during
test drives, transportation of vehicles and parts between sites,
and business travel (excluding commuting by means which
are not owned/controlled by us).
Also disclosed is the annual quantity of energy consumed. We
have reported all material energy sources for which we deem
ourselves to be responsible, including both our UK businesses
and estimated usage for our US businesses.
During the year, we have continued to assess and monitor our
energy use and, where practicable, to implement measures
designed to reduce our activities’ environmental impact,
which, over time, we anticipate will help reduce our carbon
footprint.
This year saw a decrease in the Group’s carbon footprint. An
improvement of 7.7% on 2019. Whilst this has been impacted
by COVID-19, the Group continues its efforts decarbonisation
across the year.
The Group has undertaken mandatory energy assessments
of our sites in accordance with the ESOS Regulations 2014.
We continue to use the results of this assessment to identify
further energy saving opportunities.
To conserve energy, we continue, where practicable, to install
LED lights at our sites, limit the duration of periods when full
lighting is used on our sites out of hours, keep external doors
closed when not in use, and fit insulators to limit the escape
of heat. Solar panel and solar energy systems are installed at
any new build developments. Our Group target is to, where
practical, have implemented all possible conservation methods
at all existing and new sites.
The continuation of the COVID-19 pandemic has enabled
us to develop our paperless operating systems, and we are
now trialling the concept of the ‘paperless dealership’ such to
further limit our paper consumption and waste. If our trials are
successful, we will seek to introduce our paperless operating
system across the wider Group.
Additional we have been installing electric car charging
stations at our dealerships to further enhance and grow the
electric car network. With the target of having charging
stations at every dealership.
Energy Usage
2020
UK Non-UK Total
kWh 25,864,153 658,959 26,523,112
Note: we are scope 1 only

61Pendragon PLC Annual Report 2020
AUDIT COMMITTEE REPORT
The Audit Committee is a committee of the Board and has been chaired by Brian Small since January 2020, made up entirely of independent non-executive directors. Their names and qualifications are on page 52 and attendance at meetings in the table on pages 57.
KEY RESPONSIBILITIES OF THE AUDIT COMMITTEE
• monitors the integrity of the financial statements and
formal announcements
• reviews and approves the Annual Report and Accounts
for adoption by the Board
• recommends to the Board the selection of the external
auditor and its terms of appointment and monitors its
effectiveness and independence
• governs policy for the allocation of non-audit work to the
audit firm
• reviews internal controls and risk management
• monitors the effectiveness of the internal audit function
• reviews and monitors whistleblowing arrangements
Its terms of reference detail its key responsibilities and appear,
with relevant background information, on the Company’s
website www.pendragonplc.com .
THE COMMITTEE’S WORK IN 2020
The Audit Committee met five times in 2020 and this report
describes its work and conclusions.
FINANCIAL STATEMENTS REVIEW
The Committee received the auditor’s memorandum on
the Company’s 2019 financial statements and the auditor’s
memorandum on the unaudited 2020 interim results. In each
case, it discussed the auditor’s findings with the auditor,
satisfied itself of the integrity of the financial statements
and recommended the financial statements for approval by
the Board. Key aspects of those discussions and relevant
considerations and conclusions are below:-
AUDIT RISK CONSIDERED BY THE COMMITTEE
The table on page 42 sets out the key audit risks and
judgements applied, for the 2020 year end results, which the
Committee considered and discussed with the auditor, and
the Committee’s conclusions.

62 Pendragon PLC Annual Report 2020
AUDIT COMMITTEE REPORT
Audit risk considered by the Committee
GOING CONCERN
The ongoing COVID-19 pandemic introduced the potential for
a level of material uncertainty to the going concern position,
requiring the Committee to carefully consider the Group’s
ability to continue as a going concern which included reviewing
cash flow forecasts for the eight months to 31 August 2020
and the forward looking forecast to 31 March 2022 considering
both pre and post lockdown trading, comparing assumptions
for revenue and margin to externally sourced data, assessed
assumptions for working capital and challenged management
to prepare assumptions for a severe, but plausible downside.
CGU ASSET VALUATION
The estimates in relation to asset impairment of the carrying
value of goodwill, intangible assets, property, plant and
equipment and right use of assets largely related to the
achievability of assumptions underlying the calculation of
the recoverable amount of the business being tested for
impairment, set out in note 3.1 to the financial statements.
Key assumptions used are the FY21 budget, growth rate and
discount rate as well as the EBITDA multiples applied or fair
value of individual assets.
DEFERRED TAX ASSET
The Group recognises deferred tax assets if they believe their
recovery can be justified.
VALUATION OF PARENT COMPANY INVESTMENT
This is the risk that the Company has investments in its
subsidiary companies, which could be overstated when
considered with current market capitalisation of the Company
and could impact the ability of the Company to pay dividends
should the investment be impaired. The value of investments
is underpinned by expectation of discounted future profits and
net assets of the subsidiary companies. There is an inherent
uncertainty in forecasting future profits.
Evidence considered and conclusion reached
The Committee reviewed both the forecasts presented by the
directors, and further scenarios which had been sensitised
to reflect severe but plausible downside scenarios. Those
forecasts indicate that the Group can continue to operate
within the existing facilities. The base and sensitised forecasts
which include a COVID-19 sensitivity indicate that the Group
will remain in compliance with the relevant covenants for the
period ending 31 December 2022 in the case of the sensitised
forecasts and considering mitigations available to the Group
such as deferral of capital expenditure. The Committee
concluded that it remained appropriate to prepare the
financial statements on a going concern basis. Further details
can be found within the viability statement at page 49 and
within the going concern statement on page 103.
The Committee considered the risk that goodwill could
be materially overstated in the context of the sensitivity
analysis, also set out in note 3.1. The Committee addressed
these matters through receiving reports from management
outlining the basis for the assumptions used, assessing the
range and depth of information underpinning the assumptions
and calculations and discussing this with the auditors.
The Committee concluded that the judgements applied were
appropriate.
The Committee has reviewed the forecasts presented by
management that indicated the capability of the Group to
generate future taxable profits to recover the deferred tax
asset of £36.4m.
The Committee reviewed management’s report on the
valuation assessment of the parent company investments.
To assess the valuation of parent company investments and
impairments to the value of subsidiary assets, analysis has been
performed in conjunction with the work done to establish CGU
asset impairment as described above. The Committee were
satisfied with management’s conclusion that the carrying
value of the parent company investment is supported and
therefore no further impairment is needed.
63Pendragon PLC Annual Report 2020
VEHICLE INVENTORY VALUATION
This is the risk that the value of inventory set out in note 3.4
to the financial statements could be materially overstated and
whether or not an appropriate provision had been calculated.
The risk for used vehicles is seen as the most relevant, for
scrutiny. Used vehicle prices can vary depending on a number
of factors, including general economic conditions and the
levels of new vehicle production.
PENSION SCHEME LIABILITIES
The amounts reflected in the financial statements in respect of
pension scheme liabilities involve judgements made in relation
to actuarial assumptions, long-term interest rates, inflation,
longevity and investment returns. The liabilities are set out in
note 5.1 to the financial statements. There is a risk that the
value of the pension scheme liabilities could be materially
under or over stated in the context of the sensitivity analysis
in that note. Following a court ruling in 2018 regarding
equalisation of GMP between men and women an additional
pension liability has been recorded.
RULES OF ORIGIN AND OTHER OUTCOMES ARISING FROM
THE UK’S TRADE DEAL WITH THE EUROPEAN UNION
Although the UK has now secured a trade deal with the
European Union, some future risk remains in the event of the
failure of the Group or its partners to meet EU Trade Deal rules
of origin on vehicle parts by 2024.
Failure of our business or our partners to meet the EU Trade
Deal rules of origin on vehicle parts by 2024 could result in
an increase in costs due to tariffs or disruption to our supply
chain due to a need for alternative sources of supply. Other
factors such as changes in regulation and the availability and
cost base of appropriate employee resource could impact on
the Company’s operations.
The Committee discussed with the auditors, together with
all audit findings, the factors relevant to the assessment of
used inventory valuation, including the level of inventory held
across the business, the ageing of the inventory, the stock turn
of the inventory and an analysis of market factors including the
parc of used vehicles, the used vehicle market sales rate and
historic movements in used vehicle prices with the auditors
together with all audit findings.
The Committee was satisfied that a comprehensive assessment
of inventory valuation had been undertaken and concluded
that the judgements applied were appropriate. Overall, the
level of used inventory risk remained the same as in the prior
year.
The Committee ascertained that judgements made on the
pension scheme were all based on advice from the Group’s
pension adviser. The final calculations in respect of the Group’s
defined benefit pension scheme liability were performed by
our pension scheme actuary. The Committee discussed with
the auditor the assumptions applied, in particular the findings
of the auditor’s own pension specialist.
The Committee concluded that the judgements applied were
appropriate.
The Committee received a report from the Risk Control Group,
which had carried out an initial assessment of potential risk
associated with the UK’s trade deal with the European Union
in January 2021, and has continued to monitor any potential
impacts since.
The Committee considered that the Group retained sufficient
financial liquidity and operational facility headroom to cover
any short-term financial stress scenarios resulting from the
impacts of the UK’s Trade Deal with the EU, and further
considered that the risk associated with rules of origin on
vehicle parts would not impact the Group for at least three
years.

64 Pendragon PLC Annual Report 2020
EXTERNAL AUDITOR APPOINTMENT
AND PERFORMANCE EVALUATION
The Committee considered Auditor effectiveness and
independence of the audit during the year.
The Committee arrived at its recommendation to the Board
on the Auditor’s appointment by:
• applying exclusively objective criteria;
• evaluating the ability of the audit firm to demonstrate its
independence;
• assessing the effectiveness of the audit firm in the
performance of its audit duties; and
• assessing the audit firm’s adherence to applicable
professional standards.
The Committee chairman oversaw the Company’s evaluation
of the auditor’s performance, using questionnaires covering all
aspects of the Company and auditor relationship and reviewed
the results with the Committee members and the Company’s
management. The Committee noted that the current auditor,
KPMG LLP had issued to the Company all requisite assurances
of its independence. The Committee reported its conclusions
to the Board, namely, that there are no existing or historical
relationships or other matters which adversely affect the
independence of KPMG LLP as the Company’s auditor, and
no performance shortcomings or unresolved issues relating to
fee levels.
The lead audit partner, John Leech, has held the position for
five years.
POLICY ON AUDIT TENDERING
KPMG LLP was appointed as auditor in September 1997, since
when, audit services have not been tendered competitively.
The Committee has concluded that a competitive tender of the
audit service is not necessary at this time, but acknowledged
that circumstances could arise where a competitive tender
for audit services is desirable. It recommended the re-
appointment of KPMG LLP as the company’s auditor. The
Board accepted the Committee’s recommendation and
concluded that:-
• there are no matters warranting a competitive tender
exercise in relation to the provision of audit services, but
this position would change if there were to arise at any
time any concerns as to the continuing independence or
performance of the current audit firm (no such concerns
have arisen as at the date of this report);
• none of the directors’ independence in considering this
matter is impaired in any way and none has a potential
or actual conflict of interest in relation to KPMG, whether
in regard to its appointment, fees, the evaluation of its
performance, any decision as to competitive tender for
audit services, or any other matter.
The Committee also took into account that under the current
EU legislation on audit firm rotation the current auditor could
not be reappointed after 2023.
REVIEW OF NON-AUDIT SERVICES
The Committee reviewed the Company’s policy on its use of its
audit firm for non-audit work. Its main principles are that the
auditor is excluded from providing certain non-audit services
the performance of which is considered incompatible with
its audit duties, but is eligible to tender for other non-audit
work on a competitive basis and can properly be awarded
such work if its fees and service represent value for money.
The policy can be viewed on the company’s website. The
Committee considered reports on the extent and nature of
non-audit work available, the allocation during the year of that
work to accountancy and audit firms, including KPMG LLP,
and the associated fees. Details of audit and non-audit work
performed by KPMG LLP and the related fees appear annually
in the notes to the company’s financial statements. A full
statement of the fees paid to KPMG LLP for work performed
during the year is set out in note 2.5 to the financial statements
on page 120. Having satisfied itself on each item for its review,
the Committee reported to the Board that:
• the Company’s existing policy continues to be
appropriate, has been adhered to throughout the year,
and is operating effectively to provide the necessary
safeguards to independence of the external auditor;
• there are no facts or circumstances relating to the
award or performance of non-audit work that affect the
independence of KPMG LLP as auditor or justify putting
out audit work to competitive tender at this time;
• no contract for non-audit services has been awarded to
KPMG LLP in any circumstance of perceived or potential
conflict of interest or non-compliance with the company’s
policy; and
• the fees KPMG LLP have earned from non-audit services
provided during the year are not, either by reason of
their amount or otherwise, such as might impair its
independence as auditor. The ratio of non-audit to audit
fees was 0.25:1 in 2020 (2019: 0.22:1).
The Board accepted these findings.
REVIEW OF INTERNAL AUDIT PERFORMANCE
The Committee chairman oversaw the Committee’s evaluation
of the internal auditor’s performance, using questionnaires
covering all aspects of the internal auditor work and
relationship to the audit and received the auditor’s view on
that performance. He reviewed the results with the Committee
members and Company management and reported the
Committee’s conclusions to the Board. The internal audit work
done reflects an effective, well-functioning team.
AUDIT COMMITTEE REPORT

65Pendragon PLC Annual Report 2020
REVIEW OF RISK MANAGEMENT
AND INTERNAL CONTROLS
The Committee reviewed the effectiveness of the company’s
system of internal control and financial risk management. It
received reports from the auditor on each of these areas and
from the RCG, whose work is described on page 40 on the
company’s risk register, emerging risks and corresponding
internal controls. It scrutinised the key risks register, as revised
by the RCG, and approved it for adoption by the Board. Its
work informed and supported the Board’s assessments
detailed under “How the Board manages risk” on page 55.
REVIEW OF ANTI-BRIBERY CONTROLS
AND WHISTLEBLOWING
The Committee reviewed the Company’s anti-bribery
processes and controls and evaluated and approved
these and the company’s bribery risk assessment. On its
recommendation, the Board readopted the company’s anti-
bribery policy statements and associated controls. The
Committee considered reports on known instances of alleged
wrongdoing and matters reported on the company’s third party
operated confidential reporting line and their investigation,
reviewed the adequacy of whistleblowing procedures and
commissioned follow-up action and improvements in risk-
related controls.
Our current anti-bribery value statements and our policies
on the control of fraud, theft and bribery risks appear on
the Company’s website and are drawn to the attention
of all parties seeking to transact with the Group. Our
whistleblowing procedures are published internally on our
intranet and their existence is regularly reinforced in our team
member communications. The policy is available at www.
pendragonplc.com
FINANCIAL REPORTING COUNCIL
During 2020, the Group received a letter from the Conduct
Committee of the Financial Reporting Council (FRC) relating
to a Corporate Reporting Review of the Group’s 2019 Annual
Report. The scope of this review is limited based on the
annual report and accounts and does not benefit from
detailed knowledge of the business or an understanding of
the underlying transactions entered into. It was, however,
conducted by staff of the FRC who have an understanding of the
relevant legal and accounting framework. The FRC requested
further information and clarification of the disclosures
regarding the process for assessing the recoverable amount
and any impairment of assets and the sensitivity to changes
in key assumptions; clarification of the sensitivity of the net
realisable value of inventories to changes in key assumptions
and the reconciliation of inventory movements to the related
cash flows; further information about arrangements, including
key contractual terms, for manufacturer and third party
financing of inventory; further information regarding the
composition of other receivables; as well as other more minor
items. As a result of the review, we have further enhanced the
information we disclose in relation to these items within the
2020 Annual Report to provide further clarity to the users of
the accounts.
APPROVAL
This report was approved by the Committee and signed on
it’s behalf by:-
Brian Small
Chairman of the Audit Committee
24 March 2021

66 Pendragon PLC Annual Report 2020
NOMINATION COMMITTEE REPORT
The Nomination Committee has been chaired by Mike Wright, on an interim basis, since October 2019, and is made up entirely of independent non-executive directors. Their names and qualifications are on page 52 and attendance at meetings in the table on page 57 above.
KEY RESPONSIBILITIES OF THE NOMINATION COMMITTEE
• reviews the Board’s size, structure and composition and
leads recruitment to Board positions
• undertakes annual Board performance evaluation
• satisfies itself on the Company’s refreshing of Board
membership and succession planning
Its terms of reference detail its key responsibilities and appear,
with relevant background information, on the Company’s
website www.pendragonplc.com .
THE COMMITTEE’S WORK IN 2020
The Nomination Committee met once in 2020. This report
describes its work and conclusions.
REVIEW OF BOARD COMPOSITION AND BALANCE
In January 2020, the Committee met for the purpose of
further discussing and finalising its recommendation to the
Board of Directors as to the appointment of Bill Berman to
the role of chief executive officer. The Committee further
reviewed the structure of the Board, in relation to its size,
composition and potential vacancies and concluded that
additional non-executive directors should be sought to join
the Board, provided that in doing so, a situation would not be
created which resulted in one party or group dominating any
decision-making processes.
In March 2020, the Company announced that Nikki Flanders
would join the Board as an additional non-executive director,
and in April 2020, the Company further announced that
Dietmar Exler would join the Board as an additional non-
executive director. The appointments of Nikki Flanders and
Dietmar Exler increased the complement of non-executive
directors on the Board to four.
Throughout early 2020, and before the onset of the COVID-19
pandemic in March 2020, the Committee remained mindful of
the need to appoint an independent non-executive chairman,
in accordance with the Principles F, G and provision 9 of the UK
Corporate Governance Code. Whilst the onset of the COVID-19
pandemic delayed the Committee’s activity in this regard
for the majority of 2020, both the Company and Committee
remain committed to the principle of the segregation of duties
of the chief executive officer and non-executive chairman.
As such, in February 2021, and with this principle primarily
in mind, the Committee met to reconsider the size, structure
and composition of the Board and, in particular, recommence
the process of recruiting a new non-executive chairman, in
conjunction with an executive search agency. In addition, the
Committee recommended that Dietmar Exler be appointed to
the role of senior independent director (SID) with effect from
24 February 2021.
EVALUATION
The annual evaluations of the Board and its members were
conducted by the Board and are described on page 56. As
part of that process, the Committee conducted an evaluation
of its own performance.
DIVERSITY
All appointments made, including those of Board members,
adhere to the company’s diversity and equal opportunities
policy, which can be viewed on the Company’s website.
For non-executive director appointments, where executive
search consultants are instructed, they are done so in a
manner consistent with this policy. The Company engaged
an executive search agency for the purposes of recruitment
activities to fill Board vacancies in 2020, having considered
it appropriate to do so. The Company has not adopted a
gender balance target for its Board, although continues to
make appointments at Board and immediately below Board
level in accordance with a formal, rigorous and transparent
procedure. Appointments are based on merit and objective
criteria, and within this context, we aim to promote diversity
of gender, social and ethic backgrounds, alongside cognitive
and personal strengths in accordance with Principle J of
the Code. In order to further this objective, we continue to
partner with external recruitment agencies and have recently
appointed Ruebik, an external recruitment agency committed
to reaching and providing access to diverse talent pools to
assist with these processes. Ruebik have recently led the
process to recruit a chief people officer at below Board level,
and we look forward to continue to partner with them to
further diversify our talent pool for future appointments.

67Pendragon PLC Annual Report 2020
The Remuneration Committee is a committee of the Board, and has been chaired by Mike Wright since March 2018. It is made up entirely of independent non-executive directors. Their names and qualifications are on page 52 and attendance at meetings in the table on page 57.
KEY RESPONSIBILITIES OF THE
REMUNERATION COMMITTEE
• has delegated responsibility for determining the
policy for executive director remuneration and setting
remuneration for the chairman, executive directors, the
company secretary and the immediately below board
level of senior management;
• reviews workforce remuneration and related policies and
the alignment of incentives and rewards with culture,
taking these into account when setting executive director
remuneration;
• ensures that executive directors are provided with
appropriate incentives which align their interests
with those of shareholders, and encourage enhanced
performance in the short and medium term, as well as
achievement of the Company’s longer term strategic
goals;
• determines targets for any performance related pay
schemes;
• seeks shareholder approval for triannual renewal of
remuneration policy and any long-term incentive
arrangements
The terms of reference of the Remuneration Committee are
available at www.pendragonplc.com.
THE COMMITTEE’S WORK IN 2020
The Remuneration Committee met four times in 2020. The
Directors’ Remuneration Report, beginning at page 68,
describes its work and conclusions.
REMUNERATION COMMITTEE REPORT

68 Pendragon PLC Annual Report 201868 Pendragon PLC Annual Report 2019
REMUNERATION COMMITTEE CHAIRMAN’S LETTER TO SHAREHOLDERS
Dear Shareholder
As chairman of Pendragon’s Remuneration Committee, I am pleased to present the Directors’ Remuneration Report for the financial year ended 31 December 2020. In this introductory statement, I describe the context of Pendragon’s remuneration arrangements, and the key matters considered by the Committee during the year. I also provide an update on how the Committee is responding to the ongoing COVID-19 pandemic.
Adoption of the new Remuneration Policy in 2020I am pleased to report that all aspects of the Remuneration Policy approved at the May 2020 AGM have been deployed in full. It is a clear and transparent policy with the objectives of:• attracting, retaining and motivating our executive and senior leadership team to successfully implement the Board’s strategy
as well as delivering a significant improvement in financial performance;• take account of the expectations of our major shareholders;• take into account the disruptive challenges faced by both the automotive sector, as well as the external economic factors
over the next few years, including the potential impacts of climate change and Brexit.
The policy now includes several best practice elements to ensure it is fully aligned from a corporate governance perspective, in particular:• Improved malus and clawback provisions including the addition of reputational risk and corporate failure to the triggers; • Introduction of a post-cessation shareholding requirement equal to the in-employment shareholding requirement for 2-years
after cessation of employment; • Changes to the pension policy that bring current executive director pensions in line with the average employee rate over
time and ensures that new executive directors are appointed with a pension contribution which is not above the level available to the wider workforce;
• A single remuneration framework for both executive directors and the senior management team.
Coronavirus Pandemic (COVID-19)Since March 2020, Pendragon has responded decisively to the impacts of the COVID-19 pandemic. After an encouraging first two months of trading, the UK Government issued its first national lockdown order in March 2020 and all Pendragon’s retail locations were closed and would remain so until 01 June 2020. During this period of unprecedented business disruption, the Group took action to ensure the safety and wellbeing of its associates, protect its cash position and accelerate the development of its digital sales capabilities. This included an immediate decision for all directors and senior management to voluntarily agree to a temporary reduction in their basic salaries by 20% for April and May 2020. The chief executive officer donated his voluntarily pay reduction to an NHS charity.
As the business reopened, the Group refocused on its pre pandemic priority of improved financial performance and announced a significant update to its corporate strategy in September 2020, both of which further strengthened Pendragon’s position. During the second half of the year, the Group delivered a strong performance despite the continued market interruption caused by the pandemic.
The Remuneration Committee was, and is extremely conscious of the impact the pandemic has had on our employees, customers, suppliers and other stakeholders. This will, of course, continue to be a key consideration for any decisions the Committee makes during 2021 and it will continue to closely monitor the ongoing impact of the pandemic on the business and its implications for the Remuneration Policy.
Implementation of the Approved Policy in 2020In order to meet our objective of attracting, retaining and motivating our executive team, and secondly as a result of challenges posed by the ongoing coronavirus pandemic, in 2020 the Committee took a number of exceptional steps: • Annual Salary Review. No increases would be applied in 2020. Furthermore, all directors and senior management voluntarily
agreed to a temporary reduction in their basic salaries by 20% for April and May 2020. The chief executive officer donated his voluntarily pay reduction to an NHS charity;
• Annual Bonus. Given that the Company ceased issuing financial guidance to the market at the onset of the pandemic, it was considered appropriate to halve the maximum bonus potential from 150% to 75% of base salary for the executive directors. Annual bonus targets were based on performance in the second half of the year only, with any proposed payment being in deferred shares;
• In late June and early July 2020, the Committee approved a bonus structure for 2020 to be applicable to the executive and immediately below Board senior management for the period 01 July 2020 to 31 December 2020. It was considered appropriate that the underlying profit/loss outcome for the period 01 July 2020 to 31 December 2020, derived from the H2 2020 Corporate Plan, be the sole performance metric to be applied, to ensure the focus was on a significant improvement throughout H2 in the Group’s short term financial performance and stability;
DIRECTORS’ REMUNERATION REPORT

69Pendragon PLC Annual Report 2020
• Long Term Incentive Plan (LTIP). Given the extreme levels of market volatility brought about by the COVID-19 pandemic, the continued uncertain climate in the automobile sector and the macroeconomic challenges in the UK, the Committee determined to defer its decision making on an LTIP award from May 2020 until a later date. Once more clarity emerged towards the end of Q3, the Committee determined to set a performance period which runs to the end of 2021 (but still with an overall 3-year vesting period). it remains the intention of the Committee to return to LTIPs with a 3-year performance period and 2-year holding period for future awards.
2020 Annual Bonus OutturnIn H1 2020 the Group incurred underlying losses of £31.0m, despite being able to utilise Government CJRS support, rates relief and VAT deferral to minimise the impact of the pandemic, for which the Group is extremely grateful. This helped to mitigate against potentially serious adverse short term consequences for the business.
In its review of 2020 performance the Committee took into consideration that the Company not only exceeded its H2 2020 Corporate Plan, delivering an underlying profit of £39.2m for H2, but it also outperformed the market on a number of financial and market volume metrics. It therefore concluded it was appropriate to award bonuses at the lower revised 2020 level to the executive directors and senior management at the lower revised maximum level. The bonus would also be deferred into shares to be held for a 1-year period as opposed to cash.
2020 LTIP AwardFrom March to October 2020 the Committee continually monitored the share price to ensure that there were no potential LTIP windfall gains as a result of the pandemic.
In October 2020, the Committee concluded that awards be granted in the form of nil cost share options pursuant to the Company’s LTIP with the following considerations and conditions:• The share price at the time of the grants was higher than the share price immediately before the pandemic impacted the
price and therefore no adjustment was required; • Vesting of the Awards under the LTIP is subject to the satisfaction of certain performance conditions, 50% of which is based
on achieving a defined earnings per share target over a 14-month performance period, commencing on the grant date and measured at year end 2021, with the remaining 50% based on the achievement of certain qualitative strategic performance metrics aligned to the Company’s strategic milestones to be delivered in 2021;
• If the performance conditions are not satisfied, none of the LTIP award shares will vest;• The target EPS for 2021 used was the analyst’s consensus EPS of 1.58p, available at the time of publication of the Company’s
Group Strategy Presentation; • The non-financial strategic milestones are those as set out in the Company’s Group Strategy Investor Presentation
published on 2 September 2020 (available at www.pendragonplc.com) and reflect those strategic milestones the Company considers able to achieve in 2021. Delivery against the 2021 strategic milestone performance conditions will be assessed by the Remuneration Committee at year end; the specific metrics of the strategic milestone targets are considered to be commercially sensitive and are therefore not published in this report. More detail on the metrics and achievement against them will be disclosed, once the level of vesting has been determined;
• As previously communicated, the chief executive officer and chief finance officer received one off enhanced awards in 2020 as upon joining the Company in 2019 there was not a relevant structure in place at their respective joining dates so they did not have the opportunity to take part in a long-term incentive arrangement. It is intended that subsequent awards under this policy for both individuals will be made at the normal maximum level.
Pay Across PendragonThe Remuneration Committee continues to consider wider associate reward when determining pay arrangements for the executive directors, and this will remain a fundamental part of our approach to pay, ensuring alignment of both our annual bonus and LTIP arrangements across the Group where appropriate.
AGMAt last year’s AGM, 58.70% of shareholders voted in favour of the Directors’ Remuneration Policy, and 78.84% voted in favour of the Directors’ annual Remuneration Report. We wish to thank all our shareholders who supported the changes that we believed were necessary to our Remuneration Policy to ensure that our executive and leadership team continue to be motivated in the difficult and challenging times for the automotive sector. We are also convinced that this policy was a key driver in determining the success of the Company’s response to the COVID-19 pandemic in 2020.
We hope that the disclosure provided in this report provides clear insight into the Committee’s decisions and we look forward to receiving your continued support at the AGM.
Yours sincerelyMike WrightChairman of the Remuneration Committee

70 Pendragon PLC Annual Report 2020
REMUNERATION POLICY FOR EXECUTIVE DIRECTORS
BASE SALARY
PURPOSE AND LINK TO STRATEGY
Provide competitive remuneration that will attract and
retain executives of the calibre required to take forward the
company’s strategy.
OPERATION
Base salaries are reviewed annually, effective from 1 January.
The Committee sets base salaries taking into account:
• the performance and experience of the individual
concerned;
• any change in responsibilities;
• appropriate executive remuneration benchmarking,
reflecting the size and sector of the Company
Base salaries are paid monthly in arrears.
MAXIMUM OPPORTUNITY
Salary levels are eligible for increases during the 3-year period
that the Remuneration Policy operates. During this time,
salaries may be increased each year.
Salary increases are usually determined after taking due
account of market conditions and typically, any increases
awarded will be in line with the increase of that of the wider
workforce.
Significant changes in role scope may require further
adjustments to bring salaries into line with new responsibilities.
For recent joiners or promotions whose pay was initially
set below market rate, higher than usual increases may be
awarded to bring them into line with the market over a phased
period as they develop in their role.
PERFORMANCE METRICS
Both individual and Company performance is taken into
account when determining whether any salary increases are
appropriate.
REMUNERATION DISCLOSURE
This report complies with the requirements of The Large and
Medium-sized Companies and Groups (Accounts and Reports)
Regulations 2008, The Large and Medium-sized Companies
and Groups (Accounts and Reports) (Amendment) Regulations
2013, The Companies (Miscellaneous Reporting) Regulations
2018 and The Companies (Directors’ Remuneration Policy
and Directors’ Remuneration Report) Regulations 2019 (the
Regulations) and has been prepared in accordance with the
UK Corporate Governance Code and the UKLA Listing Rules.
The parts of the report which have been audited in accordance
with the Regulations have been identified.
REMUNERATION POLICY
The Remuneration Policy summarised in this section of the
remuneration report was approved by shareholders at the AGM
held on 21 May 2020. The policy detailed applies for 3-years,
and is effective for all payments made to directors from the
date of 2020 AGM. Where a material change to this policy
is considered, the Company will consult major shareholders
prior to submitting to all shareholders for approval. The full
remuneration policy is displayed on the company’s website
(www.pendragonplc.com), and is also available to view in the
2019 Annual Report.
DIRECTORS’ REMUNERATION REPORT

71Pendragon PLC Annual Report 2020
BENEFITS
PURPOSE AND LINK TO STRATEGY
Cost-effective, market competitive benefits are provided to
assist executive directors in the performance of their roles.
OPERATION
Life assurance, private health cover, professional subscriptions,
home telephone costs and (at executive’s option) company
cars.
Relocation benefits may also be provided in certain
circumstances if considered appropriate by the Remuneration
Committee.
PENSION
ELEMENT AND PURPOSE
Provide cost-effective long-term retirement benefits that will
form part of a remuneration package that will attract and
retain executives who are able to take forward the Company’s
strategy.
OPERATION
Post-2009 executives: participation in a defined contribution
pension scheme.
Pre-2009 executives: deferred membership of defined benefit
pension scheme.
MAXIMUM OPPORTUNITY
Benefit levels are set to be competitive relative to companies
of a comparable size. The cost of some of these benefits is
not pre-determined and may vary from year to year based on
the overall cost to the Company of securing these benefits for
a population of employees (particularly health insurance and
death in service cover).
PERFORMANCE METRICS
Not applicable.
MAXIMUM OPPORTUNITY
The maximum opportunity for newly appointed executive
directors will be in line with pension contributions prevailing
in the wider workforce, and this is the case for the CEO and
the CFO were they to elect to take a pension contribution.
The COO currently receives a pension contribution of 20%
of salary which is the maximum under the policy. However,
following previous reductions on 1 June 2020 and 1 January
2021, the following further reductions are planned over the
next 3-years:
Current 20% of salary
1 January 2022 - 15% of salary;
1 January 2023 - in line with wider workforce which will
become 5% of salary
Further adjustments may be considered in subsequent years
to maintain alignment with the wider workforce.
PERFORMANCE METRICS
No performance metrics apply.

72 Pendragon PLC Annual Report 2020
ANNUAL BONUS
PURPOSE AND LINK TO STRATEGY
Incentivises achievement of annual objectives which support
the short-term goals of the Company, as reflected in the
annual business plan.
OPERATION
Annual bonuses are earned over the year and are paid annually
in arrears after the end of the financial year to which they
relate, based on performance against targets over the year.
A minimum of 25% of after tax bonus earned is subject to
compulsory deferral into the Company’s shares until such time
as the Company’s share ownership guidelines are met. In such
situations where bonus is deferred into shares, an executive
director may be entitled to receive dividend payments on
such shares.
LONG TERM INCENTIVE PLAN
PURPOSE AND LINK TO STRATEGY
Promotes retention and incentivisation over the longer term.
Aligns executive directors’ interests with the Company’s share
price and its shareholders.
OPERATION
The core design of the LTIP is that awards are subject to
performance conditions measured over three years and a
service requirement for a further two years. The Committee
may refine the choice of performance metrics each year in line
with developments in the Company’s strategy. In the event of
a significant or material change of approach, the Committee
will engage in dialogue with shareholders.
The Committee retains the option to apply a 2-year post-
vesting holding period during which shares may not be sold.
The Committee also retains a discretion to make awards with
a 1-year performance period and overall 3-year vesting period
in very exceptional circumstances.
MAXIMUM OPPORTUNITY
Maximum available bonus is equivalent to 150% of base salary,
which is available only for material outperformance of the
company’s annual business plan.
PERFORMANCE METRICS
Annual bonus is earned based on performance against
stretching Company financial performance measures as set
and assessed by the Committee.
25% will be payable for threshold performance under each
measure with 50% payable for target performance and 100%
for maximum performance. The specific measures, targets and
weightings may vary from year to year in order to align with
the company’s strategy and the measures will be dependent
on the company’s goals over the year under review. Malus
and clawback provisions continue to satisfy latest Financial
Reporting Council guidance and are reviewed in line with any
changes or enhancements to the same.
MAXIMUM OPPORTUNITY
Maximum opportunity will be 150% of base salary. In very
exceptional circumstances, the Committee may award up to
250% of salary. The Committee currently has no plans to make
such an exceptional award. Prior to making any exceptional
award, the Company will consult with its major shareholders.
PERFORMANCE METRICS
Stretching performance conditions will be set by the
Committee each year. At least 50% of each award will be
based on financial metrics, such as underlying EPS. 25% of
the award will vest for threshold performance with 100% of
awards being achieved for maximum performance. There is a
straight line vesting between performance points.
DIRECTORS’ REMUNERATION REPORT

73Pendragon PLC Annual Report 2020
ALL EMPLOYEE SHARE SCHEME (SHARESAVE)
PURPOSE AND LINK TO STRATEGY
Sharesave is an all employee share ownership plan which
has been designed to encourage all employees to become
shareholders in the Company and thereby align their interests
with shareholders.
OPERATION
Executive directors are eligible to participate in Sharesave.
The executive directors are entitled to participate in any other
all employee arrangements implemented by the Company.
POLICY ON EXECUTIVE DIRECTOR SHARE OWNERSHIP
The Company continues to recognise the importance of
executives building significant holdings of the company’s
shares to align the long-term interests of management and
shareholders in the success of the Company.
The minimum shareholding requirement for the CEO is
200% of salary (100% for all other executive directors), to
be built up within five years of appointment to the Board. In
circumstances where the Company is operating under an LTIP
structure with an overall three year vesting requirement, this
requirement will be reduced to three years.
MAXIMUM OPPORTUNITY
The maximum levels of participation set by legislation from
time to time.
PERFORMANCE METRICS
No performance conditions.
Until such time as the policy is met, executive directors will
be required to hold any vested deferred bonus shares and
LTIP awards that vest (after sale of shares to cover associated
personal tax liabilities).
Post-cessation shareholding requirement of 100% of the in-
employment requirement for two years following cessation of
employment. This provision supports sustained share price
performance and encourages strong succession processes.

74 Pendragon PLC Annual Report 2020
DIRECTORS’ REMUNERATION REPORT
POLICY ON NON-EXECUTIVE DIRECTORS’ REMUNERATION
The Company’s policy on non-executive directors’
remuneration is reviewed annually by the Board. Remuneration
for non-executive directors is confined to fees alone, without
a performance related element. Non-executive directors may
elect to receive all or part of their fees in the form of benefits
in kind, typically the provision of a motor vehicle for their
use. The Company considers that the remuneration of the
non-executive directors remains consistent with the time
commitments associated with individual positions and wider
market practice among companies of a comparable size.
Non-executive director fees were reviewed and realigned to
market in late 2019/early 2020.
Fee Type Fee Level Change in 2020
Chairman fee £150,000 None
Basic fee: £50,000 £10,000
Supplementary fees:
Senior Independent Director £4,000 None
Audit Committee Chairman £10,000 None
Remuneration Committee Chairman £5,000 None
Nomination Committee Chairman Nil None
Notes accompanying the future Remuneration Policy table:1. Malus and clawback – malus and clawback may operate in respect of the annual bonus and long term incentive plan. This approach applies to all executive directors and senior
management immediately below Board level. Malus will typically be an adjustment to the cash award or number of shares before an award has been made or released. Clawback requires the executive to make a cash repayment to the Company or the surrender of shares or other benefits provided by the Company. The overall intention is that, in exceptional circumstances, malus will apply before awards are paid or vest. Clawback will apply under the annual bonus scheme, for up to three years from when the cash payment is made, and malus will apply to any deferred shares (awarded at the same time as the cash payment) for the 3-year period of the deferral. Under the LTIP, clawback will continue to apply for up to two years following the 3-year vesting period.
As a minimum, the events in which malus and clawback may apply are as follows:• Material misstatement of financial statements.• Gross misconduct/fraud of the participant.• Where there has been an error in the calculation of performance outcomes, the value of awards, or the number of shares under an award.• Participant has caused reputational damage to the Company.• Participant has wholly or in part caused the corporate failure of the Company.
Malus and clawback provisions are kept under review, in the light of prevailing Financial Reporting Council guidance.
2. Salary – base salaries are set by reference to the criteria specified in the table above. If a salary is initially set below the market rate, a phased realignment may be made over time.3. Annual bonus – a target of underlying (adjusted) profit was selected as this measure directly correlates to Company’s overall business plan. The specific measures, targets and
weightings may vary from year to year in order to align with the Company’s strategy and the measures will be dependent on the Company’s goals over the year under review. Performance measures are determined by the Remuneration Committee who seek external guidance on the appropriateness of any performance targets set relative to the market.
4. Long term incentive plans – LTIP: under the Company’s current long term incentive plan, performance shares are awarded up to a maximum of 150% of salary if significantly chal-lenging performance targets are attained. The Remuneration Committee has currently selected two performance metrics for the LTIP, each with an equal weighting (i) EPS: this remains the key internal measure of long term financial performance, as well as being well understood by the executives and our investors as providing a clear incentive to deliver the Company’s long term growth prospects; and (ii) qualitative strategic performance metrics aligned to the Company’s strategic milestones. The vesting schedule outlines the vesting percentages in relation to both the EPS performance targets, which were set after taking into account internal scenario analysis, current market expectations and the current trading environment, and delivery against the strategic milestones as detailed in the Group’s published strategic plan.
5. Pensions – The chief operating officer ceased to be an active member of the Pension Plan in 2006. In accordance with the Code, the Company is seeking to align his pension with that of the wider workforce and is proposing to effect a phased reduction in the salary supplement in lieu of pension contribution received by the chief operating officer such that, by 1 January 2023, his salary supplement in lieu of pension contribution will be aligned to the employer pension contribution available to the majority of employees.
6. Benefits: benefit levels are set to be competitive relative to companies of a comparable size.7. Annual Bonus and LTIP Policy - Remuneration Committee Discretions: The Committee will operate the annual bonus plan and LTIP in accordance with their respective rules and
in accordance with the Listing Rules, where relevant. Consistent with market practice, the Committee retains discretion in a number of respects with regard to the operation and administration of these plans. These include the following (albeit with quantum and performance targets restricted to the descriptions detailed in the future policy table above):-
• who participates in the plans;• the timing of grant of award and/or payment;• the size of an award and/or payment;• the determination of vesting and/or meeting targets with the ability to override the formulaic outcome in light of overall business proposals• discretion required when dealing with a change of control (e.g. the timing of testing performance targets) or restructuring of the Group;• determination of good/bad leaver cases for incentive plan purposes based on the rules of each plan and the appropriate treatment chosen;• adjustments required in certain circumstances (e.g. rights issues, corporate restructuring events, share buybacks and special dividends); and• the annual review of performance measures and weighting, and targets for the annual bonus plan and LTIP from year to year or on award.
The Committee also retains the ability to adjust the targets and/or set different measures and alter weightings for the annual bonus plan and to adjust targets for the LTIP if events occur (such as a material divestment of Group business) which cause it to determine that the conditions are no longer appropriate and the amendment is required so that the condi-tions achieve their original purpose and are not materially less difficult to satisfy.
The Company retains the authority to honour any commitments entered into with current of former directors that have been disclosed to shareholders in previous remuneration reports (e.g. all historic awards that were granted under any LTIPs that remain outstanding, as detailed in the company’s latest Annual Report), and which remain eligible to vest based on their original award terms. Details of any payments to former directors will be set out in the Annual Report on remuneration as they arise. With regard to any promotions to executive director positions, the Company will retain the ability to honour payments agreed prior to executives joining the Board, albeit any payments agreed in consideration of being promoted to the Board will be consistent with the policy on new appointments as an executive director detailed in the Remuneration Policy at www.pendragonplc.com

75Pendragon PLC Annual Report 2020
Element Description Minimum On Target Maximum
FixedFixed (comprises base
salary, benefits, pension)Included Included Included
Annual Bonus Annual bonus 16.66% 50% of the maximum bonus1 100% of the maximum bonus1
Long Term Incentive Plan 16.66% 50% of maximum LTIP2 100% of the maximum LTIP2
1The maximum bonus available for executive directors is equivalent to 150% of base salary. 2Awards made under the long term incentive plan (LTIP) will be on an annual basis with a one year measurement period. The maximum LTIP award available for executive directors is equivalent to the award of nil-cost options at 150% of base salary. 3Impact of share price growth on equity based incentives – In accordance with The Companies (Miscellaneous Reporting) Regulations 2018, indications of maximum remuneration available do not allow for any share price growth.
ILLUSTRATION OF OUR REMUNERATION POLICY FOR 2021
The table below illustrates the operation of the Remuneration Policy and provide estimates of the potential future remuneration
that executive directors would receive, in the scenarios shown, in accordance with the directors’ Remuneration Policy for
Potential outcomes based on different performance scenarios are provided for each executive director. A significant percentage
of remuneration is linked to performance, particularly at maximum levels.
The chart below illustrates the remuneration that could be paid to each of the executive directors, based on salaries at the start
of the financial year 2020.
2.5m
2.0m
1.5m
1.0m
0.5m
0Minimum On Target Maximum
0.550m
1.374m
2.200m
(£m)
CHIEF EXECUTIVE OFFICER
Minimum On Target Maximum
0.376m
0.940m
1.504m
CHIEF OPERATING OFFICER
Minimum On Target Maximum
0.309m
0.773m
1.237m
CHIEF FINANCE OFFICER
Fixed Elements Annual Bonus LTIP
+ + =FixedAnnual Bonus
LTIP Total

76 Pendragon PLC Annual Report 2020
Name Commencement Expiry/cessation Unexpired at date of report (months)
Mike Wright 02.05.18 31.12.21 9
Brian Small 10.12.19 31.12.22 21
Nikki Flanders 13.03.20 31.12.23 33
Dietmar Exler 20.04.20 31.12.23 33
DIRECTORS’ REMUNERATION REPORT
NON-EXECUTIVE DIRECTORS’ APPOINTMENTS
New appointments as executive director including each component of remuneration
All these policy areas were approved by shareholders at the 2020 AGM.
New appointments as non-executive director
Non-executive remuneration
How employee pay is taken into account in executive remuneration
Directors’ service contracts and exit payments
Treatment of fees earned from external directorships
OTHER AREAS OF REMUNERATION POLICY
We list below the areas of policy the Company has adopted in the shareholder approved Remuneration Policy
(available to view on the company’s website, www.pendragonplc.com).
THE COMMITTEE’S WORK IN 2020
• determined annual bonus awards in respect of 2020
performance
• set and revised the annual bonus plan terms for 2020
• determined performance targets and granted LTIP
awards in October 2020
• set 2020 executive director salary levels
• noted remuneration trends across the Group
• reviewed Remuneration Policy and obtained shareholder
approval for new 3-year Remuneration Policy
ADVISERS
During 2020, the Committee received external advice
from PwC, who received fees of £108,060 in respect of the
same. The company secretary also acts as secretary to the
Committee and provided additional advice.
Base Salary£000
Taxablebenefits1
£000Pension2
£000Bonus3
£000
Single total4 figure£000
Total Fixed Remuneration
TotalVariable
Remuneration
2020 2019 2020 2019 2020 2019 2020 2019 2020 2019 2020 2020
Current Directors
William Berman 510 248 - - - - 413 - 923 248 510 413
Martin Casha 287 292 9 9 72 76 227 - 595 377 368 227
Mark Willis 292 223 10 2 - - 225 - 527 225 302 225
1. Benefits in kind include life assurance, private health cover, professional subscriptions, contribution to home telephone costs and the provision of up to two cars (at the Director’s election), one of which is fully expensed.2. In 2006, Martin Casha ceased to be an active member of the Pendragon defined benefit pension plan. Martin Casha elected to take early retirement benefits from 01.07.16 and is therefore also a pensioner member. In accordance with Investment Association (IA) guidelines, a phased reduction in the salary supplement in lieu of pension contribution received by Martin Casha has commenced, such that, by 1 January 2023, his salary supplement in lieu of pension contribution will be aligned to the employer pension contribution received by the majority of employees. 3. Bonus Award in 2020 equivalent to 75% of base salary; the award was deferred into Pendragon PLC ordinary shares of 5p each, with a deferral period of 1 year: the figure in the table is the cash equivalent level. No bonus payments have been made in cash to directors for 2020. 2019 total equivalent to 0% of base salary.4. The performance period for the Value Creation Plan (“VCP”) awarded in 2017 was 01.01.17 to 31.12.20: the VCP failed to achieve its performance conditions and the awards lapsed in their entirety at the measurement date of 31 December 2020. There were no awards due to vest under the LTIP in 2020.5. For comparative information, William Berman joined Pendragon on 18 April 2019. Mark Willis joined Pendragon on 8 April 2019
SINGLE TOTAL FIGURE OF REMUNERATION FOR EXECUTIVE DIRECTORS AND THE INTERIM EXECUTIVE CHAIRMAN 2020
(AUDITED INFORMATION)

77Pendragon PLC Annual Report 2020
Base Salary£000
Taxablebenefits1
£000Pension2
£000Bonus3
£000
Single total4 figure£000
Total Fixed Remuneration
TotalVariable
Remuneration
2020 2019 2020 2019 2020 2019 2020 2019 2020 2019 2020 2020
Current Directors
William Berman 510 248 - - - - 413 - 923 248 510 413
Martin Casha 287 292 9 9 72 76 227 - 595 377 368 227
Mark Willis 292 223 10 2 - - 225 - 527 225 302 225
1. Benefits in kind include life assurance, private health cover, professional subscriptions, contribution to home telephone costs and the provision of up to two cars (at the Director’s election), one of which is fully expensed.2. In 2006, Martin Casha ceased to be an active member of the Pendragon defined benefit pension plan. Martin Casha elected to take early retirement benefits from 01.07.16 and is therefore also a pensioner member. In accordance with Investment Association (IA) guidelines, a phased reduction in the salary supplement in lieu of pension contribution received by Martin Casha has commenced, such that, by 1 January 2023, his salary supplement in lieu of pension contribution will be aligned to the employer pension contribution received by the majority of employees. 3. Bonus Award in 2020 equivalent to 75% of base salary; the award was deferred into Pendragon PLC ordinary shares of 5p each, with a deferral period of 1 year: the figure in the table is the cash equivalent level. No bonus payments have been made in cash to directors for 2020. 2019 total equivalent to 0% of base salary.4. The performance period for the Value Creation Plan (“VCP”) awarded in 2017 was 01.01.17 to 31.12.20: the VCP failed to achieve its performance conditions and the awards lapsed in their entirety at the measurement date of 31 December 2020. There were no awards due to vest under the LTIP in 2020.5. For comparative information, William Berman joined Pendragon on 18 April 2019. Mark Willis joined Pendragon on 8 April 2019
SINGLE TOTAL FIGURE OF REMUNERATION FOR NON-EXECUTIVE DIRECTORS 2020 (AUDITED INFORMATION)
Basic Fee£000
Taxablebenefits
£000
SID/CommitteeChair Fee
£000Single total figure
£000
2020 2019 2020 2019 2020 2019 2020 2019
Current Directors
Dietmar Exler1 35 - - - - - 35 -
Nikki Flanders2 36 - - - - - 36 -
Brian Small 52 3 - - 10 - 62 3
Mike Wright 47 40 - - 10 5 57 45
1. Dietmar Exler was appointed to the Board on 20.04.20. Accordingly, his fees are for the period 20.04.20 to 31.12.20 2. Nikki Flanders was appointed to the Board on 13.03.20. Accordingly, her fees are for the period 13.03.20 to 31.12.20
PENSIONS
The Pendragon Pension Plan (Pension Plan) is established for
the benefit of the Group’s eligible employees. The Pension
Plan operates through a trustee company which holds and
administers its assets entirely separately from the Group’s
assets. There is no direct investment in Pendragon PLC.
Martin Casha ceased to be an active member of the Pension
Plan in 2006. The non-executive directors are not eligible to
participate in the Pension Plan. New executive directors are
invited to participate in the Pension Plan, should they so wish,
with any pension contributions being in line with the wider
workforce.
PERFORMANCE RELATED PAY FOR 2020: ANNUAL BONUS
As a result of the onset and continuation of the COVID-19
pandemic in 2020, the Committee did not consider it
appropriate to either set or award an annual bonus applicable
for the entirety of the year within the first quarter of 2020, as
would customarily be the practice. However, as the UK moved
out of the first national lockdown, the Committee reconvened
in late June and early July 2020, and considered it appropriate
to award an annual bonus applicable to the executive
directors and immediately below Board senior management
for H2 2020 only. The revised H2 2020 bonus performance
metric was set as underlying profit for H2, determined in
accordance with the Company’s revised H2 2020 Corporate
Plan which was considered to be both reflective of the
continued uncertain trading background, but also based on
a realistic assessment of the company’s trading prospects for
H2 at the time of the award. The Committee also introduced
a discretion to defer any H2 annual bonus payment made into
shares; this discretion was exercised and the bonus awarded
as outlined below was paid entirely in shares with a minimum
deferral period of 1 year.
Details of percentages of salary payable at threshold, target
and maximum are set out in the table below, together with the
actual outturn for H2 2020. For H2 2020, as the Committee
determined that as underlying profit achieved was ahead of
the revised H2 2020 Corporate Plan, bonus would be payable
at the maximum level.
Target aligned to Revised 2020 H2 Business Plan
Percentage of basic salary payable
Underlying Profit Outcome based on
revised H2 2020 Business Plan
Actual Outturn H2 2020 Underlying
Profit
% of Maximum Bonus Awarded
Payout: % of basic salary payable
Threshold (equal to 20% below Target)
12.5% £4,000,000
Target (achieving revised H2 2020 Business Plan)
50% £5,000,000
Maximum (equal to 50% above Target)
75% £7,500,000 ✓ 100% 75%
Annual Bonus for H2 2020 paid in deferred shares, as opposed to cash

78 Pendragon PLC Annual Report 2020
PERFORMANCE RELATED PAY FOR 2021: ANNUAL BONUS
The annual bonus for the 2021 financial year will operate in
accordance with the core remuneration policy detailed in
the Remuneration Policy section of this report and having
maximum bonus opportunity, deferral and clawback
provisions identical to those set out therein. The performance
metric selected for the 2021 annual bonus is underlying profit
outcome based on the FY 2021 Corporate Plan. The target
itself, as it relates to the 2021 financial year, is considered to be
commercially sensitive, and as such, we do not publish details
of this in advance.
Target aligned to 2021 FYCorporate Plan
% of basic salary payable
Underlying Profit Outcomebased on FY 2021 Corporate Plan
% Maximum Bonus Awarded
Threshold (equal to 20% below Target)
25%Year end Corporate Plan Target Profit/
Loss (£Xm/-£Xm) less 20%16.66%
Target (achieving revised H2 2020 Business Plan)
100%Year end Corporate Plan Target Profit/
Loss (£Xm/-£Xm)16.66%
Maximum (equal to 50% above Target)
150%Year end Corporate Plan Target Profit/
Loss (£Xm/-£Xm) plus 25%100%
LONG TERM INCENTIVES VESTING IN 2020
There were no long term incentive awards vesting in 2020.
VALUE CREATION PLAN (VCP) AWARDS
The Committee assessed the performance conditions
applicable to the legacy VCP Award, pursuant to which
certain executive directors and senior management were
granted nil cost options over ordinary shares of the Company
on 26 May 2017. The VCP award gave the executive directors
and senior management the opportunity to share in a
proportion of the total value created for shareholders above
a hurdle (“Threshold Total Shareholder Return”) measured
at the end of the Performance Period on 31 December 2020
(“Measurement Date”). The price used for this measurement
(“Measurement Total Shareholder Return”) was the sum of
the average share price for the three months ending on the
Measurement Date plus the cumulative dividends paid per
share over the Performance Period. The starting share price
was set at £0.3016 (“Initial Price”), being the three month
average share price prior to 1 January 2017. The hurdle price
was set at £0.442, being the Initial Price plus 10% compounded
annual growth over the Performance Period (“Hurdle”). The
total participation pool for the VCP was 10% of the total
value created above the Hurdle (“Pool”). On the basis that
the Hurdle was not exceeded at the Measurement Date, the
Remuneration Committee determined that the performance
conditions applicable to the VCP had not been achieved and
as such, all outstanding and legacy VCP Awards lapsed in their
entirety for all participants.
LONG TERM INCENTIVE PLAN AWARDS (“LTIP”)
AWARDED IN 2020
In October 2020, the Committee granted awards in the form
of nil cost share options pursuant to the Company’s LTIP to
the executive directors. Vesting of the Awards under the
LTIP is subject to the satisfaction of certain performance
conditions, 50% of which is based on achieving a defined
earnings per share target over a 14-month performance
period, commencing on the grant date and measured at year
end 2021, with the remaining 50% based on the achievement
of certain qualitative strategic performance metrics aligned to
the Company’s strategic milestones to be delivered in 2021.
If the performance conditions are not satisfied, none of the
LTIP award shares will vest. The target EPS for 2021 used was
the analyst’s consensus EPS of 1.58p, available at the time of
publication of the Company’s Group Strategy Presentation. The
non-financial strategic milestones are those as set out in the
Company’s Group Strategy Investor Presentation published
on 02 September 2020 (available at www.pendragonplc.
com) and reflect those strategic milestones the Company
considers able to achieve in 2021. Delivery against the 2021
strategic milestone performance conditions will be assessed
by the Remuneration Committee at year end; the specific
metrics of the strategic milestone targets are considered to
be commercially sensitive and are therefore not published in
this report. A summary of the awards granted and the metrics
applicable to the 2021 LTIP award are detailed in the tables
below; further detail on the metrics and achievement against
them will be disclosed, once the level of vesting has been
determined in the 2022 Annual Report.
Director Number of performance awards granted on 28 October 2020
William Berman 9,762,851
Mark Willis 5,369,568
Martin Casha 3,190,239
DIRECTORS’ REMUNERATION REPORT

79Pendragon PLC Annual Report 2020
BASE SALARY FOR 2021
Base salaries for the executive directors will remain unchanged
from the 2020 salary levels, other than the incremental increase
for Martin Casha to reflect the reduction of that element of his
remuneration which is salary in lieu of pension contribution.
DIRECTORS’ SHAREHOLDINGS (AUDITED)
The shareholdings of all directors, including the shareholdings
of their connected persons as at 31 December 2020, are set
out below. There have been no changes in the Directors’
interests from 31 December 2020 to the date of this report.
DIRECTORS’ SHAREHOLDINGS (AUDITED)
Legally owned as at 31.12.2020 Legally owned as at 31.12.2019
William Berman Nil Nil
Martin Casha 9,559,780 9,559,780
Dietmar Exler 210,000 N/A
Nikki Flanders Nil N/A
Mark Willis Nil Nil
Brian Small 400,000 400,000
Mike Wright 250,000 Nil
Executive director Martin Casha fulfils the requirement of
the Company share ownership policy applicable to them (i.e.
building a stake equivalent to 100% of base salary. The CEO
and CFO have a requirement to build up a shareholding of
200% of salary and 100% of salary respectively within five
years from appointment as executive directors. There is no
Company policy on non-executive director share ownership.
Performance Condition (weighting)
Target Percentage vesting of maximum potential
EPS Year End 2021*(50%)
Threshold: Target EPS – 20%Target: Target EPS
Maximum: Target EPS + 25%
Participant: Bill Berman, Mark Willis
Martin Casha
Straight line vesting between these points
Threshold: 10% 16.66%
Target: 40% 66.66%
Maximum: 100% 100%
Strategic metrics(50%)
(i) Unlock value in franchised UK Motor:Embed product extension;Rollout operational efficiency;Trial and rollout new propositions.(ii) Grow and diversify Pinewood:Deliver existing order pipeline;Geographic expansion;Deliver product extension.(iii) Disrupt standalone used cars:Rollout rebrand;Embed product extension;Define and launch revised value proposition;Launch one new site
*Target EPS for 2021 used was the analyst’s consensus EPS of 1.58p, available at the time of publication of the Company’s Group Strategy Presentation.

80 Pendragon PLC Annual Report 2020
300
200
100
0
2010 2011 2012 2013 2014 2015 2016 2017 2018 2019 2020
PENDRAGON PLC - TOTAL RETURN INDEX FTSE SMALL CAP EX INV. TRUSTS - TOTAL RETURN INDEX
PENDRAGON PLC TSR 2010 - 2020
1. This report is required, pursuant to the Large and Medium sized Companies and Groups (Accounts and Reports) (Amendment) Regulations 2013, regulation 18, Performance Graph. 2. Total Shareholder Return (“TSR”) is calculated over the ten years ended on 31 December 2020 and reflects the theoretical growth in the value of a shareholding over that period, assuming dividends (if any) are reinvested in shares in the Company. The price at which dividends are reinvested is assumed to be the amount equal to the closing price of the shares on the ex-dividend date plus the gross amount of annual dividend. The calculation ignores tax and reinvestment charges. For each Company in the index, the TSR statistics are normalised to a common start point, which gives the equivalent to investing the same amount of money in each company at that time. The percentage growth in TSR is measured over the chosen period. To obtain TSR growth of the relevant index over the chosen period, the weighted average of TSR for all the companies in the index is calculated. In this case, it is the FTSE Small Cap Index (excluding investment companies) as explained in Note 3. The weighting is by reference to the market capitalisation of each company in the index in proportion to the total market capitalisation of all the companies in the index at the end of the chosen measurement period.3. The FTSE Small CAP index has been selected as it represents the equity market in which the Company was a constituent member for the majority of the relevant 10-year period ending 31 December 2020 detailed above.
TOTAL SHAREHOLDER RETURN1
The graph below shows the total shareholder return (“TSR”)2
on the Company’s shares in comparison to the FTSE Small
Cap Index (excluding investment companies)3. TSR has been
calculated as the percentage change, during the relevant
period, in the market price of the shares, assuming that any
dividends paid are reinvested on the ex-dividend date. The
relevant period is the ten years ending 31 December 2020.
The notes at the foot of the graph provide more detail of the
TSR calculation.
DIRECTORS’ REMUNERATION REPORT

81Pendragon PLC Annual Report 2020
2010 2011 2012 2013 2014 2015 2016 2017 2018 2019 2020
HISTORY OF CHIEF EXECUTIVE REMUNERATION
PERCENTAGE CHANGE IN CHIEF EXECUTIVE REMUNERATION
The table below illustrates the percentage change in the remuneration awarded to the chief executive between the preceding
year and the reported year and that of the Group’s employees across its entire UK business.
Chief Executive
Employees of Company as a whole
% change in salary 2020 compared to 2019 10%1 8.05%
% change in benefit 2020 compared to 2019 0% 0%
% change in bonus 2020 compared to 2019 100% 0%
1. NB - the 2019 chief executive remuneration comparator is based on the total remuneration paid to the holder of the role of chief executive officer for the period 01.01.2019 to 30.06.2019 with data extrapolated for the full period thereafter. For the second half of 2019, the Company did not have a chief executive officer in post so like for like comparisons to the 2019 data should be considered in this context.
Chief Executive 2020 20191 2018 2017 2016 2015 2014 2013 2012 2011
Total Remuneration £m (single figure) 510 464 589 727 1,605 1,775 3,472 2,961 857 946
Annual bonus award (% of maximumthat could have been paid)
100%2 0% 0% 30% 87% 100% 100% 100% 54% 75%
Percentage of LTIP vesting3 0% 0% 0% 0% 100% 56% 100% 100% 0% 0%
1. Total remuneration for the chief executive role in 2019 has been calculated based on total remuneration paid to the holder of the role of chief executive officer for the period from 01.01.2019 to 30.06.2019, with the total remuneration payable for full reporting period based on extrapolated data assuming the last holder of the role of chief executive officer prior to that period had continued in the role at the same level of remuneration to the end of the full reporting period. 2. The annual bonus awarded in 2020 was for the period 1 July 2020 to 31 December 2020 with a reduced maximum level of quantum available.3. Percentage of shares vesting under the Pendragon Long Term Incentive Plan against the maximum number of shares that could have been received.

82 Pendragon PLC Annual Report 2020
SHAREHOLDERS’ VOTE ON REMUNERATION AT THE 2020 AGM
SHARE PRICE INFORMATION AND PERFORMANCE
Other than those detailed above, there are no share option or long term incentive schemes in which the directors are eligible to
participate. The middle market price of Pendragon ordinary shares at 31 December 2020 was 13.10 pence and the range during
the year was 5.20 pence to 15.96 pence.
APPROVAL
This report was approved by the Committee and signed on its behalf by:
Mike Wright
Chairman of the Remuneration Committee
24 March 2021
2019 Directors’ Remuneration Report Number Proportion of votes cast
Votes cast in favour 889,274,828 78.48%
Votes cast against 243,783,685 21.52%
Total votes cast in favour or against 1,133,058,513 100%
Votes withheld 103,462
RELATIVE IMPORTANCE OF SPEND ON PAY
The table below illustrates the year on year change in total team member pay (being the aggregate of staff costs as set out in
note 2.4 to the financial statements and distributions to shareholders (being declared dividends).
CHIEF EXECUTIVE OFFICER PAY RATIO
The table below shows our chief executive officer pay ratio at 25th, median and 75th percentiles of our UK employees. The
ratios have been calculated based on the single total figure of remuneration for the chief executive officer and the total pay for
the employees based on our gender pay gap data under Option B of The Companies (Miscellaneous Reporting) Regulations
2018. We have used Option B as the Company has already completed comprehensive data collection and analysis for the
purposes of gender pay gap reporting, and continues to do so on a monthly basis. The gender pay gap data used was collated
on 31 December 2020.
Financial year Method25th percentile pay ratio
(lower quartile)Median pay ratio
(median)75th percentile pay ratio
(upper quartile)
2020 Option B 30:1 26:1 20:1
Total pay for the percentile employees taken from our gender pay gap data includes the following pay elements: base salary, holiday pay, hourly pay, national minimum wage top ups, car allowance, acting up allowance, monthly advances, team member vouchers subject to national insurance, benefit schemes, statutory sick pay, maternity pay and paternity pay. Associates who have not received pay (in terms of salary and adjustments) but has still received other salary payments are excluded from our gender pay gap data.
Team member pay Distribution to shareholders
2020 (£m) 2019 (£m) % change 2020 2019 % change
£227.0m £297.6m -23.7% £0m £9.7m -100%
Directors’ Remuneration Policy (2020-2023) Number Proportion of votes cast
Votes cast in favour 665,116,001 58.70%
Votes cast against 467,942,512 41.30%
Total votes cast in favour or against 1,133,058,513 100%
Votes withheld 0
DIRECTORS’ REMUNERATION REPORT

83Pendragon PLC Annual Report 2020
STRATEGIC REVIEW AND PRESCRIBED REPORTING
Our Strategic Review at pages 24 to 35 contains the
information, prescribed by the Companies Act 2006,
required to present a fair review of the company’s business, a
description of the principal risks and uncertainties it faces, and
certain of the information on which reports and statements are
required by the UK Corporate Governance Code. The Board
approved the Strategic Review set out on page 24 and the
Viability Statement set out on page 49. Additional information
on which the directors are required by law to report is set out
below and in the following:
• Corporate Governance Report
• Board of Directors
• Corporate Social Responsibility Report
• Audit Committee Report
• Nomination Committee Report
• Directors’ Remuneration Report
• Directors’ Report
• Directors’ Responsibility Statement
In the interests of increasing the relevance of the Report and
reducing the environmental impacts of over-lengthy printed
reports, we have placed on our website certain background
information on the Company the disclosure of which, in
this Report, is not mandatory. We monitor reaction to the
publication of shareholder information on our website,
to help shape our shareholder communication and future
improvements.
RESULTS AND DIVIDENDS
The results of the Group for the year are set out in the financial
statements on pages 97 to 195. No interim dividend was
paid during the year, and the directors are not proposing to
recommend a final dividend for the year ended 31 December
2020.
APPOINTMENT AND POWERS
OF THE COMPANY’S DIRECTORS
Appointment and removal of directors is governed by the
Company’s articles of association (the Articles), the UK
Corporate Governance Code (the Code), the Companies
Acts and related legislation. Subject to the Articles (which
shareholders may amend by special resolution), relevant
legislation and any directions given by special resolution, the
Company and its Group is managed by its Board of directors.
By resolutions passed at company general meetings, the
shareholders have authorised the directors: (i) to allot and
issue ordinary shares; (ii) to offer and allot ordinary shares in
lieu of some or all of the dividends; and (iii) to make market
purchases of the Company’s ordinary shares (in practice,
exercised only if the directors expect it to result in an increase
in earnings per share). Details of movements in the Company’s
share capital are given in note 4.4 to the financial statements.
From time to time, Pendragon provides financial assistance
to its independent employee benefits trust to facilitate the
market purchase of ordinary shares in the Company for use in
connection with various of the company’s employee incentive
schemes. The Company did not purchase any shares in this
way in 2020.
BUSINESS AT THE AGM
At the AGM, a separate shareholders’ resolution is proposed for
each substantive matter. We will issue to our shareholders the
Company’s annual report and financial statements together
with the notice of AGM, giving not less than the requisite period
of notice. The notice sets out the resolutions the directors are
proposing and has explanatory notes for each. At the AGM,
directors’ terms of appointment are available for inspection
and, as well as dealing with formal AGM business, the Board
takes the opportunity to give an update to shareholders
on the Company’s trading position. The chairman and each
Committee chairman are available to answer questions put by
shareholders present.
DIRECTORS AND THEIR INTERESTS IN SHARES
Current directors are listed on page 52. Details of the terms
of appointment and notice period of each of the current
directors, together with executives directors’ respective
interests in shares under the company’s long term incentive
plan (non-executive directors have none), appear in the
Directors’ Remuneration Report on pages 68 to 82 . Directors
who served during 2020 and their respective interests in the
company’s issued ordinary share capital are shown in the
table below. All holdings shown are beneficial. None of the
directors holds options over Company shares, other than nil
paid options pursuant to the LTIP as described on page 78 in
the director’s remuneration report. Executive directors will aim
to fulfil the requirements of the Company’s share ownership
policy applicable to them within five years of appointment.
There is no Company policy requiring non-executive directors
to hold a minimum number of Company shares.
DIRECTORS’ ROTATION
The UK Corporate Governance Code (July 2018) imposes an
obligation that all Directors should be subject to annual re-
election.
DIRECTORS’ REPORT

84 Pendragon PLC Annual Report 2020
DIRECTORS’ REPORT
INDEMNITIES TO DIRECTORS
In line with market practice and the Company’s articles,
each director has the benefit of a deed of indemnity from
the Company, which includes provisions in relation to duties
as a director of the Company or an associated company,
qualifying third party indemnity provisions and protection
against derivative actions. Copies of these are available for
shareholders’ inspection at the AGM.
SHARE CAPITAL
As at 31 December 2020, Pendragon’s issued share capital
comprised a single class: ordinary shares of 5 pence each. The
Articles permit the creation of more than one class of share,
but there is currently none other than ordinary shares. Details
of the Company’s share capital are set out in note 4.4 to the
accounts. All issued shares are fully paid. The Company did
not issue any new shares during the period under review. The
rights and obligations attaching to the Company’s ordinary
shares are set out in the Articles. The Company is currently
authorised to issue up to two-thirds of its current issued share
capital pursuant to a resolution passed at its 2020 AGM.
SIGNIFICANT DIRECT OR INDIRECT SHAREHOLDINGS
At 26 February 2021 the directors had been advised of the
following interests in the shares of the Company:
VOTING RIGHTS, RESTRICTIONS ON VOTING RIGHTS
AND DEADLINES FOR VOTING RIGHTS
Shareholders (other than any who, under the Articles or the
terms of the shares they hold, are not entitled to receive such
notices) have the right to receive notice of, and to attend and
to vote at, all general and (if any) applicable class meetings of
the Company. A resolution put to the vote at any general or
class meeting is decided on a show of hands unless (before
or on the declaration of the result of the show of hands or
on the withdrawal of any other demand for a poll) a poll is
properly demanded. At a general meeting, every member
present in person has, upon a show of hands, one vote, and on
a poll, every member has one vote for every 5 pence nominal
amount of share capital of which they are the holder. In the
case of joint holders of a share, the vote of the member whose
name stands first in the register of members is accepted to
the exclusion of any vote tendered by any other joint holder.
Unless the Board decides otherwise, a shareholder may not
vote at any general or class meeting or exercise any rights in
relation to meetings whilst any amount of money relating to
his shares remains outstanding.
A member is entitled to appoint a proxy to exercise all or any
of their rights to attend and speak and vote on their behalf
at a general meeting. Further details regarding voting can
Directors’ shareholdings Number at 31.12.20 Number at 31.12.19
William Berman nil nil
Martin Casha 9,559,780 9,559,780
Dietmar Exler 210,000 n/a
Nikki Flanders nil n/a
Mark Willis nil nil
Mike Wright 250,000 nil
Brian Small 400,000 n/a
Shareholder Number of sharesPercentage of voting rights
of the issued share capital
Teleios Capital 254,363,110 18.21
Odey Asset Management 209,801,651 15.02
Anders Hedin Invest AB 189,188,563 13.54
Schroders 149,233,584 10.68
Hosking Partners 84,331,110 6.04
Farringdon Capital Management 54,611,219 3.91
Dimensional Fund Advisors 43,285,611 3.10
Blackrock Inc 29,274,404 2.10
Huntington Partners 27,859,210 1.99
Legal & General Group 26,810,099 1.92

85Pendragon PLC Annual Report 2020
By order of the Board
Richard Maloney
Company Secretary
24 March 2021
be found in the notes to the notice of the AGM. Details of
the exercise of voting rights attached to the ordinary shares
held by the Company’s Employee Benefit Trust are set out
below. None of the ordinary shares, including those held by
the Employee Benefit Trust, carries any special voting rights
with regard to control of the Company.
To be effective, electronic and paper proxy appointments
and voting instructions must be received by the Company’s
Registrars not later than 48 hours before a general meeting.
The Articles may be obtained from Companies House in the
UK or upon application to the company secretary. Other
than those prescribed by applicable law and the Company’s
procedures for ensuring compliance with it, there are no
specific restrictions on the size of a holding nor on the transfer
of shares, which are governed by the Articles and prevailing
legislation. The directors are not aware of any agreement
between holders of the Company’s shares that may result
in restrictions on the transfer of securities or the exercise of
voting rights. No person has any special rights of control over
the Company’s share capital.
SHARES HELD BY THE PENDRAGON
EMPLOYEE BENEFIT TRUST
As at 31 December 2020, the company’s Employee Benefit
Trust with Accuro Trustees (Jersey) Limited (the Trustee) held
6,420,093 shares, representing 0.46% of the total issued share
capital at that date (2019: 6,420,093; 0.46%). The Trustee
has waived its voting rights attached to these shares. It holds
these shares to enable it to satisfy entitlements under the
Company’s share schemes. During the year, the Trustee did
not transfer any shares to satisfy such entitlements (2019:0).
CONTRACTS
None of the directors had an interest in any contract with the
Group (other than their service agreement or appointment
terms and routine purchases of vehicles for their own use)
at any time during 2020. The Company and members of its
Group are party to agreements relating to banking, properties,
employee share plans and motor vehicle franchises which alter
or terminate if the Company or Group Company concerned
undergoes a change of control. None is considered significant
in terms of its likely impact on the business of the Group as a
whole.
POLITICAL DONATIONS
The Company and its Group made no political donations
(2019: £ nil).
AUDITOR
The directors who held office at the date of approval of this
directors’ report confirm that: so far as they are each aware,
there is no relevant audit information of which the Group’s
auditors are unaware; and each director has taken all the steps
that they ought to have taken as a director to make themself
aware of any relevant audit information and to establish that
the Group’s auditors are aware of that information.

86 Pendragon PLC Annual Report 2020
87 Statement of Directors’ Responsibilities in Respect
of the Annual Report and Financial Statements
88 Independent Auditor’s Report to the Members of
Pendragon PLC
97 Consolidated Income Statement
98 Consolidated Statement of Comprehensive Income
99 Consolidated Statement of Changes in Equity
100 Consolidated Balance Sheet
101 Consolidated Cash Flow Statement
102 Reconciliation of Net Cash Flow to Movement
in Net Debt
103 Notes to the Financial Statements
182 Company Balance Sheet
183 Company Statement of Comprehensive Income
184 Company Statement of Changes in Equity
185 Notes to the Financial Statements of the Company
194 Advisors, Banks and Shareholder Information
195 5 Year Group Review
FINANCIAL STATEMENTS

87Pendragon PLC Annual Report 2020
The directors are responsible for preparing the Annual Report
and the Group and parent Company financial statements in
accordance with applicable law and regulations.
Company law requires the directors to prepare Group and
parent Company financial statements for each financial
year. Under that law they are required to prepare the
Group financial statements in accordance with International
Accounting Standards in conformity with the requirements
of the Companies Act 2006 and applicable law and have
elected to prepare the parent Company financial statements
in accordance with UK accounting standards and applicable
law, including FRS 101 Reduced Disclosure Framework. In
addition the Group financial statements are required under
the UK Disclosure and Transparency Rules to be prepared in
accordance with International Financial Reporting Standards
adopted pursuant to Regulation (EC) No 1606/2002 as it
applies in the European Union (“IFRSs as adopted by the EU”).
Under company law the directors must not approve the
financial statements unless they are satisfied that they give
a true and fair view of the state of affairs of the Group and
parent company and of their profit or loss for that period. In
preparing each of the Group and parent company financial
statements, the directors are required to:
• select suitable accounting policies and then apply them
consistently;
• make judgements and estimates that are reasonable,
relevant, reliable and prudent;
• for the Group financial statements, state whether they
have been prepared in accordance with International
Accounting Standards in conformity with the requirements
of the Companies Act 2006 and International Financial
Reporting Standards adopted pursuant to Regulation
(EC) No 1606/2002 as it applies in the European Union
(“IFRSs as adopted by the EU”); for the parent Company
financial statements, state whether applicable UK
accounting standards have been followed, subject to any
material departures disclosed and explained in the parent
company financial statements;
• assess the Group and parent company’s ability to
continue as a going concern, disclosing, as applicable,
matters related to going concern; and
• use the going concern basis of accounting unless they
either intend to liquidate the Group or the parent
company or to cease operations, or have no realistic
alternative but to do so.
The directors are responsible for keeping adequate accounting
records that are sufficient to show and explain the parent
company’s transactions and disclose with reasonable accuracy
at any time the financial position of the parent company and
enable them to ensure that its financial statements comply
with the Companies Act 2006.
They are responsible for such internal control as they
determine is necessary to enable the preparation of financial
statements that are free from material misstatement, whether
due to fraud or error, and have general responsibility for taking
such steps as are reasonably open to them to safeguard the
assets of the Group and to prevent and detect fraud and other
irregularities.
Under applicable law and regulations, the Directors are also
responsible for preparing a Strategic Report, Directors’ Report,
Directors’ Remuneration Report and Corporate Governance
Statement that complies with that law and those regulations.
The directors are responsible for the maintenance and
integrity of the corporate and financial information included
on the company’s website. Legislation in the UK governing
the preparation and dissemination of financial statements
may differ from legislation in other jurisdictions.
Responsibility statement of the Directors in respect of the
annual financial report
We confirm that to the best of our knowledge:
• the financial statements, prepared in accordance with
the applicable set of accounting standards, give a true
and fair view of the assets, liabilities, financial position
and profit or loss of the company and the undertakings
included in the consolidation taken as a whole; and
• the strategic report includes a fair review of the
development and performance of the business and the
position of the issuer and the undertakings included in
the consolidation taken as a whole, together with a
description of the principal risks and uncertainties that
they face.
We consider the Annual Report and Accounts, taken as a
whole, is fair, balanced and understandable and provides the
information necessary for shareholders to assess the Group’s
position and performance, business model and strategy.
Approved by order of the Board
Mark Willis
Chief Finance Officer
24 March 2021
STATEMENT OF DIRECTORS’ RESPONSIBILITIES IN RESPECT OF THE ANNUAL REPORT AND THE FINANCIAL STATEMENTS

88 Pendragon PLC Annual Report 2020
1. Our opinion on the financial statements is unmodified
We have audited the financial statements of Pendragon PLC (“the Company”) for the year ended 31 December 2020 which comprise
the Consolidated Income Statement, Consolidated Statement of Comprehensive Income, Consolidated Statements of Changes in
Equity, Consolidated Balance Sheet, Consolidated Cash Flow Statement, Company Statement of Other Comprehensive Income,
Company Statements of Changes in Equity, Company Balance Sheet and the related notes, including the accounting policies in note 1.
In our opinion:
• the financial statements give a true and fair view of the state of the Group’s and of the parent company’s affairs as at 31
December 2020 and of the Group’s loss for the year then ended;
• the Group financial statements have been properly prepared in accordance with international accounting standards in
conformity with the requirements of the Companies Act 2006 and International Financial Reporting Standards adopted
pursuant to Regulation (EC) No 1606/2002 as it applies in the European Union (“IFRSs as adopted by the EU”)
• the parent company financial statements have been properly prepared in accordance with UK accounting standards,
including FRS 101 Reduced Disclosure Framework; and
• the financial statements have been prepared in accordance with the requirements of the Companies Act 2006 and, as
regards the Group financial statements, Article 4 of the IAS Regulation to the extent applicable.
Basis for opinion
We conducted our audit in accordance with International Standards on Auditing (UK) (“ISAs (UK)”) and applicable law. Our
responsibilities are described below. We believe that the audit evidence we have obtained is a sufficient and appropriate basis
for our opinion. Our audit opinion is consistent with our report to the audit committee.
We were first appointed as auditor by the shareholders on 28 April 1997. The period of total uninterrupted engagement is for
the 24 financial years ended 31 December 2020. We have fulfilled our ethical responsibilities under, and we remain independent
of the Group in accordance with, UK ethical requirements including the FRC Ethical Standard as applied to listed public interest
entities. No non-audit services prohibited by that standard were provided.
2 Key audit matters: including our assessment of risks of material misstatement
Key audit matters are those matters that, in our professional judgement, were of most significance in the audit of the financial
statements and include the most significant assessed risks of material misstatement (whether or not due to fraud) identified
by us, including those which had the greatest effect on: the overall audit strategy; the allocation of resources in the audit; and
directing the efforts of the engagement team. We summarise below the key audit matters (changed from 2019), in decreasing
order of audit significance, in arriving at our audit opinion above, together with our key audit procedures to address those
matters and, as required for public interest entities, our results from those procedures. These matters were addressed, and our
results are based on procedures undertaken, in the context of, and solely for the purpose of, our audit of the financial statements
as a whole, and in forming our opinion thereon, and consequently are incidental to that opinion, and we do not provide a
separate opinion on these matters.
INDEPENDENT AUDITOR’S REPORT TO THE MEMBERS OF PENDRAGON PLC

89Pendragon PLC Annual Report 2020
INDEPENDENT AUDITOR’S REPORT TO THE MEMBERS OF PENDRAGON PLC (CONTINUED)
The risk – Disclosure quality
The financial statements explain how the Board has
formed a judgement that it is appropriate to adopt the
going concern basis of preparation for the group and
parent company. We consider the risk to be consistent to
2019 as there is a requirement for the Group to refinance
again and there continues to be a challenging economic
climate.
That judgement is based on an evaluation of the inherent
risks to the Group’s and Company’s business model,
including the impact of the Coronavirus, and how those
risks might affect the Group’s and Company’s financial
resources or ability to continue operations over a period
of at least a year from the date of approval of the financial
statements.
The risks most likely to adversely affect the Group’s and
Company’s available financial resources over this period
were:
• The impact of Coronavirus (COVID-19) on consumer
spend; and
• The continued downward trend in the market for new
and used car sales.
There are also less predictable but realistic second order
impacts, such as the impact of COVID-19 on the Group’s
supply chain, which could result in a rapid reduction of
available financial resources.
The risk for our audit was whether or not those risks
were such that they amounted to a material uncertainty
that may have cast significant doubt about the ability to
continue as a going concern. Had they been such, then that
fact would have been required to have been disclosed.
Given the risk the Group is facing, complete and detailed
disclosure of the risks and the judgement applied for the
use of the going concern assumption is a key financial
statements disclosure to allow readers to understand fully
the key risks and uncertainties.
Our response – Our procedures included:
• Funding assessment: We agreed current facilities available
to the relevant facility agreements and recent lender
correspondence. We inspected the existing and new loan
agreements in order to determine the covenants attached
to the loan and we considered compliance with the financial
covenants in the context of the cash flow forecasts;
• Historical comparisons: We assessed historical accuracy of
directors’ forecasting by comparing the actual cash flows for
the year ended 31 December 2020 to the forecast cash flows
over the same period;
• Key dependency assessment: We engaged our restructuring
specialist expertise in order to identify the critical assumptions
in the cash flow forecasts and challenged the directors by
applying additional specific sensitivities to the calculation;
• Sensitivity analysis: The directors performed an initial
sensitivity analysis of the level of available financial resources
indicated by the Group’s financial forecasts taking account of
reasonably possible (but not unrealistic) adverse effects that
could arise from these risks individually and collectively. We
compared the directors’ assumptions to public information
on possible macroeconomic trends. As a result of this
comparison we requested the directors to apply more severe,
but plausible, downside assumptions for some sensitivities.
In particular, we assessed the Group’s downside forecasts
based on the risk resulting from the Coronavirus, and the
potential impact the risk may have on new and used sales;
• Benchmarking assumptions: We compared the assumptions
behind the Group’s cash flow forecasts for key variables,
such as expected used car gross profit per unit and new car
volumes, to externally derived data including market forecasts
on future new and used car sales as well as macroeconomic
data on projected growth and cost inflation;
• Evaluating directors’ intent: We evaluated the achievability
of the mitigating actions the directors consider they
would take to improve the position should the risks
materialise. We considered the extent to which the intent
and ability of the directors to pursue mitigating actions
and implement these in the time frame required, should
such actions be required, were reasonable by assessing
whether the actions were entirely within the Directors’
control and consistent with Board approved plans;
• Assessing transparency: We assessed the completeness
and accuracy of the matters covered in the going concern
disclosure by considering whether they accurately reflected
the Group’s financing arrangements and the risks associated
with the Group’s ability to continue as a going concern.
Our results: We found the going concern disclosure, without any
material uncertainty, to be acceptable (2019 result: acceptable).
2. Key audit matters: including our assessment of risks of material misstatement continued
Going Concern Risk vs 2019:
Refer to pages 103 and 104 of the Notes to the financial statements

90 Pendragon PLC Annual Report 2020
INDEPENDENT AUDITOR’S REPORT TO THE MEMBERS OF PENDRAGON PLC (CONTINUED)
The risk – Forecast-based valuation
The carrying amount of assets, including goodwill, in the
group in relation to the following cash-generating units
(“CGUs”): Citroen, Trucks, Ford, Renault, Vauxhall, Car Stores
and Hyundai (“ the specified CGUs”) and the carrying amount
of the parent company’s investments in subsidiaries are
significant and at risk of irrecoverability.
Market conditions have been challenging in the specified
CGUs. During the prior year the Group impaired goodwill
across a number of CGUs and an impairment was recognised
against the parent company investment in subsidiaries, as a
result there is limited headroom when testing for impairment
and the headroom is sensitive to the assumptions adopted.
During the year further Group impairments of £12.5m (2019:
£128.3m) in relation to the CGUs and £Nil (2019: £110.0m)
for parent company investment in subsidiaries have been
recognised. Therefore, we consider the risk has reduced
compared to 2019 due to the impairment recognised
previously, and the trading performance of the Group in 2020.
The estimated recoverable amount of these balances is
subjective due to the inherent uncertainty involved in
forecasting and discounting future cash flows, and relatively
small changes in these assumptions could give rise to material
changes in the assessment of the carrying value of these
balances.
The effect of these matters is that, as part of our risk
assessment, we determined that the valuation of the assets in
relation to these specified CGUs and the recoverable amount
of the cost of parent company’s investment in subsidiaries
has a high degree of estimation uncertainty, with a potential
range of reasonable outcomes greater than our materiality
for the financial statements as a whole, and possibly many
times that amount. The financial statements (note 3.1 for the
Group and note 5 for the Company) disclose the sensitivity
estimated by the Group.
Our response – Our procedures included:
• Benchmarking assumptions: We compared the
assumptions behind the Group’s cash flow forecasts for
key variables, such as expected used car gross profit per
unit, to externally derived data including market forecasts
on future new and used car sales as well as macroeconomic
data on projected growth and cost inflation;
• Historical comparisons: We assessed the historical
accuracy of the forecasts used in the impairment models
by comparing forecast cash flows on a CGU level to
those achieved in 2020, including an assessment of the
consistency of key variables including forecast gross
profit per vehicle in new and used car;
• Our sector experience: We evaluated the underlying
assumptions by challenging where forecasted cash flows
were significantly higher than current trading levels or did
not reflect known or probable changes in the business
environment;
• Our valuation experience: We challenged, assisted by
our own valuation specialists, the key inputs used in the
calculation of the discount rate by comparing it against
external data sources and comparator group data;
• Sensitivity analysis: We performed breakeven analysis on
the assumptions noted above for CGUs with headroom
and sensitivity analysis to identify the CGUs most sensitive
to further impairment;
• Assessing transparency: We assessed whether the
Group’s disclosures about the sensitivity of the outcome
of the impairment assessment to changes in key
assumptions reflected the risks inherent in the valuation
of assets in relation to these CGUs.
Our results: We found the carrying value of assets, including
goodwill, in relation to the Citroen, Trucks, Ford, Renault,
Vauxhall, Car Stores and Hyundai CGUs, and the related
impairment charge, to be acceptable (2019 result: acceptable).
We found the Group’s conclusion that there is no impairment of
the parent company’s investments in and loans to subsidiaries
to be acceptable (2019 result: acceptable).
2. Key audit matters: including our assessment of risks of material misstatement continued
Recoverability of assets, including goodwill, in relation to following CGUs: Citroën, Trucks, Ford, Renault, Vauxhall, Car
Stores and Hyundai and recoverability of parent’s investments in and loans to subsidiaries Risk vs 2019:
(Carrying value of assets in relation to the specified CGUs: £309.6m, Group impairment of £12.5m (2019: £128.3m); Parent
company investment in subsidiaries £802.4m (2019: £802.4m), impairment £Nil (2019: £110.0m); loans to subsidiary undertakings
£90.0m (2019: £90.0m). Refer to page 62 Audit Committee Report, pages 128 and 187 (accounting policy) and pages 128-133
and 189-190 (financial disclosures)

91Pendragon PLC Annual Report 2020
INDEPENDENT AUDITOR’S REPORT TO THE MEMBERS OF PENDRAGON PLC (CONTINUED)
The risk – subjective valuationThe Group holds significant levels of used vehicle inventory
in the UK. Used vehicle selling prices vary depending upon
a number of factors including general economic conditions,
falling diesel sales and the levels of new vehicle production.
Accounting standards require inventory to be held at the
lower of cost and net realisable value. History has shown that
the average price of a used vehicle may decline significantly
over a short period of time, and therefore the estimation
of the net realisable value of used vehicles is a significant
judgement area. The risk increases as the age of the used
vehicle inventory increases.
The effect of these matters is that, as part of our risk
assessment, we determined that the carrying amount of used
vehicles in the UK has a high degree of estimation uncertainty,
with a potential range of reasonable outcomes which
approximates to our materiality for the financial statements
as a whole. The financial statements (note 3.4) disclose the
sensitivity estimated by the Group.
Our response – Our procedures included:
• Historical comparisons: We challenged the assumptions
made in the used vehicle inventory provision by
comparison to the Group’s historical trading patterns,
including performing an analysis of the ageing of the
vehicles. We also assessed the Group’s methodology
for calculating the provision by comparing sales prices
achieved during the year to the prior year provision;
• Benchmarking assumptions: We compared the Group’s
expectations for used car prices to the expectations of
market data and various commentators;
• Sensitivity analysis: We performed sensitivity analysis on
input assumptions noted above;
• Independent reperformance: We considered alternative
methodology for assessing the valuation of used
inventory, with reference to the age, fuel type and brand
of the vehicles within used vehicle inventory in the UK at
the year end;
• Tests of details: We assessed the appropriateness of
the related inventory provision by comparing the losses
incurred on used car sales subsequent to the year end to
the level of the year end provision;
• Assessing transparency: We assessed the adequacy of
the Group’s disclosures about the degree of estimation
involved in arriving at the UK used vehicle inventory
provision.
Our results: We found the Group’s estimate of the carrying
value of UK used inventory to be acceptable (2019 result:
acceptable).
2. Key audit matters: including our assessment of risks of material misstatement continued
Carrying amount of used vehicle inventory in the UK (£215.4 million (2019: £330.3 million)) Risk vs 2019: Refer to page 63 Audit Committee report, page 139 (accounting policy) and page 139 (financial disclosures).
In the prior year we reported a key audit matter in respect of the impact of uncertainties due to the UK exiting the European
Union. Following the trade agreement between the UK and the EU, and the end of the EU-exit implementation period, the
nature of these uncertainties has changed. We continue to perform procedures over material assumptions in forward looking
assessments such as going concern and impairment tests, however, we no longer consider the effect of the UK’s departure
from the EU to be a separate key audit matter.
We performed the detailed tests above rather than seeking to rely on any of the Group’s controls because our knowledge of the
design of these controls indicated that we would not be able to obtain the required evidence to support reliance on controls.

92 Pendragon PLC Annual Report 2020
INDEPENDENT AUDITOR’S REPORT TO THE MEMBERS OF PENDRAGON PLC (CONTINUED)
3. Our application of materiality and an overview of the scope of our audit
Materiality for the Group financial statements as a whole was set at £4.0 million (2019: £4.0 million) determined with reference to a benchmark of Group revenue, normalised by averaging over the last four years due to impact of COVID-19, of which it represents 0.1% (2019: 0.1% of Group total revenue). We consider this to be the most appropriate benchmark as it provides a more stable measure year on year than Group profit or loss before tax.
Materiality for the parent company financial statements as a whole was set at £1.4 million (2019: £2.2 million), determined with reference to component materiality. This is lower than the materiality we would otherwise have determined by reference to a benchmark of the company’s net assets, of which it represents 0.4% (2019: 0.6%).
In line with our audit methodology, our procedures on individual account balances and disclosures were performed to a lower threshold, performance materiality, so as to reduce to an acceptable level the risk that individually immaterial misstatements in individual account balances add up to a material amount across the financial statements as a whole.
Performance materiality for the Group and parent company was set at 65% (2019: 65%) of materiality for the financial statements as a whole, which equates to £2.6 million (2019: £2.6 million) and £1.0 million (2019: £1.4 million), respectively.
We applied this percentage in our determination of performance materiality based on the level of identified misstatements and our understanding of the control environment during the prior period.
We agreed to report to the Audit Committee any corrected or uncorrected identified misstatements exceeding £0.2 million (2019: £0.2 million), in addition to other identified misstatements that warranted reporting on qualitative grounds.
We subjected thirteen (2019: thirteen) of the Group’s twenty four reporting components (2019: twenty four) to full scope audits for Group purposes. For the residual components, we performed analysis at an aggregated group level to re-examine our assessment that there were no significant risks of material misstatement within these. The components within the scope of our work accounted for 88% (2019: 90%) of the Group’s revenue, 90% (2019: 90%) of total profits and losses that made up Group loss before tax and 92% (2019: 89%) of Group total assets.
The Group audit team approved the component materialities, which ranged from £0.6 million to £2.2 million (2019: £0.4 million to £2.2 million), having regard to the mix of size and risk profile of the Group across the components. The Group audit team performed all of the audit work in relation to the thirteen (2019: thirteen) components, including the audit of the parent company.
NormalisedGroup Revenue
£3,182m (2019: Group revenue
of £4,600m)
Group materiality£4.0m
(2019:£4.0m)
£4.0mWhole financial statements materiality(2019:£3.0m)
£2.2m Component materiality (2019:£2.2m)
£0.2m Misstatements reported to the Audit Committee(2019:£0.2m)

93Pendragon PLC Annual Report 2020
INDEPENDENT AUDITOR’S REPORT TO THE MEMBERS OF PENDRAGON PLC (CONTINUED)
4. Going concern
The directors have prepared the financial statements on the going concern basis as they do not intend to liquidate the Group or the Company or to cease their operations, and as they have concluded that the Group’s and the Company’s financial position means that this is realistic. They have also concluded that there are no material uncertainties that could have cast significant doubt over their ability to continue as a going concern for at least a year from the date of approval of the financial statements (“the going concern period”).
An explanation of how we evaluated management’s assessment of going concern is set out in the related key audit matter in section 2 of this report.Our conclusions based on this work: • we consider that the directors’ use of the going concern basis of accounting in the preparation of the financial statements
is appropriate;• we have not identified, and concur with the directors’ assessment that there is not, a material uncertainty related to events
or conditions that, individually or collectively, may cast significant doubt on the Group’s or Company’s ability to continue as a going concern for the going concern period;
• we have nothing material to add or draw attention to in relation to the Directors’ statement in Note 1 to the financial statements on the use of the going concern basis of accounting with no material uncertainties that may cast significant doubt over the Group and Company’s use of that basis for the going concern period; and
• the related statement under the Listing Rules set out on page 49 is materially consistent with the financial statements and our audit knowledge.
However, as we cannot predict all future events or conditions and as subsequent events may result in outcomes that are inconsistent with judgements that were reasonable at the time they were made, the above conclusions are not a guarantee that the Group or the Company will continue in operation.
5. Fraud and breaches of laws and regulations – ability to detect
Identifying and responding to risks of material misstatement due to fraud
To identify risks of material misstatement due to fraud (“fraud risks”) we assessed events or conditions that could indicate an incentive or pressure to commit fraud or provide an opportunity to commit fraud. Our risk assessment procedures included:• enquiring of directors, the audit committee, internal audit and inspection of policy documentation as to the Group’s high-
level policies and procedures to prevent and detect fraud, including the internal audit function, and the Group’s channel for “whistleblowing”, as well as whether they have knowledge of any actual, suspected or alleged fraud;
• reading Board, audit committee and risk control group minutes;• considering remuneration incentive schemes and performance targets for management/directors/sales staff;• using analytical procedures to identify any usual or unexpected relationships.
We communicated identified fraud risks throughout the audit team and remained alert to any indications of fraud throughout the audit.
As required by auditing standards, and taking into account possible pressures to meet profit targets and our overall knowledge of the control environment, we perform procedures to address the risk of management override of controls and the risk of fraudulent revenue recognition, in particular the risk that new and used car sales are recorded in the wrong period and the risk that Group management may be in a position to make inappropriate accounting entries, and the risk of bias in accounting estimates and judgements such as used vehicle inventory provision and impairment.
We also identified a fraud risk related to inappropriate valuation of used vehicle inventory in response to achieve financial targets required in debt covenants and remuneration schemes.
Further detail in respect of the valuation of used vehicle inventory and impairment is set out in the key audit matter disclosures in section 2 of this report.
We performed procedures including:• identifying journal entries and other adjustments to test for all full scope components based on risk criteria and comparing
the identified entries to supporting documentation. These included those posted to unexpected accounts;• assessing significant accounting estimates for bias.

94 Pendragon PLC Annual Report 2020
INDEPENDENT AUDITOR’S REPORT TO THE MEMBERS OF PENDRAGON PLC (CONTINUED)
5. Fraud and breaches of laws and regulations – ability to detect continued
We discussed with the Audit Committee other matters related to actual or suspected fraud, for which disclosure is not necessary, and considered any implications for our audit.
Identifying and responding to risks of material misstatement due to non-compliance with laws and regulations
We identified areas of laws and regulations that could reasonably be expected to have a material effect on the financial statements from our general commercial and sector experience, and through discussion with the directors and other management (as required by auditing standards), and from inspection of the Group’s regulatory and legal correspondence and discussed with the directors and other management the policies and procedures regarding compliance with laws and regulations.
As the Group is regulated, our assessment of risks involved gaining an understanding of the control environment including the entity’s procedures for complying with regulatory requirements.
We communicated identified laws and regulations throughout our team and remained alert to any indications of non-compliance throughout the audit.
The potential effect of these laws and regulations on the financial statements varies considerably.
Firstly, the Group is subject to laws and regulations that directly affect the financial statements including financial reporting legislation (including related companies legislation), distributable profits legislation, taxation legislation, and pension legislation and we assessed the extent of compliance with these laws and regulations as part of our procedures on the related financial statement items.
Secondly, the Group is subject to many other laws and regulations where the consequences of noncompliance could have a material effect on amounts or disclosures in the financial statements, for instance through the imposition of fines or litigation or the loss of the Group’s license to operate. We identified the following areas as those most likely to have such an effect: health and safety, antibribery, employment law, regulatory capital and liquidity and certain aspects of company legislation recognising the financial and regulated nature of the Group’s activities and its legal form. Auditing standards limit the required audit procedures to identify non-compliance with these laws and regulations to enquiry of the directors and other management and inspection of regulatory and legal correspondence, if any. Therefore, if a breach of operational regulations is not disclosed to us orevident from relevant correspondence, an audit will not detect that breach.
We discussed with the Audit Committee other matters related to actual or suspected breaches of laws or regulations, for which disclosure is not necessary, and considered any implications for our audit.
Context of the ability of the audit to detect fraud or breaches of law or regulation
Owing to the inherent limitations of an audit, there is an unavoidable risk that we may not have detected some material misstatements in the financial statements, even though we have properly planned and performed our audit in accordance with auditing standards. For example, the further removed non-compliance with laws and regulations is from the events and transactions reflected in the financial statements, the less likely the inherently limited procedures required by auditingstandards would identify it.
In addition, as with any audit, there remained a higher risk of non-detection of fraud, as these may involve collusion, forgery, intentional omissions, misrepresentations, or the override of internal controls. Our audit procedures are designed to detect material misstatement. We are not responsible for preventing non-compliance or fraud and cannot be expected to detect non-compliance with all laws and regulations.
6. We have nothing to report on the other information in the Annual Report
The directors are responsible for the other information presented in the Annual Report together with the financial statements. Our opinion on the financial statements does not cover the other information and, accordingly, we do not express an audit opinion or, except as explicitly stated below, any form of assurance conclusion thereon.
Our responsibility is to read the other information and, in doing so, consider whether, based on our financial statements audit work, the information therein is materially misstated or inconsistent with the financial statements or our audit knowledge. Based solely on that work we have not identified material misstatements in the other information.

95Pendragon PLC Annual Report 2020
INDEPENDENT AUDITOR’S REPORT TO THE MEMBERS OF PENDRAGON PLC (CONTINUED)
6. We have nothing to report on the other information in the Annual Report continued
Strategic report and directors’ reportBased solely on our work on the other information:• we have not identified material misstatements in the strategic report and the directors’ report;• in our opinion the information given in those reports for the financial year is consistent with the financial statements; and• in our opinion those reports have been prepared in accordance with the Companies Act 2006.
Directors’ remuneration reportIn our opinion the part of the Directors’ Remuneration Report to be audited has been properly prepared in accordance with the Companies Act 2006.
Disclosures of emerging and principal risks and longer-term viabilityWe are required to perform procedures to identify whether there is a material inconsistency between the directors’ disclosures in respect of emerging and principal risks and the viability statement, and the financial statements and our audit knowledge.Based on those procedures, we have nothing material to add or draw attention to in relation to:• the directors’ confirmation within the viability statement on page 49 that they have carried out a robust assessment of the
emerging and principal risks facing the Group, including those that would threaten its business model, future performance, solvency and liquidity;
• the emerging and principal risks disclosures on pages 42 to 48 describing these risks and how emerging risks are identified, and explaining how they are being managed and mitigated; and
• the directors’ explanation in the viability statement of how they have assessed the prospects of the Group, over what period they have done so and why they considered that period to be appropriate, and their statement as to whether they have a reasonable expectation that the Group will be able to continue in operation and meet its liabilities as they fall due over the period of their assessment, including any related disclosures drawing attention to any necessary qualifications or assumptions.
We are also required to review the viability statement, set out on page 49 under the Listing Rules. Based on the above procedures, we have concluded that the above disclosures are materially consistent with the financial statements and our audit knowledge.
Our work is limited to assessing these matters in the context of only the knowledge acquired during our financial statements audit. As we cannot predict all future events or conditions and as subsequent events may result in outcomes that are inconsistent with judgements that were reasonable at the time they were made, the absence of anything to report on these statements is not a guarantee as to the Group’s and Company’s longer-term viability.
Corporate governance disclosuresWe are required to perform procedures to identify whether there is a material inconsistency between the directors’ corporate governance disclosures and the financial statements and our audit knowledge.
Based on those procedures, we have concluded that each of the following is materially consistent with the financial statements and our audit knowledge:• the directors’ statement that they consider that the annual report and financial statements taken as a whole is fair,
balanced and understandable, and provides the information necessary for shareholders to assess the Group’s position and performance, business model and strategy;
• the section of the annual report describing the work of the Audit Committee, including the significant issues that the Audit Committee considered in relation to the financial statements, and how these issues were addressed; and
• the section of the annual report that describes the review of the effectiveness of the Group’s risk management and internal control systems.
We are required to review the part of Corporate Governance Report relating to the Group’s compliance with the provisions of the UK Corporate Governance Code specified by the Listing Rules for our review, and to report to you if a corporate governance statement has not been prepared by the company. We have nothing to report in these respects.
Based solely on our work on the other information described above:• with respect to the Corporate Governance Report disclosures about internal control and risk management systems in
relation to financial reporting processes and about share capital structures: • we have not identified material misstatements therein; and • the information therein is consistent with the financial statements; and• in our opinion, the Corporate Governance Report has been prepared in accordance with relevant rules of the Disclosure
Guidance and Transparency Rules of the Financial Conduct Authority.

96 Pendragon PLC Annual Report 2020
INDEPENDENT AUDITOR’S REPORT TO THE MEMBERS OF PENDRAGON PLC (CONTINUED)
7. We have nothing to report on the other matters on which we are required to report by exception
Under the Companies Act 2006, we are required to report to you if, in our opinion:• adequate accounting records have not been kept by the parent Company, or returns adequate for our audit have not been
received from branches not visited by us; or• the parent Company financial statements and the part of the Directors’ Remuneration Report to be audited are not in
agreement with the accounting records and returns; or• certain disclosures of directors’ remuneration specified by law are not made; or• we have not received all the information and explanations we require for our audit.
We have nothing to report in these respects.
8. Respective responsibilities
Directors’ responsibilitiesAs explained more fully in their statement set out on page 87, the directors are responsible for: the preparation of the financial statements including being satisfied that they give a true and fair view; such internal control as they determine is necessary to enable the preparation of financial statements that are free from material misstatement, whether due to fraud or error; assessing the Group and parent Company’s ability to continue as a going concern, disclosing, as applicable, matters related to going concern; and using the going concern basis of accounting unless they either intend to liquidate the Group or the parent Company or to cease operations, or have no realistic alternative but to do so.
Auditor’s responsibilitiesOur objectives are to obtain reasonable assurance about whether the financial statements as a whole are free from material misstatement, whether due to fraud or error, and to issue our opinion in an auditor’s report. Reasonable assurance is a high level of assurance, but does not guarantee that an audit conducted in accordance with ISAs (UK) will always detect a material misstatement when it exists. Misstatements can arise from fraud or error and are considered material if, individually or in aggregate, they could reasonably be expected to influence the economic decisions of users taken on the basis of the financial statements.
A fuller description of our responsibilities is provided on the FRC’s website at www.frc.org.uk/auditorsresponsibilities.
9. The purpose of our audit work and to whom we owe our responsibilities
This report is made solely to the Company’s members, as a body, in accordance with Chapter 3 of Part 16 of the Companies Act 2006 and the terms of our engagement by the Company. Our audit work has been undertaken so that we might state to the Company’s members those matters we are required to state to them in an auditor’s report and the further matters we are required to state to them in accordance with the terms agreed with the Company, and for no other purpose. To the fullest extent permitted by law, we do not accept or assume responsibility to anyone other than the Company and the Company’s members, as a body, for our audit work, for this report, or for the opinions we have formed.
John Leech (Senior Statutory Auditor)for and on behalf of KPMG LLP, Statutory Auditor
Chartered AccountantsOne Snowhill, Snowhill Queensway, Birmingham B4 6GH24 March 2021

97Pendragon PLC Annual Report 2020
CONSOLIDATED INCOME STATEMENTYear ended 31 December 2020
Notes
Continuing operations
£m
Discontinuedoperations*
£m2020
£m
Continuing operations
£m
Discontinuedoperations*
£m2019
£m
Revenue 2.1 2,766.7 157.9 2,924.6 4,083.8 422.3 4,506.1
Cost of sales (2,436.8) (134.6) (2,571.4) (3,667.8) (365.6) (4,033.4)
Gross profit 329.9 23.3 353.2 416.0 56.7 472.7
Operating expenses 2.2 (317.1) (20.1) (337.2) (533.1) (44.0) (577.1)
Operating profit/(loss) before other income 12.8 3.2 16.0 (117.1) 12.7 (104.4)
Other income - (losses)/gains on the sale of businesses and property, plant and equipment
2.6 (0.3) (6.5) (6.8) 0.3 33.0 33.3
Operating profit/(loss) 12.5 (3.3) 9.2 (116.8) 45.7 (71.1)
Analysed as:
Underlying operating profit 42.7 3.2 45.9 14.0 12.7 26.7
Non-underlying operating (loss)/ profit (30.2) (6.5) (36.7) (130.8) 33.0 (97.8)
Finance expense 4.3 (39.0) (0.8) (39.8) (42.9) (3.1) (46.0)
Finance income 4.3 1.0 - 1.0 3.0 - 3.0
Net finance costs (38.0) (0.8) (38.8) (39.9) (3.1) (43.0)
Analysed as:
Underlying net finance costs (36.9) (0.8) (37.7) (40.0) (3.1) (43.1)
Non-underlying net finance costs (1.1) - (1.1) 0.1 - 0.1
(Loss)/profit before taxation (25.5) (4.1) (29.6) (156.7) 42.6 (114.1)
Analysed as:
Underlying profit/(loss) before taxation 5.8 2.4 8.2 (26.0) 9.6 (16.4)
Non-underlying (loss)/profit before taxation (31.3) (6.5) (37.8) (130.7) 33.0 (97.7)
Income tax credit/(expense) 2.7 3.9 1.0 4.9 7.8 (11.1) (3.3)
(Loss)/profit for the year (21.6) (3.1) (24.7) (148.9) 31.5 (117.4)
Analysed as:
Underlying profit/(loss) after taxation 6.0 3.0 9.0 (23.8) 7.4 (16.4)
Non-underlying (loss)/profit after taxation (27.6) (6.1) (33.7) (125.1) 24.1 (101.0)
Earnings per share
Basic earnings per share 2.8 (1.6p) (0.2p) (1.8p) (10.7p) 2.3p (8.4p)
Diluted earnings per share 2.8 (1.6p) (0.2p) (1.8p) (10.7p) 2.3p (8.4p)
Non GAAP measure:
Underlying basic earnings per share 2.8 (0.3p) 0.9p 0.6p (1.8p) (0.6p) (1.2p)
Underlying diluted earnings per share 2.8 (0.3p) 0.9p 0.6p (1.8p) (0.6p) (1.2p) * The discontinued operations are in respect of the Group’s US business which is currently classified as held for sale (see note 3.3). The notes on pages 103 to 181 form part of these financial statements

98 Pendragon PLC Annual Report 2020
CONSOLIDATED STATEMENT OF COMPREHENSIVE INCOMEYear ended 31 December 2020
Notes2020
£m2019
£m
Loss for the year (24.7) (117.4)
Other comprehensive income
Items that will never be reclassified to profit and loss:
Defined benefit plan remeasurement gains and (losses) 5.1 (24.6) (1.3)
Income tax relating to defined benefit plan remeasurement (gains) and losses 2.7 5.7 0.2
(18.9) (1.1)
Items that are or may be reclassified to profit and loss:
Foreign currency translation differences of foreign operations - (0.2)
- (0.2)
Other comprehensive income for the year, net of tax (18.9) (1.3)
Total comprehensive income for the year (43.6) (118.7)
Total comprehensive income for the period attributable to equity shareholders of the company arises from:
Continuing operations (40.5) (150.0)
Discontinued operations - see note 3.3 (3.1) 31.3
(43.6) (118.7)
The notes on pages 103 to 181 form part of these financial statements

99Pendragon PLC Annual Report 2020
CONSOLIDATED STATEMENT OF CHANGES IN EQUITYYear ended 31 December 2020
Share capital
£m
Share premium
£m
Capital redemption
reserve£m
Otherreserves
£m
Translationdifferences
£m
Retainedearnings
£mTotal
£m
Balance at 1 January 2020 69.9 56.8 5.6 12.6 (1.0) 25.0 168.9
Total comprehensive income for 2020
Loss for the year - - - - - (24.7) (24.7)
Other comprehensive income for the year, net of tax
- - - - - (18.9) (18.9)
Total comprehensive income for the year - - - - - (43.6) (43.6)
Share based payments - - - - - 1.2 1.2
Income tax relating to share based pay-ments
- - - - - 0.2 0.2
Balance at 31 December 2020 69.9 56.8 5.6 12.6 (1.0) (17.2) 126.7
Balance at 1 January 2019 70.0 56.8 5.5 12.6 (0.8) 201.5 345.6
Adjustment on initial application of IFRS 16 (net of tax)
- - - - - (48.4) (48.4)
Adjusted balance at 1 January 2019 70.0 56.8 5.5 12.6 (0.8) 153.1 297.2
Total comprehensive income for 2019
Loss for the year - - - - - (117.4) (117.4)
Other comprehensive income for the year, net of tax
- - - - (0.2) (1.1) (1.3)
Total comprehensive income for the year - - - - (0.2) (118.5) (118.7)
Dividends paid (note 4.5) - - - - - (9.7) (9.7)
Own shares purchased for cancellation (0.1) - 0.1 - - (0.5) (0.5)
Share based payments - - - - - 0.6 0.6
Balance at 31 December 2019 69.9 56.8 5.6 12.6 (1.0) 25.0 168.9
The notes on pages 103 to 181 form part of these financial statements

100 Pendragon PLC Annual Report 2020
CONSOLIDATED BALANCE SHEETAt 31 December 2020
Notes2020
£m2019
£m
Non-current assets
Property, plant and equipment 3.2 572.8 628.3
Goodwill 3.1 150.3 162.8
Other intangible assets 3.1 10.2 9.5
Finance lease receivables 16.6 20.6
Deferred tax assets 2.7 36.4 25.5
Total non-current assets 786.3 846.7
Current assets
Inventories 3.4 608.8 839.0
Trade and other receivables (includes £0.2m due in over 1 year) 3.6 94.6 106.9
Finance lease receivables 2.0 2.4
Current tax assets 1.4 -
Cash and cash equivalents 4.2 56.0 55.7
Assets classified as held for sale 3.3 99.0 150.1
Total current assets 861.8 1,154.1
Total assets 1,648.1 2,000.8
Current liabilities
Lease liabilities (24.5) (23.9)
Trade and other payables 3.7 (834.9) (1,084.6)
Deferred income 3.8 (42.9) (50.9)
Current tax payable - (2.8)
Liabilities directly associated with the assets held for sale 3.3 (67.3) (90.5)
Total current liabilities (969.6) (1,252.7)
Non-current liabilities
Interest bearing loans and borrowings 4.2 (156.4) (175.4)
Lease liabilities (218.7) (237.8)
Trade and other payables 3.7 (60.4) (60.4)
Deferred income 3.9 (40.8) (46.6)
Retirement benefit obligations 5.1 (75.5) (59.0)
Total non-current liabilities (551.8) (579.2)
Total liabilities (1,521.4) (1,831.9)
Net assets 126.7 168.9
Capital and reserves
Called up share capital 4.4 69.9 69.9
Share premium account 4.4 56.8 56.8
Capital redemption reserve 4.4 5.6 5.6
Other reserves 4.4 12.6 12.6
Translation reserve 4.4 (1.0) (1.0)
Retained earnings (17.2) 25.0
Total equity attributable to equity shareholders of the Company 126.7 168.9
Approved by the Board of Directors on 24 March 2021 and signed on its behalf by:
W Berman M S WillisChief Executive Chief Finance Officer
The notes on pages 103 to 181 form part of these financial statementsRegistered Company Number: 02304195

101Pendragon PLC Annual Report 2020
CONSOLIDATED CASH FLOW STATEMENTYear ended 31 December 2020
Notes2020
£m
Restated - see Section 1
2019£m
Cash flows from operating activities
Loss for the year (24.7) (117.4)
Adjustment for taxation (4.9) 3.3
Adjustment for net financing expense 38.8 43.0
9.2 (71.1)
Depreciation and amortisation 43.7 44.7
Share based payments 1.2 0.6
Pension past service costs 3.3 (4.8)
Loss/(profit) on sale of businesses and property, plant and equipment 6.8 (33.3)
Impairment of goodwill 12.5 102.4
Impairment of assets held for sale 0.8 1.9
Impairment of property, plant and equipment 3.2 25.9
Contribution into defined benefit pension scheme (12.5) (7.6)
Changes in inventories 3.4 294.8 186.7
Changes in trade and other receivables 23.4 1.7
Changes in trade and other payables (267.6) (127.4)
Movement in contract hire vehicle balances 3.5 (51.3) (55.6)
Cash generated from operations 67.5 64.1
Taxation paid (4.4) (3.3)
Bank and stocking interest paid (20.5) (26.8)
Lease interest paid (14.0) (14.4)
Lease interest received 1.0 1.1
Net cash from operating activities 29.6 20.7
Cash flows from investing activities
Proceeds from sale of businesses 6.1 16.6 67.4
Purchase of property, plant, equipment and intangible assets 3.1, 3.2 (60.2) (115.0)
Proceeds from sale of property, plant, equipment and intangible assets 3.1, 3.2 61.6 70.6
Receipt of lease receivables 1.9 2.2
Net cash from investing activities 19.9 25.2
Cash flows from financing activities
Dividends paid to shareholders - (9.7)
Repurchase of own shares - (0.5)
Payment of lease liabilities (28.7) (28.8)
Repayment of loans (40.0) (5.0)
Proceeds from issue of loans (net of directly attributable transaction costs) 18.2 5.4
Net cash outflow from financing activities (50.5) (38.6)
Net (decrease)/increase in cash and cash equivalents (1.0) 7.3
Cash and cash equivalents at 1 January 55.7 51.4
Effects of exchange rate changes on cash held 1.3 (3.0)
Cash and cash equivalents at 31 December 4.2 56.0 55.7
The notes on pages 103 to 181 form part of these financial statements
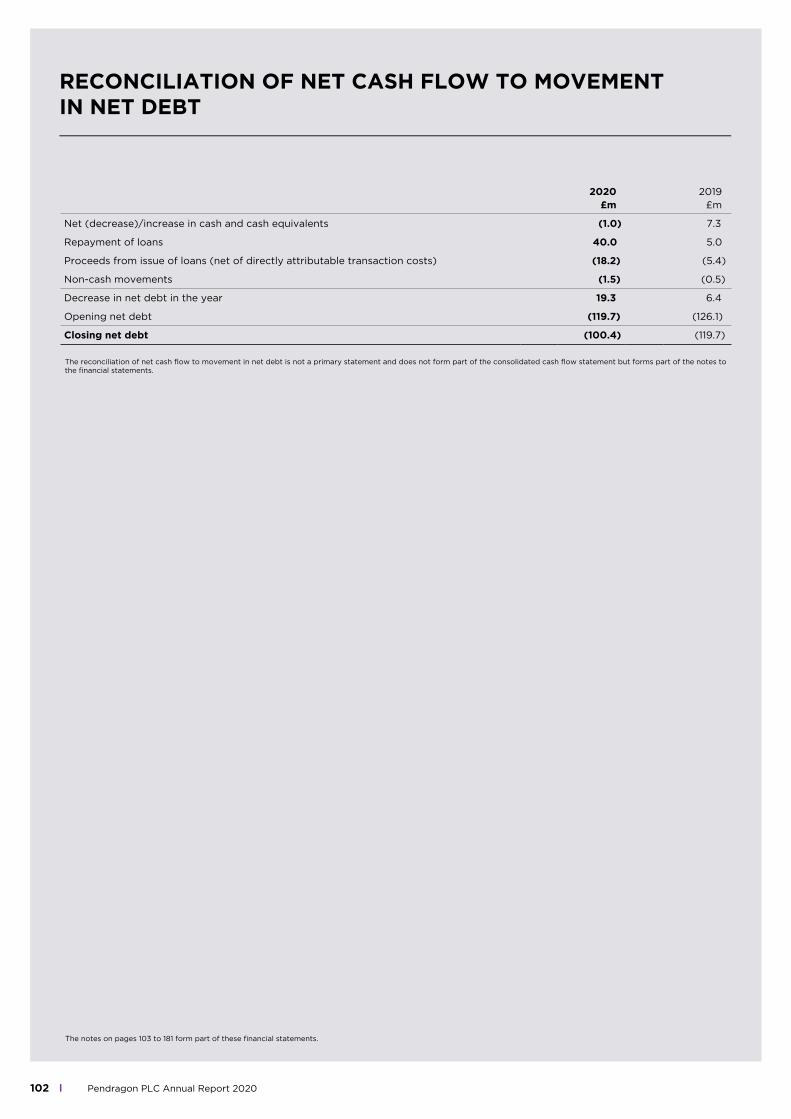
102 Pendragon PLC Annual Report 2020
RECONCILIATION OF NET CASH FLOW TO MOVEMENTIN NET DEBT
2020£m
2019£m
Net (decrease)/increase in cash and cash equivalents (1.0) 7.3
Repayment of loans 40.0 5.0
Proceeds from issue of loans (net of directly attributable transaction costs) (18.2) (5.4)
Non-cash movements (1.5) (0.5)
Decrease in net debt in the year 19.3 6.4
Opening net debt (119.7) (126.1)
Closing net debt (100.4) (119.7)
The reconciliation of net cash flow to movement in net debt is not a primary statement and does not form part of the consolidated cash flow statement but forms part of the notes to the financial statements.
The notes on pages 103 to 181 form part of these financial statements.

103Pendragon PLC Annual Report 2020
NOTES TO THE FINANCIAL STATEMENTS
SECTION 1 - BASIS OF PREPARATION
Presented below are those accounting policies that relate to the financial statements as a whole and includes details of new
accounting standards that are or will be effective for 2020 or later years. To facilitate the understanding of each note to the
financial statements those accounting policies that are relevant to a particular category are presented within the relevant
notes.
Pendragon PLC is a Group domiciled in the United Kingdom. The consolidated financial statements of the Group for
the year ended 31 December 2020 comprise the Group and its subsidiaries and the Group’s interest in jointly controlled
entities, together referred to as the ‘Group’.
The Group financial statements have been prepared in accordance with international accounting standards in conformity
with the requirements of the Companies Act 2006 and in accordance with International Financial Reporting Standards
(“adopted IFRS”) adopted pursuant to Regulation (EC) No 1606/2002 as it applies in the European Union.
The Group has elected to prepare its parent Group financial statements in accordance with FRS 101. These are presented
on pages 182 to 193.
The financial statements are presented in millions of UK pounds, rounded to the nearest £0.1m. They have been prepared
under the historical cost convention and where other bases are applied these are identified in the relevant accounting
policy in the notes below.
Going concern
The financial statements are prepared on a going concern basis notwithstanding that the Group has reported a loss before
tax of £29.6m (2019: loss of £114.1m). The directors consider that the current economic outlook presents significant
uncertainty in terms of sales volume and pricing and that the threat from further COVID-19 lockdowns and the risk of
rising unemployment as Government support measures are gradually withdrawn present uncertainties to future trading
conditions. Whilst the directors have instituted measures to preserve cash and reduce costs, there is uncertainty over
future trading results and cash flows.
The Group meets its day-to-day working capital requirements from a revolving credit facility of £175.0m and senior note
of £60m (see Note 4.2) together with manufacturer stocking facilities and cash balances. The revolving credit facility is
due for renewal on 1 March 2023 and includes covenants, a breach of which would result in the amounts drawn becoming
repayable on demand. The Group did not require use of Government backed borrowing facilities such as the Coronavirus
large business interruption loan scheme. The Group remained compliant with its banking covenants throughout the year
to 31 December 2020.
The Group instigated a number of mitigating actions to protect it against the financial impact of the dealership closures
required by the Government’s measures to combat COVID-19. This included accessing Government support measures
such as the Coronavirus job retention scheme, utilising the retail discount scheme for rates and deferring VAT, as well
as utilising support measures from vehicle manufacturers and stocking loan providers to extend payment periods, in
particular during the first national lockdown. The Group also reviewed its level of planned capital expenditure and either
cancelled or postponed certain projects.
The Directors have assessed the potential on-going impacts of the COVID-19 pandemic coupled with wider economic
disruption and have scenario modelled a base cash flow forecast for the period to 31 December 2022, the going concern
assessment period. This forecast has considered externally sourced economic forecasts to determine the outlook for
vehicle volume forecasts through-out the period being assessed. The base case forecast includes the benefit of the
previously announced cost reduction programmes and the assumption of the successful completion of the previously
announced transaction to dispose of the remaining US dealership. This forecast assumes low levels of market growth.

104 Pendragon PLC Annual Report 2020
Key judgements Effect on Financial Statements
Alternative accounting judgement that could have been applied
Effect of that alternative accounting judgement
Deferred tax assets:
No recognition of certain deferred tax assets as the Group believes their recovery to be too uncertain.
No recognition of potential assets of £10.6m relating to unutilised tax losses of £13.8m and unrecognised net capital losses of £41.9m.
If the Group had determined that the utilisation of the losses was more certain then full or partial recognition of deferred tax assets would have taken place.
Recognition of assets within the range £0- £10.6m.
SECTION 1 - BASIS OF PREPARATION
Going concern Continued
The Directors have also prepared a severe but plausible downside scenario. The scenario removes the disposal of the final
US dealership, assumes two further one-month national lockdowns without Government support measures in the next 12
months, and includes the impact of a reasonable downside contraction in sales volumes and margins which is below that
experienced in 2020. The Group believes that it would be able to withstand the conditions of this severe but plausible
downside scenario with the mitigations available to it and wholly within its control, principally being the curtailment of
uncommitted investment capital expenditure. In this scenario, the Group remain within its facility limits and in covenant
compliance, although headroom is limited.
Those forecasts indicate that the Group can continue to operate for at least the next 12 months from the date of approval
of these financial statements with the existing facilities. The base and severe but plausible downside forecasts indicate that
the Group will remain in compliance with the Group’s covenants.
Based on the above, the Directors believe it remains appropriate to prepare the financial statements on a going concern
basis.
Prior year adjustment
The Group has made adjustments to the presentation of the comparative Consolidated Cash Flow Statement. Receipt of
lease receivables (£2.2m) has been presented in investing activities as it relates such activities, whereas in the previous
financial statements it was included in financing activities. The Group has also presented cash flows for the interest portion
of the lease liability and finance lease receivable as operating cash flows, consistent with the Groups policy for presenting
interest paid/received in the cash flow statement. In the previous financial statements these amounts of £14.4m and £1.1m
respectively were including in financing cash flows. As a result of these reclassifications net cash from operating activities
for 2019 reduced from £34.0m to £20.7m. These reclassifications have no effect on total cash flows in the comparative
period.
Judgements
The Group applies judgement in how it applies its accounting policies, which do not involve estimation, but could materially
affect the numbers disclosed in these financial statements. The key accounting judgements, without estimation, that have
been applied in these financial statements are as follows:
NOTES TO THE FINANCIAL STATEMENTS

105Pendragon PLC Annual Report 2020
Key estimate area Key assumption
Potential impact within the next financial year
Potential impact in the longer term
Note reference
CGU asset impairment
To determine any possible impairment of our goodwill, intangible assets, property, plant and equipment we undertake an exercise to estimate the recoverable amount for each Cash Generating Unit (CGU). We have key assumptions on the growth, discount rates and multiples applied to the financial year 2021 budget as well as the fair value of individual assets.
✓ ✓ 3.1
Inventory fair value(UK used inventory of£215.4m (2019: £330.3m))
The Group assessment of fair values of used inventory involves an element of estimation. The key assumption is estimating the likely sale period and the expected profit or loss on sale for each of our inventory items that are held at the year end point. We conduct this analysis by looking at stock by age category and comparing historical trends and our forward expectations on these assumptions.
✓ 3.4
Retirement benefit obligations
The main assumptions in determining the Group’s Retirement Benefit Obligations are: discount rate, mortality and rate of inflation. Full detail is included in the pension note, 5.1.
✓ ✓ 5.1
SECTION 1 - BASIS OF PREPARATION
Accounting Estimates
The preparation of financial statements in conformity with adopted IFRSs requires the use of estimates and assumptions
that affect the reported amounts of assets and liabilities at the date of the financial statements and the reported amounts of
revenues and expenses during the reporting year. Although these estimates are based on management’s best knowledge
of the amount, events or actions, actual results ultimately may differ from those estimates.
The estimates and underlying assumptions are reviewed on an ongoing basis. The estimates and associated assumptions
are based on historical experience and various other factors that are believed to be reasonable under the circumstances.
Revisions to accounting estimates are recognised in the period in which the estimate is revised if the revision affects only
that period, or in the period of the revision and future periods if the revision affects both current and future periods. The
Directors consider the following to be the key estimates applicable to the financial statements, which have a significant risk
of resulting in a material adjustment to the carrying amounts of assets and liabilities within the next financial year or in the
long term:
Basis of consolidation
The consolidated financial statements include the financial statements of Pendragon PLC, all its subsidiary undertakings
and investments. Consistent accounting policies have been applied in the preparation of all such financial statements.
Subsidiaries
Subsidiaries are entities controlled by the Group. The Group controls an entity when it is exposed to, or has rights to,
variable returns from its involvement with the entity and has the ability to affect those returns through its power over the
entity. The financial statements of subsidiaries are included in the consolidated financial statements from the date that
control commences until the date that control ceases.
Transactions eliminated on consolidation
Intragroup balances and any unrealised gains or losses or income and expenses arising from intragroup transactions, are
eliminated in preparing the consolidated financial statements.
NOTES TO THE FINANCIAL STATEMENTS

106 Pendragon PLC Annual Report 2020
NOTES TO THE FINANCIAL STATEMENTS
SECTION 1 - BASIS OF PREPARATION
Foreign currencies
Transactions in foreign currencies are translated to the respective functional currency of Group entities at the foreign
exchange rate ruling at the date of the transaction. Monetary assets and liabilities denominated in foreign currencies at the
balance sheet date are translated to the functional currency at the foreign exchange rate ruling at that date. Non-monetary
assets and liabilities that are measured in terms of historical cost in a foreign currency are translated using the exchange
rate at the date of the transaction. Non-monetary assets and liabilities denominated in foreign currencies that are stated
at fair value are translated to sterling at foreign exchange rates ruling at the dates the fair value was determined. Foreign
currency differences arising on retranslation are recognised in profit or loss.
The assets and liabilities of foreign operations, including goodwill and fair value adjustments arising on consolidation, are
translated to sterling at foreign exchange rates ruling at the balance sheet date. The revenues and expenses of foreign
operations are translated to sterling at rates approximating to the foreign exchange rates ruling at the dates of the
transactions.
Foreign currency differences arising on the retranslation of a financial liability designated as a hedge of a net investment
in a foreign operation are recognised directly in equity, in the foreign currency translation reserve, to the extent the hedge
is effective. To the extent the hedge is ineffective, such differences are recognised in profit or loss. When the hedged net
investment is disposed of, the cumulative amount in equity is transferred to profit and loss on disposal.
In respect of all foreign operations, any differences that have arisen after 1 January 2004, the date of transition to IFRS, are
presented as a separate component of equity.
Cash and cash equivalents
For the purposes of the cash flow statement, cash and cash equivalents comprise deposits with banks and financial
institutions, bank and cash balances, and liquid investments, net of bank overdrafts. Bank overdrafts that are repayable
on demand and form an integral part of the Group’s cash management are included as a component of cash and cash
equivalents for the purpose of the statement of cash flows. In the balance sheet, bank overdrafts are included in current
borrowings.
Government grants
Government grants are recognised when there is reasonable assurance the grants will be received and the conditions
of the grant will be complied with. Income from government grants during 2020 of £42.3m, being the Coronavirus Job
Retention Scheme, is included within payroll expenses. A further £10.1m benefit has been received by way of business rates
relief during 2020 by way of waivers to these charges.
Impairment
The carrying amounts of the Group’s assets, other than inventories (see note 3.4) and deferred tax assets (see note 2.7),
are reviewed at each balance sheet date to determine whether there is any indication of impairment. If any such indication
exists, the asset’s recoverable amount is estimated.
For goodwill the recoverable amount is estimated at each balance sheet date. The recoverable amount is the higher of fair
value less costs to sell and value in use. In assessing value in use, the estimated future cash flows are discounted to their
present value using a pre-tax discount rate that reflects current market assessments of the time value of money and the
risks specific to the asset for which the estimates of future cash flows have not been adjusted.
In assessing fair value less costs to sell, the estimated future cash flows are multiplied by an appropriate trading multiple
or by assessing the fair value of the individual assets.

107Pendragon PLC Annual Report 2020
NOTES TO THE FINANCIAL STATEMENTS
SECTION 1 - BASIS OF PREPARATION
Impairment continued
For the purpose of impairment testing, assets are grouped together into the smallest group of assets that generates cash
inflows from continuing use that are largely independent of the cash inflows from other groups of assets (‘the cash generating
unit’). The goodwill acquired in a business combination, for the purpose of impairment testing is allocated to cash generating
units. Management have determined that the cash generating units of the Group are the motor franchise groups and other
business segments.
An impairment loss is recognised whenever the carrying amount of an asset or its cash generating unit exceeds its recoverable
amount. Impairment losses are recognised in the income statement.
Impairment losses recognised in respect of cash generating units are allocated first to reduce the carrying amount of any
goodwill allocated to cash generating units and then, to reduce the carrying amount of the other assets in the unit on a
pro-rata basis.
An impairment loss in respect of goodwill is not reversed. In respect of other assets, an impairment loss is reversed if there
has been a change in the estimates used to determine the recoverable amount. An impairment loss is reversed only to the
extent that the asset’s carrying amount does not exceed the carrying amount that would have been determined, net of
depreciation or amortisation, if no impairment loss had been recognised. The impact of the current year impairment review
can be seen in note 3.1.
Adoption of new and revised standards and new standards and interpretations not yet adopted
In 2020 the following amendments had been endorsed by the EU, became effective and therefore were adopted by the Group:
• Amendment to IFRS 16, ‘Leases’ – Covid-19 related rent concessions
• Definition of Material – Amendments to IAS 1 and IAS 8
Other standards
A number of new standards, amended standards and interpretations are effective for annual periods beginning after 1
January 2021 and earlier application is permitted; however, the Group has not early adopted the new or amended standards
in preparing these consolidated financial statements. The following new standards, amended standards and interpretations
are not expected to have a significant impact on the Group’s consolidated financial statements.
• IFRS 17 Insurance Contracts
• Amendments to IFRS 17 and IFRS 4, ‘Insurance contracts’, deferral of IFRS 9
• Amendments to IFRS 9, IAS 39, IFRS 7, IFRS 4 and IFRS 16 Interest Rate Benchmark Reform – Phase 1 and 2
Alternative performance measures
The Group uses a number of key performance measures (‘KPI’s’) which are non-IFRS measures to monitor the performance
of its operations. The Group believes these KPIs provide useful historical financial information to help investors and other
stakeholders evaluate the performance of the business and are measures commonly used by certain investors for evaluating
the performance of the Group. In particular, the Group uses KPIs which reflect the underlying performance on the basis that
this provides a more relevant focus on the core business performance of the Group. The Group has been using the following
KPIs on a consistent basis and they are defined and reconciled as follows:
Dividend per share - dividend per share is defined as the interim dividend per share plus the proposed final year dividend
per share for a given period.

108 Pendragon PLC Annual Report 2020
SECTION 1 - BASIS OF PREPARATION
Operating profit/(loss) reconciliation
2020£m
2019£m
Underlying operating profit 45.9 26.7
Settlement of historic VAT issues (see note 2.6) - 1.6
(Losses)/gains on the sale of businesses and property, plant and equipment (see note 2.6) (6.8) 33.3
Past service costs (see note 2.6) (3.3) 4.8
Pension scheme administration costs (see note 2.6) (1.0) -
Impairment of goodwill (see note 2.6) (12.5) (102.4)
Impairment of assets held for sale (see note 2.6) (0.8) (1.9)
Impairment of property, plant and equipment (see note 2.6) - (2.6)
Impairment of right of use assets (see note 2.6) (3.2) (23.3)
Car Store and other business closure costs (see note 2.6) (2.8) (1.8)
Termination and severance payments (see note 2.6) (6.3) (5.5)
Non-underlying operating (loss) items (36.7) (97.8)
Operating profit/(loss) 9.2 (71.1)
(Loss)/profit before tax reconciliation
2020£m
2019£m
Underlying profit/(loss) before tax 8.2 (16.4)
Non-underlying operating (loss) items (see reconciliation above) (36.7) (97.8)
Non-underlying net finance (costs)/income (see note 2.6) (1.1) 0.1
Non-underlying operating (loss) and finance costs items (37.8) (97.7)
(Loss) before tax (29.6) (114.1)
(Loss)/profit after tax reconciliation
2020£m
2019£m
Underlying profit/(loss) after tax 9.0 (16.4)
Non-underlying operating (loss) and finance costs items (see reconciliation above) (37.8) (97.7)
Non-underlying tax (see note 2.6) 4.1 (3.3)
Non-underlying operating (loss)/profit, finance costs and tax items (33.7) (101.0)
(Loss) after tax (24.7) (117.4)
NOTES TO THE FINANCIAL STATEMENTS
Gross margin % - gross margin is defined as gross profit as a percentage of revenue.
Operating margin % - operating margin is defined as operating profit as a percentage of revenue.
Underlying operating profit/profit before tax - results on an underlying basis exclude items that have non-trading attributes
due to their size, nature or incidence. The detail of the non-underlying results is shown in note 2.6 and this is also shown on
the face of the consolidated income statement to reconcile from the underlying to total results.
Trading Dealerships
There are dealerships that were trading at 31 December 2020

109Pendragon PLC Annual Report 2020
SECTION 1 - BASIS OF PREPARATION
Underlying basic earnings per share (‘underlying earnings per share’) – the Group presents underlying basic earnings per
share as the directors consider that this is a better measure of comparative performance. Underlying basic earnings per share
is calculated by dividing the underlying profit or loss attributable to ordinary shareholders by the weighted average number
of ordinary shares in issue during the period. A full reconciliation of how this is derived is found in note 2.8.
Underlying diluted earnings per share – the Group presents underlying diluted earnings per share as the directors consider
that this is a better measure of comparative performance. Underlying diluted earnings per share is calculated by dividing the
underlying profit and loss attributable to ordinary shareholders by the weighted average number of ordinary shares in issue
taking account of the effects of all dilutive potential ordinary shares, which comprise of share options granted to employees,
LTIPs and share warrants. A full reconciliation of how this is derived is found in note 2.8.
Leverage ratio – the Group uses the ratio of net debt to underlying EBITDA to assess the use of the Group’s financial
resources. The reconciliation of this and the composition of underlying EBITDA is shown in note 4.2.
Net franchise capital expenditure - total franchise specific (manufacturer new vehicle partners) capital expenditure incurred
in the period less franchise specific disposal proceeds.
NOTES TO THE FINANCIAL STATEMENTS

110 Pendragon PLC Annual Report 2020
Revenues by Department - Franchised UK Motor
Group revenue
2020£m
Disposals revenue
2020£m
Other non like-for-like
revenue2020
£m
Like-for-likerevenue
2020£m
Group revenue
2019£m
Disposals revenue
2019£m
Other non like-for-like
revenue2019
£m
Like-for-likerevenue
2019£m
Aftersales revenue 226.3 (4.9) (2.6) 218.8 326.2 (26.8) (1.5) 297.9
Used vehicle revenue 1,157.5 (41.4) (4.3) 1,111.8 1,702.5 (184.5) - 1,518.0
New vehicle revenue 1,208.0 (11.1) (7.7) 1,189.2 1,702.1 (96.1) - 1,606.0
Total Revenue 2,591.8 (57.4) (14.6) 2,519.8 3,730.8 (307.4) (1.5) 3,421.9
Revenues by Department - Car Store
Group revenue
2020£m
Disposals revenue
2020£m
Other non like-for-like
revenue2020
£m
Like-for-likerevenue
2020£m
Group revenue
2019£m
Disposals revenue
2019£m
Other non like-for-like
revenue2019
£m
Like-for-likerevenue
2019£m
Aftersales revenue - - - - 2.5 (2.5) - -
Used vehicle revenue 88.5 (0.3) - 88.2 267.8 (131.8) - 136.0
Total Revenue 88.5 (0.3) - 88.2 270.3 (134.3) - 136.0
Revenues by Department - Franchised US Motor
Group revenue
2020£m
Disposals revenue
2020£m
Other non like-for-like
revenue2020
£m
Like-for-likerevenue
2020£m
Group revenue
2019£m
Disposals revenue
2019£m
Other non like-for-like
revenue2019
£m
Like-for-likerevenue
2019£m
Aftersales revenue 17.3 (0.3) - 17.0 40.7 (19.0) - 21.7
Used vehicle revenue 22.0 (1.1) - 20.9 75.7 (59.2) - 16.5
New vehicle revenue 118.6 (2.2) - 116.4 305.9 (162.3) - 143.6
Total Revenue 157.9 (3.6) - 154.3 422.3 (240.5) - 181.8
SECTION 1 - BASIS OF PREPARATION
NOTES TO THE FINANCIAL STATEMENTS
Like-for-like reconciliations
Like-for-like - results on a like-for-like basis include only businesses which have been trading for 12 consecutive months.
We use like-for-like results to aid in the understanding of the like-for-like movement in revenue, gross profit and operating
profit in the business. The difference to underlying results are simply those businesses which are not like-for-like which have
recently commenced operation and therefore do not have a 12 month history plus any retail points closed during the current
or previous period.

111Pendragon PLC Annual Report 2020
SECTION 1 - BASIS OF PREPARATION
Gross profit by Department - Franchised UK Motor
Group gross profit
2020£m
Disposals gross profit
2020£m
Other non like-for-likegross profit
2020 £m
Like-for-likegross profit
2020£m
Group gross profit
2019£m
Disposals gross profit
2019£m
Other non like-for-likegross profit
2019 £m
Like-for-likegross profit
2019£m
Aftersales gross profit 111.2 (1.7) (0.9) 108.6 161.5 (12.4) (0.7) 148.4
Used vehicle gross profit 99.5 (2.4) (0.3) 96.8 105.2 (6.5) - 98.7
New vehicle gross profit 79.1 (0.5) (1.1) 77.5 104.9 (5.8) - 99.1
Total Gross profit 289.8 (4.6) (2.3) 282.9 371.6 (24.7) (0.7) 346.2
Gross profit by Department - Car Store
Group gross profit
2020£m
Disposals gross profit
2020£m
Other non like-for-likegross profit
2020 £m
Like-for-likegross profit
2020£m
Group gross profit
2019£m
Disposals gross profit
2019£m
Other non like-for-likegross profit
2019 £m
Like-for-likegross profit
2019£m
Aftersales gross profit - - - - (1.8) 1.8 - -
Used vehicle gross profit 7.3 0.1 - 7.4 12.7 (4.6) - 8.1
Total Gross profit 7.3 0.1 - 7.4 10.9 (2.8) - 8.1
Gross profit by Department - US Motor
Group gross profit
2020£m
Disposals gross profit
2020£m
Other non like-for-likegross profit
2020 £m
Like-for-likegross profit
2020£m
Group gross profit
2019£m
Disposals gross profit
2019£m
Other non like-for-likegross profit
2019 £m
Like-for-likegross profit
2019£m
Aftersales gross profit 9.1 (0.2) - 8.9 21.1 (10.4) - 10.7
Used gross profit 1.7 - - 1.7 5.7 (4.6) - 1.1
New vehicle gross profit 12.5 (0.3) - 12.2 29.9 (17.5) - 12.4
Total Gross profit 23.3 (0.5) - 22.8 56.7 (32.5) - 24.2
Underlying operating profit/(loss)
Group underlying operating
profit/(loss)2020
£m
Disposals underlying operating
profit2020
£m
Other non like-for-like underlying operating
profit2020
£m
Like-for-likeunderlying operating
profit2020
£m
Group underlying operating
profit/(loss)2019£m
Disposals underlying operating
profit2019£m
Other non like-for-like underlying operating
profit2019 £m
Like-for-likeunderlying operating
profit2019£m
Franchised UK Motor 18.5 12.2 (0.7) 30.0 13.0 13.0 0.5 26.5
Car Store (1.2) 0.2 - (1.0) (25.2) 18.6 - (6.6)
Software 12.1 - - 12.1 13.4 - - 13.4
Leasing 13.3 - - 13.3 12.8 - - 12.8
US Motor 3.2 0.7 - 3.9 12.7 (2.4) - 10.3
Total underlying operating profit
45.9 13.1 (0.7) 58.3 26.7 29.2 0.5 56.4
NOTES TO THE FINANCIAL STATEMENTS

112 Pendragon PLC Annual Report 2020
SECTION 2 - RESULTS AND TRADING
This section contains the notes and information to support the results presented in the income statement:
2.1 Revenue 2.5 Audit fees
2.2 Net operating expenses 2.6 Non-underlying items
2.3 Operating segments 2.7 Taxation
2.4 Staff costs 2.8 Earnings per share
2.1 Revenue
Accounting policy
Revenue is measured based on the consideration specified in a contract with a customer and excludes amounts collected
on behalf of third parties. The Group recognises revenue when it transfers control over a product or service to a
customer.
The following is a description of principal activities from which the Group generates its revenue categorised by the
reportable segments as detailed in note 2.3.
Franchised UK Motor segment, Car Store segment and US Motor segment
The Franchised UK, Car Store and US Motor segments principally generate revenue from the sale of new and used
motor vehicles, together with the supply of motor vehicle parts, servicing and repair activities, collectively referred to
as aftersales. Products and services may be sold separately or in bundled packages. Examples of a bundled package
will include the supply of a vehicle with an extended warranty or a servicing plan. For bundled packages, the Group
accounts for individual products and services separately as they are distinct items, as each performance obligation within
that contract is separately identifiable from other items in the bundled package. The consideration is allocated between
separate products and services in a bundle based on their stand-alone selling prices. The stand-alone selling prices are
determined based on the list prices at which the Group sells these items and are separately identified on the customer’s
invoice.
The Group has a number of manufacturer partners who will provide goods/services to customers, for example a warranty
or free servicing when purchasing a new vehicle. Such items do not have a contractual obligation on the Group as the
obligation lies with the manufacturer and therefore no revenue is recognised in respect of these items.
NOTES TO THE FINANCIAL STATEMENTS

113Pendragon PLC Annual Report 2020
Products
and services
Nature, timing of satisfaction of performance obligations and significant payment terms
New and used
vehicles, parts and
accessories
The Group recognises revenue on the sale of motor vehicles and parts revenue when they have
been supplied to the customer. The satisfaction of the performance obligation occurs on delivery
or collection of the product. Vehicles are usually paid for prior to delivery though selected
corporate operators may be granted terms of up to seven days. Parts are either paid for on
delivery or within one month, dependant upon whether or not the customer is retail or has trade
terms.
Aftersales service
and repairs
The Group recognises revenue when the one time service has been completed. Revenue is
recognised at this point provided that the revenue and costs can be measured reliably, the
recovery of the consideration is probable and there is no continuing management involvement
with the goods. Payment terms are upon completion of the service or within one month,
dependant upon whether or not the customer is retail or trade.
Commissions
received
The Group receives commissions when it arranges finance and insurance packages for its
customers to purchase its products and services, acting as agent on behalf of various finance and
insurance companies. Any commission earned is recognised when the customer draws down the
finance or commences the insurance policy from the supplier which coincides with the delivery of
the product or service. Commissions receivable are paid typically in the month after the finance is
drawn down.
Vehicle warranty
The Group offers a warranty product on vehicles supplied with a guarantee period typically
ranging from 3 months to 3 years. The Group recognises revenue on warranties on a straight-line
basis over the warranty period. The performance obligation of the Group, being the rectification
of mechanical faults on vehicles sold, will be the period over which the customer can exercise
their rights under the warranty and therefore revenue should be recognised over the period of
the warranty. Warranties are paid for prior to the commencement of the policy. The unrecognised
income is held within deferred income (see note 3.8). There are no such warranties offered for sale
in the US Motor segment.
SECTION 2 - RESULTS AND TRADING
2.1 Revenue continued
NOTES TO THE FINANCIAL STATEMENTS

114 Pendragon PLC Annual Report 2020
SECTION 2 - RESULTS AND TRADING
2.1 Revenue continued
Leasing
The leasing segment generates revenue from the provision of vehicle leasing services, principally to fleets run by various
commercial operators. Vehicles are supplied to customers on operating leases and may include servicing and maintenance
agreements, which are bundled into the overall contract. For bundled packages, the Group accounts for individual products
and services separately as they are distinct items, as each performance obligation within that contract is separately
identifiable from other items in the bundled package. At the end of each contract the Group will generate revenue from
the disposal of the vehicle, recovery of any rectification work and in some instances additional rentals beyond the original
contract term.
Products
and services
Nature, timing of satisfaction of performance obligations and significant payment terms
Leasing
Where vehicles are supplied to a leasing group for contract hire purposes and the Group
undertakes to repurchase the vehicle at a predetermined date and value the transfer of control is
deemed not to have transferred outside the Group and consequently no sale is recognised. As a
result the accounting for the arrangement reflects the Group’s retention of the asset to generate
future rentals and, in accordance with IFRS 16 Leases, the Group is considered to be an operating
lessor for all arrangements in place. The initial amounts received in consideration from the
leasing group are held as deferred income allocated between the present value of the repurchase
commitment, held within trade and other payables and a residual amount of deferred revenue held
within deferred income. A finance charge is accrued against the present value of the repurchase
commitment and recorded as a finance expense in the income statement. The remaining deferred
revenue, which effectively represents rentals received in advance, is taken to the income
statement on a straight line basis over the related lease term. No additional disclosures are made
under IFRS 16 as there are no future rentals receivable. These vehicles are held within ‘property,
plant and equipment’ at their cost to the Group and are depreciated to their residual values over
the terms of the leases. These assets are transferred into inventory at their carrying amount when
they cease to be rented and they become available for sale as part of the Group’s ordinary course
of business. Rentals are billed and paid for on a monthly basis.
Maintenance
The Group offer a maintenance contract to customers to cover routine servicing and unexpected
repairs of vehicles under a leasing contract. Revenue is recognised over the period of the contract
on a straight line basis. Maintenance contracts are billed and paid for on a monthly basis.
Used Vehicles
The Group recognises revenue on the sale of ex contract hire motor vehicles when they have been
supplied to the customer. This occurs on delivery or collection of the product. Vehicles are paid for
on delivery.
NOTES TO THE FINANCIAL STATEMENTS

115Pendragon PLC Annual Report 2020
SECTION 2 - RESULTS AND TRADING
2.1 Revenue continued
Software
The Group, through its Pinewood business, supplies dealer management systems to motor vehicle dealers. These systems
include consultancy, training and installation services and the right to use the Group’s software over a contractual period.
Products and services may be sold separately or in bundled packages. Examples of a bundled package will include system
consultancy, on and off site training for users together with the right for a number of users to use the software. For bundled
packages, the Group accounts for individual products and services separately as they are distinct items, as each performance
obligation within that contract is separately identifiable from other items in the bundled package. The consideration is
allocated between separate products and services in a bundle based on their stand-alone selling prices. The stand-alone
selling prices are determined based on the list prices at which the Group sells these items and are separately identified on
the customer’s contract and subsequent invoice.
Products
and services
Nature, timing of satisfaction of performance obligations and significant payment terms
Software
Pinewood supplies its software on a hosting basis and licencing specific numbers of users to
access this service. As such Pinewood supplies ‘Software as a Service’ (SaaS). The software
licences are provided only in conjunction with a hosting service, the customer cannot take control
of the licence or use the software without the hosting service and as such the customer cannot
benefit from the licence on its own and the licence is not separable from the hosting services.
Therefore, the licence is not distinct and would be combined with the hosting service. The Group’s
assessment of its performance obligation under IFRS 15 of providing SaaS is that revenue is
recognised over the period of the contract. SaaS is billed one month in advance of a quarterly
billing cycle ensuring payment is received prior to commencement of usage.
Training and
consultancy
The Group recognises revenue on the provision of any consultancy time and training at the point
of providing and delivering the service. Consultancy hours are billed at the time of delivery.
Training courses are billed at the time of booking which may be in advance of the date the training
is scheduled for.
NOTES TO THE FINANCIAL STATEMENTS

116 Pendragon PLC Annual Report 2020
SE
CT
ION
2 -
RE
SU
LT
S A
ND
TR
AD
ING
2.1
Re
ve
nu
e c
on
tin
ued
D
isag
gre
gati
on
of
reven
ue
In
th
e f
ollo
win
g t
ab
le, r
even
ue is
dis
ag
gre
gate
d b
y p
rim
ary
geo
gra
ph
ical m
ark
et,
majo
r p
rod
ucts
/serv
ice li
nes
an
d t
imin
g o
f re
ven
ue r
eco
gn
itio
n. T
he t
ab
le
als
o in
clu
des
a r
eco
ncili
ati
on
of
the d
isag
gre
gate
d r
even
ue w
ith
th
e G
rou
p’s
fo
ur
stra
teg
ic d
ivis
ion
s, w
hic
h a
re its
rep
ort
ab
le s
eg
men
ts, se
e n
ote
2.3
.
Fra
nch
ised
__U
K M
oto
r __
__C
ar
Sto
re__
__S
oft
ware
__
__L
easi
ng
__
d
isco
nti
nu
ed
__U
S M
oto
r__
____T
ota
l____
20
20
£m
20
19£
m
20
20
£m
20
19£
m
20
20
£m
20
19£
m
20
20
£m
20
19£
m
20
20
£m
20
19£
m2
02
0£
m20
19£
m
Pri
mary
ge
og
rap
hic
al
mark
ets
Eu
rop
e
2,5
91.
8
3,7
30
.8
88
.5
270
.3
16.4
17.6
69
.46
4.4
-
-
2,7
66
.1
4,0
83
.1
No
rth
Am
eri
ca
-
-
-
-
-
-
-
-
15
7.9
4
22.3
1
57
.9
422.3
Afr
ica
-
-
-
-
0.4
0
.5
-
-
-
-
0.4
0
.5
Asi
a -
-
-
-
0
.2
0.2
-
-
-
-
0
.2
0.2
Reven
ue f
rom
exte
rnal cu
sto
mers
2,5
91.
8
3,7
30
.8
88
.5
270
.3
17.0
18.3
69
.46
4.4
15
7.9
4
22.3
2
,92
4.6
4
,50
6.1
Majo
r p
rod
ucts
/se
rvic
e l
ine
s
Aft
ers
ale
s re
ven
ue
226
.3
326
.2
-
2.5
-
-
-
-
1
7.3
4
0.7
2
43
.6
36
9.4
Use
d v
eh
icle
reven
ue
1,1
57.5
1
,70
2.5
8
8.5
2
67.8
-
-
-
-
2
2.0
7
5.7
1
,26
8.0
2
,04
6.0
New
veh
icle
reven
ue
1,2
08
.0
1,7
02.1
-
-
-
-
-
-
1
18.6
3
05
.9
1,3
26
.6
2,0
08
.0
So
ftw
are
reven
ue
-
-
-
-
17.0
18.3
-
-
-
-
17
.0
18
.3
Leasi
ng
reven
ue
-
-
-
-
-
-
69
.46
4.4
-
-
69
.4
64
.4
Reven
ue f
rom
exte
rnal cu
sto
mers
2,5
91.
8
3,7
30
.8
88
.5
270
.3
17.0
18.3
69
.46
4.4
15
7.9
4
22.3
2
,92
4.6
4
,50
6.1
Tim
ing
of
reve
nu
e r
eco
gn
itio
n
At
po
int
in t
ime
2,5
81.
0
3,7
22.8
8
7.4
2
69
.3
0.9
1
.7
28
.520
.4
15
7.9
4
22.3
2
,85
5.7
4
,43
6.5
Over
tim
e 1
0.8
8
.0
1.1
1
.0
16.1
16.6
40
.9
44
.0
-
-
68
.9
69
.6
Reven
ue f
rom
exte
rnal cu
sto
mers
2,5
91.
8
3,7
30
.8
88
.5
270
.3
17.0
18.3
69
.46
4.4
15
7.9
4
22.3
2
,92
4.6
4
,50
6.1
NOTES TO THE FINANCIAL STATEMENTS

117Pendragon PLC Annual Report 2020
2.1 Revenue continued
Movements in the deferred income balance in respect of the warranty policies is presented in note 3.8 which shows the
value of policies sold during the year and the income recognised during the year.
2.2 Net operating expenses
2.3 Operating segments
The Group has five reportable segments, as described below, which are the Group’s strategic business units. The segments
offer different ranges of products and services and are managed separately because they require their own specialism
in terms of market and product. For each of these segments, the Executive Committee which is deemed to be the Chief
Operating Decision Maker (CODM), reviews internal management reports on at least a monthly basis. The review of
these management reports enables the CODM to allocate resources to each segment and form the basis of strategic
and operational decisions, such as acquisition strategy, closure programme or working capital allocation. The following
summary describes the operations in each of the Group’s reportable segments:
Franchised UK Motor This segment comprises the Group’s motor vehicle retail, parts wholesale and fleet operations from
its franchised dealer network, encompassing the sale of new and used motor cars, motorbikes, trucks and vans, together
with associated aftersales activities of service, body repair and parts sales.
Car Store This segment comprises the Group’s used vehicle retail operation branded Car Store, encompassing the sale of
used motor cars, together with associated aftersales service activities.
SECTION 2 - RESULTS AND TRADING
Contract balances
Contract Assets
The Group recognises the following contract assets:
2020£m
2019£m
Aftersales work in progress yet to be completed 1.2 1.5
Contract liabilities
The Group recognises the following contract liabilities:
2020£m
2019£m
Deposits received from customers 21.6 18.7
Unearned proportion of warranty policies sold 15.0 19.4
2020£m
2019£m
Net operating expenses:
Distribution costs (167.5) (256.2)
Administrative expenses (172.0) (322.2)
Impairment loss on trade receivables (0.3) (0.6)
Rents received 1.2 1.9
(338.6) (577.1)
NOTES TO THE FINANCIAL STATEMENTS

118 Pendragon PLC Annual Report 2020
2.3 Operating segments continued
Software This segment comprises the Group’s activities as a dealer management systems provider.
Leasing This segment comprises the Group’s contract hire and leasing activities.
US Motor This segment comprises the Group’s retail operation in California in the United States encompassing the sale of
new and used motor cars, together with associated aftersales activities of service and parts sales.
The tables of financial performance presented in the Operational and Financial Review on pages 25 to 35 are based upon
these segmental reports.
Inter-segment transfers and transactions are entered into under normal commercial terms and conditions that would also
be available to unrelated third parties.
Year ended 31 December 2020
SECTION 2 - RESULTS AND TRADING
FranchisedUK Motor
£mCar Store
£mSoftware
£mLeasing
£m
Groupinterest
£m
Continuingoperations
Sub total£m
Discontinuedoperations
US Motor£m
Total £m
Total gross segment revenue 2,591.8 88.5 22.3 86.3 - 2,788.9 157.9 2,946.8
Inter-segment revenue - - (5.3) (16.9) - (22.2) - (22.2)
Revenue from external customers 2,591.8 88.5 17.0 69.4 - 2,766.7 157.9 2,924.6
Operating profit/(loss) before non-underlying items
18.5 (1.2) 12.1 13.3 - 42.7 3.2 45.9
Non-underlying items (30.1) (0.1) - - - (30.2) (6.5) (36.7)
Operating profit/(loss) (11.6) (1.3) 12.1 13.3 - 12.5 (3.3) 9.2
Finance expense - - - (3.1) (35.9) (39.0) (0.8) (39.8)
Finance income - - - - 1.0 1.0 - 1.0
Segmental (loss)/profit before tax (11.6) (1.3) 12.1 10.2 (34.9) (25.5) (4.1) (29.6)
Other items included in the income statement are as follows:
Depreciation and impairment (38.4) (0.6) (0.7) (40.8) - (80.5) (0.1) (80.6)
Impairment of goodwill (12.5) - - - - (12.5) - (12.5)
Impairment of property, plant and equipment
(3.1) (0.1) - - - (3.2) - (3.2)
Amortisation (0.4) - (3.3) (0.2) - (3.9) - (3.9)
Share based payments (1.2) - - - - (1.2) - (1.2)
Impairment of assets held for sale
(0.8) - - - - (0.8) - (0.8)
Termination and severance costs (6.3) - - - - (6.3) - (6.3)
Business closure costs (4.2) - - - - (4.2) - (4.2)
Pension past service cost (3.3) - - - - (3.3) - (3.3)
Other income - profit/(loss) on the sale of businesses and property, plant and equipment
(0.3) - - - - (0.3) (6.5) (6.8)
NOTES TO THE FINANCIAL STATEMENTS

119Pendragon PLC Annual Report 2020
SECTION 2 - RESULTS AND TRADING
2.3 Operating segments continued
Year ended 31 December 2019
Geographical information.
All segments, with the exception of the US Motor Group in the United States originate in the United Kingdom. The US
Motor Group segment is a discontinued operation.
FranchisedUK Motor
£mCar Store
£mSoftware
£mLeasing
£m
Groupinterest
£m
Continuingoperations
Sub total£m
Discontinuedoperations
US Motor£m
Total £m
Total gross segment revenue 3,730.8 270.3 23.4 87.7 - 4,112.2 422.3 4,534.5
Inter-segment revenue - - (5.1) (23.3) - (28.4) - (28.4)
Revenue from external customers 3,730.8 270.3 18.3 64.4 - 4,083.8 422.3 4,506.1
Operating profit before non-underlying items
13.0 (25.2) 13.4 12.8 - 14.0 12.7 26.7
Non-underlying items (109.4) (21.4) - - - (130.8) 33.0 (97.8)
Operating profit (96.4) (46.6) 13.4 12.8 - (116.8) 45.7 (71.1)
Finance expense - - - (3.1) (39.8) (42.9) (3.1) (46.0)
Finance income - - - - 3.0 3.0 - 3.0
Segmental (loss)/profit before tax (96.4) (46.6) 13.4 9.7 (36.8) (156.7) 42.6 (114.1)
Other items included in the income statement are as follows:
Depreciation and impairment (40.0) (0.5) (0.6) (42.2) - (83.3) - (83.3)
Impairment of goodwill (102.4) - - - - (102.4) - (102.4)
Impairment of property, plant and equipment
(6.3) (19.6) - - - (25.9) - (25.9)
Amortisation (0.7) - (2.8) - - (3.5) - (3.5)
Share based payments (0.6) - - - - (0.6) - (0.6)
Impairment of assets held for sale
(1.9) - - - - (1.9) - (1.9)
Settlement of historic VAT issues 1.6 - - - - 1.6 1.0 2.6
Termination and severance costs (5.5) - - - - (5.5) - (5.5)
Car Store closure costs - (1.8) - - - (1.8) - (1.8)
Pension past service credit 4.8 - - - - 4.8 - 4.8
Other income - profit on the sale of businesses and property
0.3 - - - - 0.3 33.0 33.3
NOTES TO THE FINANCIAL STATEMENTS

120 Pendragon PLC Annual Report 2020
2.4 Staff costs
The average number of people employed by the Group in the following areas was:
Costs incurred in respect of these employees were:
Information relating to directors’ emoluments, share options and pension entitlements is set out in the Directors’
Remuneration Report on pages 68 to 82.
The Group appropriately used government assistance from the Coronavirus Job Retention Scheme and has benefited from
£42.3m of furlough support during the year, which is recognised against the wages and salaries expense. The furlough
support is included in the underlying result as the Group do not consider it to meet the definition of non-underlying when
taken together with the payroll costs that the amount compensates for.
2.5 Audit fees
SECTION 2 - RESULTS AND TRADING
2020Number
2019Number
Sales 2,426 3,156
Aftersales 3,308 4,304
Administration 1,617 2,104
7,351 9,564
2020£m
2019£m
Wages and salaries 165.4 271.6
Social security costs 18.1 25.4
Contributions to defined contribution plans (see note 5.1) 7.4 11.6
Cost recognised for defined benefit plans (see note 5.1) 4.4 (3.0)
Share based payments (see note 4.6) 1.2 0.6
196.5 306.2
Auditor’s remuneration:2020£000
2019£000
Fees payable to the company's Auditor for the audit of the company's annual accounts 520.0 350.0
Fees payable to the company's Auditor and its associates for other services:
Audit of the company's subsidiaries pursuant to legislation 250.0 210.0
Audit-related assurance services 170.0 80.0
Tax compliance services 70.0 71.0
Other assurance services 10.0 10.0
1,020.0 721.0
NOTES TO THE FINANCIAL STATEMENTS

121Pendragon PLC Annual Report 2020
SECTION 2 - RESULTS AND TRADING
2.6 Non-underlying items
Non-underlying income and expenses are items that are not incurred in the normal course of business and are sufficiently
significant and/or irregular to impact the underlying trends in the business.
The following amounts have been presented as non-underlying items in these financial statements:
Goodwill has been reviewed for any possible impairment and as a result of this review there was an impairment charge of
£12.5m made during the year (2019: £102.4m) (see note 3.1).
Group property, plant and equipment and assets held for sale have been reviewed for possible impairments. As a result
of this review there was an impairment charge against assets held for sale of £0.8m during the year (2019: £1.9m) and
property, plant and equipment of £3.2m (2019: £25.9m) which comprised impairment of owned assets of £nil (2019: £2.6m)
and right of use assets of £3.2m (2019: £23.3m). There were no reversals of previous impairment charges in respect of
assets held for sale where anticipated proceeds less costs to sell have increased over their impaired carrying values (2019:
£nil).
2020£m
2019£m
Within operating expenses:
Settlement of historic VAT issues - 1.6
Impairment of goodwill (12.5) (102.4)
Impairment of assets held for sale (0.8) (1.9)
Impairment of property, plant and equipment - (2.6)
Impairment of right of use assets (3.2) (23.3)
Termination and severance costs (6.3) (5.5)
Business closure costs (2.8) (1.8)
Pension scheme administration costs (1.0) -
Past service costs in respect of pension obligations (3.3) 4.8
(29.9) (131.1)
Within other income - gains on the sale of businesses, property, plant and equipment:
(Losses)/gains on the sale of businesses (6.5) 32.1
Gains on the sale of property 1.1 1.2
Losses on the disposal of property, plant and equipment (1.4) -
(6.8) 33.3
Within net finance expense:
Interest on settlement of historic VAT issues - 1.9
Net interest on pension scheme obligations (1.1) (1.8)
(1.1) 0.1
Total non-underlying items before tax (37.8) (97.7)
Non-underlying items in tax 4.1 (3.3)
Total non-underlying items after tax (33.7) (101.0)
NOTES TO THE FINANCIAL STATEMENTS

122 Pendragon PLC Annual Report 2020
SECTION 2 - RESULTS AND TRADING
2.6 Non-underlying items continued
The High Court ruling in the Lloyds Banking Group Pension Trustees Limited v Lloyds Bank plc and others published
in October 2018 held that UK pension schemes with Guaranteed Minimum Pensions (GMPs) accrued from 17 May 1990
must equalise for the different effects of these GMPs between men and women. Following a further High Court ruling on
20 November 2020 the case extends the scope of the GMP equalisation to include previous transfer values paid from
the scheme since 1990. An allowance for the estimated impact of this has been included in the benefit obligations at 31
December 2020 of £3.3m and is recorded as a non-underlying past service cost in the Income Statement. During the
previous year a Pension Increase Exchange exercise was carried out and the impact of this was to recognise a credit of
£4.8m in the past service cost line.
The administration costs of the pension scheme in respect of the Pension Protection Fund levy is shown as a non-underlying
item in 2020 due to the significant increase in this charge which was £1.0m in the year, a increase of over four times that
of the previous year.
The net financing return on pension obligations in respect of the defined benefit schemes closed to future accrual is shown
as a non-underlying item due to the irregularity of this amount historically and it is not incurred in the normal course of
business. A net expense of £1.1m has been recognised during the year (2019: £1.8m).
Other income consists of the profit or loss on disposal of businesses and property, plant and equipment. This comprises a
£6.5m loss (2019: £32.1m profit) on disposals of motor vehicle dealerships during the year (of which £6.5m was in respect
of discontinued operations (2019: £33.0m)), a £1.1m profit on sale of properties (2019: £1.2m) and a loss of £1.4m (2019:
£nil) in respect of losses on the disposal of plant and equipment as a result of the closure of businesses during the year.
This does not include routine transactions in relation to the disposal of individual assets, and only relates to the disposal or
closure of motor vehicle dealerships and associated properties.
The Group undertook a review of its operations during the year which resulted in a number of business closures. The
resultant costs of closure of these sites of £2.8m have been recognised as a non-underlying item in 2020. These costs
were in addition to the £1.4m losses on plant and equipment referred to above, making the total closure cost for the year
£4.2m. These closures were further to the closure of 22 Car Stores and one preparation centre in the previous year, costs
of closure of these sites being £1.8m were likewise recognised as a non-underlying item in 2019.
During the year as part of the Group’s business review and rationalisation a large number of redundancies were made, the
cost of which is presented as a non-underlying item of £6.3m. During the previous year some of the Group’s senior executive
team were offered compensation on terminating their employment contracts which amounted to £5.5m.
We acquired CD Bramall PLC in 2004, with the Group having made a claim in 2003 for VAT overpaid in respect of bonuses
received by the Group’s leasing companies from OEMs during the period 1988-1995 (Fleming claims). These claims were
refused by HMRC over the years for a number of reasons which gradually fell away through litigation with other parties. We
were then left with a fundamental objection of principle by HMRC and so we litigated in 2017 and were successful (decision
released August 2018). As the legal decision was one of principle only, we were then left to agree quantum with HMRC.
This was concluded during the first half of 2019, resulting in a VAT repayment of just over £1.9m (cash received in June
2019) with interest to follow shortly of another £1.9m. Associated costs were £0.3m which resulted in a net gain of £3.5m
reported in 2019.
NOTES TO THE FINANCIAL STATEMENTS

123Pendragon PLC Annual Report 2020
SECTION 2 - RESULTS AND TRADING
2.7 Taxation
Accounting policy
Income tax comprises current and deferred tax. Income tax is recognised in the income statement except to the extent
that it relates to items recognised directly in other comprehensive income, in which case it is recognised in the statement
of comprehensive income.
Current tax is the expected tax payable on the taxable income for the year, using tax rates enacted or substantively
enacted at the balance sheet date, and any adjustment to tax payable in respect of previous years.
Deferred tax is recognised using the balance sheet liability method, recognising temporary differences between the
carrying amounts of assets and liabilities for financial reporting purposes and the amounts used for taxation purposes.
The following temporary differences are not recognised: initial recognition of goodwill, the initial recognition of assets or
liabilities in a transaction that is not a business combination that affect neither accounting nor taxable profit. The amount
of deferred tax recognised is based on the expected manner of realisation or settlement of the carrying amount of assets
and liabilities, using tax rates enacted or substantively enacted at the balance sheet date.
A deferred tax asset is recognised only to the extent that it is probable that future taxable profits will be available against
which the asset can be utilised. Deferred tax assets are reduced to the extent that it is no longer probable that the related
tax benefit will be realised.
Estimates and judgements
The actual tax on the Group’s profits is determined according to complex laws and regulations. Where the effect of
these laws and regulations is unclear, estimates are used in determining the liability for the tax to be paid on profits
which are recognised in the financial statements. The Group considers the estimates, assumptions and judgements to be
reasonable but this can involve complex issues which may take a number of years to resolve. The final determination of
tax liabilities could be different from the estimates reflected in the financial statements but the Group believes that none
have a significant risk of causing a material adjustment to the carrying amount of the liability within the next financial
year.
Deferred tax assets and liabilities require management judgement in determining the amounts to be recognised. In particular,
judgement is used when assessing the extent to which deferred tax assets should be recognised with consideration given
to the timing and level of future taxable income. The unrecognised deferred tax assets are disclosed below.
NOTES TO THE FINANCIAL STATEMENTS

124 Pendragon PLC Annual Report 2020
SECTION 2 - RESULTS AND TRADING
2.7 Taxation continued
Taxation - Income statement continued
2020£m
2019£m
UK corporation tax:
Current tax on loss for the year - (3.6)
Adjustments in respect of prior periods 2.2 -
2.2 (3.6)
Overseas taxation:
Current tax on profit for the year (0.7) 13.4
Adjustments in respect of prior periods (1.4) 0.2
(2.1) 13.6
Total current tax 0.1 10.0
Deferred tax expense:
Origination and reversal of temporary differences (5.0) (6.7)
Total deferred tax (5.0) (6.7)
Total income tax (credit)/expense in the income statement (4.9) 3.3
Factors affecting the tax (credit)/charge for the period:
The tax assessed is different from the standard rate of corporation tax in the UK of 19.00% (2019: 19.00%)
The differences are explained below: 2020£m
2019£m
Loss before taxation (29.6) (114.1)
Tax on loss at UK rate of 19.00% (2019: 19.00%) (5.6) (21.7)
Differences:
Tax effect of expenses that are not deductible in determining taxable profit 0.9 0.3
Permanent differences arising in respect of fixed assets 1.2 1.6
Tax rate differential on overseas income (0.4) 1.1
Non-underlying items (see below) 2.2 22.0
Impact of UK corporation tax rate change (2.4) 0.6
Adjustments to tax charge in respect of previous periods (0.8) (0.6)
Total income tax (credit)/expense in the income statement (4.9) 3.3
Taxation - Other comprehensive income 2020£m
2019£m
Relating to defined benefit plan remeasurement (gains) and losses 5.7 0.2
Other short term temporary differences 0.2 -
5.9 0.2
NOTES TO THE FINANCIAL STATEMENTS

125Pendragon PLC Annual Report 2020
SECTION 2 - RESULTS AND TRADING
2.7 Taxation continued
Tax rate
A reduction in the UK corporation tax rate from 19% to 17% (effective from 1 April 2020) was substantively enacted on 6
September 2016, and the UK deferred tax asset as at 31 December 2019 has been calculated based on this rate. In the 11
March 2020 Budget it was announced that the UK tax rate will remain at the current 19% and not reduce to 17% from 1 April
2020. The deferred tax asset at 31 December 2020 has therefore been measured using 19%.
A UK corporation tax rate of 25% was announced in the Chancellor’s Budget of 3 March 2021, along with a temporary
extension to the loss carry-back rules allowing up to £2m of tax losses to be carried back to the preceding 3 periods. The
25% rate will apply from 1 April 2023 and the carry-back of losses is expected to apply to year ends 31 December 2020 and
31 December 2021. If these two measures had been substantively enacted at the balance sheet date the deferred tax asset
would have increased by £6.1m and the current tax asset increased by £0.4m.
The USA deferred tax liability as at 31 December 2020 has been calculated based on a blended federal and Californian state
tax basis using the expected long term federal rate of 21% substantively enacted at the balance sheet date.
Factors affecting the tax charge /credit
The tax charge/credit is decreased/increased by the release of prior year provisions relating to UK corporation tax returns
and also non-deductible expenses including the impairment of goodwill and non-qualifying depreciation.
Non-underlying tax credit / charge
The tax credit in relation to non-underlying items referred to in note 2.6 is £4.1m (2019: £3.3m charge). Of the £4.1m credit
£0.4m related to discontinued operations. The tax credit is lower than the non-underlying loss multiplied by the tax rate
(19%) mainly due to £12.5m of the loss not being eligible for tax relief (goodwill impairment).
Unrecognised deferred tax assets
There are unutilised tax losses within the Group of £13.8m (2019: £13.8m) relating to former overseas businesses for
which no deferred tax asset has been recognised pending the clarity of the availability of intra-EU losses. There are also
unrecognised capital losses net of rolled over gains of £41.9m (2019: £35.2m).
Deferred tax assets/(liabilities)
Deferred income tax assets and liabilities are offset when there is a legally enforceable right to offset current tax assets
against current tax liabilities and when the deferred income taxes relate to the same fiscal authority. The deferred tax
assets all relate to the UK and the deferred tax liabilities relate to the US. The offset amounts are as follows:
2020£m
2019£m
Deferred tax assets 37.9 25.9
Deferred tax liabilities (1.5) (0.4)
36.4 25.5
NOTES TO THE FINANCIAL STATEMENTS

126 Pendragon PLC Annual Report 2020
SECTION 2 - RESULTS AND TRADING
2.7 Taxation continued
The table below outlines the deferred tax assets/(liabilities) that are recognised on the balance sheet, together with their
movements in the year;
A deferred tax asset on UK losses of £6.8m was generated during 2019 due to the exceptional nature of activity that
occurred during 2019. A further £7.3m was generated in 2020 due to the business interruption from the Covid-19 pandemic.
A deferred tax asset for the losses has been recognised as the Group has been historically profitable (it made taxable
profits in the UK in 2018 and immediately preceding periods), made an underlying profit in 2020, and is expected to be
profitable in future.
At 1January
2019 £m
Recognised on initial
application of IFRS 16
£m
Credited/(charged) to consolidated
income statement
£m
Credited to other
comprehensiveincome
£m
Exchangedifferences
£m
At 31 December
2019 £m
Property, plant and equipment (5.0) 8.7 1.7 - 0.1 5.5
Retirement benefit obligations 11.7 - (1.8) 0.2 - 10.1
Other short term temporary differences 1.8 - - - - 1.8
Losses 1.3 - 6.8 - - 8.1
Tax assets/(liabilities) 9.8 8.7 6.7 0.2 0.1 25.5
At 1January
2020 £m
Credited/(charged) to consolidated
income statement
£m
Credited to other
comprehensiveincome
£m
Exchangedifferences
£m
At 31 December
2020 £m
Property, plant and equipment 5.5 0.3 - - 5.8
Retirement benefit obligations 10.1 (1.3) 5.7 - 14.5
Other short term temporary differences 1.8 (1.3) 0.2 - 0.7
Losses 8.1 7.3 - - 15.4
Tax assets/(liabilities) 25.5 5.0 5.9 - 36.4
NOTES TO THE FINANCIAL STATEMENTS

127Pendragon PLC Annual Report 2020
SECTION 2 - RESULTS AND TRADING
2.8 Earnings per share
Accounting policy
The Group presents basic and diluted earnings per share (‘EPS’) data for its ordinary shares. Basic eps is calculated by
dividing the profit or loss attributable to ordinary shareholders of the Group by the weighted average number of ordinary
shares in issue during the period. The shares held by the EBT have been excluded from the calculation until such time
as they vest unconditionally with the employees. Diluted eps is calculated by dividing the profit and loss attributable to
ordinary shareholders by the weighted average number of ordinary shares in issue taking account of the effects of all
dilutive potential ordinary shares, which comprise of share options granted to employees and LTIPs.
Earnings per share calculation
2020Earnings
per share pence
2020Earnings
Total £m
2019Earnings
per share pence
2019 Earnings
Total £m
Basic earnings per share from continuing operations (1.6) (21.6) (10.7) (148.9)
Basic earnings per share from discontinued operations (0.2) (3.1) 2.3 31.5
Basic earnings per share (1.8) (24.7) (8.4) (117.4)
Adjusting items:
Non-underlying items attributable to the parent from continuing operations 2.2 31.3 9.4 130.7
Non-underlying items attributable to the parent from discontinued operations 0.5 6.5 (2.4) (33.0)
Non-underlying items attributable to the parent (see note 2.6) 2.7 37.8 7.0 97.7
Tax effect of non-underlying items from continuing operations (1.0) (13.4) (0.4) (6.0)
Tax effect of non-underlying items from discontinued operations 0.7 9.3 0.6 9.3
Tax effect of non-underlying items (0.3) (4.1) 0.2 3.3
Underlying earnings per share from continuing operations (Non-GAAP measure) (0.3) (3.7) (1.8) (24.2)
Underlying earnings per share from discontinued operations (Non-GAAP measure) 0.9 12.7 0.6 7.8
Underlying earnings per share (Non-GAAP measure) 0.6 9.0 (1.2) (16.4)
Diluted earnings per share from continuing operations (1.6) (21.6) (10.7) (148.9)
Diluted earnings per share from discontinued operations (0.2) (3.1) 2.3 31.5
Diluted earnings per share (1.8) (24.7) (8.4) (117.4)
Diluted earnings per share - underlying from continuing operations (Non-GAAP measure) (0.3) (3.7) (1.8) (24.2)
Diluted earnings per share - underlying from discontinued operations (Non-GAAP measure) 0.9 12.7 0.6 7.8
Diluted earnings per share - underlying (Non-GAAP measure) 0.6 9.0 (1.2) (16.4)
The calculation of basic, adjusted and diluted earnings per share is based on the following number of shares in issue (millions):
2020Number
2019Number
Weighted average number of ordinary shares in issue 1,390.5 1,390.6
Weighted average number of dilutive shares under option 6.1 2.6
Weighted average number of shares in issue taking account of applicable outstanding share options
1,396.6 1,393.2
Non-dilutive shares under option 38.3 8.7
The Directors consider that the underlying earnings per share figure provides a better measure of comparative performance.
NOTES TO THE FINANCIAL STATEMENTS

128 Pendragon PLC Annual Report 2020
SECTION 3 - OPERATING ASSETS AND LIABILITIES
This section contains the notes and information to support those assets and liabilities presented in the Consolidated
Balance Sheet that relate to the Group’s operating activities.
3.1 Intangible assets and goodwill 3.5 Movement in contract hire vehicle balances
3.2 Property, plant and equipment 3.6 Trade and other receivables
3.3 Assets held for sale and discontinued operations 3.7 Trade and other payables
3.4 Inventories 3.9 Deferred income
3.1 Intangible assets and goodwill
Accounting policies
All business combinations are accounted for by applying the purchase method. Goodwill represents the excess of the cost
of acquisition over the net fair value of the identifiable assets, liabilities and contingent liabilities of the acquired subsidiary
undertakings at the effective date of acquisition and is included in the balance sheet under the heading of intangible
assets. The goodwill is allocated to cash generating units (CGUs), which are franchise groups and other business units.
An impairment test is performed annually as detailed below. Goodwill is then held in the balance sheet at cost less any
accumulated impairment losses.
Adjustments are applied to bring the accounting policies of the acquired businesses into alignment with those of the
Group. The costs associated with reorganising or restructuring are charged to the post acquisition income statement. For
those acquisitions made prior to 1 January 2004, goodwill is recorded on the basis of its deemed cost which represented
its carrying value as at 1 January 2004 under UK GAAP. Fair value adjustments are made in respect of acquisitions. If
at the balance sheet date the fair value of the acquiree’s identifiable assets, liabilities and contingent liabilities can only
be established provisionally then these values are used. Any adjustments to these values made within 12 months of the
acquisition date are taken as adjustments to goodwill.
Internally generated intangible assets relate to activities that involve the development of dealer management systems
by the Group’s Pinewood division. Development expenditure is capitalised only if development costs can be measured
reliably, the product is technically and commercially feasible, future economic benefits are probable and the Group intends
to and has sufficient resources to complete development and to use or sell the asset. The expenditure capitalised includes
the costs of labour and overhead costs that are directly attributable to preparing the asset for its intended use. If the
development expenditure does not meet the above criteria it is expensed to the income statement.
Capitalised development expenditure is measured at cost less accumulated amortisation and accumulated impairment
losses and is amortised over a period of five years.
Intangible assets other than goodwill are stated at cost less accumulated amortisation and any impairment losses. This
category of asset includes purchased computer software and internally generated intangible assets which are amortised
by equal instalments over four years and the fair value of the benefit of forward sales orders assumed on acquisition, which
is amortised by reference to when those orders are delivered.
Subsequent expenditure on capitalised intangible assets is capitalised only when it increases the future economic benefits
embodied in the specific asset to which it relates. All other expenditure is expensed as incurred.
Intangible assets arising on an acquisition are recognised separately from goodwill if the fair value of the asset can be
identified separately and measured reliably. Amortisation is calculated on a straight line basis over the estimated useful life
of the intangible asset. Amortisation methods and useful lives are reviewed annually and adjusted if appropriate.
NOTES TO THE FINANCIAL STATEMENTS

129Pendragon PLC Annual Report 2020
SECTION 3 - OPERATING ASSETS AND LIABILITIES
3.1 Intangible assets and goodwill continued
Goodwill £m
Development costs
£m
Otherintangibles
£m Total
£m
Cost
At 1 January 2019 407.5 21.9 12.7 442.1
Additions - 4.1 0.7 4.8
Disposals (0.7) (9.9) (9.0) (19.6)
At 31 December 2019 406.8 16.1 4.4 427.3
At 1 January 2020 406.8 16.1 4.4 427.3
Additions - 4.3 0.3 4.6
Disposals - - (0.3) (0.3)
At 31 December 2020 406.8 20.4 4.4 431.6
Amortisation
At 1 January 2019 141.6 14.8 11.6 168.0
Amortised during the year - 2.8 0.7 3.5
Impairment 102.4 - - 102.4
Disposals - (9.9) (9.0) (18.9)
At 31 December 2019 244.0 7.7 3.3 255.0
At 1 January 2020 244.0 7.7 3.3 255.0
Amortised during the year - 3.3 0.6 3.9
Impairment 12.5 - - 12.5
Disposals - - (0.3) (0.3)
At 31 December 2020 256.5 11.0 3.6 271.1
Carrying amounts
At 1 January 2019 265.9 7.1 1.1 274.1
At 31 December 2019 162.8 8.4 1.1 172.3
At 31 December 2020 150.3 9.4 0.8 160.5
NOTES TO THE FINANCIAL STATEMENTS

130 Pendragon PLC Annual Report 2020
SECTION 3 - OPERATING ASSETS AND LIABILITIES
3.1 Intangible assets and goodwill continued
Goodwill is allocated across multiple cash-generating units which are motor franchise groups and other business units and
consequently a consistent approach to performing an annual impairment test to assess the carrying value of this amount
is taken. This value was determined by comparing the carrying value of the asset with the higher of its fair value less costs
to sell (where value is determined by applying a trading multiple to the estimated future cash flow or by assessing the
depreciated replacement cost of the individual assets) and value in use (where value is determined by discounting the future
cash flows generated from the continuing use of the unit and was based on the following key assumptions):
Future cash flows were projected into perpetuity with reference to the Group’s forecasts for 2021. The 2021 forecast was
derived from the corporate plan, approved by the Board and compiled on a bottom up basis. New car volume growth was
based on the latest SMMT forecasts. Used car and aftersales revenue and gross profit growth has been based on latest run-
rates for the CGUs. The 2022 to 2025 forecast represents a projection from the 2021 bottom up forecast and is a short term
income growth of 1.9% and short term cost growth of 2.2% based on short term market inflation assumptions.
Fair value less costs of disposal has been calculated using transaction and trading multiples. The multiples are based on
median EV / LTM EBITDA for relevant transactions post 2010 across the 3 main sectors of Pendragon: retail, leasing and
software.
It is anticipated that the units will grow revenues in the future. For the purpose of the impairment testing, a long-term growth
rate of 1.9% (2019: 1.6%) has been assumed beyond 2025. The growth rate of 1.9% that has been used in the impairment
calculations is based on long-term inflation.
The pre-tax discount rates are estimated to reflect current market estimates of the time value of money and is calculated
after consideration of market information and risk adjusted for individual circumstances. The discount rates used are specific
to each CGU and vary between 9.7% and 13.7% (2019: discount rates varied between 9.4% and 14.6%). The increase in
average discount rates reflect the cash flow forecasts being risk adjusted to a lesser degree this year
The following have been recognised in the income statement within net operating expenses:
2020£m
2019£m
Amortisation of internally generated intangible assets 3.3 2.8
Amortisation of other intangible assets 0.6 0.7
Impairment of goodwill 12.5 102.4
Research and development costs 0.8 0.6
NOTES TO THE FINANCIAL STATEMENTS

131Pendragon PLC Annual Report 2020
SE
CT
ION
3 -
OP
ER
AT
ING
AS
SE
TS
AN
D L
IAB
ILIT
IES
3.1
In
tan
gib
le a
sse
ts a
nd
go
od
wil
l co
nti
nu
ed
M
ovem
en
ts o
f th
e p
rin
cip
al C
GU
s are
su
mm
ari
sed
in
th
e t
ab
le b
elo
w:
V
IU -
Valu
e in
use
, F
VL
CT
S -
Fair
valu
e less
co
sts
to s
ell,
DR
C -
Dep
recia
ted
rep
lacem
en
t co
st
20
19
At
1Jan
uary
20
19£
m
Bu
sin
ess
d
isp
osa
ls£
mIm
pair
men
t£
m
Exch
an
ge
ad
just
men
ts£
m
Cla
ssifi
ed a
sn
on
-cu
rren
t h
eld
fo
r sa
le£
m
At
31
Decem
ber
20
19£
m
PP
E(n
ote
3.2
)Im
pair
men
t £
m
Ro
U ass
et
(no
te 3
.2)
Imp
air
men
t£
m
Rec
ove
rab
le
am
ou
nt
of
CG
U£
m
Rec
ove
rab
leam
ou
nt
ap
pro
ach
Dis
co
un
t ra
te/
Tra
din
g
Mu
ltip
leH
ead
roo
m£
m
Fo
rd
69
.7
-
-
-
-
69
.7
-
-
191.
2
VIU
9.5
%3
0.8
Vau
xh
all
64
.4
-
(29
.2)
-
-
35
.2
-
(1.
3)
91.
2
VIU
9.5
%-
BM
W
7.9
-
(
7.9
) -
-
-
-
(
0.2
)4
5.4
D
RC
Equa
l to
book
val
ue-
Merc
ed
es
27.8
-
(
27.8
) -
-
-
(
0.3
) (
0.6
)5
.9
DR
CEq
ual t
o bo
ok v
alue
-
Jag
uar
Lan
d R
over
17.2
(
0.7
) (
16.5
) -
-
-
(
0.3
) (
1.3
)5
6.0
V
IU9
.4%
-
MIN
I 7.3
-
(
7.3
) -
-
-
-
-
1.
4
DR
CEq
ual t
o bo
ok v
alue
-
Cit
roen
11
.5
-
(1.
9)
-
-
9.6
-
-
24
.3
VIU
9.5
%-
Nis
san
9
.7
-
(9
.7)
-
-
-
(0
.7)
-
4.9
V
IU9
.6%
-
Car
Sto
re
-
-
-
-
-
-
(0
.8)
(18
.7)
25
.0
DR
CEq
ual t
o bo
ok v
alue
-
Ren
au
lt
12.2
-
(
0.3
) -
-
11
.9
-
-
22.6
V
IU9
.6%
-
Tru
cks
12.1
-
-
-
-
12
.1
-
-
40
.5F
VL
CT
S7.7
%23
.7
Oth
ers
26
.1
-
(1.
8)
-
-
24
.3
(0
.5)
(1.
2)
45
2.7
VI
U/DR
C/FV
LCTS
9.5
% -
14
.6%
34
4.5
To
tal
26
5.9
(
0.7
) (
102.4
) -
-
16
2.8
(
2.6
) (
23
.3)
96
1.1
20
20
At
1Jan
uary
20
20
£m
Bu
sin
ess
d
isp
osa
ls£
mIm
pair
men
t£
m
Exch
an
ge
ad
just
men
ts£
m
Cla
ssifi
ed a
sn
on
-cu
rren
t h
eld
fo
r sa
le£
m
At
31
Decem
ber
20
20
£m
PP
E(n
ote
3.2
)Im
pair
men
t £
m
Ro
U ass
et
(no
te 3
.2)
Imp
air
men
t£
m
Rec
ove
rab
le
am
ou
nt
of
CG
U£
m
Rec
ove
rab
leam
ou
nt
ap
pro
ach
Dis
co
un
t ra
te/
Tra
din
g
Mu
ltip
leH
ead
roo
m£
m
Fo
rd
69
.7
-
-
-
-
69
.7
-
-
160
.9
VIU
12.8
%9
.0
Vau
xh
all
35
.2
-
-
-
-
35
.2
-
(0
.9)
78
.3
VIU
11.9
%1.
0
BM
W
-
-
-
-
-
-
-
-
61.
8
VIU
13.0
%15
.5
Merc
ed
es
-
-
-
-
-
-
-
-
68
.2
VIU
12.7
%5
1.2
Jag
uar
Lan
d R
over
-
-
-
-
-
-
-
-
76
.4
VIU
12.8
%21.
3
MIN
I -
-
-
-
-
-
-
-
21.
3
VIU
11.2
%18
.2
Cit
roen
9
.6
-
(6
.1)
-
-
3.5
-
(
0.1
)14
.3
VIU
9.7
%-
Nis
san
-
-
-
-
-
-
-
-
18
.4
VIU
10.5
%12
.1
Car
Sto
re
-
-
-
-
-
-
-
-
24
.3
DR
CEq
ual t
o bo
ok v
alue
-
Ren
au
lt
11.9
-
-
-
-
11
.9
-
-
27.3
V
IU10
.5%
7.4
Tru
cks
12.1
-
(6
.4)
-
-
5.7
-
-
17
.3V
IU10
.5%
5.6
Oth
ers
24
.3
-
-
-
-
24
.3
-
(2.2
)4
01.
9V
IU/D
RC
10.3
% -
13
.7%
319
.9
To
tal
162.8
-
(
12.5
) -
-
15
0.3
-
(
3.2
)9
70
.4
NOTES TO THE FINANCIAL STATEMENTS

132 Pendragon PLC Annual Report 2020
SECTION 3 - OPERATING ASSETS AND LIABILITIES
3.1 Intangible assets and goodwill continued
Sensitivity of assumptions
The forecasts used to determine impairment are sensitive to the key assumptions used in preparing those forecasts. Future
uncertainty with respect to the markets we operate in, could all have an effect on our sales volumes and margins and
the general costs of doing business. The key assumptions used in our forecasts are therefore the long-term growth rates
and discount rate applied. The sensitivities below indicate the total change in the value in use forecast, keeping other
assumptions constant. Such changes would only result in further impairment to the extent that the impact of the sensitivities
reduced the calculation of value in use below the carrying value of the respective CGU. For those CGUs already impaired,
any worsening of assumptions would lead to further impairment on a pound for pound basis. For those CGUs not already
impaired, the estimated headroom before impairment is disclosed.
The directors and management have considered and assessed reasonably possible changes to the key assumptions.
Sensitivities have not been provided for FVLCTS and DRC as reasonably possible changes in assumptions would not lead to
a significant change in any impairment required.
Within a downside, the reasonably possible changes to the key assumptions are a reduction in the long term growth rate
of 1.9%, which would equate to a 0% long term growth rate. Short term growth rate reduction of 1.9% to all incomes, which
would equate to a 0% increase each period. Finally an increase on 1% to all discount rates.
Goodwill by segment 2020£m
2019£m
UK Motor 128.0 140.5
Pinewood 0.3 0.3
Leasing 22.0 22.0
150.3 162.8
NOTES TO THE FINANCIAL STATEMENTS

133Pendragon PLC Annual Report 2020
SECTION 3 - OPERATING ASSETS AND LIABILITIES
3.1 Intangible assets and goodwill continued
Sensitivity by CGU
* Note that “Others” comprises individual CGUs amalgamated for the purposes of disclosure.
Ford is the CGU with the largest carrying value of Goodwill (£69.7m) noted above. For an impairment to occur in the Ford
CGU, there would have to be either: a reduction in the short term income growth rate of 0.4% or an increase in the pre-tax
discount rate to 13.4%.
___Headroom Increase________Further Impairment to goodwill___________and assets (if applicable)_______
CarryingValue
£m
Current Headroom
£m
Long-Term Growth Rate
1.0%Increase
£m
Discount Rate 1.0%Decrease
£m
Long-Term Rate 1.9% Decrease
£m
Discount Rate 1.0%
Increase£m
Short-Term Growth Rate Income 1.9%
Decrease£m
Ford 69.7 9.0 13.7 19.5 (10.2) (6.6) (34.1)
Vauxhall 35.2 1.0 7.0 9.8 (8.6) (6.8) (22.0)
BMW - 15.5 5.4 7.6 - - -
Mercedes - 51.2 5.7 8.1 - - -
Jaguar Land Rover - 21.3 6.5 9.2 - - -
MINI - 18.2 2.4 3.2 - - -
Citroen 3.5 - 1.6 2.1 (2.5) (2.1) (11.6)
Nissan - 12.1 2.3 3.0 - - -
Car Store - - - - - - -
Renault 11.9 7.4 3.4 4.5 - - (1.0)
Trucks 5.7 5.6 2.1 2.8 - - (0.7)
Others 24.3 319.9 29.8 40.6 - - -
Total 150.3 461.2
NOTES TO THE FINANCIAL STATEMENTS

134 Pendragon PLC Annual Report 2020
SECTION 3 - OPERATING ASSETS AND LIABILITIES
3.2 Property, plant and equipment
Accounting policy
Freehold land is not depreciated. Depreciation is provided to write off the cost less the estimated residual value of other
assets by equal instalments over their estimated useful economic lives. On transition to IFRS as at 1 January 2004, all land
and buildings were restated to fair value as permitted by IFRS 1, which is then treated as the deemed cost. All other assets
are initially measured and recorded at cost.
Depreciation rates are as follows:
• Freehold buildings – 2% per annum
• Right of use assets - over the period of the lease
• Leasehold property improvements – 2% per annum or over the period of the lease if less than 50 years
• Fixtures, fittings and office equipment – 10 – 20% per annum
• Plant and machinery – 10 – 33% per annum
• Motor vehicles – 20 – 25% per annum
• Contract hire vehicles are depreciated to their residual value over the period of their lease
The residual value of all assets, depreciation methods and useful economic lives, if significant, are reassessed annually.
The Group recognises in the carrying amount of an item of property, plant and equipment the cost of replacing part of
such an item when that cost is incurred if it is possible that the future economic benefits embodied with the item will flow
to the Group and the cost of the item can be measured reliably. All other costs are recognised in the income statement as
an expense as incurred.
Gains and losses on disposal of an item of property, plant and equipment are determined by comparing the proceeds from
disposal with the carrying amount of property, plant and equipment and are recognised net within other income in the
income statement.
The depreciation charge in respect of property, plant and equipment is recognised within administrative expenses within
the income statement.
Land & buildings
£m
Plant & equipment
£m
Motor vehicles
£m
Contract hire
vehicles £m
Total £m
Cost
At 1 January 2019 294.3 87.2 46.7 230.1 658.3
Recognition of right-of-use asset on initial application of IFRS 16
394.1 - 0.5 - 394.6
Adjusted balance at 1 January 2019 688.4 87.2 47.2 230.1 1,052.9
Additions 37.8 10.9 62.8 107.9 219.4
Business disposals (6.1) (1.1) - - (7.2)
Other disposals (12.8) (10.7) (72.4) - (95.9)
Contract hire vehicles transferred to inventory - - - (92.7) (92.7)
Classified as non-current assets held for sale (22.7) - - - (22.7)
Reinstated from non-current assets held for sale
10.9 - - - 10.9
At 31 December 2019 695.5 86.3 37.6 245.3 1,064.7
NOTES TO THE FINANCIAL STATEMENTS

135Pendragon PLC Annual Report 2020
SECTION 3 - OPERATING ASSETS AND LIABILITIES
3.2 Property, plant and equipment continued
Land & buildings
£m
Plant & equipment
£m
Motor vehicles
£m
Contract hire
vehicles £m
Total £m
Cost
At 1 January 2020 695.5 86.3 37.6 245.3 1,064.7
Additions 16.9 6.6 35.8 72.6 131.9
Disposals (21.6) (7.7) (47.7) - (77.0)
Contract hire vehicles transferred to inventory - - - (87.5) (87.5)
Classified as non-current assets held for sale (5.4) - - - (5.4)
Reinstated from non-current assets held for sale
3.7 - - - 3.7
At 31 December 2020 689.1 85.2 25.7 230.4 1,030.4
Depreciation
At 1 January 2019 53.8 58.0 6.0 76.6 194.4
Recognition of right-of-use asset on initial application of IFRS 16
201.5 - - - 201.5
Adjusted balance at 1 January 2019 255.3 58.0 6.0 76.6 395.9
Charge for the year 25.6 8.5 7.1 42.1 83.3
Impairment 25.5 0.4 - - 25.9
Business disposals (1.1) (0.5) - - (1.6)
Other disposals (8.0) (9.7) (7.7) - (25.4)
Contract hire vehicles transferred to inventory - - - (43.4) (43.4)
Classified as non-current assets held for sale (4.3) - - - (4.3)
Reinstated from non-current assets held for sale
6.0 - - - 6.0
At 31 December 2019 299.0 56.7 5.4 75.3 436.4
At 1 January 2020 299.0 56.7 5.4 75.3 436.4
Charge for the year 25.6 8.0 6.1 40.9 80.6
Impairment 3.2 - - - 3.2
Disposals (8.0) (5.7) (6.6) - (20.3)
Contract hire vehicles transferred to inventory - - - (43.2) (43.2)
Classified as non-current assets held for sale (0.5) - - - (0.5)
Reinstated from non-current assets held for sale
1.4 - - - 1.4
At 31 December 2020 320.7 59.0 4.9 73.0 457.6
Carrying amounts
At 1 January 2019 240.5 29.2 40.7 153.5 463.9
At 31 December 2019 396.5 29.6 32.2 170.0 628.3
At 31 December 2020 368.4 26.2 20.8 157.4 572.8
NOTES TO THE FINANCIAL STATEMENTS

136 Pendragon PLC Annual Report 2020
SECTION 3 - OPERATING ASSETS AND LIABILITIES
3.2 Property, plant and equipment continued
Property, plant and equipment includes right-of-use assets of £146.0m (see Note 4.7).
During the year two properties were re-classified as property, plant and equipment following decisions to withdraw them
from sale. Both properties have been re-instated at the lower of their recoverable amount, or the carrying amount had
the asset never been moved to assets held for sale. One property was re-instated at its recoverable value having been
previously impaired down to that value, the other being reinstated at its original carrying value less depreciation that
would have been charged had the asset not been classified as held for sale. The depreciation adjustment was immaterial.
Cash flows relating to the purchase of contract hire vehicles are disclosed within Movement in contract hire vehicle balances
(see note 3.5).
Land & buildings
£m
Plant & equipment
£m
Motor vehicles
£m
Contract hire vehicles
£m Total
£m
Assets leased out under operating leases
Cost at 31 December 2020 18.2 - - 230.4 248.6
Accumulated depreciation at 31 December 2020 (8.6) - - (73.0) (81.6)
Accumulated Impairment at 31 December 2020 (0.3) - - - (0.3)
Carrying value of assets leased out under operating leases at 31 December 2020
9.3 - - 157.4 166.7
2020£m
2019£m
Building projects currently under construction for which no depreciation has been charged during the year
6.1 19.6
Future capital expenditure which has been contracted for but not yet provided in the financial statements - property development and refurbishment
22.4 8.4
Cumulative interest charges capitalised as construction costs and included in land and buildings
4.9 4.4
The following items have been charged to the income statement as operating expenses during the year:
Depreciation of property, plant and equipment - leased 19.0 19.2
Depreciation of contract hire vehicles - leased 40.9 42.1
Depreciation of property, plant and equipment - owned 20.7 22.0
Cash flow statement information
Additions to property, plant, equipment and intangible assets:
Additions to land and buildings (16.9) (37.8)
Additions to plant and equipment (6.6) (10.9)
Additions to motor vehicles (35.8) (62.8)
Additions to intangible assets (see note 3.1) (4.6) (4.8)
Total additions (63.9) (116.3)
Less additions of property, plant and equipment acquired under finance leases for which no cash flow arises (see note 4.7)
9.3 8.0
Cash flows relating to additions of property, plant and equipment made by the US disposal group disclosed within assets held for sale
(5.6) (6.7)
Cash flows from investing activities in respect of additions to property, plant and equipment
(60.2) (115.0)
NOTES TO THE FINANCIAL STATEMENTS

137Pendragon PLC Annual Report 2020
SECTION 3 - OPERATING ASSETS AND LIABILITIES
3.3 Assets held for sale and discontinued operations
Accounting policy
Non-current assets that are expected to be recovered primarily through sale rather than through continuing use are
classified as held for sale. Immediately before classification as held for sale, the assets are measured in accordance with
the Group’s accounting policies. Thereafter the assets are measured at the lower of their carrying amount and fair value
less costs to sell. Impairment losses on remeasurement are recognised in the income statement. Gains are not recognised
in excess of any cumulative impairment loss. Non-current assets classified as held for sale are available for immediate sale
and a resultant disposal is highly probable within one year.
A non-current asset that stops being classified as held for sale is remeasured at the lower of its carrying amount prior to
the asset or disposal group being classified as held for sale, adjusted for any depreciation or amortisation that would have
been recognised if the asset had not been classified as held for sale, or, its recoverable amount at the date of the decision
not to sell.
Discontinued operations
The Group announced at the end of 2017 that it intended to dispose of the US motor business and had initiated an active
program to find a buyer. At the date of this report this program is still on going, with sales of the Aston Martin business
being concluded in July 2018, the sale of Jaguar Land Rover Mission Viejo and Newport Beach completed in 2019 and the
sale of the Chevrolet business completed in the first half of 2020 for proceeds of £16.6m. The sale of the Jaguar Land
Rover business in Los Angeles completed in January 2021 for proceeds of £16.3m. A further sale of the Jaguar Land Rover
business in Santa Monica is expected to be completed during the first half of 2021. As such the results of the US Business are
shown as a discontinued operation within these consolidated financial statements and its assets and liabilities reclassified
as held for sale as a disposal group. No impairment loss has been recognised in the income statement for the year ended
31 December 2020 in respect of this transaction.
The results of the discontinued operation are set out on the face of the consolidated income statement. Other financial
information relating to the discontinued operation for the period is set out below.
Assets and liabilities of a disposal Group held for sale
From 31 December 2018, the US motor business was classified as a disposal group which was stated at fair value less costs
to sell and comprised the following assets and liabilities.
2020£m
2019£m
Goodwill - 6.2
Other intangible assets - 0.1
Property, plant and equipment 50.4 61.7
Inventories 31.2 50.2
Trade and other receivables 10.0 19.1
Assets held for sale 91.6 137.3
Trade and other payables (67.3) (90.5)
Liabilities held for sale (67.3) (90.5)
NOTES TO THE FINANCIAL STATEMENTS
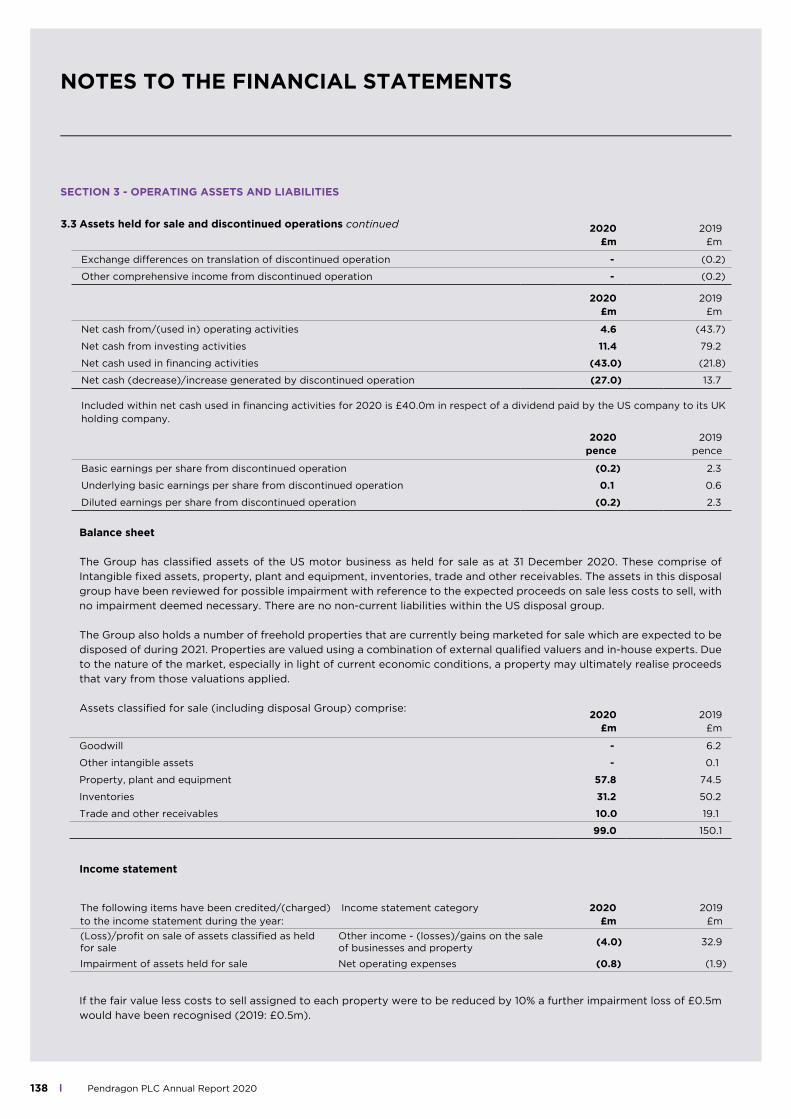
138 Pendragon PLC Annual Report 2020
The following items have been credited/(charged) to the income statement during the year:
Income statement category 2020£m
2019£m
(Loss)/profit on sale of assets classified as held for sale
Other income - (losses)/gains on the sale of businesses and property
(4.0) 32.9
Impairment of assets held for sale Net operating expenses (0.8) (1.9)
3.3 Assets held for sale and discontinued operations continued
Balance sheet
The Group has classified assets of the US motor business as held for sale as at 31 December 2020. These comprise of
Intangible fixed assets, property, plant and equipment, inventories, trade and other receivables. The assets in this disposal
group have been reviewed for possible impairment with reference to the expected proceeds on sale less costs to sell, with
no impairment deemed necessary. There are no non-current liabilities within the US disposal group.
The Group also holds a number of freehold properties that are currently being marketed for sale which are expected to be
disposed of during 2021. Properties are valued using a combination of external qualified valuers and in-house experts. Due
to the nature of the market, especially in light of current economic conditions, a property may ultimately realise proceeds
that vary from those valuations applied.
Assets classified for sale (including disposal Group) comprise:
Income statement
If the fair value less costs to sell assigned to each property were to be reduced by 10% a further impairment loss of £0.5m
would have been recognised (2019: £0.5m).
2020£m
2019£m
Goodwill - 6.2
Other intangible assets - 0.1
Property, plant and equipment 57.8 74.5
Inventories 31.2 50.2
Trade and other receivables 10.0 19.1
99.0 150.1
SECTION 3 - OPERATING ASSETS AND LIABILITIES
2020£m
2019£m
Exchange differences on translation of discontinued operation - (0.2)
Other comprehensive income from discontinued operation - (0.2)
2020£m
2019£m
Net cash from/(used in) operating activities 4.6 (43.7)
Net cash from investing activities 11.4 79.2
Net cash used in financing activities (43.0) (21.8)
Net cash (decrease)/increase generated by discontinued operation (27.0) 13.7
Included within net cash used in financing activities for 2020 is £40.0m in respect of a dividend paid by the US company to its UK holding company.
2020pence
2019pence
Basic earnings per share from discontinued operation (0.2) 2.3
Underlying basic earnings per share from discontinued operation 0.1 0.6
Diluted earnings per share from discontinued operation (0.2) 2.3
NOTES TO THE FINANCIAL STATEMENTS

139Pendragon PLC Annual Report 2020
Balance sheet
2020£m
2019£m
New and used vehicles 505.9 730.5
Consignment vehicles 81.7 79.5
Vehicle parts and other inventories 21.2 29.0
608.8 839.0
2020£m
2019£m
Inventories recognised as an expense during the year 2,535.0 3,977.8
Carrying value of inventories subject to retention of title clauses 544.2 726.4
Write-down of inventories to net realisable value 10.9 7.2
SECTION 3 - OPERATING ASSETS AND LIABILITIES
3.4 Inventories
Accounting policies
Motor vehicle inventories are stated at the lower of cost and net realisable value. Costs incurred in bringing each product
to its present location and condition are including and cost is based on price including delivery costs less specific trade
discounts. Fair value reviews of stock are conducted regularly utilising our market intelligence and analysis of the market
which we conduct by segment and by model, these fair values are updated in the light of any changing trends by model line.
The assessment of fair values involves an element of estimation: the Group takes the age profile of our inventories at the year
end, estimates the likely sale period and the expected profit or loss on sale to determine the fair value at the balance sheet
date. Whilst this data is deemed representative of current values it is possible that ultimate sales values can vary from those
applied. Parts inventories are based on an average purchase cost principle and are written down to net realisable value by
providing for obsolescence on a time in stock based formula approach.
Consignment vehicles are regarded as being effectively under the control of the Group and are included within inventories
on the balance sheet as the Group has the significant risks and rewards of ownership even though legal title has not yet
passed. The corresponding liability is included in trade and other payables. Movements in consignment vehicle inventory and
its corresponding liability within trade and other payables are not included within movements of inventories and payables
as stated in the consolidated cash flow statement as no cash flows arise in respect of these transactions until the vehicle is
either sold or purchased at which point it is reclassified within new and used vehicle inventory.
Motor vehicles are transferred from contract hire activities at the end of their lease term to inventory at their depreciated
cost. No physical cash flow arises from these transfers.
The key assumptions underpinning the net realisable value of UK used vehicle inventory are (i) the time to sell each vehicle;
(ii) the expected sales price at the date of sale. If the average time to sell a vehicle is increased by 30 days then it would
reduce the value of UK used vehicle inventory by £2.4m. If the expected sales price at the date of sale were to decrease by
£500 per vehicle then it would reduce the value of UK used vehicle inventory by £4.5m (2019: ‘if our assumptions were £500
per unit worse for used vehicles that expected to make a loss per unit’ £2.4m) at the balance sheet date.
Cash flow statement information 2020
£m20191
£m
Movement in inventory 230.2 120.6
Inventory changes in business combinations and disposals - (2.9)
Impact of exchange differences 0.3 0.5
Non cash movement in consignment vehicles 2.2 7.7
Classified as held for sale 17.8 11.5
Transfer value of contract hire vehicles from fixed assets to inventory 44.3 49.3
Cash flow decrease due to movements in inventory 294.8 186.7
NOTES TO THE FINANCIAL STATEMENTS
1 There was a typographic error in this note in the 2019 accounts that has now been corrected

140 Pendragon PLC Annual Report 2020
SECTION 3 - OPERATING ASSETS AND LIABILITIES
3.5 Movement in contract hire vehicle balance
3.6 Trade and other receivables
Accounting policy
Trade and other receivables are recognised initially at fair value and are subsequently stated at amortised cost using the
effective interest method, less any impairment losses.
Impairment losses are measured in accordance with IFRS 9, which is based on an ‘expected credit loss’ (ECL) model. The
impairment model applies to financial assets measured at amortised cost.
The calculation of ECLs are a probability-weighted estimate of credit losses. Credit losses are measured as the present
value of all cash shortfalls (i.e. the difference between the cash flows due to the entity in accordance with the contract and
the cash flows that the Group expects to receive).
The Group considers a trade or other receivable to be in default when the borrower is unlikely to pay its credit obligations
to the Group in full after all reasonable actions have been taken to recover the debt.
Credit risk management
The Group is exposed to credit risk primarily in respect of its trade receivables and financial assets. Trade receivables are
stated net of provision for estimated impairment losses. Exposure to credit risk in respect of trade receivables is mitigated
by the Group’s policy of only granting credit to certain customers after an appropriate evaluation of credit risk. Credit risk
arises in respect of amounts due from vehicle manufacturers in relation to bonuses and warranty receivables. This risk is
mitigated by the range of manufacturers dealt with, the Group’s procedures in effecting timely collection of amounts due
and management’s belief that it does not expect any manufacturer to fail to meet its obligations. Financial assets comprise
trade and other receivables (as above) and cash balances. The counterparties are banks and management does not expect
any counterparty to fail to meet its obligations. The maximum exposure to credit risk is represented by the carrying
amount of each financial asset, including derivative financial instruments, in the balance sheet.
Before granting any new customer credit terms the Group uses external credit scoring systems to assess the potential new
customer’s credit quality and defines credit limits by customer. These limits and credit worthiness are regularly reviewed
and use is made of monitoring alerts provided by the providers of the credit scoring systems. The Group has no customer
that represents more than 5% of the total balance of trade receivables.
2020£m
2019£m
Depreciation 40.9 42.1
Changes in trade and other payables and deferred income (16.5) 13.3
Purchases of contract hire vehicles (72.6) (107.9)
Unwinding of discounts in contract hire residual values (3.1) (3.1)
(51.3) (55.6)
NOTES TO THE FINANCIAL STATEMENTS

141Pendragon PLC Annual Report 2020
SECTION 3 - OPERATING ASSETS AND LIABILITIES
3.6 Trade and other receivables continued
All amounts are due within one year with the exception of £0.2m other receivables and finance lease receivables.
All trade receivables are classified as loans and receivables and held at amortised cost in the current year and prior
year.
Total trade receivables held by the Group at 31 December 2020 was £40.6m (2019: £50.9m). This includes trade receivables
that have been classified as held for sale of £2.6m (2019: £8.9m).
The average credit period taken on sales of goods is 29 days (2019: 29 days). No interest is charged on trade receivables.
The Group makes an impairment provision based on the expected credit losses it deems likely to incur. The calculation
is based on an average of previous default experiences which is assessed against the risk of the current total in light of
current economic expectations. An expense has been recognised in respect of impairment losses during the year of £0.3m
(2019: £0.6m).
The ageing of trade and other receivables at the reporting date was:
Balance sheet
2020£m
2019£m
Trade receivables 38.4 42.4
Allowance for doubtful debts (0.4) (0.4)
38.0 42.0
Accrued manufacturer rebate receivables 17.8 25.3
Other receivables 36.7 34.7
Prepayments 2.1 4.9
94.6 106.9
Tradereceivables
2020£m
Manufacturer bonus
receivables 2020
£m
Otherreceivables
2020 £m
Tradereceivables
2019 £m
Manufacturer bonus
receivables 2019
£m
Otherreceivables
2019 £m
Not past due 25.0 13.7 32.1 28.6 17.4 33.9
Past due 0-30 days 10.4 2.3 2.5 9.7 4.4 0.5
Past due 31-120 days 1.6 1.8 2.1 3.4 3.5 0.3
Past due 120+ days 1.4 - - 0.7 - -
38.4 17.8 36.7 42.4 25.3 34.7
Provision for impairment (0.4) - - (0.4) - -
38.0 17.8 36.7 42.0 25.3 34.7
NOTES TO THE FINANCIAL STATEMENTS

142 Pendragon PLC Annual Report 2020
SECTION 3 - OPERATING ASSETS AND LIABILITIES
3.6 Trade and other receivables continued
The movement in the allowance for impairment in respect of trade receivables during the year was as follows:
The Directors consider that the carrying amount of trade and other receivables approximates their fair value.
Finance lease receivables
Where the Group acts as a lessor of properties of which it is a lessee and the term of the head lease and sub lease are
coterminous, rather than recognise a right of use asset the Group recognises a finance lease receivable which is measured
at the net present value of future cash receipts discounted at the Groups incremental borrowing rate. The finance income
element of rentals received under these leases is credited so as to give a constant rate of finance income on the remainder
of the obligation. Finance income is credited in the income statement. The finance lease receivable is reduced by rentals
received and increased by the interest income recognised.
Finance lease rentals are invoiced quarterly on standard rent quarter days, no credit terms are extended beyond these
dates. Expected credit losses in respect of finance lease receivables are deemed immaterial.
2020£m
2019£m
Non-current 16.6 20.6
Current 2.0 2.4
18.6 23.0
NOTES TO THE FINANCIAL STATEMENTS
2020£m
2019£m
Balance at 1 January 0.4 0.4
Utilisation (0.6) (0.5)
Impairment loss recognised 0.6 0.5
Balance at 31 December 0.4 0.4
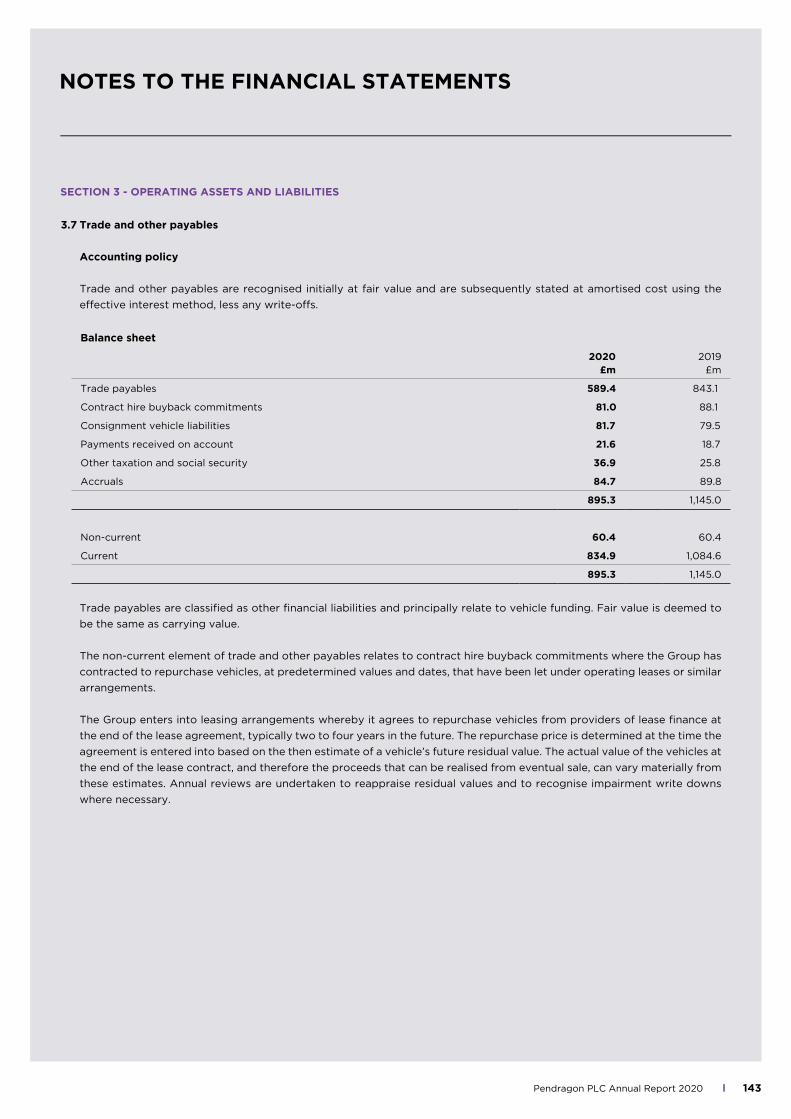
143Pendragon PLC Annual Report 2020
SECTION 3 - OPERATING ASSETS AND LIABILITIES
3.7 Trade and other payables
Accounting policy
Trade and other payables are recognised initially at fair value and are subsequently stated at amortised cost using the
effective interest method, less any write-offs.
Trade payables are classified as other financial liabilities and principally relate to vehicle funding. Fair value is deemed to
be the same as carrying value.
The non-current element of trade and other payables relates to contract hire buyback commitments where the Group has
contracted to repurchase vehicles, at predetermined values and dates, that have been let under operating leases or similar
arrangements.
The Group enters into leasing arrangements whereby it agrees to repurchase vehicles from providers of lease finance at
the end of the lease agreement, typically two to four years in the future. The repurchase price is determined at the time the
agreement is entered into based on the then estimate of a vehicle’s future residual value. The actual value of the vehicles at
the end of the lease contract, and therefore the proceeds that can be realised from eventual sale, can vary materially from
these estimates. Annual reviews are undertaken to reappraise residual values and to recognise impairment write downs
where necessary.
Balance sheet
2020£m
2019£m
Trade payables 589.4 843.1
Contract hire buyback commitments 81.0 88.1
Consignment vehicle liabilities 81.7 79.5
Payments received on account 21.6 18.7
Other taxation and social security 36.9 25.8
Accruals 84.7 89.8
895.3 1,145.0
Non-current 60.4 60.4
Current 834.9 1,084.6
895.3 1,145.0
NOTES TO THE FINANCIAL STATEMENTS

144 Pendragon PLC Annual Report 2020
SECTION 3 - OPERATING ASSETS AND LIABILITIES
3.8 Deferred income
Warranty policies sold
The income received in respect of warranty policies sold and administered by the Group is recognised over the period of
the policy on a straight line basis. The unrecognised income is held within deferred income.
Contract hire
Vehicles supplied to a leasing group for contract hire purposes where the Group undertakes to repurchase the vehicle
at a predetermined date are accounted for in accordance with IFRS 16 Leases, where the Group is considered to be an
operating lessor for all arrangements in place. The initial amounts received in consideration from the leasing group are
allocated between the present value of the repurchase commitment, held within trade and other payables and a residual
amount of deferred revenue held within deferred income. The deferred revenue, which effectively represents rentals
received in advance, is taken to the income statement on a straight line basis over the related lease term.
The deferred income balance at 31 December for warranty policies and contract hire is the aggregate transaction price
allocated to performance obligations that are unsatisfied or partly satisfied at the reporting date. No information is
provided about remaining performance obligations at 31 December 2020 or 31 December 2019 that have an original
expected duration of one year or less as allowed by IFRS 15.
Warranty policies
£m
Contract hire £m
Total £m
At 1 January 2020 19.4 78.1 97.5
Created in the year 14.6 31.5 46.1
Recognised as income during the year (11.9) (40.9) (52.8)
Recognised as income and utilised against warranty claims (7.1) - (7.1)
At 31 December 2020 15.0 68.7 83.7
Non-current 4.8 36.0 40.8
Current 10.2 32.7 42.9
15.0 68.7 83.7
Recognition of opening balance as at 31 December 2019
Recognised during the year 14.0 36.9 50.9
Carried forward at 31 December 2020 5.4 41.2 46.6
19.4 78.1 97.5
NOTES TO THE FINANCIAL STATEMENTS

145Pendragon PLC Annual Report 2020
SECTION 4 - FINANCING ACTIVITIES AND CAPITAL STRUCTURE
This section contains the notes and information to support the elements of both net debt and equity financing as presented
in the Consolidated Balance Sheet.
4.1 Accounting policies 4.5 Dividends
4.2 Financial instruments and derivatives 4.6 Share based compensation
4.3 Net financing costs 4.7 Leases
4.4 Capital and reserves
4.1 Accounting policies
IFRS 9 requires an entity to recognise a financial asset or a financial liability in its statement of financial position when it
becomes party to the contractual provisions of the instrument. At initial recognition, an entity measures a financial asset or
a financial liability at its fair value plus or minus, in the case of a financial asset or a financial liability not at fair value through
profit or loss, transaction costs that are directly attributable to the acquisition or issue of the financial asset or the financial
liability. Subsequent to initial recognition financial assets and financial liabilities are classified and measured as described
below.
Financial assets
IFRS 9 classifies assets according to the business model for their realisation, as determined by the expected contractual
cashflows. This classification determines the accounting treatment, and the classification under IFRS 9 is by reference to
the accounting treatment i.e. amortised cost, fair value through other comprehensive income or fair value through profit
and loss.
A financial asset is measured at amortised cost if both of the following conditions are met:
the asset is held within a business model whose objective is to hold assets in order to collect contractual cash flows; and
the contractual terms of the financial asset give rise on specified dates to cash flows that are solely payments of principal
and interest on the principal amount outstanding.
Financial assets are therefore classified and measured in these financial statements at amortised cost.
The Group recognises loss allowances for expected credit losses (ECLs) on financial assets measured at amortised cost,
debt investments measured at FVOCI and contract assets (as defined in IFRS 15).
The Group measures loss allowances at an amount equal to lifetime ECL, except for other debt securities and bank balances
for which credit risk (i.e. the risk of default occurring over the expected life of the financial instrument) has not increased
significantly since initial recognition which are measured as 12-month ECL.
Loss allowances for trade receivables and contract assets are always measured at an amount equal to lifetime ECL.
When determining whether the credit risk of a financial asset has increased significantly since initial recognition and when
estimating ECL, the Group considers reasonable and supportable information that is relevant and available without undue
cost or effort. This includes both quantitative and qualitative information and analysis, based on the Group’s historical
experience and informed credit assessment and including forward-looking information.
The Group assumes that the credit risk on a financial asset has increased significantly if it is more than 30 days past due.
The Group considers a financial asset to be in default when:
• the borrower is unlikely to pay its credit obligations to the Group in full, without recourse by the Group to actions such
as realising security (if any is held); or
• the financial asset is more than 90 days past due.
NOTES TO THE FINANCIAL STATEMENTS

146 Pendragon PLC Annual Report 2020
SECTION 4 - FINANCING ACTIVITIES AND CAPITAL STRUCTURE
4.1 Accounting policies continued
Lifetime ECLs are the ECLs that result from all possible default events over the expected life of a financial instrument.
12-month ECLs are the portion of ECLs that result from default events that are possible within the 12 months after the
reporting date (or a shorter period if the expected life of the instrument is less than 12 months).
The maximum period considered when estimating ECLs is the maximum contractual period over which the Group is
exposed to credit risk.
Measurement of ECLs
ECLs are a probability-weighted estimate of credit losses. Credit losses are measured as the present value of all cash
shortfalls (i.e. the difference between the cash flows due to the entity in accordance with the contract and the cash flows
that the Group expects to receive). ECLs are discounted at the effective interest rate of the financial asset.
Credit-impaired financial assets
At each reporting date, the Group assesses whether financial assets carried at amortised cost and debt securities at FVOCI
are credit-impaired. A financial asset is ‘credit-impaired’ when one or more events that have a detrimental impact on the
estimated future cash flows of the financial asset have occurred.
Write-offs
The gross carrying amount of a financial asset is written off (either partially or in full) to the extent that there is no realistic
prospect of recovery.
Impairment of financial assets
IFRS 9 adopts an expected credit loss approach (ECL). The IFRS 9 approach does not require a credit event (an actual
loss or a debt past a number of days due) to occur but is based on changes in expectations of credit losses. IFRS 9 also
requires that impairment of financial assets be shown as a separate line item in either the statement of comprehensive
income or the income statement.
Trade and other receivables - see note 3.6
Cash and cash equivalents
Cash and cash equivalents comprise cash in hand and demand deposits, and other short term highly liquid investments
that are readily convertible to a known amount of cash and are subject to an insignificant risk of changes in value.
Financial assets
IFRS 9classification £m
Trade and other receivables Amortised cost 92.5
Finance lease receivables Amortised cost 18.6
Cash and cash equivalents Amortised cost 56.0
NOTES TO THE FINANCIAL STATEMENTS

147Pendragon PLC Annual Report 2020
SECTION 4 - FINANCING ACTIVITIES AND CAPITAL STRUCTURE
4.1 Accounting policies continued
Loans and borrowings
Interest-bearing loans and borrowings are recognised initially at fair value less attributable transaction costs. Subsequent
to initial recognition, interest-bearing borrowings are stated at amortised cost with any difference between cost and
redemption value being recognised in the income statement over the period of the borrowings on an effective interest
basis. The effective interest basis is a method of calculating the amortised cost of a financial liability and of allocating
interest payments over the relevant period. The effective interest rate is the rate that exactly discounts estimated future
cash payments through the expected life of the financial liability, or where appropriate, a shorter period.
Trade and other payables - see note 3.7
Hedging Instruments
The Group holds hedging instruments to hedge currency risks arising from its activities. Hedging instruments are recognised
at fair value. Any gain or loss on remeasurement is recognised in the income statement. However, the treatment of gains or
losses arising from hedging instruments which qualify for hedge accounting depends on the type of hedge arrangement.
The fair value of hedging instruments is the estimated amount receivable or payable to terminate the contract determined
by reference to the market prices prevailing at the balance sheet date. The only hedging instrument held by the Group at
the balance sheet date was its borrowing in USD to hedge its investment in overseas operations. A gain or loss in respect
of an effective hedge of a net investment in an overseas operation is recognised directly in equity. Any ineffective portion
of the hedge is recognised in the income statement.
4.2 Financial instruments and derivatives
Net Debt 2020£m
2019£m
Cash and cash equivalents 56.0 55.7
Non-current interest bearing loans and borrowings (156.4) (175.4)
(100.4) (119.7)
The Group has on adoption of IFRS 16 Leases excluded Finance Lease liabilities from its measure of Net Debt. Full details
of lease liabilities are presented in note 4.7.
Cash and cash equivalents
Bank balances and bank overdrafts set out below are stated net of legal rightsof set-off resulting from pooling arrangements
operated by individual banks.Carrying valueand fair value
2020£m
Carrying value and fair value
2019£m
Bank balances and cash equivalents 56.0 55.7
Borrowings
As at 31 December 2020, the Group had a £175m credit facility and a £60m senior note, expiring as set out below:
Expiry Date £m
Revolving credit facility March 2022 175.0
Senior note March 2023 60.0
235.0
NOTES TO THE FINANCIAL STATEMENTS

148 Pendragon PLC Annual Report 2020
SECTION 4 - FINANCING ACTIVITIES AND CAPITAL STRUCTURE
4.2 Financial instruments and derivatives continued
During 2016 the Group signed a £240.0m 5 year committed bank facility and a £60.0m 5.75% 7 year debt private placement.
The fees and expenses associated with this debt of £2.1m are amortised over the expected life of the facility commencing
in 2016 and as at 31 December 2020 it was fully amortised, the remaining £0.1m as at 31 December 2019 being amortised
during the year. In March 2020, the Revolving credit facility was extended for a further year to March 2022 incurring fees
and costs of £1.8m to be amortised over the expected life of the facility. At 31 December 2020, £1.35m had been amortised
and £0.45m remains to be amortised in future periods.
The margin on the revolving credit facility varies according to a ratchet mechanism linked to the ratio of net debt to
underlying EBITDA (after stocking interest), measured on a rolling twelve month basis every quarter, plus increasing
margin uplifts on a quarterly basis. At 31 December 2020, the margin was 1.75%, consequent on the Group having achieved
a ratio of under 0.5 for the twelve month period ended 30 September 2020, plus cumulative quarterly uplifts of a further
0.75%. The commitment fee is calculated at 35% of the margin. The interest rate in respect of the senior note is a fixed rate
of 5.75% until maturity.
The revolving credit facility and the senior note are both subject to the same performance covenants with respect to
leverage and fixed charge cover. The Group complied with these covenants during the period.
The leverage covenant is calculated at the ratio of net debt to underlying profit before tax, depreciation, amortisation and
finance charges (excluding vehicle stocking plan interest charges disclosed in note 4.3) calculated on an IAS 17 basis. This
ratio can not exceed 3.00 times. At 31 December 2020 the ratio was 1.36 times.
The fixed charge cover covenant is calculated as the ratio of underlying profit before tax, depreciation, amortisation and
finance charges (excluding vehicle stocking plan interest charges disclosed in note 4.3) calculated on an IAS 17 basis plus
rent paid to finance charges (excluding vehicle stocking plan interest charges disclosed in note 4.3) plus rent paid. This
ratio must exceed 1.60 times. At 31 December 2020 the ratio was 2.46 times.
Security
Both the revolving credit facility and the senior note are unsecured and rank pari-passu.
Amendment and extension of the revolving credit facility
With effect from 2 March 2021 the maturity of the revolving credit facility has been extended to 1 March 2023. The margin
uplift mechanism has been replaced by a flat margin of 4.85%, increasing to 6.00% by 1 October 2021 and by a further
0.25% each quarter commencing 1 January 2023.
Current margin
Commitment (non-utilisation)
fee
Revolving credit facility 2.50% 0.88%
Senior note 5.75% n/a
NOTES TO THE FINANCIAL STATEMENTS

149Pendragon PLC Annual Report 2020
Summary of borrowings
Carrying value2020
£m
Fair value2020
£m
Carrying value2019
£m
Fair value2019
£m
Non-current:
Bank borrowings 96.2 96.2 115.2 115.2
5.75% Senior note 2023 60.0 60.0 60.0 60.0
Other loan notes 0.2 0.2 0.2 0.2
Finance leases 218.7 218.7 237.8 237.8
Total non-current 375.1 375.1 413.2 413.2
Finance leases 24.5 24.5 23.9 23.9
Total current 24.5 24.5 23.9 23.9
Total borrowings 399.6 399.6 437.1 437.1
SECTION 4 - FINANCING ACTIVITIES AND CAPITAL STRUCTURE
NOTES TO THE FINANCIAL STATEMENTS
4.2 Financial instruments and derivatives continued

150 Pendragon PLC Annual Report 2020
SECTION 4 - FINANCING ACTIVITIES AND CAPITAL STRUCTURE
4.2 Financial instruments and derivatives continued
Reconciliation of movements of liabilities to cash flows arising from financing activities
Long termborrowings
£m
FinanceLease
£m
Share capital
£m
Other reserves
£m
Retained earnings
£m Total
£m
At 1 January 2020 175.4 261.7 69.9 74.0 25.0 640.8
Cash flows from financing activities
Payment of lease liabilities - (23.6) - - - (23.6)
Repayment of loans (40.0) - - - - (40.0)
Proceeds from issue of loans 18.2 - - - - 18.2
(21.8) (23.6) - - - (45.4)
Other changes
The effect of changes in foreign exchange rates 1.3 - - - - 1.3
New finance leases undertaken - non cash - 9.3 - - - 9.3
Disposal of finance leases - non cash - (4.3) - - - (4.3)
Liability-related : Lease expenses - non cash - 0.1 - - - 0.1
Liability-related : Amortisation of fees and expenses 1.5 - - - - 1.5
Equity-related : Total other changes - - - - (42.2) (42.2)
At 31 December 2020 156.4 243.2 69.9 74.0 (17.2) 526.3
Interest payments in respect of the above borrowings are reported in operating cash flows in the Consolidated Cash Flow
Statement.
Fair value hierarchy
Financial instruments carried at fair value are required to be measured by reference to the following levels:
Level 1: quoted prices in active markets for identical assets or liabilities
Level 2: inputs other than quoted prices included within Level 1 that are observable for the asset or liability, either directly
(i.e. as prices) or indirectly (i.e. derived from prices)
Level 3: inputs for the asset or liability that are not based on observable market data (unobservable inputs)
The revolving credit facility and senior note have been measured by a Level 2 valuation method.
____Borrowings___ __________Equity_________
NOTES TO THE FINANCIAL STATEMENTS
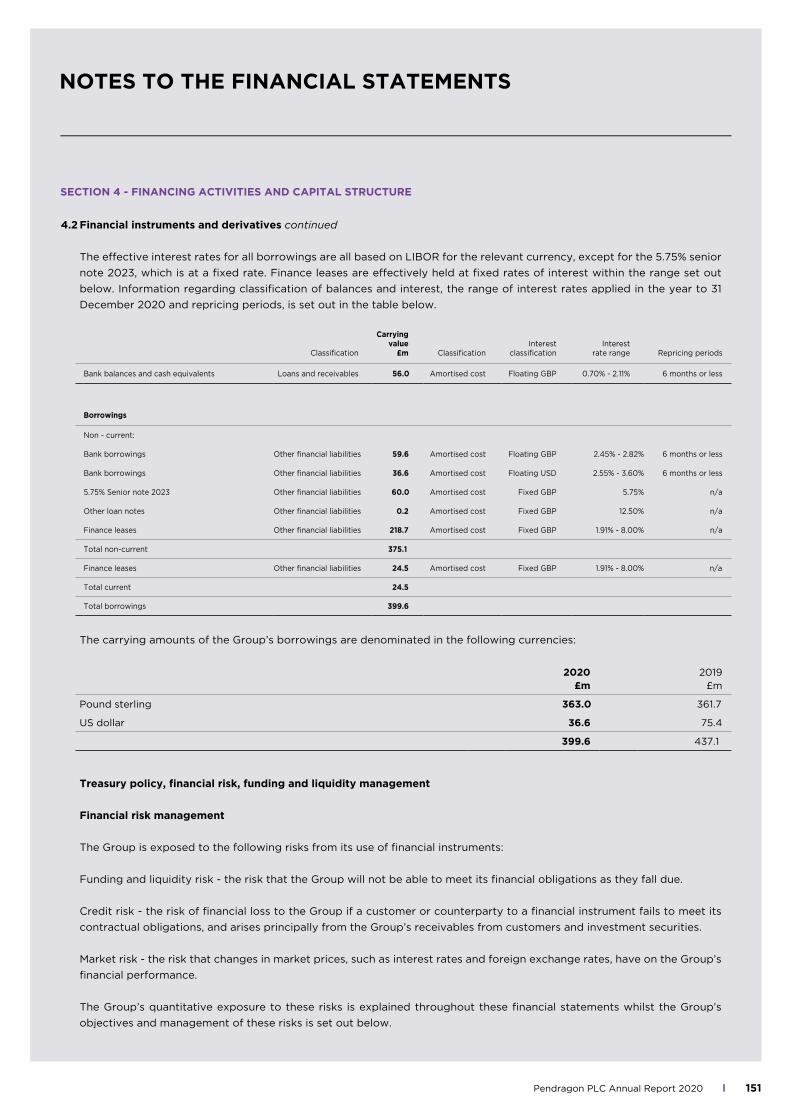
151Pendragon PLC Annual Report 2020
SECTION 4 - FINANCING ACTIVITIES AND CAPITAL STRUCTURE
4.2 Financial instruments and derivatives continued
The effective interest rates for all borrowings are all based on LIBOR for the relevant currency, except for the 5.75% senior
note 2023, which is at a fixed rate. Finance leases are effectively held at fixed rates of interest within the range set out
below. Information regarding classification of balances and interest, the range of interest rates applied in the year to 31
December 2020 and repricing periods, is set out in the table below.
The carrying amounts of the Group’s borrowings are denominated in the following currencies:
Treasury policy, financial risk, funding and liquidity management
Financial risk management
The Group is exposed to the following risks from its use of financial instruments:
Funding and liquidity risk - the risk that the Group will not be able to meet its financial obligations as they fall due.
Credit risk - the risk of financial loss to the Group if a customer or counterparty to a financial instrument fails to meet its
contractual obligations, and arises principally from the Group’s receivables from customers and investment securities.
Market risk - the risk that changes in market prices, such as interest rates and foreign exchange rates, have on the Group’s
financial performance.
The Group’s quantitative exposure to these risks is explained throughout these financial statements whilst the Group’s
objectives and management of these risks is set out below.
Classification
Carrying value £m
Classification
Interest classification
Interest rate range Repricing periods
Bank balances and cash equivalents Loans and receivables 56.0 Amortised cost Floating GBP 0.70% - 2.11% 6 months or less
Borrowings
Non - current:
Bank borrowings Other financial liabilities 59.6 Amortised cost Floating GBP 2.45% - 2.82% 6 months or less
Bank borrowings Other financial liabilities 36.6 Amortised cost Floating USD 2.55% - 3.60% 6 months or less
5.75% Senior note 2023 Other financial liabilities 60.0 Amortised cost Fixed GBP 5.75% n/a
Other loan notes Other financial liabilities 0.2 Amortised cost Fixed GBP 12.50% n/a
Finance leases Other financial liabilities 218.7 Amortised cost Fixed GBP 1.91% - 8.00% n/a
Total non-current 375.1
Finance leases Other financial liabilities 24.5 Amortised cost Fixed GBP 1.91% - 8.00% n/a
Total current 24.5
Total borrowings 399.6
2020 £m
2019 £m
Pound sterling 363.0 361.7
US dollar 36.6 75.4
399.6 437.1
NOTES TO THE FINANCIAL STATEMENTS

152 Pendragon PLC Annual Report 2020
SECTION 4 - FINANCING ACTIVITIES AND CAPITAL STRUCTURE
4.2 Financial instruments and derivatives continued
Treasury policy and procedures
Group treasury matters are managed within policy guidelines set by the Board with prime areas of focus being liquidity,
interest rate and foreign exchange exposure. Management of these areas is the responsibility of the Group’s central
treasury function. Hedging financial instruments are utilised to reduce exposure to movements in foreign exchange rates.
The Board does not permit the speculative use of derivatives.
Funding and liquidity management
The Group is financed primarily by its issued Senior note, revolving credit facility, vehicle stocking credit lines and operating
cash flow. Committed facilities mature within appropriate timescales, are maintained at levels in excess of planned
requirements and are in addition to short term uncommitted facilities that are also available to the Group.
Each business within the Group is responsible for its own day-to-day cash management and the overall cash position is
monitored on a daily basis by the Group treasury department.
The maturity of non-current borrowings is as follows, excluding finance lease liabilities:
Maturities include amounts drawn under revolving credit facilities which are contractually repayable generally within a
month of the year end but which may be redrawn at the Group’s option. The maturities above therefore represent the final
repayment dates for these facilities. If the amounts drawn at the year end were redrawn at the Group’s usual practice of
monthly drawings, the total cash outflows associated with all borrowings, assuming interest rates remain at the same rates
as at the year end, are estimated on an undiscounted basis as follows:
2020 £m
2019 £m
Between 1 and 2 years 96.2 115.2
Between 2 and 5 years 60.2 60.2
156.4 175.4
Carrying amount
Contractual cashflows
Within 6 months
6 - 12 months 1-2 years 2-5 years
over 5 years
Bank borrowings 96.2 99.2 1.2 1.2 96.8 - -
Senior note 60.0 67.8 1.7 1.7 3.5 60.9 -
Loan notes 0.2 0.4 - - - 0.4 -
156.4 167.4 2.9 2.9 100.3 61.3 -
Finance leases 243.2 349.3 18.8 18.2 35.9 99.0 177.4
Trade payables (including vehicle stocking credit lines)
589.4 596.0 373.3 222.7 - - -
989.0 1,112.7 395.0 243.8 136.2 160.3 177.4
The Group has the following undrawn borrowing facilities:
2020 £m
2019 £m
Expiring in 1-2 years 78.8 -
Expiring in more than two years - 122.7
NOTES TO THE FINANCIAL STATEMENTS

153Pendragon PLC Annual Report 2020
SECTION 4 - FINANCING ACTIVITIES AND CAPITAL STRUCTURE
4.2 Financial instruments and derivatives continued
Interest rate risk management
The objective of the Group’s interest rate policy is to minimise interest costs whilst protecting the Group from adverse
movements in interest rates. Borrowings issued at variable rates expose the Group to cash flow interest rate risk whereas
borrowings issued at fixed rates expose the Group to fair value interest rate risk. The Group does not actively manage cash
flow interest rate risk as the Board believes that the retail sector in which the Group operates provides a natural hedge
against interest rate movements. Consequently, it is normal Group policy to borrow on a floating rate basis and all fair value
interest rate risk arising from fixed rate borrowings entered into by the Group are usually managed by swaps into floating
rate. However, the Group decided on a deviation from this policy in respect of its former 6.875% bond 2020. This bond was
issued at a fixed rate of interest and, due to the historically low rates in current floating interest rates, there was relatively
low downside risk in maintaining the bond at fixed rate. This policy has been continued in respect of the Group’s £60.0m
Senior note 2023.
Interest rate risk sensitivity analysis
As some of the Group’s borrowings and vehicle stocking credit lines are floating rate instruments they therefore have a
sensitivity to changes in market rates of interest. The table below shows the effect of a 100 basis points change in interest
rates for floating rate instruments outstanding at the period end, showing how profit or loss would have varied in the
period on the assumption that the instruments at the period end were outstanding for the entire period.
Foreign exchange risk management
The Group faces currency risk in respect of its net assets denominated in currencies other than sterling. On translation
into sterling, movements in currency will affect the value of these assets. The Group’s policy is therefore to match, where
possible, net assets in overseas subsidiaries which are denominated in a foreign currency with borrowings in the same
currency. With several US assets disposed of during the year, the hedging requirement has decreased. The Group has
therefore borrowed USD 50.0m (2019: USD 100.0m) against its net assets held in overseas subsidiaries.
Profit/(loss)2020
£m
Profit/(loss) 2019 £m
100 basis points increase (4.5) (4.7)
Tax effect 0.9 0.9
Effect on net assets (3.6) (3.8)
100 basis points decrease 4.5 4.7
Tax effect (0.9) (0.9)
Effect on net assets 3.6 3.8
NOTES TO THE FINANCIAL STATEMENTS

154 Pendragon PLC Annual Report 2020
SECTION 4 - FINANCING ACTIVITIES AND CAPITAL STRUCTURE
4.2 Financial instruments and derivatives continued
Hedges of net investments in overseas operations
A gain or loss in respect of an effective hedge of a net investment in an overseas operation is recognised directly in equity.
Any ineffective portion of the hedge is recognised in the income statement.
Included within bank borrowings are balances denominated in US dollars which are designated as a hedge of the net
investment in the Group’s US subsidiaries. Foreign exchange differences on translation of the borrowings to sterling at
the balance sheet date are recognised within the translation differences reserve in equity, net of exchange differences in
respect of the net investments being hedged.
Capital management
The Group views its financial capital resources as primarily comprising share capital, issued Senior note, bank loans, vehicle
stocking credit lines and operating cashflow.
Core debt i.e. total debt required to fund the Group’s net debt : underlying EBITDA target of 1.0 to 1.5, is essentially funded
by the Group’s issued Senior note and revolving credit facility. The Group requires its revolving credit facility to fund its
day-to-day working capital requirements. A fundamental element of the Group’s financial resources revolves around the
provision of vehicle and parts stocking credit lines, provided by the vehicle manufacturers’ funding arms and other third
party providers. The Group’s funding of its vehicle and parts inventories is set out below:
When considering vehicle stocks from a funding risk view point we split the funding into that which is funded by the vehicle
manufacturers through their related finance arms and that funded through third party stock finance facilities and bank
borrowings. Financing for stock other than through bank borrowings is shown in trade creditors in the balance sheet. The
maturity analysis on page 152 includes stock finance facilities.
2020 $m
2019 $m
Aggregate fair value of borrowings designated as hedge of net investment in the Group's US subsidiaries
50.0 100.0
£m £m
Foreign exchange (losses)/gains on translation of borrowings to sterling at balance sheet date
(1.3) 3.0
Foreign exchange gains/(losses) on translation of net investments to sterling at balance sheet date
1.3 (3.2)
Net exchange gain/(loss) recognised within translation reserve in equity - (0.2)
2020 £m
2019 £m
Manufacturer finance arm 360.8 474.7
Third party stock finance 183.4 280.7
Bank 64.6 83.6
Total inventories 608.8 839.0
NOTES TO THE FINANCIAL STATEMENTS

155Pendragon PLC Annual Report 2020
SECTION 4 - FINANCING ACTIVITIES AND CAPITAL STRUCTURE
4.2 Financial instruments and derivatives continued
The third party stock facilities have prescribed limits and can be used to fund virtually any vehicle. Any undrawn amount
is therefore directly relatable to the ability of the Group to increase inventory and fund it accordingly. Undrawn third
party stock finance facilities at 31 December 2020 amounted to £147.0m (2019: £47.0m). In contrast, manufacturer limits
vary with the manufacturer’s requirements (depending on the amount of stocks each manufacturer wishes to put into the
network, which varies depending on the time of year and level of production) and are therefore not directly related to the
Group’s liquidity: it is therefore not appropriate to quote an undrawn facility.
The key contractual terms of the facilities (both manufacturer and third party) are:
• The facilities are usually structured as an agency to purchase vehicles on behalf of the funder .
• Those vehicles are immediately sold back to Pendragon on deferred payment terms .
• Legal title to the vehicles thus remains with the funder as the funder has purchased the vehicles (via the dealer as agent)
and has an unpaid invoice (either in part or in full) outstanding from Pendragon.
• The unpaid invoice is therefore trade credit and is accounted for as a trade payable in the financial statements.
• The payment terms for the invoice vary with the type of vehicle.
• A new vehicle invoice typically requires no upfront deposit payment (a new i.e. unregistered vehicle, does not
depreciate) and remains outstanding for varying periods up to 360 days.
• A used vehicle invoice typically requires an immediate payment of c.10% i.e. so that the effective “loan to value”
given for the vehicle is c.90%. As a used vehicle depreciates with age and mileage, periodic instalment payments
might also be required, for example 2% per month or 10% at day 90.
• Interest is payable in respect of the unpaid invoice. Most new vehicle invoices from manufacturers have an interest free
period followed by commercial rates of interest. Interest rates from third party stock funders are at a commercial rate
from the start.
Payment of any outstanding amounts is due on the earlier of the sale of the vehicle by Pendragon to a customer, or upon
the expiry of a pre-determined maturity period. The maturity period varies by funder and by type of vehicle but is up to
360 days in respect of new vehicles and 330 days in respect of used vehicles.
Manufacturer facility agreements are tied to the franchise agreement i.e. for as long as the franchise agreement is
operational the manufacturer will provide funding facilities to enable the franchisee to sell the product. Other than that,
the normal provisions regarding immediate termination due to an insolvency event or change of control would apply.
Third party facility agreements are uncommitted and can be terminated immediately upon default or upon written notice
by either party; those notice periods vary by agreement but can be from 30-120 days. In practice, if notice is given, no
new contracts for funding individual vehicles would be entered into by the funding partner and the facility in respect of
each individual vehicle would be paid down over time as normal i.e. on the earlier of the normal maturity of the facility for
a particular vehicle or upon sale of the vehicle to a customer. Despite the uncommitted nature of the agreements, most
relationships with funders are of a long standing nature. All of the Group’s stock funding partners were supportive during
the period’s Covid closures, by suspending payments due on their respective facilities.
NOTES TO THE FINANCIAL STATEMENTS

156 Pendragon PLC Annual Report 2020
SECTION 4 - FINANCING ACTIVITIES AND CAPITAL STRUCTURE
4.2 Financial instruments and derivatives continued
The Group is also responsible for funding the pension deficit. The total financial resources required by the Group to fund
itself at 31 December 2020 comprises:
The Board’s policy is to maintain a strong capital base to maintain market confidence and to sustain the development of
the business, whilst maximising the return on capital to the Group’s shareholders. The Group’s strategy will be to maintain
facilities appropriate to the working requirements of the Group and to service its debt requirements through generating
cash flow. The Group uses a leverage ratio based on net debt : underlying EBITDA ratio as key indicator of its capital
management. At 31 December 2020 the leverage ratio achieved was 0.8 : 1, calculated as follows:
2020 £m
2019 £m
Net debt 100.4 119.7
Finance lease liabilities 218.7 237.8
Stock finance 544.2 755.4
Pension deficit 75.5 59.0
938.8 1,171.9
2020 £m
2019£m
Underlying operating profit 45.9 26.7
Depreciation 80.6 83.3
Amortisation 3.9 3.5
Underlying EBITDA 130.4 113.5
Net debt (being net debt as set out above)
100.4 119.7
Leverage ratio 0.8 1.1
NOTES TO THE FINANCIAL STATEMENTS

157Pendragon PLC Annual Report 2020
2020 £m
2019£m
Underlying operating profit 45.9 26.7
Depreciation 80.6 83.3
Amortisation 3.9 3.5
Underlying EBITDA 130.4 113.5
Net debt (being net debt as set out above)
100.4 119.7
Leverage ratio 0.8 1.1
2020 2019
Underlying profit/(loss) before tax (£m) 8.2 (16.4)
Underlying earnings per share (p) 0.6 (1.2)
Net debt : underlying EBITDA 0.8 1.1
SECTION 4 - FINANCING ACTIVITIES AND CAPITAL STRUCTURE
4.2 Financial instruments and derivatives continued
The key measures which management uses to evaluate the Group’s use of its financial resources, and performance achieved
against these in 2020 and 2019 are set out below:
The Group’s capital structure and capital allocation priorities were reassessed during 2020 as part of the determination
of the Group’s strategy for the next five years. That strategy shall require investment to grow the used car non-franchise
business, to develop Pinewood’s offering and to maintain and improve the UK Motor franchise business. The previously
instigated strategy to dispose of the US Motor business to realise its value of approximately £100m before tax, is nearly
complete. In total to date, total disposal proceeds of £95.1m have been received (including £16.3m received in January
2021). One business remains to be sold.
The Group believes that it will continue to generate strong cash flows and shall be developing a funding strategy during
2021 to assess the capital needs of the business and the leverage position.
The Group has previously engaged in share buyback programmes though none are currently operating. The Group may
also issue shares or purchase them in the market to satisfy share incentives issued to employees of the Group. The Group
encourages employees to be shareholders of the Group, providing selective share option and LTIP schemes from time to
time.
Certain of the Group’s subsidiaries are required to maintain issued share capital at levels to support capital adequacy under
Financial Conduct Authority (FCA) requirements. The Group ensures these requirements are met by injections of equity to
the subsidiaries in question, when required.
Other than specifically set out above, there were no changes to capital management in the year.
NOTES TO THE FINANCIAL STATEMENTS

158 Pendragon PLC Annual Report 2020
SECTION 4 - FINANCING ACTIVITIES AND CAPITAL STRUCTURE
4.3 Net financing costs
Accounting policy
Finance income comprises interest income on funds invested, return on net pension scheme assets and gains on hedging
instruments that are recognised in profit and loss. Interest income is recognised as it accrues in profit and loss, using the
effective rate method.
Finance expense comprises interest expense on borrowings, unwinding of the discount on provisions, interest on net
pension scheme obligations and losses on hedging instruments recognised in profit and loss. All borrowing costs are
recognised in profit and loss using the effective interest method.
Gross finance costs directly attributable to the construction of property, plant and equipment are capitalised as part of the
cost of those assets until such a time as the assets are substantially ready for their intended use or sale.
Finance expense
Interest of £0.5m has been capitalised during the year on assets under construction at an average rate of 5.75% (2019:
£0.8m).
Finance income
Recognised in profit and loss 2020 £m
2019 £m
Interest payable on bank borrowings, Senior note and loan notes 8.5 8.2
Vehicle stocking plan interest 13.6 19.3
Interest payable on finance leases 14.0 14.4
Net interest on pension scheme obligations (non-underlying - see note 2.6) 1.1 1.8
Less: interest capitalised (0.5) (0.8)
Total interest expense being interest expense in respect of financial liabili-ties held at amortised cost
36.7 42.9
Unwinding of discounts in contract hire residual values 3.1 3.1
Total finance expense 39.8 46.0
Recognised in profit and loss 2020 £m
2019 £m
Interest receivable on finance leases 1.0 1.1
Interest on settlement of historic VAT issues - 1.9
Total finance income 1.0 3.0
NOTES TO THE FINANCIAL STATEMENTS

159Pendragon PLC Annual Report 2020
SECTION 4 - FINANCING ACTIVITIES AND CAPITAL STRUCTURE
4.4 Capital and reserves
Ordinary share capital
Ordinary shares are classified as equity. Incremental costs directly attributable to the issue of ordinary shares are
recognised as a deduction from equity, net of any tax effects.
There were no issues of ordinary shares during the year.
During the previous year, 2,204,621 ordinary shares having a nominal value of £0.1m were bought back and subsequently
cancelled in accordance with the authority granted by shareholders in the Annual General Meeting on 25 April 2019. The
aggregate consideration paid, including directly attributable costs, was £0.5m. Since the commencement of the current
share buyback programme in 2016, as at 31 December 2020, 63,376,251 shares have been bought back and cancelled
representing 4.3% of the issued ordinary shares, at a total cost to date of £18.7m. The share buyback programme has been
suspended and the Group made no transactions during 2020 and anticipate that no further transactions will be made
during 2021.
The holders of ordinary shares are entitled to receive dividends as declared from time to time and are entitled to one vote
per share at meetings of the Group. All shares rank equally with regard to the Group’s residual assets.
Capital redemption reserve
The capital redemption reserve has arisen following the purchase by the Group of its own shares and comprises the
amount by which distributable profits were reduced on these transactions in accordance with s733 of the Companies Act
2006. There were no transfers into the capital redemption reserve during the year in respect of shares purchased by the
Group and subsequently cancelled (2019: £0.1m).
Other reserves
Other reserves comprise the amount of demerger reserve arising on the demerger of the Group from Williams Holdings
PLC in 1989.
Own shares held by Employee Benefit Trust (EBT)
Transactions of the Group-sponsored EBT are included in the Group financial statements. In particular, the trust’s purchases
of shares in the Group, which are classified as own shares, are debited directly to equity through retained earnings. When
own shares are sold or reissued the resulting surplus or deficit on the transaction is also recognised within retained
earnings.
The market value of the investment in the Group’s own shares at 31 December 2020 was £0.8m (2019: £0.8m), being
6.4m (2019: 6.4m) shares with a nominal value of 5p each, acquired at an average cost of £0.33 each (2019: £0.33). The
amounts deducted from retained earnings for shares held by the EBT at 31 December 2020 was £18.1m (2019: £18.1m).
The trustee of the EBT is Salamanca Group Trust (Jersey) Limited. The shares in trust may subsequently be awarded to
Executive Directors and employees under the Pendragon 1999 Approved Executive Share Option Scheme, Pendragon
1999 Unapproved Executive Share Option Scheme and to satisfy amounts under LTIPs and the VCP. Details of the plans
are given in the Directors’ Remuneration Report on pages 68 to 82.
Number £m
Allotted, called up and fully paid shares of 5p each at 31 December 2019 and 31 December 2020
1,396,944,404 69.9
IFRS 9 classification IAS 39 classification
IFRS 9 Carrying value £m
Remeas- urement £m
IAS 39 Carrying value £m
Financial assets
Trade and other receivables Amortised costs Loans and receivables 139.8 - 139.8
Cash and cash equivalents Amortised costs Loans and receivables 51.4 - 51.4
Financial liabilities
Loans and borrowings Amortised cost Amortised cost (179.0) - (179.0)
Trade and other payables Amortised cost Amortised cost (1,318.3) - (1,318.3)
Foreign currency loans used to hedge overseas investments Fair value hedging instrument Fair value hedging instrument (72.9) - (72.9)
NOTES TO THE FINANCIAL STATEMENTS

160 Pendragon PLC Annual Report 2020
SECTION 4 - FINANCING ACTIVITIES AND CAPITAL STRUCTURE
4.4 Capital and reserves continued
Dividends on the shares owned by the trust, the purchase of which were funded by interest free loans to the trust from
Pendragon PLC, are waived. All expenses incurred by the trust are settled directly by Pendragon PLC and charged in the
accounts as incurred.
The trust is regarded as a quasi subsidiary and its assets and results are consolidated into the financial statements of the
Group.
Translation reserve
The translation reserve comprises all foreign exchange differences arising from the translation of the net investment
in foreign operations as well as from the translation of liabilities held to hedge the respective net investment in foreign
operations.
4.5 Dividends
Final dividends proposed by the Board and unpaid at the end of the year are not recognised in the financial statements
until they have been approved by the shareholders at the AGM. Interim dividends are recognised when they are paid.
The Board is not recommending the payment of a final dividend for 2020 (2019: nil).
2020 £m
2019 £m
Ordinary shares
Final dividend in respect of 2019 of nil per share (2018: 0.7p per share) - 9.7
- 9.7
NOTES TO THE FINANCIAL STATEMENTS

161Pendragon PLC Annual Report 2020
SECTION 4 - FINANCING ACTIVITIES AND CAPITAL STRUCTURE
4.6 Share based compensation
Accounting policy
The Group operates a number of employee share option schemes and an executive share ownership plan ‘exsop’ awarded
in 2010. The fair value at the date at which the share options are granted is recognised in the income statement on a
straight line basis over the vesting period, taking into account the number of options that are expected to vest. The fair
value of the options granted is measured using an option pricing model, taking into account the terms and conditions
upon which the options were granted. The number of options that are expected to become exercisable is reviewed at each
balance sheet date and if necessary estimates are revised.
Executive share options
The number and weighted average exercise prices of share options is as follows:
The options outstanding at 31 December 2020 have an exercise price in the range of 8.82p to 31.82p and a weighted
contractual life of 2.7 years. All share options are settled in equity.
Movements in the number of options to acquire ordinary shares under the Group’s various share option schemes, together
with exercise prices and the outstanding position at 31 December 2020 were as follows:
All grants of share options were issued pursuant to the 2009 Executive Share Option Scheme, which prescribed an earnings
per share performance criterion. It is a precondition to the exercise of grants made under the 2009 Scheme that the growth
in the Group’s earnings per share over the prescribed three year period must exceed by at least 3 percent per annum
compound the annual rate of inflation as shown by the RPI Index.
There were no exercises of share options during the year or previous year.
All options are settled by physical delivery of shares.
Exercise period Date of grant
Exercise price per
share
At 31 December
2019 Number
Exercised Number
Lapsed Number
At 31 December
2020 Number
20 September 2013 to 19 September 2020
20 September 2010 14.22p 435,977 - (435,977) -
7 October 2014 to 6 October 2021 6 October 2011 8.82p 758,318 - - 758,318
31 March 2015 to 30 March 2022 30 March 2012 13.50p 1,100,000 - (100,000) 1,000,000
19 September 2017 to 19 September 2024 18 September 2014 31.82p 2,879,500 - (50,000) 2,829,500
5,173,795 - (585,977) 4,587,818
Weighted average exercise
price 2020
Number of
options millions
2020
Weighted average exercise
price 2019
Number of
options millions
2019
Outstanding at beginning of period 23.1p 5.2 23.6p 5.5
Exercised during the period - - 0.0p -
Lapsed during the period 5.0p (0.6) 31.8p (0.3)
Outstanding at the end of the period 24.0p 4.6 23.1p 5.2
Exercisable at the end of the period 24.0p 4.6 23.1p 5.2
NOTES TO THE FINANCIAL STATEMENTS

162 Pendragon PLC Annual Report 2020
SECTION 4 - FINANCING ACTIVITIES AND CAPITAL STRUCTURE
4.6 Share based compensation continued
The fair value of the services received in return for share options is measured by reference to the fair value of the options
granted. The estimate of the fair value of the services received in respect of share option schemes is measured using the
Black-Scholes option pricing model. The weighted average fair value of the options at the date of grant for those that are
outstanding at 31 December 2020 is 6.4p (2019: 6.4p).
Executive Long Term Incentive Plan (“LTIPs”)
The number and weighted average exercise prices of executive LTIPs is as follows:
Movements in the number of options to acquire ordinary shares under the Group’s LTIP, together with the outstanding
position at 31 December 2020 were as follows:
All grants of LTIPs were issued pursuant to the Long Term Incentive Plan, which prescribed an earnings per share
performance criterion. It is a pre-condition that vesting will not occur if earnings per share growth in the three year
performance period does not exceed RPI by at least 4 percent. All is subject to an underpin of creating absolute total
shareholder value. In the case of the Company, this means that growth in the value of a shareholding in the Company must
exceed the growth in the value of shares in the comparator index the Company is in, currently the FTSE 350.
Executive bonuses relating to performance in the second half of 2020 will be granted in the form of deferred share awards
that will vest one year after grant date. They automatically convert into one ordinary share each on vesting at an exercise
price of nil. The executives do not receive any dividends and are not entitled to vote in relation to the deferred shares
during the vesting period.
The fair value at the date at which the share options are granted is recognised in the income statement on a straight line
basis over the vesting period, taking into account the number of options that are expected to vest. The number of options
that are expected to become exercisable is reviewed at each balance sheet date and if necessary estimates are revised.
The fair value of the services received in return for the LTIPs is measured by reference to the fair value of the LTIPs granted.
The estimate of the fair value of the services received in respect of the LTIPs is measured using the Black-Scholes option
pricing model. The weighted average fair value of the options at the date of grant for those that are outstanding at 31
December 2020 is 14.08p.
NOTES TO THE FINANCIAL STATEMENTS
Weighted average exercise
price 2020
Number of
options millions
2020
Weighted average exercise
price 2019
Number of
options millions
2019
Granted during the period 0.00p 27.6 - -
Outstanding at the end of the period 0.00p 27.6 - -
Exercise period Date of grant
At 31 December
2019 Number
Granted Number
At 31 December
2020 Number
27 October 2023 28 October 2020 - 27,648,123 27,648,123

163Pendragon PLC Annual Report 2020
SECTION 4 - FINANCING ACTIVITIES AND CAPITAL STRUCTURE
4.6 Share based compensation continued
Expected volatility was determined by calculating the historical volatility of the Group’s share price over the corresponding
historical period. The expected life used in the model has been adjusted, based on management’s best estimate, for the
effects of exercise restrictions and team member turnover.
Value Creation Plan (“VCP”)
A VCP award was granted as a nil cost option over ordinary shares of the company on 26 May 2017. Vesting is based on
the growth of absolute total shareholder return generated over the VCP performance period. The performance period for
the award comprises the four years (“Performance Period”) commencing on 01 January 2017. The VCP award gives the
holders the opportunity to share in a proportion of the total value created for shareholders above a hurdle (“Threshold
Total Shareholder Return”) measured at the end of the Performance Period on 31 December 2020 (“Measurement Date”).
The price used for this measurement (“Measurement Total Shareholder Return”) will be the sum of the average share price
for the three months ending on the Measurement Date plus the cumulative dividends paid per share over the Performance
Period. The starting share price was set at £0.3016 (“Initial Price”), being the three month average share price prior to 01
January 2017. The hurdle price was set at £0.442, being the Initial Price plus 10% compounded annual growth over the
Performance Period (“Hurdle”). The total participation pool for the VCP will be 10% of the total value created above the
Hurdle (“Pool”). The number of shares under the nil cost option will be determined at the end of the Performance Period
on the Measurement Date and will be calculated by reference to the holder’s percentage entitlement to growth in value
below. The VCP ended on 31 December 2020 and the conditions were not satisfied so the award lapsed at this date. No
VCP awards were made in 2020.
Movements in the number of options to acquire ordinary shares under the Group’s VCP, together with the outstanding
position at 31 December 2020 were as follows:
Income statement
The Group recognised a total net expense of £1.2m (2019: £0.7m) as an employee benefit cost in respect of all equity-
settled share based payment transactions included within administration costs.
NOTES TO THE FINANCIAL STATEMENTS
Executive LTIP Scheme 2020 2019
Number of share options granted in year 27,648,123 -
Weighted average share price (pence) 0.00 -
Weighted average exercise price (pence) 0.00 -
Weighted average fair value (pence) 14.08 -
Expected volatility (%) 58.6% -
Expected life (years) 2.3 -
Risk free rate (%) -6.3% -
Expected dividend yield (%) 0.0% -
Exercise period Date of grant
At 31 December
2019 Number
Lapsed Number
At 31 December
2020 Number
31 December 2020 26 May 2017 5,977,001 (5,977,001) -

164 Pendragon PLC Annual Report 2020
SECTION 4 - FINANCING ACTIVITIES AND CAPITAL STRUCTURE
4.7 Leases
Accounting policies
Leases as a Lessee
At inception of a contract, the Group assesses whether a contract is, or contains, a lease. A contract is, or contains, a lease
if the contract conveys the right to control the use of an identified asset for a period of time in exchange for consideration.
To assess whether a contract conveys the right to control the use of an identified asset, the Group uses the definition of a
lease in IFRS 16. This policy is applied to contracts entered into, on or after 1 January 2019.
The Group recognises a right of use asset and a lease liability at the lease commencement date. The right of use asset is
initially measured at cost, and subsequently at cost less accumulated depreciation and impairment losses, and adjusted for
certain remeasurements of the lease liability. Cost comprises the initial amount of the lease liability adjusted for any initial
direct costs incurred less any lease incentives received. Depreciation is recognised on a straight line basis over the period
of the lease the right of use asset is expected to be utilised.
The lease liability is initially measured at the present value of lease payments that are not paid at the commencement
date, discounted by the interest rate implicit in the lease or when this is not readily attainable, the Group’s incremental
borrowing rate. Lease payments include fixed rental payments and amounts expected to be payable under a residual
value guarantee. Generally the Group uses its incremental borrowing rate as the discount rate. The Group determines
its incremental borrowing rate by obtaining interest rates from various external financing sources and makes certain
adjustments to reflect the terms of the lease and type of the asset leased.
The lease liability is subsequently increased by the interest cost on the lease liability and reduced by payments made. It is
remeasured when there is a change in future lease payments arising from a change of index or rate, a variation in amounts
payable following contractual rent reviews and changes in the assessment of whether an extension/termination option is
reasonably certain to be exercised. When the lease liability is remeasured in this way, a corresponding adjustment is made
to the carrying amount of the right-of-use asset, or is recorded in profit or loss if the carrying amount of the right-of-use
asset has been reduced to zero.
Sale and leaseback transactions. When a transfer of an asset is made and it is deemed a sale in accordance with IFRS15,
the resulting right-of-use asset arising from the leaseback is measured at the proportion of the previous carrying amount
of the asset that relates to the right of use retained by the seller-lessee. Gain or loss is recognised only at the amount that
relates to the rights transferred to the buyer-lessor.
The Group presents right-of-use assets that do not meet the definition of investment property in ‘property, plant and
equipment’ and lease liabilities in ‘loans and borrowings’ in the Balance Sheet.
The Group has elected not to recognise right-of-use assets and lease liabilities for leases of low-value assets and short-
term leases. The Group recognises the lease payments associated with these leases as an expense on a straight-line basis
over the lease term.
NOTES TO THE FINANCIAL STATEMENTS

165Pendragon PLC Annual Report 2020
SECTION 4 - FINANCING ACTIVITIES AND CAPITAL STRUCTURE
4.7 Obligations under finance leases
Balance Sheet
The Group leases a large number of properties for use as motor vehicle dealerships, parts distribution warehouses, storage
compounds and offices. Lease terms vary and at 31 December 2020 property leases had an average of around 11 years
to expiry. These leases comprise those with provision for periodic rent reviews, fixed scheduled increases and those
with periodic increases based on the RPI. The Group does not have any property leases that contain extension clauses. A
number of property leases have break clauses allowing the Group to terminate the agreement earlier than the lease expiry
date. The Group has applied judgement in that unless it is reasonably certain that such a break option will be exercised, the
calculation of the lease liability and right of use asset is made up to the expiry date of the lease. Had the Group recognised
a shorter lease term then right of use assets and lease liabilities would both be lower than currently reported and the
interest expense for the current year on lease liabilities would be reduced with the possibility depreciation charges could
increase.
In addition to property leases the Group have leases for various items of plant and equipment and motor vehicles.
Right of use assets are presented as part of property, plant and equipment as presented in note 3.2.
Right of Use Assets
Disposals of right of use assets have occurred on assignment of leases, derecognition on entering into sub leases and early
terminations.
Land & buildings
£m
Plant & Equipment
£m
Motor vehicles
£m Total
£m
Balance at 1 January 2019 196.2 - 0.5 196.7
Additions to right of use assets 7.6 - 0.4 8.0
Depreciation charge (18.8) - (0.4) (19.2)
Impairment (23.3) - - (23.3)
Other disposals of right of use assets (3.0) - - (3.0)
Balance at 31 December 2019 158.7 - 0.5 159.2
Balance at 1 January 2020 158.7 - 0.5 159.2
Additions to right of use assets 8.9 - 0.4 9.3
Depreciation charge (18.5) - (0.5) (19.0)
Impairment (3.2) - - (3.2)
Other disposals of right of use assets (0.3) - - (0.3)
Balance at 31 December 2020 145.6 - 0.4 146.0
NOTES TO THE FINANCIAL STATEMENTS

166 Pendragon PLC Annual Report 2020
SECTION 4 - FINANCING ACTIVITIES AND CAPITAL STRUCTURE
4.7 Obligations under finance leases continued
Lease liabilities
The calculation of the lease liability and the right of use asset relies upon the estimation of a suitable interest rate. The
Group has applied rates to represent the different types of leases it has by applying its incremental borrowing rate for
shorter term leases and a higher rates based upon market rates for borrowing against equivalent assets with similar risk
profiles in specific markets for medium to longer term leases.
Future increases in rentals linked to an index or rate are not included in the lease liability until the change in cash flows
takes effect. Approximately 16.5% (2019: 17.1%) of the Group’s lease liabilities are subject to inflation linked rentals. Rental
changes linked to inflation or rent reviews typically occur on an annual basis.
Land & buildings
£m
Plant & Equipment
£m
Motor vehicles
£m Total
£m
Included within liabilities
associated with the assets held
for sale£m
Balance at 1 January 2019 (280.7) (0.5) (281.2) (39.4)
Additions to right of use assets (8.0) - (0.4) (8.4) -
Interest expense related to lease liabilities (13.6) - - (13.6) (0.8)
Interest expense related to lease liabilities capitalised - - - - (1.8)
Disposals of lease liabilities 4.2 - - 4.2 -
Repayment of lease liabilities (including interest element) 37.0 - 0.4 37.4 5.8
Exchange adjustments - - - - 1.4
Other movements (0.1) - - (0.1) -
Balance at 31 December 2019 (261.2) - (0.5) (261.7) (34.8)
Non-current (237.8) - - (237.8)
Current (23.4) - (0.5) (23.9)
Balance at 31 December 2019 (261.2) - (0.5) (261.7)
Balance at 1 January 2020 (261.2) (0.5) (261.7) (34.8)
Additions to right of use assets (8.9) - (0.4) (9.3) -
Interest expense related to lease liabilities (13.3) - - (13.3) (0.7)
Interest expense related to lease liabilities capitalised - - - - (1.7)
Disposals of lease liabilities 4.3 - - 4.3 -
Repayment of lease liabilities (including interest element) 36.5 - 0.4 36.9 5.8
Exchange adjustments - - - - 0.8
Other movements (0.1) - - (0.1) -
Balance at 31 December 2020 (242.7) - (0.5) (243.2) (30.6)
Non-current (218.7) - - (218.7)
Current (24.0) - (0.5) (24.5)
Balance at 31 December 2020 (242.7) - (0.5) (243.2)
NOTES TO THE FINANCIAL STATEMENTS

167Pendragon PLC Annual Report 2020
SECTION 4 - FINANCING ACTIVITIES AND CAPITAL STRUCTURE
4.7 Obligations under finance leases continued
Other future possible cash outflows not included in the lease liability include the payment of dilapidations in respect of
properties where the lease contains specific condition of return clauses. Whilst the Group endeavours to maintain its
properties to a high standard it is likely that such payments will be made in the future when lease contacts end.
Amounts recognised in profit or loss
Expense relating to variable lease payments not included in lease liabilities relate to the payment of dilapidation claims
made on properties.
During the year the Group completed a sale and leaseback transaction of a motor vehicle dealership property that was
built and developed by the Group. The transaction resulted in proceeds of £10.5m and a loss on sale of £2.4m which was
recognised immediately in the income statement as a result of the previous property carrying amount being more than
the sale price (established at fair value) at the point of leaseback. The lease is for a term of 15 years and has resulted in a
right of use asset addition and an increase in lease liabilities of £5.9m. The transaction is in line with the Group’s ambition
to focus its resources on generating returns through its motor businesses whilst ensuring the property remains available to
Pendragon.
The Group as lessor
Leases as a Lessor
When the Group acts as a lessor, it determines at lease inception whether each lease is a finance lease or an operating
lease.
To classify each lease, the Group makes an overall assessment of whether the lease transfers substantially all of the risks
and rewards incidental to ownership of the underlying asset. If this is the case, then the lease is a finance lease; if not, then
it is an operating lease. As part of this assessment, the Group considers certain indicators such as whether the lease is for
the major part of the economic life of the asset.
When the Group is an intermediate lessor, it accounts for its interests in the head lease and the sub-lease separately. It
assesses the lease classification of a sub-lease with reference to the right-of-use asset arising from the head lease, not with
reference to the underlying asset.
Where the Group acts as a Lessor of an operating lease, receipts of lease payments are recognised in the income statement
on a straight line basis over the period of the lease. Where the Group acts as a Lessor of a finance lease the Group will,
rather than recognise a right of use asset, recognise a finance lease receivable, this being the present value of future lease
receipts discounted at the interest rate implicit in the lease or if this is not specified the Group’s incremental borrowing rate.
The finance lease receivable will be increased by the interest received and reduced by payments made by the lessee.
2020 £m
2019 £m
Depreciation of right of use assets 19.0 19.2
Impairment of right of use assets (non-underlying) 3.2 23.3
Interest on lease liabilities 14.0 14.4
Loss on sale and leaseback transaction 2.4 -
Expense relating to variable lease payments not included in lease liabilities 1.4 0.2
Expenses relating to low value leases 0.1 -
Expenses relating to short term leases 6.8 3.6
NOTES TO THE FINANCIAL STATEMENTS

168 Pendragon PLC Annual Report 2020
SECTION 4 - FINANCING ACTIVITIES AND CAPITAL STRUCTURE
4.7 Obligations under finance leases continued
Balance Sheet
Lease receivables
The following table sets out a maturity analysis of lease payments receivable, showing the undiscounted lease payments
to be received after the reporting date:
Land and buildings2020
£m 2019 £m
Balance at 1 January 2020 23.0 24.7
Additions to lease receivables 0.2 0.5
Interest income related to lease receivables 1.0 1.1
Disposals of lease liabilities (2.7) -
Payment of lease receivables (including interest element) (2.9) (3.3)
Balance at 31 December 2020 18.6 23.0
Non-current 16.6 20.6
Current 2.0 2.4
18.6 23.0
2020 £m
2019 £m
Less than one year 3.0 3.6
Between one and two years 3.0 3.7
Between two and three years 3.0 3.6
Between three and four years 2.8 3.6
Between four and five years 2.0 3.4
More than five years 9.9 15.0
Total undiscounted lease receivable 23.7 32.9
Unearned finance income (5.1) (9.9)
18.6 23.0
NOTES TO THE FINANCIAL STATEMENTS

169Pendragon PLC Annual Report 2020
SECTION 4 - FINANCING ACTIVITIES AND CAPITAL STRUCTURE
4.7 Obligations under finance leases continued
At the 31 December 2020 balance sheet date, the Group had contracted with tenants for the following future minimum
lease payments on leases classified as operating leases.
The Group has no properties that are treated as investment properties.
Amounts recognised in profit or loss
NOTES TO THE FINANCIAL STATEMENTS
2020 Property
2019 Property
Less than one year 1.1 1.1
Between one and two years 0.9 0.9
Between two and three years 0.8 0.6
Between three and four years 0.7 0.4
Between four and five years 0.7 0.4
More than five years 3.4 2.3
7.6 5.7
2020 £m
2019 £m
Operating lease rentals received 1.2 1.9
Interest received on finance lease receivables 1.0 1.1
2.2 3.0
170 Pendragon PLC Annual Report 2020
SECTION 5 - PENSION SCHEMES
This section explains the pension scheme obligations of the Group.
5.1 Pension obligations
Accounting policy
The Group operated a number of defined benefit and defined contribution plans during the year. The assets of the defined
benefit plan and one defined contribution plan are held in independent trustee administered funds. The Group also operates
a Group Personal Pension Plan which is a defined contribution plan where the assets are held by the insurance group under
a contract with each individual.
Defined contribution plans - A defined contribution plan is one under which the Group pays fixed contributions and has
no legal or constructive obligation to pay further amounts. Therefore, no assets or liabilities of these plans are recorded
in these financial statements. Obligations for contributions to defined contribution pension plans are recognised as an
employee benefit expense in the income statement when they are due.
Defined benefit plans - Pension accounting costs for defined benefit plans are assessed by determining the pension
obligation using the projected unit credit method after including a net return on the plan assets. Under this method, in
accordance with the advice of qualified actuaries, the amounts charged in respect of employee benefits reflect the cost of
benefits accruing in the year and the cost of financing historical accrued benefits. The Group recognises all actuarial gains
and losses arising from defined benefit plans in the statement of other comprehensive income immediately.
The present value of pension obligations is measured by reference to market yields on high quality corporate bonds which
have terms to maturity approximating to the terms of the related pension liability. Plan assets are measured at fair value.
When the calculation results in a benefit to the Group, the recognised asset is limited to the total of the present value of
economic benefits available in the form of any future refunds from the plan or reductions in future contributions to the
plan. An economic benefit is available to the Group if it is realisable during the life of the plan, or on settlement of the plan
liabilities.
Under IAS 19 Employee Benefits, the Group recognises an interest expense or income which is calculated on the net defined
benefit liability or asset respectively by applying the discount rate to the net defined benefit liability or asset.
Remeasurements arising from defined benefit plans comprise actuarial gains and losses and the return on plan assets
(excluding interest) are immediately recognised directly in the statement of other comprehensive income. Actuarial
gains and losses are the differences between actual and interest income during the year, experience losses on scheme
liabilities and the impact of any changes in assumptions. Details of the last independent statutory actuarial valuation and
assumptions are set out below.
Pension arrangements
The Group operated six defined benefit pension schemes (one of which had a defined contribution section) which closed
to new members and accrual of future benefits on 30 September 2006 and a defined contribution scheme which was
closed to new contributions from April 2006. All affected employees were offered membership of a defined contribution
pension arrangement with Friends Provident. A Group Personal Pension arrangement with Legal & General replaced the
Friends Provident arrangement from 1 January 2010. Total contributions paid by the Group in 2020 to the Legal & General
arrangement were £2.4m (2019: £2.8m). To comply with the Government’s automatic enrolment legislation, the Group
chose to participate in the People’s Pension Scheme in April 2013. This is a defined contribution occupational pension
scheme provided by B&CE. Total contributions paid by the Group to the People’s Pension in 2020 were £5.0m (2019:
£8.7m). The combined contributions to the Group’s Personal Pension arrangement (including the US Motor business) and
the Peoples Pension scheme therefore totalled £7.4m in the period (2019: £11.6m).
NOTES TO THE FINANCIAL STATEMENTS
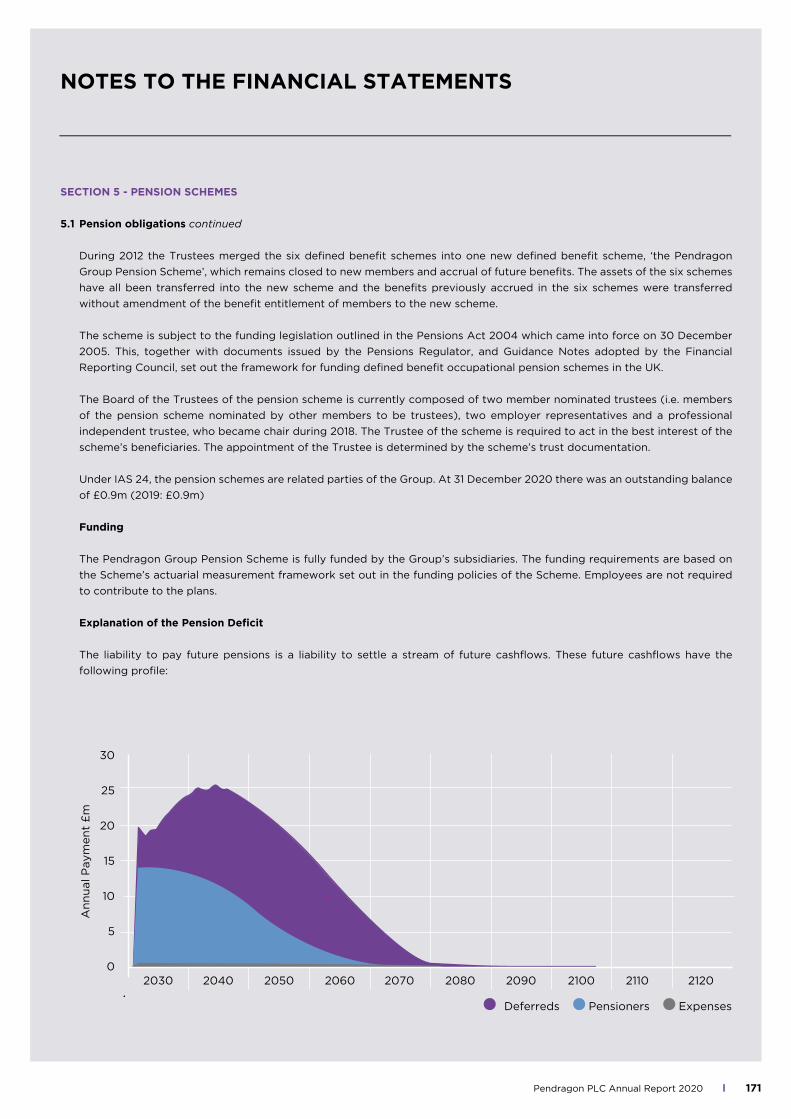
171Pendragon PLC Annual Report 2020
SECTION 5 - PENSION SCHEMES
5.1 Pension obligations continued
During 2012 the Trustees merged the six defined benefit schemes into one new defined benefit scheme, ‘the Pendragon
Group Pension Scheme’, which remains closed to new members and accrual of future benefits. The assets of the six schemes
have all been transferred into the new scheme and the benefits previously accrued in the six schemes were transferred
without amendment of the benefit entitlement of members to the new scheme.
The scheme is subject to the funding legislation outlined in the Pensions Act 2004 which came into force on 30 December
2005. This, together with documents issued by the Pensions Regulator, and Guidance Notes adopted by the Financial
Reporting Council, set out the framework for funding defined benefit occupational pension schemes in the UK.
The Board of the Trustees of the pension scheme is currently composed of two member nominated trustees (i.e. members
of the pension scheme nominated by other members to be trustees), two employer representatives and a professional
independent trustee, who became chair during 2018. The Trustee of the scheme is required to act in the best interest of the
scheme’s beneficiaries. The appointment of the Trustee is determined by the scheme’s trust documentation.
Under IAS 24, the pension schemes are related parties of the Group. At 31 December 2020 there was an outstanding balance
of £0.9m (2019: £0.9m)
Funding
The Pendragon Group Pension Scheme is fully funded by the Group’s subsidiaries. The funding requirements are based on
the Scheme’s actuarial measurement framework set out in the funding policies of the Scheme. Employees are not required
to contribute to the plans.
Explanation of the Pension Deficit
The liability to pay future pensions is a liability to settle a stream of future cashflows. These future cashflows have the
following profile:
30
25
20
15
10
5
02030 2040 2050 2060 2070 2080 2090 2100 2110 2120
Deferreds Pensioners Expenses
An
nu
al P
aym
en
t £
mNOTES TO THE FINANCIAL STATEMENTS

172 Pendragon PLC Annual Report 2020
SECTION 5 - PENSION SCHEMES
5.1 Pension obligations continued
‘Deferred’ are those pension scheme members not yet drawing a pension as at 31 December 2020; ‘Pensioners’ are those
in receipt of pension at 31 December 2020.
The actual total cash liabilities shown above are estimated at £747m. The value of these liabilities discounted to present
value at 31 December 2020 are £599.1m.
In order to meet those future cashflows, the Pension Scheme has to grow its assets sufficient to settle those liabilities. The
risk of the future value of those assets is dependent on the financial return; the liabilities will change dependent on the
rate of inflation (as most pensions are inflation adjusted) and longevity (how long the pensioner lives for and therefore
in receipt of pension). The pension deficit is the gap between those assets and liabilities and can be calculated in one of
two ways, both of which are arithmetically identical: either forecast future assets at the asset growth rate to offset against
actual liabilities or discount future liabilities by the asset growth rate and compare with the present value of the assets. The
latter method is the one commonly adopted and accounting standards require that the asset growth rate (the discount
rate) should be estimated on a similar basis for every Group, to enhance comparability and to assume a relatively low level
of risk. The more realistic picture is provided by the actuarial valuation which considers what the prudent estimate of the
asset growth rate should be and hence what the gap is that the Group will be required to fund through cash contributions.
These actuarial valuations are conducted every three years (the triennial valuation). The last triennial valuation was
conducted as at 31 December 2018 giving the following comparison:
The triennial valuation of the pension scheme reflecting the position as at 31 December 2018 was agreed by the Trustees on
17 March 2020. The Group has agreed with the trustees that it will aim to eliminate the deficit over a period of 7 years and 7
months from 31 March 2020 by the payment of deficit recovery contributions of £12.5m each year, increasing at 2.25% p.a.
These contributions include the expected quarterly distributions from the Central Asset Reserve over the recovery period.
The next triennial valuation of the pension scheme will reflect the position as at 31 December 2021.
Central Asset Reserve
Pendragon PLC is a general partner and the Pendragon Group Pension Scheme is a limited partner of the Pendragon
Scottish Limited Partnership (the Partnership). The Partnership holds properties with a book value of £37.4m (with a most
recent market valuation of £43.5m), which have been leased back to the Group at market rates. The Group retains control
over these properties, including the flexibility to substitute alternative properties. As such, the Partnership is consolidated
into the results of the Group. During the year the Group has paid £3.0m to the Pendragon Group Pension Scheme through
the Partnership (2019: £3.0m) and will increase by 2.25% on 1 August each year until the leases expire on 31 July 2032.
These payments could cease in advance of that date if the Pension Scheme’s actuarial valuation reaches a point where
there is a surplus of 5% over the liability value (on the actuarial triennial valuation basis). The Pension Scheme therefore
has a right to receive a future stream of rental receipts. No asset is recognised in these financial statements as the Group
has to consent to any proposed disposal of this asset by the Pension Scheme. However, if the Group became insolvent the
properties themselves would be retained by the Pension Scheme.
As at 31 December 2018 IAS 19(Accounts)
£m
Actuarial valuation
£m
Assets 418.0 418.1
Liabilities (486.3) (535.2)
Pension deficit (68.3) (117.1)
Discount rate used 3.90% 2.47%
Inflation 2.1%-3.9% 2.65%-3.45%
NOTES TO THE FINANCIAL STATEMENTS

173Pendragon PLC Annual Report 2020
SECTION 5 - PENSION SCHEMES
5.1 Pension obligations continued
IAS 19 assumptions
The assumptions used by the actuary in performing the triennial valuation at 31 December 2018 include an element of
caution and are chosen from a range of possible actuarial assumptions which, due to the timescale covered, may not
necessarily be borne out in practice. The IAS assumptions have been updated at 31 December 2020 and differ from those
used for the earlier independent statutory actuarial valuations explained above.
The principal assumptions used by the independent qualified actuaries for the purposes of IAS 19 for all schemes were:
*The mortality table assumption implies the following expected future lifetime from age 65:
During 2010 the Government announced a change to the index to be used for pension increases from RPI to CPI. The
change applied to certain elements of pension increases depending on the nature of the pension entitlement, the period in
which it was earned and the rules of each scheme. The application of either RPI or CPI to calculate the pension liability has
been assessed for each scheme and the relevant elements of pension increases within each scheme.
The outcome of the formal consultation on the proposed changes to RPI was announced on 25 November 2020 and
confirmed that RPI will match CPI including Housing (CPIH) from 2030. CPIH is essentially the same as CPI but with an
allowance for owner occupied housing. In the past, on average over the long term, CPIH has been almost the same as
CPI inflation, and is expected to be materially lower than RPI. The assumptions use a single break-even RPI inflation rate
which, when applied to the projected benefit cashflows underlying a pension scheme with a 16 year duration, would give
broadly the same result as applying the full Bank of England inflation curve to the same cashflows. For the reporting period
ending 31 December 2019 an RPI inflation assumption of 2.85% p.a. was used, which included an inflation-risk premium
deduction of 0.4% p.a. to the break-even inflation rate, to reflect the likelihood of change in the longer term i.e. the RPI
inflation assumption was 3.25% before the premium. On balance, it is reasonable to assume that RPI reform is now priced
into the market implied RPI curve, such that the temporary adjustment to the inflation risk premium for RPI reform at 31
December 2019 can now be removed. The assumptions therefore make no change to the base derivation of the break-even
RPI assumption (i.e. 3.25%), but revert to adjusting the gilt market-implied RPI rate at 31 December 2020 by an inflation
risk premium of 0.2% p.a., which reflects a general allowance for the inflation risk premium within the inflation curve. This
results in an RPI inflation assumption of 3.05% p.a. as at 31 December 2020. The impact of this change is estimated to have
increased liabilities by £10.0m.
At present there is no reliable indicator for market expectations of CPI inflation. Therefore, typical market practice is to
make an adjustment to the RPI assumption which takes into account the expected differences between the two inflation
2020 2019 2018
Inflation - RPI 3.05% 2.85% 3.25%
Inflation - CPI 2.55% 2.05% 2.25%
Discount rate 1.40% 2.05% 2.85%
Mortality table assumption * VitaCurves CMI 2019 M (1%) / VitaCurves CMI 2018 M (1%) / VitaCurves CMI 2017 M (1%) /
VitaCurves CMI 2019 F (1%) VitaCurves CMI 2018 F (1%) VitaCurves CMI 2017 F (1%)
2020 Years
2019Years
2018Years
Males aged 45 22.1 22.6 22.8
Females aged 45 24.2 24.7 24.9
Males aged 65 21.1 21.2 21.8
Females aged 65 23.0 23.1 23.7
NOTES TO THE FINANCIAL STATEMENTS

174 Pendragon PLC Annual Report 2020
SECTION 5 - PENSION SCHEMES
5.1 Pension obligations continued
measures. On the assumption that the market implied RPI rate from 2030 fully reflects the anticipated future reforms, it
would be consistent to assume that the gap between RPI and CPI from 2030 would be nil, and the RPI/CPI gap remains
unchanged from previous estimates before 2030. For the previous reporting period, the CPI inflation assumption of 2.05%
p.a. was derived as the RPI assumption less 0.8% p.a. This is equivalent to a long term RPI/CPI gap of 1.0% p.a. allowing for
the higher deduction from the market implied RPI rate at 31 December 2019. The assumptions update the RPI/CPI gap to
be an average of 0.50% p.a. which broadly reflects an average of a retention of a long term 1.0% p.a. assumed gap before
2030 and a 0% gap thereafter, suitably weighted to reflect the scheme’s exposure to CPI liabilities. This results in a CPI
inflation assumption of 2.55% p.a. for the reporting period ending 31 December 2020. The impact of changing this RPI
“wedge” from the previous 0.8% p.a. to the current 0.5% p.a. is to increase the liabilities by approximately £6.0m.
The sensitivities regarding the principal assumptions used to measure scheme liabilities are set out below. The Group
regards these sensitivities as reasonably likely to occur.
The sensitivities shown above are approximate. Each sensitivity considers one change in isolation. The inflation sensitivity
includes the impact of changes to the assumptions for revaluation and pension increases. The average duration of the
defined benefit obligation at the period ending 31 December 2020 is 16 years (2019: 16 years).
The scheme typically exposes the Group to actuarial risks such as investment risk in assets (the return and gain or loss
on assets invested in), inflation risk (as pensions typically rise in line with inflation) and mortality risk (the length of time
a pensioner lives for) in respect of liabilities. As the accounting deficit is calculated by reference to a discount rate linked
to corporate bonds then the Group is also exposed to interest rate risk i.e. the discounted value of liabilities will rise or
fall in line with changes in the interest rate used to calculate (discount) the future pension liabilities to present value.
A decrease in corporate bond yields, a rise in inflation or an increase in life expectancy would result in an increase to
scheme liabilities. This would detrimentally impact the balance sheet position and may give rise to increased charges in
future income statements. This effect could be partially offset by an increase in the value of the scheme’s assets. In order
to further mitigate risk, the scheme’s investment strategy was changed during 2017 and now operates within a liability
driven framework known as Liability Driven Investments (‘LDI’) i.e. the scheme invests in a mix of assets that are broadly
expected to match the expected movement in the net present value of liabilities. This is achieved by investing in assets
that are broadly expected to hedge the underlying inflation and interest rate risks of 100% of the liabilities (2019: 90%
of the liabilities). The nature of the products available for liability driven investing mean that a greater proportion of the
scheme’s assets can be used to invest in assets that are expected to have a higher growth rate than low risk assets. The
scheme’s assets can therefore be broadly subdivided into two categories: return-seeking assets which aim to achieve a
level of growth to reduce the deficit and “protection seeking” assets, which comprise the LDI assets held to mitigate the
changes in liabilities. There is further diversification within these individual categories, as further described below.
Assumption Change in assumption Impact on scheme liabilities
Discount rate Increase/decrease by 0.25% Decrease/increase of 3.9%
Rate of inflation Increase/decrease by 0.25% Increase/decrease of 2.0%
Mortality Increase in life expectancy of 1 year Increase by 3.4%
NOTES TO THE FINANCIAL STATEMENTS

175Pendragon PLC Annual Report 2020
SECTION 5 - PENSION SCHEMES
5.1 Pension obligations continued
The fair value of the scheme’s assets which are not intended to be realised in the short term and may be subject to
significant change before they are realised, and the value of the schemes liabilities, which is derived from cash flow
projections over long periods and thus inherently uncertain, are:
Scheme assets and liabilities
None of the fair values of the assets shown above include any of the Group’s own financial instruments or any property
occupied by, or other assets used by, the Group.
All of the assets are held within pooled investment vehicles (where cash is invested in a quoted fund designed by the fund
manager).
Investment risk
The pension scheme has exposure to a number of risks:
Credit risk: this is the risk that one party to a financial instrument will cause a financial loss for the other party by failing to
discharge an obligation.
Currency risk: this is the risk that the fair value or future cash flows of a financial asset will fluctuate because of changes in
foreign exchange rates.
Interest rate risk: this is the risk that the fair value or future cash flows of a financial asset will fluctuate because of changes
in market interest rates.
Other price risk: this is the risk that the fair value of future cash flows of financial assets will fluctuate because of changes
in market prices (other than those arising from interest rate risk or currency risk).
Credit risk
The Scheme is subject to credit risk as it has credit fund exposure and has cash balances. The Scheme invests in pooled
investment vehicles and is therefore directly exposed to credit risk in relation to the holdings in the pooled investment
vehicles, and is indirectly exposed to credit risks arising on the financial instruments that make up the pooled investment
vehicles.
Direct credit risk arising from pooled investment vehicles is mitigated by the underlying assets of the pooled arrangements
being ring-fenced from the pooled manager, the regulatory environments in which the pooled managers operate and
diversification of investments amongst a number of pooled arrangements.
2020£m
2019£m
2018£m
UK equities - - 129.1
Overseas equities 60.3 106.3 1.9
Unit trust - - 13.2
Corporate bonds 91.3 87.6 -
Government bonds - - -
Liability driven investments 182.7 115.4 58.9
Diversified growth fund 153.4 119.9 163.1
Cash 35.9 43.0 51.8
Fair value of scheme assets 523.6 472.2 418.0
Present value of funded defined benefit obligations (599.1) (531.2) (486.3)
Net liability on the balance sheet (75.5) (59.0) (68.3)
NOTES TO THE FINANCIAL STATEMENTS

176 Pendragon PLC Annual Report 2020
SECTION 5 - PENSION SCHEMES
5.1 Pension obligations continued
Currency risk
The Scheme’s liabilities are denominated in sterling. The Scheme is exposed to currency risk because some of its investments
are held in overseas markets. For example, the Scheme invests in pooled funds that hold overseas equities, global credit
and also funds where the manager has discretion to hold overseas assets. The respective fund managers hedge all, or a
proportion of, these risks back to sterling.
Interest rate risk and other price risk
The Scheme is subject to interest rate risk on the investments comprising of bonds and cash held through pooled vehicles
and other price risk arises principally in relation to the Scheme’s return-seeking portfolio which includes equities held in
pooled investment vehicles. The Scheme manages this exposure to other price risk by constructing a diverse portfolio of
investments across various markets.
Fair value determination
The fair value of financial instruments has been determined using the following fair value hierarchy:
Level 1: The unadjusted quoted price in an active market for identical assets or liabilities which the entity can access at the
measurement date
Level 2: Inputs other than quoted prices included within Level 1 which are observable (i.e. developed using market data) for
the asset or liability, either directly or indirectly
Level 3: Inputs which are unobservable (i.e. for which market data is unavailable) for the asset or liability
A summary of the risks and the fair value determination is set out in the table below:
No specific risk is assigned to investment held in multi-asset pooled investment vehicles, as they are multi-asset by definition,
and therefore the asset allocations within these funds, and the associated risk theron, change frequently.
The Private markets investments have a level 3 valuation as they comprise investments in one fund invested in property.
It is the policy of the Trustee and the Group to review the investment strategy at the time of each funding valuation and
keep this under review. The Trustee investment objectives and the processes undertaken to measure and manage the risks
inherent in the scheme investment strategy are documented in the scheme’s Statement of Investment Principles.
NOTES TO THE FINANCIAL STATEMENTS
Interest rate risk
£m
Other price risk
£m Other
£m Level 1
£m Level 2
£m Level 3
£m
LDI and cash 124.1 - - 35.3 88.8 -
Credit funds 185.2 - - - 185.2 -
Equity - 84.5 - 47.6 36.9 -
Private markets - - 79.6 - 55.5 24.1
DGF - - 49.5 - 49.5 -
309.3 84.5 129.1 82.9 415.9 24.1
Being:
Indirect - Bonds 274.0 - - - 274.0 -
Indirect - Cash 35.3 - - 35.3 - -
Indirect - equities - 84.5 - 47.6 36.9 -
Indirect - multi-asset - - 129.1 - 105.0 24.1
309.3 84.5 129.1 82.9 415.9 24.1
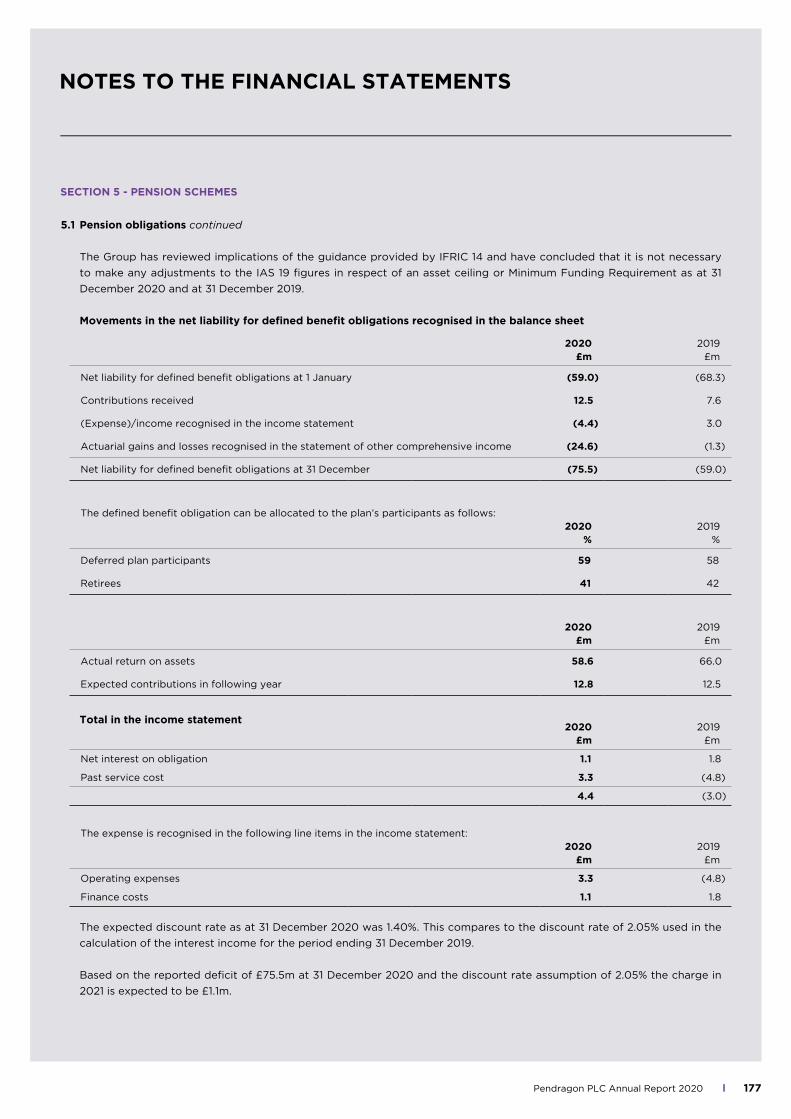
177Pendragon PLC Annual Report 2020
SECTION 5 - PENSION SCHEMES
5.1 Pension obligations continued
The Group has reviewed implications of the guidance provided by IFRIC 14 and have concluded that it is not necessary
to make any adjustments to the IAS 19 figures in respect of an asset ceiling or Minimum Funding Requirement as at 31
December 2020 and at 31 December 2019.
Movements in the net liability for defined benefit obligations recognised in the balance sheet
Total in the income statement
The expected discount rate as at 31 December 2020 was 1.40%. This compares to the discount rate of 2.05% used in the
calculation of the interest income for the period ending 31 December 2019.
Based on the reported deficit of £75.5m at 31 December 2020 and the discount rate assumption of 2.05% the charge in
2021 is expected to be £1.1m.
2020 £m
2019£m
Net liability for defined benefit obligations at 1 January (59.0) (68.3)
Contributions received 12.5 7.6
(Expense)/income recognised in the income statement (4.4) 3.0
Actuarial gains and losses recognised in the statement of other comprehensive income (24.6) (1.3)
Net liability for defined benefit obligations at 31 December (75.5) (59.0)
The defined benefit obligation can be allocated to the plan’s participants as follows: 2020
% 2019
%
Deferred plan participants 59 58
Retirees 41 42
2020£m
2019£m
Actual return on assets 58.6 66.0
Expected contributions in following year 12.8 12.5
2020£m
2019£m
Net interest on obligation 1.1 1.8
Past service cost 3.3 (4.8)
4.4 (3.0)
The expense is recognised in the following line items in the income statement: 2020
£m 2019
£m
Operating expenses 3.3 (4.8)
Finance costs 1.1 1.8
NOTES TO THE FINANCIAL STATEMENTS

178 Pendragon PLC Annual Report 2020
SECTION 5 - PENSION SCHEMES
5.1 Pension obligations continued
Past service costs
The High Court ruling in the Lloyds Banking Group Pension Trustees Limited v Lloyds Bank plc and others published in
October 2018 held that UK pension schemes with Guaranteed Minimum Pensions (GMPs) accrued from 17 May 1990 must
equalise for the different effects of these GMPs between men and women. Allowance was made in the benefit obligations
at 31 December 2018 for the estimated impact, with a cost recorded as a benefit change in the Income Statement.
A further High Court ruling on 20 November 2020 in the Lloyds Bank Trustees’ case extends the scope of the GMP
equalisation to include previous transfer values paid from the scheme since 1990. An allowance for the estimated impact
of this has been included in the benefit obligations at 31 December 2020 of £3.3m and similarly recorded as a past service
cost in the Income Statement.
2019: Pension Increase Exchange (PIE)
The Group has implemented a PIE for pensioner members whereby future inflationary increases in pension payments
were exchanged for an increased fixed pension. 31% of eligible members took up the offer and the new pensions went into
payment on 27 September 2019. The gain of £4.8m arising was recorded as a negative past service cost in the Income
Statement. The rule change made to facilitate the offer was implemented in November 2018 but the amount was all
recognised in 2019.
NOTES TO THE FINANCIAL STATEMENTS

179Pendragon PLC Annual Report 2020
2020 £m
2019£m
Cumulative amount at 1 January (52.9) (51.6)
Recognised during the period (24.6) (1.3)
Cumulative amount at 31 December (77.5) (52.9)
SECTION 5 - PENSION SCHEMES
5.1 Pension obligations continued
Actuarial gains and losses recognised directly in the statement of other comprehensive income
Defined benefit income recognised in statement of other comprehensive income
Changes in the present value of the defined benefit obligation
Movement in fair value of scheme assets during the period
2020 £m
2019£m
Return on plan assets excluding interest income 50.0 54.3
Experience gain/(loss) on scheme liabilities 1.5 (5.1)
Changes in assumptions underlying the present value of scheme obligations (76.1) (50.5)
(24.6) (1.3)
2020 £m
2019£m
Opening present value of defined benefit obligation 531.2 486.3
Interest cost 10.7 13.5
Past service cost 3.3 (4.8)
Remeasurements:
Experience adjustments (1.5) 5.1
Actuarial gains due to changes in demographic assumptions 5.2 0.2
Actuarial (gains)/losses due to changes in financial assumptions 70.9 50.3
Benefits paid (20.7) (19.4)
Closing present value of defined benefit obligation 599.1 531.2
2020 £m
2019£m
Opening fair value of assets 472.2 418.0
Interest income 9.6 11.7
Return on plan assets, excluding interest income 50.0 54.3
Contributions by employer 12.5 7.6
Benefits paid (20.7) (19.4)
End of period 523.6 472.2
NOTES TO THE FINANCIAL STATEMENTS

180 Pendragon PLC Annual Report 2020
SECTION 5 - PENSION SCHEMES
5.1 Pension obligations continued
History of experience adjustments2020
£m2019
£m2018
£m2017
£m2016
£m
Present value of defined benefit obligation 599.1 531.2 486.3 521.8 544.6
Fair value of scheme assets 523.6 472.2 418.0 459.0 441.4
Deficit in schemes 75.5 59.0 68.3 62.8 103.2
Experience adjustments on scheme liabilities:
Amount 74.6 55.6 (37.9) (7.4) 111.2
Percentage of scheme liabilities (%) 12.5% 10.5% (7.8%) (1.4%) 20.4%
Experience adjustments on scheme assets:
Amount 50.0 54.3 (38.8) 28.4 49.9
Percentage of scheme liabilities (%) 8.3% 10.2% (8.0%) 5.4% 9.2%
NOTES TO THE FINANCIAL STATEMENTS

181Pendragon PLC Annual Report 2020
SECTION 6 - OTHER NOTES
This section contains the notes and information relating to acquisitions and disposals and related party transactions:
6.1 Business disposals 6.2 Related party transactions
6.1 Business disposals
Accounting policy
The results of businesses disposed of during the year are included up to the effective date of disposal using the acquisition
method of accounting.
Activity
During the year the Group disposed of its Chevrolet business in California for net proceeds of £16.6m which resulted in a
loss on disposal of £6.5m. The assets of the business were classified as part of a disposal group held for sale.
Net assets at the date of disposal:
No cash was disposed as part of any business disposal during the year.
During the previous year the Group disposed of six UK dealerships representing Jaguar and Land Rover and four US
dealerships representing Jaguar and Land Rover for proceeds of £67.4m and realising a profit of £32.1m on disposal.
6.2 Related party transactions
Subsidiaries
The Group’s ultimate parent Group is Pendragon PLC. A listing of subsidiaries is shown within the financial statements of
the Company on page 190.
Transactions with key management personnel
The key management personnel of the Group comprise the executive and non-executive directors. The details of the
remuneration, long term incentive plans, shareholdings, share option and pension entitlements of individual directors are
included in the Directors’ Remuneration Report on pages 68 to 82.
Directors of the Group and their immediate relatives control 0.7459% of the ordinary shares of the Group.
During the year key management personnel compensation was as follows:
USBusinesses
£m
Net book value
£m
Assets held for sale 23.1 23.1
Loss on sale of businesses (6.5) (6.5)
Proceeds on sale satisfied by cash and cash equivalents 16.6 16.6
NOTES TO THE FINANCIAL STATEMENTS
2020 £m
2019£m
Short term employee benefits 2.2 1.4
Post-employment benefits 0.1 0.1
Termination payments - 1.4
Share based payments 1.1 0.6
3.4 3.5

182 Pendragon PLC Annual Report 2020
COMPANY BALANCE SHEETAt 31 December 2020
Notes2020
£m2019
£m
Fixed assets
Investments 5 804.0 804.0
Loans to subsidiary undertakings 90.0 90.0
894.0 894.0
Current assets
Debtors (amounts due after more than one year:£15.1m) 6 41.2 38.0
41.2 38.0
Creditors: amounts falling due within one year 7 (392.7) (371.6)
Net current liabilities (351.5) (333.6)
Total assets less current liabilities 542.5 560.4
Creditors: amounts falling due after more than one year 8 (156.2) (175.2)
Retirement benefit obligations (75.4) (59.0)
Net assets 310.9 326.2
Capital and reserves
Called up share capital 11 69.9 69.9
Share premium account 56.8 56.8
Capital redemption reserve 11 5.6 5.6
Other reserves 11 13.9 13.9
Profit and loss account 164.7 180.0
Equity shareholders' funds 310.9 326.2
Approved by the Board of Directors on 24 March 2021 and signed on its behalf by:
W Berman M S WillisChief Executive Chief Finance Officer
Registered Company Number: 2304195
The notes on pages 185 to 193 form part of these financial statements.

183Pendragon PLC Annual Report 2020
COMPANY STATEMENT OF OTHER COMPREHENSIVE INCOMEYear ended 31 December 2020
Note2020
£m2019
£m
Profit/(loss) for the year 0.8 (31.4)
Other comprehensive income
Items that will never be reclassified to profit and loss:
Defined benefit plan remeasurement (losses) and gains (22.9) 0.4
Income tax relating to defined benefit plan remeasurement (losses) and gains 5.7 0.2
Other comprehensive income for the year, net of tax (17.2) 0.6
Total comprehensive income for the year (16.4) (30.8)
The notes on pages 185 to 193 form part of these financial statements

184 Pendragon PLC Annual Report 2020
COMPANY STATEMENT OF CHANGES IN EQUITYYear ended 31 December 2020
Share capital
£m
Share premium account
£m
Capitalredemption
reserve £m
Other reserves
£m
Retained earnings
£m Total
£m
Balance at 1 January 2020 69.9 56.8 5.6 13.9 180.0 326.2
Total comprehensive income for 2020
Profit for the year - - - - 0.8 0.8
Other comprehensive income for the year, net of tax - - - - (17.2) (17.2)
Total comprehensive income for the year - - - - (16.4) (16.4)
Transactions with owners, recorded directly in equity
Share based payments - - - - 1.1 1.1
Total contributions by and distributions to owners - - - - 1.1 1.1
Balance at 31 December 2020 69.9 56.8 5.6 13.9 164.7 310.9
Balance at 1 January 2019 70.0 56.8 5.5 13.9 220.4 366.6
Total comprehensive income for 2019
Loss for the year - - - - (31.4) (31.4)
Other comprehensive income for the year, net of tax - - - - 0.6 0.6
Total comprehensive income for the year - - - - (30.8) (30.8)
Transactions with owners, recorded directly in equity
Own shares purchased for cancellation (0.1) - 0.1 - (0.5) (0.5)
Share based payments - - - - 0.6 0.6
Dividends paid (see note 4) - - - - (9.7) (9.7)
Total contributions by and distributions to owners (0.1) - 0.1 - (9.6) (9.6)
Balance at 31 December 2019 69.9 56.8 5.6 13.9 180.0 326.2
The notes on pages 185 to 193 form part of these financial statements.

185Pendragon PLC Annual Report 2020
1 Accounting Policies
(a) Basis of preparation Pendragon PLC is a company incorporated and domiciled in England, UK.
These financial statements were prepared in accordance with Financial Reporting Standard 101 Reduced Disclosure
Framework (‘FRS 101’).
In preparing these financial statements, the Company applies the recognition, measurement and disclosure requirements
of International Financial Reporting Standards as adopted by the EU (‘Adopted IFRSs’), but makes amendments where
necessary in order to comply with the Companies Act 2006 and has set out below where advantage of the FRS 101 disclosure
exemptions has been taken.
These financial statements have been prepared on a going concern basis as explained in note 1 of the Group Financial
Statements.
Principal risks and uncertainties are outlined in the Group Financial Statements on pages 103 to 104.
In these financial statements, the Company has applied the exemptions available under FRS 101 in respect of the following
disclosures:
• a Cash Flow Statement and related notes;
• Comparative period reconciliations for share capital, tangible fixed assets and intangible assets;
• Disclosures in respect of transactions with wholly owned subsidiaries;
• Disclosures in respect of capital management;
• The effects of new but not yet effective IFRSs;
• Disclosures in respect of the compensation of Key Management Personnel;
• Disclosures of transactions with a management entity that provides key management personnel services to the company;
• Certain disclosures required by IAS 36 Impairments of Assets in respect of the impairment of assets.
As the consolidated financial statements of the Company include the equivalent disclosures, the Company has also taken
the exemptions under FRS 101 available in respect of the following disclosures:
• IFRS 2 Share Based Payments in respect of group settled share based payments;
• Certain disclosures required by IFRS 13 Fair Value Measurement and the disclosures required by IFRS 7 Financial
Instrument Disclosures.
The accounting policies set out below have, unless otherwise stated, been applied consistently to all periods presented in
these financial statements.
Judgements
The Company applies judgement in how it applies its accounting policies, which do not involve estimation, but could
materially affect the numbers disclosed in these financial statements. There are however no such key accounting judgements
applied in these financial statements.
Accounting estimates
The preparation of financial statements in conformity with FRS 101 requires the use of estimates and assumptions that
affect the reported amounts of assets and liabilities at the date of the financial statements and the reported amounts of
revenues and expenses during the reporting year. Although these estimates are based on management’s best knowledge
of the amount, events or actions, actual results ultimately may differ from those estimates.
NOTES TO THE FINANCIAL STATEMENTS OF THE COMPANY

186 Pendragon PLC Annual Report 2020
NOTES TO THE FINANCIAL STATEMENTS OF THE COMPANY
Key estimate area Key assumptionPotential impact within the next financial year
Potential impact in the longer term
Note reference
Retirement benefit obligations
The main assumptions in determining the Company’s retirement benefit obligations are: discount rate, mortality and rate of inflation. Full detail is included in the pension note in the Consolidated Financial Statements in note 5.1.
✓ ✓ 5.1 Group
Investment impairment
The balances of investment in subsidiary companies are held at cost less any impairment. An impairment exists when their recoverable amount is less than the costs held in the accounts. There are a number of factors which could impact the recoverable amount which creates a risk of this recoverable amount being lower than the investment balance held.
✓ ✓ 5 and3.1 Group
1 Accounting Policies continued
The estimates and underlying assumptions are reviewed on an ongoing basis. The estimates and associated assumptions
are based on historical experience and various other factors that are believed to be reasonable under the circumstances.
Revisions to accounting estimates are recognised in the period in which the estimate is revised if the revision affects only
that period, or in the period of the revision and future periods if the revision affects both current and future periods. The
directors consider the following to be the key estimates applicable to the financial statements, which have a significant risk
of resulting in a material adjustment to the carrying amounts of assets and liabilities within the next financial year or in the
long-term:
(b) Deferred taxation Full provision is made for deferred taxation on all timing differences which have arisen but have not
reversed at the balance sheet date, except as follows:
(i) tax payable on the future remittance of the past earnings of subsidiaries is provided only to the extent that dividends have
been accrued as receivable or a binding agreement to distribute all past earnings exists;
(ii) deferred tax assets are recognised only to the extent that it is more likely than not that they will be recovered.
Deferred tax is measured on a non-discounted basis at the tax rates that are expected to apply in the periods in which the
timing differences reverse, based on tax rates and laws substantively enacted at the balance sheet date.
(c) Impairment excluding deferred tax assets Financial assets (including trade and other debtors) A financial asset not
carried at fair value through profit or loss is measured for impairment losses in accordance with IFRS 9 using an expected
credit loss (ECL) model. The impairment model applies to financial assets measured at amortised cost. The calculation
of ECLs are a probability-weighted estimate of credit losses. For trade receivables, the Company applies the simplified
approach set out in IFRS 9 to measure expected credit losses using a lifetime expected credit loss allowance. The Company
considered a trade or other receivables, including intercompany receivables, to be in default when the borrower is unlikely
to pay its credit obligations to the Company in full after all reasonable actions have been taken to recover the debt.
Non-financial assets
The carrying amounts of the Company’s non-financial assets, other than deferred tax assets, are reviewed at each reporting
date to determine whether there is any indication of impairment. If any such indication exists, then the asset’s recoverable
amount is estimated.

187Pendragon PLC Annual Report 2020
The recoverable amount of an asset or cash-generating unit is the greater of its value in use and its fair value less costs to
sell. In assessing value in use, the estimated future cash flows are discounted to their present value using a pre-tax discount
rate that reflects current market assessments of the time value of money and the risks specific to the asset. For the purpose
of impairment testing, assets that cannot be tested individually are grouped together into the smallest group of assets that
generates cash inflows from continuing use that are largely independent of the cash inflows of other assets or groups of
assets (the ‘cash-generating units).
An impairment loss is recognised if the carrying amount of an asset or its CGU exceeds its estimated recoverable amount.
Impairment losses are recognised in profit or loss. Impairment losses recognised in respect of CGUs are allocated first to
reduce the carrying amount of any goodwill allocated to the units, and then to reduce the carrying amounts of the other
assets in the unit (group of units) on a pro-rata basis.
Fair value hedges
Where a derivative financial instrument hedges the changes in fair value of recognised assets or liabilities, any gain or loss
is recognised in profit and loss. The hedged item is also stated, separately from the derivative, at fair value in respect of
the risk being hedged with any gain or loss also recognised in profit and loss. This will result in variations in the balance
sheet values of the gross debt and the offsetting derivatives as the market value fluctuates.
(d) Investments Investments held as fixed assets are stated at cost less any impairment losses. For Investments the
recoverable amount is estimated at each balance sheet date. The recoverable amount is the higher of fair value less costs
to sell and value in use. In assessing value in use, the estimated future cash flows are discounted to their present value using
a pre-tax discount rate that reflects current market assessments of the time value of money and the risks specific to the
asset for which the estimates of future cash flows have not been adjusted. Further details of impairment testing policies
are presented in note 3.1 of the Group Financial Statements.
(e) Employee benefits - Share based payments The Company operates a number of employee share option schemes. The
fair value at the date at which the share options are granted is recognised in profit and loss on a straight line basis over
the vesting period, taking into account the number of options that are expected to vest. The number of options that are
expected to become exercisable is reviewed at each balance sheet date and if necessary estimates are revised.
(f) Pension obligations The Company operated a defined benefit and defined contribution plan during the year, the
assets of which are held in independent trustee administered funds. Pension accounting costs for defined benefit plans
are assessed by determining the pension obligation using the projected unit credit method after including a net return
on the plan assets. Under this method, in accordance with the advice of qualified actuaries, the amounts charged in
respect of employee benefits reflect the cost of benefits accruing in the year and the cost of financing historical accrued
benefits. The Company recognises all actuarial gains and losses arising from defined benefit plans in the statement of
other comprehensive income immediately.
The present value of pension obligations is measured by reference to market yields on high quality corporate bonds which
have terms to maturity approximating to the terms of the related pension liability. Plan assets are measured at fair value.
When the calculation results in a benefit to the Company, the recognised asset is limited to the total of the present value
of economic benefits available in the form of any future refunds from the plan or reductions in future contributions to the
plan. An economic benefit is available to the Company if it is realisable during the life of the plan, or on settlement of the
plan liabilities.
Under IAS 19 Employee Benefits, the Group recognises an interest expense or income which is calculated on the net
defined benefit liability or asset respectively by applying the discount rate to the net defined benefit liability or asset.
A defined contribution plan is one under which the Company pays fixed contributions and has no legal or constructive
obligation to pay further amounts. Obligations for contributions to defined contribution pension plans are recognised as
an employee benefit expense in the income statement when they are due.
1 Accounting Policies continued
NOTES TO THE FINANCIAL STATEMENTS OF THE COMPANY
188 Pendragon PLC Annual Report 2020
1 Accounting Policies continued
In accordance with IFRIC 14 surpluses in schemes are recognised as assets only if they represent unconditional economic
benefits available to the Company in the future. Provision is made for future unrecognisable surpluses that will arise
as a result of regulatory funding requirements. Movements in unrecognised surpluses are included in the statement of
recognised income and expense. If the fair value of the assets exceeds the present value of the defined benefit obligation
then the surplus will only be recognised if the nature of the arrangements under the trust deed, and funding arrangements
between the Trustee and the Company support the availability of refunds or recoverability through agreed reductions in
future contributions. In addition, if there is an obligation for the Company to pay deficit funding, this is also recognised.
Under the provisions of FRS 101 Pendragon PLC is designated as the principal employer of the Pendragon Group Pension
Scheme and as such applies the full provisions of IAS 19 Employee benefits (2011). In line with IAS 19 Employee benefits
(2011), the Company has recognised a pension prepayment with respect to an extraordinary contribution made during
31 December 2011 as this does not meet the definition of a planned asset and therefore the amount is held in pension
prepayment and will be unwound over the period in which Scottish Limited Partnership Limited makes contributions to the
pension scheme.
Information relating to pension obligations can be found in the Consolidated Financial Statements in note 5.1.
(g) Dividends Dividends proposed by the Board and unpaid at the end of the year are not recognised in the financial
statements until they have been approved by the shareholders at the Annual General Meeting. Interim dividends are
recognised when they are paid.
(h) Own shares held by ESOP trust Transactions of the group-sponsored ESOP trust are included in the Company financial
statements. In particular, the trust’s purchases and sales of shares in the Company are debited and credited directly to
equity.
(i) Contingent liabilities Where the Company enters into financial guarantee contracts to guarantee the indebtedness
of other companies within its group, the Company considers these to be insurance arrangements, and accounts for them
as such. In this respect, the Company treats the guarantee contract as a contingent liability until such time as it becomes
probable that the Company will be required to make a payment under the guarantee.
2 Profit and loss account of the company and distributable reserves
In accordance with the exemption allowed by Section 408 of the Companies Act 2006, the profit and loss account of the
Company is not presented. The profit after taxation attributable to the Company dealt with in its own accounts for the
year ended 31 December 2020 is £0.8m (2019: loss £31.4m).
The profit and loss account of the Parent Company does not include any unrealised profits. The amount available for
distribution under the Companies Act 2006 by reference to these accounts is £164.7m (2019: £180.0m) which is stated
after deducting the ESOT reserve of £18.2m (2019: £18.2m). The Group’s subsidiary companies which earn distributable
profits themselves are expected to make distributions each year up to the Parent Company in due course to ensure a
regular flow of income to the Company such that surplus cash generated can continue to be returned to our external
shareholders.
NOTES TO THE FINANCIAL STATEMENTS OF THE COMPANY

189Pendragon PLC Annual Report 2020
3 Directors
Total emoluments of directors (including pension contributions) amounted to £3.4m (2019: £3.5m). Information relating to
directors’ emoluments, share options and pension entitlements is set out in the Directors’ Remuneration Report on pages 68
to 82.
The directors are the only employees of the Company.
4 Dividends
The Board is not recommending the payment of a final dividend for 2020 (2019: nil).
5 Investments
In assessing the carrying value of investments in subsidiary undertakings, the Group has assessed the recoverable amount of
each investment using the same methodology and assumptions that were used to derive the recoverable amounts of CGUs
(which are allocated to the relevant subsidiary) that was undertaken as part of the goodwill impairment assessment; included
the intercompany receivables and payables due between group entities and then assessed whether there were additional
current assets, such as cash, which should be included in the Investment recoverable amount.
This assessment resulted in £nil provision for impairment for the year ended 31 December 2020 (2019: £108.4m) to the
investment in subsidiary undertakings.
The calculation is sensitive to the key assumptions used in determining the recoverable amount of the CGUs that are then
allocated to the investments in subsidiary undertakings (further details provided in note 3.1 of the Group financial statements).
The directors and management have considered and assessed reasonably possible changes to the key assumptions as set
out below.
2020£m
2019£m
Ordinary shares
Final dividend in respect of 2019 of nil per share (2018: 0.7p per share) - 9.7
- 9.7
Shares in subsidiary undertakings £m
Cost
At 31 December 2019 and at 31 December 2020 981.2
Impairment
At 31 December 2019 and at 31 December 2020 (177.2)
Net book value
At 31 December 2019 and at 31 December 2020 804.0
NOTES TO THE FINANCIAL STATEMENTS OF THE COMPANY
Long term growth rate
1.9% decrease£m
Discountrate
1.0% increase£m
Short term incomegrowth rate
1.9% decrease£m
Provision for impairment of investments in subsidiary undertakings (29.9) (19.6) (89.1)

190 Pendragon PLC Annual Report 2020
Incorporated in Great Britain having a registered office at Loxley House, 2 Little Oak Drive, Annesley, Nottingham, NG15 0DR:
Shares in subsidiary undertakings are stated at cost.
Pendragon PLC owns directly or indirectly 100 percent of the issued ordinary share capital of the following subsidiaries.
Incorporated in Great Britain having a registered office at Loxley House, 2 Little Oak Drive, Annesley, Nottingham, NG15 0DR:
Incorporated in Great Britain having a registered office at Citypoint, 65 Haymarket Terrace, Edinburgh, Scotland, EH12 5HD:
Pendragon General Partner Limited *
Incorporated in Great Britain having a registered office at 221 Windmillhill Street, Motherwell, Lanarkshire, ML1 2UB:
Reg Vardy (MME) Limited
Incorporated in the United States of America having a registered office at 2171 Campus Dr Ste 260, Irvine, California:
Pendragon North America Automotive, Inc. Penegon Glendale, Inc. South County, Inc.
Penegon West, Inc. Lincoln Irvine, Inc. Bauer Motors, Inc.
Penegon Mission Viejo, Inc. Penegon South Bay, Inc. Penegon Properties, Inc.
Penegon Newport Beach, Inc. Penegon Santa Monica, Inc. Penegon East, Inc.
Incorporated in Germany having a registered office at 40210 Düsseldorf,Nordrhein-Westfalen, Germany:
Pendragon Overseas Holdings GmbH.
* Direct subsidiary of Pendragon PLC
** Pendragon PLC owns 95% of the issued ordinary share capital
5 Investments continued
Alloy Racing Equipment Limited Pendragon Automotive Services Limited * Manchester Garages Limited
Bramall Quicks Dealerships Limited Stratstone.com Limited Merlin (Chatsworth) Limited
Car Store Limited Pendragon Group Pension Trustees Limited * Miles (Chesham) Limited
CD Bramall Dealerships Limited Allens (Plymouth) Limited Motors Direct Limited
Chatfields Limited Andre Baldet Limited Munn Holdings Limited
Derwent Vehicles Limited Arena Auto Limited Neville (EMV) Limited
Evans Halshaw Limited Bletchley Motor Company Limited Newport (Gwent) Motor Company Limited
National Fleet Solutions Limited Bletchley Motor Contracts Limited Oggelsby's Limited
Pendragon Vehicle Management Limited Bletchley Motor Group Limited P.J.Evans (Holdings) Limited
Pendragon Finance & Insurance Services Limited * Bletchley Motor Rentals Limited Paramount Cars Limited
Pendragon Management Services Limited Bletchley Motors Car Sales Limited Pendragon Company Car Finance Limited
Pendragon Motor Group Limited Bramall Contracts Limited Pendragon Demonstrator Finance Limited
Pendragon Premier Limited Bridgegate Limited Pendragon Demonstrator Finance November Limited
Pendragon Property Holdings Limited Brightdart Limited Pendragon Demonstrator Sales Limited
Pendragon Sabre Limited Buist Manor Limited Petrogate Properties Limited
Pinewood Technologies PLC * C P Evinson Limited Pinewood Computers Limited
Reg Vardy (MML) Limited C.G.S.B Holdings Limited Plumtree Motor Company Limited
Reg Vardy (VMC) Limited ** CD Bramall Motor Group Limited Quicks (1997) Motor Holdings Limited
Reg Vardy Limited * CD Bramall Pensions Limited Quicks Finance Limited
Stratstone Limited CD Bramall Pension Trustee Limited Reades of Telford Limited
Stripestar Limited Central Motor Company (Leicester) Limited Regency Automotive Limited
Victoria (Bavaria) Limited Charles Sidney Limited Reg Vardy (AMC) Limited
Chatfields - Martin Walter Limited Davies Holdings Limited Reg Vardy (Property Management) Limited
Pendragon Group Services Limited * Dunham & Haines Limited Rudds Limited
Pendragon Overseas Limited * Evans Halshaw (Cardiff) Limited Skipper of Aintree Limited
Pendragon Stock Limited Evans Halshaw (Dormants) Limited * Skipper of Cheltenham Limited
Pendragon Stock Finance Limited Evans Halshaw (Halifax) Limited Skipper of Darlington Limited
Vardy Contract Motoring Limited Evans Halshaw (Midlands) Limited Skipper of Wakefield Limited
Vardy Marketing Limited Evans Halshaw Group Pension Trustees Limited Suresell Limited
Pendragon Limited Partner Limited * Evans Halshaw Motor Holdings Limited The Car and Van Store Limited
Bramall Quicks Limited Executive Motors (Stevenage) Limited The Mcgill Group Limited
Car Store.com Limited Folletts Limited The Skipper Group Limited
CD Bramall Limited * G.E. Harper Limited Tins Limited *
Stratstone Motor Holdings Limited * Godfrey Davis (Trust) Limited Trust Motors Limited
Petrogate Limited Godfrey Davis Motor Group Limited Trust Properties Limited
Reg Vardy (Property Management) Limited Kingston Reconditioning Services Limited Vertcell Limited
Reg Vardy (TMC) Limited Lewcan Limited Wayahead Fuel Services Limited
Reg Vardy (TMH) Limited Manchester Garages (Cars) Limited
Evans Halshaw.com Limited Manchester Garages Holdings Limited
NOTES TO THE FINANCIAL STATEMENTS OF THE COMPANY
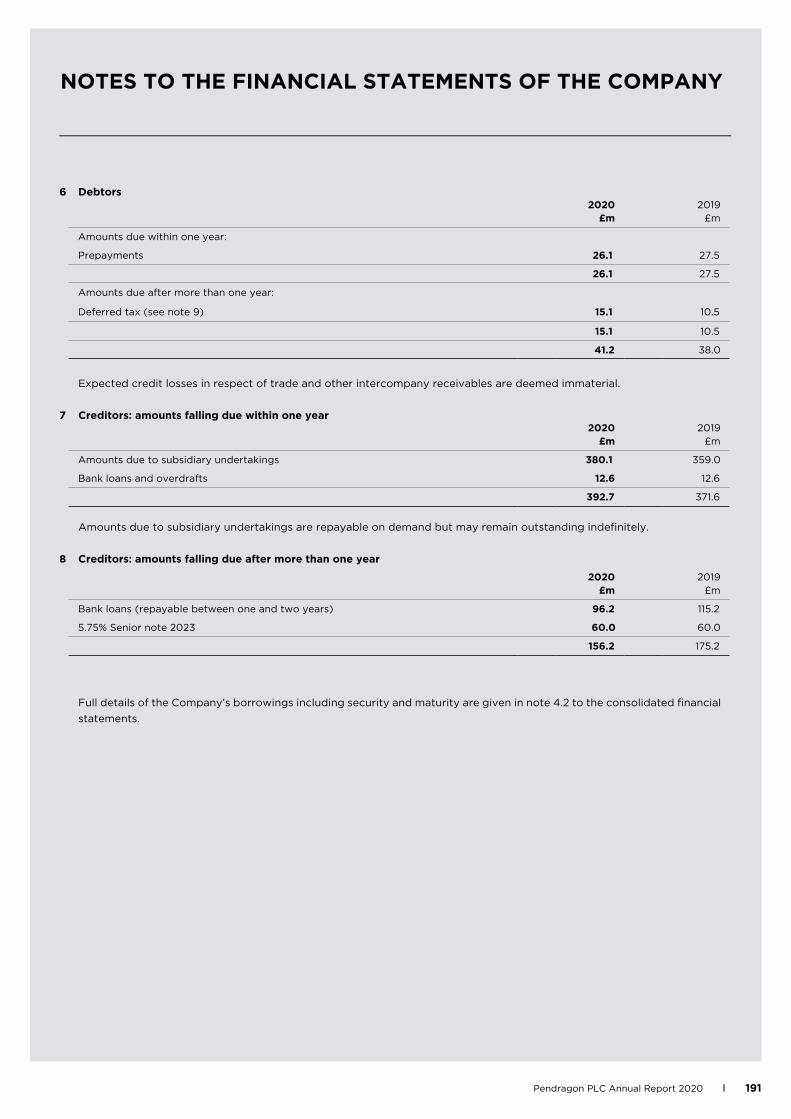
191Pendragon PLC Annual Report 2020
6 Debtors
Expected credit losses in respect of trade and other intercompany receivables are deemed immaterial.
7 Creditors: amounts falling due within one year
Amounts due to subsidiary undertakings are repayable on demand but may remain outstanding indefinitely.
8 Creditors: amounts falling due after more than one year
Full details of the Company’s borrowings including security and maturity are given in note 4.2 to the consolidated financial
statements.
2020£m
2019£m
Amounts due within one year:
Prepayments 26.1 27.5
26.1 27.5
Amounts due after more than one year:
Deferred tax (see note 9) 15.1 10.5
15.1 10.5
41.2 38.0
2020£m
2019£m
Amounts due to subsidiary undertakings 380.1 359.0
Bank loans and overdrafts 12.6 12.6
392.7 371.6
2020£m
2019£m
Bank loans (repayable between one and two years) 96.2 115.2
5.75% Senior note 2023 60.0 60.0
156.2 175.2
NOTES TO THE FINANCIAL STATEMENTS OF THE COMPANY
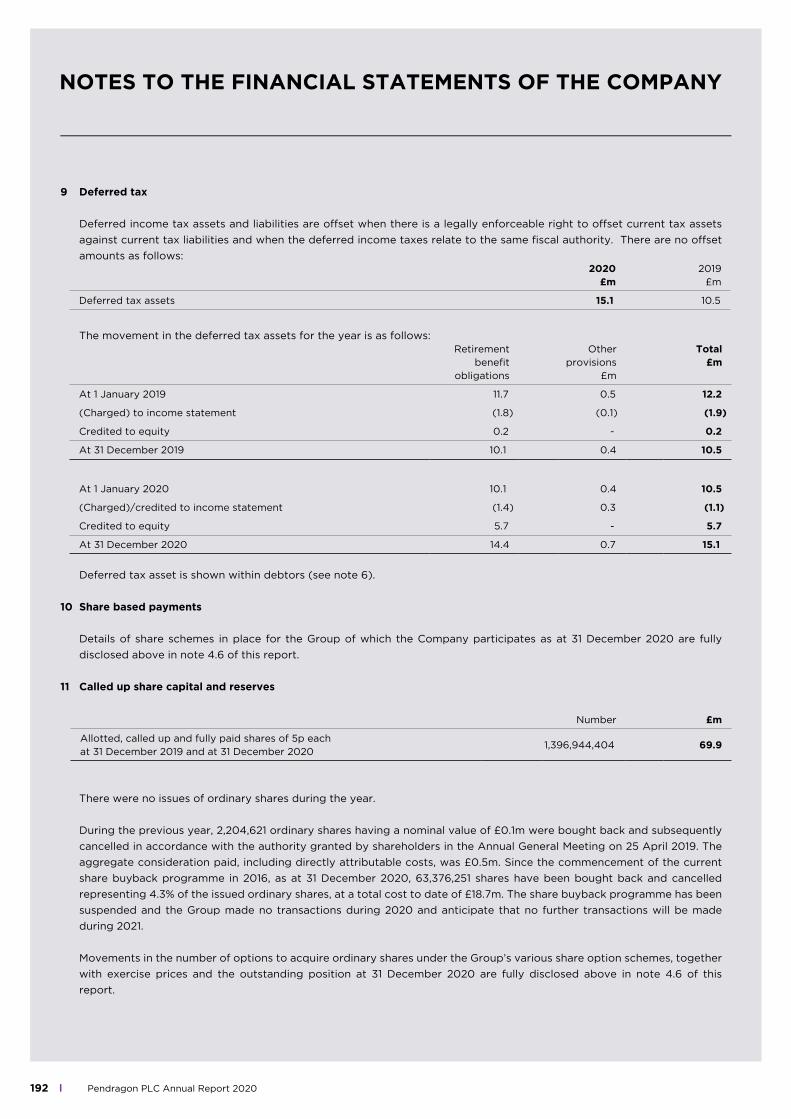
192 Pendragon PLC Annual Report 2020
Number £m
Allotted, called up and fully paid shares of 5p eachat 31 December 2019 and at 31 December 2020
1,396,944,404 69.9
9 Deferred tax
Deferred income tax assets and liabilities are offset when there is a legally enforceable right to offset current tax assets
against current tax liabilities and when the deferred income taxes relate to the same fiscal authority. There are no offset
amounts as follows:
The movement in the deferred tax assets for the year is as follows:
Deferred tax asset is shown within debtors (see note 6).
10 Share based payments
Details of share schemes in place for the Group of which the Company participates as at 31 December 2020 are fully
disclosed above in note 4.6 of this report.
11 Called up share capital and reserves
There were no issues of ordinary shares during the year.
During the previous year, 2,204,621 ordinary shares having a nominal value of £0.1m were bought back and subsequently
cancelled in accordance with the authority granted by shareholders in the Annual General Meeting on 25 April 2019. The
aggregate consideration paid, including directly attributable costs, was £0.5m. Since the commencement of the current
share buyback programme in 2016, as at 31 December 2020, 63,376,251 shares have been bought back and cancelled
representing 4.3% of the issued ordinary shares, at a total cost to date of £18.7m. The share buyback programme has been
suspended and the Group made no transactions during 2020 and anticipate that no further transactions will be made
during 2021.
Movements in the number of options to acquire ordinary shares under the Group’s various share option schemes, together
with exercise prices and the outstanding position at 31 December 2020 are fully disclosed above in note 4.6 of this
report.
2020£m
2019£m
Deferred tax assets 15.1 10.5
Retirement benefit
obligations
Other provisions
£m
Total £m
At 1 January 2019 11.7 0.5 12.2
(Charged) to income statement (1.8) (0.1) (1.9)
Credited to equity 0.2 - 0.2
At 31 December 2019 10.1 0.4 10.5
At 1 January 2020 10.1 0.4 10.5
(Charged)/credited to income statement (1.4) 0.3 (1.1)
Credited to equity 5.7 - 5.7
At 31 December 2020 14.4 0.7 15.1
NOTES TO THE FINANCIAL STATEMENTS OF THE COMPANY
193Pendragon PLC Annual Report 2020
The market value of the investment in the Group’s own shares at 31 December 2020 was £0.8m (2019: £0.8m), being
6.4m (2019: 6.4m) shares with a nominal value of 5p each, acquired at an average cost of £0.33 each (2019: £0.33). The
amounts deducted from retained earnings for shares held by the EBT at 31 December 2020 was £18.1m (2019: £18.1m).
The trustee of the EBT is Salamanca Group Trust (Jersey) Limited. The shares in trust may subsequently be awarded to
Executive Directors and employees under the Pendragon 1999 Approved Executive Share Option Scheme, Pendragon
1999 Unapproved Executive Share Option Scheme and to satisfy amounts under LTIPs and the VCP. Details of the plans
are given in the Directors’ Remuneration Report on pages 68 to 82.
Dividends on the shares owned by the trust, the purchase of which were funded by interest free loans to the trust from
Pendragon PLC, are waived. All expenses incurred by the trust are settled directly by Pendragon PLC and charged in the
accounts as incurred.
Capital redemption reserve
The capital redemption reserve has arisen following the purchase by the Group of its own shares and comprises the
amount by which distributable profits were reduced on these transactions in accordance with s733 of the Companies Act
2006. There were no transfers into the capital redemption reserve during the year in respect of shares purchased by the
Group and subsequently cancelled (2019: £0.1m).
Other reserves
Other reserves comprise the amount of demerger reserve arising on the demerger of the Group from Williams Holdings
PLC in 1989.
12 Retirement benefit obligations
Details of Pendragon Group Pension Scheme are fully disclosed above in note 5.1 of this report.
13 Related party transactions
Identity of related parties
The Company has related party relationships with its subsidiaries and with its key management personnel.
Transactions with related parties
The transaction with directors of the Company are set out in note 6.2 to the consolidated financial statements.
14 Contingent liabilities
(a) The company has entered into cross-guarantees with its bankers whereby it guarantees payment of bank borrowings
in respect of UK subsidiary undertakings.
(b) The company has given performance guarantees in the normal course of business in respect of subsidiary undertaking
obligations.
NOTES TO THE FINANCIAL STATEMENTS OF THE COMPANY
194 Pendragon PLC Annual Report 2020
ADVISORS, BANKS AND SHAREHOLDER INFORMATION
Share dealing service
Pendragon’s company registrar offers a share dealing service,
provided by Link Asset Services (a trading name of Link
Market Services). Details appear at www.linksharedeal.com
Shareholder and investor information
Making some of our corporate materials and policies available
on our website reduces the length of this Report. This year
we have placed certain background information on policy and
governance on our website. We also display historic financial
reports and have a section on company news, which we
regularly update on www.pendragonplc.com
Online services
Shareholders can choose to receive communications and
access a variety of share-related services online via the share
portal offered by Pendragon’s company registrar. This allows
shareholders to manage their shareholding electronically and
is free of charge. For details, visit www.mypendragonshares.
com
Getting company reports online
Reduces the environmental impacts of report distribution.
To choose online only reporting, visit the share portal and
register for electronic form reporting, or contact our registrar,
whose details are:
Registrar and shareholder enquiries
Link Asset Services
The Registry
34 Beckenham Road
Beckenham
Kent
BR3 4TU
Tel: 0871 664 0300
Financial Calendar 2021
24 March date of this Report
24 March preliminary announcement of 2020 results
19 May Annual General Meeting
Auditor
KPMG LLP
Banks
Barclays Bank PLC
Lloyds TSB Bank plc
Royal Bank of Scotland plc
Allied Irish Banks plc
HSBC Bank plc
Stockbrokers
Joh. Berenberg, Gossler & Co. KG
Jefferies International Limited
Solicitors
CMS Cameron McKenna Nabarro Olswang LLP
Geldards LLP
Eversheds LLP
How to find Pendragon PLC’s offices
Visit Contacts on the company’s website
www.pendragonplc.com.
Stock Classification
The company’s ordinary shares are traded on the London
Stock Exchange. Investment codes for Pendragon’s shares
are:
London Stock Exchange: PDG
Bloomberg: PDG.LN
GlobalTOPIC and Reuters: PDG.L

195Pendragon PLC Annual Report 2020
5 YEAR GROUP REVIEW
2020IFRS 16
£m
2019IFRS 16
£m
2018IAS 17
£m
2017IAS 17
£m
2016IAS 17
£m
Revenue 2,924.6 4,506.1 4,627.0 4,739.1 4,537.0
Gross profit 353.2 472.7 550.5 552.9 559.6
Operating profit/(loss) before other income 16.0 (104.4) (30.1) 91.5 100.1
(Loss)/profit before taxation (29.6) (114.1) (44.4) 65.3 73.0
Basic earnings per share (1.8p) (8.4p) (3.6p) 3.7p 3.8p
Net assets 126.7 168.9 345.6 425.4 372.8
Net borrowings (note 1) 100.4 119.7 126.1 124.1 79.6
Other financial information
Underlying profit/(loss) before tax 8.2 (16.4) 47.8 60.4 75.4
Underlying earnings per share (note 4) 0.6p (1.2p) 2.8p 3.3p 3.9p
Net debt : underlying EBITDA (note 6) 0.8 1.1 0.9 0.9 0.6
Gross margin 12.1% 10.5% 11.9% 11.7% 12.3%
Total operating margin (note 2) 0.5% -2.3% -0.7% 1.8% 2.2%
After tax return on equity (note 3) -16.7% -45.6% -13.1% 13.4% 14.5%
Dividends per share (note 5) - - 1.5p 1.6p 1.5p
Dividend cover (times) (note 7) - - 2.0 2.4 2.7
Interest cover (times) (note 8) 0.2 (1.7) (0.5) 3.5 3.7
Gearing (note 9) 79.2% 70.9% 36.5% 29.2% 24.6%
Business summary
Number of franchise points 146 166 186 194 196
note 1 Net borrowings comprise interest bearing loans and borrowings, cash and cash equivalents and derivative financial instruments, excluding lease liabilities.
note 2 Total operating margin is calculated after adding back non-underlying items, and excluding other income.
note 3 Return on equity is profit after tax for the year as a percentage of average shareholders’ funds.
note 4 Basic earnings per share adjusted to eliminate the effects of non-underlying operating, non-underlying finance and tax items, see note 2.8 of the financial statements.
note 5 Dividends per share are based on the interim dividend paid and final dividend proposed for the year.
note 6 Full details of the calculation of the net debt : underlying EBITDA ratio are given in note 4.2 to the financial statements.
note 7 Dividend cover is underlying profit after tax divided by the total of the interim dividend paid and the final dividend per share.
note 8 Interest cover is operating profit divided by net finance expense.
note 9 Gearing is calculated as net borrowings as a percentage of net assets.

ADDRESS I Pendragon PLC Loxley House, 2 Oakwood Court, Little Oak Drive, Annesley, Nottingham NG15 0DR
TELEPHONE I 01623 725200 E-MAIL I [email protected]
WEBSITE I www.pendragonplc.com
DESIGN I Creative Services Loxley House, 2 Oakwood Court, Little Oak Drive, Annesley, Nottingham NG15 0DR