2020 budget notes arena boards of management - toronto.ca · • ensuring the arena boards are...
TRANSCRIPT

2020 Budget Notes Arena Boards of Management While we aim to provide fully accessible content, there is no text alternative available for some of the content within these pages. If you require alternate formats or need assistance understanding our charts, graphs, or any other content, please contact us at 416-395-6767 or [email protected].
What we do We are 8 Board-managed arenas that offer use of ice (i.e. Hockey, figure skating), programming, and pleasure skating to the community. Some arenas also offer dry floor rentals (i.e. floor hockey) in the summer. These services are complemented with snack bars, pro-shops, and meeting room rentals at some locations. The Arena Boards of Management have stewardship over 11 ice rinks, including 4 that offer year-round ice rentals.
Why we do it Arena Boards of Management provide safe, full and equitable access to high quality indoor ice sport recreation facilities that are managed effectively and efficiently to provide opportunities for physical fitness and sport skill development through individual and team activities in response to local community needs.
Who we serve Community Ice & Facility Booking
• Charitable Organizations • Community Leagues / Associations • Corporations / Businesses • Individual Ice Users • Public & Private School Boards • Agency Staff
Beneficiaries • Residents • Visitors/Tourists
2020 Operating Budget Arena Boards of Management
toronto.ca/budget Budget Notes | Page 2 of 21
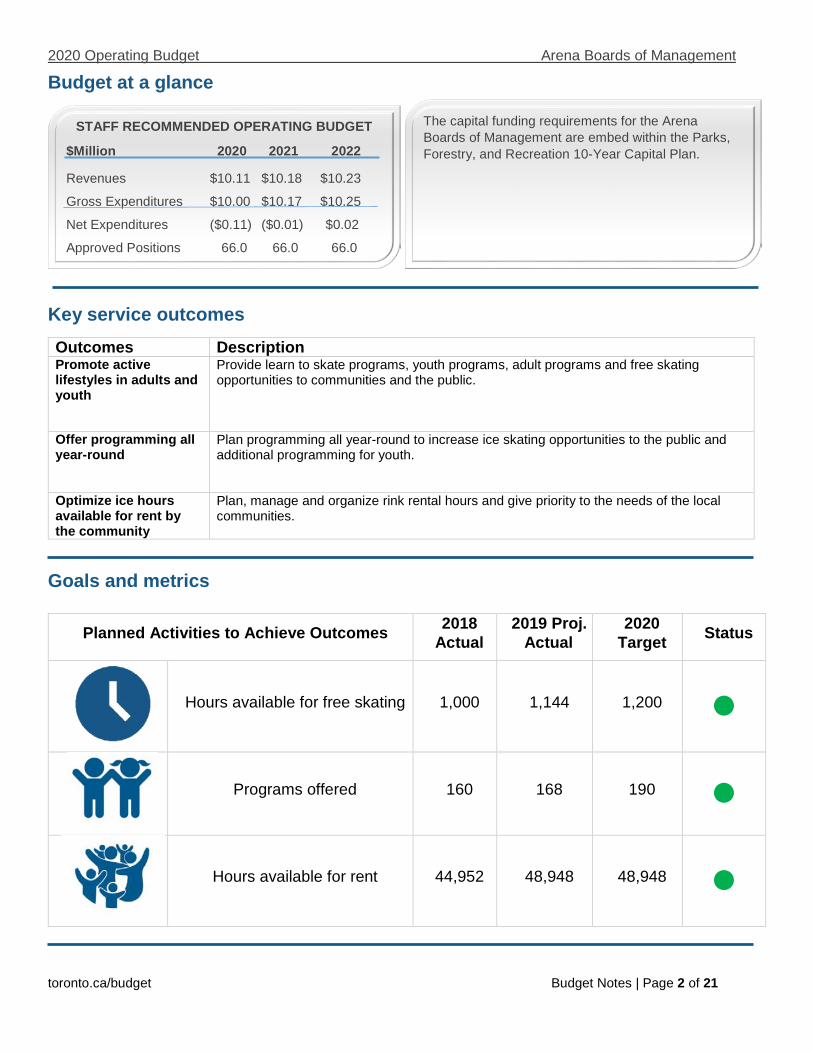
Budget at a glance
Key service outcomes Outcomes Description Promote active lifestyles in adults and youth
Provide learn to skate programs, youth programs, adult programs and free skating opportunities to communities and the public.
Offer programming all year-round
Plan programming all year-round to increase ice skating opportunities to the public and additional programming for youth.
Optimize ice hours available for rent by the community
Plan, manage and organize rink rental hours and give priority to the needs of the local communities.
Goals and metrics
Planned Activities to Achieve Outcomes 2018 Actual
2019 Proj. Actual
2020 Target Status
Hours available for free skating 1,000 1,144 1,200
Programs offered 160 168 190
Hours available for rent 44,952 48,948 48,948
STAFF RECOMMENDED OPERATING BUDGET
$Million 2020 2021 2022
Revenues $10.11 $10.18 $10.23
Gross Expenditures $10.00 $10.17 $10.25
Net Expenditures ($0.11) ($0.01) $0.02
Approved Positions 66.0 66.0 66.0
The capital funding requirements for the Arena Boards of Management are embed within the Parks, Forestry, and Recreation 10-Year Capital Plan.
2020 Operating Budget Arena Boards of Management
toronto.ca/budget Budget Notes | Page 3 of 21
Our experience and success
• William H. (Bill) Bolton Arena operating at pre-2018 levels after completing a major renovation that took place over a 7 month period
• Ted Reeve Arena has taken over managing and operating the covered outdoor rink that neighbours Ted Reeve
• Leaside Memorial Gardens Arena made improvements to the aging pool which has allowed them to maintain a warm temperature of the pool appealing to a number of members of the public.
Key challenges and risks • Meet rising demand for ice-time in the City of Toronto • Stay competitive in comparison to newer arenas in neighbouring 905 communities that have modern
facilitates, more available ice-time, and far better customer amenities to service arena users • Maintaining and increasing the state of good repair on the aging arenas to minimize the amount of service
disruptions due to repairs
Priority actions • Evaluate current state of Toronto arenas and develop a strategy to increase access to ice-time. • Upgrade facilities' conditions and amenities to improve the service provided to arena users • Continue to explore opportunities for increased revenues without impacting the needs of the local
communities.
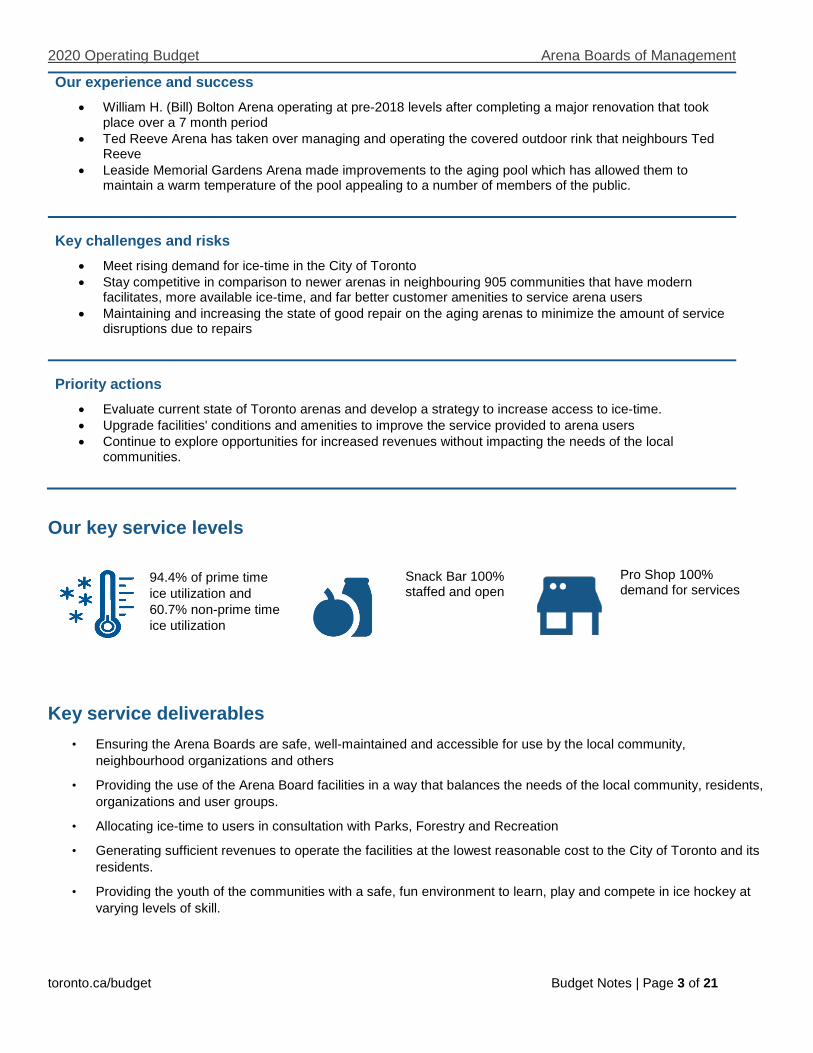
Our key service levels
94.4% of prime time ice utilization and 60.7% non-prime time ice utilization
Snack Bar 100% staffed and open
Pro Shop 100% demand for services
Key service deliverables • Ensuring the Arena Boards are safe, well-maintained and accessible for use by the local community,
neighbourhood organizations and others
• Providing the use of the Arena Board facilities in a way that balances the needs of the local community, residents, organizations and user groups.
• Allocating ice-time to users in consultation with Parks, Forestry and Recreation
• Generating sufficient revenues to operate the facilities at the lowest reasonable cost to the City of Toronto and its residents.
• Providing the youth of the communities with a safe, fun environment to learn, play and compete in ice hockey at varying levels of skill.

2020 Operating Budget Arena Boards of Management
toronto.ca/budget Budget Notes | Page 4 of 21
RECOMMENDATIONS
The City Manager and Chief Financial Officer and Treasurer recommend that:
1. City Council approve the 2020 Staff Recommended Operating Budget for the Arena Boards of Management of $9.99 million gross, ($0.11) million net for the following services:
Service: Gross ($000s)
Revenue ($000s)
Net ($000s)
George Bell 778.6 778.8 (0.3)
William H. Bolton 1,258.4 1,258.6 (0.3)
Larry Grossman Forest Hill Memorial 1,372.2 1,374.8 (2.6)
Leaside Memorial Community Gardens 2,290.4 2,378.7 (88.3)
McCormick Playground 856.6 857.0 (0.4)
Moss Park 1,008.7 1,009.8 (1.1)
North Toronto Memorial 1,106.5 1,106.6 (0.1)
Ted Reeve Community 1,327.5 1,342.3 (14.8)
Total Program Budget 9,998.8 10,106.7 (107.9)
2. City Council approve the 2020 staff complement for the Arena Boards of Management of 66.0 operating positions.
3. City Council approve the technical adjustments to user fees, and market rate user fee changes, for the Arena Boards of Management identified in Appendix 8, for inclusion in the Municipal Code Chapter 441 “Fees and Charges”.
Corporate: Anthony Ng Manager, Financial Planning Tel: (416) 395-6767 Email: [email protected]

2020 Operating Budget Arena Boards of Management
toronto.ca/budget Budget Notes | Page 5 of 21
2020 STAFF RECOMMENDED OPERATING BUDGET

2020 Operating Budget Arena Boards of Management
toronto.ca/budget Budget Notes | Page 6 of 21
2020 OPERATING BUDGET OVERVIEW
Table 1: 2020 Staff Recommended Operating Budget by Service
COSTS TO MAINTAIN EXISTING SERVICES Total 2020 Base Budget expenditures of $9.9 million gross reflecting an increase of $0.2 million in spending above 2019 projected year-end actuals, predominantly arising from:
• Salary & benefit increases and inflationary contract cost escalation which are offset by market-based increases to user fees
• Increased vehicle reserve contributions for replacement of ice resurfacers.
• Revenue increases from market rate user fee changes as well as additional attendance in programming.
EQUITY IMPACTS OF BUDGET CHANGES No significant equity impacts: The changes in the Arena Boards of Management's 2020 Operating Budget do not have any significant equity impacts
By Service $ $ $ $ $ $ %Revenues
George Bell 729.0 757.0 778.8 778.8 21.8 2.9% William H. Bolton 844.0 1,227.7 1,258.6 1,258.6 31.0 2.5% Larry Grossman Forest Hill Memorial 1,282.3 1,331.5 1,374.8 1,374.8 43.3 3.3% Leaside Memorial Community Gardens 2,172.5 2,264.3 2,378.7 2,378.7 114.4 5.1% McCormick Playground 811.6 840.7 857.0 857.0 16.3 1.9% Moss Park 898.7 977.2 1,009.8 1,009.8 32.6 3.3% North Toronto Memorial 975.5 1,070.4 1,106.6 1,106.6 36.2 3.4% Ted Reeve Community 1,240.0 1,324.6 1,342.3 1,342.3 17.7 1.3%
Total Revenues 8,953.5 9,793.3 10,106.7 0.0 10,106.7 313.4 3.2% Expenditures
George Bell 732.1 782.3 778.6 778.6 (3.7) (0.5%) William H. Bolton 1,007.4 1,227.6 1,258.4 1,258.4 30.8 2.5% Larry Grossman Forest Hill Memorial 1,274.6 1,330.2 1,372.2 1,372.2 42.0 3.2% Leaside Memorial Community Gardens 2,145.2 2,257.0 2,290.4 2,290.4 33.4 1.5% McCormick Playground 822.6 840.3 856.6 856.6 16.3 1.9% Moss Park 909.4 977.1 1,008.7 1,008.7 31.6 3.2% North Toronto Memorial 975.1 1,070.2 1,106.5 1,106.5 36.3 3.4% Ted Reeve Community 1,311.0 1,297.0 1,327.5 1,327.5 30.5 2.4%
Total Gross Expenditures 9,177.4 9,781.7 9,998.8 0.0 9,998.8 217.1 0.2
Net Expenditures 223.9 (11.6) (107.9) 0.0 (107.9) (96.3) 827.6%
Approved Positions 65.6 65.5 66.0 66.0 0.5 0.8% *2019 Budget and Actuals (based on Q3 2019) adjusted retroactively to remove interdepartmental charges and recoveries.
Change v. 2019 Projected Actual($000s)
2020 Staff Rec'd
Budget
2018 Actual
2019 Projected
Actual
2020 Base
Budget
2020 New / Enhanced

2020 Operating Budget Arena Boards of Management
toronto.ca/budget Budget Notes | Page 7 of 21
2020 STAFF RECOMMENDED OPERATING BUDGET KEY DRIVERS The 2020 Staff Recommended Operating Budget for the Arena Boards of Management is $0.2 million gross or 2.2% higher than the 2019 Projected Actuals. Table 2a below summarizes the key cost drivers for the base budget.
Table 2a: 2020 Key Drivers – Base Budget
Salaries & Benefits: The increase in Salary and Benefits is driven by inflation. Service and Rent: The increase in Service and Rent is driven by increasing cost of repairs to buildings and equipment. Contribution to Reserves: The Arena Boards of Management have increased their budgeted contribution to the Arena Boards of Management Ice Resurfacer Replacement Reserve to account for increasing Zamboni costs. User Fees & Donations: The increase in User Fees and Donations is driven by market-based user fee increases to a number of services provided by the Arenas as well as additional attendance in programming.
$ %
Expenditures
1 Salaries and Benefits 4,776.7 5,091.2 5,127.9 36.7 0.7%
2 Materials & Supplies 2,515.5 2,558.0 2,581.1 23.1 0.9%
3 Equipment 69.4 55.5 54.5 (1.0) (1.8%)
4 Service and Rent 1,015.6 1,265.3 1,376.9 111.6 8.8%
5 Contribution To Capital 525.0 525.0 525.0
6 Contribution To Reserves 275.3 286.7 308.9 22.3 7.8%
7 Other Expenditures 24.4 24.4
Total Expenditures 9,177.4 9,781.7 9,998.8 217.1 2.2%
Revenues
1 Provincial Subsidies
2 Federal Subsidies
3 User Fees & Donations 7,870.6 8,683.7 8,992.2 308.5 3.6%
4 Transfers From Capital
5 Other Revenues 1,082.9 1,109.7 1,114.5 4.9 0.4%
Total Revenues 8,953.5 9,793.3 10,106.7 313.4 3.2%
Net Expenditures 223.9 (11.6) (107.9) (96.3) 827.5%*2019 Q3 Proj Actuals and 2018 Actuals adjusted retroactively to remove interdepartmental charges and recoveries
Key Cost Drivers ($000) 2018 Actuals 2019 Proj.
Actuals
2020 Staff Rec'd Base
Budget
Year over Year Changes

2020 Operating Budget Arena Boards of Management
toronto.ca/budget Budget Notes | Page 8 of 21
2021 & 2022 OUTLOOKS
Table 3: 2021 and 2022 Outlooks
Key 2021 drivers Summarize key drivers/changes reflected in outlooks
Inflationary Impact • Increases to Gross Expenditures are driven by inflationary impacts to salaries & benefits • Increases to Revenues is driven by inflationary increases to ice rental revenues which are offset by
inflationary increases to operational cost increases.
Key 2022 drivers Summarize key drivers/changes reflected in outlooks
Inflationary Impact • Increases to Gross Expenditures are driven by inflationary impacts to salaries & benefits • Increases to Revenues is driven by inflationary increases to ice rental revenues which are offset by
inflationary increases to operational cost increases.
$ $ $ $Revenues 9,793.3 10,106.7 10,179.0 10,227.1Gross Expenditures 9,781.7 9,998.8 10,165.2 10,253.0
Net Expenditures 11.6 107.9 13.7 25.9
Approved Positions 65.5 66.0 66.0 66.0*2019 Q3 Projected Actuals adjusted retroactively to remove interdepartmental charges and recoveries
($000s) 2021 Outlook 2022 Outlook2019 Projected Actual
2020 Staff Rec'd Budget
2020 Operating Budget Arena Boards of Management
toronto.ca/budget Budget Notes | Page 9 of 21
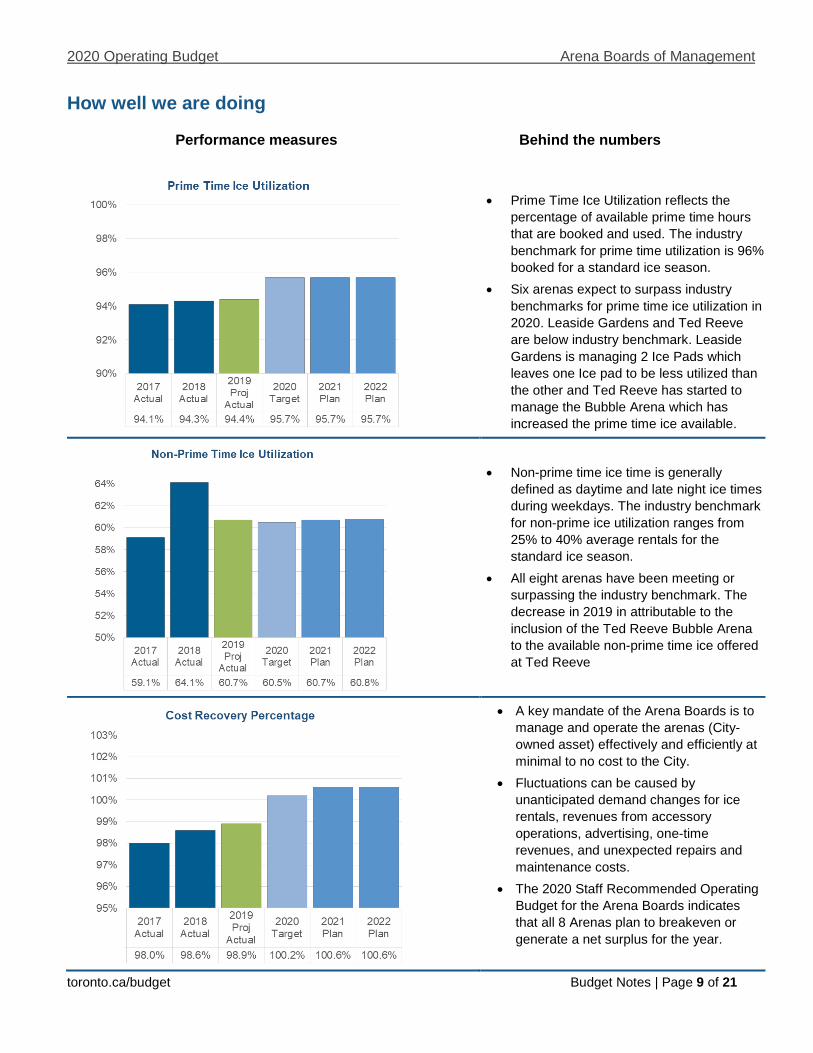
How well we are doing
Performance measures Behind the numbers
• Prime Time Ice Utilization reflects the
percentage of available prime time hours that are booked and used. The industry benchmark for prime time utilization is 96% booked for a standard ice season.
• Six arenas expect to surpass industry benchmarks for prime time ice utilization in 2020. Leaside Gardens and Ted Reeve are below industry benchmark. Leaside Gardens is managing 2 Ice Pads which leaves one Ice pad to be less utilized than the other and Ted Reeve has started to manage the Bubble Arena which has increased the prime time ice available.
• Non-prime time ice time is generally
defined as daytime and late night ice times during weekdays. The industry benchmark for non-prime ice utilization ranges from 25% to 40% average rentals for the standard ice season.
• All eight arenas have been meeting or surpassing the industry benchmark. The decrease in 2019 in attributable to the inclusion of the Ted Reeve Bubble Arena to the available non-prime time ice offered at Ted Reeve
• A key mandate of the Arena Boards is to manage and operate the arenas (City-owned asset) effectively and efficiently at minimal to no cost to the City.
• Fluctuations can be caused by unanticipated demand changes for ice rentals, revenues from accessory operations, advertising, one-time revenues, and unexpected repairs and maintenance costs.
• The 2020 Staff Recommended Operating Budget for the Arena Boards indicates that all 8 Arenas plan to breakeven or generate a net surplus for the year.
2020 Operating Budget Arena Boards of Management
toronto.ca/budget Budget Notes | Page 10 of 21
APPENDICES

2020 Operating Budget Arena Boards of Management
toronto.ca/budget Budget Notes | Page 11 of 21
Appendix 1
2020 Staff Recommended Operating Budget by Expenditure Category
2020
2017 2018 20192019
ProjectedTotal Staff
RecommendedCategory Actual Actual Budget Actual * Budget(In $000s) $ $ $ $ $ $ %
Provincial Subsidies Federal Subsidies Other Subsidies User Fees & Donations 7,970.8 7,870.6 8,690.5 8,683.7 8,992.2 308.5 3.6% Licences & Permits Revenue Transfers From Capital Contribution From Reserves/Reserve Funds Sundry and Other Revenues 1,062.0 1,082.9 1,109.7 1,109.7 1,114.5 4.9 0.4% Inter-Divisional Recoveries
Total Revenues 9,032.8 8,953.5 9,800.1 9,793.3 10,106.7 313.4 3.2% Salaries and Benefits 4,692.0 4,776.7 5,091.2 5,091.2 5,127.9 36.7 0.7% Materials & Supplies 2,339.2 2,515.5 2,558.0 2,558.0 2,581.1 23.1 0.9% Equipment 78.9 69.4 55.5 55.5 54.5 (1.0) (1.8%) Service and Rent 1,107.1 1,015.6 1,266.1 1,265.3 1,376.9 111.6 8.8% Contribution To Capital 525.0 525.0 525.0 525.0 525.0 Contribution To Reserves/Reserve Funds 271.0 275.3 286.7 286.7 308.9 22.3 7.8% Other Expenditures 24.4 24.4 Inter-Divisional Charges
Total Gross Expenditures 9,013.2 9,177.4 9,782.4 9,781.7 9,998.8 217.1 2.2% Net Expenditures (19.6) 223.9 (17.7) (11.6) (107.9) (96.3) 827.5% Approved Positions 67.7 65.6 65.5 65.5 66.0 0.5 0.8%
* Year-End Projection Based on Q3 2019 Variance Report**Prior Year Budget and Actuals adjusted retroactively to remove interdepartmental charges and recoveries
2020 Change from 2019 Projected Actual
2020 Operating Budget Arena Boards of Management
toronto.ca/budget Budget Notes | Page 12 of 21
Appendix 2
Summary of 2020 Service Changes N/A
Appendix 3
Summary of 2020 New / Enhanced Service Priorities Included in Budget N/A
Appendix 4
Summary of 2020 New / Enhanced Service Priorities Not Included in Budget N/A
Appendix 5
2020 Capital Budget; 2021 - 2029 Capital Plan Including Carry Forward Funding
N/A
Appendix 5a
2020 Cash Flow and Future Year Commitments Including Carry Forward Funding N/A
Appendix 5b
2021 - 2029 Capital Plan N/A
Appendix 6
Reporting on Major Capital Projects: Status Update N/A
Appendix 7
Summary of Capital Needs Constraints (In $ Millions)
N/A

2020 Operating Budget Arena Boards of Management
toronto.ca/budget Budget Notes | Page 13 of 21
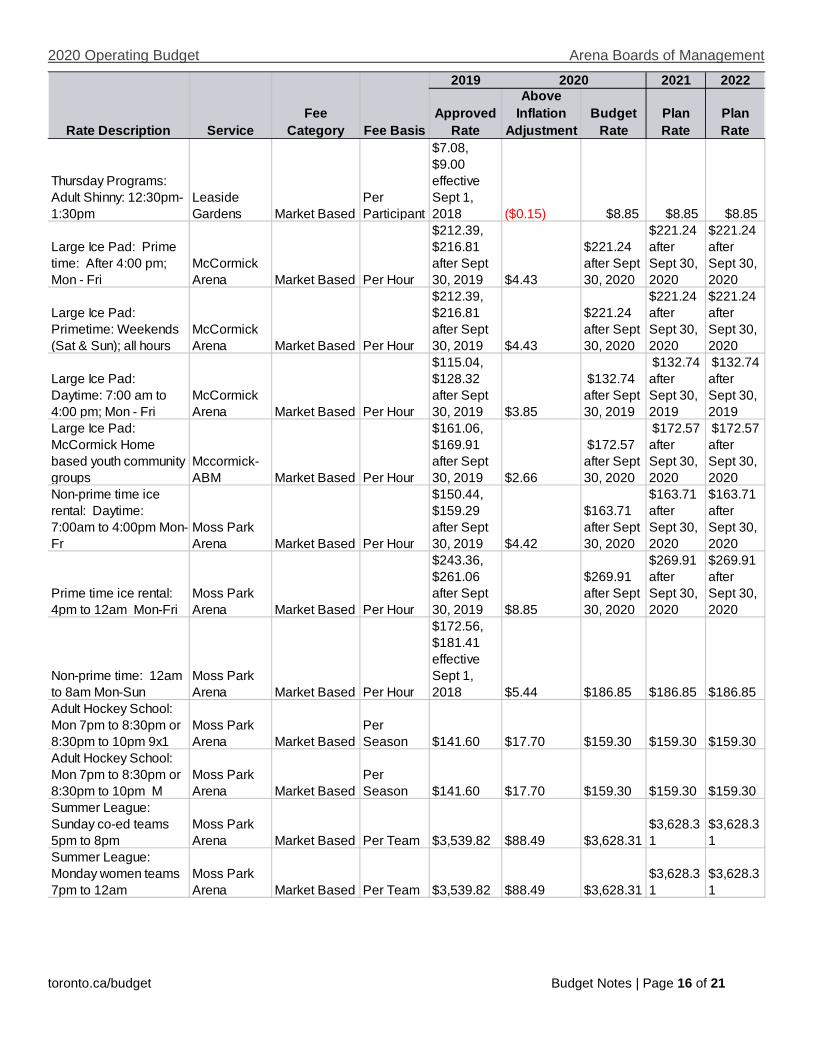
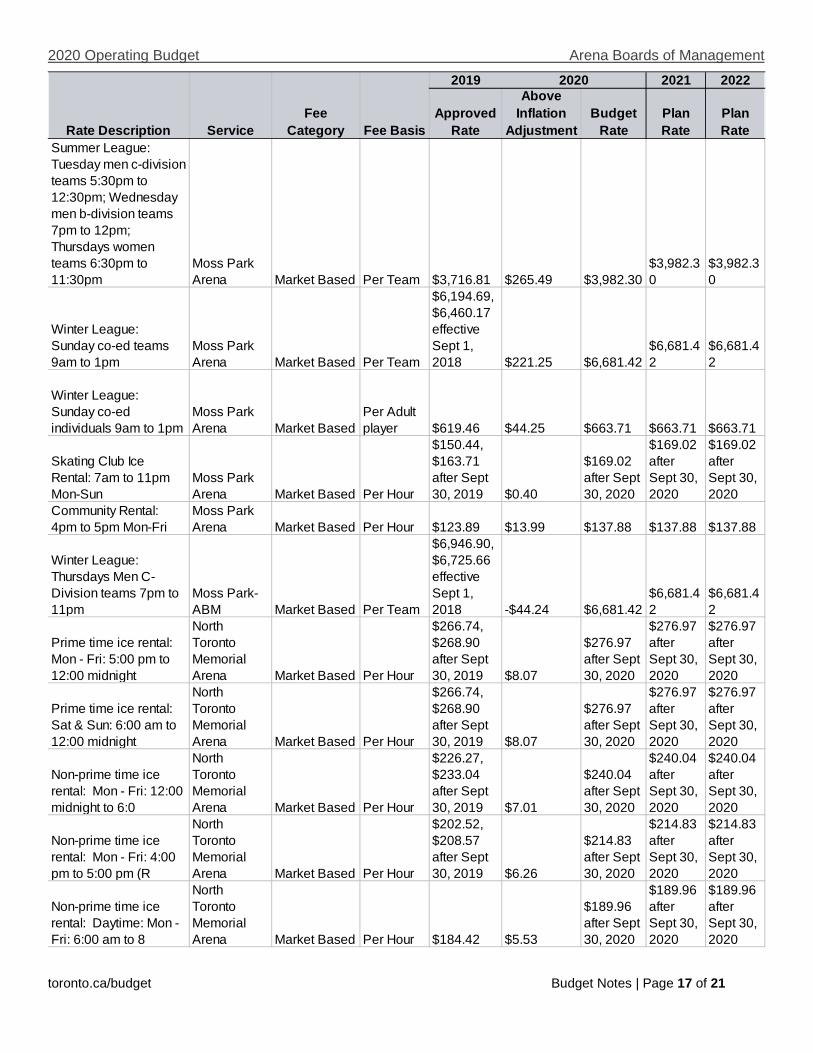
Appendix 8
2020 User Fee Changes (Excludes User Fees Adjusted for Inflation)
Table 8b – Fees Above Inflation
2019 2021 2022
ApprovedRate
Above Inflation
AdjustmentBudget
RatePlanRate
PlanRate
Fall/Winter Ice Season: Ice Time Rental: Adult Prime Time:
George Bell Arena Market Based Per Hour
$300.80, $309.82 after Sept 30, 2019 $9.39
$319.21 after May 1, 2020
$319.21 after May 1, 2020
$319.21 after May 1, 2020
Fall/Winter Ice Season: Ice Time Rental: Youth Prime Time:
George Bell Arena Market Based Per Hour
$236.99, $244.10 after Sept 30, 2019 $7.51
$251.61 after May 1, 2020
$251.61 after May 1, 2020
$251.61 after May 1, 2020
Fall/Winter Ice Season: Ice Time Rental: Weekday Non-Prime
George Bell Arena Market Based Per Hour
$132.17, $136.14 after Sept 30, 2019 $4.69
$140.83 after May 1, 2020
$140.83 after May 1, 2020
$140.83 after May 1, 2020
Fall/Winter Ice Season: Ice Time Rental: Weekday/Weekend N
George Bell Arena Market Based Per Hour
$236.99, $244.10 after Sept 30, 2019 $7.51
$251.61 after May 1, 2020
$251.61 after May 1, 2020
$251.61 after May 1, 2020
Ice Time Rental - Girls Hockey: Prime Time
George Bell Arena Market Based Per Hour
$186.86, $192.47 after Sept 30, 2019 $5.63
$198.10 after May 1, 2020
$198.10 after May 1, 2020
$198.10 after May 1, 2020
Ice Time Rental: School Games Non-Prime
George Bell Arena Market Based Per Hour
$132.17, $136.14 after Sept 30, 2019 $4.69
$140.83 after May 1, 2020
$140.83 after May 1, 2020
$140.83 after May 1, 2020
Summer Ice RentalGeorge Bell Arena Market Based Per Hour
$236.99, $244.10 after Sept 30, 2019 $7.51
$251.61 after May 1, 2020
$251.61 after May 1, 2020
$251.61 after May 1, 2020
Program: Adult Leagues
William H. Bolton Arena Market Based
Per Season $406.00 $101.25
507.25 after Sept 30, 2019
507.25 after Sept 30, 2019
507.25 after Sept 30, 2019
Program: Learn to Skate
William H. Bolton Arena Market Based
Per Season
$143.00, $147.50 after Sept 30, 2019 $2.99
$150.49 after Sept 30, 2019
$150.49 after Sept 30, 2019
$150.49 after Sept 30, 2019
Program : Learn To Skate (Children - Beginners): Teaching C
William H. Bolton Arena Market Based
Per Season
$117.00, $120.50 after Sept 30, 2019 $2.50
$123 after Sept 30, 2020
$123 after Sept 30, 2020
$123 after Sept 30, 2020
2020
Rate Description ServiceFee
Category Fee Basis

2020 Operating Budget Arena Boards of Management
toronto.ca/budget Budget Notes | Page 14 of 21
2019 2021 2022
ApprovedRate
Above Inflation
AdjustmentBudget
RatePlanRate
PlanRate
Program: Boys and Girls House League Hockey
William H. Bolton Arena Market Based
Per Season
$346.00, $356.50 after Sept 30, 2019 $32.50
$389.00 after Sept 30, 2019
$389.00 after Sept 30, 2019
$389.00 after Sept 30, 2019
Program: Women's Education: Teaching Hockey Skills (for a
William H. Bolton Arena Market Based
Per Season
$140.00, $144.00 after Sept 30, 2019 $2.99
$146.99 after Sept 30, 2020
$146.99 after Sept 30, 2020
$146.99 after Sept 30, 2020
Fall/Winter Ice Season: Ice Time Rental: Daytime ice
William H. Bolton Arena Market Based Per Hour
$120.00, $124.00 after Sept 30, 2019 $2.50
$126.50 after Sept 30, 2019
$126.50 after Sept 30, 2019
$126.50 after Sept 30, 2019
Fall/Winter Ice Season: Non-prime time ice rental: 4:00 pm
William H. Bolton Arena Market Based Per Hour
$170.00, $175.00 after Sept 30, 2019 -$48.50
$126.50 after Sept 30, 2019
$126.50 after Sept 30, 2019
$126.50 after Sept 30, 2019
Fall/Winter Ice Season: Ice Time Rental: Prime time ice
William H. Bolton Arena Market Based Per Hour
$230.00, $237.00 after Sept 30, 2019 $4.75
$241.75 after Sept 30, 2019
$241.75 after Sept 30, 2019
$241.75 after Sept 30, 2019
Program: Boys and Girls Hockey Skills
William H. Bolton Arena Market Based
Per Season
$217.50, $246.00 after Sept 30, 2019 $5.00
$251.00 after Sept 30, 2019
$251.00 after Sept 30, 2019
$251.00 after Sept 30, 2019
Large Ice Surface: Non-Prime Time Ice Rental: Daytime: 7:00
Larry Grossman Forest Hill Memorial Arena Market Based Per Hour
$123.89, $128.32 after Sept 30, 2019 $2.65 $130.97 $130.97 $130.97
Large Ice Surface: Prime Time Ice Rental: Primetime: 4:00
Larry Grossman Forest Hill Memorial Arena Market Based Per Hour
$230.09, $234.51 after Sept 30, 2019 $4.43 $238.94 $238.94 $238.94
Large Ice Surface: Ice Time Rental: Weekend: 7:00 am to 1:
Larry Grossman Forest Hill Memorial Arena Market Based Per Hour
$230.09, $234.51 after Sept 30, 2019 $4.43 $238.94 $238.94 $238.94
Large Ice Surface: Non-Prime Time Ice Rental: 8:00 am to 4
Larry Grossman Forest Hill Memorial Arena Market Based Per Hour
$66.37, $70.80 effective Sept 1, 2018 $1.77 $72.57 $72.57 $72.57
Small Ice Surface: Non-Prme Time Ice Rental: Daytime: 7:00
Larry Grossman Forest Hill Memorial Arena Market Based Per Hour
$110.61, $115.04 effective Sept 1, 2018 $4.43 $119.47 $119.47 $119.47
2020
Rate Description ServiceFee
Category Fee Basis

2020 Operating Budget Arena Boards of Management
toronto.ca/budget Budget Notes | Page 15 of 21
2019 2021 2022
ApprovedRate
Above Inflation
AdjustmentBudget
RatePlanRate
PlanRate
Small Ice Surface: Ice Time Rental: Primetime: 4:00 pm to
Larry Grossman Forest Hill Memorial Arena Market Based Per Hour
$176.99, $181.42 after Sept 30, 2019 $4.42 $185.84 $185.84 $185.84
Small Ice Surface: Ice Time Rental: Weekend: 7:00 am to 1:
Larry Grossman Forest Hill Memorial Arena Market Based Per Hour
$176.99, $181.42 after Sept 30, 2019 $4.42 $185.84 $185.84 $185.84
Small Ice Surface: Ice Time Rental: 8:00 am to 4 pm Mon -
Larry Grossman Forest Hill Memorial Arena Market Based Per Hour
$66.37, $70.80 effective Sept 1, 2018 $1.77 $72.57 $72.57 $72.57
Prime Time Ice RentalLeaside Gardens Market Based Per Hour $335.66 $9.71 $345.47 $345.47 $345.47
Day Time Ice RentalLeaside Gardens Market Based Per Hour $273.96 ($24.73) $249.23 $249.23 $249.23
Non-prime: 11 pm - 12 midnight
Leaside Gardens Market Based Per Hour $190.00 $5.63 $195.63 $195.63 $195.63
Public Skating - AdultLeaside Gardens Market Based
Per Participant $4 ($0.46) 3.54 3.54 3.54
Public Skating - Youth (12 - 17 years old)
Leaside Gardens Market Based
Per Participant $3 ($0.35) $2.65 $2.65 $2.65
Public Skating: Children (11 years and under)
Leaside Gardens Market Based
Per Participant $2 ($0.23) $1.77 $1.77 $1.77
Tuesday Programs: Adult Shinny: 12 noon - 1:00 pm
Leaside Gardens Market Based
Per Participant
$7.08, $9.00 effective Sept 1, 2018 ($0.15) $8.85 $8.85 $8.85
Friday Programs: Adult Shinny: 1:00 pm - 2:00 pm
Leaside Gardens Market Based
Per Participant
$7.08, $9.00 effective Sept 1, 2018 ($0.15) $8.85 $8.85 $8.85
Banquet Hall Rental: Jan, Feb, Mar, Apr, Oct, Nov: Saturda
Leaside Gardens Market Based Per Day $730.00 $95.00 $825.00 $825.00 $825.00
Banquet Hall Rental: Jan, Feb, Mar, Apr, Oct, Nov: Fridays
Leaside Gardens Market Based Per Day $509.00 $66.00 $575.00 $575.00 $575.00
Banquet Hall Rental: Jan, Feb, Mar, Apr, Oct, Nov: Mondays
Leaside Gardens Market Based Per Day $442.00 $58.00 $500.00 $500.00 $500.00
2020
Rate Description ServiceFee
Category Fee Basis
2020 Operating Budget Arena Boards of Management
toronto.ca/budget Budget Notes | Page 16 of 21
2019 2021 2022
ApprovedRate
Above Inflation
AdjustmentBudget
RatePlanRate
PlanRate
Thursday Programs: Adult Shinny: 12:30pm-1:30pm
Leaside Gardens Market Based
Per Participant
$7.08, $9.00 effective Sept 1, 2018 ($0.15) $8.85 $8.85 $8.85
Large Ice Pad: Prime time: After 4:00 pm; Mon - Fri
McCormick Arena Market Based Per Hour
$212.39, $216.81 after Sept 30, 2019 $4.43
$221.24 after Sept 30, 2020
$221.24 after Sept 30, 2020
$221.24 after Sept 30, 2020
Large Ice Pad: Primetime: Weekends (Sat & Sun); all hours
McCormick Arena Market Based Per Hour
$212.39, $216.81 after Sept 30, 2019 $4.43
$221.24 after Sept 30, 2020
$221.24 after Sept 30, 2020
$221.24 after Sept 30, 2020
Large Ice Pad: Daytime: 7:00 am to 4:00 pm; Mon - Fri
McCormick Arena Market Based Per Hour
$115.04, $128.32 after Sept 30, 2019 $3.85
$132.74 after Sept 30, 2019
$132.74 after Sept 30, 2019
$132.74 after Sept 30, 2019
Large Ice Pad: McCormick Home based youth community groups
Mccormick-ABM Market Based Per Hour
$161.06, $169.91 after Sept 30, 2019 $2.66
$172.57 after Sept 30, 2020
$172.57 after Sept 30, 2020
$172.57 after Sept 30, 2020
Non-prime time ice rental: Daytime: 7:00am to 4:00pm Mon-Fr
Moss Park Arena Market Based Per Hour
$150.44, $159.29 after Sept 30, 2019 $4.42
$163.71 after Sept 30, 2020
$163.71 after Sept 30, 2020
$163.71 after Sept 30, 2020
Prime time ice rental: 4pm to 12am Mon-Fri
Moss Park Arena Market Based Per Hour
$243.36, $261.06 after Sept 30, 2019 $8.85
$269.91 after Sept 30, 2020
$269.91 after Sept 30, 2020
$269.91 after Sept 30, 2020
Non-prime time: 12am to 8am Mon-Sun
Moss Park Arena Market Based Per Hour
$172.56, $181.41 effective Sept 1, 2018 $5.44 $186.85 $186.85 $186.85
Adult Hockey School: Mon 7pm to 8:30pm or 8:30pm to 10pm 9x1
Moss Park Arena Market Based
Per Season $141.60 $17.70 $159.30 $159.30 $159.30
Adult Hockey School: Mon 7pm to 8:30pm or 8:30pm to 10pm M
Moss Park Arena Market Based
Per Season $141.60 $17.70 $159.30 $159.30 $159.30
Summer League: Sunday co-ed teams 5pm to 8pm
Moss Park Arena Market Based Per Team $3,539.82 $88.49 $3,628.31
$3,628.31
$3,628.31
Summer League: Monday women teams 7pm to 12am
Moss Park Arena Market Based Per Team $3,539.82 $88.49 $3,628.31
$3,628.31
$3,628.31
2020
Rate Description ServiceFee
Category Fee Basis
2020 Operating Budget Arena Boards of Management
toronto.ca/budget Budget Notes | Page 17 of 21
2019 2021 2022
ApprovedRate
Above Inflation
AdjustmentBudget
RatePlanRate
PlanRate
Summer League: Tuesday men c-division teams 5:30pm to 12:30pm; Wednesday men b-division teams 7pm to 12pm; Thursdays women teams 6:30pm to 11:30pm
Moss Park Arena Market Based Per Team $3,716.81 $265.49 $3,982.30
$3,982.30
$3,982.30
Winter League: Sunday co-ed teams 9am to 1pm
Moss Park Arena Market Based Per Team
$6,194.69, $6,460.17 effective Sept 1, 2018 $221.25 $6,681.42
$6,681.42
$6,681.42
Winter League: Sunday co-ed individuals 9am to 1pm
Moss Park Arena Market Based
Per Adult player $619.46 $44.25 $663.71 $663.71 $663.71
Skating Club Ice Rental: 7am to 11pm Mon-Sun
Moss Park Arena Market Based Per Hour
$150.44, $163.71 after Sept 30, 2019 $0.40
$169.02 after Sept 30, 2020
$169.02 after Sept 30, 2020
$169.02 after Sept 30, 2020
Community Rental: 4pm to 5pm Mon-Fri
Moss Park Arena Market Based Per Hour $123.89 $13.99 $137.88 $137.88 $137.88
Winter League: Thursdays Men C-Division teams 7pm to 11pm
Moss Park-ABM Market Based Per Team
$6,946.90, $6,725.66 effective Sept 1, 2018 -$44.24 $6,681.42
$6,681.42
$6,681.42
Prime time ice rental: Mon - Fri: 5:00 pm to 12:00 midnight
North Toronto Memorial Arena Market Based Per Hour
$266.74, $268.90 after Sept 30, 2019 $8.07
$276.97 after Sept 30, 2020
$276.97 after Sept 30, 2020
$276.97 after Sept 30, 2020
Prime time ice rental: Sat & Sun: 6:00 am to 12:00 midnight
North Toronto Memorial Arena Market Based Per Hour
$266.74, $268.90 after Sept 30, 2019 $8.07
$276.97 after Sept 30, 2020
$276.97 after Sept 30, 2020
$276.97 after Sept 30, 2020
Non-prime time ice rental: Mon - Fri: 12:00 midnight to 6:0
North Toronto Memorial Arena Market Based Per Hour
$226.27, $233.04 after Sept 30, 2019 $7.01
$240.04 after Sept 30, 2020
$240.04 after Sept 30, 2020
$240.04 after Sept 30, 2020
Non-prime time ice rental: Mon - Fri: 4:00 pm to 5:00 pm (R
North Toronto Memorial Arena Market Based Per Hour
$202.52, $208.57 after Sept 30, 2019 $6.26
$214.83 after Sept 30, 2020
$214.83 after Sept 30, 2020
$214.83 after Sept 30, 2020
Non-prime time ice rental: Daytime: Mon - Fri: 6:00 am to 8
North Toronto Memorial Arena Market Based Per Hour $184.42 $5.53
$189.96 after Sept 30, 2020
$189.96 after Sept 30, 2020
$189.96 after Sept 30, 2020
2020
Rate Description ServiceFee
Category Fee Basis

2020 Operating Budget Arena Boards of Management
toronto.ca/budget Budget Notes | Page 18 of 21
The 2020 User fees are adjusted throughout the year to respond to market conditions. Each Individual Arena Board examines their user fee levels in relation to fees at other comparable facilities, consult with key user groups, and determine appropriate user fee adjustments.
Table 8d - User Fees for Technical Adjustments
These 2020 User Fees were inadvertently not included in Municipal Code 441 while the Arena Board was offering these services to the public.
2019 2021 2022
ApprovedRate
Above Inflation
AdjustmentBudget
RatePlanRate
PlanRate
Non-prime time ice rental: Daytime: Mon - Fri: 8:00 am to 4:
North Toronto Memorial Arena Market Based Per Hour
$137.81, $180.18 after Sept 30, 2019 $5.41
$185.59 after Sept 30, 2020
$185.59 after Sept 30, 2020
$185.59 after Sept 30, 2020
Non-prime time ice rental: Private Ice: Mon - Fri: 8:00 am
North Toronto Memorial Arena Market Based Per Hour
$62.00, $79.65 after Sept 30, 2019 $4.42
$84.07 after Sept 30, 2020
$84.07 after Sept 30, 2020
$84.07 after Sept 30, 2020
Prime Time Ice Rental: Mon. - Fri. 6:00 pm to 11:00 pm; Sat
Ted Reeve Arena Market Based Per Hour
$251.90, $291.15 after Sept 30, 2019 $2.66
$293.81 after Sept 30, 2020
$293.81 after Sept 30, 2020
$293.81 after Sept 30, 2020
Non-prime time: Weekdays: 5:00 pm to 6:00 pm; Mon - Fri
Ted Reeve Arena Market Based Per Hour
$186.78, $187.61 after Sept 30, 3019 $1.77
$189.38 after Sept 30, 2020
$189.38 after Sept 30, 2020
$189.38 after Sept 30, 2020
Prime time: Sunday to Friday after 11 pm
Ted Reeve Arena Market Based Per Hour $195.58 $1.76
$197.34 after Sept 30, 2020
$197.34 after Sept 30, 2020
$197.34 after Sept 30, 2020
2020
Rate Description ServiceFee
Category Fee Basis
Rate Description Service Fee
Category Fee Basis
2019Approved
Rate
2020Budget
RateReason for Adjustment
Small Ice Pad: Shinny Hockey
Mccormick-ABM
Market Based Per Session $7.08
Small Ice Pad: Kids Shinny Hockey
Mccormick-ABM
Market Based Per Session $4.42
Large Ice Pad: Ticket-Ice Figure Skating
Mccormick-ABM
Market Based Per Session $4.42
Inadvertently excluded in
Municipal Code 441

2020 Operating Budget Arena Boards of Management
toronto.ca/budget Budget Notes | Page 19 of 21
Appendix 9
Inflows and Outflows to/from Reserves and Reserve Funds 2020 Operating Budget
Program Specific Reserve / Reserve Funds
Corporate Reserve / Reserve Funds
2020 2021 2022$ $ $ $
Beginning Balance 256.9 262.6 164.6 174.1 Arena Boards of Management Ice Resurfacer Replacement Reserve
XQ1705
Withdrawals (-)Ice Resurfacer Purchase (108.3) (222.0) (114.5) (120.0)
Contributions (+)Contributions to Fund 114.0 124.0 124.0 124.0
Total Reserve / Reserve Fund Draws / Contributions 262.6 164.6 174.1 178.1 Balance at Year-End 262.6 164.6 174.1 178.1 * Based on 9-month 2019 Reserve Fund Variance Report
Reserve / Reserve Fund Number
Projected Balance as of Dec. 31, 2019 *
Withdrawals (-) / Contributions (+)Arena Boards of Management Ice Resurfacer Replacement Reserve
(In $000s)
2020 2021 2022
$ $ $ $Beginning Balance 571.4 654.3 737.3 820.3 Leaside Memorial Community Gardens Arena Debt Service Reserve Fund
XR3216
Withdrawals (-)Contributions (+)
Contributions to fund 83.0 83.0 83.0 83.0 Total Reserve / Reserve Fund Draws / Contributions 654.3 737.3 820.3 903.3 Other Program / Agency Net Withdrawals & ContributionsBalance at Year-End 654.3 737.3 820.3 903.3 * Based on 9-month 2019 Reserve Fund Variance Report
Reserve / Reserve Fund Number
Projected Balance as of Dec. 31, 2019 *
Withdrawals (-) / Contributions (+)Leaside Memorial Community
Gardens Arena Debt Service Reserve Fund
(In $000s)
2020 2021 2022$ $ $ $
Beginning Balance 33,164.6 25,183.1 16,736.2 8,289.3 Sick Leave Reserve Fund XR1007Withdrawals (-)Contributions (+)
Contributions to fund 5.0 5.0 5.0 5.0 Total Reserve / Reserve Fund Draws / Contributions 33,169.6 25,188.1 16,741.2 8,294.3 Other Program / Agency Net Withdrawals & Contributions (7,986.5) (8,451.9) (8,451.9) (8,451.9) Balance at Year-End 25,183.1 16,736.2 8,289.3 (157.6) * Based on 9-month 2019 Reserve Fund Variance Report
Reserve / Reserve Fund Number
Projected Balance as of Dec. 31, 2019 *
Withdrawals (-) / Contributions (+)Sick Leave Reserve Fund
(In $000s)

2020 Operating Budget Arena Boards of Management
toronto.ca/budget Budget Notes | Page 20 of 21
2020 2021 2022$ $ $ $
Beginning Balance 34,554.0 29,462.4 26,435.4 23,282.9 Insurance Reserve Fund(In $000s)
XR1010
Withdrawals (-)Contributions (+)
Contributions to fund 89.7 97.0 93.5 93.5 Total Reserve / Reserve Fund Draws / Contributions 34,643.7 29,559.4 26,528.9 23,376.4 Other Program / Agency Net Withdrawals & Contributions (5,181.3) (3,124.0) (3,246.0) (3,241.4) Balance at Year-End 29,462.4 26,435.4 23,282.9 20,135.1 * Based on 9-month 2019 Reserve Fund Variance Report
Reserve / Reserve Fund Number
Projected Balance as of Dec. 31, 2019 *
Withdrawals (-) / Contributions (+)Insurance Reserve Fund
(In $000s)

2020 Operating Budget Arena Boards of Management
toronto.ca/budget Budget Notes | Page 21 of 21
Appendix 10
Glossary of Terms Approved Position: Permanent or temporary positions that support the delivery of City services and service levels as approved by Council.
Actuals: An actual financial amount paid (or received) for the delivery of City services (these exclude any commitments to be paid in the future). Capacity to Spend: Ability to spend money along with the capacity to deliver projects as demonstrated by historic spending patterns and approved contractual obligations. Capital Budget: A Capital Budget is the City's plan to acquire / build assets or extend the useful life of existing assets; an example of a capital expenditure is the construction of a new community centre.
Capital Needs Constraints: The capital needs that cannot be accommodated within the capital plan that the Division or Agency have the capacity to deliver. Complement: Positions that support the delivery of City services and service levels as approved by Council.
Efficiencies: Reductions in the cost of delivering a service without a reduction in service level.
New / Enhanced: New and enhanced service changes resulting in an increase in service levels from what was previously approved by Council. Operating Budget: An Operating Budget is the City's annual plan to provide services to the residents of Toronto; the budget includes all revenues and expenses needed to provided services; an example of an operating cost would be the cost to run the TTC subways.
Operating Impact of Completed Capital Projects: The additional expense (or savings) and positions needed to operate or maintain a new asset; an example would be the additional expense and staff needed to operate a recently completed community centre.
Rate Supported Budget: Budget fully funded by user fees such as Solid Waste, Toronto Water and Toronto Parking Authority
Staff Recommended Operating / Capital Budget: An operating or capital budget recommended by City Manager and Chief Financial Officer and Treasurer to City Council for consideration and approval.
State of Good Repair (SOGR): The cost of maintaining assets to ensure they are able to support the delivery of City services and meet service outcomes
Tax Supported Budget: Budget funded by property taxes.
User Fees: Program generated fee and rental revenue for the use of its services (such as the TTC fare, ice rental fees and various City permits).
Value Based Outcome Review (VBOR): The City conducted a Value Based Outcome Review in 2019 for all of its operations and agencies to identify specific opportunities and strategies to maximize the use of tax dollars, enhance its financial sustainability while achieving service outcomes. These opportunities will help the City chart its financial course in the next four years.