2020 cahps health plan survey database chartbook
TRANSCRIPT

THE CAHPS DATABASE
2020 CAHPS Health Plan Survey Database
2020 Chartbook What Consumers Say About Their Experiences With Their Health Plans and Medical Care

This document is in the public domain and may be used and reprinted without permission in the United States for noncommercial purposes, unless materials are clearly noted as copyrighted in the document. No one may reproduce materials without the permission of the copyright holders. Users outside the United States must get permission from AHRQ to reprint or translate this product. Anyone wanting to reproduce this product for sale must contact AHRQ for permission.
The authors of this report are responsible for its content. Statements in the report should not be construed as endorsement by the Agency for Healthcare Research and Quality or the U.S. Department of Health and Human Services.
No investigators have any affiliations or financial involvement (e.g., employment, consultancies, honoraria, stock options, expert testimony, grants or patents received or pending, or royalties) that conflict with material presented in this report.
AHRQ Contract No.: 3201500026I/HHSP23337004T
Managed and prepared by:
Westat, Rockville, MD
Daniel Sangria Darby Quave Naomi Yount Dale Shaller Teresa Dodson

CAHPS Health Plan Survey Database 2020 Chartbook: What Consumers Say About Their Experiences With Their Health Plans and Medical Care
i
TABLE OF CONTENTS
1. OVERVIEW ................................................................................................................................................... 2
2. INTRODUCTION ........................................................................................................................................... 4
3. DATA SOURCES, LIMITATIONS AND RESEARCH DATASETS ................................................................ 5
Data Sources ........................................................................................................................ 5 Data Limitations ................................................................................................................... 5 Impact of COVID-19 Pandemic ............................................................................................ 5 Research Datasets and Technical Assistance ................................................................... 6
4. RESULTS BY ENROLLEE POPULATION ................................................................................................... 7
Adult Medicaid ..................................................................................................................... 8 Adult Medicaid 2020 Results ........................................................................................ 9 Adult Medicaid Trends ................................................................................................ 11
Child Medicaid .................................................................................................................... 13 Child Medicaid 2020 Results ...................................................................................... 14 Child Medicaid Trends ................................................................................................ 16
Children’s Health Insurance Program (CHIP) ................................................................... 18 CHIP 2020 Results ...................................................................................................... 19 CHIP Trends ................................................................................................................ 21
APPENDIX A. 2020 SURVEY RESPONDENTS BY STATE .......................................................................... 23
APPENDIX B. DEFINITION OF COMPOSITE MEASURES, ITEMS, AND RATINGS ................................... 25

CAHPS Health Plan Survey Database 2020 Chartbook: What Consumers Say About Their Experiences With Their Health Plans and Medical Care
2
1. OVERVIEW
2020 Health Plan Survey Database
This overview of results summarizes how health plan enrollees across all populat ions rate their healt h plan based on the 2020 Consumer Assessment of
Healthcare Providers and Systems (CAHPS®) Health Plan Survey Database.
HEALTH PLAN ENROLLEES
51 ,211 Adult Medicaid Enrollees
56,311 Child Medicaid Enrollees
12,448 CHIP Program Enrollees
119,970 Total Enrollees
AMONG THE THREE ENROLLEE POPULATIONS ...
Highest Scoring Measure
How Well Doctors Communicate
82 percent of CHIP respondents indicated that the child's doctor
communicated well.
Lowest Scoring Measure
Getting Needed Care
55 percent of Adult Medicaid respondents indicated that
they could always get needed care.
Overall Rating Items
Personal Doctors and Specialists
Enrollees rated their Personal Doctors and Specialists more highly than their Health Care
or Health Plans.

CAHPS Health Plan Survey Database 2020 Chartbook: What Consumers Say About Their Experiences With Their Health Plans and Medical Care
3
Health Plan Composite Measure Results by Enrollee Population
Child Medicaid and CHIP enrollees report having better access to care and communicat ion w ith doctors than the Adult Medicaid enrollees.
Getting Care Quickly
73 75
59
Adult Child Medicaid Medicaid
CHIP
Gett ing Needed Care
55 61 62
Adult Child Medicaid Medicaid
CHIP
How Well Doctors Communicat e
n 81 82
Adult Child CHIP Medicaid Medicaid
Health Plan Information and Customer Service
69 68 67
Adult Child CHIP Medicaid Medicaid
Largest Composite Measure Difference Between Adult Medicaid and the Child Medicaid and CHIP Enrollees
The largest difference in scores between Adult Medicaid enrollees and the Child Medicaid and CHIP enrollees is in the composite measure Getting Care Quickly. Over a ten-year per iod, Child Medicaid and CHIP enrollees
consistently scored higher than Adult Medicaid enrollees, w ith little improvement over t ime. 100
75
50
25
0 2010 2011 2013 2014 2015 2016 2017 2018 2019 2020
+ Adult Medicaid + Child Medicaid + CHIP
*There are no results available for 20 12 because of a lapse in the support contract for the CAHPS Database.

CAHPS Health Plan Survey Database 2020 Chartbook: What Consumers Say About Their Experiences With Their Health Plans and Medical Care
4
2. INTRODUCTION The Consumer Assessment of Healthcare Providers and Systems (CAHPS®) Health Plan Survey Database receives data voluntarily submitted by survey sponsors that have administered the CAHPS Health Plan Survey Versions 5.0 or 5.0H (HEDIS). The CAHPS Database aggregates the data to facilitate comparisons of CAHPS survey results by sponsors, researchers, and other interested organizations.
This Chartbook presents summary-level results calculated from CAHPS Health Plan Survey data submitted in 2020 for the following health plan enrollee populations1:
• Adult Medicaid • Child Medicaid • CHIP (Children's Health Insurance Program)
Detailed results for each enrollee population are provided for the core survey composite measures, individual question items, and ratings in the sections that follow. In addition, selected trend results for 10 years during the period from 2010-2020 are presented for the Adult and Child Medicaid populations.
Table 1 presents a comparison of the top-box scores (the most positive survey response option) for the composite measures and ratings across the three health plan enrollee populations included in the 2020 CAHPS Health Plan Survey Database.
Table 1. Comparison of 2020 Top-Box Scores By Enrollee Population
Composite Measure//Rating Adult Medicaid Child Medicaid CHIP
Number of Respondents 51,211 56,311 12,448
Number of Plans 159 137 42
Composite Measure
Getting Needed Care 55% 61% 62%
Getting Care Quickly 59% 73% 75%
How Well Doctors Communicate 77% 81% 82%
Health Plan Information and Customer Service 69% 68% 67%
Ratings
Rating of Personal Doctor 69% 78% 78%
Rating of Specialist 69% 74% 74%
Rating of Health Care 56% 70% 72%
Rating of Health Plan 61% 71% 70%
1In previous years, the CAHPS Database has received CAHPS Medicare Managed Care survey data collected by the Centers for Medicare & Medicaid Services (CMS). CMS did not collect Medicare data this year due to the COVID-19 pandemic and therefore, results are not presented in this Chartbook.

CAHPS Health Plan Survey Database 2020 Chartbook: What Consumers Say About Their Experiences With Their Health Plans and Medical Care
5
3. DATA SOURCES, LIMITATIONS AND RESEARCH DATASETS Data Sources The data presented in this Chartbook were compiled from CAHPS Health Plan Survey results submitted to the CAHPS Database by various survey sponsors, including State Medicaid agencies, CHIP programs, and individual health plans. The 2020 results are based on survey data collected between July 2019 and July 2020.
The summary results presented in this Chartbook are compiled from data reported in the CAHPS Health Plan Database Online Reporting System (ORS). The ORS is a Web-based platform that allows users to interact with the results for survey composite measures, rating measures, and individual items. The CAHPS Health Plan ORS is updated annually with new data submitted by users of the CAHPS Health Plan Survey.
Appendix A presents the number of Medicaid and CHIP survey respondents by State included in the 2020 CAHPS Health Plan Survey Database.
Data Limitations Because the organizations that voluntarily contribute data to the CAHPS Database are not from a statistically representative sample of all U.S. health plans, and a limited number of plans may choose to participate, the submitting organizations are not representative of all U.S. health plans or enrollee populations. Estimates based on these voluntarily submitted data sets may produce biased estimates of the U.S. health plan and enrollee populations; it is not possible to compute estimates of precision from these data. In addition, the number and mix of sponsors contributing data vary slightly from year to year, and therefore comparisons over time should be made with these limitations and variations in mind. Comparisons of results across populations should also take into account that variations in benefit design and other factors might affect survey responses across populations.
Impact of COVID-19 Pandemic Eighty percent or more of health plans submitting to the 2020 CAHPS Health Plan Survey Database fielded the survey during the initial wave of the pandemic between February 2020 and May 2020. Because of this, a series of analyses were performed to help determine the impact, if any, the pandemic may have had on 1) the number of plan submissions, 2) survey scores, and 3) missing data for the 2020 data compared to the data submitted for the same time periods in 2018 and 2019.
The COVID-19 pandemic does not appear to have had a major impact on the number of CAHPS Health Plan Survey submissions to the 2020 CAHPS Database, or on survey scores compared to the previous two years. A few items had a higher percentage of missing data in 2020 as compared to previous years but it was due to low administration of those questions. These questions are not publicly reported due to lack of data.
In addition, six survey vendors that submitted data this year were asked to describe what impact, if any, the pandemic had on survey administration. The most prevalent change to survey administration protocols was the transition to mail-only administration, affecting a majority of the plan samples. This change was related to the extension of the field period, which was requested by two vendors, and resulted in a decision to extend the 2020 CAHPS Health Plan Survey Database submission period by six weeks. This extension was welcomed by all vendors in order to accommodate delays in USPS delivery of

CAHPS Health Plan Survey Database 2020 Chartbook: What Consumers Say About Their Experiences With Their Health Plans and Medical Care
6
both outgoing and incoming surveys. Taken together, these changes do not appear to have had a material effect on the number of plan submissions or survey scores, as noted above.
Research Datasets and Technical Assistance De-identified CAHPS Health Plan Survey data research files are available upon request according to the CAHPS Database Data Release Policy. To learn more, visit https://cahpsdatabase.ahrq.gov/DataResearchers.aspx.
Questions or comments regarding this Chartbook or the CAHPS Health Plan Survey Database may be directed to the CAHPS Database by email [email protected] or questions may be directed to the toll-free help line at 888-808-7108.

CAHPS Health Plan Survey Database 2020 Chartbook: What Consumers Say About Their Experiences With Their Health Plans and Medical Care
7
4. RESULTS BY ENROLLEE POPULATION This section presents a summary of results for each of the health plan enrollee populations included in the 2020 CAHPS Health Plan Survey Database. Results are presented in the form of bar charts that graphically show the distribution of scores for the four composite measures, the individual question items that compose each composite measure, and the four ratings. Appendix B lists the composite measures, individual items, and ratings for the 5.0 version of the CAHPS Health Plan Survey.
The bar charts are composed of colored segments that show the percentage of responses in each of the response categories. For questions and composite measures based on 4-point response scales (i.e., "always," "usually," "sometimes," and "never"), the left-most segment combines the two lowest response categories (i.e., "sometimes" and "never").
All results presented in these charts are calculated at the respondent level. Survey results are presented in the following order:
• Adult Medicaid • Child Medicaid • CHIP
To provide context for the 2020 results, the percentage distribution of survey respondents by state for each population is shown graphically at the beginning of each section. The actual number of respondents by state is shown in Appendix A.
Trend data for the Adult and Child Medicaid enrollee populations are presented for 2010 to 2020. Trend data for the CHIP enrollee population are presented for 2011 to 2020. Note that no results are available for 2012 because of a lapse in the support contract for the CAHPS Database. Although the number and mix of health plans within each enrollee population vary slightly from year to year, there has been a fairly consistent level of participation during this time span within the Adult Medicaid and Child Medicaid populations. There has been a general increase in participation for the CHIP population since 2011. At the end of each section, there is table that provides the number of plans and respondents to provide an indication of the variation in the data sources from year to year. And although the CAHPS Health Plan Survey instrument changed slightly during this period with the transition from the 4.0 to the 5.0 version, changes to individual question items were very minor, and there were no changes to the rating questions or to the definition of the composite measures.
As noted earlier, detailed results for each question item are available through the CAHPS Database Online Reporting System. The ORS also includes results for select supplemental HEDIS items included in the 5.0H version of the CAHPS Health Plan Survey.

CAHPS Health Plan Survey Database 2020 Chartbook: What Consumers Say About Their Experiences With Their Health Plans and Medical Care
8
Adult Medicaid
Percentage Distribution of 2020 Survey Respondents by State
AK 0.0%
ME 0.0%
VT 0.9%
NH 0.7%
WA 2.2%
ID 0.0%
MT 0.0%
ND 0.0%
MN 7.2%
IL 2.0%
WI 0.4%
MI 6.8%
NY 7.4%
RI 1.7%
MA 2.5%
OR 9.6%
NV 0.2%
WY 0.0%
SD 0.9%
IA 0.0%
IN 2.1%
OH 3.3%
PA 9.7%
NJ 1.8%
CT 0.6%
CA 6.0%
UT 0.0%
co 0.9%
NE 0.6%
MO 1.0%
KY 2.1%
WV 0.0%
VA 8.0%
MD 4.3%
DE 1.2%
AZ 0.4%
NM 0.5%
KS 1.5%
AR 0.0%
TN 0.0%
NC 0.0%
SC 1.7%
DC 1.3%
HI 5.8%
OK 0.8%
LA 1.2%
MS 0.0%
AL 0.7%
GA 0.6%
TX 0.0%
FL 1.2%

CAHPS Health Plan Survey Database 2020 Chartbook: What Consumers Say About Their Experiences With Their Health Plans and Medical Care
9
Adult Medicaid 2020 Results
Composite Measure/Individual Item Never + Sometimes Usually Always
N
Getting Needed Care 17% 28% 55% 38,788
Easy to get necessary care, tests, or treatment 14% 28% 58% 36 ,291
Got appointment with specialists as soon as needed 2 1% 2 7% 5 2% 2 1 ,4 12
Getting Care Quickly 18% 23% 59% 37,585
Got care for illness, injury or condition as soon as needed 15% 22% 63% 17,903
Got non-urgent appointment as soon as needed 20% 2 5% 55% 34,226
How Well Doctors Communicate 7% 16% 77% 32,247
Doctor ex plained things in a way that was easy to understand 7% 17% 77% 32,112
Doctor listened carefully 7% 16% 78 % 32,047
Doctor showed respect for what enrollee had to say 5% 13% 82% 32,048
Doctor spent enough time with enrollee 9% 20% 71% 3 1,951
Health Plan Information and Customer Service 11% 20% 69% 18,340
Customer service gave necessary informat ion or help 17% 25% 59% 18 , 14 1
Customer serv ice was courteous and respectful 6% 15% 7 9 % 18,133
Composite Measure/Individual Item

CAHPS Health Plan Survey Database 2020 Chartbook: What Consumers Say About Their Experiences With Their Health Plans and Medical Care
10
Adult Medicaid 2020 Results (continued)
Rating 0-6 7-8 9-10
N Overall Rating of Personal Doctor 10% 21% 69% 39,881
Overall Rating of Specialist 10% 21% 69% 20,058
Overall Rating of Health Care 15% 29 % 56% 36,375
Overall Rating of Health Plan 14% 26% 61% 48,514

CAHPS Health Plan Survey Database 2020 Chartbook: What Consumers Say About Their Experiences With Their Health Plans and Medical Care
11
Adult Medicaid Trends
Figure 1. Adult Medicaid Top-Box Composite Measure Scores 2010-2020
40%
45%
50%
55%
60%
65%
70%
75%
80%
2010 2011 2013 2014 2015 2016 2017 2018 2019 2020
How Well DoctorsCommunicate
Health Plan Information andCustomer Service
Getting Care Quickly
Getting Needed Care

CAHPS Health Plan Survey Database 2020 Chartbook: What Consumers Say About Their Experiences With Their Health Plans and Medical Care
12
Adult Medicaid Trends (continued)
Figure 2. Adult Medicaid Top-Box Rating Scores 2010-2020
40%
45%
50%
55%
60%
65%
70%
75%
2010 2011 2013 2014 2015 2016 2017 2018 2019 2020
Rating ofPersonal DoctorRating ofSpecialistRating of HealthPlanRating of AllHealth Care
Table 2. Adult Medicaid Composition of the CAHPS Health Plan Survey Database 2010-2020 Adult Medicaid Composition
measurement 2010 2011 2013 2014 2015 2016 2017 2018 2019 2020 Number of Plans 186 148 124 149 133 157 152 146 131 159
Number of Respondents 97,626 73,820 60,249 68,234 61,369 73,155 65,053 54,362 43,588 51,211 Notes: (1) From 2010-2011, the Database reported Adult Medicaid version 4.0. (2) From 2013-2020, the Database reported Adult Medicaid version 5.0.

CAHPS Health Plan Survey Database 2020 Chartbook: What Consumers Say About Their Experiences With Their Health Plans and Medical Care
13
Child Medicaid
Percentage Distribution of 2020 Survey Respondents by State
AK 0.0%
ME 0.0%
VT 0.6%
NH 1.2%
WA 5.4%
ID 0.0%
MT 0.0%
ND 0.0%
MN 0.0%
IL 1.9%
WI 6.7%
Ml 5.1%
NY 0.3%
RI 1.4%
MA 1.3%
OR 12.4%
NV 0.0%
WY 0.0%
SD 0.7%
IA 0.0%
IN 1.9%
OH 5.1%
PA 4.9%
NJ 1.6%
CT 1.4%
CA 4.7%
UT 0.9%
co 0.8%
NE 1.3%
MO 0.5%
KY 2.1%
WV 0.0%
VA 6.3%
MD 8.2%
DE 1.3%
AZ 0.2%
NM 1.1%
KS 2.7%
AR 0.0%
TN 0.0%
NC 0.0%
SC 3.5%
DC 1.8%
HI 0.3%
OK 0.6%
LA 2.4%
MS 0.0%
AL 1.0%
GA 1.2%
TX 3.0%
FL 4.5%

CAHPS Health Plan Survey Database 2020 Chartbook: What Consumers Say About Their Experiences With Their Health Plans and Medical Care
14
Child Medicaid 2020 Results
Composite Measure/Individual Item Never + Sometimes Usually Always
N Getting Needed Care for a Child 14% 24% 61% 40 ,865
Easy to get necessary care, tests, or treatment for child 9% 23% 68% 38,945
Got appoint ment for child w it h specialist s as soon as needed 20% 2 5% 55% 13,722
Getting Care Quickly for a Child 10% 17% 73% 41, 370
Child got care for illness, injury, or condition as soon as needed 8% 12%79% 17,213
Child got non-urgent appointment as soon as needed 11% 21% 67% 37,811
How Well the Child's Doctors Communicate 5% 14% 81% 35,986
Child's doctor explained things in a way that was easy to understand 5% 12% 84% 35,837
Child's doctor listened carefully to respondedent 4% 12% 84% 35, 786
Child's doctor showed respect for what respondent had to say 3% 9% 88% 35,737
Child's doctor explained things in a way that was easy for child to understand 5% 17% 78% 23,922
Child's doctor spent enough time with child 8% 19% 72% 35, 362
Health Plan Information and Customer Service 11% 20% 68% 14,618
Customer service at child's health plan gave necessary information or help 17% 24% 59% 14, 509
Customer service staff at child's health plan was courteous and respectful
6% 16% 78% 14,475
Composite Measure/Individual Item

CAHPS Health Plan Survey Database 2020 Chartbook: What Consumers Say About Their Experiences With Their Health Plans and Medical Care
15
Child Medicaid 2020 Results (continued)
Rating 0-6 7-8 9-10
N Overall Rating of Child's Personal Doctor 5% 17% 78% 46,713
Overall Rating of Child's Specialist 7% 19% 74% 12,670
Overall Rating of Child's Health Care 6% 23% 70% 39 ,032
Overall Rating of Child's Health Plan 8% 22% 71% 53 ,059

CAHPS Health Plan Survey Database 2020 Chartbook: What Consumers Say About Their Experiences With Their Health Plans and Medical Care
16
Child Medicaid Trends
Figure 3. Child Medicaid Top-Box Composite Measure Scores 2010-2020
50%
55%
60%
65%
70%
75%
80%
85%
2010 2011 2013 2014 2015 2016 2017 2018 2019 2020
How Well DoctorsCommunicate
Getting CareQuickly
Health PlanInformation andCustomer Service
Getting NeededCare

CAHPS Health Plan Survey Database 2020 Chartbook: What Consumers Say About Their Experiences With Their Health Plans and Medical Care
17
Child Medicaid Trends (continued)
Figure 4. Child Medicaid Top-Box Rating Scores 2010-2020
55%
60%
65%
70%
75%
80%
2010 2011 2013 2014 2015 2016 2017 2018 2019 2020
Rating of PersonalDoctorRating of Specialist
Rating of Health Plan
Rating of All HealthCare
Table 3. Child Medicaid Composition of the CAHPS Health Plan Survey Database 2010-2020 Child Medicaid Composition
measurement 2010 2011 2013 2014 2015 2016 2017 2018 2019 2020
Number of Plans 132 129 105 100 136 132 169 150 152 137
Number of Respondents 88,694 85,003 66,804 60,153 91,049 79,058 103,283 79,736 72,429 56,311
Notes: (1) From 2010-2011, the Database reported Child Medicaid version 4.0. (2) From 2013-2020, the Database reported Child Medicaid version 5.0.

CAHPS Health Plan Survey Database 2020 Chartbook: What Consumers Say About Their Experiences With Their Health Plans and Medical Care
18
Children’s Health Insurance Program (CHIP)
Percentage Distribution of 2020 Survey Respondents by State
AK 0.0%
ME 0.0%
VT 0.0%
NH 0.0%
WA 0.0%
ID 0.0%
MT 0.0%
ND 0.0%
MN 0.0%
IL 0.0%
WI 5.5%
Ml 0.0%
NY 0.0%
RI 0.0%
MA 0.0%
OR 0.0%
NV 0.0%
WY 0.0%
SD 3.7%
IA 0.0%
IN 0.0%
OH 0.0%
PA 10.3%
NJ 5.3%
CT 6.7%
CA 0.0%
UT 0.0%
CO 12.5%
NE 4.3%
MO 3.6%
KY 7.4%
WV 0.0%
VA 6.1%
MD 0.0%
DE 0.8%
AZ 0.0%
NM 0.0%
KS 14.8%
AR 4.3%
TN 0.0%
NC 0.0%
SC 0.0%
DC 0.0%
HI 5.3%
OK 0.0%
LA 0.0%
MS 0.0%
AL 3.6%
GA 0.0%
TX 4.5%
FL 1.5%

CAHPS Health Plan Survey Database 2020 Chartbook: What Consumers Say About Their Experiences With Their Health Plans and Medical Care
19
CHIP 2020 Results
Composite Measure/Individual Item Never + Sometimes Usually Always
N Getting Needed Care for a Child 13% 25% 62% 8,763
Easy to get necessary care, tests, or treatment for child 8% 24% 69% 8,374
Got appointment for child with specialists as soon as needed 19% 26% 55% 2,647
Getting Care Quickly for a Child 8% 17%7 5%
8,624
Child got care for illness, injury, or condition as soon as needed 7% 12% 81% 3,655
Child got non-urgent appointment as soon as needed 10% 22% 68% 7,589
How Well the Child's Doctors Communicate 4% 15% 82% 7,523
Child's doctor explained things in a way that was easy to understand 3% 12% 84% 7,499
Child's doctor listened carefully to respondent 3% 12% 85% 7,492
Child's doctor showed respect for what respondent had to say 2% 10% 88% 7,484
Child's doctor explained things in a way that was easy for child to understand 4% 18%
78% 5,682
Child 's doctor spent enough time with child 6% 20% 74% 7,436
Health Plan Information and Customer Service 11% 22% 67% 2,941
Customer service at child's health plan gave necessary information or help 18% 26% 57% 2,917
Customer service staff at ch ild's health plan was courteous and respectful 5% 18% 76% 2,913
Composite Measure/Individual Item

CAHPS Health Plan Survey Database 2020 Chartbook: What Consumers Say About Their Experiences With Their Health Plans and Medical Care
20
CHIP 2020 Results (continued)
Rating 0-6 7-8 9-10
N Overall Rating of Child's Personal Doctor 5% 18% 78% 10,387
Overall Rating of Child's Specialist 6% 19% 74% 2,447
Overall Rating of Child's Health Care 5% 23% 72% 8,409
Overall Rating of Child's Health Plan 7% 23% 70% 11,869

CAHPS Health Plan Survey Database 2020 Chartbook: What Consumers Say About Their Experiences With Their Health Plans and Medical Care
21
CHIP Trends
Figure 5. CHIP Top-Box Composite Measure Scores 2011-2020
50%
55%
60%
65%
70%
75%
80%
85%
2011 2013 2014 2015 2016 2017 2018 2019 2020
How Well DoctorsCommunicate
Getting Care Quickly
Health Plan Informationand Customer Service
Getting Needed Care

CAHPS Health Plan Survey Database 2020 Chartbook: What Consumers Say About Their Experiences With Their Health Plans and Medical Care
22
CHIP Trends (continued)
Figure 6. CHIP Top-Box Rating Scores 2011-2020
55%
60%
65%
70%
75%
80%
2011 2013 2014 2015 2016 2017 2018 2019 2020
Rating ofPersonal Doctor
Rating ofSpecialist
Rating of HealthCare
Rating of HealthPlan
Table 4. CHIP Composition of the CAHPS Health Plan Survey Database 2011-2019 CHIP Medicaid Composition
measurement 2011 2013 2014 2015 2016 2017 2018 2019 2020
Number of Plans 41 12 15 19 21 23 25 48 42
Number of Respondents 26,232 9,149 11,762 13,466 14,999 15,221 13,933 18,090 12,448
Notes: (1) In 2011, the Database reported CHIP Medicaid version 4.0. (2) From 2013-2020, the Database reported CHIP Medicaid version 5.0.

CAHPS Health Plan Survey Database 2020 Chartbook: What Consumers Say About Their Experiences With Their Health Plans and Medical Care
23
APPENDIX A. 2020 SURVEY RESPONDENTS BY STATE Table A-1 shows data submissions to the CAHPS Health Plan Survey Database by State for 2020. The total number of respondents by state are presented by population.
Table A-1. 2020 Survey Respondents by State
State Adult
Medicaid Child
Medicaid CHIP
Alabama 362 543 446
Arizona 189 85 -
Arkansas - - 529
California 3,093 2,670 -
Colorado 482 469 1,554
Connecticut 314 790 829
Delaware 617 722 104 District Of Columbia 683 1,029 -
Florida 613 2,511 180
Georgia 301 676 -
Hawaii 2,961 175 656
Idaho - - -
Illinois 1,033 1,051 -
Indiana 1,078 1,064 -
Iowa - - -
Kansas 786 1,518 1,837
Kentucky 1,077 1,177 920
Louisiana 596 1,341 -
Maine - - -
Maryland 2,202 4,626 -
Massachusetts 1,291 719 -
Michigan 3,493 2,888 -
Minnesota 3,706 - -
Mississippi - - -
Missouri 497 297 450
Montana - - -
Nebraska 307 723 540
Nevada 124 - -
New Hampshire 358 690 -
New Jersey 944 879 663
New Mexico 233 608 -
New York 3,806 174 -
North Carolina - - -
Ohio 1,678 2,864 -
Oklahoma 395 325 -
Oregon 4,938 6,996 -

CAHPS Health Plan Survey Database 2020 Chartbook: What Consumers Say About Their Experiences With Their Health Plans and Medical Care
24
State Adult
Medicaid Child
Medicaid CHIP
Pennsylvania 4,942 2,745 1,277
Puerto Rico - - -
Rhode Island 892 813 -
South Carolina 877 1,945 -
South Dakota 470 369 459
Tennessee - - -
Texas - 1,659 563
Utah - 484 -
Vermont 435 316 -
Virginia 4,104 3,562 760
Washington 1,130 3,015 -
West Virginia - - -
Wisconsin 204 3,793 681
Total 51,211 56,311 12,448

CAHPS Health Plan Survey Database 2020 Chartbook: What Consumers Say About Their Experiences With Their Health Plans and Medical Care
25
APPENDIX B. DEFINITION OF COMPOSITE MEASURES, ITEMS, AND RATINGS The following tables present the composite measures, individual items and ratings for the 5.0 Adult Medicaid and Child versions of the CAHPS Health Plan Survey.
Table B-1. Adult Medicaid Composite Measures and Rating Items for 5.0 Version of CAHPS Health Plan Survey
Question Text Response Options Getting Needed Care In the last 6 months, how often did you get an appointment to see a specialist as soon as you needed? In the last 6 months, how often was it easy to get the care, tests, or treatment you needed?
Response Options • Never• Sometimes• Usually• Always
Getting Care Quickly In the last 6 months, when you needed care right away, how often did you get care as soon as you needed? In the last 6 months, how often did you get an appointment for a check-up or routine care at a doctor's office or clinic as soon as you needed?
Response Options • Never• Sometimes• Usually• Always
How Well Doctors Communicate In the last 6 months, how often did your personal doctor explain things in a way that was easy to understand? In the last 6 months, how often did your personal doctor listen carefully to you? In the last 6 months, how often did your personal doctor show respect for what you had to say? In the last 6 months, how often did your personal doctor spend enough time with you?
Response Options • Never• Sometimes• Usually• Always
Health Plan Information & Customer Service In the last 6 months, how often did your health plan’s customer service give you the information or help you needed? In the last 6 months, how often did your health plan’s customer service staff treat you with courtesy and respect?
Response Options • Never• Sometimes• Usually• Always
Overall Ratings Using any number from 0 to 10, where 0 is the worst health care possible and 10 is the best health care possible, what number would you use to rate all your health care in the last 6 months? Using any number from 0 to 10, where 0 is the worst personal doctor possible and 10 is the best personal doctor possible, what number would you use to rate your personal doctor? Using any number from 0 to 10, where 0 is the worst specialist possible and 10 is the best specialist possible, what number would you use to rate the specialist? Using any number from 0 to 10, where 0 is the worst health plan possible and 10 is the best health plan possible, what number would you use to rate your health plan?
Response Options • 0-10
CAHPS Health Plan Survey Database 2019 Chartbook: What Consumers Say About Their Experiences With Their Health Plans and Medical Care
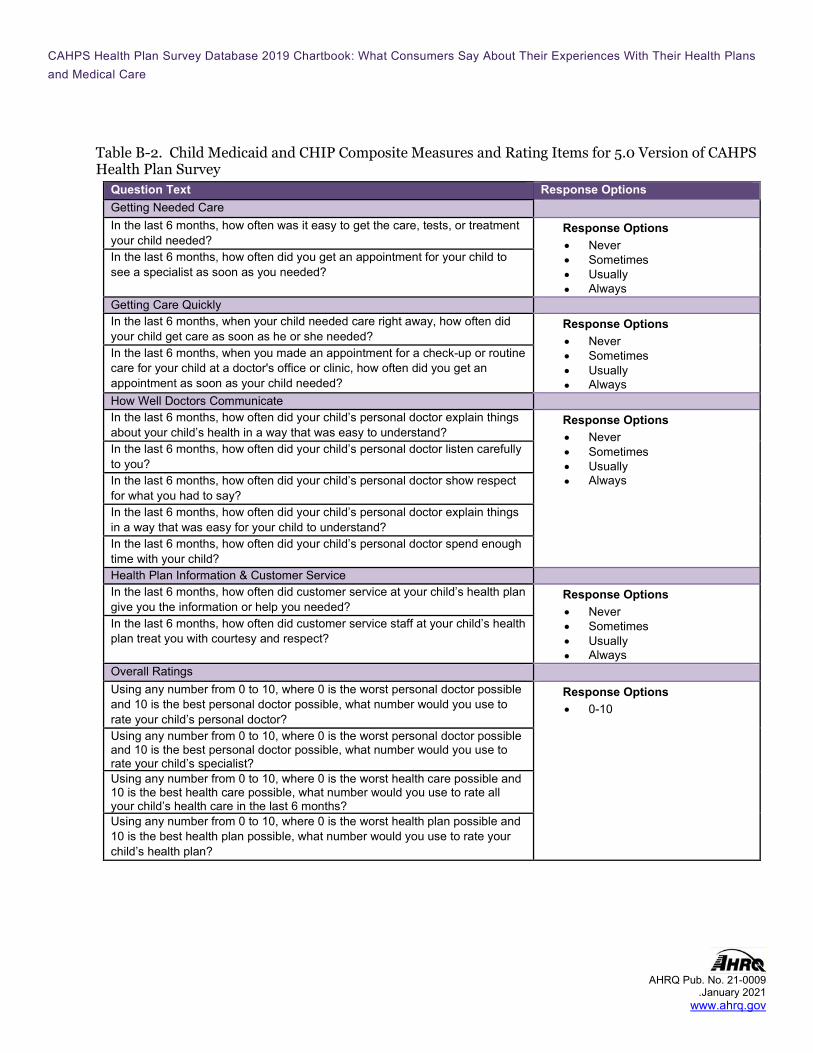
Table B-2. Child Medicaid and CHIP Composite Measures and Rating Items for 5.0 Version of CAHPS Health Plan Survey
Question Text Response Options Getting Needed Care In the last 6 months, how often was it easy to get the care, tests, or treatment your child needed? In the last 6 months, how often did you get an appointment for your child to see a specialist as soon as you needed?
Response Options • Never• Sometimes• Usually• Always
Getting Care Quickly In the last 6 months, when your child needed care right away, how often did your child get care as soon as he or she needed? In the last 6 months, when you made an appointment for a check-up or routine care for your child at a doctor's office or clinic, how often did you get an appointment as soon as your child needed?
Response Options • Never• Sometimes• Usually• Always
How Well Doctors Communicate In the last 6 months, how often did your child’s personal doctor explain things about your child’s health in a way that was easy to understand? In the last 6 months, how often did your child’s personal doctor listen carefully to you? In the last 6 months, how often did your child’s personal doctor show respect for what you had to say? In the last 6 months, how often did your child’s personal doctor explain things in a way that was easy for your child to understand? In the last 6 months, how often did your child’s personal doctor spend enough time with your child?
Response Options • Never• Sometimes• Usually• Always
Health Plan Information & Customer Service In the last 6 months, how often did customer service at your child’s health plan give you the information or help you needed? In the last 6 months, how often did customer service staff at your child’s health plan treat you with courtesy and respect?
Response Options • Never• Sometimes• Usually• Always
Overall Ratings Using any number from 0 to 10, where 0 is the worst personal doctor possible and 10 is the best personal doctor possible, what number would you use to rate your child’s personal doctor? Using any number from 0 to 10, where 0 is the worst personal doctor possible and 10 is the best personal doctor possible, what number would you use to rate your child’s specialist? Using any number from 0 to 10, where 0 is the worst health care possible and 10 is the best health care possible, what number would you use to rate all your child’s health care in the last 6 months? Using any number from 0 to 10, where 0 is the worst health plan possible and 10 is the best health plan possible, what number would you use to rate your child’s health plan?
Response Options • 0-10
AHRQ Pub. No. 21-0009 .January 2021
www.ahrq.gov