2020 county fiscal strategy paper - kilifi.go.ke
TRANSCRIPT

REPUBLIC OF KENYA
COUNTY GOVERNMENT OF KILIFI
THE COUNTY TREASURY
2020 COUNTY FISCAL STRATEGY PAPER
SUSTAINABLE PEOPLE-FOCUSED TRANSFORMATIVE AGENDA FOR
WEALTH CREATION
March 11, 2020

2020 Kilifi County Fiscal Strategy Paper Page 2 of 44
© County Government of Kilifi
This 2020 County Fiscal Strategy Paper (CFSP) has been compiled using latest
information, some of which is unaudited or subject to revision.
To obtain copies of the document, please contact:
The County Treasury
P. O. Box 519
KILIFI, KENYA
The document is also available on the website at: www.kilifi.go.ke

2020 Kilifi County Fiscal Strategy Paper Page 3 of 44
Table of Contents
CHAPTER 1: INTRODUCTION .............................................................................................................. 4
Overview .................................................................................................................................................. 4
Structure of the County Fiscal Strategy Paper ................................................................................... 5
CHAPTER 2: SUSTAINABLE PEOPLE-FOCUSSED TRANSFORMATIVE AGENDA FOR WEALTH
CREATION .......................................................................................................................... 7
Overview .................................................................................................................................................. 7
Ensuring food self-sufficiency for all residents ................................................................................... 9
Progressive provision of safe water for all residents ....................................................................... 12
Promoting good performance and quality education ...................................................................... 15
Ensuring accessible, equitable and quality healthcare services .................................................... 19
Securing beneficial use of land, other natural resources and built environment ........................ 21
Developing competitive connectivity and transport infrastructure................................................ 23
Empowering community and cushioning vulnerable groups .......................................................... 24
CHAPTER 3: RECENT ECONOMIC DEVELOPMENTS AND MEDIUM-TERM OUTLOOK OVERVIEW
......................................................................................................................................... 25
Overview ................................................................................................................................................ 25
Global and regional economic developments ................................................................................... 25
Domestic Economic Developments .................................................................................................... 27
Economic Outlook ................................................................................................................................. 31
County’s Fiscal Outlook ........................................................................................................................ 34
CHAPTER 4: FISCAL POLICY AND BUDGET FRAMEWORK ............................................................ 37
Prudent Fiscal Policy ............................................................................................................................. 37
Observing Fiscal Responsibility Principles ......................................................................................... 37
Fiscal Structural Reforms ..................................................................................................................... 38
FY 2020/21 Budget Framework .......................................................................................................... 38
Indicative Budget Ceilings for the FY 2020/2021 Budget ............................................................... 42
CONCLUSION ............................................................................................................................................ 44

2020 Kilifi County Fiscal Strategy Paper Page 4 of 44
CHAPTER 1: INTRODUCTION
Overview
1. The County Fiscal Strategy Paper (CFSP) sets out the broad strategic priorities and
policy goals to guide the county government in preparing the budget for the coming
financial year and the medium term. This foster understanding of the county’s public
finance management and sharpens the discourse on economic and development issues
in the County. Comprehensively, the CFSP is viewed from its adherence to the statutory
timelines, alignment to the national objectives in the Budget Policy Statement, fitness of
the specified broad strategic priorities and policy goals to the financial, economic and
development trajectory of the County, correspondence of the financial outlook in terms
of revenues and expenditure allocation with the priorities identified and incorporation to
the CFSP of the views sought from, among others, the Commission on Revenue Allocation
(CRA), the public, any other interested persons or groups and the County Budget and
Economic Forum (CBEF).
2. This 2020 CFSP is prepared with practical consideration and adherence to these
requirements which are provided in Section 117 of the Public Finance Management Act,
2012 that;
(i) The County Treasury shall prepare and submit to the County Executive
Committee the County Fiscal Strategy Paper for approval and the County
Treasury shall submit the approved Fiscal Strategy Paper to the county
assembly, by the 28th February 2020.
(ii) The County Treasury shall align its County Fiscal Strategy Paper with the
national objectives in the 2020 Budget Policy Statement.
(iii) In preparing the County Fiscal Strategy Paper, the County Treasury shall
specify the broad strategic priorities and policy goals that will guide the
county government in preparing its budget for the FY2020/21-FY2022/23.

2020 Kilifi County Fiscal Strategy Paper Page 5 of 44
(iv) The County Treasury shall include in the 2020 CFSP the financial outlook
with respect to county government revenues, expenditures and borrowing
for the FY2020/21-FY2022/23.
(v) In preparing the County Fiscal Strategy Paper, the County Treasury shall
seek and take into account the views of —
a. the Commission on Revenue Allocation;
b. the public;
c. any interested persons or groups; and
d. any other forum that is established by legislation.
(vi) Not later than fourteen days after submitting the County Fiscal Strategy
Paper to the county assembly, the county assembly shall consider and may
adopt it with or without amendments.
(vii) The County Treasury shall consider any recommendations made by the
county assembly when finalising the budget proposal for the financial year
concerned.
(viii) The County Treasury shall publish and publicise the 2020 CFSP within seven
days after it has been submitted to the county assembly.
Structure of the County Fiscal Strategy Paper
3. In response to these statutory requirements, the 2020 CFSP is structured in a way
that this introductory chapter asserts the relevance of the CFSP by providing an overview
and statutory underpinnings that guide preparation and review of the paper. The broad
strategic priorities and policy goals under the theme “Sustainable People-Focused
Transformative Agenda for Wealth Creation” that inform FY2020/21-FY2022/23 budget
are specified in chapter two. The macro-economic and financial performances and
forecasts are presented in chapter three to contextualize what it will take to realize the
specified priorities. This is followed, in chapter four, by how well the county complied

2020 Kilifi County Fiscal Strategy Paper Page 6 of 44
with principles of public finance and fiscal responsibility principles as it set the budget
framework for FY2020/21-FY2022/23.

2020 Kilifi County Fiscal Strategy Paper Page 7 of 44
CHAPTER 2: SUSTAINABLE PEOPLE-FOCUSSED TRANSFORMATIVE
AGENDA FOR WEALTH CREATION
Overview
4. The 2020 CFSP is premised on the people-focused transformative agenda initiated
two previous financial years through the implementation of the County Integrated
Development Plan (CIDP) 2018-2022. This agenda extends to the County the
achievement of the economic and social pillars of Kenya Vision 2030 which are prioritized
in the Third Medium Term Plan (MTP III) 2018-2022 which seeks to transform lives by
advancing socio-economic development through the “Big Four” Plan. The implementation
of the “Big Four” Plan is set to be accelerated in the 2020 Budget Policy Statement,
through:
(i) Supporting value addition and raising the share of manufacturing sector to
GDP
(ii) Enhancing food and nutrition security to all Kenyans
(iii) Providing universal health coverage to guarantee quality and affordable
healthcare to all Kenyans
(iv) Provision of affordable and decent housing for all Kenyans
5. The above explanation serves to demonstrate that the alignment of the 2020 CFSP
to the 2020 BPS is integral but the County goes ahead to pull out specific policies and
programmes in the 2020 BPS that relate directly to the County’s policy goals, which are:
(i) Ensuring food self-sufficiency,
(ii) Progressively providing safe water,
(iii) Promoting good performance and quality education,
(iv) Ensuring accessible, equitable and quality healthcare services,
(v) Securing beneficial use of land, other natural resources and built
environment,

2020 Kilifi County Fiscal Strategy Paper Page 8 of 44
(vi) Developing competitive connectivity infrastructure, and
(vii) Empowering the community and cushioning vulnerable groups
6. The County’s fiscal stance in the implementation of the people-focused
transformative agenda is operationalizing all complete but not functional projects and
completing and operationalizing on-going or stalled projects before new ones are started.
This fiscal stance is consistent with the presidential directive of July 2018 to freeze new
government projects until on-going projects are completed to avoid wastage of resources
by abandoning incomplete projects and jumping onto others. With regard, to human
capital and other operational cost plans, the County prioritized recruitment of critical staff
such as medical staff for health facilities and caregivers for Early Childhood Education
Centers (ECDEs) and provided essential supplies such as medical drugs and learning
material to facilitate provision of services to residents.
7. The trade-off to this fiscal stance has been deferring implementation of new
projects which were planned and budgeted for and could not take off within their
respective financial year on account of delays in identifying contractors and service
providers or issues related to where they will be located. This has not escaped discontent
from political elites who have been eager, or otherwise, to be associated with these
projects and the public for testing their patience to reap the benefits of these projects
and devolution in general. In light of this discontent, this 2020 CFSP prioritizes the
deferred projects for implementation subject to fresh appraisals being conducted to
determine their viability.
8. In recognition that the county government does not have adequate funds to
undertake the programmes and projects to achieve earmarked results for 2020 and
beyond in the CIDP 2018-2022, this 2020 CFSP prioritizes building of partnerships
between the county government, the private sector and non-governmental organizations
to leverage on their motives for existence in a way that contributes to the policy goals
and creates wealth for the County.

2020 Kilifi County Fiscal Strategy Paper Page 9 of 44
9. The fiscal stance, its discontent and efforts to build partnerships provide the
context for specifying the broad strategic priorities to realize the County’s policy goals as
detailed in the sections that follow.
Ensuring food self-sufficiency for all residents
10. The county government’s position that food self-sufficiency is a useful strategy to
food security and nutrition places the County within the ambit of the “Big Four” Plan. That
food self-sufficiency, which means meeting the consumption needs of staple food crop
from own production rather than buying, is a necessary condition for achieving food
security has been affirmed in the 2020 BPS overall strategy to reduce food insecure
Kenyans by expanding large scale production of staples among other strategies. Kenya
National Bureau of Statistics (KNBS) reported in the first publication of Gross County
Product (GCP) in 2019 that Kilifi’s share contribution to the Gross Domestic Product (GDP)
from agriculture, forestry and fisheries was rivaled by Kwale County among the coastal
counties. This shows that agriculture remains the key driver of growth in the County and
therefore the need to direct more funds towards agriculture to enhance economic activity.
11. Thus, the county government will continue to deepen strategies towards
expanding irrigation schemes, increasing access to agricultural inputs, extending credit
facilities to farmers through the ‘Mbegu Fund’, promoting use of appropriate farming
techniques, upgrading of livestock breeds, increasing fisheries production and promote
the uptake of agricultural research and development findings and recommendations to
boost household’s involvement in agrarian production to attain food self-sufficiency and
increase household’s incomes. The County will encourage intensified production to
leverage of households’ mixed farming practice as depicted in the table below.

2020 Kilifi County Fiscal Strategy Paper Page 10 of 44
Table 2.1: Household Practice in Farming, Crop production, livestock production, aquaculture, fishing and irrigation
Description/ Households'
Practice
Total Farming Crop Production
Livestock Production
Aquaculture Fishing Irrigation
County 298,472 161,188 149,334 101,983 366 6,393 5,643
Chonyi 11,421 10,025 9,838 5,153 14 30 68
Ganze 23,258 20,578 19,306 15,777 41 158 442
Kaloleni 36,355 22,504 21,295 14,519 34 54 254
Kauma 3,479 2,867 2,738 1,939 10 60 54
Kilifi North 39,512 18,690 17,085 12,011 30 1,021 386
Kilifi South 53,074 15,114 13,485 8,570 72 878 466
Magarini 33,017 25,989 24,929 15,959 75 1,884 856
Malindi 73,547 31,072 27,424 19,363 63 2,176 2,942
Rabai 24,809 14,349 13,234 8,692 27 132 175
Source: 2019 Kenya Population and Housing Census Vol. IV
12. The county government prepared and adopted a crop production master plan that
seeks to incentivize farmers to increase acreage under cultivation for increased
production of staples, promote crop diversification and production of cash crops to boost
farmer’s income. Under this master plan, the County continues to organize farmers into
cooperatives or groups in the provision of agricultural support services to increase
adoption of technological traits that improve production and productivity. As such, the
use of certified seeds and fertilizers which is known to increase crop yields, enhance
disease tolerance and drought resistance will continue to be promoted through provision
of certified seeds and fertilizers to small holder farmers who are organized in cooperatives
or groups. The organization of farmers into cooperatives or groups will also improve the
reach of extension services to production units which are relied upon by farmers in the
management of farms, handling of harvest, value-addition and marketing. The private
sector will find farmers’ cooperatives or groups as providing useful linkages, both
backward and forward, for commercialization of agricultural input or output. Agro-
processors will be encouraged to enter contract farming with farmers’ cooperatives or
groups thereby improve crop price through collective bargaining while they harness
economies of scale in crop production.

2020 Kilifi County Fiscal Strategy Paper Page 11 of 44
13. Irrigated farming will be promoted in the County by encouraging small holder
farmers to train and adopt modern irrigation techniques that are suitable for the small
land parcels and are cost effective.
14. On livestock production, the county government opens to private sector
involvement in the establishment of a tannery for value-addition on hides and skins
considering improved inspection of hides and skins for quality control and assurance. The
county government will also continue with the programme of upgrading livestock breeds,
make advancements in establishing livestock disease free zones and strategic feed
reserves to improve availability of fodder in arid and semi-arid areas of the County during
dry periods and even drought. In regard to dairy farming, the County will continue to
capacity build the households on appropriate farming techniques by promoting upgrading
to exotic breeds and reducing milk losses using milk coolers that will be availed to every
ward on a need basis in partnership with the national government. The County recorded
4,905 households rearing exotic dairy cattle during the 2019 Kenya Population and
Housing Census. This is expected to increase with the County’s programme of providing
dairy cattle to groups. Over the medium term, the County is pursuing private sector
involvement with a view to setting up a dairy factory which will create employment to the
youth as well as increase farmers’ income.
15. Fish still finds place on the plate of residents of Kilifi because of divisibility of big
fish into portions and availability of smaller fish that are affordable and can be stretched
to feed more people than the smallest units of, say, beef or chicken. Thus, the County
prioritizes increasing fish production for self-sufficiency as well as food security and
nutrition. This priority is pursued through providing advanced infrastructure in fishing,
enhancing value addition of fish and fish products, development of new products like crab
harvesting and exploitation of byproducts that can be used to produce energy thereby
reducing household’s cost of acquiring energy. The 2020 BPS report that fish production
has more than doubled only six months into the operations of the Kenya Coast Guard
Service at the Liwatoni Fishing Complex spells good tidings for the County’s fisherfolk.
This is coupled with the fish landing sites at Kichwa cha Kati and Ngomeni and the fish

2020 Kilifi County Fiscal Strategy Paper Page 12 of 44
market in Malindi that are being constructed by the national government. To deepen
these initiatives by the national government, the county government is constructing a
boat building factory which will produce tailor made boats of fiber boards for use by local
fishermen and is increasing the number of bigger vessels in order to enhance continuation
of fish harvesting during rainy and windy seasons which is not possible when using small
fishing vessels. To further augment these efforts, the county government has been
restocking fishponds with fish brooders and fingerlings in order to promote culture fish
harvest which is slowly gaining traction apart from the County’s proximity to the Indian
Ocean. The County also prides in the set-up of the first crab hatchery out grower farm at
Che Shalle near Ngomeni, which will be probably one of the largest blue economy projects
in East Africa. Currently the project is at an advanced stage and is set to create jobs for
thousands of residents in the County.
Progressive provision of safe water for all residents
16. Progressive provision of safe water that is accessible to all residents in adequate
quantity and quality at an affordable price brings home the achievement of the social
pillar in Kenya Vision 2030 as prioritized under the Environment, Water, Sanitation and
Regional Development Sector in MTP III. This linkage of the County’s policy goals with
the MTP III signify alignment of the 2020 CFSP to the 2020 BPS that accelerates
implementation of the “Big Four” Plan. The pursuit of this policy goal is also informed by
the frequency of severe water scarcity especially during prolonged dry spells in the
County. Propounding the need for the pursuit of this policy goal is rapid population growth
with above national average population density of 116 persons per square kilometer
against 82 nationally as reported in the 2019 Kenya Population and Housing Census. This
tends to overstretch access to adequate quantities of piped water whose supply is
relatively skewed to areas with dense water infrastructure network especially rapidly
urbanizing areas and major tourist destinations in the County.
2020 Kilifi County Fiscal Strategy Paper Page 13 of 44
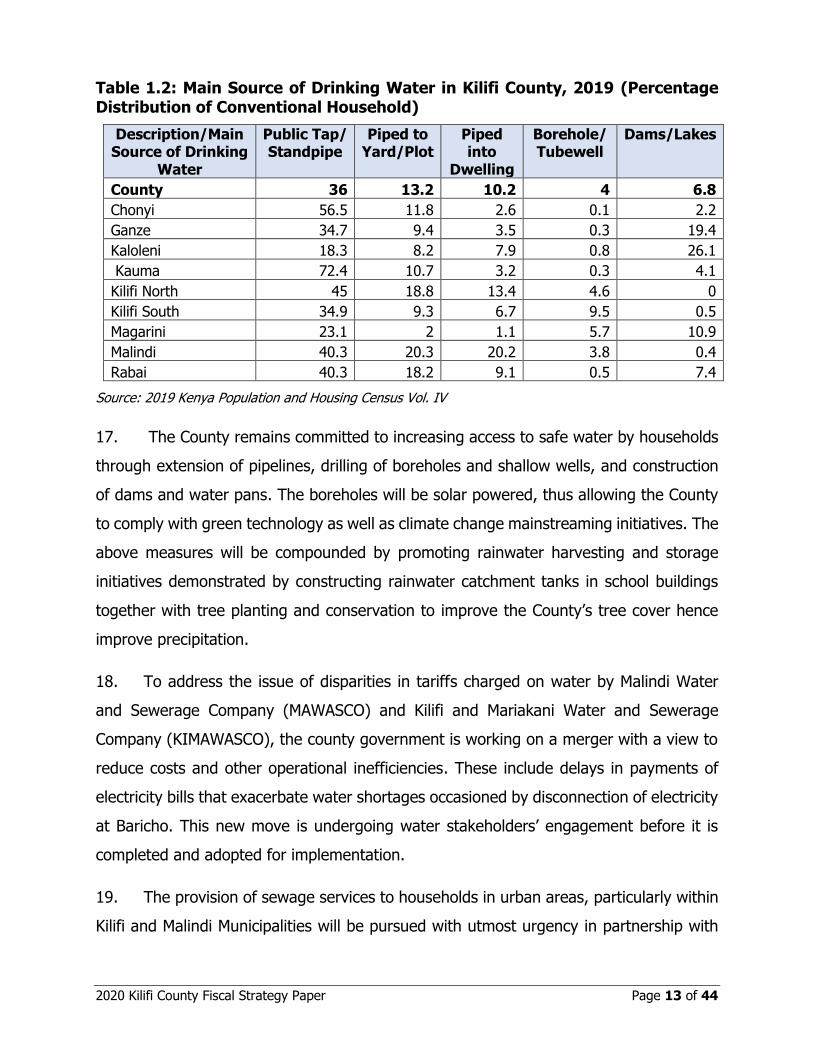
Table 1.2: Main Source of Drinking Water in Kilifi County, 2019 (Percentage Distribution of Conventional Household)
Description/Main Source of Drinking
Water
Public Tap/ Standpipe
Piped to Yard/Plot
Piped into
Dwelling
Borehole/ Tubewell
Dams/Lakes
County 36 13.2 10.2 4 6.8
Chonyi 56.5 11.8 2.6 0.1 2.2
Ganze 34.7 9.4 3.5 0.3 19.4
Kaloleni 18.3 8.2 7.9 0.8 26.1
Kauma 72.4 10.7 3.2 0.3 4.1
Kilifi North 45 18.8 13.4 4.6 0
Kilifi South 34.9 9.3 6.7 9.5 0.5
Magarini 23.1 2 1.1 5.7 10.9
Malindi 40.3 20.3 20.2 3.8 0.4
Rabai 40.3 18.2 9.1 0.5 7.4
Source: 2019 Kenya Population and Housing Census Vol. IV
17. The County remains committed to increasing access to safe water by households
through extension of pipelines, drilling of boreholes and shallow wells, and construction
of dams and water pans. The boreholes will be solar powered, thus allowing the County
to comply with green technology as well as climate change mainstreaming initiatives. The
above measures will be compounded by promoting rainwater harvesting and storage
initiatives demonstrated by constructing rainwater catchment tanks in school buildings
together with tree planting and conservation to improve the County’s tree cover hence
improve precipitation.
18. To address the issue of disparities in tariffs charged on water by Malindi Water
and Sewerage Company (MAWASCO) and Kilifi and Mariakani Water and Sewerage
Company (KIMAWASCO), the county government is working on a merger with a view to
reduce costs and other operational inefficiencies. These include delays in payments of
electricity bills that exacerbate water shortages occasioned by disconnection of electricity
at Baricho. This new move is undergoing water stakeholders’ engagement before it is
completed and adopted for implementation.
19. The provision of sewage services to households in urban areas, particularly within
Kilifi and Malindi Municipalities will be pursued with utmost urgency in partnership with

2020 Kilifi County Fiscal Strategy Paper Page 14 of 44
the private sector to forestall continued contamination of underground water with
Escheriria coli which originates from human and animal waste. On-site management of
effluent allows recycling and reuse of water, removal of pharmaceuticals and pathogens,
as well as protecting existing water sources such as boreholes, shallow wells, dams and
water pans which provide the only realistic water supply option for meeting dispersed
rural demand. The decency is sanitation services will also be extended to the by
promoting adoption of ‘a toilet per home’ strategy, thus preventing the spread of water
borne diseases by improving the mode of human waste disposal in the County.
Table 2.3: Mode of Human Waste Disposal in the County, (Percentage Distribution by Households)
Description/Mode of Human waste Disposal
Septic Tank
Pit Latrine Covered
Open/Bush Main Sewer
County Level 18.7 40.1 17.0 2.4
Chonyi 0.9 74.3 6.1 0.1
Ganze 2.6 36.3 44.5 0.1
Kaloleni 13.6 53.6 12.2 2.4
Kauma 1.1 39.1 42.2 0.1
Kilifi North 23.2 41.6 9.8 2.3
Kilifi South 20.9 46.8 4.5 2.4
Magarini 6.3 27.9 43.6 0.9
Malindi 34.0 23.6 15.7 4.4
Rabai 11.5 55.9 5.8 1.9
Source: 2019 Kenya Population and Housing Census Vol. IV
20. Solid waste management for municipalities and upcoming towns remains a major
priority for a sustainable clean environment in the County. As such, the measures to allow
for a sustainable approach of dealing with waste products pre and post disposal and
collection entail comprehensive awareness programs on waste segregation across the
County to allow for categorization of the waste, for easy recycling. The County will also
capacity build women and youth groups involved in waste collection and disposal to do
so sustainably in a bid to conserve the environment while providing employment
opportunities for wealth creation.
2020 Kilifi County Fiscal Strategy Paper Page 15 of 44
Promoting good performance and quality education
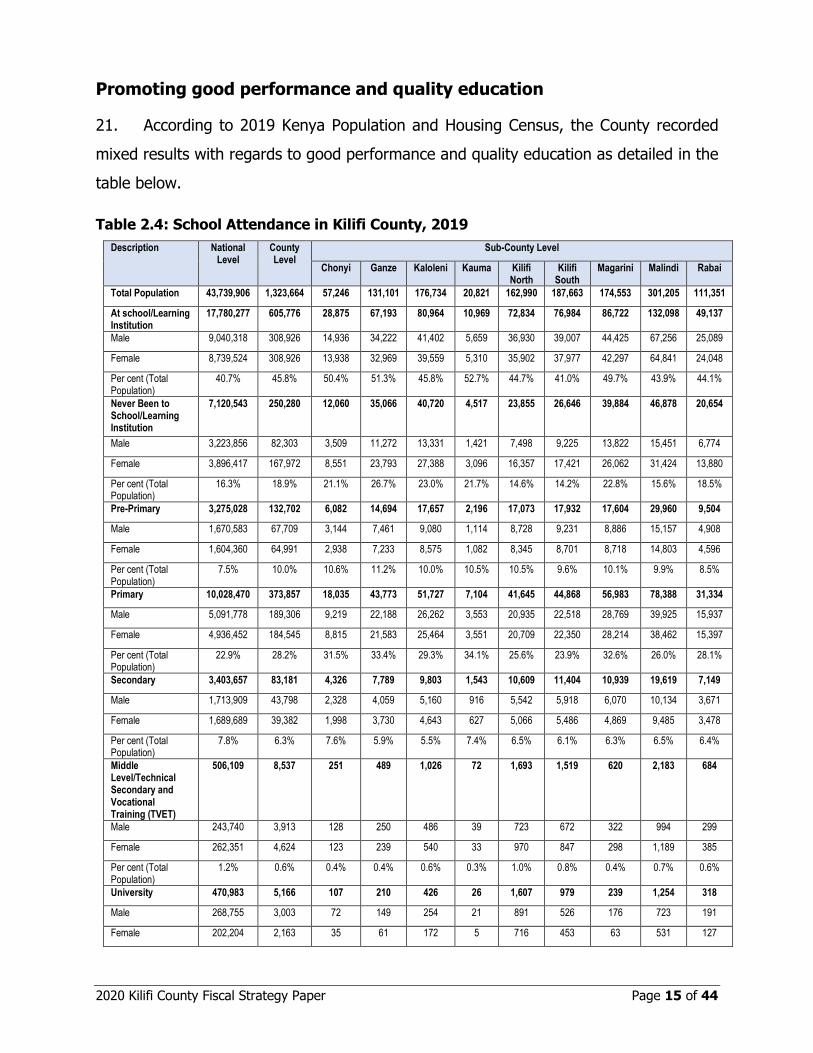
21. According to 2019 Kenya Population and Housing Census, the County recorded
mixed results with regards to good performance and quality education as detailed in the
table below.
Table 2.4: School Attendance in Kilifi County, 2019
Description National Level
County Level
Sub-County Level
Chonyi Ganze Kaloleni Kauma Kilifi North
Kilifi South
Magarini Malindi Rabai
Total Population 43,739,906 1,323,664 57,246 131,101 176,734 20,821 162,990 187,663 174,553 301,205 111,351
At school/Learning Institution
17,780,277 605,776 28,875 67,193 80,964 10,969 72,834 76,984 86,722 132,098 49,137
Male 9,040,318 308,926 14,936 34,222 41,402 5,659 36,930 39,007 44,425 67,256 25,089
Female 8,739,524 308,926 13,938 32,969 39,559 5,310 35,902 37,977 42,297 64,841 24,048
Per cent (Total Population)
40.7% 45.8% 50.4% 51.3% 45.8% 52.7% 44.7% 41.0% 49.7% 43.9% 44.1%
Never Been to School/Learning Institution
7,120,543 250,280 12,060 35,066 40,720 4,517 23,855 26,646 39,884 46,878 20,654
Male 3,223,856 82,303 3,509 11,272 13,331 1,421 7,498 9,225 13,822 15,451 6,774
Female 3,896,417 167,972 8,551 23,793 27,388 3,096 16,357 17,421 26,062 31,424 13,880
Per cent (Total Population)
16.3% 18.9% 21.1% 26.7% 23.0% 21.7% 14.6% 14.2% 22.8% 15.6% 18.5%
Pre-Primary 3,275,028 132,702 6,082 14,694 17,657 2,196 17,073 17,932 17,604 29,960 9,504
Male 1,670,583 67,709 3,144 7,461 9,080 1,114 8,728 9,231 8,886 15,157 4,908
Female 1,604,360 64,991 2,938 7,233 8,575 1,082 8,345 8,701 8,718 14,803 4,596
Per cent (Total Population)
7.5% 10.0% 10.6% 11.2% 10.0% 10.5% 10.5% 9.6% 10.1% 9.9% 8.5%
Primary 10,028,470 373,857 18,035 43,773 51,727 7,104 41,645 44,868 56,983 78,388 31,334
Male 5,091,778 189,306 9,219 22,188 26,262 3,553 20,935 22,518 28,769 39,925 15,937
Female 4,936,452 184,545 8,815 21,583 25,464 3,551 20,709 22,350 28,214 38,462 15,397
Per cent (Total Population)
22.9% 28.2% 31.5% 33.4% 29.3% 34.1% 25.6% 23.9% 32.6% 26.0% 28.1%
Secondary 3,403,657 83,181 4,326 7,789 9,803 1,543 10,609 11,404 10,939 19,619 7,149
Male 1,713,909 43,798 2,328 4,059 5,160 916 5,542 5,918 6,070 10,134 3,671
Female 1,689,689 39,382 1,998 3,730 4,643 627 5,066 5,486 4,869 9,485 3,478
Per cent (Total Population)
7.8% 6.3% 7.6% 5.9% 5.5% 7.4% 6.5% 6.1% 6.3% 6.5% 6.4%
Middle Level/Technical Secondary and Vocational Training (TVET)
506,109 8,537 251 489 1,026 72 1,693 1,519 620 2,183 684
Male 243,740 3,913 128 250 486 39 723 672 322 994 299
Female 262,351 4,624 123 239 540 33 970 847 298 1,189 385
Per cent (Total Population)
1.2% 0.6% 0.4% 0.4% 0.6% 0.3% 1.0% 0.8% 0.4% 0.7% 0.6%
University 470,983 5,166 107 210 426 26 1,607 979 239 1,254 318
Male 268,755 3,003 72 149 254 21 891 526 176 723 191
Female 202,204 2,163 35 61 172 5 716 453 63 531 127

2020 Kilifi County Fiscal Strategy Paper Page 16 of 44
Source: 2019 Kenya Population and Housing Census Vol. IV
22. The County’s population that is at school/learning institution is above the national
level at 45.8 percent against 40.7 percent. This impressive indicator is dimmed by that of
the population that has never been to school/learning institution which is 18.9 percent
against 16.3 percent at the national level. However, on account of devolving pre-primary
education, the County has 10.0 percent of the population attending pre-primary education
which is above 7.5 percent nationally. In addition, the County has extended financial
support to secondary school learners towards seamless transition from primary to
secondary school which has contributed towards having 6.3 percent of the County’s
population in secondary school much as more needs to be done, especially in Ganze and
Kaloleni sub-counties.
23. Significant milestones have been registered which include employment of 989 ECD
caregivers, construction of 777 ECD classrooms and the ECD Teacher Training College at
Fumbini. It is expected that these measures will improve the physical and academic
environments thereby contribute to improved enrolment for the ECD population cohort
which lags the other population cohorts knowing that they have to be at school/learning
institution as shown below.
Table 2.5: School Attendance by Age and Sex in the County, 2019
County's Population (2019) At School/Learning Institution Per Cent (Total at
school/Learning Institution)
Special Age Groups
Total Male Female Total Male Female
Population 1,323,664 636,891 686,754 605,776 308,926 296,841 45.8%
3-5 126,430 63,506 62,923 74,467 36,629 37,837 58.9%
4-5 85,491 43,101 42,389 62,064 30,760 31,303 72.6%
6-13 328,848 164,769 164,072 311,570 155,860 155,705 94.7%
14-17 144,986 73,000 71,983 133,019 67,451 65,565 91.7%
18-22 146,905 71,639 75,263 68,786 38,854 29,932 46.8%
23+ 576,479 263,973 312,502 17,934 10,132 7,802 3.1%
Source: 2019 Kenya Population and Housing Census Vol. IV
Per cent (Total Population)
1.1% 0.4% 0.2% 0.2% 0.2% 0.1% 1.0% 0.5% 0.1% 0.4% 0.3%

2020 Kilifi County Fiscal Strategy Paper Page 17 of 44
24. To further improve physical environment at ECDE centers, the county government
will also engage stakeholders for partnership in infrastructure development, provision of
teaching/learning material, and teachers’ training on new curriculum.
25. The Kilifi County government has taken a giant step towards eradicating illiteracy
in the County by partnering with the United Kingdom (UK) not-for-profit organization –
Universal Learning Solutions – and educational publisher – Jolly Learning Ltd – to train
government school teachers in the fast-track English literacy method – Jolly Phonics. With
Jolly Phonics the pupils are first taught the 42 letter sounds of English at a fast pace. At
the same time, they are taught how to ‘blend’ those sounds together to read and write
words by segmenting the words into its sounds, and correctly form the letters for those
sounds. Following a successful pilot project in 2017 and 2018, which saw pupils reading
ages increasing by up to two years and two months in comparison to nine months in
control schools, the project has now been rolled out to all public pre-primary schools in
Kilifi County and has seen similarly spectacular results. These results highlight the
significant potential for Jolly Phonics to transform literacy levels in Kenya and place Kilifi
County at the very forefront of the fight against illiteracy, not only in Kenya but across
East Africa.
26. On technical and Vocational Training Centers (VTCs); a total of 96 classrooms
(VTCs) have been constructed while 21 of them are still ongoing and tools and equipment
provided. Renovations for 4 Youth Polytechnics were done to completion. Boards of
Governors were established and 33 instructors employed on permanent and pensionable
terms in all the public VTCs.
27. The County records a high school dropout rate, underperformance of candidates
at the end of secondary and primary school education as well as graduates that are ill
equipped for the job market or self-employment. However, vocational and technical
training institutions in the County are inadequate and lack the essential facilities and
technology to prepare trainees for the challenging market demands. The County
government will therefore ensure that adequate resources are given to these institutions
to enable the young people acquire relevant skills. Blue Economy trade lines as well as

2020 Kilifi County Fiscal Strategy Paper Page 18 of 44
cottage skills will be part of the diversified programs rolled out at the VTCs. In addition
to this, the County aims to partner the modern community colleges in Kenya with local
industries to ensure skill utilization post-graduation through job opportunities and or seed
capital.
28. With regards to youth talent search, the County government will develop Talent
Search Academies which will provide youth with the opportunity to discover their talents.
29. To enhance the capacity of the Ward Scholarship Fund to administer loans to
university and college students, the Fund will partner with Higher Education Loans Board
(HELB) to make the County Scholarship Fund a revolving fund as the beneficiaries will be
mandated to repay the monies upon graduation. The Ward Scholarship Fund remains the
most reliable tool and widely appreciated response offered by the County to relieve the
economic burden for education on households. The County Government coordinates the
process of applications, vetting of applicants, and identification of beneficiaries and
disbursement of funds in a manner that ensures utmost transparency.
30. In terms of sustainability in the education sector, the county will enhance the role
of education and learning for equitable, efficient and sustainable utilization of the county’s
resources. The county aims at promoting education through diverse learning and public
awareness for improved quality of life and productive livelihoods. The county will also
promote teaching and learning that inculcates appropriate values, behaviors and lifestyles
for good governance and sustainability.
31. The County will engage the private sector to maximize the potential for expanding
equitable access to schooling and for improving learning outcomes. Private involvement
in education can help to increase the level of financial resources committed to the sector
and supplement the limited capacity of government institutions to absorb growing
demand. There is also increasing evidence to suggest that the private sector is well
equipped to meet the growing differentiated demands of specific groups, for example,
religious ones – even when the county provides sufficient places in public schools and
universities.

2020 Kilifi County Fiscal Strategy Paper Page 19 of 44
Ensuring accessible, equitable and quality healthcare services
32. The county government remains committed to providing accessible, equitable and
quality health care services to the population of 1,453,787 underscoring its contribution
towards universal health coverage in the country. In terms of accessibility, the County
serves approximately 10,000 persons in every two (2) health facilities due to improvement
in the number of public health facilities consisting one (1) referral hospital, four (4) sub-
county hospitals, fifteen (15) health centers and one hundred twenty two (122)
dispensaries. Further, the County is completing one of the flagship projects; Kilifi County
Hospital Complex, which will significantly contribute to improved access to quality referral
and curative health services. On primary healthcare, the county government has 87
functional community units against a target of 309 community units is expected to serve
a population of 5,000.
33. On human resource, the County employed a total of 184 new health workers in
Financial Year 2018/19. Nurses made the highest number of new employees at 75%. The
total staffing during that financial year was 1377. The County has 110 doctors, 775
nurses, 22 pharmacists as well as 1945 community health workers, this gives a ratio of
doctor to patient at 1: 10,000 and that of nurse to patient at 5: 10,000. According to the
WHO, the recommended ratio of doctor to patient is 1: 1,000 and that of nurse to patient
is 83: 10,000 This shows that the health department does not meet the standard of
Universal Health Coverage. In this case more health workers should be employed.
34. A high-quality health service involves the right care, at the right time, responding
to the service users’ needs and preferences while minimizing harm and resource waste.
Offering high-quality health services also means linking financial reforms and
reorientation of delivery model to goals on quality care. The County Government role in
this is empowering residents to actively engage in care to optimize their health status
and informing their right to have access to care that meets achievable standards of
quality.
35. To ensure delivery of quality health care county government will:
(i) Promote provision of primary health care

2020 Kilifi County Fiscal Strategy Paper Page 20 of 44
(ii) Develop financing mechanism that support continuous quality improvements
Provision of Quality Primary Health Care
36. The Government of Kenya aims at attaining Universal Health Care; which
guarantees quality and affordable healthcare to all Kenyans as well as eliminates out of
pocket expenditure. The fourth schedule of the Constitution of Kenya list primary
healthcare provision as one of the devolved functions to County Governments. Primary
health care is a whole-of-society approach to health and well-being centered on the needs
and preferences of individuals, families and communities. Therefore, a strong primary
health care is essential in achieving the health-related Sustainable Development Goals
(SDGs) as well as universal health coverage. In achieving this, other goals beyond the
health goal (SDG3), including those on poverty, hunger, education, gender equality, clean
water and sanitation, work and economic growth, reducing inequality and climate action
are simultaneously achieved.
37. The County Government aims to improve and sustainably provide primary health
care by equipping the Level 1 health facilities with both non pharmaceuticals and
pharmaceutical requirements. To cater for human resource element, the County
Government will train and equip the Community Health Volunteers/Workers (CHVs) with
necessary information, skills and knowledge to handle infections and diseases in the
homes. This will have taken care of the preventive aspect of health care delivery.
38. This calls for a multisectoral collaboration and to this end, the County is deliberate
in attracting the private sector, government agencies as well as donor community in
harnessing the potential of the CHVs to deliver the basic health care services thus
reducing the congestion in health facilities.
Develop Financing Mechanism That Support Continuous Quality
Improvements
39. The County Government seeks to develop its health financing system to provide
financial protection and achieve Universal Health Coverage (UHC), in line with the national
government’s “Big Four” Plan. UHC is defined as the access to key promotive, preventive,
curative and rehabilitative health interventions of good quality at an affordable cost.

2020 Kilifi County Fiscal Strategy Paper Page 21 of 44
40. While health care financing remains a challenge, most of the population are
enrolled onto the NHIF program which is mostly insufficient to cater for the health needs
in case of hospitalization. There is thus an urgent need to model a health care financing
system that curbs the increasing out of pocket expenditures on patients.
41. By collaborating with the private sector and NGOs, households can be enrolled on
a localized insurance scheme for which they pay a premium every month. With this in
place, they can access treatment for free across the sub county health centers and allow
the smooth operationalization of the CHVs to take care of the less serious cases.
Securing beneficial use of land, other natural resources and built
environment
42. The county government is committed to securing beneficial use of land, other
natural resources and built environment in response to tenurial tensions emanating from
undesirable, often unintended, outcomes of land control and ownership policies, laws and
practices. These tensions often result to idle land parcels, underutilization of land and
mushrooming of informal settlements in the County. This happens amidst growing
demands on land due to its relevance in production when combined with capital and
labor. Of the 298,472 households in the County, 154,803 and 4,076 derive their
livelihoods on land-based activities that is, subsistence and commercial agriculture
respectively. Hence, the need to manage use of land in a way that avails the highest
utility to the residents forms the basis upon which the county government will pursue
land potential optimization through land use planning and resource mapping.
43. The County will continue upgrading informal settlements and where possible
mitigate their development by opening access roads on surveyed settlement schemes.
Measures will also be put in place to sustainable planning of urban areas and develop
them into engines for economic development. This includes continued investment in Kilifi
and Malindi Municipality which are now functional devolved entities and key drivers for
sustainable urbanization in line with the New Urban Agenda.

2020 Kilifi County Fiscal Strategy Paper Page 22 of 44
44. The county will also invest in promoting appropriate building technology and eco-
friendly building materials while ensuring energy efficiency and conservation in buildings.
The measures put in place aim to respond to the continued depletion of tree cover
especially coconut trees. Coconut palms are used for makuti thatching and constitute
20.0 percent of roofing material after iron sheets at 71.6 percent. There is a growing
concern that indiscriminate felling of coconut trees for raising roofing structure to lay iron
sheets or poles for raising walls is becoming unsustainable with only 15.9 percent of the
households growing coconut trees in the County. The depletion of tree cover is
compounded by the dominant use of firewood and charcoal fuel whose use stands at
58.2 percent and 21.9 percent of conventional household in the County respectively (see
figure below). Charcoal production was banned in 2017 to give room for rehabilitation of
forest and tree cover but the continued use of charcoal calls for measures to produce
charcoal more efficiently and effectively. Therefore, the county government will continue
investing in efficient wood-charcoal conversion technologies such as charcoal briquetting
kilns.
Figure 2.1: Type of Cooking Fuel (% of Conventional Households in the County, 2019)
Source: Kenya Population and Housing Census, 2019, Vol. IV
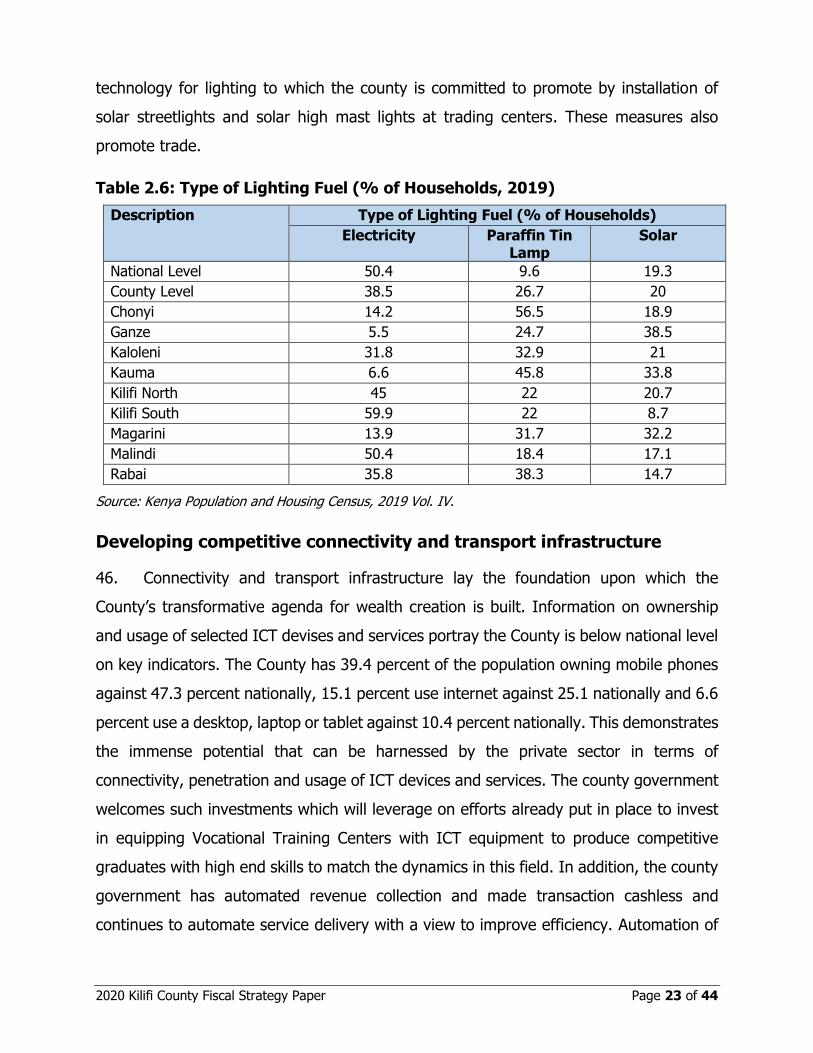
45. The County’s mains electricity use for lighting dominates at 38.5 percent of the
households followed by paraffin tin lamp at 26.7 percent and solar at 20.0 percent (see
table below). This indicates the potential for growth of adoption of renewable energy
58
.2
95
.9
91
.1
64
.6
94
.6
48
.9
38
.6
82
.2
43
.0
65
.5
21
.9
2.3 6
.8
21
.0
3.3
28
.2
17
.9
14
.1
35
.3
18
.6
0.5
0.1
0.1 0.3
0.1 0.4 0.7
0.3 0.8
0.4
C O U N T Y L E V E LC H O N Y I G A N Z E K A L O L E N I K A U M A K I L I F I N O R T HK I L I F I S O U T HM A G A R I N I M A L I N D I R A B A I
Type of Cooking Fuel (% of Households) Firewood Type of Cooking Fuel (% of Households) Charcoal
Type of Cooking Fuel (% of Households) Biogas
2020 Kilifi County Fiscal Strategy Paper Page 23 of 44
technology for lighting to which the county is committed to promote by installation of
solar streetlights and solar high mast lights at trading centers. These measures also
promote trade.
Table 2.6: Type of Lighting Fuel (% of Households, 2019)
Description Type of Lighting Fuel (% of Households)
Electricity Paraffin Tin Lamp
Solar
National Level 50.4 9.6 19.3
County Level 38.5 26.7 20
Chonyi 14.2 56.5 18.9
Ganze 5.5 24.7 38.5
Kaloleni 31.8 32.9 21
Kauma 6.6 45.8 33.8
Kilifi North 45 22 20.7
Kilifi South 59.9 22 8.7
Magarini 13.9 31.7 32.2
Malindi 50.4 18.4 17.1
Rabai 35.8 38.3 14.7
Source: Kenya Population and Housing Census, 2019 Vol. IV.
Developing competitive connectivity and transport infrastructure
46. Connectivity and transport infrastructure lay the foundation upon which the
County’s transformative agenda for wealth creation is built. Information on ownership
and usage of selected ICT devises and services portray the County is below national level
on key indicators. The County has 39.4 percent of the population owning mobile phones
against 47.3 percent nationally, 15.1 percent use internet against 25.1 nationally and 6.6
percent use a desktop, laptop or tablet against 10.4 percent nationally. This demonstrates
the immense potential that can be harnessed by the private sector in terms of
connectivity, penetration and usage of ICT devices and services. The county government
welcomes such investments which will leverage on efforts already put in place to invest
in equipping Vocational Training Centers with ICT equipment to produce competitive
graduates with high end skills to match the dynamics in this field. In addition, the county
government has automated revenue collection and made transaction cashless and
continues to automate service delivery with a view to improve efficiency. Automation of

2020 Kilifi County Fiscal Strategy Paper Page 24 of 44
revenue collection has helped in sealing revenue loopholes by instilling accountability and
transparency when handling County’s resources.
47. The county’s transport infrastructure is nascent and vulnerable to the vagaries of
weather especially storm water that frequently washes away sections of weathered roads
and render them unmotorable. In this regard, the county government has continually
attended to such mishaps with a view to make these roads motorable for the better part
of the year. The county government also continues to open access roads, grading and
murraming and upgrading others to bitumen or cabro standard in order to enhance
movement of persons, goods and services.
Empowering community and cushioning vulnerable groups
48. The county’s attention has been drawn to communal disorders that drain efforts
towards achieving the transformative agenda. The County recognizes efforts by non-state
actors towards addressing these disorders but has had to spring into action when these
disorders erupt as they often do. These being social issues, they are sometimes difficult
to detect, they erupt with no warning and take more time to be resolved. Initiatives to
empower the community easily focus on the economic triggers of these disorders
neglecting the latent social norms whose disturbance breeds the root causes for these
disorders. In this regard, the county has taken a lead role in addressing these communal
disorders such as the killing and maiming of the elderly presumed to be witches, teenage
pregnancies and gender-based violence.

2020 Kilifi County Fiscal Strategy Paper Page 25 of 44
CHAPTER 3: RECENT ECONOMIC DEVELOPMENTS AND MEDIUM-
TERM OUTLOOK OVERVIEW
Overview
49. The Kenyan economy remains resilient and grew by an average of 5.5 percent in
the first three quarters of 2019, mostly supported by strong performance in the services
sector. Growth momentum is expected to pick up to 5.6 percent in 2019, 6.1 percent in
2020 and further to 7.0 percent over the medium term supported by a strong rebound in
the agricultural output, steady recovery in industrial activities, robust performance in the
services sector, and investments in strategic areas under the “Big Four” Plan.
50. The economy continues to register macroeconomic stability with low and stable
interest rates and a competitive exchange rate to support exports. At 5.8 percent in
December 2019, year-on-year overall inflation remained stable and within the 5 (+/-2.5)
percent target largely due to lower food prices following favorable weather conditions.
Inflation is expected to remain within target in 2020, largely due to lower energy prices
and expected stability in food prices.
51. The foreign exchange market remains stable supported by the narrowing of the
current account deficit. The current account deficit is estimated at 4.3 percent of GDP in
2019 down from 5.0 percent in 2018. The narrowing deficit reflects strong growth in
diaspora remittances and tourism receipts, higher tea and horticultural exports, slower
growth in imports due to lower food imports and the decline in international oil prices.
Global and regional economic developments
52. Global growth is projected to pick up to 3.4 percent in 2020 from an estimated 3.0
percent growth in 2019. The projected pick up is on account of recoveries in stressed
emerging markets and macroeconomic policy support in major economies.
53. In advanced economies, growth is expected to slow down to 1.7 percent in 2020
from an estimated 2.3 percent in 2018 mainly due to trade tensions between the United
States of America (U.S.A) and China, uncertainties surrounding the Brexit outcome, rising

2020 Kilifi County Fiscal Strategy Paper Page 26 of 44
global oil prices due to tensions between U.S.A and Iran, and the pace of normalization
of monetary policy in the advanced economies.
54. Among emerging markets and developing economies, growth is expected to pick
up to 4.6 percent in 2020 from an estimated 3.9 percent in 2019 reflecting recoveries in
stressed economies such as Turkey, Argentina and Iran as well pickup in growth for Brazil,
Mexico, India, Russia and Saudi Arabia which recorded significant slowdowns in 2019
relative to 2018.
55. Growth prospects for sub-Saharan Africa continue to strengthen. Growth is
projected to improve to 3.6 percent in 2020 from 3.2 percent in 2018 and 2019, supported
by higher commodity prices, improved capital market access and contained fiscal
imbalances in many countries.
56. Growth in the East African Community (EAC) region is estimated to improve to 6.0
percent in 2020 from 5.6 percent in 2019 mostly supported by the stable macroeconomic
environment, rebound in agricultural activities on the backdrop of favorable weather
conditions, ongoing infrastructure investments, and strong private consumption.
Table 3.1: Global economic growth in percentage
Region/Country Actual Estimated Projected
2018 2019 2020
World 3.6 3.0 3.4
Advanced Economies of which 2.3 1.7 1.7
USA 2.9 2.4 2.1
Emerging and Developing economies of which
4.5 3.9 4.6
China 6.6 6.1 5.8
India 6.8 6.1 7.0
Sub-Saharan Africa 3.2 3.2 3.6
Of which South Africa 0.8 0.7 1.1
Nigeria 1.9 2.3 2.5
EAC 5 countries 6.5 5.6 6.0
Of which Kenya 6.3 5.6 6.1
2020 Kilifi County Fiscal Strategy Paper Page 27 of 44
Domestic Economic Developments
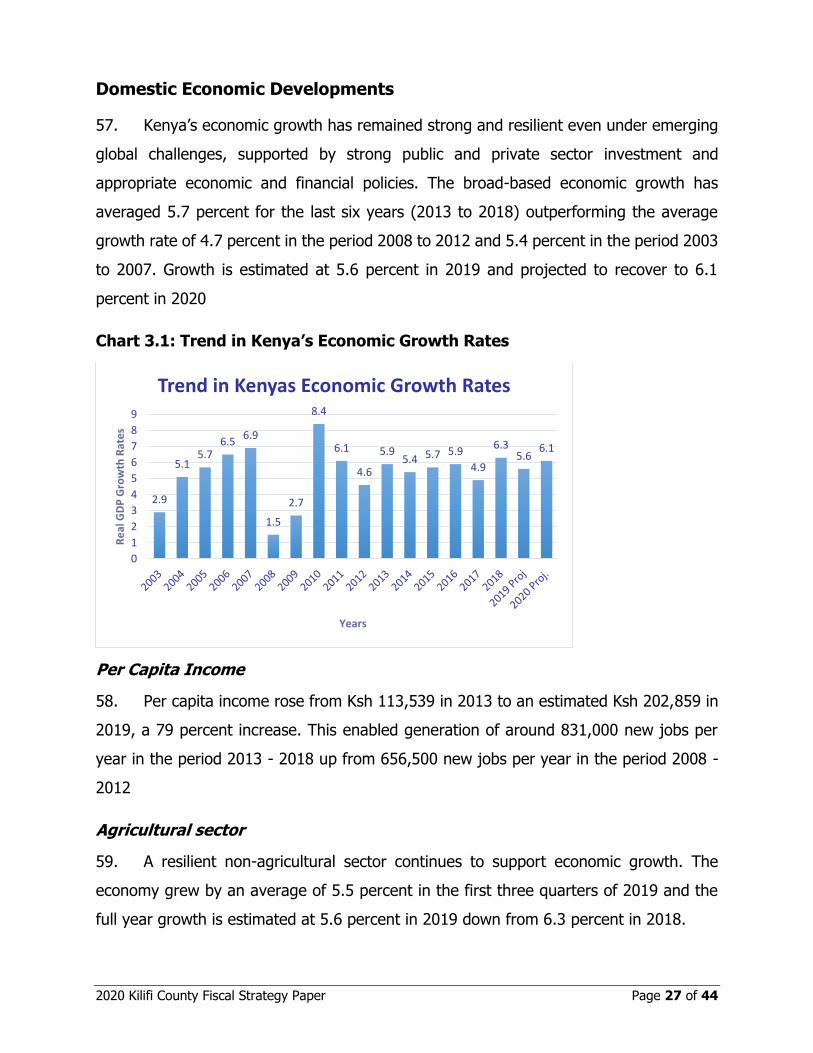
57. Kenya’s economic growth has remained strong and resilient even under emerging
global challenges, supported by strong public and private sector investment and
appropriate economic and financial policies. The broad-based economic growth has
averaged 5.7 percent for the last six years (2013 to 2018) outperforming the average
growth rate of 4.7 percent in the period 2008 to 2012 and 5.4 percent in the period 2003
to 2007. Growth is estimated at 5.6 percent in 2019 and projected to recover to 6.1
percent in 2020
Chart 3.1: Trend in Kenya’s Economic Growth Rates
Per Capita Income
58. Per capita income rose from Ksh 113,539 in 2013 to an estimated Ksh 202,859 in
2019, a 79 percent increase. This enabled generation of around 831,000 new jobs per
year in the period 2013 - 2018 up from 656,500 new jobs per year in the period 2008 -
2012
Agricultural sector
59. A resilient non-agricultural sector continues to support economic growth. The
economy grew by an average of 5.5 percent in the first three quarters of 2019 and the
full year growth is estimated at 5.6 percent in 2019 down from 6.3 percent in 2018.
2.9
5.15.7
6.56.9
1.5
2.7
8.4
6.1
4.6
5.95.4 5.7 5.9
4.9
6.35.6
6.1
0
1
2
3
4
5
6
7
8
9
Re
al G
DP
Gro
wth
Rat
es
Years
Trend in Kenyas Economic Growth Rates

2020 Kilifi County Fiscal Strategy Paper Page 28 of 44
60. In the third quarter of 2019, the economy grew by 5.1 percent compared to a
growth of 6.4 percent in a similar quarter in 2018, mainly supported by strong
performance in the services sub-sector such as information and communication,
transportation and storage, and accommodation and restaurant.
61. The agriculture sector recorded a decreased growth of 3.2 percent in the third
quarter of 2019 compared to a growth of 6.9 percent in a similar quarter of 2018, as a
result of delayed long rains. Consequently, the sector’s contribution to GDP growth
declined to 0.6 percent in the third quarter of 2019 compared to 1.3 percent in the same
period in 2018.
Non-Agricultural Sector
62. The non-agricultural sector (service and industry) remained vibrant and grew by
5.7 percent in the third quarter of 2019 down from a growth of 6.5 percent in a similar
quarter in 2018. It has the largest percentage points contribution to real GDP growth at
4.0 in the third quarter of 2019, mainly supported by the services sector
Chart 3.2: Economic Performance (Percent Growth Rates)
6.16.4 6.4
7.2
5.95.6
4.9
6.6 6.4 6.3 6.56.8
5.86.2
5.7
3.6
7.6
2.1
5.2
4.1
0.7
2.7
-0.8
7.4
6.56.9
4
5.3
4.2
3.2
-2
-1
0
1
2
3
4
5
6
7
8
9
2016 Q1
2016 Q2
2016 Q3
2016 Q4
2017 Q1
2017 Q2
2017 Q3
2017 Q4
2018 Q1
2018 Q2
2018 Q3
2018 Q4
2019 Q1
2019 Q2
2019 Q3
Per
cen
t
Quarters
Economic performance(% GDP growth Rates
Non-Agriculture Agriculture

2020 Kilifi County Fiscal Strategy Paper Page 29 of 44
Inflation Rate
63. Year-on-year overall inflation remained low, stable and within the Government
target range of 5+/-2.5 percent in December 2019 at 5.8 percent up from 5.7 percent in
December 2018 reflecting higher food prices.
Chart 3.3: Inflation Rate
Source: Kenya National Bureau of Statistics
64. Core inflation (Non-Food-Non-Fuel) remained below 5.0 percent in the period
under review reflecting subdued demand pressures in the economy. Fuel inflation
declined from 6.9 percent in December 2018 to 2.5 percent in December 2019 on account
of declining energy prices
Table 3.2: Components of Inflation
Month Food Fuel Core
December 2018 2.6 6.9 4.0
January 2019 1.8 12.1 3.4
February 2019 1.3 11.4 3.2
March 2019 2.9 8.8 3.1
April 2019 7.7 7.5 3.1
May 2019 6.0 6.8 3.0
June 2019 6.6 6.5 2.9
July 2019 7.9 6.3 2.7
August 2019 6.7 4.2 2.3
180
185
190
195
200
205
210
215
Dec-18 Apr-19 Aug-19 Dec-19 Apr-20 Aug-20 Dec-20
Per
cen
t
Axis Title
Chart Title
Overall CPI Inflation Rates

2020 Kilifi County Fiscal Strategy Paper Page 30 of 44
Month Food Fuel Core
September 2019 5.9 1.3 2.1
October 2019 8.1 1.5 1.9
November 2019 8.9 2.3 1.8
December 2019 9.3 2.5 1.7
65. The delay in the onset of rains resulted in lower agricultural activities and raised
food inflation from March 2019. Food inflation increased from 2.6 percent in December
2018 to 9.3 percent in December 2019 reflecting rising prices of key food items.
66. The contribution of core inflation to overall inflation has been low and stable
reflecting muted demand pressures in the economy on account of prudent monetary
policies. The major driver of overall inflation from December 2018 to March 2019 was
fuel inflation. However, beginning March 2019 food inflation has been the major driver of
inflation.
67. Kenya’s rate of inflation compares favorably with the rest of Sub-Saharan African
countries and its peers such as Nigeria and Ghana whose inflation rates were 11.9 percent
and 8.2 percent, respectively in November 2019 (Chart 1.3d).
Chart 3.4: Annual Inflation Rates in selected African Countries (September 2019)
-5
0
5
10
15
20
Inflation Rate (%)
Per
cen
t
Sub-Saharan Countries
Burundi Rwanda Uganda Namibia
Tanzania South Africa Kenya Zambia
Ghana Nigeria Ethiopia

2020 Kilifi County Fiscal Strategy Paper Page 31 of 44
Kenya Shilling Exchange Rate
68. The Kenya Shilling has been relatively stable supported by continued narrowing of
the current account deficit and adequate foreign reserve buffer. The Shilling appreciated
against the US Dollar and the Euro exchanging at an average of Ksh 101.4 and Ksh 112.7
in December 2019 from Ksh 102.3 and Ksh 116.4 in December 2018, respectively.
However, against the Sterling Pound, the Shilling weakened exchanging at an average of
Ksh 133.0 in December 2019 compared to Kshs 129.7 in December 2018.
Interest Rates
69. Interest rates were low and stable for the period 2008 to 2011 due to ample
liquidity in the money market. However, interest rates increased in 2012 following tight
monetary policy stance in order to ease inflationary pressures. Interest rates remained
stable and low in the period 2013 to October 2019, except from June to December 2015
when world currencies were under pressure. During the period, the Central Bank Rate
(CBR) was adjusted appropriately to anchor inflation expectations. The Central Bank Rate
was reduced to 8.5 percent on 25th November 2019 from 9.0 percent in August 2018 as
there was room for easing monetary policy stance to support economic activity
70. The interbank rate declined to 5.9 percent in December 2019 from 8.2 percent in
December 2018 due to enhanced liquidity in the money market. The interest rates for
government securities have been declining indicating that the implementation of
government domestic borrowing program supported market stability. The 91-day
Treasury bills rate declined to 7.2 percent in December 2019 compared to 7.3 percent in
December 2018. The 182-day Treasury bills rate declined to 8.2 percent from 8.4 percent
while 364-day increased to 9.8 percent from 9.7 percent.
Economic Outlook
Global Growth Outlook
71. Owing to weaker trade and investment at the start of the year, global economic
growth is expected at 3.4 percent in 2019 from a projection of 3.0 percent in 2019 down

2020 Kilifi County Fiscal Strategy Paper Page 32 of 44
from 3.6 percent in 2018. The sluggish growth reflects the continued global trade
sanctions between the U.S.A and China, subdued investment and demand for consumer
durables in emerging markets and developing economies, rising energy prices and the
continued Brexit-related uncertainties.
72. As a result of the weaker prospects in the United States as its fiscal stimulus fades
and the forthcoming increase in the consumption tax rate in Japan, growth in the
advanced economies is expected to ease to 1.7 percent in 2020 from 2.3 percent in 2018.
73. Growth in the emerging markets and developing economies is expected to pick up
to t4.6 percent in 2020, from an estimated growth of 3.9 in 2019. Similarly, the sub-
Saharan Africa region is expected to remain relatively robust growing by 3.6 percent in
2020 from 3.2 percent in 2019.
Domestic Growth Outlook
74. On the domestic scene, despite the challenging global environment, Kenya’s
economy has remained strong and resilient. The economy expanded by 6.3 percent in
2018 up from the 4.9 percent growth registered in 2017. The growth momentum
continued in the first three quarters of 2019, with the economy expanding by an average
of 5.4 percent. The latest economic indicators in the third quarter of 2019 point to
continued economic recovery that will culminate to an overall projected growth of about
5.9 percent in the FY 2019/20. Economic growth is further projected to rise to 6.2 percent
in the FY 2020/21 and 6.9 percent by FY 2023/24.
75. The growth outlook for the FY 2019/20 and the medium term is supported by a
stable macroeconomic environment, investments in the strategic areas under the “Big
Four” Plan and their enablers, and existing business and consumer confidence in the
economy. Further, the ongoing public investments in infrastructure projects, growth in
tourism, resilient exports and the associated benefits from regional economic integration
in the sub region will reinforce the projected growth. The economic growth projections
over the medium term are aligned to those of the MTP III

2020 Kilifi County Fiscal Strategy Paper Page 33 of 44
Risks to the Economic Outlook
76. The macroeconomic outlook is faced with risks from both external and domestic
sources. Risks from global economies relate to increased volatility in the global financial
markets due to tensions between the U.S.A and China, the slower growth of the Chinese
economy, uncertainties over the nature and timing of Brexit and the pace of normalization
of monetary policy in the advanced economies. Further, the uncertainty of trade
agreements such as between the United Kingdom and the European Union, the free trade
area encompassing Canada, Mexico, and the U.S.A as well as uneven and sluggish growth
in advanced and emerging market economies could hamper the forecasted growth. The
low commodity prices and the risk of energy prices taking an upward trend, if the rising
geopolitical tensions are not subdued, could negatively impact on our exports.
77. Domestically, the economy will continue to be exposed to risks arising from public
expenditure pressures, particularly related to wage related recurrent expenditures and
the inevitable climate change and variability which has enhanced the frequency of
disaster such as landslides, droughts and destruction of physical infrastructure. Locust
invasion witnessed in the country in late 2019 and early 2020 poses a risk to agricultural
production and food security. These shocks are likely to have negative impact on energy
generation and agricultural output leading to higher inflation that could slow down
economic growth.
Mitigating the Risks
78. The Government continually monitors these risks to inform appropriate mitigating
monetary and fiscal policy measures to preserve macroeconomic stability and strengthen
resilience in the economy. To cushion the country against the downsides of the risks
emanating from the global sphere, the Government is deepening reforms in the financial
sector to ensure a stable and strong financial system in Kenya. The Government is also
safeguarding macroeconomic stability through prudent fiscal and monetary policies. In
particular, the Government continues to accumulate foreign exchange reserves to deal

2020 Kilifi County Fiscal Strategy Paper Page 34 of 44
with any external shocks. Additionally, the diversified nature of our economy continues
to offer resilience to the global challenges.
79. To protect the country from climate related risks and disasters, the Government
has put in place various policies, strategies and financial risk protection instruments to
cushion the economy against budget disturbances emanating from the need to address
the unforeseen natural disaster. In particular, the Government has put in place a Disaster
Risk Financing Strategy which outlines various financial protection instruments in the
economy in the event of a disaster.
80. On risks emanating from domestic sources, the Government has laid foundations
to enhance faster and lasting growth through the “Big Four” Plan, which will enhance
growth momentum, and positively impact on the lives of people through jobs creation
and poverty reduction. For example, the Government is expanding irrigation schemes to
reduce dependence on rain-fed agriculture, diversifying exports and promoting value
addition in agriculture. Further, the Government is accelerating infrastructure
development to support manufacturing and expand intra-regional trade by deliberately
targeting new markets for our products. In addition, the ongoing enhanced domestic
resource mobilization and expenditure rationalization will significantly reduce wage
related pressures and reduce debt accumulation thus creating fiscal space necessary for
economic sustainability
County’s Fiscal Outlook
81. Implementation of FY 2019/20 started on a slow pace on account of disputes on
the equitable share of revenue to county governments. When a resolution was arrived
at, the county government revised the approved estimates for FY 2019/20 to provide for
the additional equitable share of revenue from national government, unspent revenue
from FY 2018/19 and pending bills for goods and services provided, works done as well
as allocate more funds for ongoing projects.
82. Own Source Revenue collection also started on a low but increased by 9.0 percent
in the half year of FY 2019/20 compared with FY 2018/19. The county government will

2020 Kilifi County Fiscal Strategy Paper Page 35 of 44
intensify enforcement of applicable measures to ensure the target for FY 2019/20 is
achieved but will also be cautious and conservative when projecting own source revenue
for the coming year. The conservative own source revenue estimation trend is evident in
the table below which also provides an analysis of revenue performance to indicate the
areas of intervention by the county government towards achieving the target for FY
2019/20.
Table 3.3: Own Source Revenue Collection by Class, FY 2019/20
REVENUE CLASS Approved Estimates FY 2018/29
Half Year FY 2018/19
Approved Estimates FY 2019/20
Actual Amount Half Year 2019/20
Performance (% (+/-))
HSIF 158,287,692 41,669,786 132,000,000 83,772,970 50.3%
Land Rates and other Land Revenue
338,355,777 35,586,101 337,710,413 39,407,311 9.7%
Cess on natural resources 379,803,743 104,604,494 339,932,316 99,168,251 -5.5%
Business Permit 188,023,235 6,301,195 88,732,482 6,503,612 3.1%
Parking fees 47,797,124 16,266,586 50,008,379 10,304,619 -57.9%
Market fees 31,477,932 5,435,028 16,569,337 5,372,437 -1.2%
Billboards & Signage 47,827,529 4,051,304 26,370,253 4,944,123 18.1%
Building Plan approval and Inspection
5,680,382 1,893,700 9,242,007 2,375,173 20.3%
Rent/Stall rents 14,222,944 1,645,850 5,874,241 2,932,350 43.9%
Survey fees and plot rents 4,670,509 500,000 3,102,184 511,450 2.2%
Sale of Tender Documents 61,647 1,000 - -
Plot ground rent 6,857,069 3,374,977 9,908,832 2,483,615 -35.9%
House rent 100,816,543 30,519,081 15,000,000 18,358,790 -66.2%
Refuse Collection 1,355,696 474,900 6,343,947 490,125 3.1%
Food Hygiene Fees 1,821,792 341,600 15,118,139 372,300 8.2%
Slaughter House and Livestock sale Yards
1,993,703 559,209 3,539,470 661,115 15.4%
Others 70,946,686 9,030,955 40,548,000 10,450,605 13.6%
TOTAL 1,400,000,000 262,255,766 1,100,000,000 288,108,846 9.0%
83. On the expenditure side, the County’s absorption rate was 19.6 percent in the half
year of FY 2019/20. It is expected that the revision of the budget to provide for pending
bills and ongoing projects will unlock this. The table below provides the expenditure
analysis for half year FY 2019/20 according to economic classification.

2020 Kilifi County Fiscal Strategy Paper Page 36 of 44
Table 3.4: Expenditure Analysis According to Economic Classification, Half Year FY 2019/20
Department/Division
RECURRENT EXPENDITURE DEVELOPMENT EXPENDITURE TOTAL
Printed Estimates
Revised Estimates
Cumulative Expenditure
Printed Estimates
Revised Estimates
Cumulative Expenditure
Printed Estimates
Revised Estimates
Cumulative Expenditure
Overall Absorption
County Assembly 798,455,640
803,455,640
-
200,000,000
200,000,000
-
998,455,640
1,003,455,640
265,136,516 26.4%
Office of the Governor 278,938,877
357,879,649
116,874,029
-
-
-
278,938,877
357,879,649
116,874,029 32.7%
County Attorney 92,575,000
102,575,000
54,070,459
-
-
-
92,575,000
102,575,000
54,070,459 52.7%
Finance 474,428,769 544,106,446
61,717,911
1,500,516,666
6,000,000
1,974,945,435
550,106,446
61,717,911 11.2%
Economic planning 53,456,532
91,956,532
2,869,846
-
-
-
53,456,532
91,956,532
2,869,846 3.1%
Agriculture 305,773,597 307,752,392
23,168,989
104,550,000
522,930,436
-
410,323,597
830,682,828
23,168,989 2.8%
Livestock 20,815,764 21,415,764
7,638,877
100,000,000
145,746,689
-
120,815,764
167,162,453
7,638,877 4.6%
Fisheries 21,009,180 21,009,180
3,819,058
88,500,000
117,431,030
2,020,000
109,509,180
138,440,210
5,839,058 4.2%
Water and Sanitation 166,905,360
231,930,095
74,362,212
423,300,000
1,122,098,708
19,355,940
590,205,360
1,354,028,804
93,718,152 6.9%
Environment, Natural Resources and Wildlife 40,290,702
60,290,702
16,928,600
500,000
1,800,000
40,790,702
62,090,702
16,928,600 27.3%
Education 839,889,501 930,054,977
325,442,036
316,763,298
560,420,839
22,770,518
1,156,652,799
1,490,475,816
348,212,554 23.4%
Information, Communication and Technology 11,226,139
69,826,139
244,600
-
-
-
11,226,139
69,826,139
244,600 0.4%
Medical Services 2,379,235,431
2,553,123,063
1,052,756,643
662,984,758
930,666,654
82,392,361
3,042,220,189
3,483,789,717
1,135,149,004 32.6%
Public Health 355,298,457 601,624,896
124,049,805
49,700,000
64,000,000
-
404,998,457
665,624,896
124,049,805 18.6%
Roads, Transport and Public Works 305,168,574
341,588,322
60,449,641
1,069,024,063
1,336,477,382
179,683,182
1,374,192,637
1,678,065,704
240,132,822 14.3%
Lands and Energy 114,391,349
133,834,878
20,955,127
178,000,000
196,649,584
-
292,391,349
330,484,462
20,955,127 6.3%
Physical Planning, Urban Development and Housing 47,660,493
81,075,595
2,369,182
45,500,000
95,869,941
-
93,160,493
176,945,536
2,369,182 1.3%
Gender, Culture, Social Services and Sports 83,069,099
120,456,348
33,883,414
264,100,000
317,750,685
-
347,169,099
438,207,033
33,883,414 7.7%
Trade and Tourism 121,253,463
155,383,322
30,269,490
226,163,361
260,229,808
45,354,413
347,416,824
415,613,130
75,623,903 18.2%
Cooperatives Development 10,178,850
28,178,850
2,670,205
-
-
-
10,178,850
28,178,850
2,670,205 9.5%
County Public Service Board 55,920,071
82,345,935
13,098,420
-
-
-
55,920,071
82,345,935
13,098,420 15.9%
Public Service Management
210,049,925
210,049,925
91,769,802
34,800,000
42,644,351
-
244,849,925
252,694,276
91,769,802 36.3%
Devolution, and Disaster Management
308,845,866
581,567,560
136,766,686
2,500,000
2,500,000
8,015,686
311,345,866
584,067,560
144,782,372 24.8%
Kilifi Municipality
-
19,600,000
-
-
96,593,668
116,193,668
- 0.0%
Malindi Municipality
-
19,338,716
-
-
233,406,332
252,745,048
- 0.0%
TOTAL 7,094,836,639
8,470,419,926
2,256,175,031
5,266,902,146
6,253,216,107
359,592,100
12,361,738,785
14,723,636,033
2,880,903,647 19.6%

2020 Kilifi County Fiscal Strategy Paper Page 37 of 44
CHAPTER 4: FISCAL POLICY AND BUDGET FRAMEWORK
Prudent Fiscal Policy
84. The 2020 County Fiscal Strategy Paper (CFSP), specifies broad strategic priorities
and policy goals that will guide the preparation of the coming budget. The medium-term
expenditure framework ensures resource allocation based on prioritized programs.
Priority is accorded to ongoing projects as well as flagship projects that are almost
complete amidst contracting resource basket. Thus, departments must do more with less
than has been available through prioritization and directing spending towards most critical
needs as well as leveraging on the private sector engagement.
Observing Fiscal Responsibility Principles
85. In managing the County Government’s public finances, the County Treasury shall
comply with the provisions of the Public Financial Management Act 2012 in observing
these fiscal responsibility principles:
(i) The County Government’s recurrent expenditure shall not exceed the
County Government’s total revenue;
(ii) Over the medium term, a minimum of thirty percent of the County
Government’s budget shall be allocated to the development expenditure;
(iii) The County Government’s expenditure on wages and benefits for its public
officers shall not exceed thirty five (35) percent of the County Government’s
total revenue as prescribed by the County Executive member for finance in
regulations and approved by the County Assembly;
(iv) Over the medium term, the Government’s borrowings shall be used only for
the purpose of financing development expenditure and not for recurrent
expenditure;

2020 Kilifi County Fiscal Strategy Paper Page 38 of 44
(v) The County debt shall be maintained at a sustainable level as approved by
County assembly and shall never exceed twenty (20) percent of the county
government’s total revenue at any one time in accordance to Regulation
25(1)(d);
(vi) The fiscal risks shall be managed prudently; and
(vii) Increase the absorption of resources allocated for development purposes
from the current levels to over 80 percent. This will give the envisaged
impetus to economic development and further improve the credibility of our
budget.
Fiscal Structural Reforms
86. Underpinning the fiscal program are measures to provide realistic own revenue
estimates with the objective of exceeding the target every subsequent year. For effective
and efficient management of financial resources, the County will continue to enhance
revenue collection as well as rationalize expenditure. This will be achieved by instilling
accountability and transparency in handling public finances, simplifing licenses and fees
levies, improving compliance and automation of revenue collection system and to
widening revenue base.
87. On the expenditure side, the County Government will continue to enhance prudent
financial management; to improve efficiency and reduce wastage. The County
Government will institute measures to contain the wage bill so as to channel resources
to development initiatives. These would include payroll cleansing and staff rationalization.
The County Government will also enhance staff technical capacity so as to encourage
proper and transparent use of resources and enhance service delivery.
FY 2020/21 Budget Framework
88. The County Government intends to attain prudent use of financial resources in the
coming financial year and over the medium term. As such, it will ensure strict adherence
to the fiscal responsibility principles as well as prioritize the completion of ongoing

2020 Kilifi County Fiscal Strategy Paper Page 39 of 44
projects. As such, resources will be allocated to various departments based on the
following considerations:
• Personnel costs of existing staff and their promotions, before recruitment of
new staff is provided.
• Projects to be revoted
• Ongoing Projects
• Strategic Interventions
• Operations and Maintenance
89. The budget estimates will be scrutinized along the above considerations with at
view to avail resources to scale up investments in the County’s priority areas of
Agriculture, Water, waste management, Health and Education, as captured in the CFSP
2020.
90. With regards to own source revenue estimates, the county government projects
to collect Ksh.660,494,713 down from Kshs. 1,100,000,000 in FY 2019/20. This
conservative figure is considered realistic but is subject to review especially when the
revenue raising measures instituted during FY 2019/2020 materialize. A decision to revise
the target upwards may be reached towards the end of the FY 2019/2020 considering
that the process of reviewing the property valuation is approaching the tail end. The table
below provides own source revenue projection for each class.
Table 4.1: Own Source Revenue Estimates for FY 2018/19-FY 2020/21
Revenue Class Approved Estimates FY
2018/29
Approved Estimates FY
2019/20
Projected Revenue FY
2020/21
HSIF
158,287,692
132,000,000
94,383,844
Land Rates and other Land Revenue
338,355,777
337,710,413
126,387,790
Cess on natural resources
379,803,743
339,932,316
209,448,321
Business Permit
188,023,235
88,732,482
60,777,250
Parking fees
47,797,124
50,008,379
29,248,289

2020 Kilifi County Fiscal Strategy Paper Page 40 of 44
Revenue Class Approved Estimates FY
2018/29
Approved Estimates FY
2019/20
Projected Revenue FY
2020/21
Market fees
31,477,932
16,569,337
11,677,048
Billboards & Signage
47,827,529
26,370,253
12,669,431
Building Plan approval and Inspection
5,680,382
9,242,007
5,713,060
Rent/Stall rents
14,222,944
5,874,241
5,835,845
Survey fees and plot rents
4,670,509
3,102,184
1,266,734
Sale of Tender Documents
61,647
-
21,000
Plot ground rent
6,857,069
9,908,832
6,728,051
House rent
100,816,543
15,000,000
54,873,993
Refuse Collection
1,355,696
6,343,947
1,262,806
Food Hygiene Fees
1,821,792
15,118,139
1,912,780
Slaughterhouse and Livestock sale Yards
1,993,703
3,539,470
1,600,657
Others
70,946,686
40,548,000
36,687,814
TOTAL
1,400,000,000
1,100,000,000
660,494,713
91. The county government will receive conditional grants amounting to Kshs.
1,824,081,312 which will be expended by respective departments as shown in the table
below.
Table 4.2: Conditional Grants FY 2020/21
DESCRIPTION REVISED ESTIMATES
FY 2019/20
ESTIMATES FY 2020/21
Department/Division
Total Conditional
Grants to County
Government 2,242,614,969 1,824,081,312
Total Conditional
Grants from the
National Government Revenue 537,146,040 570,846,602
Compensation for User Fee Foregone 26,056,268 25,969,864 Public Health

2020 Kilifi County Fiscal Strategy Paper Page 41 of 44
DESCRIPTION REVISED
ESTIMATES FY 2019/20
ESTIMATES FY
2020/21
Department/Division
Leasing of
Medical Equipment 131,914,894 148,396,170 Medical Services
Road Maintenance Fuel Levy 320,311,580 316,014,398
Roads Transports and Public Works
Rehabilitation of Village Polytechnic 58,863,298 80,466,170 Education
Total Conditional
allocations to County Governments from
Loans and Grants
from Development Partners 1,705,468,929 1,253,234,710
Loans and Grants - 945,715,703 TBD
Transforming Health Systems (THS) for
Universal Health Project 137,494,851 277,819,007 Medical Services
National Agricultural and Rural Inclusive Growth
Project (NARIGP) 350,000,000
Kenya Devolution
Support Programme
(KDSP) Level 1 Grant 30,000,000
Kenya Urban Support
Programme (KUSP)-
Urban Development Grant 330,534,500
DANIDA Grant (Universal Healthcare in
Devolved System
Programme) 32,775,320 29,700,000 Public Health
Water &Sanitation
Development
Programme (WSDP) 600,000,000
Kenya Devolution
Support Programme
(KDSP) Level II Grant 153,800,563
Agricultural Sector
Development Support Programme (ASDSP) II 19,723,695
Kenya Urban Support
Programme (KUSP)-Urban Institutional Grant 50,000,000
SlovakAid-Desktop
Support for Vocational Training 1,140,000

2020 Kilifi County Fiscal Strategy Paper Page 42 of 44
Indicative Budget Ceilings for the FY 2020/2021 Budget
92. The table below shows the indicative budget ceilings set for the various county
entities. In formulating the FY 2020/2021 budget, county entities will be required to limit
themselves within the resource constraints defined in the table.
Table 4.3: Indicative budget ceilings for FY 2020/2021
93. The strategic interventions provided for in the above budget ceilings include:
(i) Gratuity for county executives
PROJECTIONS 2020/21
Department
Recommended
Recurrent
Ceilings FY
2020/21
Recommended
Development
Ceilings FY
2020/21
Recommended
Total Ceilings FY
2020/21
Variance
Recurrent
(Inidicative Vs.
Recommended)
County Assembly 817,588,616 94,500,000 912,088,616 132,000,000
Office of the Governor 370,395,858 370,395,858 -
Finance and Economic Planning 391,986,183 60,033,455 452,019,638 (0)
Agriculture , Livestock and Fisheries 473,509,291 305,476,411 778,985,702 0
Water, Environment and Solid Waste Management 277,231,175 192,879,708 470,110,883 0
Education and ICT 749,964,192 180,009,414 929,973,606 (0)
County Health Services 2,500,244,741 210,006,553 2,710,251,294 39,000,000
Roads, Transport & Public Works 179,028,294 197,348,863 376,377,157 0
Lands, Energy, Physical Planning and Housing 148,199,339 314,942,962 463,142,301 0
Gender, Culture, Social Services and Sports 114,479,724 93,238,722 207,718,446 (0)
County Division for Trade, & Tourism 135,019,996 125,023,654 260,043,650 10,000,000
County Public Service Board 65,158,200 65,158,200 (0)
Devolution, Public Service and Disaster Management 211,479,111 42,960,041 254,439,152 1
Kilifi Municipality 25,000,000 25,000,000 5,000,000
Malindi Municipality 35,000,000 36,000,000 71,000,000 15,000,000
Strategic Interventions 1,307,383,844 1,287,626,466 2,595,010,310 (152,000,000)
Conditional Grants 333,488,871 1,490,592,441 1,824,081,312 -
Total 8,135,157,435 4,630,638,690 12,765,796,125 49,000,001

2020 Kilifi County Fiscal Strategy Paper Page 43 of 44
(ii) Legal fees
(iii) Car loan and mortgage
(iv) Ward development projects
(v) Contracted services for garbage collection
(vi) Kilifi Ward Scholarship Fund
(vii) Medical drugs
(viii) Phase II of the Kilifi Hospital Complex
(ix) General insurance for motor vehicles
(x) Construction of sports stadium
(xi) Kilifi Micro-finance (Mbegu) Fund
(xii) Emergency relief programmes
(xiii) Staff medical insurance
These interventions have been provided for separately from the indicative budget ceilings
for respective county entities.

2020 Kilifi County Fiscal Strategy Paper Page 44 of 44
CONCLUSION
94. The 2020 CFSP seeks to ensure that the county government creates and enabling
environment for wealth creation by private citizens and both domestic and foreign
investors. The contractionary expenditure direction advocated for in this CFSP will ensure
that more public resources are directed towards catalysing the growth of the local
economy and enhancement of efficiency in service delivery.