2020 global medical trends survey report
TRANSCRIPT

2020 Global Medical Trends Survey Report

Executive summary
The 2020 Global Medical Trends Survey sees a continuation of previous, modest increases with one significant change that should be of concern to insurers and employers alike.
The cost of medical care is rising at a similar rate to previous years, a rate that remains relatively stable. The global trend is for a projected 6.8% increase in 2020 where in 2019 it was 6.7%. The most dramatic rise is in the Middle East and Africa, where costs are expected to jump to 9.3% from 8.5%. The European rate of increase will remain stable at 4.3%, and in Latin America medical costs are projected to decrease from 12.2% to 11.7%.
Beyond these averages, each region has countries where health care policy, political instability or a combination of the two have conspired to significantly raise the projections. In Latin America, Venezuela is predicted to see a dramatic increase of 180% and so pushes the average higher, while the Middle East and Africa is the region seeing the most marked increases. There were not enough responses from the countries that saw the greatest rate of increase to draw a reliable conclusion, but clearly many show that political instability can lead to medical inflation.
Cancer, cardiovascular diseases, and conditions affecting musculoskeletal and connective tissue remain the top three conditions by cost at 83%, 55% and 46% respectively, and also by incidence. They are projected to remain so over the next five years. What is noticeable, however, and what confirms a trend identified in the 2019 report, is that mental and behavioral disorders will become increasingly significant.
Within the next five years, 27% of health insurers predicted that mental and behavioral conditions will be among the three most common conditions, and 26% predict that they will be among the three most expensive. This will bring uncertainty and challenge existing models of health care.
This is the reason why mental disorders are the focus of the 2020 Global Medical Trends Survey. You can read more about the research behind the conclusions and about the likely consequences in the special report section on page 11.
2020 Global Medical Trends Survey Report
2 willistowerswatson.com

Key findings
�� There are some decreases, some stability and some modest increases. An absence of significant change was one of the defining characteristics of the 2020 study. The increase in the Middle East and Africa is projected to be 0.8%. This gentle rise is as extreme as the 2019 figures get. The increase in Asia Pacific will remain the same while Europe rises from 4.2% to 4.3%. Latin America will see a slight decrease from 12.2% to 11.7%. The cost and incidence of complex conditions are set to grow, however, suggesting that insurers should not be complacent.
�� National averages can distort the international picture. The Global Medical Trends Survey relies on averages across regions, and these averages can be distorted by developments in a comparatively small number of countries. An increase of 60% is projected in Zimbabwe, a rise of 10% over last year and 35% on 2018. This was repeated elsewhere, if less dramatically. In Zambia, there is projected to be a 5% increase to 25% in 2020, and in Cote d’Ivoire there will be a rise to 13.3%. Both Congo and Chad will see a rise to 15%.
�� Be careful before translating local experience into regional reality. One of the problems with taking averages for a region is that individual stories can be obscured or overlooked. In Europe, where the rates of increase are predicted to remain slight, Hungary and Turkey are significantly higher at 9.6% and 19.2%, respectively. Both countries have a decaying public system, and private provision is being used by citizens who have grown exasperated with waiting times and inefficiency.
�� Overuse of care increases costs. Both patients and practitioners are seen by insurers as using too much care to no great effect. When insurers were asked to cite the three most significant factors driving medical costs per person, 73% cited an overuse of care by practitioners offering too many services, while 66% saw insured members as responsible for overusing care. This balance between prudence and largesse is a hugely difficult one to strike for any insurer.
�� Technology has its price. Asked which external factors were driving the increase in medical costs, 70% of insurers identified new technology as being responsible. This largely replicates 2019’s previous results and speaks to insurers’ darkest fears that the conditions covered by their policies can be treated more effectively with new technology but that this treatment is more expensive.
�� The most common policy exclusions are for alcohol and drug use, and HIV/AIDS. There continue to be significant gaps in coverage for these conditions. There is a clear global trend for group policies covering less than 50 employees to exclude people with preexisting conditions — 50%, falling to 32% when the group policy covers up to 500 employees. But when it comes to alcoholism and drug use as well as HIV/AIDS, there is much more unanimity. For group policies of different sizes, between 49% and 53% exclude on the basis of alcoholism and drug use, and between 47% to 50% exclude on the basis of HIV/AIDS.
2020 Global Medical Trends Survey Report 3

4 willistowerswatson.com
About the survey
Willis Towers Watson conducts the Global Medical Trends Survey every year between July and September. In compiling the survey, we obtained information from a global network of 296 leading insurers in 79 countries and weight the results using GDP per capita. The majority of our respondents insure or administer in excess of 100,000 lives in the country in which they operate.
The U.S. market has evolved in particular ways, which means that our global survey methodology would not be particularly insightful. With this in mind, U.S. medical trend data are drawn from various years of the Willis Towers Watson National Trend Survey research. Similarly, the mental health report has been assembled using information from across our internal network, and the findings reflect significant variation across countries and regions.
Figure 1. Participant profile
Americas
Asia Pacific
Europe
Middle East and Africa
23%
24%22%
30%
�� Member coinsurance is the top cost management method. Contracted networks of providers for all treatments is still the main cost management method across all regions with a combined total of 74%. Just behind it is the limiting or capping of certain services. This is most popular in the Middle East and Africa, more than any other market and any other method, with 83% of respondents identifying it as being the most effective.
�� Pharmacy services cost increases appear to be slightly moderating compared with prior years outside of the U.S. Nevertheless, 61% of respondents in Latin America saw mental health costs as being responsible for a moderate increase in health care costs with a further 5% seeing them as responsible for a significant increase. This trend was broadly reproduced across each of the regions, with 60% in Europe seeing it as responsible for a moderate increase and 47% in Asia Pacific similarly minded. The Middle East and Africa is an exception, with just 24% seeing it as responsible for a moderate increase.
�� Over 40% of insurers think that medical expenses will increase. Global figures suggest that just over 40% of respondents see medical costs as trending higher over the next three years. Asia Pacific is the most optimistic region, with 32% agreeing that there will be a moderate increase and 12% thinking that costs will be lower. However, 54% of respondents in the Middle East and Africa thought that medical expenses would increase; none thought they would be significantly lower, and just 1% thought they would be lower.
�� Europe continues to be an anomaly. The prevalence of socialized medicine or systems that rely on at least some degree of state coverage means that Europe has always behaved differently than other markets. This trend continues. While member coinsurance continues to be rated as “typical” or “very typical” in most regions, in Europe only 10% of respondents see it as very typical and 17% see it as typical.
Figure 1. Participant profile

2020 Global Medical Trends Survey Report 5
Middle East/Africa
Europe
Asia-Pacific
Latin America
Global
1 4 51 41 4
24 59 33 2
12
2
54 32 3
1
50 43 4
42 54 3
Significantly lower
HigherLower Significantly higher
About the same
0% 20% 40% 60% 80% 100%
Medical trends by region and country
A little less than half of health insurers in all regions are anticipating higher or significantly higher medical trends over the next three years. The global trend is that 41% of insurers are predicting higher costs over this period, and 4% are predicting significantly higher costs. In Latin America and Asia Pacific, just 35% predict higher or significantly higher costs while in the Middle East and Africa this figure is altogether higher, with 57% expecting an increase — the highest total, of any region, by some distance.
Latin America
Chile. The projected rise in health costs is explained by an investment in medical technology and more effective treatments for conditions. As a result, services are being used much more frequently, and members of an aging population are living longer and accessing more services over their lifetimes, developing chronic diseases for which they will need treatment. The improvement in public health policies, such as campaigns for the prevention and diagnosis of diseases, also contributes to the increased utilization and health spending.
Mexico. Mexico’s economy is slowing down, which is expected to continue in 2020. The new government’s expenses control policies, which led to the cancellation of medical expenses insurance under certain circumstances, have significantly reduced the use of private hospital services. As a result, the average costs for hospital providers to cover their fixed expenses have increased.
Results from insurers suggest that there will be a projected medical trend decrease to 11.7% in 2020. Inflation is generally in the double digits, although there are exceptions, including Colombia, the lowest in the region, where it is 5.6%.
Argentina. Economic impacts are particularly significant. Particularly high inflation and the devaluation of the Argentine currency against the U.S. dollar are two factors that have had a marked impact on the increase in medical costs since last year. It is estimated that this impact will continue to be felt next year.
Brazil. Over 50% of the insurers expect an increase in medical costs for the next three years, with a projected increase of 12.5% for 2020. According to the insurers, the main causes for this cost increase are the excessive requests for procedures and a level of abuse by plan members.
Insurers are negotiating the remuneration model with the medical services providers, replacing the current “fee for service” model with a fixed cost for a particular procedure or event. Employers demand transparency over expenditures and want to understand the negotiations with providers. They are increasingly aware of how central health education is to promoting self-care and efficient use of medical plans among plan members.
Figure 1. Participant profile
Figure 2. How do you expect the medical trend in your overall book of business to change over the next three years compared to current rates?

Gross cost trend Net cost trend (net of general inflation)
2018 2019 2020‡ 2018 2019 2020‡
Global† 6.5 6.7 6.8 4.3 4.5 4.5
Latin America† 11.6 12.2 11.7 7.0 7.5 7.8
Argentina* 41.9 46.3 42.0 7.6 2.6 18.8
Barbados and East Caribbean 10.5 10.5 10.5 6.9 9.2 8.6
Brazil* 14.3 13.0 12.5 10.6 9.4 8.4
Chile* 5.5 6.1 6.3 3.2 3.7 3.4
Colombia* 5.5 5.4 5.6 2.2 2.0 2.4
Costa Rica 13.0 13.0 11.0 10.7 10.4 7.9
Dominican Republic 8.0 10.0 10.0 4.4 8.6 5.9
Ecuador 16.0 13.0 13.0 16.2 12.4 11.8
El Salvador 11.0 11.0 9.0 9.9 10.4 7.7
Guatemala 11.0 11.0 9.0 7.3 7.6 5.3
Honduras 11.0 11.0 11.0 6.7 6.3 6.5
Mexico* 9.8 10.1 11.0 4.9 6.2 7.9
Panama 13.0 13.0 12.0 12.2 11.5 10.0
Peru* 6.0 6.6 7.7 4.7 4.3 5.7
Puerto Rico 5.0 7.3 7.3 2.5 7.0 6.0
Trinidad and Tobago 11.0 11.0 11.0 9.9 9.9 8.8
Venezuela 119.5 110.0 180.0 929,670 9,999,890 9,999,820
North America 11.1 10.9 10.6 8.8 9.0 8.4
Canada 12.7 12.7 12.7 10.5 11.0 10.8
United States** 8.7 7.9 7.2 6.2 5.9 4.5
Asia Pacific 6.8 7.1 7.1 5.1 5.2 5.1
Australia 3.4 3.7 3.2 1.4 1.6 0.9
China* 9.2 10.1 9.8 7.1 7.8 7.3
Hong Kong* 7.5 8.2 8.3 5.1 5.8 5.8
India 11.0 11.3 12.0 7.5 7.5 7.8
Indonesia 9.0 9.8 11.0 5.8 6.4 7.4
Malaysia* 11.9 11.6 12.6 11.0 9.6 10.1
New Zealand 7.0 7.5 6.0 5.4 5.5 4.1
Philippines* 5.3 7.9 8.2 0.1 4.0 4.9
Singapore 8.8 8.3 9.3 8.3 6.9 7.9
South Korea 3.8 4.0 4.0 2.3 2.6 2.5
Taiwan 6.0 6.1 6.3 4.5 5.0 5.0
Thailand* 8.1 9.0 9.2 7.0 8.0 8.0
Vietnam* 9.7 10.9 12.1 6.2 7.8 8.8
Europe 4.3 4.2 4.3 2.4 2.5 2.5
Austria 3.0 3.0 3.0 0.9 1.2 1.0
Belgium 3.8 4.2 4.5 1.5 2.2 2.9
Cyprus 8.0 4.0 5.0 7.2 3.5 3.4
Denmark 8.0 6.0 3.5 7.3 4.9 2.2
France 1.0 0.9 1.0 -1.1 -0.4 -0.6
Germany 5.8 5.5 5.5 3.8 4.2 3.8
Greece 4.6 4.8 4.8 3.8 3.7 3.3
Hungary* 10.4 10.6 9.6 7.6 7.4 6.5
Ireland 3.7 4.2 4.0 3.0 3.0 2.5
6 willistowerswatson.com
Figure 3. Global average medical trend rates by country, 2018 – 2020

Gross cost trend Net cost trend (net of general inflation)
2018 2019 2020‡ 2018 2019 2020‡
Italy 0.9 0.9 3.4 -0.4 0.1 2.2
Netherlands 2.8 2.8 2.8 1.1 0.4 1.1
Norway 4.0 4.2 4.3 1.2 2.3 2.6
Poland 5.0 5.5 6.3 3.4 3.5 4.3
Portugal* 2.5 3.1 2.8 1.3 2.1 1.1
Romania 10.0 10.0 10.0 5.4 6.7 7.0
Russia 5.8 7.0 7.2 2.9 2.0 2.7
Serbia 7.3 7.0 7.8 5.3 5.0 5.3
Spain* 2.9 3.4 3.8 1.2 2.1 2.1
Sweden 2.0 1.0 3.5 0.0 -0.9 1.8
Switzerland 4.5 4.5 4.5 3.6 3.7 3.6
Turkey* 15.6 24.4 19.2 -0.7 6.9 5.1
United Kingdom* 3.1 3.9 4.3 0.6 2.0 2.3
Middle East and Africa 7.9 8.5 9.3 5.5 6.0 6.2
Bahrain* 9.3 7.1 8.4 7.2 3.8 5.2
Benin 16.0 20.0 17.5 15.0 18.0 15.5
Cameroon* 7.2 8.3 10.6 6.2 7.1 9.1
Chad 10.0 10.0 15.0 7.5 7.1 12.0
Congo (DRC) 10.0 12.0 15.0 -19.3 3.6 8.3
Congo (Republic of)* 7.2 8.3 8.4 6.0 6.8 6.6
Cote d'Ivoire 7.0 10.0 13.3 6.7 8.0 11.3
Egypt 17.0 13.7 11.5 -3.9 -0.9 -0.8
Gabon 10.0 10.0 10.0 5.2 7.0 7.5
Ghana 8.0 10.0 12.0 -1.8 0.9 3.6
Guinea 7.0 9.0 10.0 -2.7 0.1 1.7
Jordan 6.5 9.0 11.5 2.0 7.0 9.0
Kenya 9.0 9.8 12.5 4.3 5.3 7.5
Kuwait* 7.0 8.2 8.7 6.3 5.7 6.0
Lebanon 8.0 9.0 7.0 1.9 7.0 4.7
Mozambique 10.0 12.0 15.0 6.1 7.8 9.5
Nigeria 10.0 13.0 15.0 -2.1 1.3 3.3
Oman 3.0 3.0 3.0 2.1 1.5 1.2
Qatar 7.0 7.9 9.1 6.8 7.7 5.4
Saudi Arabia* 6.3 8.0 10.0 3.9 8.7 7.8
Senegal* 8.3 8.4 9.3 7.9 7.1 7.8
South Africa* 8.9 8.1 9.0 4.3 3.2 3.6
Tanzania 12.0 15.0 17.0 8.5 11.5 12.5
United Arab Emirates 8.8 8.7 8.7 5.8 6.6 6.6
Zambia 15.0 20.0 25.0 8.0 9.3 13.0
Zimbabwe 40.0 50.0 60.0 29.4 -23.4 50.6
‡2020 medical trend is projected.†Due to the hyperinflationary nature of the Venezuelan economy, Venezuela has been excluded from Latin America regional and global totals. Including Venezuela, the 2020 global average trends would be 7.2% gross and 20,622% net, and Latin American average trends would be 14.8% gross and 186,200% net. *Countries with significant participation.**U.S. data are from various years of the Willis Towers Watson National Trend Survey.Notes: Global and regional trend rates are weighted averages based on GDP per capita. No response is indicated by NR.
2020 Global Medical Trends Survey Report 7
Global average medical trend rates by country, 2018 – 2020 (continued)
8 willistowerswatson.com
China. It is expected that medical inflation in 2020 will remain very high at 9.8%. Contributing factors include the rising cost of treatment, an aging population, escalating labor costs in the health care industry, and the use of new technology and drugs for treatment. In addition, the government is trying to reverse the trend of public hospitals generating revenue by selling prescriptions, but it is making slow progress that has yet to have a noticeable effect on expenses.
Hong Kong. Employers should brace themselves for slightly higher premium increases, with 2020 gross medical inflation projected to reach 8.3%. With an uncertain economic outlook, there should be a renewed urgency for employers to review their program design and identify priorities for change. This may include tools to incentivize employees to take an active interest in their wellbeing and become co-stakeholders with their employers.
India. Medical costs are impacted by the failure to adopt a preventive approach to health care coupled with a delay in seeking care, but there are other factors at work. Expensive, chronic ailments and lifestyle-related disorders still top the health care utilization chart, with an increase in medical practitioners recommending advanced medical procedures and treatments pushing inflation higher. Insurers are attempting to build underwriting discipline, but persistent underpricing of medical policies is artificially depressing the health insurance premium. This will remain a concern for both the mid and long term.
Malaysia. Patient demand continues to increase with a growing awareness of new treatments and the availability of new technologies. A focus on profit motives on the part of medical providers, combined with the continued rise in both noncommunicable and infectious diseases, has resulted in yet another year of increase in medical spend, which is projected to rise from 11.6% in 2019 to 12.6% in 2020.
On the broader health care front, doctors have been pushing for an increase in consultation fees, which have not been revised in more than 20 years. The Ministry of Health has yet to take a stance on this, but the doctors can increase treatment costs through medication prescriptions.
Corporate wellness initiatives continue to gain in popularity, but there are few signs that organizations are willing to allocate additional budget to them, which will slow progress in preventive education around certain of health conditions. Despite this, the working population is more aware of the need for additional medical coverage, and there has been a spike in enquiries from human resources practitioners about being able to offer voluntary medical top-up programs to employees.
Singapore. Medical inflation is projected to rise by 9.3% in 2020, far ahead of the core inflation figure projected at 1.9% by the Monetary Authority of Singapore. The demand for health care services continues to outstrip supply, and there is an indication that inefficient administrative procedures exist, which aggravate costs further.
The Singapore government has reviewed the level of subsidies granted to lower- and middle-income groups, but more education and critical health care cost management is necessary, especially on preventive health care and individual habits. Some chronic diseases and medical conditions are being seen in younger people. These require early intervention, which pushes up medical expenses. Medical advances also increase cost, especially when Singapore is often where such newer solutions are introduced.
It is to be expected that in such a diverse region, where countries face a range of disparate challenges, some of those countries exceed the average expected increase of 7.1%. A dramatically aging population in China, unrest in Hong Kong and a new government-mandated scheme in India, which will take awhile to implement effectively, are all concerns for the immediate future.
Asia Pacific

2020 Global Medical Trends Survey Report 9
Hungary. A shortage of doctors is caused by many deciding to leave for more lucrative jobs overseas. This means that the ones who remain can demand significantly higher levels of remuneration, which contributes to the trends seen above 9%. In addition, the private sector is seeing significant levels of disruption, where small and individually run medical practices are being complimented by large private clinics built by major investors and equipped with the most modern diagnostic tools and equipment.
Larger clinics have a much stronger drive toward profitability than the established clinics. Some companies introduced medical insurance packages for their employees several years ago, and these schemes are becoming much more popular to the extent where they are expected by prospective employees. This has resulted in a much higher claim ratio and higher level of utilization. The same trend is expected to continue in the near future.
Italy. The unique health care system in Italy drives the story that is underneath the apparent increase in trend from 0.9% to 3.4% for 2020. Numerous variables are caused by the coexistence of public and private systems. The country has Social Security National, a scheme that provides public health care to all citizens. It is financed by general taxation on salaries, and while good services are available, there is a waiting list. It is possible to circumvent this by paying to use either private or public hospitals.
If you are an employee and have one of around 300 different contracts, both you and your company can pay a contribution to a mandatory health care fund. Some funds cover the medical expenses of the employee, others the expenses of all family members. And while some funds cover everything, including dental and vision care, others only include hospitalization. Contributions to the fund are in the range of 150 to 4,000 euros a year.
Employers can additionally set up an integrative corporate plan so employees can receive any medical expenses not reimbursed by the main category fund within limits defined in the terms and conditions. A further complication is that specialized carriers who do not use strong hospital networks could potentially have much higher claims ratios than other players in the market, making carrier selection critically important; hence, the actual trend seen for any carrier is dependent on its mix of contracts.
United Kingdom. Insurers and medical plan administrators are continuing various initiatives to mitigate cost escalation. They are continuing the roll out and promotion of directional plans, where the insurer directs to the relevant clinician and hospital group rather than the individual patient or his or her doctor, which makes it possible to secure more favorable deals with providers as well as manage the episode cost more closely.
Providers are also actively promoting softer directional models through condition-specific self-referral pathways for conditions such as musculoskeletal, mental health and cancer. These facilitate speed of access to ensure that patients receive the right intervention and intervention at the earliest possible opportunity to influence journey and episode cost. The providers are also developing technology to deliver wellbeing alongside traditional plans with a view to encouraging positive health behaviors.
Wider social charges are also playing their part. The diversity and inclusion agenda is driving medical plan benefits, with gender dysphoria and fertility being an area of focus for many employers. Chronic medical conditions typically fall outside the scope of private medical plans in the U.K., but a number of employers are choosing to include provision and support within their plans. Mental health is also becoming important to employers as part of a broader holistic strategy to managing mental health in the workplace.
An emerging area that will potentially have a material impact on costs and trend is Advanced Therapy Medicinal Products. This name is given to three new types of products: gene therapies, tissue-engineered products and somatic cell therapies. Many employers are considering their plan design governing this emerging area.
Europe has the lowest average trend rates as in previous years and is stable at 4.3%. This is chiefly due to the use of socialized medicine, which often means that insurers are providing what could be described as top-up coverage that may include a very different array of services. When these systems fail, however, as is the case with Hungary (where there is an increased trend rate of 7%) inflation can rise steeply as a combination of a smaller number of providers and wider need drives demand.
Europe

10 willistowerswatson.com
Bahrain. Some variation between local and multinational insurers is similar to the combination of factors at play in the U.A.E. and Saudi Arabia. Equally, there is fierce price competition with generally high loss ratios as insurers offer discounts to maintain business and persistently underprice their policies. Proposed changes in regulations as they apply to compulsory medical insurance may be postponed to 2021, which brings uncertainty for insurers that will not want to sustain losses in the run up to legislative revision.
Kuwait. As with Bahrain, changes in regulations that govern compulsory medical insurance law are under discussion. This creates significant uncertainty, and, again, insurers dislike the idea of taking losses in advance of any change.
Oman. The reported inflation rate of 3% appears low compared with what in-country experts have seen, which suggests a range closer to 7% to 8%, which is more in line with other countries in the region. This could reflect preparations for mandatory health care coverage, which may see insurers extensively underpricing in order to hold on to their business, and there has been speculation that less than half of current medical insurers will be allowed to offer the new state mandated plan. Outside of this, the government still regulates pharmaceutical pricing, which may yet act as a partial brake on inflation.
Qatar. Neighboring countries have been blockading Qatar since June 2017, causing the cost of goods and services to increase, which may be having an effect on increasing medical costs. In line with other countries in the region, possible revisions of legislation that governs medical coverage is creating significant uncertainty.
Saudi Arabia. The figures for the Saudi health care market are not reflected in group medical plan renewal terms, as a significant level of competition exists in the market. Regarding the current spike, the Saudi government body— the Council of Cooperative Health Insurance — has a mandated benefit plan that was enhanced last year, so this could be reflected in the projection for inflation next year.
Despite the levels of competition and aggressive pricing, hospital closures have occurred in key locations, such as the SAAD hospital in the Eastern Province, have led to a reduction in overall competition and choice, allowing other facilities to raise their rates. A marked tendency toward particularly high levels of utilization leads to overtreatment, with prevalent misuse and abuse.
More general factors outside the health care industry could be having significant effects. An increased number of Saudis are working in the private sector. Government hospitals have always covered Saudi citizens free of charge but have recently begun to charge insurers if the patient is employed in the private sector.
As expats leave the country, market shrinkage could potentially lead to higher unit costs in order for hospitals to cover fixed costs. This will be exacerbated by competition for local talent as hospitals compete in the labor market and struggle to fill key roles. Also, the adverse effect of collection of receivables leads to higher than anticipated bad debt provisions by the insurers.
South Africa. Over the past decade in South Africa, medical inflation has been just under 11% with both supply and demand side factors contributing heavily. This is significant as the rate is more than double the Consumer Price Index of around 5.2% over the same 10-year period. The inflation figures are in line with some of the biggest open scheme increases as can be seen from just one of the more popular schemes. Discovery Health plans will increase between 8.8% and 10.9%, and approximately 60% of Discovery members will see an 8.9% increase in 2020.
UAE. A similar range of factors apply to the U.A.E. as to Saudi Arabia. There is both a rising prevalence and a rising cost of dental and other outpatient claims, but fierce price competition among insurers is bringing downward pressure. The view is that the aggressive pricing of mandated plans is not sustainable, with some variation between local and multinational insurers. The latter often take a more accommodating approach with their claims adjudication protocols.
This region has seen the largest rise, with costs increasing from 8.5% to 9.3%, which is a reflection of a very unstable political situation in the region as a whole and in several countries. For instance, Qatar is under an embargo, and many countries seem about to implement a state mandated plan. Medical inflation is closely tied to wider economic factors, and it is difficult to be sure how these will be affected by uncertainty and by the causes of that uncertainty, from unsettled domestic conditions to wider factors that affect countries in the region, including oil prices and conflict.
Middle East and Africa

The 2019 survey identified diabetes as an illness that had attracted a smaller level of attention from health care providers than its capacity to cause significant cost escalation might suggest. We called it a “sleeper condition” as rates are quietly but steadily increasing.
This report would like to sound a similar alarm call about the mounting crisis in mental health conditions and in funding for their treatment.
The scale of this crisis is such that it has received in-depth attention from the World Health Organization (WHO), which led to a 2013 – 2020 action plan for participating states. This plan calls for the wider dissemination of four objectives. These extend from the strengthening of leadership in line with the understanding of human rights, increased provision for mental health disorders, prevention programs tied into reduced suicide rates, and improved monitoring and reporting.
The mounting crisis of mental health
2020 Global Medical Trends Survey Report 11
What makes the subject more difficult is that unlike diabetes, many mental health conditions can be hard to define, for all that they have the potential to cause significant harm. An untreated mental health condition can jeopardize the life of the sufferer; cause significant harm to society, as addiction can be part of a comorbidity; and, in the case of conditions such as stress, result in ongoing health conditions, which can be expensive.
For clarity we are using the term “mental health” to refer to more than definable mental health disorders — using it more broadly than “behavioral health” alone. Rather, Willis Towers Watson views the state of good mental health to be one of successful performance of mental function, resulting in productive activities, fulfilling relationships with other people, and an ability to adapt to change and cope with challenges. It should not be confused with emotional wellbeing that relates specifically to social/emotional competencies, such as the ability to empathize or regulate emotions.
$£€

12 willistowerswatson.com
Coverage for mental health conditions
Mental health coverage is offered more widely in Latin America as a whole than any other region, irrespective of whether group policies are for less than 50, up to 500 or more than 500 employees. Over 84% of providers in this region offer coverage that is related to mental health, stress and substance use. Digging beneath the averages, on the one hand, in Brazil mental health treatments are part of the mandatory coverage, which provides for psychiatric consultations in an unlimited number, hospitalization, attendance and follow-up in a hospital, consultation with a psychologist and occupational therapist, as well as psychotherapy sessions. On the other hand, in Mexico neither mental health nor substance abuse treatments are covered under private major medical expenses. This excludes all psychiatric and psychological treatment. At best, a few sessions might be covered due to traumatic situations such as natural disasters or for victims of violent crimes.
The region of the Middle East and Africa provides the weakest coverage. Sixty percent of respondents in that region covered mental health in their large group policies, a number that fell to 41% when the policy covered under 500 lives and 30% when 50 lives or less were covered.
Some statistics
Both a wider statistical basis to the concerns about mental health and a series of more specific figures of direct interest to employers are revealed in the survey:
�� Mental health disorders are common in the workforce globally; around three in 10 employees suffer from severe stress, anxiety or depression.1
�� Over 300 million people of all ages suffer from depression globally.
�� One in four people is affected by a mental disorder at some point in his or her life; nearly two-thirds never seek help from a health professional.
�� Global rates of depression and anxiety have increased 15% to 20% in the past decade.
�� 800,000 people die by suicide each year, equivalent to one person every 40 seconds.
�� Global economic losses related to mental health disorders between 2011 and 2030 are estimated to total $16.3 trillion, comparable to those of cardiovascular diseases and higher than cancer, chronic respiratory diseases and diabetes.
It is noteworthy that mental health impacts employers in a range of adverse ways. Even if there was not an altruistic reason why employers should seek to alleviate mental health problems in their staffs, impacts on productivity and absence are an argument for making them a matter of immediate concern.
�� Financial and job security are leading sources of stress globally, and there are strong links between financial worries, stress and poor health.2
�� Employees who are in the poorest health report more than double the absences and more than 25% higher presenteeism than other colleagues, and they are more than twice as likely to be disengaged from their jobs and almost three times as likely to experience high stress as those in very good health.
�� In many developed countries, 35% to 45% of absenteeism from work is due to mental health problems.3
1 Willis Towers Watson’s 2017/2018 Global Benefits Attitudes Survey2Willis Towers Watson’s 2017/2018 Global Benefits Attitudes Survey3World Health Organization, 2005, Mental health policies and programmes in the workplace. https://www.who.int/mental_health/policy/workplace_policy_programmes.pdf,
Global economic losses related to mental health disorders between 2011 and 2030 are estimated to total $16.3 trillion, comparable to those of cardiovascular diseases and higher than cancer, chronic respiratory diseases and diabetes.
2020 Global Medical Trends Survey Report 13
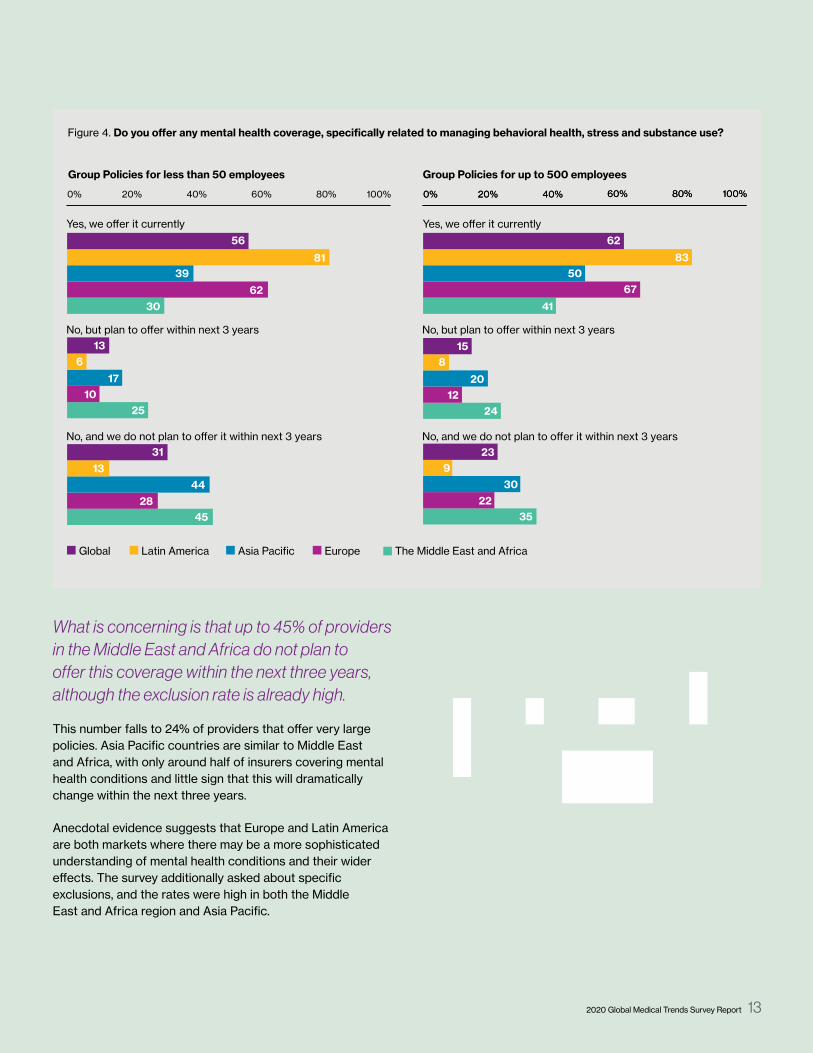
Figure 4. Do you offer any mental health coverage, specifically related to managing behavioral health, stress and substance use?
Group Policies for less than 50 employees Group Policies for up to 500 employees
81
56
39
6230
613
1710
25
1331
4428
45
83
62
5067
41
815
2012
24
923
3022
35
Global EuropeLatin America The Middle East and AfricaAsia Pacific
0% 20% 40% 60% 80% 100%
No, and we do not plan to o�er it within next 3 years
No, but plan to o�er within next 3 years
Yes, we o�er it currently
No, and we do not plan to o�er it within next 3 years
No, but plan to o�er within next 3 years
Yes, we o�er it currently
0% 20% 40% 60% 80% 100%0% 20% 40% 60% 80% 100%
What is concerning is that up to 45% of providers in the Middle East and Africa do not plan to offer this coverage within the next three years, although the exclusion rate is already high.
This number falls to 24% of providers that offer very large policies. Asia Pacific countries are similar to Middle East and Africa, with only around half of insurers covering mental health conditions and little sign that this will dramatically change within the next three years.
Anecdotal evidence suggests that Europe and Latin America are both markets where there may be a more sophisticated understanding of mental health conditions and their wider effects. The survey additionally asked about specific exclusions, and the rates were high in both the Middle East and Africa region and Asia Pacific.

14 willistowerswatson.com
Seeing the increase in costs
Despite the enhanced provision in the Americas and Europe, both regions expect that mental health will be responsible for the bulk of medical health expense increase in the next five years. Sixty-one percent of respondents in Latin America foresaw a moderate increase, and 60% in Europe reported the same. Unsurprisingly, just 24% in the Middle East and Africa predicted a moderate increase.
Behavioral and mental health conditions are now the third most costly medical condition behind pharmacy and hospital or inpatient care. Given that pharmacy costs have already been identified in previous iterations of the report as a significant source of concern and that inpatient care is obviously expensive, this rate of increase is a matter of real concern. Whether it reflects greater awareness, more accurate reporting or perhaps another unknown factor, only time will tell.
0%
10%
20%
30%
40%
50%
60%
70%
80%
Behavioral (includingsubstance abuse)/
Mental Health
Dental careMaternityPharmacyHospital/ Inpatient
Basic medical/Outpatient
Moderate increaseSignificant increase
Latin AmericaModerate increaseSignificant increase
Asia PacificModerate increaseSignificant increase
EuropeModerate increaseSignificant increase
Middle East and Africa
603
384
214
30
15
63 11
51
14
5
11
23
11
37
65
648
21
11
483
604
193
295
384
50 247
33
48
3
3
6
615
47
19
60
24
4
5
Figure 5. How do you expect costs related to the following service categories to change over the next five years?
For the time being, mental health coverage does not account for a particularly high number of claims being processed. This reflects the volume of limitations and exclusions often included in relation to these conditions. Most regions state that less than 5% of claims processed are related to mental health conditions, with the Middle East and Africa the lowest of all, although Asia Pacific is not far behind. Predictions about the rate of increase are already coming true: Globally, 21% of respondents reported between 5% and 10% of their total claims processed are related to mental health coverage, and this number will certainly go higher.
The current low utilization does not mean that employees are not experiencing problems with their mental health; it purely reflects that the required services are not being covered.

Figure 6. How many total claims processed (in terms of number) are related to the mental health coverage you provide in your policies?
75
56
69
4673
21
1717
276
68
311
0
2
2
40
02
1
40
0
29
89
22
GlobalEurope
Latin AmericaThe Middle East and Africa
Asia Pacific
Between 5% – 10%
Between 11% – 20%
Less than 5%
Between 31% – 40%
Between 21% – 30%
Other
0% 20% 40% 60% 80% 100%
2020 Global Medical Trends Survey Report 15

16 willistowerswatson.com
In line with this approach, employer organizations are increasingly moving the focus beyond programs to broader organizational factors that play a critical role in supporting mental health and emotional wellbeing.
A range of factors play a part in this, and employers may want to include them in their planning:
�� Stigma and significant gaps exist globally that prevent individuals from discussing mental health at work or accessing resources and care.
�� Market maturity varies considerably by region and individual countries, as do employee preferences around employer involvement. This requires a tailored and culturally relevant communication and engagement approach.
�� Employers should be cognizant of the drivers of stress, such as financial insecurity, making sure to align provision with employee preferences.
�� The global market for stress and resilience solutions is emerging but less established outside of the U.S. and U.K. All employers should also focus on broader organizational factors such as creating an inclusive culture, reducing stigma, thinking about the work environment and policies that impact mental health.
For more information on mental health and how to address it in your organization, and for a more detailed explanation of available reports and statistics, please contact your Willis Towers Watson representative.
Providing treatment
Interrogating where the increased spending will be allocated gives some significant indications as to where and how the providers will seek to manage mental health conditions. Above and beyond the simple reimbursement of mental health claims, insurers are likely to use an employee assistance program provided by an external partner, with a global rate of 47%. In-house programs are less popular at 19%.
Similarly, mental health and/or substance abuse programs are slightly more likely to be provided by an external partner or vendor than being integrated in a medical plan or offered as an optional extra. The global rate is 46% for provision by external providers and 35% for the integrated equivalent. By contrast, provision provided in-house has a global rate of just 15%.
Where emotional resilience and stress management programs are offered, it is once again more likely to be provided through an external source and not something that an insurer typically provides in-house. Of more interest for future developments is the increasing use of virtual and telebehavioral health services.
Twenty-three percent of respondents offer these services in-house, the highest global total for any in-house provision save for in-house counseling. A global total of 35% use an external provider. This collectively shows that where expertise around the treatment of mental health conditions is not adequately provided for, there is a readiness to use external expertise to expand provision.
Advice to employers
The global mental health burden is staggering. Mental health disorders and stress are increasing in incidence and in detection all over the world, and inevitably, employers shoulder a large share of that burden. In addition to its action plan, the WHO has taken practical steps toward the alleviation of mental distress by starting work on a series of guidelines that are intended to address mental health in the workplace.
These guidelines will address psychological support to manage and overcome mental health conditions in the workplace but also the organizational and managerial systems conducive to employees’ emotional wellbeing.
2020 Global Medical Trends Survey Report 17
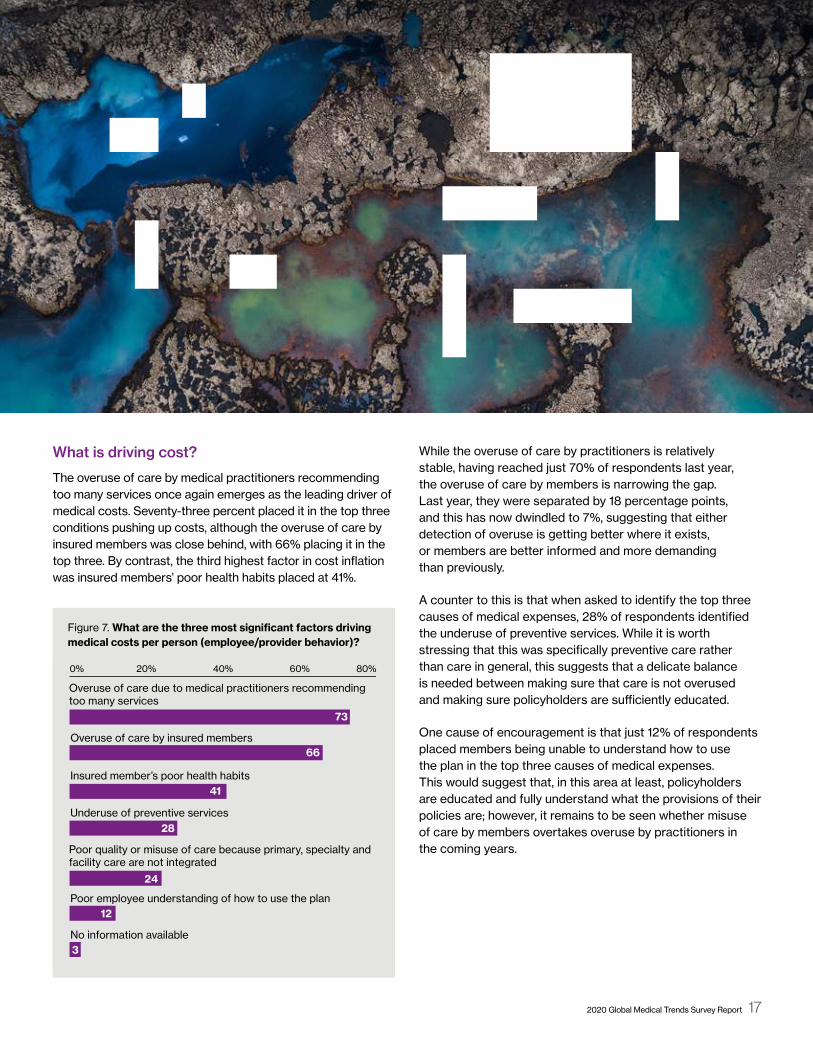
Figure 7. What are the three most significant factors driving medical costs per person (employee/provider behavior)? Figure 4. What are the three most significant factors driving medical costs per person (employee/provider behavior)?
0% 20% 40% 60% 80%
No information available
Poor employee understanding of how to use the plan
Poor quality or misuse of care because primary, specialty and facility care are not integrated
Underuse of preventive services
Insured member’s poor health habits
Overuse of care by insured members
Overuse of care due to medical practitioners recommending too many services
66
73
41
28
24
12
3
What is driving cost?
The overuse of care by medical practitioners recommending too many services once again emerges as the leading driver of medical costs. Seventy-three percent placed it in the top three conditions pushing up costs, although the overuse of care by insured members was close behind, with 66% placing it in the top three. By contrast, the third highest factor in cost inflation was insured members’ poor health habits placed at 41%.
While the overuse of care by practitioners is relatively stable, having reached just 70% of respondents last year, the overuse of care by members is narrowing the gap. Last year, they were separated by 18 percentage points, and this has now dwindled to 7%, suggesting that either detection of overuse is getting better where it exists, or members are better informed and more demanding than previously.
A counter to this is that when asked to identify the top three causes of medical expenses, 28% of respondents identified the underuse of preventive services. While it is worth stressing that this was specifically preventive care rather than care in general, this suggests that a delicate balance is needed between making sure that care is not overused and making sure policyholders are sufficiently educated.
One cause of encouragement is that just 12% of respondents placed members being unable to understand how to use the plan in the top three causes of medical expenses. This would suggest that, in this area at least, policyholders are educated and fully understand what the provisions of their policies are; however, it remains to be seen whether misuse of care by members overtakes overuse by practitioners in the coming years.

Top three conditions globally
There has been no variation in the top three global conditions: cardiovascular, cancer and musculoskeletal disorders. As with previous incarnations of this survey, the incidence of these conditions and of challengers to the “top three” is highly regionalized and will reflect particular realities that operate in those areas.
Conditions relating to injury and other similar causes are the most common in Latin America by incidence, at 55%. The costliest condition is cancer, which 94% reported was most expensive. The opinion of the responders was that this would be maintained over the next five years. Cancer is the most expensive condition in Asia Pacific and will be over the next five years, but gastrointestinal disorders are the most common and predicted to remain so.
Europe is the only region where cancer leads by measures on both cost and incidence, now and in five years’ time. Sixty-two percent of respondents believe it will be in the top three in five years’ time — the highest of any condition.
In the Middle East and Africa, cancer is the most expensive condition now and in the future, but cardiovascular is rated as among the top three conditions by 67% of respondents, the same number who predict it will also be dominant in five years’ time. Diabetes and other endocrine, nutritional and metabolic diseases are just behind on a present-day incidence of 58%, predicted to rise to 61%.
It is noteworthy that mental health disorders are identified by 31% of the European providers as being among the top three conditions by incidence; they predict this figure will rise to 40%. Even in Asia Pacific, mental health disorders were identified by 17% of respondents as being in the top three conditions in the next three years, again by incidence, suggesting that this is a trend that may be worth monitoring more closely.
18 willistowerswatson.com

2020 Global Medical Trends Survey Report 19
Figure 6. Excluding maternity, what are the top three conditions currently causing the highest incidence (most common) and the highest cost of claims in your medical client portfolio?
55
54
49
58
14
19
27
17
611
11
4
48
63
17
3
1
54
23
83
14
40
24
22
8351
5387
10
4639
3341
22
1329
2813
10
20
2627
22
26
2328
23
Top three conditions currentlyby incidence
Top three conditions currently by cost
Top three conditions over the next five years by incidence
Top three conditions over the next five years by cost
0% 10% 20% 30% 40% 50% 60% 70% 80% 90%
Diabetes, endocrine, nutritional and metabolic diseases
Digestive system (gastrointestinal)
Respiratory
Mental and behavioral disorders (e.g., stress)
Cancer (neoplasms)
Musculoskeletal and connective tissue
Circulatory system (cardiovascular)
Eye and adnexa, ear and mastoid process
Diseases of blood and blood-forming organs
Congenital malformations and related abnormalities
Substance abuse
Genitourinary system
Injury and other consequences of external cause
Infectious and parasitic disease
0% 10% 20% 30% 40% 50% 60% 70% 80% 90%
Figure 8. What are the top three conditions (excluding maternity) currently causing the highest incidence of claims (most common) in your medical client portfolio and the highest cost of claims? What do you expect the top three conditions causing the highest incidence and the highest cost of claims will be in the next five years?

20 willistowerswatson.com
Figure 9. How typical are the following cost-sharing approaches for the medical products you offer
Managing medical trend: Cost sharing and cost management
The approach to cost sharing is the same as in previous years with the same exception. Member coinsurance is the most popular save for Europe, where socialized medicine distorts the averages. There is also some variation within the statistics. While member coinsurance is very typical for 60% of respondents in Latin America, it is very typical with only 8% of respondents in Asia Pacific, but 48% say it is typical.
Other schemes, however, are also popular. The deductible — which includes a cost per claim, per service or per year — was rated as being “very typical” in Latin America by 60% of respondents, and premium cost sharing within group policies was rated the same. Deductibles were similarly
rated as “typical” by 49% of survey respondents in Asia Pacific and as “typical” by 51% of respondents from the Middle East and Africa.
An annual limit on out-of-pocket expenses were less popular. Forty-six percent of respondents from the Americas rated them as being used occasionally, and 34% from Asia Pacific reported that they were never used — the largest figure in the “never” category behind Europe, a market with highly specialized characteristics. In fact, 26% of European respondents said they were only used occasionally.
The European market tends to favor deductibles. Thirty-two percent of respondents said that they were very typical, and a further 19% said that they were typical, making them more popular in Europe than any other type of cost sharing.
Figure 9. How typical are the following cost-sharing approaches for the medical products you oer?
60 21 13
15 39 32
10 17 35
8 48 38
Very typical TypicalOccasionally Never
Latin America
6
14
38
6
60 13 14 14
1 49 37 14
32 19 32 17
13 51 22 14
34 33 16 17
10 23 57 9
12 14 34 39
7 34 41 18
9 6 46
16 32 22
13 22 26
2 26 38
39
29
39
34
60 28 6
5 22 39
8 26 34
2 21 55
6
34
32
22
20% 40% 60% 80% 100%
14 56 21
54 15 26
19 11 52 19
15 62 18
20% 40% 60% 80% 100%
18 39
18 18 40
30 8 32
18 35 17
31
24
29
30
Very typical TypicalOccasionally Never
Asia Pacific
Very typical TypicalOccasionally Never
Europe
Very typical TypicalOccasionally Never
The Middle East and Africa
Member coinsurance (fixed percentage of services)
Deductible (including per claim or per service, or per year)
Member copays (flat fee)
Annual limit of out-of-pocket expenses
For group policies, premium cost sharing by insured members (including employees and/or dependents)
0% 20% 40% 60% 80% 100% 0% 20% 40% 60% 80% 100%
2020 Global Medical Trends Survey Report 21
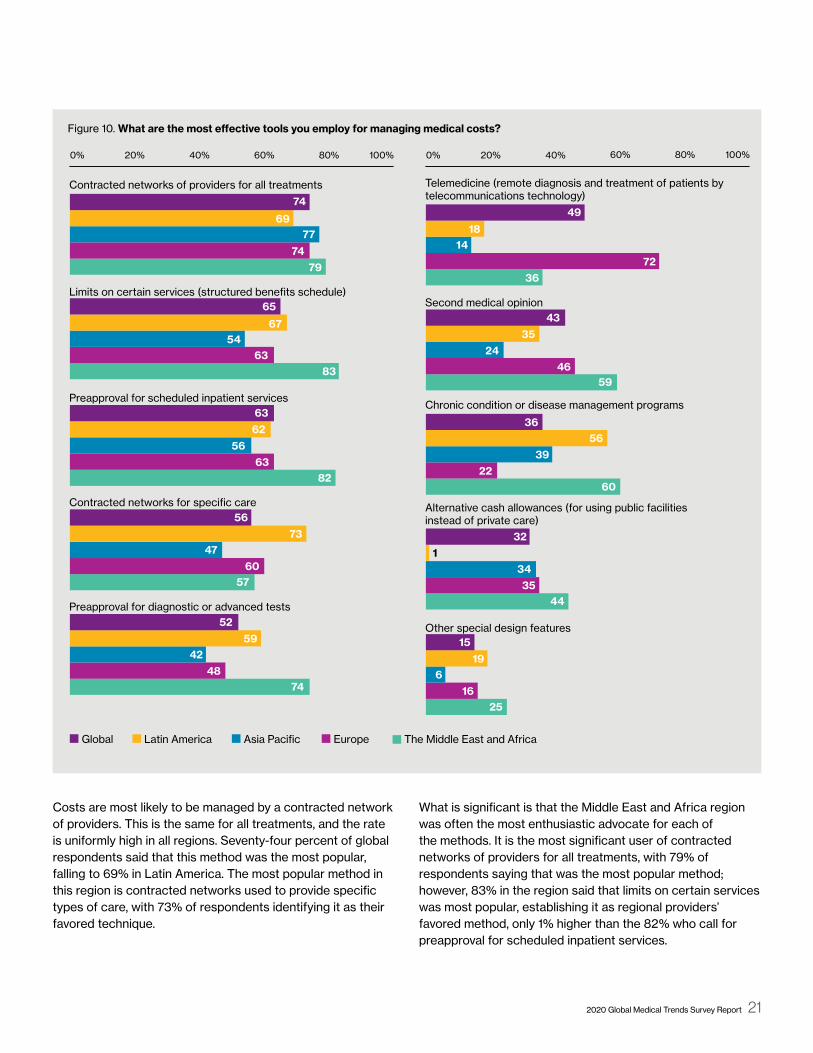
Figure 10. What are the most effective tools you employ for managing medical costs? Figure 10. What are the most e�ective tools you employ for managing medical costs?
69
74
77
7479
67
65
5463
83
6263
5663
82
7356
4760
57
5952
4248
74
18
49
14
7236
3543
2446
59
5636
3922
60
32
341
3544
1915
616
25
Global EuropeLatin America The Middle East and AfricaAsia Pacific
Preapproval for diagnostic or advanced tests
Limits on certain services (structured benefits schedule)
Contracted networks for specific care
Preapproval for scheduled inpatient services
Contracted networks of providers for all treatments
Other special design features
Alternative cash allowances (for using public facilities instead of private care)
Second medical opinion
Telemedicine (remote diagnosis and treatment of patients by telecommunications technology)
Chronic condition or disease management programs
0% 20% 40% 60% 80% 100% 0% 20% 40% 60% 80% 100%
Costs are most likely to be managed by a contracted network of providers. This is the same for all treatments, and the rate is uniformly high in all regions. Seventy-four percent of global respondents said that this method was the most popular, falling to 69% in Latin America. The most popular method in this region is contracted networks used to provide specific types of care, with 73% of respondents identifying it as their favored technique.
What is significant is that the Middle East and Africa region was often the most enthusiastic advocate for each of the methods. It is the most significant user of contracted networks of providers for all treatments, with 79% of respondents saying that was the most popular method; however, 83% in the region said that limits on certain services was most popular, establishing it as regional providers’ favored method, only 1% higher than the 82% who call for preapproval for scheduled inpatient services.

22 willistowerswatson.com
Claim data classification
Looking at what claim-coding systems insurers use to adjudicate claims, we see a continued increase in those using the latest version of the International Classification of Disease, more commonly referred to as ICD 10. The Middle East and Africa region is the most advanced in this area, with nearly 70% of all insurers using this coding system, whereas Europe and Latin America show only 33% of insurers using it.
Europe seems to be the one region lagging in adoption of the standardized ICD classification, with nearly 20% of insurers reporting that they use a homegrown or local system instead of ICD 9 or 10. This continues to be a frustration when attempting to perform comparative analysis of claim experience and health conditions across countries. Perhaps some insurers are planning to skip ICD 9 or ICD 10 and are working on ICD 11 implementation recently released by the WHO.
This was the third most popular method overall. Second placed was limits on service. While results were solid but unspectacular, 65% of global providers said they used this method. The lowest total in this category was the 54% in Asia Pacific who said that it was the most popular market, but totals for this region were uniformly low. Fifty-six percent of respondents from Asia Pacific said preapproval for scheduled inpatient services was the highest total, although there was also a strong showing for alternative cash allowances for using public facilities, with 34% of providers in the region saying this was the most popular.
Other than the generic category of “other special design features,” this was the worst-performing category. Still, 32% of global providers said that this was most popular. Of the regions, the Middle East and Africa seems to find it particularly useful, with 44% saying it was the most popular but just 1% of respondents from Latin America expressing their agreement.

More than 500 lives
200 – 500lives
50 – 200lives
Less than50 lives
6670
5433
5047
4227
3834
2923
2724
2112
988
5
111
17
4132
2818
5859
6764
Figure 11. What type of claim data do you make available to your clients?
0% 20% 40% 60% 80%
No data
Other (please specify)
Data on physicians utilized by insured population
Individual claim data indication service provided and diagnosis
Data with split on claims incurred in and out of network
Data on medical facilities utilized by insured population
High-level claim data only (total claims incurred)
Detailed claim data identified by top 10 causes or medical conditions
Latin America Asia Pacific Europe The Middle Eastand Africa
4819
278
97
186
49
193
215
315
3751
3368
Figure 12. What claim-coding system do you use to adjudicate medical claims?
0% 10% 20% 30% 40% 50% 60% 70%
Other
None
Local coding system
ICD-9
ICD-10
ICD-10
ICD-9
Local coding system
None
Other43%
14%
24%
12%
7%
2020 Global Medical Trends Survey Report 23
Figure 11. What type of claim data do you make available to your clients?
Figure 12. What claim-coding system do you use to adjudicate medical claims?

503231
10910
5352
49
4950
47
2120
17
1414
13
262323
322425
Figure 13. Do your standard (typical) medical insurance programs exclude any of the following?
Group policies for less than 50 employeesGroup policies for up to 500 employeesGroup policies for more than 500 employees
252323
302525
353132
5958
55
3833
31
5153
49
413938
3026
24
Mammograms
Second surgical opinion
HIV/AIDS
Alcoholism and drug use
Ongoing diabetes care
Cancer
Mental health and stress
Preexisting conditions
Retirees
Child dependents, age 23 and above
Parents
Hearing services
Speech services
Vision services
Dental services
Out-of-country coverage
0% 20% 40% 60% 80% 0% 20% 40% 60% 80%
24 willistowerswatson.com
Figure 13. Do your standard (typical) medical insurance programs exclude any of the following?

Medical insurance program exclusions
The global exclusion picture is mixed. For the most part there is considerable unanimity between insurers of differing sizes. Where there is a difference is with preexisting conditions and mental health. Group policies for less than 50 employees are more likely to exclude on this basis, accounting for 50% and 32% respectively, but this number falls for larger insurers. Thirty-one percent of insurers are responsible for over 500 employers that exclude for preexisting conditions and just 25% that exclude for mental health and stress.
At the regional level, exclusions in both Asia Pacific and Europe tend to be higher, with little gap between large and small insurers. There are comparatively few exclusions for cancer in either region, for instance, peaking at 15% for group policies for more than 500 people in Europe and 6% for similarly sized businesses in Asia Pacific and rather more for HIV/AIDS or alcoholism and drug use.
Exclusions in Latin America tend to focus on people insured in addition to the policyholder, such as parents and children, or on retirees. Midsize group policies for up to 500 employees exclude 75% of parents, 57% of children and 60% of retirees, although the general exclusion rate for other conditions tends to be lower.
The Middle East and Africa region is a hybrid of the other regions. Exclusions for drug use and alcoholism are common at 69% for group policies for more than 500 employees, as are exclusions for HIV/AIDS at 70% for similarly large businesses. There are also common exclusions for parents and children, while 88% of group policies for less than 50 employees can be expected to exclude retirees.
2020 Global Medical Trends Survey Report 25

26 willistowerswatson.com
The task for this survey is to reflect reality as it is shown by these statistics. If that information does not exist, it cannot be shown, in this instance because there are some policies that actively exclude mental health conditions. Where evidence suggests that these problems are increasing, irrespective of whether they happen to be covered or not, it is a pressing problem for any employer that has concern for its employees and will need to be addressed, if not in-house then by external providers.
That medical inflation can be affected by wider cultural events shows how it can be seen as a barometer for social changes. Medical inflation woes afflict Venezuela, where inflation could reach 180%, and Argentina, where inflation was around 46% in 2019, according to our statistics. Similarly, China is facing a trade war with the U.S. and has an aging population, ergo medical inflation is predicted to be somewhere around 9.8%.
Everyone who works in this area needs to continue to pay close attention to medical trend, which tends to be two to three times higher than general inflation in many countries, continuing to impact compensation and benefit funding as well as overall business profitability. Private medical insurance has become the norm in many countries and is seen as being a benefit necessary to attract and retain top talent.
However, for employers and insurers to mitigate medical inflation, they will need to manage plan design and cost sharing features while still allowing access to the physicians and medical network that will provide the best outcome for their employees and members. The answer for the treatment of mental health may yet prove to be careful deployment of solutions that show “out of the box” thinking, such as telemedicine and better education. Only time will tell whether this makes a meaningful impact.
Conclusion and next steps
On the surface, the 2020 survey appears to report the same news as the preceding years. There is a gentle increase in some regions, a decrease that falls within the statistical margin of error, and stasis elsewhere. So much, so similar — but under the surface there are changes in the nature of the demand for medical services and, pursuant to that, signs of a growing need for mental health services.
The Lancet Commission report by 28 global specialists in psychiatry, public health and neuroscience, among others, into the cost of mental health estimates that there will be a $16 trillion economic impact by 2030. That this figure is so large and that the report was commissioned in the first place shows that mental health is becoming a matter of note and that any residual stigma is starting to disappear with gathering speed.
While putative costs are a crude measure of this, insurers in both Latin America and Europe estimate that mental health will be responsible for the bulk of medical health expense increase in the next five years, which is a remarkably high figure. While Europe largely has socialized medicine and the Americas largely do not, both are mature markets with a sophisticated understanding of every gradation of mental health condition.
In Asia Pacific and the Middle East and Africa, this understanding may be somewhat slower to evolve, so it follows that treatment costs will also be behind the curve. If the approach to mental health develops and gains wider cultural recognition, expect to see more demand for it to be included in commonly available policies and for that to be reflected in medical inflation statistics.


willistowerswatson.com/social-media
Copyright © 2019 Willis Towers Watson. All rights reserved.WTW-HP-2019-0236
willistowerswatson.com
About Willis Towers WatsonWillis Towers Watson (NASDAQ: WLTW) is a leading global advisory, broking and solutions company that helps clients around the world turn risk into a path for growth. With roots dating to 1828, Willis Towers Watson has 45,000 employees serving more than 140 countries and markets. We design and deliver solutions that manage risk, optimize benefits, cultivate talent, and expand the power of capital to protect and strengthen institutions and individuals. Our unique perspective allows us to see the critical intersections between talent, assets and ideas — the dynamic formula that drives business performance. Together, we unlock potential. Learn more at willistowerswatson.com.