2020 oil and gas m&a outlook bigger deals, fewer transactions · 2020-02-12 · 2020 oil and...
TRANSCRIPT

2020 oil and gas M&A outlookBigger deals, fewer transactions

Brochure / report title goes here | Section title goes here
02
Contents
Executive summary 1
Markets remain challenging despite marked improvements since 2016 3
Bigger was better in 2019 5
2019 M&A sector by sector 7
Five trends that could shape 2020 M&A 17
More of the same, but a little bit different 20
Endnotes 21
2020 oil and gas M&A outlook | Bigger deals, fewer transactions
1
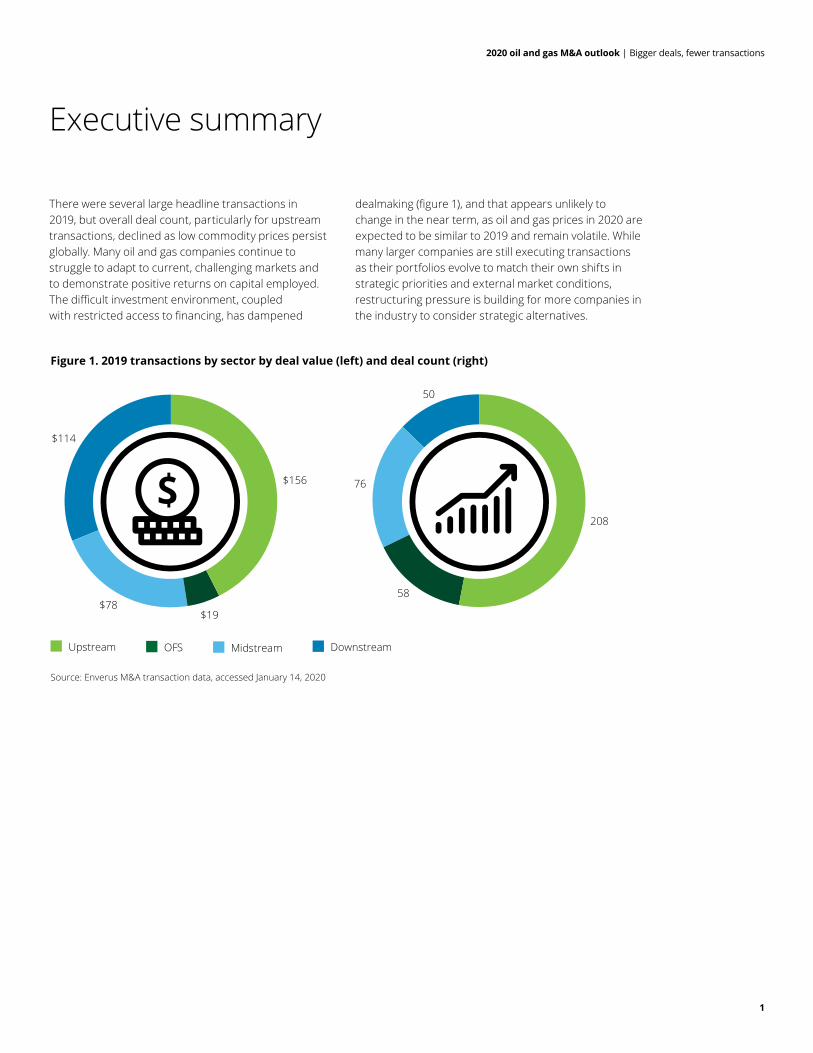
There were several large headline transactions in 2019, but overall deal count, particularly for upstream transactions, declined as low commodity prices persist globally. Many oil and gas companies continue to struggle to adapt to current, challenging markets and to demonstrate positive returns on capital employed. The difficult investment environment, coupled with restricted access to financing, has dampened
dealmaking (figure 1), and that appears unlikely to change in the near term, as oil and gas prices in 2020 are expected to be similar to 2019 and remain volatile. While many larger companies are still executing transactions as their portfolios evolve to match their own shifts in strategic priorities and external market conditions, restructuring pressure is building for more companies in the industry to consider strategic alternatives.
Executive summary
Figure 1. 2019 transactions by sector by deal value (left) and deal count (right)
$156
$19$78
$114
208
58
76
50
Source: Enverus M&A transaction data, accessed January 14, 2020
Upstream OFS Midstream Downstream

2020 oil and gas M&A outlook | Bigger deals, fewer transactions
2
Key 2019 takeaways:
• Access to the initial public offering (IPO) market has been frozen for most since 2015, and equity and debt financing continues to decline, as capital markets expect companies to operate within cash flows and have limited capital available to fund acquisitions. This restricted access to capital has been especially challenging for private equity funds that are looking to exit portfolio companies; as a result, private equity funds have been forced to hold their positions longer than expected and, in some cases, consolidate portfolio companies.
• There were almost 400 oil and gas transactions in 2019 worth $370 billion, with deal value up but deal count down significantly year-on-year
• Transaction values were significantly concentrated, with 44 deals (or 12 percent of deals) comprising 80 percent of total deal value (worth almost $300 billion) and the top two deals comprising almost one-third of deal values for the year
• Upstream companies cut 208 deals worth $156 billion in 2019, with value up $26 billion (20 percent) year-on-year as larger companies continue to divest noncore assets, but overall counts were down by 40 percent compared to 2018
• 2019 oilfield services (OFS) deal value dropped to $19 billion, or 35 percent below the five-year average, while deal volume was only 10 percent below the five-year average, and the sector continues to be financially stressed as operators focus on capital discipline
• Midstream was the only sector to see an increase in deal count over 2018 (with an increase of 30 percent and value up 50
percent year-on-year), reaching 76 deals worth $78 billion in 2019 with increased private equity spend as investors pivot from production to infrastructure
• 2019 downstream deal flow declined 15 percent after a strong 2018, but value reached $114 billion this year, almost double both the prior year and the five-year average, as several companies invested in larger-scale petrochemicals and end-markets integration
Themes shaping dealmaking in 2020:
• The Majors and large independents will likely continue to divest their noncore international assets to streamline their portfolio and double down on key major capital projects and US shale
• Big Oil is pushing to become Big Energy, and these companies are starting to divest higher-carbon assets and expand power and renewables investment as part of a large-scale transformation
• Large, international oil and gas companies are expected to continue to expand their downstream footprint in the pursuit of growing demand and petrochemical opportunities
• Following years of low commodity prices and weak balance sheets, US upstream and OFS companies will likely circle the wagons in 2020 and consolidate what has been a fragmented market
• Private equity should rethink its investment strategy as the IPO markets remain frozen and the mergers and acquisitions (M&A) market continues to be soft
2
2020 oil and gas M&A outlook | Bigger deals, fewer transactions

2020 oil and gas M&A outlook | Bigger deals, fewer transactions
3
2019 saw several large transactions, but overall deal count declined as low commodity prices persist globally. Many oil and gas companies continue to struggle to adapt to current, challenging market conditions. It is true that oil prices have partially recovered from their 2016 nadir, but natural gas prices remain low in many markets, including the United States (figure 2). As we noted in our most recent 2020 Oil and Gas Industry Outlook, prices will likely look a lot like they did in 2019, as demand growth is uncertain and petroleum stocks remain
high.1, 2 Companies across the oil and gas value chain have all been affected, though not to the same degree. Producers and service companies bore the brunt of lower prices and subsequently pulled back spend and reduced head count the most, even as global production grows,3, 4 whereas midstream and downstream companies fared better thanks to ample supply and growing demand for refined products (though refining margins remain narrow).5 The impact of low prices can be seen in both oil and gas financing and transactions.
Markets remain challenging despite marked improvements since 2016
Figure 2. Global oil prices have rebounded since 2016; gas prices remain near decade lows
2015 2016 2017 2018 2019 2015 2016 2017 2018 2019
Crud
e oi
l pric
es ($
/bbl
)
0
20
40
60
80
100
Nat
ural
gas
pric
es ($
/MM
Btu)
0
5
10
15
20
Source: The World Bank Group6
Note: European natural gas prices reflect Netherlands Title Transfer Facility (TTF) post-April 2015. Prior to April 2015, prices include both an average import border price and a spot price component, including the United Kingdom.
Dubai West Texas IntermediateBrent Europe Japan LNGHenry Hub
2020 oil and gas M&A outlook | Bigger deals, fewer transactions
4
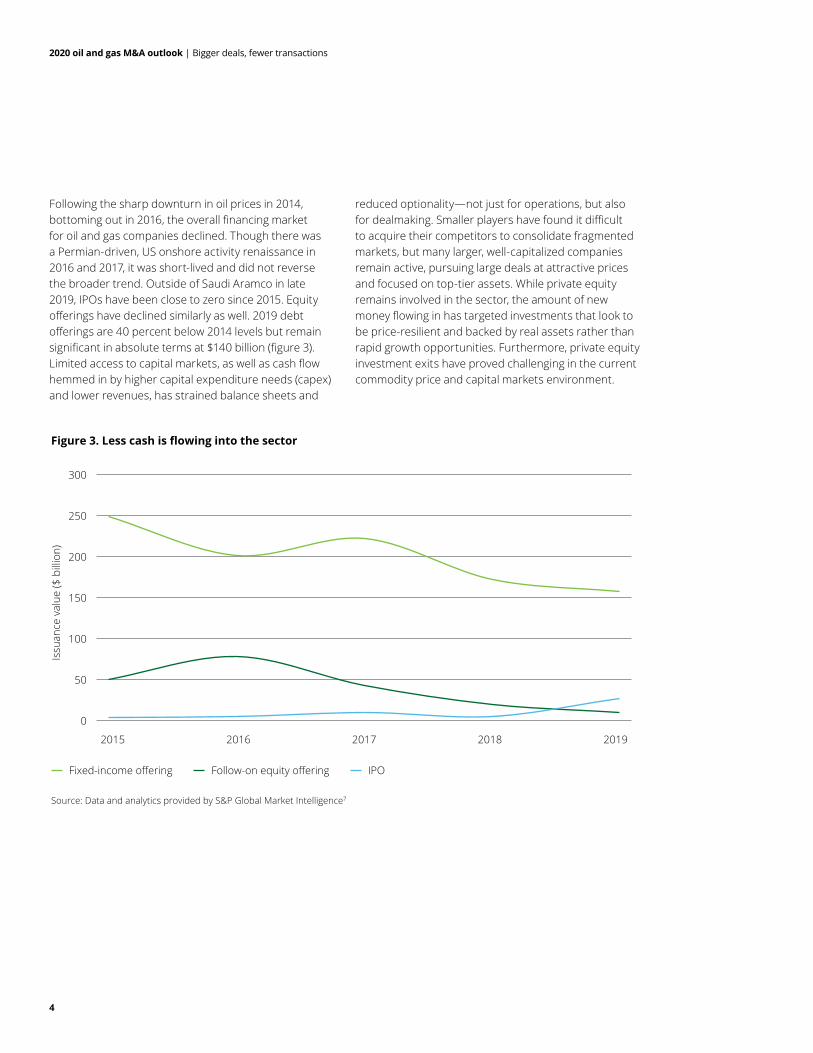
Following the sharp downturn in oil prices in 2014, bottoming out in 2016, the overall financing market for oil and gas companies declined. Though there was a Permian-driven, US onshore activity renaissance in 2016 and 2017, it was short-lived and did not reverse the broader trend. Outside of Saudi Aramco in late 2019, IPOs have been close to zero since 2015. Equity offerings have declined similarly as well. 2019 debt offerings are 40 percent below 2014 levels but remain significant in absolute terms at $140 billion (figure 3). Limited access to capital markets, as well as cash flow hemmed in by higher capital expenditure needs (capex) and lower revenues, has strained balance sheets and
reduced optionality—not just for operations, but also for dealmaking. Smaller players have found it difficult to acquire their competitors to consolidate fragmented markets, but many larger, well-capitalized companies remain active, pursuing large deals at attractive prices and focused on top-tier assets. While private equity remains involved in the sector, the amount of new money flowing in has targeted investments that look to be price-resilient and backed by real assets rather than rapid growth opportunities. Furthermore, private equity investment exits have proved challenging in the current commodity price and capital markets environment.
Figure 3. Less cash is flowing into the sector
2015 2016 2017 2018 2019
Issu
ance
val
ue ($
bill
ion)
0
100
50
150
200
250
300
Source: Data and analytics provided by S&P Global Market Intelligence7
Follow-on equity offering IPOFixed-income offering
2020 oil and gas M&A outlook | Bigger deals, fewer transactions
5
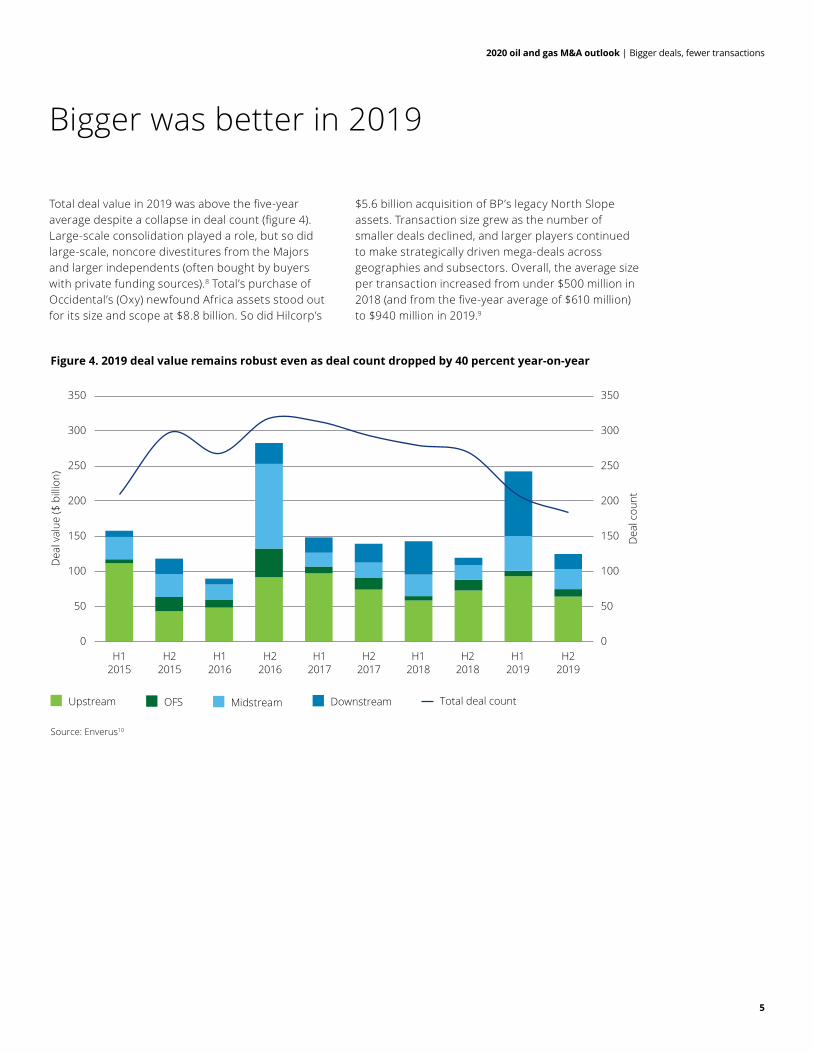
Total deal value in 2019 was above the five-year average despite a collapse in deal count (figure 4). Large-scale consolidation played a role, but so did large-scale, noncore divestitures from the Majors and larger independents (often bought by buyers with private funding sources).8 Total’s purchase of Occidental’s (Oxy) newfound Africa assets stood out for its size and scope at $8.8 billion. So did Hilcorp’s
$5.6 billion acquisition of BP’s legacy North Slope assets. Transaction size grew as the number of smaller deals declined, and larger players continued to make strategically driven mega-deals across geographies and subsectors. Overall, the average size per transaction increased from under $500 million in 2018 (and from the five-year average of $610 million) to $940 million in 2019.9
Bigger was better in 2019
Figure 4. 2019 deal value remains robust even as deal count dropped by 40 percent year-on-year
Dea
l val
ue ($
bill
ion)
Dea
l cou
nt0
150
100
50
200
250
300
350
0
150
100
50
200
250
300
350
Source: Enverus10
Upstream OFS Midstream Downstream Total deal count
H12015
H22015
H12016
H22016
H12017
H22017
H12018
H22018
H12019
H22019
2020 oil and gas M&A outlook | Bigger deals, fewer transactions
6
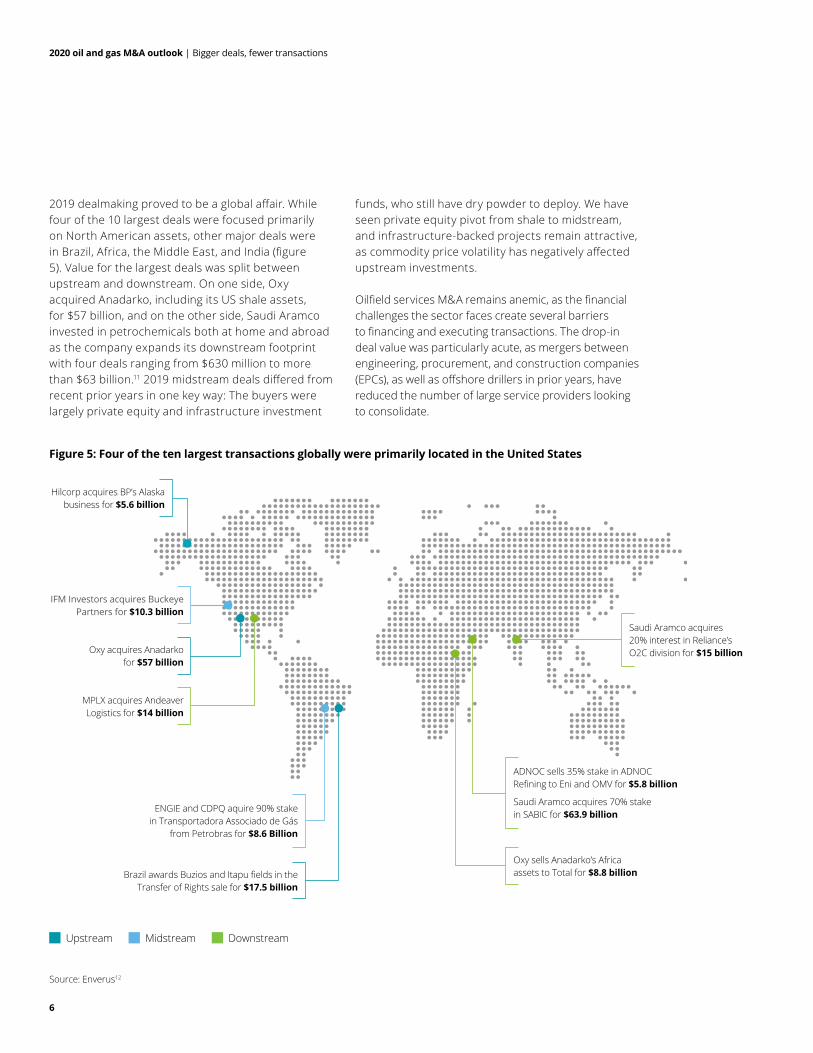
2019 dealmaking proved to be a global affair. While four of the 10 largest deals were focused primarily on North American assets, other major deals were in Brazil, Africa, the Middle East, and India (figure 5). Value for the largest deals was split between upstream and downstream. On one side, Oxy acquired Anadarko, including its US shale assets, for $57 billion, and on the other side, Saudi Aramco invested in petrochemicals both at home and abroad as the company expands its downstream footprint with four deals ranging from $630 million to more than $63 billion.11 2019 midstream deals differed from recent prior years in one key way: The buyers were largely private equity and infrastructure investment
funds, who still have dry powder to deploy. We have seen private equity pivot from shale to midstream, and infrastructure-backed projects remain attractive, as commodity price volatility has negatively affected upstream investments.
Oilfield services M&A remains anemic, as the financial challenges the sector faces create several barriers to financing and executing transactions. The drop-in deal value was particularly acute, as mergers between engineering, procurement, and construction companies (EPCs), as well as offshore drillers in prior years, have reduced the number of large service providers looking to consolidate.
Figure 5: Four of the ten largest transactions globally were primarily located in the United States
Saudi Aramco acquires 70% stake in SABIC for $63.9 billion
ADNOC sells 35% stake in ADNOC Refining to Eni and OMV for $5.8 billion
ENGIE and CDPQ aquire 90% stake in Transportadora Associado de Gás
from Petrobras for $8.6 Billion
Saudi Aramco acquires 20% interest in Reliance’s O2C division for $15 billion
Oxy sells Anadarko’s Africa assets to Total for $8.8 billionBrazil awards Buzios and Itapu fields in the
Transfer of Rights sale for $17.5 billion
Hilcorp acquires BP’s Alaska business for $5.6 billion
IFM Investors acquires Buckeye Partners for $10.3 billion
Oxy acquires Anadarko for $57 billion
MPLX acquires Andeaver Logistics for $14 billion
Upstream Midstream Downstream
Source: Enverus12
2020 oil and gas M&A outlook | Bigger deals, fewer transactions
7
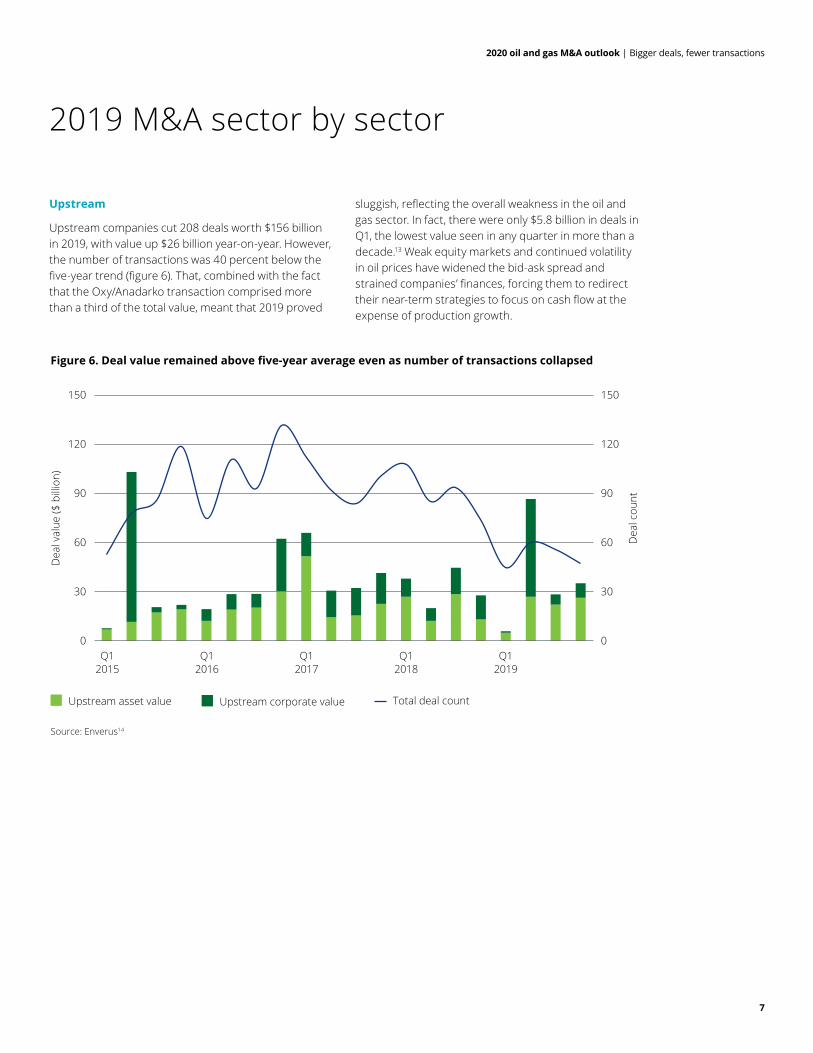
Upstream
Upstream companies cut 208 deals worth $156 billion in 2019, with value up $26 billion year-on-year. However, the number of transactions was 40 percent below the five-year trend (figure 6). That, combined with the fact that the Oxy/Anadarko transaction comprised more than a third of the total value, meant that 2019 proved
sluggish, reflecting the overall weakness in the oil and gas sector. In fact, there were only $5.8 billion in deals in Q1, the lowest value seen in any quarter in more than a decade.13 Weak equity markets and continued volatility in oil prices have widened the bid-ask spread and strained companies’ finances, forcing them to redirect their near-term strategies to focus on cash flow at the expense of production growth.
2019 M&A sector by sector
Figure 6. Deal value remained above five-year average even as number of transactions collapsed
Dea
l val
ue ($
bill
ion)
Dea
l cou
nt0
30
60
90
120
150
0
30
60
90
120
150
Source: Enverus14
Upstream asset value Upstream corporate value Total deal count
Q12015
Q12016
Q12017
Q12018
Q12019

2020 oil and gas M&A outlook | Bigger deals, fewer transactions
8
Regionally, the United States continues to be the prime market for upstream M&A, representing more than 60 percent in terms of both deal volume and value (figure 7). However, sensitivity to oil prices and weak market sentiment drove the contraction in basin-specific deals in the United States, with most of the deals taking place across multiple basins or, absent that, focused solely on the Permian. Out of the roughly $95 billion in US M&A, asset-focused deals accounted for $25 billion, reflecting a fall of 50 percent year-on-
year. Additionally, for the first time ever, one-fourth of the total asset deal value came from royalty or joint development agreements, including Ecopetrol’s $1.5 billion joint venture with Oxy in the Midland Basin, highlighting the lower risk appetite for many players, including private equity.15 Outside of that, private money remained on the sidelines for the most part despite availability of dry powder—reflecting not just concerns about risk and valuations, but also potential problems exiting shale investments in the future.
Figure 7. US transactions as a percent of global deal value (left) and count (right)
61%13%
6%
5%
3%3%
8%
63%7%
4%
3%
2%2%
17%
Source: Enverus16
Brazil
Norway
Canada
US
United Kingdom
Rest of world
Mozambique
Canada
Norway
Colombia
US
United Kingdom
Rest of world
Brazil

2020 oil and gas M&A outlook | Bigger deals, fewer transactions
9
Low and volatile oil prices have affected the international M&A market more than the US market, leading to modest deal flow. Internationally, South America saw the highest deal value ($23 billion) as Petrobras, CNOOC, and CNPC were awarded Buzios and Itapu fields for $17.5 billion through the recent transfer of rights sale held by the Brazilian government. Furthermore, Petrobras’s divestment plan led to six upstream transactions paring down its mature offshore assets, including its $1.3 billion deal in April with Petronas to farm down its interest in two fields.
Europe, particularly the North Sea, also saw notable deal activity in 2019 (worth $13 billion) as supermajors and large independents like ConocoPhillips divested their noncore North Sea assets to optimize their portfolio. Buyers were almost exclusively regional small-to-mid-sized independents, including several private equity–backed companies such as Chrysaor.
The Majors and larger independents were also actively divesting noncore assets in Asia Pacific and Africa to a lesser degree. Murphy exited Malaysia in March for $2.1 billion, and ConocoPhillips sold its Northern Australian projects to Santos for $1.5 billion. Oxy’s divestiture of its Anadarko-sourced Africa assets to Total for $8.8 billion proved to be the second-largest upstream deal of the year.
In Canada, oil sands consolidation continues as Devon sold its Canadian business to CNRL in May for $2.8 billion. Outside the oil sands, the deal market was muted with several smaller transactions, primarily in the Montney and other Western Canadian shale basins.
Looking toward 2020, larger deals will likely still prove attractive as companies both streamline their portfolio and augment their exposure to underweight resources. Furthermore, potential thawing in the debt markets could support further US onshore consolidation. However, absent a significant shift in commodity prices, deal count is expected to remain low.
2020 oil and gas M&A outlook | Bigger deals, fewer transactions
10
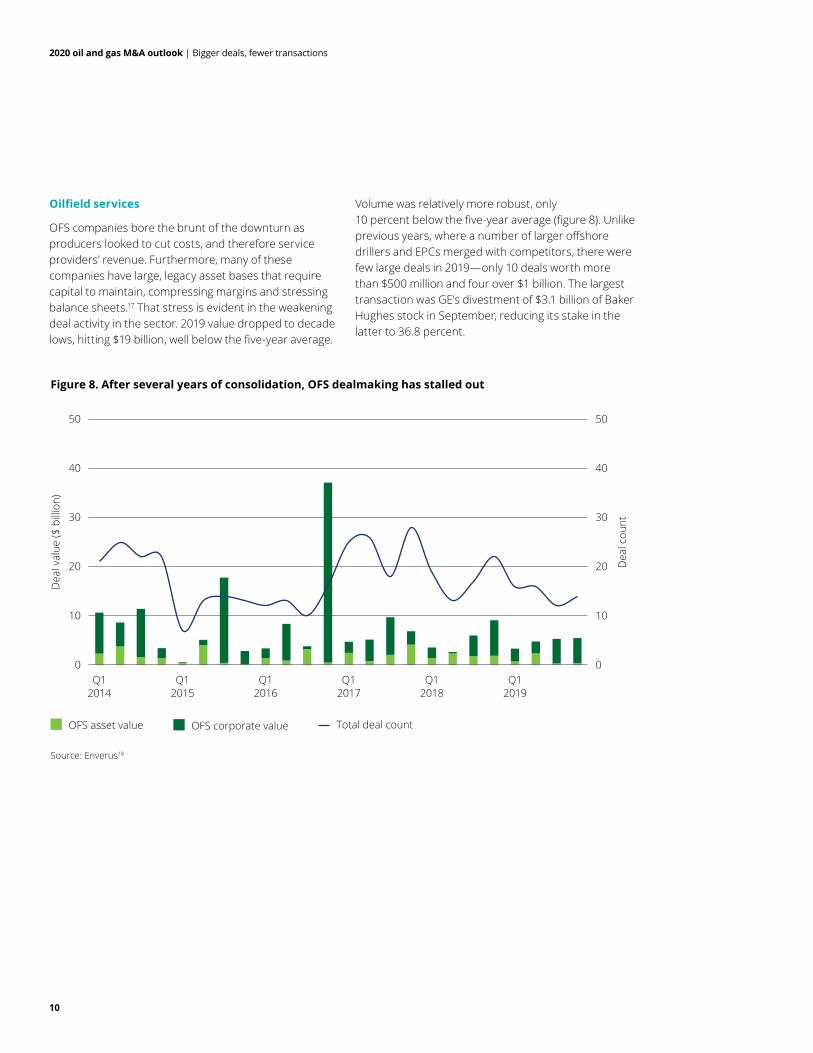
Oilfield services
OFS companies bore the brunt of the downturn as producers looked to cut costs, and therefore service providers’ revenue. Furthermore, many of these companies have large, legacy asset bases that require capital to maintain, compressing margins and stressing balance sheets.17 That stress is evident in the weakening deal activity in the sector. 2019 value dropped to decade lows, hitting $19 billion, well below the five-year average.
Volume was relatively more robust, only 10 percent below the five-year average (figure 8). Unlike previous years, where a number of larger offshore drillers and EPCs merged with competitors, there were few large deals in 2019—only 10 deals worth more than $500 million and four over $1 billion. The largest transaction was GE’s divestment of $3.1 billion of Baker Hughes stock in September, reducing its stake in the latter to 36.8 percent.
Figure 8. After several years of consolidation, OFS dealmaking has stalled out
Dea
l val
ue ($
bill
ion)
Dea
l cou
nt
0
10
20
30
40
50
0
10
20
30
40
50
Source: Enverus18
OFS asset value OFS corporate value Total deal count
Q12014
Q12016
Q12015
Q12017
Q12018
Q12019

2020 oil and gas M&A outlook | Bigger deals, fewer transactions
11
Transactions were minimal throughout the year despite record-low market capitalization for many large service companies offering attractive price points. These firms have cut costs, and a few that are active in the Permian have grown revenues, but overall margins are less than a third of what they were pre-2015, and the outlook remains challenging.19 Most large OFS firms have not expanded scale or scope of operations, and for many, costs fell more slowly than revenue. That may be making the sector less attractive to outside investors and creating a difficult environment for companies to optimize their portfolio; only $3.5 billion worth of assets exchanged hands in 2019, down 50 percent year-on-year.20
Regionally, US-based sellers accounted for more than 60 percent of total value, largely in line with previous years. Outside of GE’s divestment, most of the US deals were centered around single-segment companies rather than the ones with diverse portfolio of services. $2.7 billion worth of deals in the United States involved production operations, and a number of companies expanded their exposure to water handling and disposal services, a potential growth opportunity as domestic production growth has centered in regions with limited water resources (such as the Permian in West Texas) or underdeveloped infrastructure relative to production levels (such as water disposal in the Marcellus). There were also several drilling and completions deals in the United States worth $1.8 billion, comprising several smaller transactions driven by consolidation.21
There were also $6 billion worth of OFS deals outside the United States in 2019, spread broadly across Europe, Asia, and, to a lesser extent, the Middle East. The transactions were split evenly across a range of service offerings, from drilling to production. While consolidation was front of mind, in the Middle East, where activity has proven more resilient, there was also a push toward increasing capabilities and expanding operational footprints via strategic acquisitions. For example, TAQA acquired Schlumberger’s Middle East onshore drilling rigs business for $415 million in April. There remains significant room for further transactions as the sector continues to be reshaped by adverse market conditions.22
Low market capitalization, reduced demand for key services (such as onshore drilling), and stressed balance sheets have limited the amount of oilfield services consolidation, particularly in the United States. While there will likely continue to be a number of smaller deals, including targeted divestitures, in the OFS sector, overall deal value and count is likely to be muted in 2020. One potential deal driver to watch for in the year to come is restructuring as companies reorganize to better position themselves financially and strategically.

2020 oil and gas M&A outlook | Bigger deals, fewer transactions
12
Midstream
Midstream was the brightest sector in 2019, with dealmaking remaining strong relative to prior years despite the lack of mega-deals. Production growth in US shale, as well as internationally (for example, Brazil), combined with opportunities for sustained, predictable cash flows, attracted private equity and infrastructure
fund capital into the sector. Deal count was up 30 percent and value by 50 percent year-on-year, reaching 76 deals worth $78 billion in 2019 (figure 9). While MPLX’s acquisition of Andeavor Logistics for $14 billion in May was the only transaction over $10 billion, there were 19 deals larger than $1 billion in 2019, including 10 deals worth $35 billion involving private equity or similar buyers.23
Figure 9. Strong midstream dealmaking as the sector continues to attract outside capital
Dea
l val
ue ($
bill
ion)
Dea
l cou
nt
0
20
40
60
80
0
20
40
60
80
Source: Enverus24
Midstream asset value Midstream corporate value Total deal count
Q12015
Q12016
Q12017
Q12018
Q12019

2020 oil and gas M&A outlook | Bigger deals, fewer transactions
13
At a regional level, 70 percent of deal value and volume was contributed by North America, particularly the United States (figure 10). US deal value increased 25 percent, exceeding $50 billion in 2019, with midstream players pushing to optimize the portfolio and extract maximum value from their infrastructure investments as domestic oil, gas, and natural gas liquids production, as well as energy exports, continue to grow. Surprisingly, the Permian basin witnessed deals worth only $5 billion despite continued record-setting production growth. However, there were several sizeable asset deals, worth some $8.5 billion, targeting the Williston and Appalachian basins, reflecting that there remain a number of attractive opportunities outside of Texas in regions that are infrastructure-constrained.25 While much of the deal activity occurred in the United States, private equity and other outside investment contributed to $4.8 billion in Canadian transactions as well.
Most midstream transactions were focused on North America; however, the two largest asset deals occurred internationally, including ENGIE and CDPQ acquiring 90 percent stake in the TAG pipeline from Petrobras for $8.6 billion as part of the latter’s divestment strategy, as well as BlackRock and KKR’s acquisition of 40 percent in ADNOC pipelines for $4 billion.
There are unlikely to be mega-deals in 2020, as most of the larger midstream companies have consolidated their positions. However, several parts of the sector remain regionally fragmented, opening opportunities for dealmaking for companies pursuing augmented scope or scale. Furthermore, the nature of the assets will likely remain attractive to private investors, with a more aligned returns profile than upstream deals seen in prior years.
Figure 10. Like upstream, most midstream deal value was in North America
72%
12%
7%
5%4%
Source: Enverus 26
Latin America Asia PacificNorth America EuropeMiddle East & Africa
2020 oil and gas M&A outlook | Bigger deals, fewer transactions
14
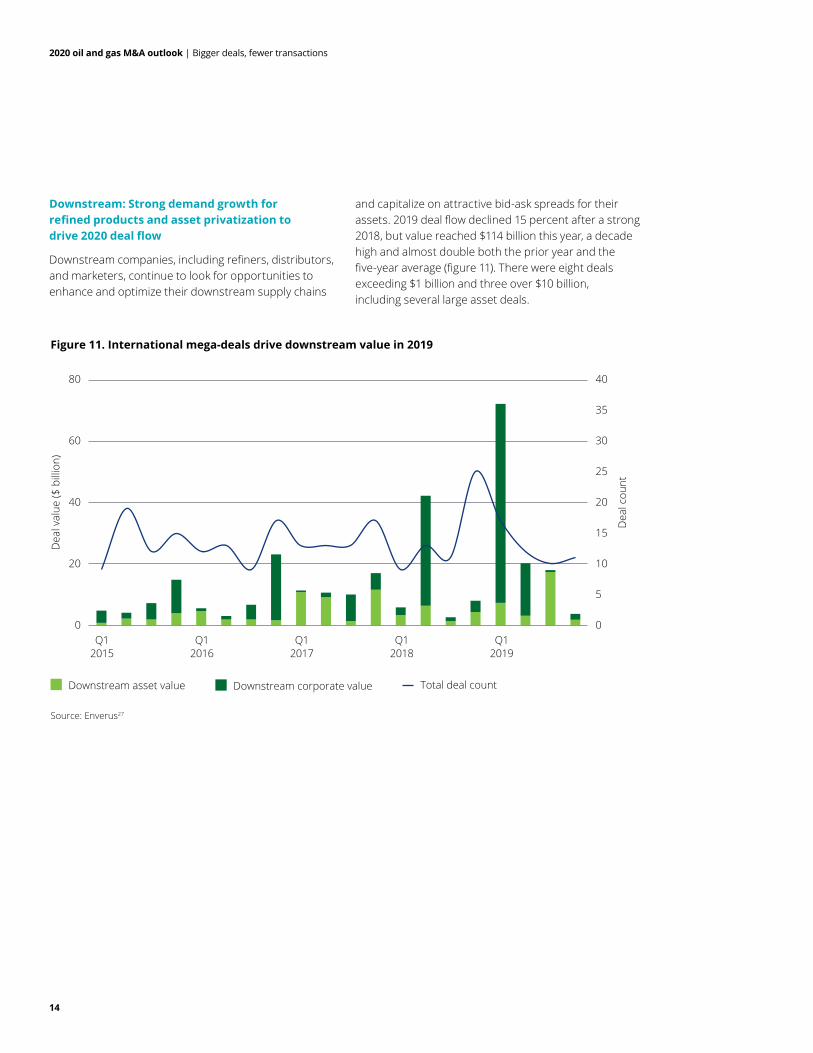
Downstream: Strong demand growth for refined products and asset privatization to drive 2020 deal flow
Downstream companies, including refiners, distributors, and marketers, continue to look for opportunities to enhance and optimize their downstream supply chains
and capitalize on attractive bid-ask spreads for their assets. 2019 deal flow declined 15 percent after a strong 2018, but value reached $114 billion this year, a decade high and almost double both the prior year and the five-year average (figure 11). There were eight deals exceeding $1 billion and three over $10 billion, including several large asset deals.
Figure 11. International mega-deals drive downstream value in 2019
Dea
l val
ue ($
bill
ion)
Dea
l cou
nt0
20
40
60
80
0
25
30
35
10
5
15
20
40
Source: Enverus27
Downstream asset value Downstream corporate value Total deal count
Q12015
Q12016
Q12017
Q12018
Q12019
2020 oil and gas M&A outlook | Bigger deals, fewer transactions
15
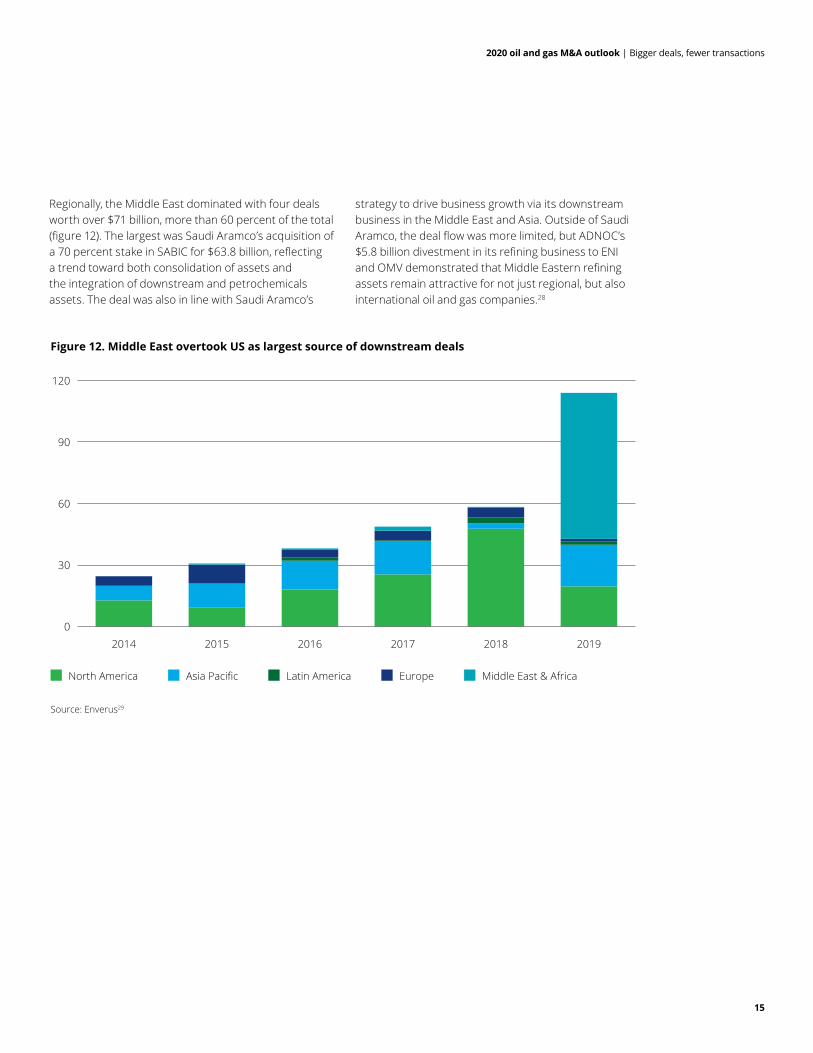
Regionally, the Middle East dominated with four deals worth over $71 billion, more than 60 percent of the total (figure 12). The largest was Saudi Aramco’s acquisition of a 70 percent stake in SABIC for $63.8 billion, reflecting a trend toward both consolidation of assets and the integration of downstream and petrochemicals assets. The deal was also in line with Saudi Aramco’s
strategy to drive business growth via its downstream business in the Middle East and Asia. Outside of Saudi Aramco, the deal flow was more limited, but ADNOC’s $5.8 billion divestment in its refining business to ENI and OMV demonstrated that Middle Eastern refining assets remain attractive for not just regional, but also international oil and gas companies.28
Figure 12. Middle East overtook US as largest source of downstream deals
20152014 2016 2017 2018 20190
30
60
90
120
Source: Enverus29
Asia Pacific EuropeNorth America Middle East & AfricaLatin America

2020 oil and gas M&A outlook | Bigger deals, fewer transactions
16
Outside the Middle East, there were also $20 billion worth of deals in Asia Pacific, representing 18 percent of the 2019 total. Almost all these transactions involved cross-border investments from the Middle East or Europe into fast-growing countries like India, including Saudi Aramco’s acquisition of 20 percent stake in Reliance’s oil-to-chemicals division for $15 billion in August. BP and Total also invested in the country, acquiring a retail and a gas-processing business respectively. Given strong demand growth for refined products and an interest in privatizing assets in many countries, downstream deal activity in the Asia Pacific region will likely remain active.
North American activity declined 60 percent year-on-year, reaching $20 billion. This is driven primarily by the large-scale consolidation in domestic capacity in recent years and limited opportunities for further massive transactions. However, there was a push to acquire US mid-size assets, including IFM’s acquisition of Buckeye Partners for $10.3 billion in May and the $4.6 billion acquisition of AmeriGas’s remaining 74 percent stakes
by UGI in April, which helped the company expand its propane operations and distribution footprint.30 Outside of that, Shell divested its Martinez refinery to PBF for $1 billion in June as part of its broader divestment push, Chevron acquired the Pasadena Refinery System from Petrobras for $560 million in January, and there were several small-to-mid-sized storage and retail transactions representing $1.3 billion in value in the United States. Canadian dealmaking remains muted, with three transactions in 2019, including the Noverco acquisition of Valener for $900 million in March.
Companies will likely continue investing further downstream and into petrochemicals in 2020 as demand for raw materials continues to grow in Asia and other parts of the developing world. Furthermore, these investments likely reduce risks from lower fuel demand in carbon-constrained scenarios. However, there will likely also be opportunities for divestment as shareholders and activists push downstream companies to high-grade their portfolios by spinning off or selling lower-performing assets (such as small-scale retail).
2020 oil and gas M&A outlook | Bigger deals, fewer transactions
17
2019 deal value held up even as volumes slid, thanks to a number of mega-deals, primarily in upstream and downstream. In the five years following the oil price downturn, there have been a number of large transactions that reshaped a number of companies, often with significant implications for certain geographies or subsectors (such as Shell, BG, and LNG). One-off deals are hard to predict by their very nature, even as rumors and speculations abound. Looking at the 2019 M&A market; the current appetite for dealmaking; and the outlook for commodity prices, trade, and economic growth, we have identified five key trends that could shape the oil and gas transactions market in 2020 and beyond.
Exit stage left
In 2019, the Majors divested a wide swath of assets across a range of geographies and resource types. This was not new to this year, as assets sales began in earnest at the beginning of the downturn. The pace may slow down, but there remain opportunities for further portfolio streamlining, with some potentially large assets in play. For example, BP is ahead of schedule for its 2019 divestment plan after its acquisition of BHP Billiton’s US onshore for $10.5 billion and after selling its Alaska position and its Oklahoma SWOOP acreage, but its other legacy acreage remains, so there could be further divestitures in 2020.31 Outside of BP, Shell divested partial interest in its Caesar-Tonga field to Equinor for $965 million in May.32
It’s not just the Majors, and it’s not just in the United States. Several companies have exited their legacy North Sea assets. While the deal flow is likely to slow as the region runs out of legacy players with mature assets that they are looking to sell, we should continue to see transaction in 2020 (albeit much less than the $10+ billion of North Sea sales in 2019). Beyond that, both ConocoPhillips and Murphy sold large Asia Pacific assets in 2019 and could be looking to pare down their global footprint further. Furthermore, we should expect large-scale sales from companies like Petrobras who have both significant exploration and development opportunities, as well as legacy asset bases ranging from upstream to downstream. In Petrobras’s case, it increased its divestment plan to $20–30 billion through 2024, including four refineries that went up for bid in late 2019.33, 34
Headline 2018 and 2019 mergers could also contribute to divestitures as strategic decisions are made on the focus of portfolios. From that perspective, there are several companies likely to be active in the next year. For example, even with Oxy’s $8.8 billion sale of its (formerly Anadarko) assets to Total and its $1.5 Permian joint venture with Ecopetrol,35 there could be other opportunities for it to realign its portfolio as its strategy evolves. Increased rate of divestments to generate cash could go hand in hand with prioritizing projects in its expanded footprints in West Texas, Colorado, and the Gulf of Mexico.36
Five trends that could shape 2020 M&A

2020 oil and gas M&A outlook | Bigger deals, fewer transactions
18
Big oil is looking for greener pastures
It is hardly a secret that the Majors have increased their investment in renewables and power markets. Since 2011, the Majors have spent more than $5 billion on alternative investments, and that trend looks likely to continue.37 What is new is that some companies are looking at their existing assets and considering carbon emission when it comes to divestitures. For example, BP stated that it plans to sell projects to reduce its emissions. In fact, the company noted that the massive sale of its Alaska assets had lowered the company’s carbon footprint.38 Many other Majors and larger independents have their own health, safety, and environmental management processes and goals as well, which often include carbon considerations. We could see more of these types of sales in the near future—if not in 2020, certainly in the following years.
Getting greener through portfolio cleanup is not just altruistic. Oil and gas companies across the value chain have several financial incentives to diversify their assets, ranging from satisfying stakeholder and regulatory scrutiny to mitigating long-term demand risks. Some of the largest investors and asset managers have pushed to prioritize climate and the environment.39 As investor sentiment has changed, many oil companies have increased their discussion of environmental, social, and governance (ESG) issues.40 That is not all that surprising, considering that eight of the 10 largest US sustainable funds invest in oil and gas companies.41 While these green funds are a small part of the market, they have grown quickly—38 percent year-on-year in the United States.42 As the size of ESG funds grows, so too could oil and gas companies’ interests in burnishing their environmental credentials. To that end, we will likely see not only renewables investment, but also carbon-based divestures.
IOCs and NOCs moving onward and downward
Integrated oil companies (IOCs), including the Majors and national oil companies (NOCs), have continued to move further downstream and expand beyond refining assets into distribution, retail, and chemicals businesses. The investment push has primarily targeted integrated refining and petrochemical assets, as well as fuel and natural gas networks in the Middle East and Asia Pacific. Outside of Saudi Aramco’s headline deals in Saudi Arabia and India, BP spent $990 million on a retail venture with Reliance, and Total acquired large stake in Adani Gas for $870 million, both deals in India. Part of this is due to margin pressure (opportunities to invest in higher-value-added projects); part of it is a growth play (sales in large, rapidly growing countries).
Due to sheer size of the transactions and the limited number of potential buyers, the number of deals we could see in 2020 is limited, but they could have an outsized impact on both the downstream sector and Asia Pacific more broadly, as the incentive to invest remains strong in the region. Nine of the 15 fastest-growing economies in 2019 were in Asia, and the two largest developing economies, China and India, are expected to sustain strong fuels and chemicals growth even as their growth slows.43 The global economic center continues to move eastward.

2020 oil and gas M&A outlook | Bigger deals, fewer transactions
19
US shale has started circling the wagons
Headlines coming out of major shale basins have been mixed in 2019, with concerns over cash flow, renewed focus on capital discipline, and lowered production outlooks.44 In reaction to these trends, US upstream and OFS companies have begun to circle the wagons. This year alone, we have seen significant consolidation, with Callon acquiring Carrizo for $2.7 billion (Delaware and Eagle Ford Basins), Parsley acquiring Jagged Peak for $2.3 billion (Delaware Basin), and Citizen Energy acquiring Roan Resources for $1 billion (SCOOP/STACK), among others. OFS has been less active, but Keane joined with C&J Energy Services in a merger of equals. The $724 million transaction was announced in June, and following the deal’s close in October, the combined company was renamed NexTier Oilfield Solutions. That is a good start.
However, 2020 could see more interest in consolidation as the capital markets refuse to thaw and topline US production growth goes from meteoric to modest. Mergers can bring economies of scale and scope, as well as more efficiently allocate spend across a larger, consolidated portfolio of shale assets, as opposed to the patchwork more common in the oil patch today. The independents are not the only ones to watch, as the Majors have indicated that their appetite for shale assets remains if the price is right.45 If the shale industry remains stressed, it probably will be. This likely means sellers and management teams need to be willing to forgo significant premiums to get the deals done in order to achieve the synergies and economies of scale that form the strategic basis for executing the deal, which may make stock more valuable as currency.
Private equity is back at the drawing board
Traditional US oil and gas private equity strategy typically involved investing (relatively) early in a shale play, proving up the acreage and holding by production, and making a few bolt-on acquisitions with the goal to IPO or sell to a larger company five or so years after the initial investment. With the oil and gas IPO market dead in the water and debt issuance trending monotonically downward since 2014, private equity firms and their portfolio companies are rethinking that strategy. 2020 may be the year when the build-to-operate model fully takes flight in the Permian and beyond.
What could the impacts be? For one, this should play well with the consolidation-oriented mindset we have been seeing in shale this year, increasing deal discussions and potentially narrowing the bid-ask spread. Two, there should be an increase in PE-to-PE deals as they focus on reducing portfolio overhead and creating economies of scale. Three, we might see management teams grow rather than shrink, as operating assets and marketing production will likely require a broader skill set than the original build-to-sell strategy. Like other companies, PE-backed producers have had to tack in the face of strong headwinds.
This trend could have knock-on effects for the funds as their portfolio companies become tied-up in longer-term strategies and exit opportunities remain limited. Portfolio reshuffling and liquidity-driven transactions could play a role in 2020.

2020 oil and gas M&A outlook | Bigger deals, fewer transactions
20
2019 was a slow year for M&A activity, offset by a series of mega-deals. Absent a significant upward revision of production or price outlooks, 2020 likely holds much of the same. While the levels may be similar, the types of deals should evolve along with both the oil and gas markets, as well as companies’ underlying balance sheets. That should mean more divestitures by large companies, more purchases from smaller companies, and an overall realignment of portfolios to reflect 2020 as it will be, rather than what many had likely hoped for in 2014. That will, paradoxically, bring more diversification as many corners of the industry consolidate, as well as opportunities for big bets based on macro trends.
More of the same, but a little bit different
2020 oil and gas M&A outlook | Bigger deals, fewer transactions
21
Endnotes
1. The World Bank Group, Monthly commodity market outlook, November 2019, https://www.worldbank.org/en/research/commodity-markets, accessed December 2, 2019.
2. US Energy Information Administration, Short-term energy outlook, November 12, 2019, https://www.eia.gov/outlooks/steo, accessed December 2, 2019.
3. Jennifer Hiller and Scott DiSavino, “US oil and gas producers to slash spending for second straight year in 2020,” Reuters, November 15, 2019, https://www.reuters.com/article/usa-shale-spending/rpt-u-s-oil-and-gas-producers-to-slash-spending-for-second-straight-year-in-2020-idUSL2N27V09U, accessed December 2, 2019.
4. David Wethe and Kevin Crowley, “Fracking slowdown in Permian Basin leads to more job losses,” Bloomberg, December 2, 2019, https://www.bloomberg.com/news/articles/2019-12-02/fracking-slowdown-in-permian-basin-leads-to-more-job-losses, accessed December 2, 2019.
5. Jeff Baron, “In late January, Gulf Coast gasoline crack spreads reached their lowest levels since 2014,” US Energy Information Administration, March 5, 2019, https://www.eia.gov/todayinenergy/detail.php?id=38552, accessed December 2, 2019.
6. The World Bank Group, Monthly commodity market outlook, November 2019, https://www.worldbank.org/en/research/commodity-markets, accessed December 2, 2019.
7. S&P Capital IQ database, https://dupress.deloitte.com/dup-us-en/snp-global-market-intelligence-disclosure-notice.html,accessed January 3. 2019.
8. Simon Flowers, “Private equity – big buyers of oil and gas in the downturn,” Wood Mackenzie, November 12, 2019, https://www.woodmac.com/news/the-edge/private-equity--big-buyers-of-oil-and-gas-in-the-downturn/, accessed January 10, 2020.
9. Enverus M&A transaction data, accessed January 14, 2020.
10. Ibid.
11. Ibid.
12. Ibid.
13. Ibid.
14. Ibid.
15. Ibid.
16. Ibid.
17. Duane Dickson, Alex Fleming, and Thomas Shattuck, “Down but not out: Transforming oilfield services,” Deloitte Insights, December 16, 2019, https://www2.deloitte.com/us/en/insights/industry/oil-and-gas/oilfield-services-companies-performance-operating-models.html, accessed December 18, 2019.
18. Enverus M&A transaction data, accessed January 14, 2020.
19. Duane Dickson, Alex Fleming, and Thomas Shattuck, “Down but not out: Transforming oilfield services.”
20. Enverus M&A transaction data, accessed January 14, 2020.
21. Ibid.
22. Ibid.
23. Ibid.
24. Ibid.
25. Ibid.
26. Ibid.
27. Ibid.
28. Dahlia Nehme and Maha El Dahan, “ADNOC seals $5.8 billion refining and trading deal with ENI, OMV,” Reuters, January 27, 2019, https://in.reuters.com/article/emirates-oil-adnoc/adnoc-seals-5-8-billion-refining-and-trading-deal-with-eni-omv-idINKCN1PL0BB, accessed December 4, 2019.
29. Enverus M&A transaction data, accessed January 14, 2020.
30. UGI Corporation, “UGI to Acquire 100% of the Publicly Held Units of AmeriGas Partners, L.P.,” Business Wire, April 2, 2019, https://www.businesswire.com/news/home/20190402005527/en/UGI-Acquire-100-Publicly-Held-Units-AmeriGas, accessed December 4, 2019.
31. Mohit Singh, “Transformation of the BPX Energy Portfolio,” BP, February 27, 2019, https://www.spegcs.org/media/files/files/9a93d18e/mohit-singh-bpx-energy-spe-bd-feb-27-vfinal.pdf, accessed December 5, 2019.
32. Enverus M&A transaction data, accessed January 14, 2020.
33. Wood Mackenzie, “Strategy update: Petrobras' 2020-2024 strategic plan,” December 6, 2019, accessed December 12, 2019.
34. Tatiana Bautzer and Carolina Mandl, “Brazil, China, UAE firms in second round of bids for Petorbras refineries,” Nasdaq, November 29, 2019, https://www.nasdaq.com/articles/exclusive-brazil-china-uae-firms-in-second-round-of-bids-for-petrobras-refineries-sources, accessed January 10, 2020.
35. Ibid.
36. Oxy, “Acquisitions and dispositions,” https://www.oxy.com/investors/Profile/Pages/Acquisitions-and-Dispositions.aspx, accessed December 5, 2019.
37. Wood Mackenzie, “Oil and gas Majors’ power sector investments a signpost for the utility of the future,” January 14, 2019, https://my.woodmac.com/reports/power-markets-oil-and-gas-majors-power-sector-investments-a-signpost-for-the-utility-of-the-future-94271?contentId=94271, accessed December 5, 2019.
38. Kelly Gilblom, “BP CEO says he’ll sell oil projects to meet climate targets,” Anchorage Daily News, September 12, 2019, https://www.adn.com/business-economy/energy/2019/09/12/bp-ceo-says-hell-sell-oil-projects-to-meet-climate-targets, accessed December 5, 2019.
39. Larry Fink, “A fundamental reshaping of finance,” BlackRock, https://www.blackrock.com/us/individual/larry-fink-ceo-letter, accessed January 15, 2020.
40. Karen Langley, “More companies are making noise about ESG,” Wall Street Journal, September 23, 2019, https://www.wsj.com/articles/more-companies-are-making-noise-about-esg-11569263634, accessed December 5, 2019.
41. Akane Otani, “ESG funds enjoy record inflows, still back big oil and gas,” Wall Street Journal, November 11, 2019, https://www.wsj.com/articles/top-esg-funds-are-all-still-invested-in-oil-and-gas-companies-11573468200, accessed December 5, 2019.
42. Mark Miller, “Bit by bit, socially conscious investors are influencing 401(k)’s,” New York Times, September 27, 2019, https://www.nytimes.com/2019/09/27/business/esg-401k-investing-retirement.html, accessed December 5, 2019.
43. Focus Economics, “The world’s fastest growing economies,” March 19, 2019, https://www.focus-economics.com/blog/fastest-growing-economies-in-the-world, accessed December 5, 2019.
44. Christopher Matthews, “Fracking buzzwords evolve, from ‘ram up’ to ‘capital discipline,’” Wall Street Journal, September 9, 2019, https://www.wsj.com/articles/frackers-change-their-tune-focus-on-discipline-11568034098, accessed December 5, 2019.
45. Jennifer Hiller, “Exxon, Chevron see consolidation in top US shale field,” Reuters, September 4, 2019, https://www.reuters.com/article/us-exxon-mobil-chevron-shale/exxon-chevron-see-consolidation-in-top-u-s-shale-field-idUSKCN1VP1VN, accessed December 5, 2019.

2020 oil and gas M&A outlook | Bigger deals, fewer transactions
22
Let’s talk
Key Global Contacts
Rajeev Chopra Energy & Resources Global Industry Leader Deloitte Touche Tohmatsu [email protected] +44 20 7007 2933
Duane Dickson Global Energy, Resources & Industrials Consulting Leader Vice Chairman, US Oil, Gas & Chemicals Sector Leader Deloitte Consulting LLP [email protected] +1 203 905 2633
Dan Schweller Deloitte Financial Advisory Global Energy, Resources & Industrials Industry Leader Deloitte & Touche LLP [email protected] +1 312 486 2783
Andrew Botterill Deloitte Financial Advisory Global Oil, Gas & Chemicals Sector Leader National Oil & Gas Leader Deloitte Canada [email protected] +14036483239
Jonathan Hughes Partner Deloitte LLP [email protected] +44 20 7007 1980
Jamie Avey Partner Deloitte Canada [email protected] +14035031353
Primary Authors
Thomas Shattuck Manager Center for Energy & Industrials Deloitte Services LP [email protected] +1 713 982 4715
Vivek Bansal Senior Analyst Market Development Deloitte Support Services Private Limited [email protected] +1 615 718 1690
Kate Hardin Executive DirectorCenter for Energy & Industrials Deloitte Services [email protected] +1 469 858 1112
Melinda Yee Partner Deloitte & Touche LLP [email protected] +1 713 982 4402

2020 oil and gas M&A outlook | Bigger deals, fewer transactions
23
Key contributors
Jeff Kennedy, Principal, M&A Valuation & Modeling, Deloitte Transactions and Business Analytics LLP Chad Lackey, Manager, M&A Transaction Advisory Services, Deloitte & Touche LLPChris de Lavigne, Executive Director, M&A Transaction Services, Deloitte & Touche FASBreno Medeiros, Specialist, Energy, Resources & Industrials, Deloitte Consultores
Africa China
Claude Illy Africa Financial Advisory Oil, Gas & Chemicals Leader Deloitte Capital (Pty) Ltd [email protected] +27 11 209 6792
Ivan Wong China Financial Advisory Oil, Gas & Chemicals Leader Deloitte & Touche Corporate Finance Limited [email protected] +85 22 8521219
Middle East
Adnan Fazli Middle East Financial Advisory Energy, Resources & Industrials Leader Deloitte Professional Services (DIFC) Limited [email protected] +971 4 506 4911
US
Brian Boufarah Partner, M&A Transaction Advisory Services Deloitte & Touche LLP [email protected] +1 212 436 6997
Phil Hueber US M&A Transaction Services Oil, Gas & Chemicals Leader Deloitte & Touche LLP [email protected] +1 312 486 5791
Jason Spann Partner, M&A Tax Deloitte Tax LLP [email protected] +1 713 982 4879
Mark Pighini US Oil, Gas and Chemicals sector leader Risk & Financial Advisory Deloitte & Touche LLP [email protected] +1 404 220 1983

2020 oil and gas M&A outlook | Bigger deals, fewer transactions
24


This publication contains general information only and Deloitte is not, by means of this publication, rendering accounting, business, financial, investment, legal, tax, or other professional advice or services. This publication is not a substitute for such professional advice or services, nor should it be used as a basis for any decision or action that may affect your business. Before making any decision or taking any action that may affect your business, you should consult a qualified professional advisor. Deloitte shall not be responsible for any loss sustained by any person who relies on this publication.
About DeloitteDeloitte refers to one or more of Deloitte Touch Tohmatsu Limited, a private UK company limited by guarantee (“DTTL”), its network of member firms, and their related entities. DTTL and each of its member firms are legally separate and independent entities. DTTL (also referred to as “Deloitte Global”) does not provide services to clients. In the United States, Deloitte refers to one or more of the US member firms of DTTL, their related entities that operate using the “Deloitte” name in the United States, and their respective affiliates. Certain services may not be available to attest clients under the rules and regulations of public accounting. Please see www.deloitte.com/about to learn more about our global network of firms.
Copyright 2020 Deloitte Development LLC. All rights reserved.