2020 preliminary results - london stock exchange group
TRANSCRIPT

2020 Preliminary results5 March 2021

Welcome
▪ Introduction – David Schwimmer, CEO
▪ Financial Performance FY2020 – Anna Manz, CFO
▪ LSEG – The Path Forward – David Schwimmer
▪ Q&A

A leading financial markets infrastructure and data provider
3
▪ Delivered a strong 2020 performance against a challenging market backdrop
▪ Strong operational resilience – successfully navigating through Covid-19 and Brexit
▪ Completion of the Refinitiv transaction following successful navigation of highly
complex approvals process
▪ Increasingly compelling strategic rationale – a transformational transaction
▪ Executing on integration programme – work so far confirms the quality of the business
and the extent of the opportunities across the Group
▪ Group well-positioned across the financial markets value chain – further connection of
Group’s divisions will deliver increased value
▪ Strong industry trends and LSEG competitive advantages provide strong shareholder
value proposition
▪ Confidence in delivery of financial targets

Financial Performance FY2020
Anna Manz, CFO

5
£2,444mTotal Income
6%
£2,220mGross profit
6%
£887mUnderlying Operating
Expenses
6%
£1,329mAdj. EBITDA
5%
209.7pAdj. EPS
5%
75.0pFull-year dividend
7%
Strong financial performance despite challenging market backdrop
Overview of FY2020
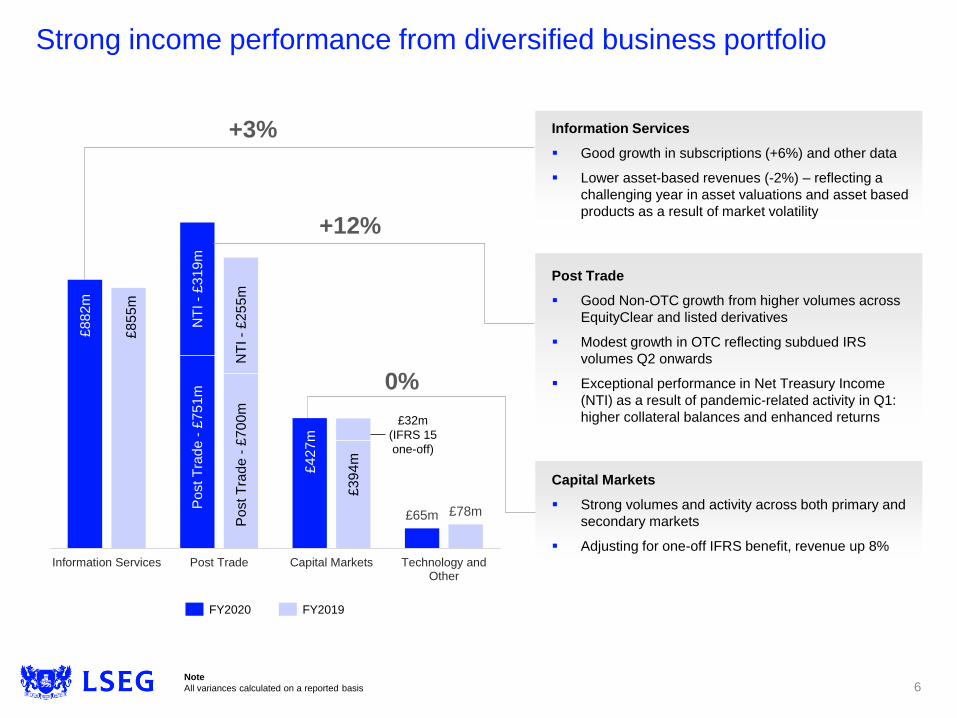
Strong income performance from diversified business portfolio
6
£65m £78m
Information Services Post Trade Capital Markets Technology andOther
+3%
+12%
0%
Po
st T
rad
e -
£7
00
m
Po
st T
rad
e -
£7
51
m
NT
I -
£2
55
m
NT
I -
£3
19
m
Information Services
▪ Good growth in subscriptions (+6%) and other data
▪ Lower asset-based revenues (-2%) – reflecting a
challenging year in asset valuations and asset based
products as a result of market volatility
Post Trade
▪ Good Non-OTC growth from higher volumes across
EquityClear and listed derivatives
▪ Modest growth in OTC reflecting subdued IRS
volumes Q2 onwards
▪ Exceptional performance in Net Treasury Income
(NTI) as a result of pandemic-related activity in Q1:
higher collateral balances and enhanced returns
Capital Markets
▪ Strong volumes and activity across both primary and
secondary markets
▪ Adjusting for one-off IFRS benefit, revenue up 8%
£8
82
m
£8
55
m
£4
27
m
£3
94
m
£32m
(IFRS 15
one-off)
FY2020 FY2019
Note
All variances calculated on a reported basis

£2,314m
£2,287m
£2,444m
£5m
(£32m)
£58m
£99m
FY19 Actual FX effects IFRS 15 one-off FY19 Adjusted Exceptionalincome
Underlyingincome
FY20 Actual
Continued organic growth supplemented by strong NTI activity
7
7% growth (adjusted for
IFRS 15)
Good underlying growth
across all business lines
reflecting diversity of
revenues
Largely a result of NTI
(£48m) increase from
higher collateral
balances and enhanced
investment returns
Collateral balances now
returning to normalised
levels and investment
returns reflect a lower
rate environment
“Exceptional”
income gain as
a result of the
pandemic,
unlikely to
repeat in 2021
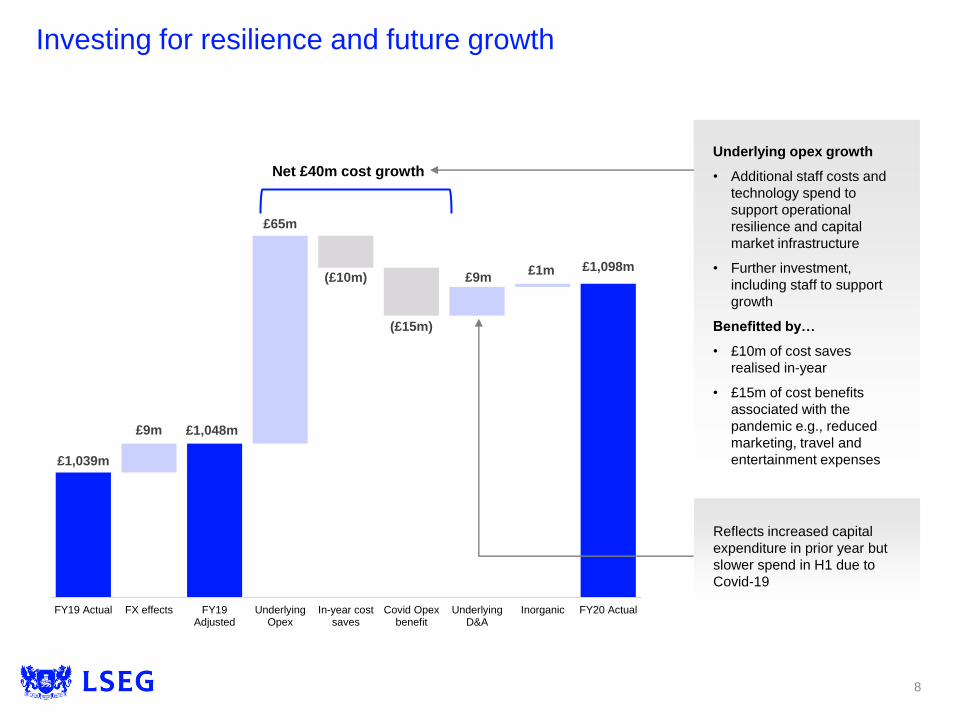
£1,039m
£1,048m
£1,098m
£9m
£65m
(£10m)
(£15m)
£9m£1m
FY19 Actual FX effects FY19Adjusted
UnderlyingOpex
In-year costsaves
Covid Opexbenefit
UnderlyingD&A
Inorganic FY20 Actual
Investing for resilience and future growth
8
Underlying opex growth
• Additional staff costs and
technology spend to
support operational
resilience and capital
market infrastructure
• Further investment,
including staff to support
growth
Benefitted by…
• £10m of cost saves
realised in-year
• £15m of cost benefits
associated with the
pandemic e.g., reduced
marketing, travel and
entertainment expenses
Net £40m cost growth
Reflects increased capital
expenditure in prior year but
slower spend in H1 due to
Covid-19
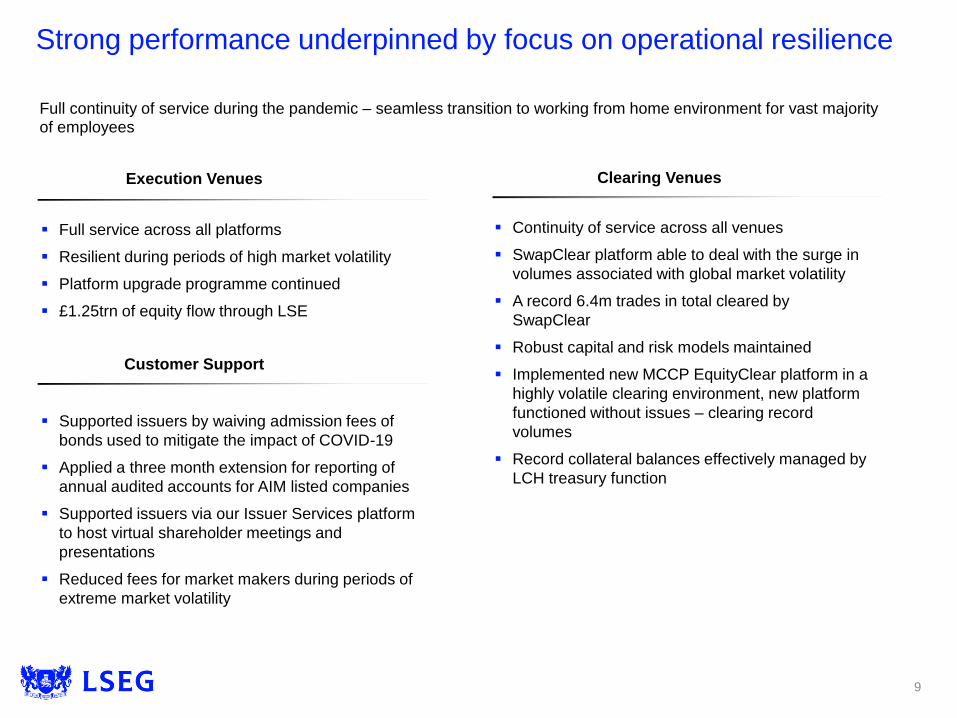
Strong performance underpinned by focus on operational resilience
9
Full continuity of service during the pandemic – seamless transition to working from home environment for vast majority of employees
▪ Full service across all platforms
▪ Resilient during periods of high market volatility
▪ Platform upgrade programme continued
▪ £1.25trn of equity flow through LSE
▪ Continuity of service across all venues
▪ SwapClear platform able to deal with the surge in
volumes associated with global market volatility
▪ A record 6.4m trades in total cleared by
SwapClear
▪ Robust capital and risk models maintained
▪ Implemented new MCCP EquityClear platform in a
highly volatile clearing environment, new platform
functioned without issues – clearing record
volumes
▪ Record collateral balances effectively managed by
LCH treasury function
▪ Supported issuers by waiving admission fees of
bonds used to mitigate the impact of COVID-19
▪ Applied a three month extension for reporting of
annual audited accounts for AIM listed companies
▪ Supported issuers via our Issuer Services platform
to host virtual shareholder meetings and
presentations
▪ Reduced fees for market makers during periods of
extreme market volatility
Execution Venues
Customer Support
Clearing Venues

Robust cash generation resulting in strong year-end financial position
10
Continued strong cash generation; investment activities as planned
Leverage as at 31 December 2020:
• 1.1x Net Debt / EBITDA(1)
Note
(1) Pro forma EBITDA as if acquisitions held for the complete year
(2) Investment activities includes purchase of property, plant and equipment, purchase of intangible assets
Total investment of £263m, of which £222m
capex
Investment for growth and efficiency:
• Enhancements to trading venues
• LCH MCCP – multi-asset clearing and risk
platform
• Index & Analytics – new products
Operational:
• Improved cyber security controls
• Resiliency upgrades across market operations
and technology
• Data centre consolidation
4
£1,283m
£472m
(£75m)
(£236m)
(£222m)
(£278m)
Cashgenerated
fromoperations
Net interest &royalties paid
Tax paid Investmentactivities
Dividends Free cashflow(2)

36.0%
39.8%
44.9%
2018 2019 2020
$5,739m$5,831m
$6,077m
2018 2019 2020
Note:
(1) Revenue excludes recoveries
(2) Adjusted EBITDA margin is calculated as a % of Refinitiv revenue excluding recoveries
(3) Refinitiv revenue includes recoveries
19%Asia Pacific
38%US
High proportion of recurring subscription-
based revenue
Diversified revenue across the globe
Good revenue growth and margin expansion, supported by the accelerated delivery of productivity programme and continued investment in business
Revenue(1) – good growth trajectory
Adjusted EBITDA margin(2) – improving efficiency
$6.1bn(1)
4%Other Americas
$6.5bn(3)15%UK
24%EMEA
$650m run-rate cost saving target achieved
80%Recurring
20%Non-recurring
11
Strong performance momentum at Refinitiv

`
`
`
CFO priorities going forward
12
Strong financial management – opportunities from integration for
process optimisation and value delivery from cost and scale efficiencies
Enable strategic change and development – through strong
performance-management focus
Integration execution – enable delivery on synergy targets and drive
additional benefits/returns from a fully integrated business
Capital allocation – to support transformation and value-creation
opportunities while managing de-leveraging plan
`

13
Consistent capital management framework
Organic Deployment:Pursue organic investment opportunities for growth,
efficiency and resilience
Inorganic Opportunities: Robust appraisal of inorganic opportunities to deliver
growth through ‘bolt-on’ / strategic M&A
Returns to Shareholders:Commitment to ordinary dividends and continue to
keep other options for capital returns under review
How we deploy capital Key factors that inform our capital
allocation decisions
Maintain our existing leverage target of 1.0-2.0x
Net Debt / EBITDA and manage credit rating, debt
profile, and regulatory requirements
Focus on meeting appropriate internal
hurdles for selected organic and inorganic
investment opportunities
Maintain a progressive ordinary dividend policy,
operating in a target 2.5-3.0x dividend cover range
Continued focus on deploying capital for selected organic and inorganic investments, and shareholder returns, while maintaining a prudent balance sheet.

Executing on our refinancing strategy
14
Note:
(1) The headline amount of £11.8bn includes one-off Refinitiv refinancing costs plus additional Refinitiv borrowings incurred to part finance
acquisition of GIACT, as at 31 January 2021
Longer-term refinancing
• Gross borrowings as at completion of
£12.4bn
• Existing LSEG debt remains in place
• New USD/EUR Term Loans arranged to
partially replace Bridge Facility.
• Monitoring market conditions for refinancing
as opportunity permits
• Group rated long term A3 with Stable Outlook
by Moody’s and long term A with S&P with
negative outlook
• Borsa Italiana proceeds to reduce debt by
c.£4bn
• Estimated Pro forma leverage at completion
>3.5x Net debt / EBITDA; taking into account
the proceeds from the divestment of Borsa
Italiana this would fall to <3.0x
RCF
£2.5bn
Bridge USD / EUR
£11.8bn1
Refinitiv
completionFuture state
c. £7.8bn
Apply Borsa
Italiana proceeds
Refinitiv debt
replaced by bridge
and other facilities
Interim financing converted to
longer-term debt and flexible
shorter-term financing
LSEG Bonds
Term Loans
Commercial Paper
Term Loans
Commercial Paper
LSEG Bond
Combination of
longer-term bonds
and commercial
paper
GBP / USD / EUR
£1.7bn
£8.0bn
£1.9bn
£0.2bn
Likely to stay in
place over the
longer term
+ drawn RCF
(£646m)
+ future drawn
RCF
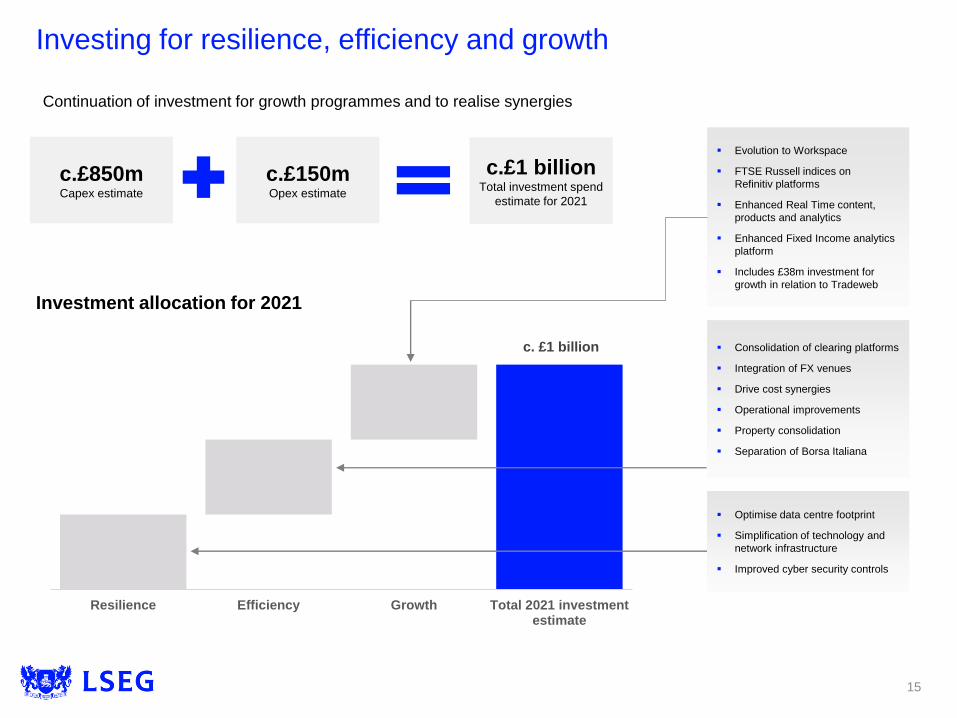
c. £1 billion
Resilience Efficiency Growth Total 2021 investmentestimate
Investing for resilience, efficiency and growth
15
Continuation of investment for growth programmes and to realise synergies
c.£1 billionTotal investment spend
estimate for 2021
c.£850mCapex estimate
c.£150mOpex estimate
Investment allocation for 2021
▪ Consolidation of clearing platforms
▪ Integration of FX venues
▪ Drive cost synergies
▪ Operational improvements
▪ Property consolidation
▪ Separation of Borsa Italiana
▪ Optimise data centre footprint
▪ Simplification of technology and
network infrastructure
▪ Improved cyber security controls
▪ Evolution to Workspace
▪ FTSE Russell indices on
Refinitiv platforms
▪ Enhanced Real Time content,
products and analytics
▪ Enhanced Fixed Income analytics
platform
▪ Includes £38m investment for
growth in relation to Tradeweb
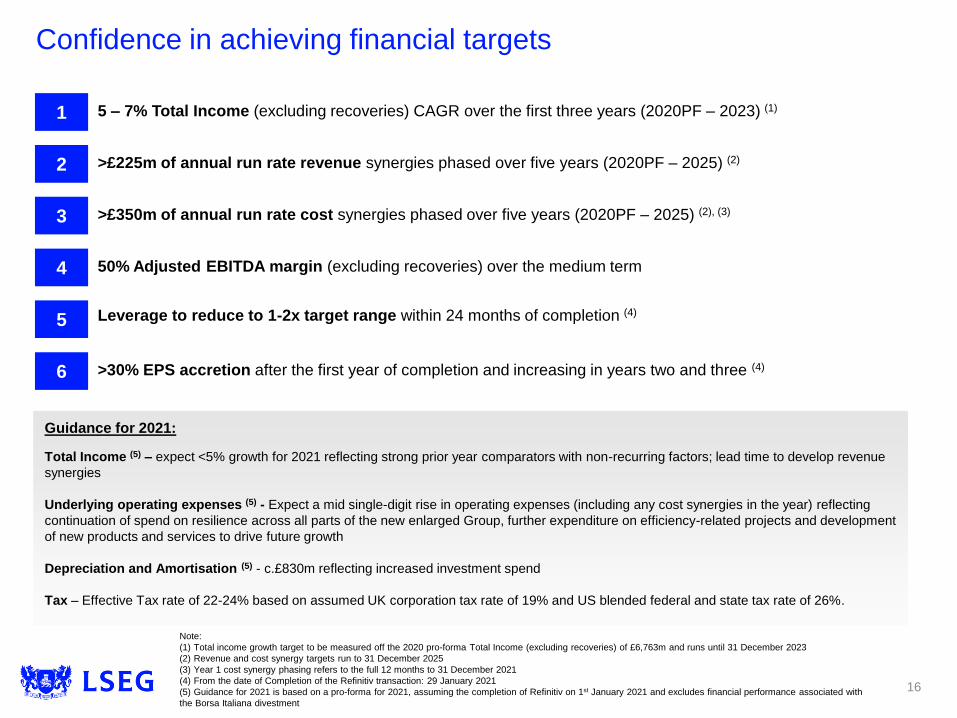
Confidence in achieving financial targets
1 5 – 7% Total Income (excluding recoveries) CAGR over the first three years (2020PF – 2023) (1)
>£225m of annual run rate revenue synergies phased over five years (2020PF – 2025) (2)
>£350m of annual run rate cost synergies phased over five years (2020PF – 2025) (2), (3)
50% Adjusted EBITDA margin (excluding recoveries) over the medium term
>30% EPS accretion after the first year of completion and increasing in years two and three (4)
Leverage to reduce to 1-2x target range within 24 months of completion (4)
Note:
(1) Total income growth target to be measured off the 2020 pro-forma Total Income (excluding recoveries) of £6,763m and runs until 31 December 2023
(2) Revenue and cost synergy targets run to 31 December 2025
(3) Year 1 cost synergy phasing refers to the full 12 months to 31 December 2021
(4) From the date of Completion of the Refinitiv transaction: 29 January 2021
(5) Guidance for 2021 is based on a pro-forma for 2021, assuming the completion of Refinitiv on 1st January 2021 and excludes financial performance associated with
the Borsa Italiana divestment
Guidance for 2021:
Total Income (5) – expect <5% growth for 2021 reflecting strong prior year comparators with non-recurring factors; lead time to develop revenue
synergies
Underlying operating expenses (5) - Expect a mid single-digit rise in operating expenses (including any cost synergies in the year) reflecting
continuation of spend on resilience across all parts of the new enlarged Group, further expenditure on efficiency-related projects and development
of new products and services to drive future growth
Depreciation and Amortisation (5) - c.£830m reflecting increased investment spend
Tax – Effective Tax rate of 22-24% based on assumed UK corporation tax rate of 19% and US blended federal and state tax rate of 26%.
2
3
4
5
6
16
Well positioned to create further value
▪ Strong LSEG and Refinitiv financial results in 2020
▪ Strong operational performance and focus on resilience
▪ Financial priorities are clear
▪ Investment continues for growth, efficiency and resilience
▪ Confidence in opportunities ahead for enlarged Group and delivering on
financial targets
17

LSEG – The Path Forward
David Schwimmer, CEO

A leading global financial markets infrastructure and data provider
19
▪ Increasingly compelling strategic rationale for the combination
▪ Core attributes to be a leading financial markets infrastructure business of the future:
Global footprint
Leading data and analytics capabilities
Multi-asset class coverage
▪ Many opportunities to deliver value through sustainable revenue growth, product
innovation, scale efficiencies and substantial synergies
▪ Strategic alignment to strong, long term market trends, diversified and highly
recurring revenue streams
▪ Supporting customers across the entire financial markets value chain
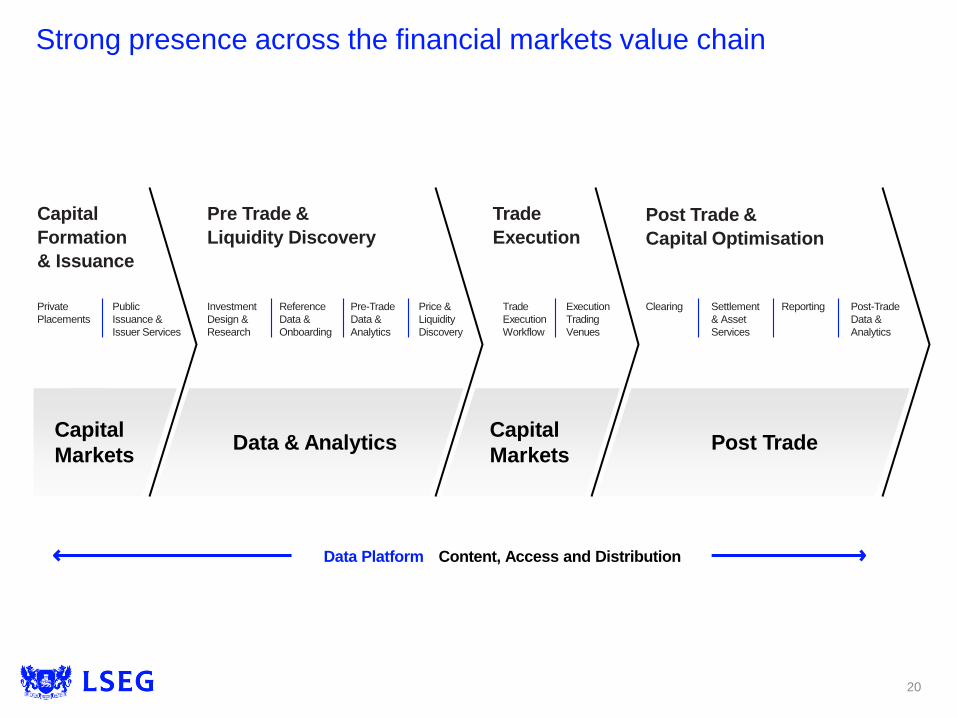
Strong presence across the financial markets value chain
20
Capital
Formation
& Issuance
Private
Placements
Public
Issuance &
Issuer Services
Pre Trade &
Liquidity Discovery
Investment
Design &
Research
Reference
Data &
Onboarding
Pre-Trade
Data &
Analytics
Price &
Liquidity
Discovery
Post Trade &
Capital Optimisation
Clearing Settlement
& Asset
Services
Reporting Post-Trade
Data &
Analytics
Trade
Execution
Trade
Execution
Workflow
Execution
Trading
Venues
Data & AnalyticsCapital
Markets
Capital
MarketsPost Trade
Data Platform Content, Access and Distribution

21
Mega-trends shaping the industry drive multiple opportunities
Demand for data
discovery and access
Demand for open and more
interoperable platforms
Adoption of cloud for compute
power and analytics
Role of AI / machine learning in
unlocking the value of data
Evolution of
sustainable markets
Continued growth in
sustainable investing and
financing, driven by regulatory
focus and investor demand
ESG criteria adopted into
portfolio and product strategies
Digitisation and the
customer experience
Increased focus on digitisation
and the digital customer
experience across banking,
wealth and asset management
Ability to diversify offerings
across new segments, markets
Growth of passive
investing
Growth in passive investment
strategies, AUM composition,
and increased demand for
passive instruments and
products
Demand for index solutions
of investment
professionals use ESG
factorsCFA Institute
Assets managed through
global index funds pushed
through the $10 trillion
barrier at the end of 2019Funds Europe
$10trn
Continued regulatory
change
Ongoing governance and
regulation of financial markets,
including demand for post trade
services to help manage
operational risk, regulatory risk
and capital requirements
Global multi-asset
connectivity
Increasing ability to trade and
invest across global markets,
driven by electronification
Growing demand across both
single and multi-asset
execution workflows
Growth of global
wealth
Growing influence of millennial
and gen-Z on global wealth
including emerging markets
Continued growth in self-
directed and retail activity –
catalysed by digital services
AuM in Multi-Asset
funds globally, expected
to grow at 8% CAGR
(2018 - 2023)BCG
$11trn
Continued focus on
cost and resiliency
Consistent fee pressures and a
focus on margin and costs
across banking communities
Critical importance of cyber
security and operational
resiliency
85%

Strong competitive advantages
22
Customer Partnership
Multi-asset class execution
and post trade venues
Global presence and multi-
channel distribution
Proprietary and extensive
content with added value
services packaged for
different customer groups
• Capabilities across Fixed income,
FX, Equities, ETFs and
Derivatives
• Simplified connectivity to multiple
venues further enhanced by
workflow integration
• Deep liquidity pools and access to
capital across asset classes
• Presence in 190 countries, across
400,000 end users
• Experience in the expansion of
global financial markets
capabilities
• Distribution across desktop /
feeds / cloud tailored to client
needs
• Leading data aggregation and
content management capabilities
• Tailored data, analytics, indices,
and IP tailored to different market
segments
• Value-add services across client
workflows – from informing
investment decisions through to
trade execution and post-trade
Open Access approach
Supported by

Supportive market trends and LSEG customer propositions creates strong shareholder value creation
Strongly positioned for growth and value creation
23
Well positioned to take
advantage of growing
industry trends
Significant scale and
positions in core segments
Diversified and highly
recurring revenue base
Scalable operating platform
Fully integrated, powerful
financial ecosystem
Strong value creation
Open Access approach
Customer Partnership
Multi-Asset class execution
and post trade Venues
Global presence and multi-
channel distribution
Proprietary and extensive
data, analytics and IP
Mega-trends shaping the industry LSEG competitive advantages
1
2
3
4
5
Digitisation and the customer
experience
Evolution of sustainable
markets
Demand for data discovery
and access
Growth in passive investing
Continued regulatory change
Global multi-asset class
connectivity
Growth of global wealth
Continued focus on cost and
resiliency

LSEG’s competitive positioning and supportive market trends creates strong long-term value opportunities for shareholders
Strong value proposition
24
Diversified and highly recurring
revenue base
>70% recurring revenues with
established customer base and
strong cash generation
Transaction based revenues provide
upside during market volatility
Diversified geographic mix with
strong position in Europe, US and
emerging markets
Significant scale and
positions in core segments
#2 financial market data provider, #1
provider of direct data feeds
Leading provider of ESG data
Leading position in equities, fixed
income and FX execution venues
#1 provider of clearing services in
rates and FX
Well positioned to take
advantage of growing
industry trends
Increasing use of data in the
investment decisioning process
Increasingly global nature of
trading across borders
Accelerating adoption of electronic
and algorithmic trading employing
multi-asset strategies
Scalable operating platform
Ability to develop and distribute new
products at scale
Ongoing investment for growth
programmes across both businesses
Large scale efficiency programmes
launched as part of the integration
Fully integrated, powerful
financial ecosystem
Coverage across the financial
markets value chain – a seamless
offering
Benefits of connectivity across data
platform, trading and clearing venues
Over 150,000 data sources and
10,000 data partners
1 2 3
4 5
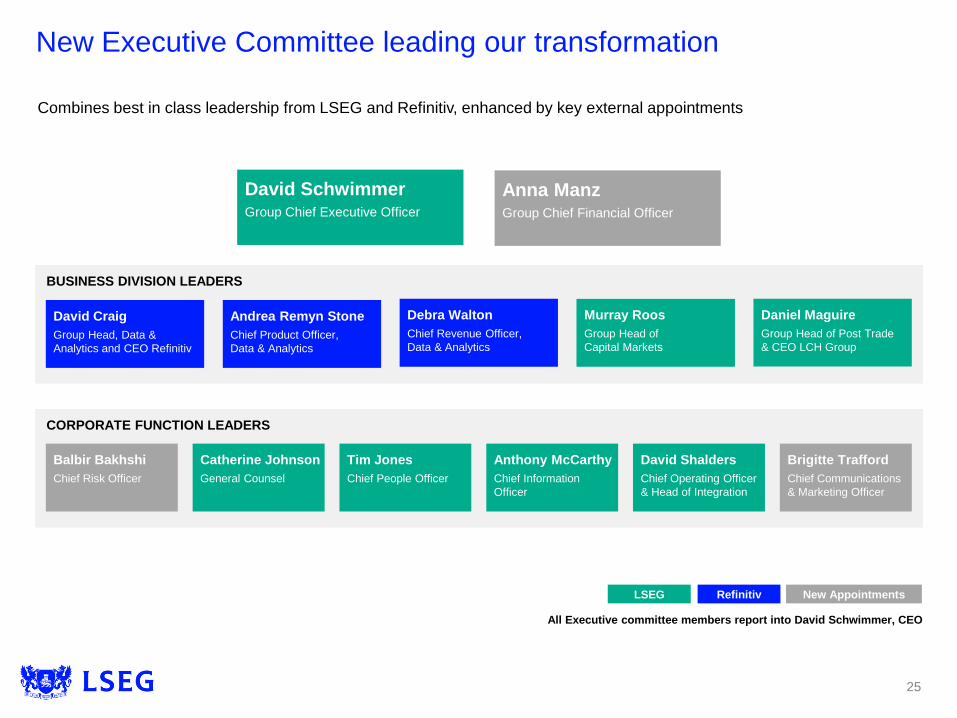
CORPORATE FUNCTION LEADERS
BUSINESS DIVISION LEADERS
David SchwimmerGroup Chief Executive Officer
David Craig
Group Head, Data &
Analytics and CEO Refinitiv
Murray Roos
Group Head of
Capital Markets
Andrea Remyn Stone
Chief Product Officer,
Data & Analytics
Debra Walton
Chief Revenue Officer,
Data & Analytics
Anthony McCarthy
Chief Information
Officer
David Shalders
Chief Operating Officer
& Head of Integration
Tim Jones
Chief People Officer
Brigitte Trafford
Chief Communications
& Marketing Officer
Catherine Johnson
General Counsel
Daniel Maguire
Group Head of Post Trade
& CEO LCH Group
Balbir Bakhshi
Chief Risk Officer
Anna ManzGroup Chief Financial Officer
Combines best in class leadership from LSEG and Refinitiv, enhanced by key external appointments
LSEG Refinitiv New Appointments
All Executive committee members report into David Schwimmer, CEO
25
New Executive Committee leading our transformation

Data & Analytics Post TradeCapital Markets
• Collects, aggregates and manages
huge breadth and depth of financial,
company, economic and other market
data content
• Provides enriched data, analytics,
indices, tools and workflow
• Delivered via multiple distribution
channels such as API, data feeds,
cloud and desktop solutions
• Tailored data and analytics packaged
for specific customer segments
• Provides world-class clearing, bilateral
services and regulatory reporting
services to support clients’ risk and
balance sheet management,
regulatory reporting and capital
efficiency
• Effective management of cash
collateral contained in the margin and
collateral funds
• Provides access to capital for
domestic and international participants
• Leading electronic platforms for
trading of equities, FX and fixed
income products
• Combines LSEG’s Capital Markets
division with Refinitiv’s FX platforms
and Tradeweb
69%Total Revenue
contribution (1)
£4.7bnTotal Revenue (1)
Note:
(1) Based on 2020 pro-forma of the combined company which includes LSEG total income and Refinitiv total revenue, excluding recoveries and
revenues associated with the Borsa Italiana divestment. All 2020 pro-forma information is unaudited
(2) Post Trade revenue includes net treasury income
17%Total Revenue
contribution (1)
£1.2bnTotal Revenue (1)
14%Total Revenue
contribution (1) (2)
£0.9bnTotal Revenue (1) (2)
1 2 3
Three core businesses across the financial markets value chain
26
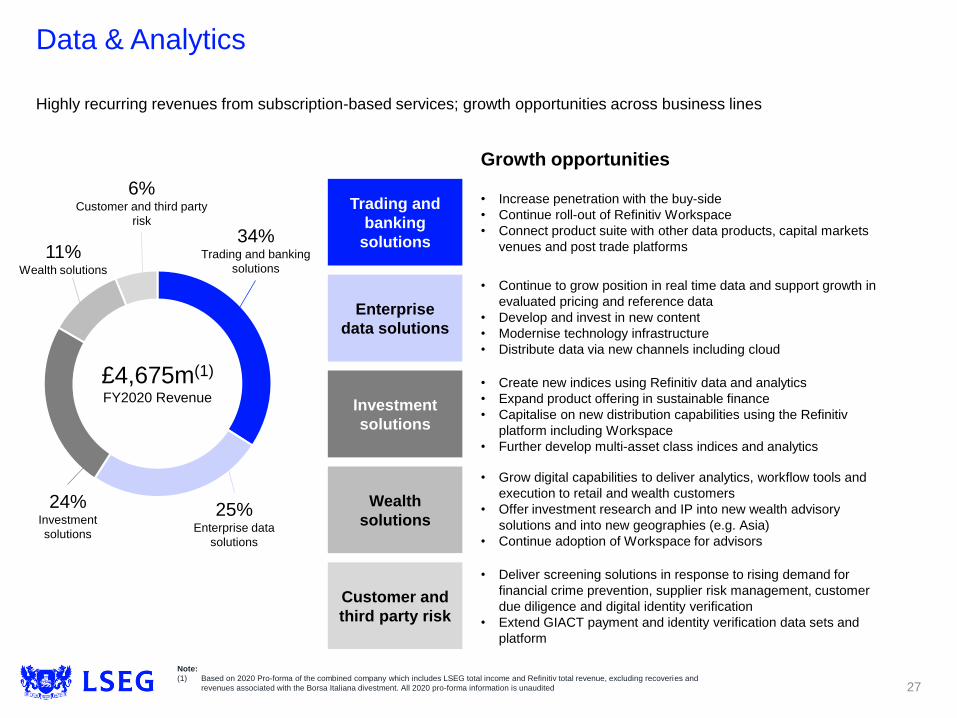
Data & Analytics
27
Highly recurring revenues from subscription-based services; growth opportunities across business lines
25%Enterprise data
solutions
34%Trading and banking
solutions
6%Customer and third party
risk
Trading and
banking
solutions
Investment
solutions
Wealth
solutions
Customer and
third party risk
Enterprise
data solutions
• Increase penetration with the buy-side
• Continue roll-out of Refinitiv Workspace
• Connect product suite with other data products, capital markets
venues and post trade platforms
Growth opportunities
• Create new indices using Refinitiv data and analytics
• Expand product offering in sustainable finance
• Capitalise on new distribution capabilities using the Refinitiv
platform including Workspace
• Further develop multi-asset class indices and analytics
• Grow digital capabilities to deliver analytics, workflow tools and
execution to retail and wealth customers
• Offer investment research and IP into new wealth advisory
solutions and into new geographies (e.g. Asia)
• Continue adoption of Workspace for advisors
• Deliver screening solutions in response to rising demand for
financial crime prevention, supplier risk management, customer
due diligence and digital identity verification
• Extend GIACT payment and identity verification data sets and
platform
• Continue to grow position in real time data and support growth in
evaluated pricing and reference data
• Develop and invest in new content
• Modernise technology infrastructure
• Distribute data via new channels including cloud
£4,675m(1)
FY2020 Revenue
Note:
(1) Based on 2020 Pro-forma of the combined company which includes LSEG total income and Refinitiv total revenue, excluding recoveries and
revenues associated with the Borsa Italiana divestment. All 2020 pro-forma information is unaudited
24%Investment
solutions
11%Wealth solutions
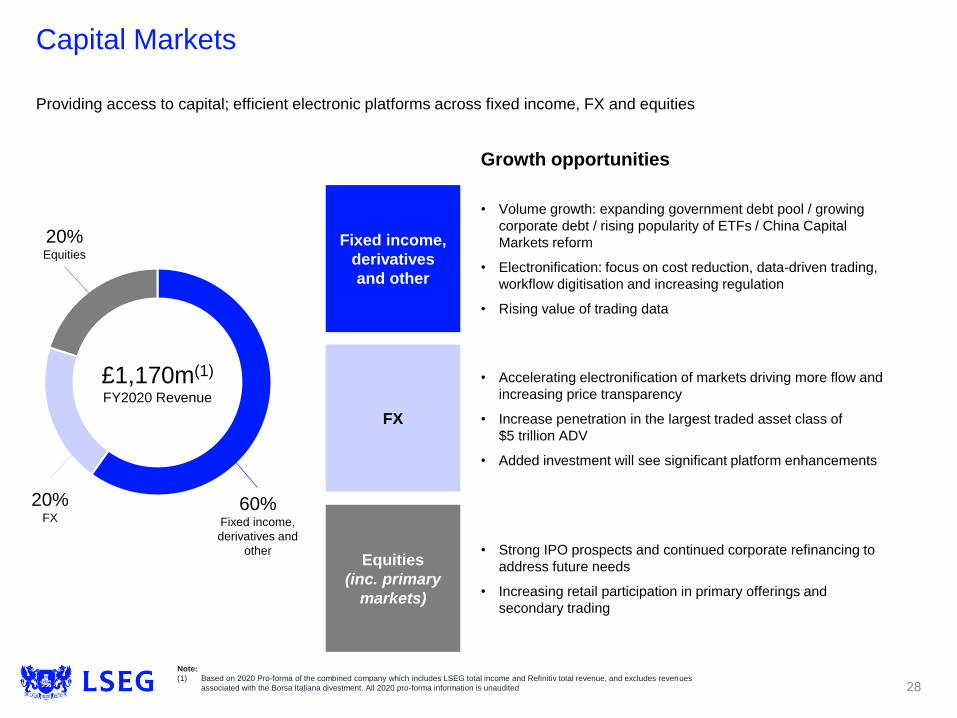
Capital Markets
Providing access to capital; efficient electronic platforms across fixed income, FX and equities
20%Equities
Equities
(inc. primary
markets)
FX
Fixed income,
derivatives
and other
• Strong IPO prospects and continued corporate refinancing to
address future needs
• Increasing retail participation in primary offerings and
secondary trading
Growth opportunities
• Accelerating electronification of markets driving more flow and
increasing price transparency
• Increase penetration in the largest traded asset class of
$5 trillion ADV
• Added investment will see significant platform enhancements
• Volume growth: expanding government debt pool / growing
corporate debt / rising popularity of ETFs / China Capital
Markets reform
• Electronification: focus on cost reduction, data-driven trading,
workflow digitisation and increasing regulation
• Rising value of trading data
£1,170m(1)
FY2020 Revenue
20%FX
60%Fixed income,
derivatives and
other
Note:
(1) Based on 2020 Pro-forma of the combined company which includes LSEG total income and Refinitiv total revenue, and excludes revenues
associated with the Borsa Italiana divestment. All 2020 pro-forma information is unaudited 28
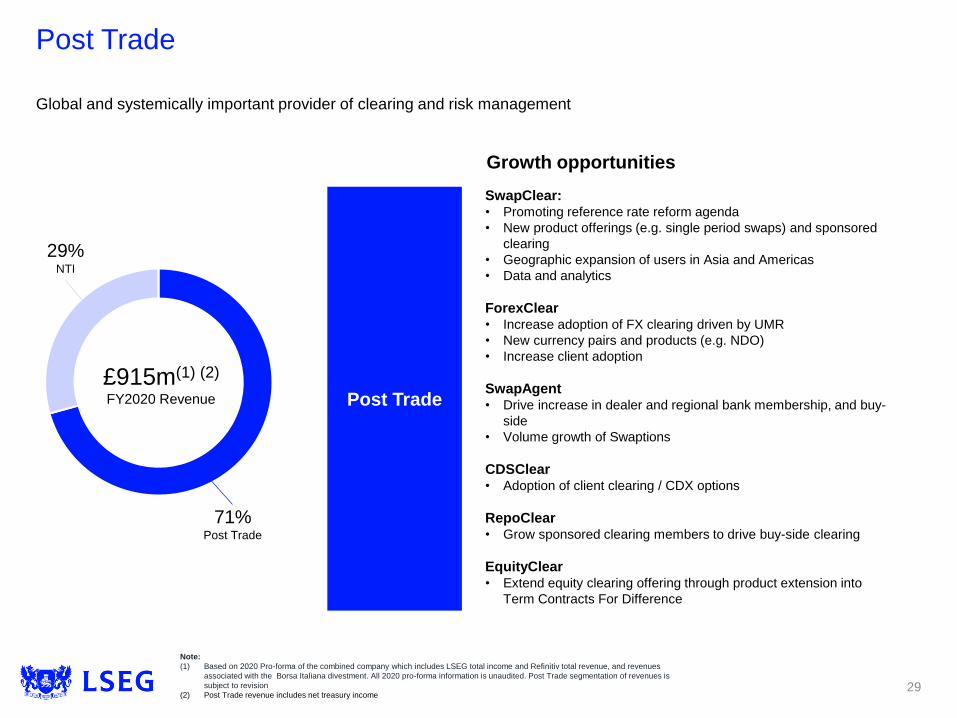
Post Trade
29
Growth opportunities
Note:
(1) Based on 2020 Pro-forma of the combined company which includes LSEG total income and Refinitiv total revenue, and revenues
associated with the Borsa Italiana divestment. All 2020 pro-forma information is unaudited. Post Trade segmentation of revenues is
subject to revision
(2) Post Trade revenue includes net treasury income
£915m(1) (2)
FY2020 Revenue
29%NTI
71%Post Trade
Post Trade
SwapClear:• Promoting reference rate reform agenda
• New product offerings (e.g. single period swaps) and sponsored
clearing
• Geographic expansion of users in Asia and Americas
• Data and analytics
ForexClear• Increase adoption of FX clearing driven by UMR
• New currency pairs and products (e.g. NDO)
• Increase client adoption
SwapAgent• Drive increase in dealer and regional bank membership, and buy-
side
• Volume growth of Swaptions
CDSClear• Adoption of client clearing / CDX options
RepoClear• Grow sponsored clearing members to drive buy-side clearing
EquityClear• Extend equity clearing offering through product extension into
Term Contracts For Difference
Global and systemically important provider of clearing and risk management
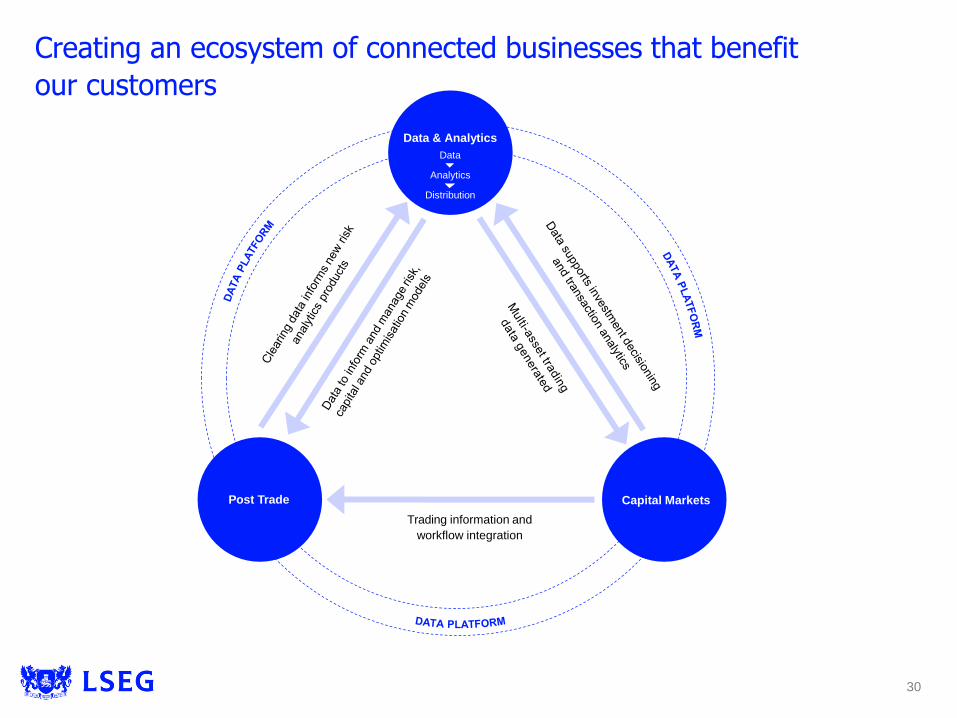
Creating an ecosystem of connected businesses that benefit
our customers
Post Trade
Trading information and
workflow integration
Capital Markets
Data & Analytics
Data
Analytics
Distribution
30

Integration priorities and milestones
Integration programme focused on delivery of £350m cost and £225m revenue run rate synergies
• Successful employee and customer Day 1 roll out - including launch of new LSEG brand and internet site
• Executing on organisation changes and investment programmes to deliver integration efficiencies
• Confident in achieving year 1 target - realising 25% run rate of cost benefits
Swift transition from integration planning to execution
Milestones for 2021
Revenue initiatives
Delayering and removing duplication in senior
management rolesCross-selling Refinitiv’s pricing and reference data
Consolidation of property to reduce footprint
and enable collaboration
Technology efficiencies from contract rationalisation with
our scale service providers e.g. run and development
services
Cost initiatives
New FTSE Russell product launches using Refinitiv’s
pricing and reference data
31

A leading financial markets infrastructure and data provider
▪ Increasingly compelling strategic rationale – a transformational transaction
▪ Executing on integration programme – work so far confirms the quality of the
business and the extent of the opportunities across the Group
▪ Group well-positioned across the financial markets value chain – further connection
of Group’s divisions will deliver increased value
▪ Strong industry trends and LSEG competitive advantages provide strong shareholder
value proposition
▪ Confidence in delivery of financial targets
32

Appendix

Group Sustainability
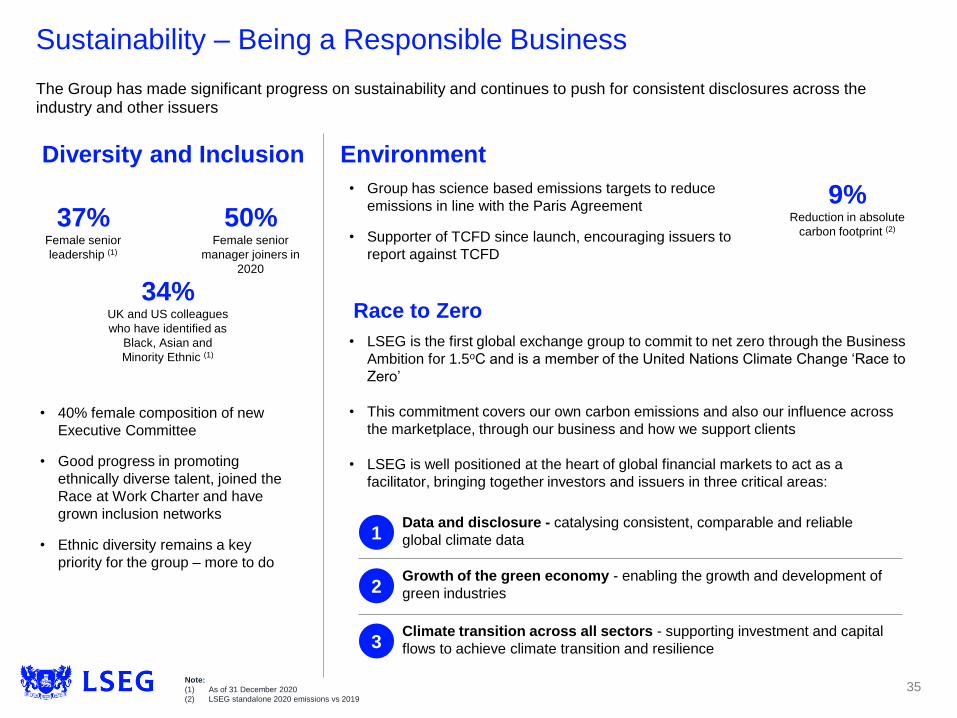
Sustainability – Being a Responsible Business
The Group has made significant progress on sustainability and continues to push for consistent disclosures across the industry and other issuers
Diversity and Inclusion
37%Female senior
leadership (1)
50%Female senior
manager joiners in
2020
• 40% female composition of new
Executive Committee
• Good progress in promoting
ethnically diverse talent, joined the
Race at Work Charter and have
grown inclusion networks
• Ethnic diversity remains a key
priority for the group – more to do
34%UK and US colleagues
who have identified as
Black, Asian and
Minority Ethnic (1)
Environment
9%Reduction in absolute
carbon footprint (2)
• Group has science based emissions targets to reduce
emissions in line with the Paris Agreement
• Supporter of TCFD since launch, encouraging issuers to
report against TCFD
Race to Zero
• LSEG is the first global exchange group to commit to net zero through the Business
Ambition for 1.5oC and is a member of the United Nations Climate Change ‘Race to
Zero’
• This commitment covers our own carbon emissions and also our influence across
the marketplace, through our business and how we support clients
• LSEG is well positioned at the heart of global financial markets to act as a
facilitator, bringing together investors and issuers in three critical areas:
1
2
3Climate transition across all sectors - supporting investment and capital
flows to achieve climate transition and resilience
Growth of the green economy - enabling the growth and development of
green industries
Data and disclosure - catalysing consistent, comparable and reliable
global climate data
Note:
(1) As of 31 December 2020
(2) LSEG standalone 2020 emissions vs 2019
35

Sustainability – Enabling and Supporting Positive Change
LSEG is well positioned to support and facilitate sustainable and low carbon solutions across the financial markets ecosystemby providing access to capital and supporting integration of sustainability into investment processes.
ESG data
• Covering 450 metrics across ESG
categories for 10,000 companies
across the globe
• Macro datasets added to
establish the sustainability
footprint of countries
• Green Revenues data model
Sustainable indices
• Climate WGBI / EGBI
• FTSE TPI Index
• FTSE4Good Index series
ESG and climate risk analytics
tools
Green Crime Screening
• Partnering to create tools to help
disrupt criminal networks. We can
now unwrap ownership
hierarchies across more than
200 countries and screen the
associated entities for potential
risks, including those relating to
green crime
Measure Up in partnership with
Fortune
• Encourages the world’s biggest
companies to collect and disclose
data on their racial composition
by reporting current levels of
minority inclusion in the workplace
Model guidance on TCFD
ESG disclosure score report
• In 2020, 12 issuers scored over
90% and eight of these issuers
scored 100%
Green Economy Mark
• Recognises issuers with 50%+ of
revenues from green sources
• 92 Green Economy Mark issuers
in 2020
Green bonds / Sustainable Bond
Market
• £75 billion in Covid-19 bonds
• 43 bonds raising £13.5 billion
listed on the Sustainable Bond
Market in 2020
Transition Bonds
AIM
Data & Analytics1 Capital Markets2 Promoting Disclosure3
Future opportunities across the sustainable finance landscape
• Scale our sustainable finance and investment data, analytics and benchmarks across
asset classes and across a wider investable universe
• Developing capabilities to help our clients prepare for incoming sustainable finance and
investment regulations such as SFDR (Sustainable Finance Disclosure regulation) in
Europe
36

Information on the pro-forma combined company
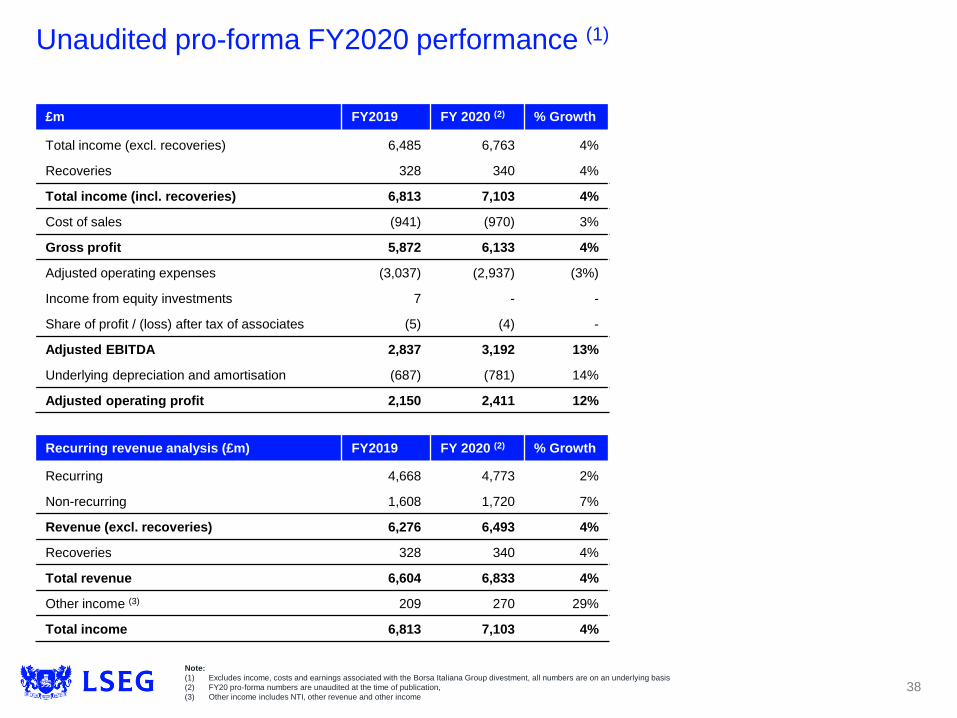
Unaudited pro-forma FY2020 performance (1)
£m FY2019 FY 2020 (2) % Growth
Total income (excl. recoveries) 6,485 6,763 4%
Recoveries 328 340 4%
Total income (incl. recoveries) 6,813 7,103 4%
Cost of sales (941) (970) 3%
Gross profit 5,872 6,133 4%
Adjusted operating expenses (3,037) (2,937) (3%)
Income from equity investments 7 - -
Share of profit / (loss) after tax of associates (5) (4) -
Adjusted EBITDA 2,837 3,192 13%
Underlying depreciation and amortisation (687) (781) 14%
Adjusted operating profit 2,150 2,411 12%
Note:
(1) Excludes income, costs and earnings associated with the Borsa Italiana Group divestment, all numbers are on an underlying basis
(2) FY20 pro-forma numbers are unaudited at the time of publication,
(3) Other income includes NTI, other revenue and other income
Recurring revenue analysis (£m) FY2019 FY 2020 (2) % Growth
Recurring 4,668 4,773 2%
Non-recurring 1,608 1,720 7%
Revenue (excl. recoveries) 6,276 6,493 4%
Recoveries 328 340 4%
Total revenue 6,604 6,833 4%
Other income (3) 209 270 29%
Total income 6,813 7,103 4%
38
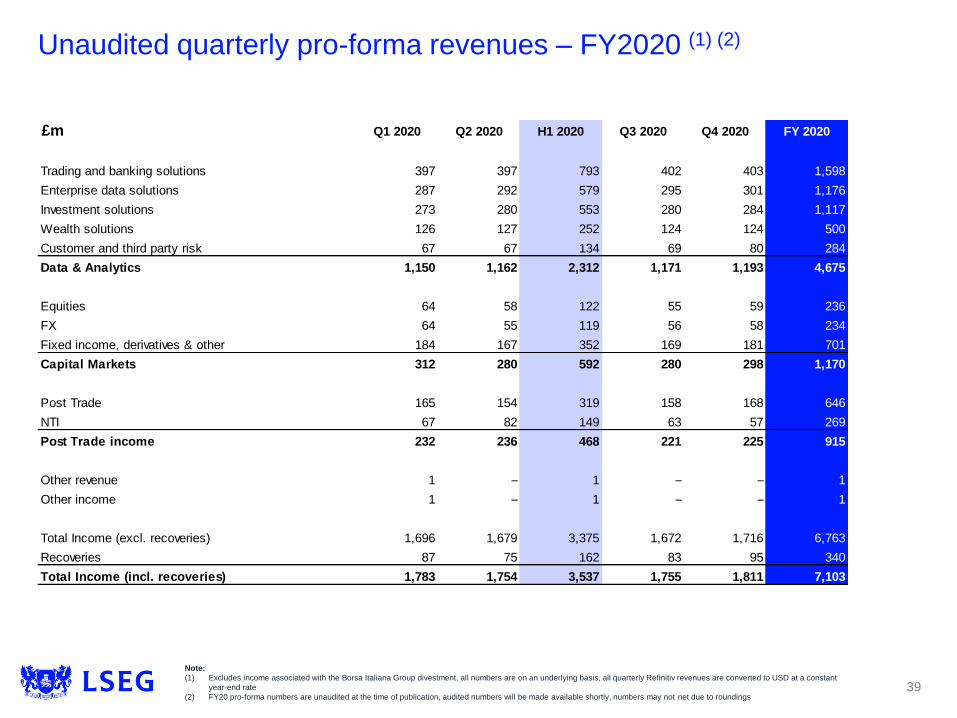
Unaudited quarterly pro-forma revenues – FY2020 (1) (2)
Note:
(1) Excludes income associated with the Borsa Italiana Group divestment, all numbers are on an underlying basis, all quarterly Refinitiv revenues are converted to USD at a constant
year-end rate
(2) FY20 pro-forma numbers are unaudited at the time of publication, audited numbers will be made available shortly, numbers may not net due to roundings39
£m Q1 2020 Q2 2020 H1 2020 Q3 2020 Q4 2020 FY 2020
Trading and banking solutions 397 397 793 402 403 1,598
Enterprise data solutions 287 292 579 295 301 1,176
Investment solutions 273 280 553 280 284 1,117
Wealth solutions 126 127 252 124 124 500
Customer and third party risk 67 67 134 69 80 284
Data & Analytics 1,150 1,162 2,312 1,171 1,193 4,675
Equities 64 58 122 55 59 236
FX 64 55 119 56 58 234
Fixed income, derivatives & other 184 167 352 169 181 701
Capital Markets 312 280 592 280 298 1,170
Post Trade 165 154 319 158 168 646
NTI 67 82 149 63 57 269
Post Trade income 232 236 468 221 225 915
Other revenue 1 – 1 – – 1
Other income 1 – 1 – – 1
Total Income (excl. recoveries) 1,696 1,679 3,375 1,672 1,716 6,763
Recoveries 87 75 162 83 95 340
Total Income (incl. recoveries) 1,783 1,754 3,537 1,755 1,811 7,103

Unaudited quarterly pro-forma revenues – FY2019 (1) (2)
Note:
(1) Excludes income associated with the Borsa Italiana Group divestment, all numbers are on an underlying basis, all quarterly Refinitiv revenues are converted to
USD at a constant year-end rate
(2) FY20 pro-forma numbers are unaudited at the time of publication, audited numbers will be made available shortly, numbers may not net due to roundings
£m Q1 2019 Q2 2019 H1 2019 Q3 2019 Q4 2019 FY 2019
Trading and banking solutions 411 406 817 398 405 1,619
Enterprise data solutions 279 282 560 282 293 1,135
Investment solutions 262 276 538 279 276 1,094
Wealth solutions 121 114 235 114 113 461
Customer and third party risk 65 65 130 65 70 266
Data & Analytics 1,138 1,142 2,280 1,137 1,157 4,574
Equities 53 86 139 55 55 248
FX 59 58 117 58 57 232
Fixed income, derivatives & other 148 152 300 161 159 619
Capital Markets 260 295 555 274 270 1,099
Post Trade 147 143 291 154 152 597
NTI 48 48 96 53 57 206
Post Trade income 195 191 387 207 209 803
Other revenue 1 1 2 1 2 5
Other income 1 1 2 1 1 3
Total Income (excl. recoveries) 1,595 1,631 3,226 1,620 1,639 6,485
Recoveries 82 78 160 85 83 328
Total Income (incl. recoveries) 1,677 1,709 3,386 1,705 1,722 6,813
40
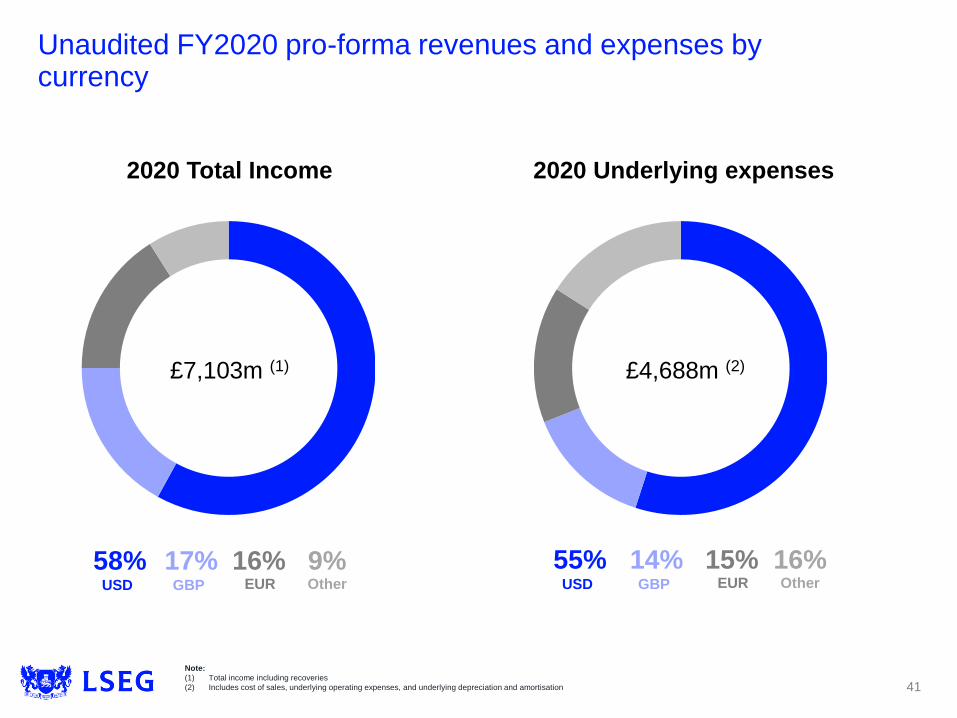
Unaudited FY2020 pro-forma revenues and expenses by currency
£7,103m (1) £4,688m (2)
2020 Total Income 2020 Underlying expenses
16%EUR
17%GBP
9%Other
58%USD
15%EUR
14%GBP
16%Other
55%USD
Note:
(1) Total income including recoveries
(2) Includes cost of sales, underlying operating expenses, and underlying depreciation and amortisation 41

Supplementary FY2020 information
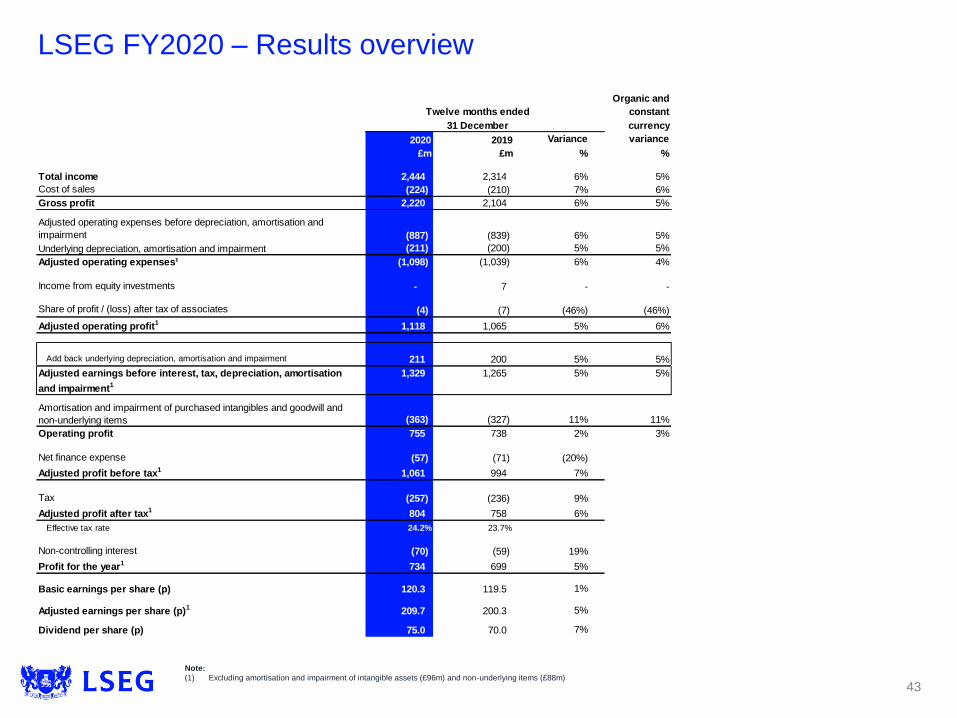
LSEG FY2020 – Results overview
Note:
(1) Excluding amortisation and impairment of intangible assets (£96m) and non-underlying items (£88m)
Organic and
constant
currency
2020 2019 Variance variance
£m £m % %
Total income 2,444 2,314 6% 5%
Cost of sales (224) (210) 7% 6%
Gross profit 2,220 2,104 6% 5%
Adjusted operating expenses before depreciation, amortisation and
impairment (887) (839) 6% 5%
Underlying depreciation, amortisation and impairment (211) (200) 5% 5%
Adjusted operating expenses¹ (1,098) (1,039) 6% 4%
Income from equity investments - 7 - -
Share of profit / (loss) after tax of associates (4) (7) (46%) (46%)
Adjusted operating profit1 1,118 1,065 5% 6%
Add back underlying depreciation, amortisation and impairment 211 200 5% 5%
Adjusted earnings before interest, tax, depreciation, amortisation
and impairment1
1,329 1,265 5% 5%
Amortisation and impairment of purchased intangibles and goodwill and
non-underlying items (363) (327) 11% 11%
Operating profit 755 738 2% 3%
Net finance expense (57) (71) (20%)
Adjusted profit before tax1 1,061 994 7%
Tax (257) (236) 9%
Adjusted profit after tax1 804 758 6%
Effective tax rate 24.2% 23.7%
Non-controlling interest (70) (59) 19%
Profit for the year1 734 699 5%
Basic earnings per share (p) 120.3 119.5 1%
Adjusted earnings per share (p)1 209.7 200.3 5%
Dividend per share (p) 75.0 70.0 7%
Twelve months ended
31 December
43
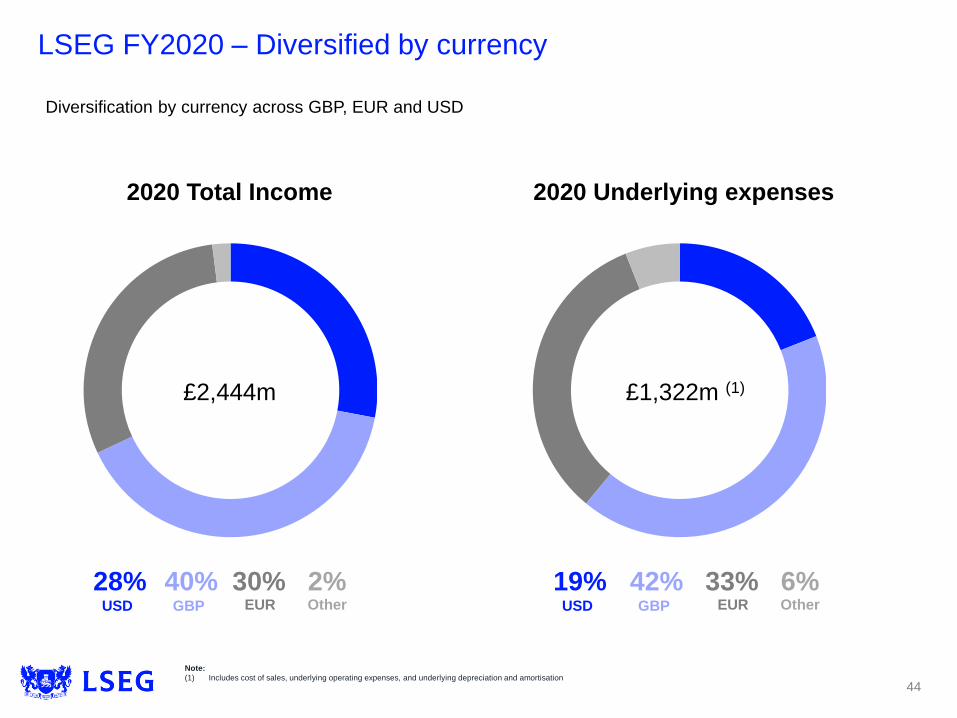
LSEG FY2020 – Diversified by currency
£2,444m £1,322m (1)
2020 Total Income 2020 Underlying expenses
Diversification by currency across GBP, EUR and USD
30%EUR
40%GBP
2%Other
28%USD
33%EUR
42%GBP
6%Other
19%USD
Note:
(1) Includes cost of sales, underlying operating expenses, and underlying depreciation and amortisation
44

FY2020 - Key performance indicators (1)
Information Services
Variance
2020 2019 %
ETF assets under management
benchmarked ($bn)
FTSE 521 450 16%
Russell Indexes 349 297 17%
Total 869 747 16%
Terminals
UK 64,000 65,000 (2%)
Borsa Italiana Professional Terminals 97,000 102,000 (5%)
As at
31 December
Post Trade - Italy
Variance
2020 2019 %
CC&G Clearing
Contracts (m) 121.5 99.5 22%
Initial margin held (average €bn) 13.4 14.5 (7%)
Monte Titoli
Settlement instructions (trades m) 51.1 44.4 15%
Custody assets under management
(average €tn) 3.36 3.33 1%
Twelve months ended
31 December
Note:
(1) These key performance indicators relate to LSEG prior to the acquisition of Refinitiv for FY2020
Note: FTSE ETF assets under management benchmarked KPI has been rebased to remove previously
reported active ETFs. The previous year comparator has also been adjusted, with a change of £16bn
Note: CDSClear notional and LCH Non-OTC volumes have been rebased to count both sides of each
cleared trade. This aligns with how activity is reported on LCH’s website. The previous year comparator has
also been adjusted
45
Post Trade - LCH
Variance
2020 2019 %
LCH OTC derivatives
SwapClear
IRS notional cleared ($tn) 1,058 1,229 (14%)
SwapClear members 122 123 (1%)
Client trades ('000) 1,784 1,681 6%
CDSClear
Notional cleared (€bn) 2425 1518 60%
CDSClear members 26 26 -
ForexClear
Notional value cleared ($bn) 18,986 18,050 5%
ForexClear members 35 34 3%
LCH Non-OTC
Fixed income - Nominal value (€tn) 205.3 212.2 (3%)
Listed derivatives contracts (m) 341.0 289.4 18%
Cash equities trades (m) 1,963 1,397 41%
LCH average cash collateral (€bn) 109.9 98.4 12%
31 December
Twelve months ended

FY2020 - Key performance indicators (1)
Capital Markets - Primary Markets
Variance
2020 2019 %
New Issues
UK Main Market & PSM 54 50 8%
UK AIM 32 23 39%
Borsa Italiana 22 36 (39%)
Total 108 109 (1%)
Money Raised (£bn)
UK New 8.9 4.5 98%
UK Further 34.3 16.3 110%
Borsa Italiana new and further 1.6 2.5 (36%)
Total (£bn) 44.8 23.3 92%
Twelve months ended
31 December
Capital Markets - Secondary Markets
Variance
Equity 2020 2019 %
Totals for period
UK value traded (£bn) 1,248 1,188 5%
Borsa Italiana (no of trades m) 88.2 64.3 37%
Turquoise value traded (€bn) 528 531 (1%)
SETS Yield (basis points) 0.71 0.69 3%
Average daily
UK value traded (£bn) 4.9 4.7 6%
Borsa Italiana (no of trades '000) 346 256 35%
Turquoise value traded (€bn) 2.0 2.1 (4%)
Derivatives
Contracts (m) 25.1 33.1 (24%)
Fixed Income
MTS cash and BondVision (€bn) 3,976 3,182 25%
MTS money markets (€bn term adjusted) 98,965 113,456 (13%)
31 December
Twelve months ended
Note:
(1) These key performance indicators relate to LSEG prior to the acquisition of Refinitiv for FY2020
Note: The 2019 number of derivatives contracts include 2.4 million contracts from LSE Derivatives. This
service no longer accepted new trades rom November 2019
46

FY2020 Income and gross profit
2019 2020
£ millions Q1 Q2 Q3 Q4 2019 Q1 Q2 Q3 Q4 2020
Index - Subscription 99 104 108 107 418 105 113 112 113 443
Index - Asset based 52 60 61 58 231 58 54 57 56 225
FTSE Russell 151 164 169 165 649 163 167 169 169 668
Real time data 24 24 24 25 97 25 27 27 26 105
Other information services 26 27 27 29 109 27 28 27 27 109
Information Services 201 215 220 219 855 215 222 223 222 882
OTC - SwapClear, ForexClear & CDSClear 76 72 80 79 307 82 75 74 78 309
Non OTC - FI, Cash equities & Listed derivs 34 35 36 35 140 41 39 40 44 164
LCH other revenue 24 25 28 26 103 26 30 29 33 118
Post Trade Services - LCH 134 132 144 140 550 149 144 143 155 591
Clearing 11 11 11 10 43 12 10 10 11 43
Settlement, Custody & other 14 15 16 15 60 15 16 15 17 63
Post Trade Services - CC&G and MT 25 26 27 25 103 27 26 25 28 106
UnaVista 13 12 10 12 47 16 10 15 13 54
Post Trade 172 170 181 177 700 192 180 183 196 751
Primary Markets 28 62 30 31 151 32 33 33 33 131
Secondary Markets - Equities 37 37 39 38 151 49 42 37 43 171
Secondary Markets - FI, derivs & other 32 30 33 29 124 31 30 32 32 125
Capital Markets 97 129 102 98 426 112 105 102 108 427
Technology 14 16 16 20 66 14 16 15 16 61
Other 2 2 2 3 9 2 0 1 0 3
Total Revenue 486 532 521 517 2,056 535 523 524 542 2,124
Net treasury income through CCP:
LCH 48 48 53 57 206 67 82 63 57 269
CC&G 11 13 12 13 49 12 15 13 10 50
Other income 1 1 1 0 3 1 0 0 0 1
Total income 546 594 587 587 2,314 615 620 600 609 2,444
Cost of sales (56) (53) (58) (43) (210) (60) (61) (49) (54) (224)
Gross profit 490 541 529 544 2,104 555 559 551 555 2,220
Note: Minor rounding differences may mean quarterly and other segmental figures may differ slightly
47

London Stock Exchange Group plc
10 Paternoster Square
London
EC4M 7LS
Paul Froud
Group Head of Investor Relations
Tel: +44 (0)20 7797 1186
email: [email protected]
Gaurav Patel
Investor Relations Senior Manager
Tel: +44 (0)20 7797 1154
email: [email protected]
Ian Hughes
Investor Relations Manager
Tel: +44 (0)20 7797 3334
email: [email protected]
Natanya Grant
Investor Relations Analyst
Tel: +44 (0)20 7797 1215
email: [email protected]
For investor relations information:
www.lseg.com/investor-relations
For Corporate Sustainability information:
www.lseg.com/investor-relations/sustainability
Contacts and further information
48