2020 q1 press release - ex99comerica.mediaroom.com/download/comerica+inc+1q2020... ·...
TRANSCRIPT

Dallas, TX/April 21, 2020
FIRST QUARTER 2020 NET LOSS OF $65 MILLION
Comerica is Well-Positioned to Navigate These Challenging TimesWell-Capitalized, Strong Liquidity Base and Solid Operating Leverage
Record $53.5 Billion in Period-End Loans, up $3.1 Billion to Support Customers' Needs
Allowance for Loan Losses of $916 Million, or 1.71% of Total Loans Provision Reflects Stress on Energy Loans and Expected Recessionary Environment
"The well-being of our customers, employees and communities is our priority during this challenging time," said Curt C. Farmer, Comerica Chairman, President and Chief Executive Officer. "Comerica has quickly adapted to the COVID-19 crisis. I am proud of the work our team has done to ensure we continue to deliver products and services. During times of stress, our conservative approach to banking, including liquidity and capital management, serves us well. Over our 170-year history, we have managed through many economic cycles, demonstrating our resiliency and our ability to work cohesively and leverage our ingenuity and entrepreneurial spirit. Helping our customers navigate changing environments by providing our expertise, products and services is at the heart of Comerica’s relationship banking strategy.
“Our first quarter results reflect a large increase in our credit reserves and, to a much lesser degree, the net impact of the decline in interest rates. We prudently increased our credit reserves in light of the economic outlook, particularly as it relates to Energy. Loans increased over $3 billion in the latter half of March to a record level, as we appropriately supported customers' borrowing needs. Relative to the first quarter last year, average deposits were up $2.8 billion, or 5 percent. Compared to the previous quarter, noninterest income included a decline in noncustomer-related activity as well as lower loan syndication volume. Expenses were well controlled and resulted in an efficiency ratio of under 57 percent. We have suspended our share repurchase program and remain focused on deploying our capital to meet our customers' financing requirements.”
(dollar amounts in millions, except per share data) 1st Qtr '20 4th Qtr '19 1st Qtr '19FINANCIAL RESULTSNet interest income $ 513 $ 544 $ 606Provision for credit losses 411 8 (13)Noninterest income 237 266 238Noninterest expenses 425 451 433Pre-tax (loss) income (86) 351 424(Benefit) provision for income taxes (21) 82 85Net (loss) income $ (65) $ 269 $ 339Diluted (losses) earnings per common share $ (0.46) $ 1.85 $ 2.11Period-end loans 53,458 50,369 50,302Period-end deposits 57,366 57,295 54,091Average loans 49,604 50,505 49,677Average deposits 56,768 57,178 53,996Efficiency ratio (a) 56.57% 55.46% 50.81%Net interest margin 3.06 3.20 3.79Common equity Tier 1 capital ratio (b) 9.51 10.13 10.78Common equity ratio 9.70 9.98 10.48Common shareholders' equity per share of common stock $ 53.24 $ 51.57 $ 47.67Tangible common equity per share of common stock (c) 48.65 47.07 43.55
(a) Noninterest expenses as a percentage of net interest income and noninterest income excluding net gains (losses) from securities and a derivative contract tied to the conversion rate of Visa Class B shares.
(b) Estimated for March 31, 2020, reflects deferral of CECL model impact as calculated per regulatory guidance. (c) See Reconciliation of Non-GAAP Financial Measures.
2
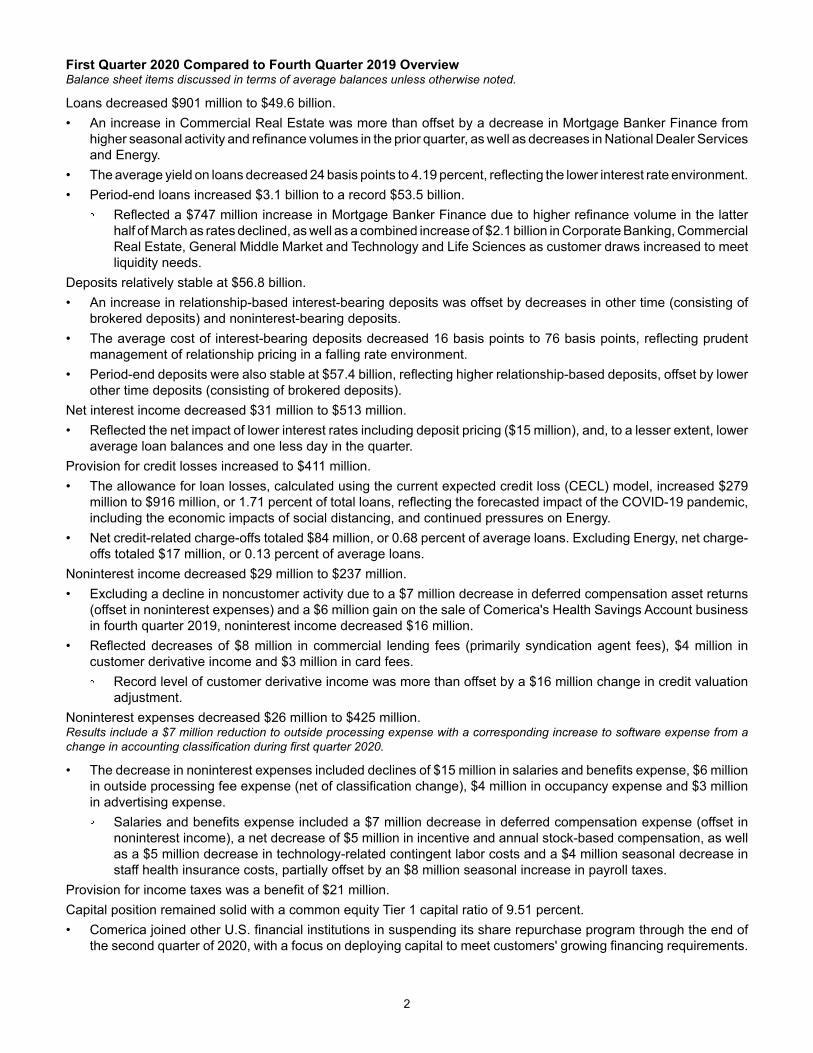
First Quarter 2020 Compared to Fourth Quarter 2019 OverviewBalance sheet items discussed in terms of average balances unless otherwise noted.
Loans decreased $901 million to $49.6 billion.• An increase in Commercial Real Estate was more than offset by a decrease in Mortgage Banker Finance from
higher seasonal activity and refinance volumes in the prior quarter, as well as decreases in National Dealer Services and Energy.
• The average yield on loans decreased 24 basis points to 4.19 percent, reflecting the lower interest rate environment.• Period-end loans increased $3.1 billion to a record $53.5 billion.
Reflected a $747 million increase in Mortgage Banker Finance due to higher refinance volume in the latter half of March as rates declined, as well as a combined increase of $2.1 billion in Corporate Banking, Commercial Real Estate, General Middle Market and Technology and Life Sciences as customer draws increased to meet liquidity needs.
Deposits relatively stable at $56.8 billion. • An increase in relationship-based interest-bearing deposits was offset by decreases in other time (consisting of
brokered deposits) and noninterest-bearing deposits.• The average cost of interest-bearing deposits decreased 16 basis points to 76 basis points, reflecting prudent
management of relationship pricing in a falling rate environment.• Period-end deposits were also stable at $57.4 billion, reflecting higher relationship-based deposits, offset by lower
other time deposits (consisting of brokered deposits).Net interest income decreased $31 million to $513 million.• Reflected the net impact of lower interest rates including deposit pricing ($15 million), and, to a lesser extent, lower
average loan balances and one less day in the quarter.Provision for credit losses increased to $411 million.• The allowance for loan losses, calculated using the current expected credit loss (CECL) model, increased $279
million to $916 million, or 1.71 percent of total loans, reflecting the forecasted impact of the COVID-19 pandemic, including the economic impacts of social distancing, and continued pressures on Energy.
• Net credit-related charge-offs totaled $84 million, or 0.68 percent of average loans. Excluding Energy, net charge-offs totaled $17 million, or 0.13 percent of average loans.
Noninterest income decreased $29 million to $237 million.• Excluding a decline in noncustomer activity due to a $7 million decrease in deferred compensation asset returns
(offset in noninterest expenses) and a $6 million gain on the sale of Comerica's Health Savings Account business in fourth quarter 2019, noninterest income decreased $16 million.
• Reflected decreases of $8 million in commercial lending fees (primarily syndication agent fees), $4 million in customer derivative income and $3 million in card fees. Record level of customer derivative income was more than offset by a $16 million change in credit valuation
adjustment.Noninterest expenses decreased $26 million to $425 million.Results include a $7 million reduction to outside processing expense with a corresponding increase to software expense from a change in accounting classification during first quarter 2020.
• The decrease in noninterest expenses included declines of $15 million in salaries and benefits expense, $6 millionin outside processing fee expense (net of classification change), $4 million in occupancy expense and $3 million in advertising expense. Salaries and benefits expense included a $7 million decrease in deferred compensation expense (offset in
noninterest income), a net decrease of $5 million in incentive and annual stock-based compensation, as well as a $5 million decrease in technology-related contingent labor costs and a $4 million seasonal decrease in staff health insurance costs, partially offset by an $8 million seasonal increase in payroll taxes.
Provision for income taxes was a benefit of $21 million.Capital position remained solid with a common equity Tier 1 capital ratio of 9.51 percent.• Comerica joined other U.S. financial institutions in suspending its share repurchase program through the end of
the second quarter of 2020, with a focus on deploying capital to meet customers' growing financing requirements.

3
• Returned a total of $283 million to shareholders, including an increase in the dividend to 68 cents per share and the repurchase of $189 million of common stock (3.2 million shares) prior to the suspension of the repurchase plan.
• Newly issued regulatory relief to defer the impact of adopting the CECL model for measuring credit losses expected to provide a benefit of approximately 10 basis points to the estimated common equity Tier 1 capital ratio.
First Quarter 2020 Compared to First Quarter 2019 Overview Balance sheet items discussed in terms of average balances unless otherwise noted.
Loans were relatively stable, reflecting increases in Commercial Real Estate and Mortgage Banker Finance, offset by a decline in National Dealer Services. The average yield on loans declined 88 basis points, consistent with the lower interest rate environment.
• Period-end loans increased $3.2 billion to $53.5 billion, reflecting a $1.8 billion increase in Mortgage Banker Finance, as well as a combined increase of $1.8 billion in Commercial Real Estate and Corporate Banking as customers met their liquidity needs, partially offset by decreases in National Dealer Services and Energy.
Deposits increased $2.8 billion, reflecting an increase in relationship-based interest-bearing deposits, partially offset by decreases in other time (consisting of brokered deposits) and noninterest-bearing deposits. The average cost of interest-bearing deposits was relatively stable, declining 2 basis points to 76 basis points.
• Period-end deposits increased $3.3 billion to $57.4 billion, reflecting higher relationship-based deposits, partially offset by lower other time deposits (consisting of brokered deposits).
Net interest income decreased $93 million, reflecting the impact of lower short-term rates on loans.
Provision for credit losses, calculated using the CECL model effective first quarter 2020, increased $424 million, reflecting the forecasted impact of the COVID-19 pandemic, including the economic impacts of social distancing, and continued pressures on Energy.
Noninterest income was stable at $237 million, including a reduction in net securities losses (primarily due to a repositioning loss recorded in first quarter 2019), as well as increased fiduciary income, offset by decreases in commercial lending fees, deferred compensation asset returns (offset in noninterest expenses) and card fees.
Noninterest expenses decreased $8 million, reflecting decreases in salaries and benefits expense, partially offset by increases in operational losses, FDIC insurance expense and advertising expense. Results include a $7 million reduction to outside processing expense with a corresponding increase to software expense from a change in accounting classification during first quarter 2020.
4
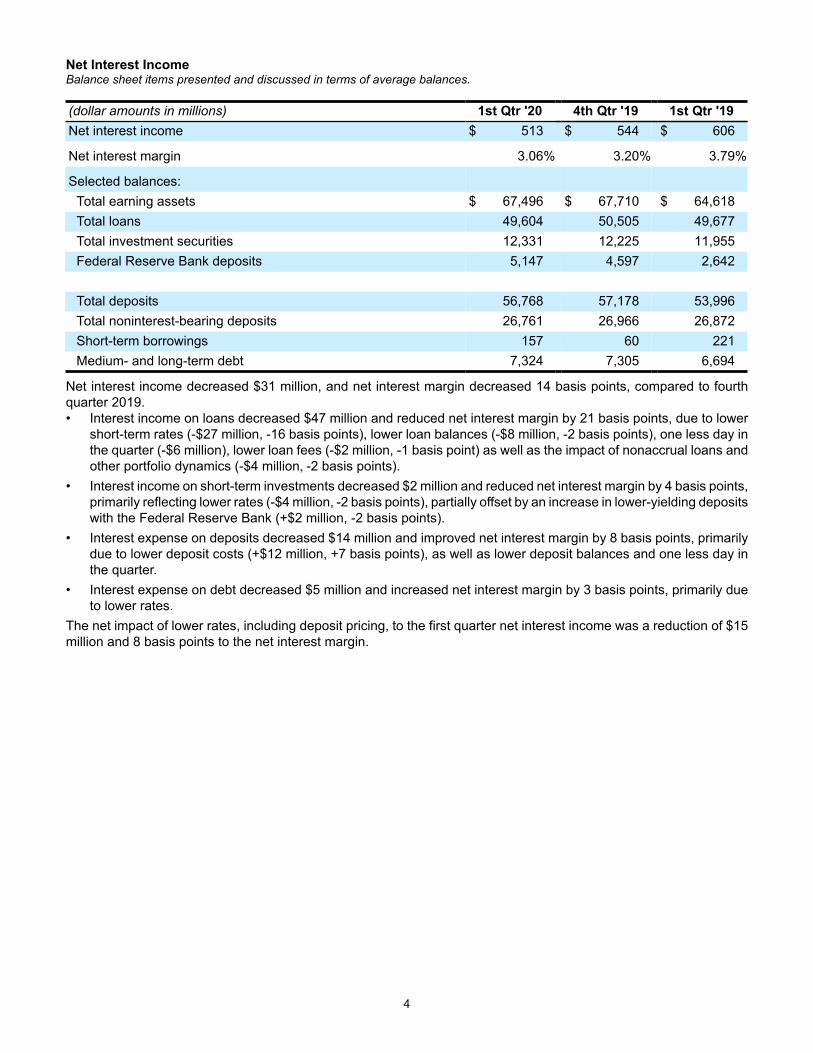
Net Interest IncomeBalance sheet items presented and discussed in terms of average balances.
(dollar amounts in millions) 1st Qtr '20 4th Qtr '19 1st Qtr '19Net interest income $ 513 $ 544 $ 606
Net interest margin 3.06% 3.20% 3.79%
Selected balances:Total earning assets $ 67,496 $ 67,710 $ 64,618Total loans 49,604 50,505 49,677Total investment securities 12,331 12,225 11,955Federal Reserve Bank deposits 5,147 4,597 2,642
Total deposits 56,768 57,178 53,996Total noninterest-bearing deposits 26,761 26,966 26,872Short-term borrowings 157 60 221Medium- and long-term debt 7,324 7,305 6,694
Net interest income decreased $31 million, and net interest margin decreased 14 basis points, compared to fourth quarter 2019. • Interest income on loans decreased $47 million and reduced net interest margin by 21 basis points, due to lower
short-term rates (-$27 million, -16 basis points), lower loan balances (-$8 million, -2 basis points), one less day in the quarter (-$6 million), lower loan fees (-$2 million, -1 basis point) as well as the impact of nonaccrual loans and other portfolio dynamics (-$4 million, -2 basis points).
• Interest income on short-term investments decreased $2 million and reduced net interest margin by 4 basis points, primarily reflecting lower rates (-$4 million, -2 basis points), partially offset by an increase in lower-yielding deposits with the Federal Reserve Bank (+$2 million, -2 basis points).
• Interest expense on deposits decreased $14 million and improved net interest margin by 8 basis points, primarily due to lower deposit costs (+$12 million, +7 basis points), as well as lower deposit balances and one less day in the quarter.
• Interest expense on debt decreased $5 million and increased net interest margin by 3 basis points, primarily due to lower rates.
The net impact of lower rates, including deposit pricing, to the first quarter net interest income was a reduction of $15 million and 8 basis points to the net interest margin.
5
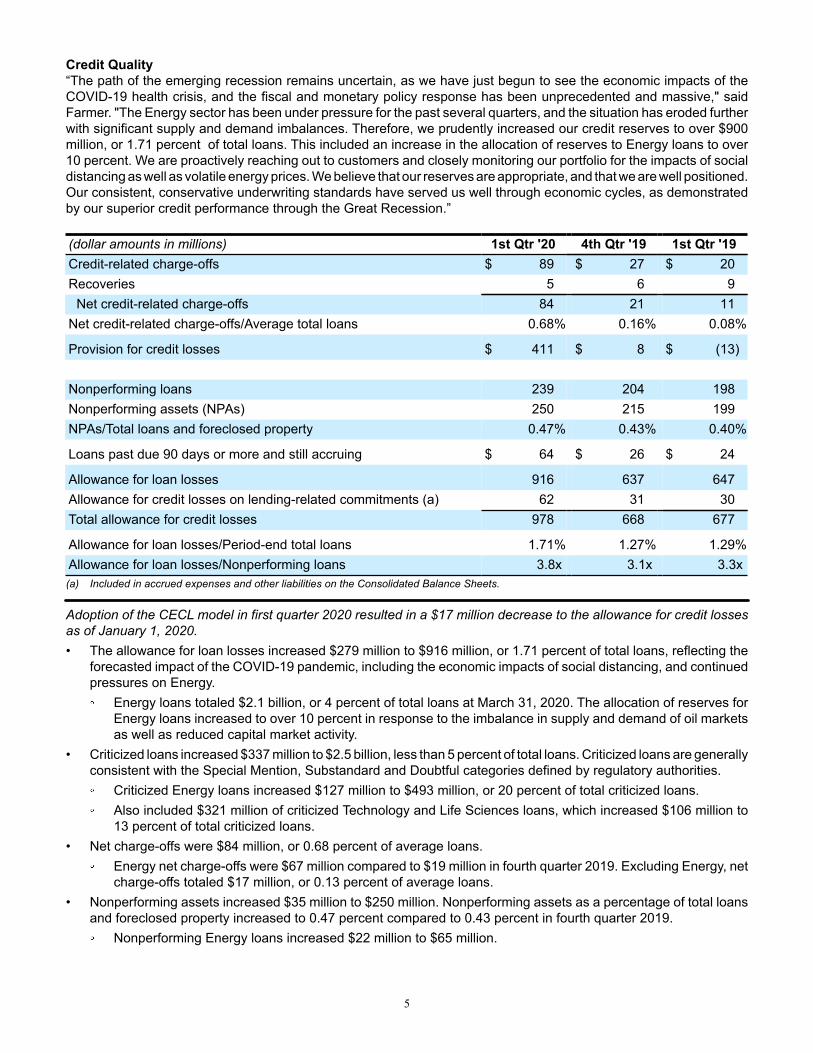
Credit Quality“The path of the emerging recession remains uncertain, as we have just begun to see the economic impacts of the COVID-19 health crisis, and the fiscal and monetary policy response has been unprecedented and massive," said Farmer. "The Energy sector has been under pressure for the past several quarters, and the situation has eroded further with significant supply and demand imbalances. Therefore, we prudently increased our credit reserves to over $900 million, or 1.71 percent of total loans. This included an increase in the allocation of reserves to Energy loans to over 10 percent. We are proactively reaching out to customers and closely monitoring our portfolio for the impacts of social distancing as well as volatile energy prices. We believe that our reserves are appropriate, and that we are well positioned. Our consistent, conservative underwriting standards have served us well through economic cycles, as demonstrated by our superior credit performance through the Great Recession.”
(dollar amounts in millions) 1st Qtr '20 4th Qtr '19 1st Qtr '19Credit-related charge-offs $ 89 $ 27 $ 20Recoveries 5 6 9
Net credit-related charge-offs 84 21 11Net credit-related charge-offs/Average total loans 0.68% 0.16% 0.08%
Provision for credit losses $ 411 $ 8 $ (13)
Nonperforming loans 239 204 198Nonperforming assets (NPAs) 250 215 199NPAs/Total loans and foreclosed property 0.47% 0.43% 0.40%
Loans past due 90 days or more and still accruing $ 64 $ 26 $ 24
Allowance for loan losses 916 637 647Allowance for credit losses on lending-related commitments (a) 62 31 30Total allowance for credit losses 978 668 677
Allowance for loan losses/Period-end total loans 1.71% 1.27% 1.29%Allowance for loan losses/Nonperforming loans 3.8x 3.1x 3.3x(a) Included in accrued expenses and other liabilities on the Consolidated Balance Sheets.
Adoption of the CECL model in first quarter 2020 resulted in a $17 million decrease to the allowance for credit losses as of January 1, 2020.• The allowance for loan losses increased $279 million to $916 million, or 1.71 percent of total loans, reflecting the
forecasted impact of the COVID-19 pandemic, including the economic impacts of social distancing, and continued pressures on Energy. Energy loans totaled $2.1 billion, or 4 percent of total loans at March 31, 2020. The allocation of reserves for
Energy loans increased to over 10 percent in response to the imbalance in supply and demand of oil markets as well as reduced capital market activity.
• Criticized loans increased $337 million to $2.5 billion, less than 5 percent of total loans. Criticized loans are generally consistent with the Special Mention, Substandard and Doubtful categories defined by regulatory authorities. Criticized Energy loans increased $127 million to $493 million, or 20 percent of total criticized loans. Also included $321 million of criticized Technology and Life Sciences loans, which increased $106 million to
13 percent of total criticized loans.• Net charge-offs were $84 million, or 0.68 percent of average loans.
Energy net charge-offs were $67 million compared to $19 million in fourth quarter 2019. Excluding Energy, net charge-offs totaled $17 million, or 0.13 percent of average loans.
• Nonperforming assets increased $35 million to $250 million. Nonperforming assets as a percentage of total loans and foreclosed property increased to 0.47 percent compared to 0.43 percent in fourth quarter 2019. Nonperforming Energy loans increased $22 million to $65 million.
6
Outlook for Second Quarter 2020 Compared to First Quarter 2020Based on management expectations for recessionary conditions:• Growth in average loans, reflecting an increase in Mortgage Banker Finance and support of customers' liquidity
needs, including through the Paycheck Protection Program, partly offset by customers' reduced working capital and capital expenditure needs.
• Growth in average deposits as customers conserve liquidity and receive benefits of economic stimulus programs, partly offset by customers using cash to meet operating needs.
• Decrease in net interest income due to the net impact of lower interest rates, partially offset by loan growth. Estimated $55 million net reduction from lower interest rates.
• Provision for credit losses highly uncertain, reflective of economic environment, including the effects resulting from the duration and severity of the COVID-19 pandemic. Current reserve is appropriate based on expected recessionary conditions as of March 31, 2020.
• Stable noninterest income with increase in card fees offset by reduced economic activity and lower market-based fees.
• Increase in noninterest expenses from higher outside processing expenses and costs related to the COVID-19 pandemic as well as the impact of merit increases, partially offset by continued expense discipline.
• Capital to reflect suspension of share repurchase program and focus on supporting customers' financing needs as well as providing an attractive dividend.
7
Business SegmentsComerica's operations are strategically aligned into three major business segments: the Business Bank, the Retail Bank and Wealth Management. The Finance Division is also reported as a segment. Comerica also provides market segment results for three primary geographic markets: Michigan, California and Texas. In addition to the three primary geographic markets, Other Markets is also reported as a market segment. Other Markets includes Florida, Arizona, the International Finance division and businesses that have a significant presence outside of the three primary geographic markets. For a summary of business segment and geographic market quarterly results, see the Business Segment Financial Results and Market Segment Financial Results tables included later in this report. From time to time, Comerica may make reclassifications among the segments to reflect management's current view of the segments, and methodologies may be modified as the management accounting system is enhanced and changes occur in the organizational structure and/or product lines. The financial results provided are based on the internal business unit and geographic market structures of Comerica and methodologies in effect at March 31, 2020. A discussion of business segment and geographic market year-to-date results will be included in Comerica's First Quarter 2020 Form 10-Q.
Conference Call and WebcastComerica will host a conference call to review first quarter 2020 financial results at 7 a.m. CT Tuesday, April 21, 2020. Interested parties may access the conference call by calling (800) 309-2262 or (706) 679-5261 (Event ID No. 3289618). The call and supplemental financial information can also be accessed via Comerica's "Investor Relations" page at www.comerica.com. A replay of the Webcast can be accessed via Comerica's “Investor Relations” page at www.comerica.com.
Comerica Incorporated is a financial services company headquartered in Dallas, Texas, and strategically aligned by three major business segments: The Business Bank, The Retail Bank and Wealth Management. Comerica focuses on relationships and helping people and businesses be successful. In addition to Texas, Comerica Bank locations can be found in Arizona, California, Florida and Michigan, with select businesses operating in several other states, as well as in Canada and Mexico.
This press release contains both financial measures based on accounting principles generally accepted in the United States (GAAP) and non-GAAP based financial measures, which are used where management believes it to be helpful in understanding Comerica's results of operations or financial position. Where non-GAAP financial measures are used, the comparable GAAP financial measure, as well as a reconciliation to the comparable GAAP financial measure, can be found in this press release. These disclosures should not be viewed as a substitute for operating results determined in accordance with GAAP, nor are they necessarily comparable to non-GAAP performance measures that may be presented by other companies.
Forward-looking Statements Any statements in this news release that are not historical facts are forward-looking statements as defined in the Private Securities Litigation Reform Act of 1995. Words such as “anticipates,” “believes,” “contemplates,” “feels,” “expects,” “estimates,” “seeks,” “strives,” “plans,” “intends,” “outlook,” “forecast,” “position,” “target,” “mission,” “assume,” “achievable,” “potential,” “strategy,” “goal,” “aspiration,” “opportunity,” “initiative,” “outcome,” “continue,” “remain,” “maintain,” “on track,” “trend,” “objective,” “looks forward,” “projects,” “models” and variations of such words and similar expressions, or future or conditional verbs such as “will,” “would,” “should,” “could,” “might,” “can,” “may” or similar expressions, as they relate to Comerica or its management, are intended to identify forward-looking statements. These forward-looking statements are predicated on the beliefs and assumptions of Comerica's management based on information known to Comerica's management as of the date of this news release and do not purport to speak as of any other date. Forward-looking statements may include descriptions of plans and objectives of Comerica's management for future or past operations, products or services, and forecasts of Comerica's revenue, earnings or other measures of economic performance, including statements of profitability, business segments and subsidiaries as well as estimates of credit trends and global stability. Such statements reflect the view of Comerica's management as of this date with respect to future events and are subject to risks and uncertainties. Should one or more of these risks materialize or should underlying beliefs or assumptions prove incorrect, Comerica's actual results could differ materially from those discussed. Factors that could cause or contribute to such differences include credit risks (unfavorable developments concerning credit quality; declines or other changes in the businesses or industries of Comerica's customers, in particular the energy industry; and changes in customer behavior); market risks (changes in monetary and fiscal policies; fluctuations in interest rates and their impact on deposit pricing; and transitions away from LIBOR towards new interest rate benchmarks); liquidity risks (Comerica's ability to maintain adequate sources of funding and liquidity; reductions in Comerica's credit rating; and the interdependence of financial service companies); technology risks (cybersecurity risks and heightened legislative and regulatory focus on cybersecurity and data privacy); operational risks (operational, systems or infrastructure failures; reliance on other companies to provide certain key components of business infrastructure; the impact of legal and regulatory proceedings or determinations; losses due to fraud; and controls and procedures failures); compliance risks (changes in regulation or oversight; the effects of stringent capital requirements; and the impacts of future legislative, administrative or judicial changes to tax regulations); financial reporting risks (changes in accounting standards and the critical nature of Comerica's accounting policies); strategic risks (damage to Comerica's reputation; Comerica's ability to utilize technology to efficiently and effectively develop, market and deliver new products and services; competitive product and pricing pressures among financial institutions within Comerica's markets; the implementation of Comerica's strategies and business initiatives; management's ability to maintain and expand customer relationships; management's ability to retain key officers and employees; and any future strategic acquisitions or divestitures); and other general risks (changes in general economic, political or industry conditions; the effectiveness of methods of reducing risk exposures; the effects of catastrophic events, including the Covid-19 global pandemic; and the volatility of Comerica’s stock price). Comerica cautions that the foregoing list of factors is not all-inclusive. For discussion of factors that may cause actual results to differ from expectations, please refer to our filings with the Securities and Exchange Commission. In particular, please refer to “Item 1A. Risk Factors” beginning on page 12 of Comerica's Annual Report on Form 10-K for the year ended December 31, 2019. Forward-looking statements speak only as of the date they are made. Comerica does not undertake to update forward-looking statements to reflect facts, circumstances, assumptions or events that occur after the date the forward-looking statements are made. For any forward-looking statements made in this news release or in any documents, Comerica claims the protection of the safe harbor for forward-looking statements contained in the Private Securities Litigation Reform Act of 1995.
Media Contacts: Investor Contacts:Wendy Bridges Darlene P. Persons(214) 462-4443 (214) 462-6831
Louis H. Mora Amanda Perkins(214) 462-6669 (214) 462-6731
9
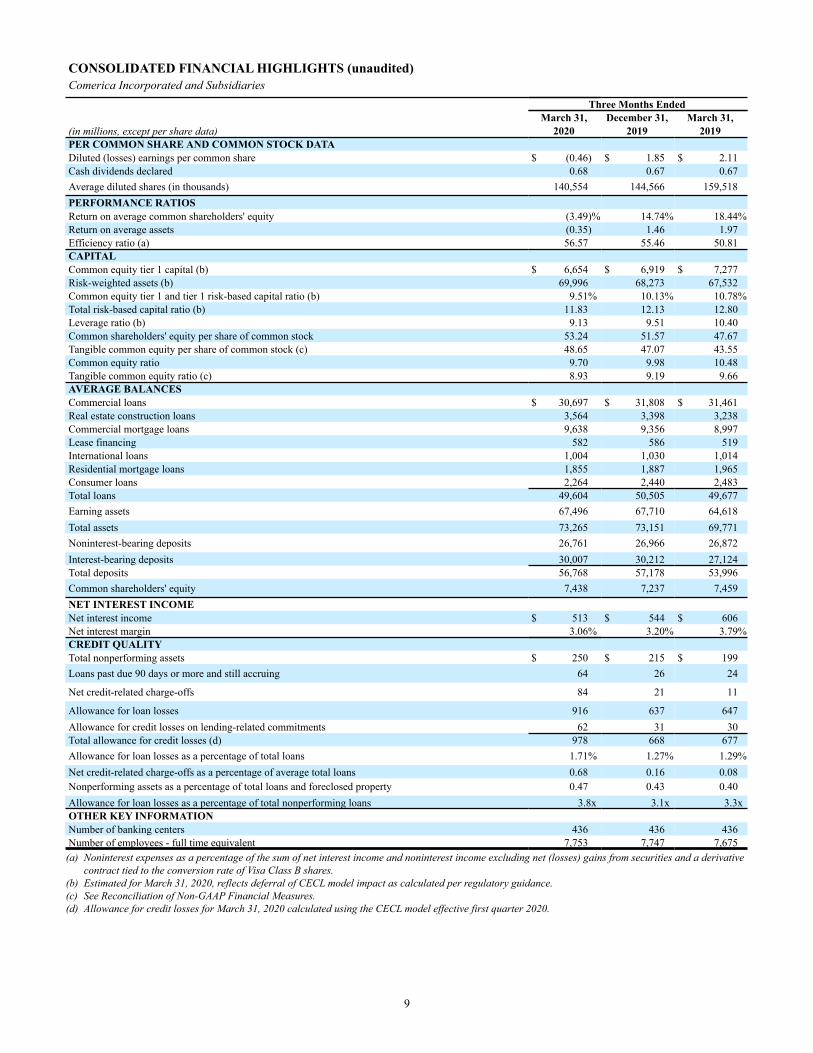
CONSOLIDATED FINANCIAL HIGHLIGHTS (unaudited)Comerica Incorporated and Subsidiaries
Three Months EndedMarch 31, December 31, March 31,
(in millions, except per share data) 2020 2019 2019PER COMMON SHARE AND COMMON STOCK DATADiluted (losses) earnings per common share $ (0.46) $ 1.85 $ 2.11Cash dividends declared 0.68 0.67 0.67Average diluted shares (in thousands) 140,554 144,566 159,518PERFORMANCE RATIOSReturn on average common shareholders' equity (3.49)% 14.74% 18.44%Return on average assets (0.35) 1.46 1.97Efficiency ratio (a) 56.57 55.46 50.81CAPITALCommon equity tier 1 capital (b) $ 6,654 $ 6,919 $ 7,277Risk-weighted assets (b) 69,996 68,273 67,532Common equity tier 1 and tier 1 risk-based capital ratio (b) 9.51% 10.13% 10.78%Total risk-based capital ratio (b) 11.83 12.13 12.80Leverage ratio (b) 9.13 9.51 10.40Common shareholders' equity per share of common stock 53.24 51.57 47.67Tangible common equity per share of common stock (c) 48.65 47.07 43.55Common equity ratio 9.70 9.98 10.48Tangible common equity ratio (c) 8.93 9.19 9.66AVERAGE BALANCESCommercial loans $ 30,697 $ 31,808 $ 31,461Real estate construction loans 3,564 3,398 3,238Commercial mortgage loans 9,638 9,356 8,997Lease financing 582 586 519International loans 1,004 1,030 1,014Residential mortgage loans 1,855 1,887 1,965Consumer loans 2,264 2,440 2,483Total loans 49,604 50,505 49,677Earning assets 67,496 67,710 64,618Total assets 73,265 73,151 69,771Noninterest-bearing deposits 26,761 26,966 26,872Interest-bearing deposits 30,007 30,212 27,124Total deposits 56,768 57,178 53,996Common shareholders' equity 7,438 7,237 7,459NET INTEREST INCOMENet interest income $ 513 $ 544 $ 606Net interest margin 3.06% 3.20% 3.79%CREDIT QUALITYTotal nonperforming assets $ 250 $ 215 $ 199Loans past due 90 days or more and still accruing 64 26 24
Net credit-related charge-offs 84 21 11
Allowance for loan losses 916 637 647Allowance for credit losses on lending-related commitments 62 31 30Total allowance for credit losses (d) 978 668 677Allowance for loan losses as a percentage of total loans 1.71% 1.27% 1.29%Net credit-related charge-offs as a percentage of average total loans 0.68 0.16 0.08Nonperforming assets as a percentage of total loans and foreclosed property 0.47 0.43 0.40Allowance for loan losses as a percentage of total nonperforming loans 3.8x 3.1x 3.3xOTHER KEY INFORMATIONNumber of banking centers 436 436 436Number of employees - full time equivalent 7,753 7,747 7,675(a) Noninterest expenses as a percentage of the sum of net interest income and noninterest income excluding net (losses) gains from securities and a derivative
contract tied to the conversion rate of Visa Class B shares.(b) Estimated for March 31, 2020, reflects deferral of CECL model impact as calculated per regulatory guidance. (c) See Reconciliation of Non-GAAP Financial Measures.(d) Allowance for credit losses for March 31, 2020 calculated using the CECL model effective first quarter 2020.
10
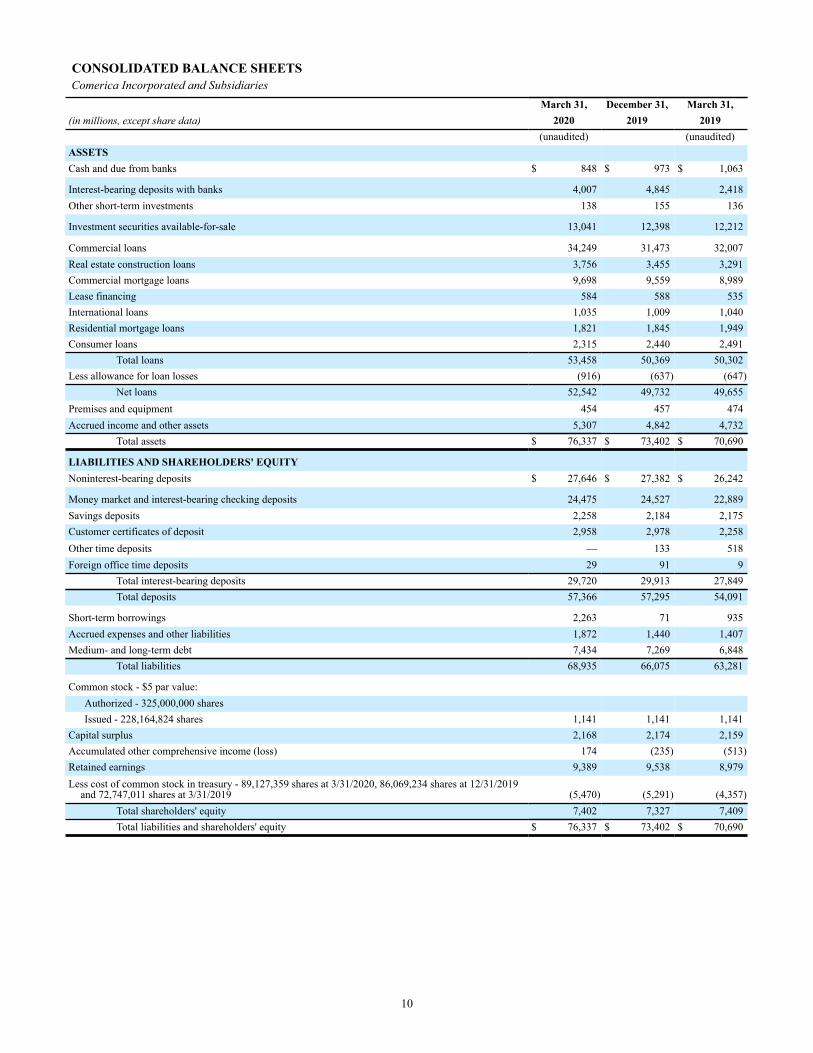
CONSOLIDATED BALANCE SHEETS Comerica Incorporated and Subsidiaries
March 31, December 31, March 31,(in millions, except share data) 2020 2019 2019
(unaudited) (unaudited)ASSETSCash and due from banks $ 848 $ 973 $ 1,063
Interest-bearing deposits with banks 4,007 4,845 2,418Other short-term investments 138 155 136
Investment securities available-for-sale 13,041 12,398 12,212
Commercial loans 34,249 31,473 32,007Real estate construction loans 3,756 3,455 3,291Commercial mortgage loans 9,698 9,559 8,989Lease financing 584 588 535International loans 1,035 1,009 1,040Residential mortgage loans 1,821 1,845 1,949Consumer loans 2,315 2,440 2,491
Total loans 53,458 50,369 50,302Less allowance for loan losses (916) (637) (647)
Net loans 52,542 49,732 49,655Premises and equipment 454 457 474Accrued income and other assets 5,307 4,842 4,732
Total assets $ 76,337 $ 73,402 $ 70,690
LIABILITIES AND SHAREHOLDERS' EQUITYNoninterest-bearing deposits $ 27,646 $ 27,382 $ 26,242
Money market and interest-bearing checking deposits 24,475 24,527 22,889Savings deposits 2,258 2,184 2,175Customer certificates of deposit 2,958 2,978 2,258Other time deposits — 133 518Foreign office time deposits 29 91 9
Total interest-bearing deposits 29,720 29,913 27,849Total deposits 57,366 57,295 54,091
Short-term borrowings 2,263 71 935Accrued expenses and other liabilities 1,872 1,440 1,407Medium- and long-term debt 7,434 7,269 6,848
Total liabilities 68,935 66,075 63,281
Common stock - $5 par value:Authorized - 325,000,000 sharesIssued - 228,164,824 shares 1,141 1,141 1,141
Capital surplus 2,168 2,174 2,159Accumulated other comprehensive income (loss) 174 (235) (513)Retained earnings 9,389 9,538 8,979Less cost of common stock in treasury - 89,127,359 shares at 3/31/2020, 86,069,234 shares at 12/31/2019
and 72,747,011 shares at 3/31/2019 (5,470) (5,291) (4,357)Total shareholders' equity 7,402 7,327 7,409Total liabilities and shareholders' equity $ 76,337 $ 73,402 $ 70,690
11
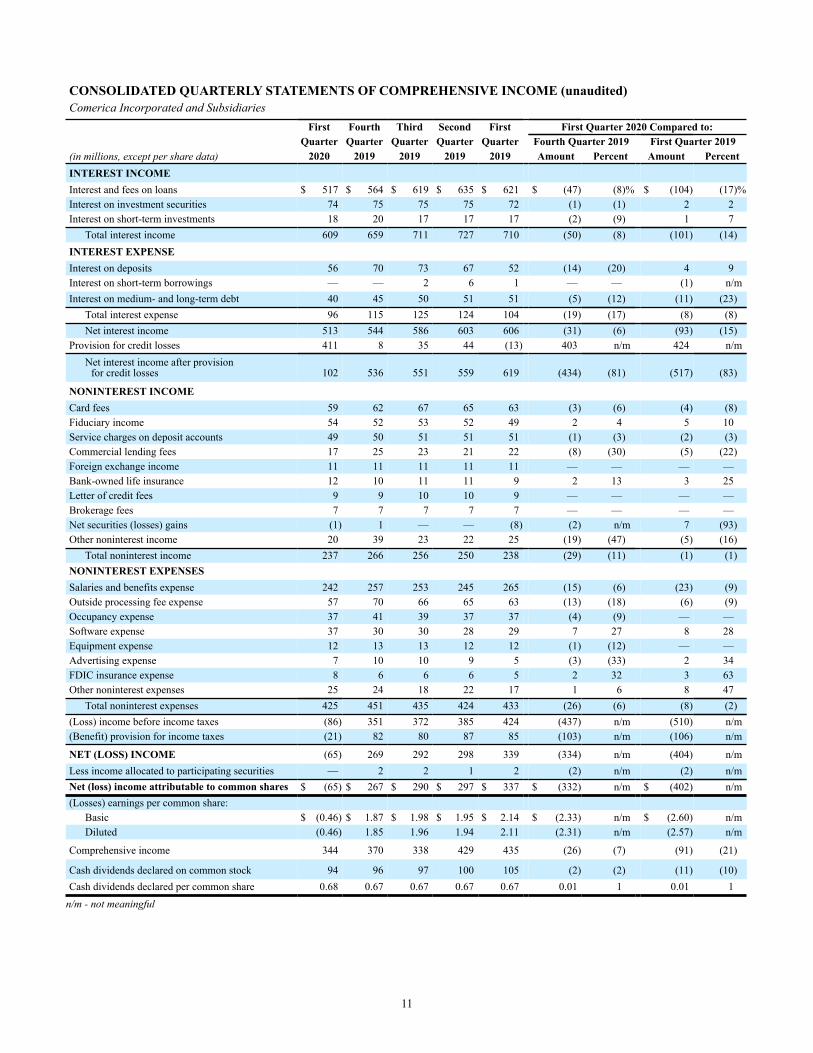
CONSOLIDATED QUARTERLY STATEMENTS OF COMPREHENSIVE INCOME (unaudited)Comerica Incorporated and Subsidiaries
First Fourth Third Second First First Quarter 2020 Compared to:Quarter Quarter Quarter Quarter Quarter Fourth Quarter 2019 First Quarter 2019
(in millions, except per share data) 2020 2019 2019 2019 2019 Amount Percent Amount PercentINTEREST INCOMEInterest and fees on loans $ 517 $ 564 $ 619 $ 635 $ 621 $ (47) (8)% $ (104) (17)%Interest on investment securities 74 75 75 75 72 (1) (1) 2 2Interest on short-term investments 18 20 17 17 17 (2) (9) 1 7
Total interest income 609 659 711 727 710 (50) (8) (101) (14)INTEREST EXPENSEInterest on deposits 56 70 73 67 52 (14) (20) 4 9Interest on short-term borrowings — — 2 6 1 — — (1) n/mInterest on medium- and long-term debt 40 45 50 51 51 (5) (12) (11) (23)
Total interest expense 96 115 125 124 104 (19) (17) (8) (8)Net interest income 513 544 586 603 606 (31) (6) (93) (15)
Provision for credit losses 411 8 35 44 (13) 403 n/m 424 n/mNet interest income after provision
for credit losses 102 536 551 559 619 (434) (81) (517) (83)
NONINTEREST INCOMECard fees 59 62 67 65 63 (3) (6) (4) (8)Fiduciary income 54 52 53 52 49 2 4 5 10Service charges on deposit accounts 49 50 51 51 51 (1) (3) (2) (3)Commercial lending fees 17 25 23 21 22 (8) (30) (5) (22)Foreign exchange income 11 11 11 11 11 — — — —Bank-owned life insurance 12 10 11 11 9 2 13 3 25Letter of credit fees 9 9 10 10 9 — — — —Brokerage fees 7 7 7 7 7 — — — —Net securities (losses) gains (1) 1 — — (8) (2) n/m 7 (93)Other noninterest income 20 39 23 22 25 (19) (47) (5) (16)
Total noninterest income 237 266 256 250 238 (29) (11) (1) (1)NONINTEREST EXPENSESSalaries and benefits expense 242 257 253 245 265 (15) (6) (23) (9)Outside processing fee expense 57 70 66 65 63 (13) (18) (6) (9)Occupancy expense 37 41 39 37 37 (4) (9) — —Software expense 37 30 30 28 29 7 27 8 28Equipment expense 12 13 13 12 12 (1) (12) — —Advertising expense 7 10 10 9 5 (3) (33) 2 34FDIC insurance expense 8 6 6 6 5 2 32 3 63Other noninterest expenses 25 24 18 22 17 1 6 8 47
Total noninterest expenses 425 451 435 424 433 (26) (6) (8) (2)(Loss) income before income taxes (86) 351 372 385 424 (437) n/m (510) n/m(Benefit) provision for income taxes (21) 82 80 87 85 (103) n/m (106) n/m
NET (LOSS) INCOME (65) 269 292 298 339 (334) n/m (404) n/mLess income allocated to participating securities — 2 2 1 2 (2) n/m (2) n/mNet (loss) income attributable to common shares $ (65) $ 267 $ 290 $ 297 $ 337 $ (332) n/m $ (402) n/m(Losses) earnings per common share:
Basic $ (0.46) $ 1.87 $ 1.98 $ 1.95 $ 2.14 $ (2.33) n/m $ (2.60) n/mDiluted (0.46) 1.85 1.96 1.94 2.11 (2.31) n/m (2.57) n/m
Comprehensive income 344 370 338 429 435 (26) (7) (91) (21)
Cash dividends declared on common stock 94 96 97 100 105 (2) (2) (11) (10)Cash dividends declared per common share 0.68 0.67 0.67 0.67 0.67 0.01 1 0.01 1
n/m - not meaningful
12
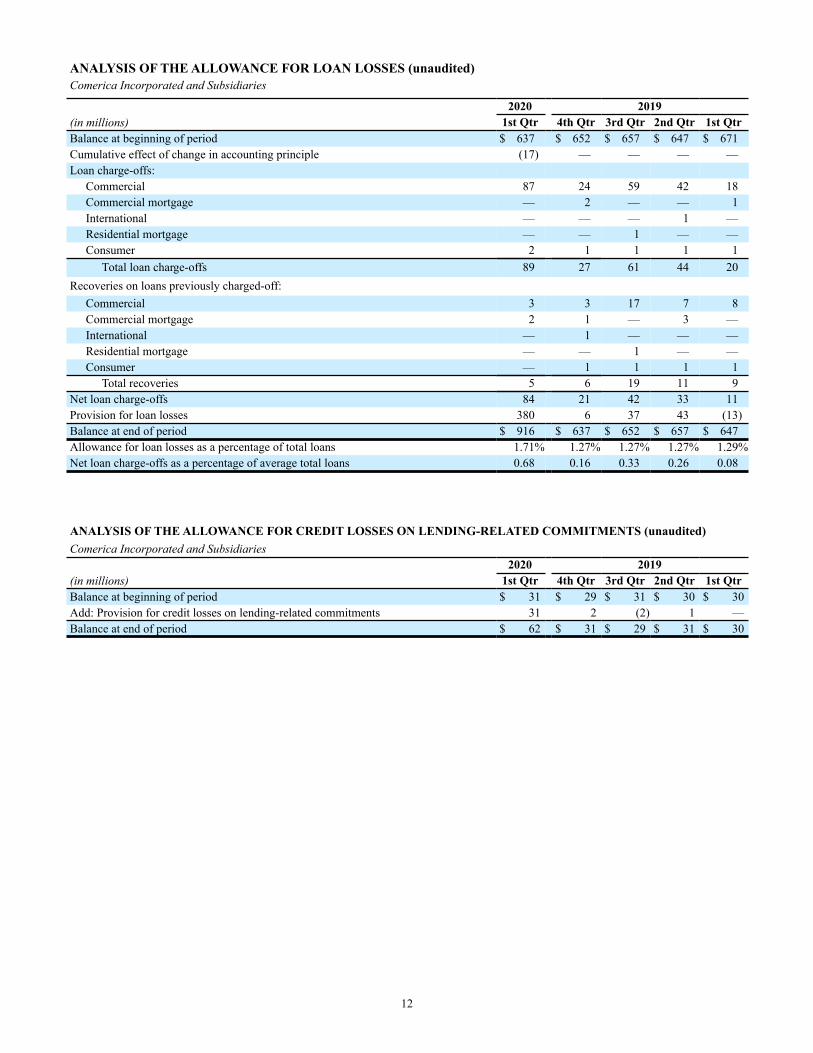
ANALYSIS OF THE ALLOWANCE FOR LOAN LOSSES (unaudited)Comerica Incorporated and Subsidiaries
2020 2019(in millions) 1st Qtr 4th Qtr 3rd Qtr 2nd Qtr 1st QtrBalance at beginning of period $ 637 $ 652 $ 657 $ 647 $ 671Cumulative effect of change in accounting principle (17) — — — —Loan charge-offs:
Commercial 87 24 59 42 18Commercial mortgage — 2 — — 1International — — — 1 —Residential mortgage — — 1 — —Consumer 2 1 1 1 1
Total loan charge-offs 89 27 61 44 20Recoveries on loans previously charged-off:
Commercial 3 3 17 7 8Commercial mortgage 2 1 — 3 —International — 1 — — —Residential mortgage — — 1 — —Consumer — 1 1 1 1
Total recoveries 5 6 19 11 9Net loan charge-offs 84 21 42 33 11Provision for loan losses 380 6 37 43 (13)Balance at end of period $ 916 $ 637 $ 652 $ 657 $ 647Allowance for loan losses as a percentage of total loans 1.71% 1.27% 1.27% 1.27% 1.29%Net loan charge-offs as a percentage of average total loans 0.68 0.16 0.33 0.26 0.08
ANALYSIS OF THE ALLOWANCE FOR CREDIT LOSSES ON LENDING-RELATED COMMITMENTS (unaudited)Comerica Incorporated and Subsidiaries
2020 2019(in millions) 1st Qtr 4th Qtr 3rd Qtr 2nd Qtr 1st QtrBalance at beginning of period $ 31 $ 29 $ 31 $ 30 $ 30Add: Provision for credit losses on lending-related commitments 31 2 (2) 1 —Balance at end of period $ 62 $ 31 $ 29 $ 31 $ 30
13
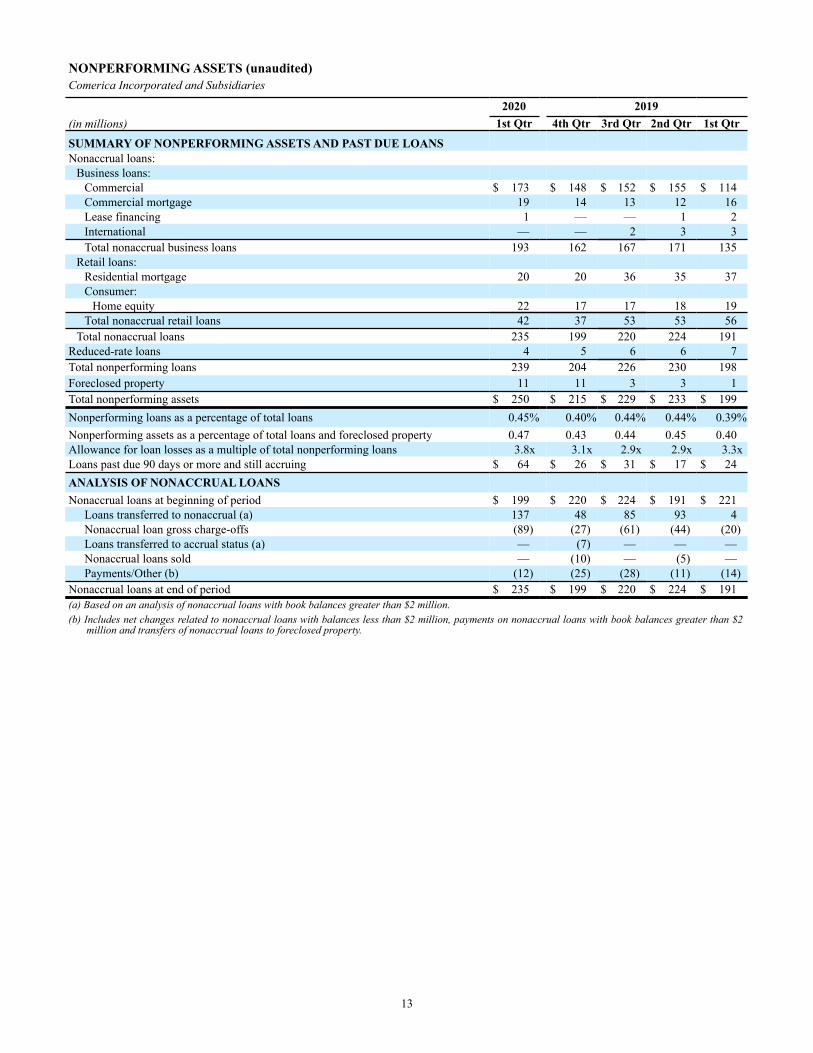
NONPERFORMING ASSETS (unaudited)Comerica Incorporated and Subsidiaries
2020 2019(in millions) 1st Qtr 4th Qtr 3rd Qtr 2nd Qtr 1st Qtr
SUMMARY OF NONPERFORMING ASSETS AND PAST DUE LOANSNonaccrual loans:
Business loans:Commercial $ 173 $ 148 $ 152 $ 155 $ 114Commercial mortgage 19 14 13 12 16Lease financing 1 — — 1 2International — — 2 3 3Total nonaccrual business loans 193 162 167 171 135
Retail loans:Residential mortgage 20 20 36 35 37Consumer:
Home equity 22 17 17 18 19Total nonaccrual retail loans 42 37 53 53 56
Total nonaccrual loans 235 199 220 224 191Reduced-rate loans 4 5 6 6 7Total nonperforming loans 239 204 226 230 198Foreclosed property 11 11 3 3 1Total nonperforming assets $ 250 $ 215 $ 229 $ 233 $ 199Nonperforming loans as a percentage of total loans 0.45% 0.40% 0.44% 0.44% 0.39%Nonperforming assets as a percentage of total loans and foreclosed property 0.47 0.43 0.44 0.45 0.40Allowance for loan losses as a multiple of total nonperforming loans 3.8x 3.1x 2.9x 2.9x 3.3xLoans past due 90 days or more and still accruing $ 64 $ 26 $ 31 $ 17 $ 24ANALYSIS OF NONACCRUAL LOANSNonaccrual loans at beginning of period $ 199 $ 220 $ 224 $ 191 $ 221
Loans transferred to nonaccrual (a) 137 48 85 93 4Nonaccrual loan gross charge-offs (89) (27) (61) (44) (20)Loans transferred to accrual status (a) — (7) — — —Nonaccrual loans sold — (10) — (5) —Payments/Other (b) (12) (25) (28) (11) (14)
Nonaccrual loans at end of period $ 235 $ 199 $ 220 $ 224 $ 191(a) Based on an analysis of nonaccrual loans with book balances greater than $2 million.(b) Includes net changes related to nonaccrual loans with balances less than $2 million, payments on nonaccrual loans with book balances greater than $2
million and transfers of nonaccrual loans to foreclosed property.
14
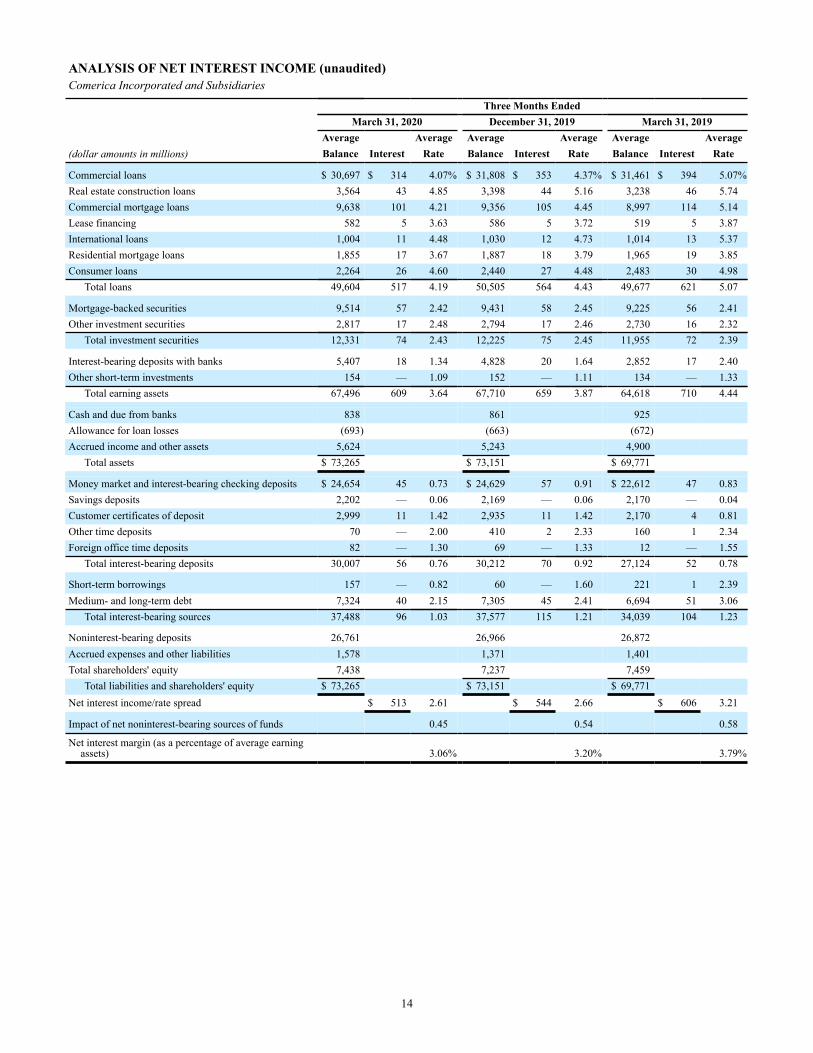
ANALYSIS OF NET INTEREST INCOME (unaudited)Comerica Incorporated and Subsidiaries
Three Months EndedMarch 31, 2020 December 31, 2019 March 31, 2019
Average Average Average Average Average Average(dollar amounts in millions) Balance Interest Rate Balance Interest Rate Balance Interest Rate
Commercial loans $ 30,697 $ 314 4.07% $ 31,808 $ 353 4.37% $ 31,461 $ 394 5.07%Real estate construction loans 3,564 43 4.85 3,398 44 5.16 3,238 46 5.74Commercial mortgage loans 9,638 101 4.21 9,356 105 4.45 8,997 114 5.14Lease financing 582 5 3.63 586 5 3.72 519 5 3.87International loans 1,004 11 4.48 1,030 12 4.73 1,014 13 5.37Residential mortgage loans 1,855 17 3.67 1,887 18 3.79 1,965 19 3.85Consumer loans 2,264 26 4.60 2,440 27 4.48 2,483 30 4.98
Total loans 49,604 517 4.19 50,505 564 4.43 49,677 621 5.07
Mortgage-backed securities 9,514 57 2.42 9,431 58 2.45 9,225 56 2.41Other investment securities 2,817 17 2.48 2,794 17 2.46 2,730 16 2.32
Total investment securities 12,331 74 2.43 12,225 75 2.45 11,955 72 2.39
Interest-bearing deposits with banks 5,407 18 1.34 4,828 20 1.64 2,852 17 2.40Other short-term investments 154 — 1.09 152 — 1.11 134 — 1.33
Total earning assets 67,496 609 3.64 67,710 659 3.87 64,618 710 4.44
Cash and due from banks 838 861 925Allowance for loan losses (693) (663) (672)Accrued income and other assets 5,624 5,243 4,900
Total assets $ 73,265 $ 73,151 $ 69,771
Money market and interest-bearing checking deposits $ 24,654 45 0.73 $ 24,629 57 0.91 $ 22,612 47 0.83Savings deposits 2,202 — 0.06 2,169 — 0.06 2,170 — 0.04Customer certificates of deposit 2,999 11 1.42 2,935 11 1.42 2,170 4 0.81Other time deposits 70 — 2.00 410 2 2.33 160 1 2.34Foreign office time deposits 82 — 1.30 69 — 1.33 12 — 1.55
Total interest-bearing deposits 30,007 56 0.76 30,212 70 0.92 27,124 52 0.78
Short-term borrowings 157 — 0.82 60 — 1.60 221 1 2.39Medium- and long-term debt 7,324 40 2.15 7,305 45 2.41 6,694 51 3.06
Total interest-bearing sources 37,488 96 1.03 37,577 115 1.21 34,039 104 1.23
Noninterest-bearing deposits 26,761 26,966 26,872Accrued expenses and other liabilities 1,578 1,371 1,401Total shareholders' equity 7,438 7,237 7,459
Total liabilities and shareholders' equity $ 73,265 $ 73,151 $ 69,771Net interest income/rate spread $ 513 2.61 $ 544 2.66 $ 606 3.21
Impact of net noninterest-bearing sources of funds 0.45 0.54 0.58
Net interest margin (as a percentage of average earningassets) 3.06% 3.20% 3.79%
15
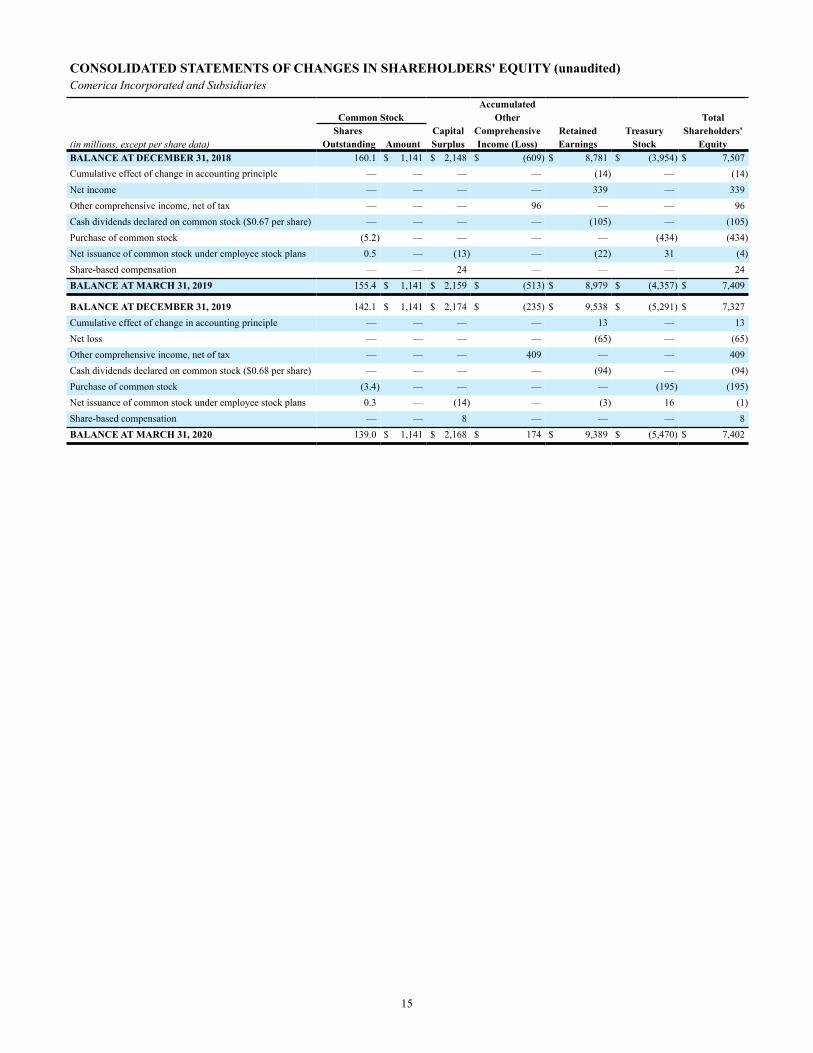
CONSOLIDATED STATEMENTS OF CHANGES IN SHAREHOLDERS' EQUITY (unaudited)Comerica Incorporated and Subsidiaries
AccumulatedCommon Stock Other Total
Shares Capital Comprehensive Retained Treasury Shareholders'(in millions, except per share data) Outstanding Amount Surplus Income (Loss) Earnings Stock EquityBALANCE AT DECEMBER 31, 2018 160.1 $ 1,141 $ 2,148 $ (609) $ 8,781 $ (3,954) $ 7,507Cumulative effect of change in accounting principle — — — — (14) — (14)Net income — — — — 339 — 339Other comprehensive income, net of tax — — — 96 — — 96Cash dividends declared on common stock ($0.67 per share) — — — — (105) — (105)Purchase of common stock (5.2) — — — — (434) (434)Net issuance of common stock under employee stock plans 0.5 — (13) — (22) 31 (4)Share-based compensation — — 24 — — — 24BALANCE AT MARCH 31, 2019 155.4 $ 1,141 $ 2,159 $ (513) $ 8,979 $ (4,357) $ 7,409
BALANCE AT DECEMBER 31, 2019 142.1 $ 1,141 $ 2,174 $ (235) $ 9,538 $ (5,291) $ 7,327Cumulative effect of change in accounting principle — — — — 13 — 13Net loss — — — — (65) — (65)Other comprehensive income, net of tax — — — 409 — — 409Cash dividends declared on common stock ($0.68 per share) — — — — (94) — (94)Purchase of common stock (3.4) — — — — (195) (195)Net issuance of common stock under employee stock plans 0.3 — (14) — (3) 16 (1)Share-based compensation — — 8 — — — 8BALANCE AT MARCH 31, 2020 139.0 $ 1,141 $ 2,168 $ 174 $ 9,389 $ (5,470) $ 7,402
16
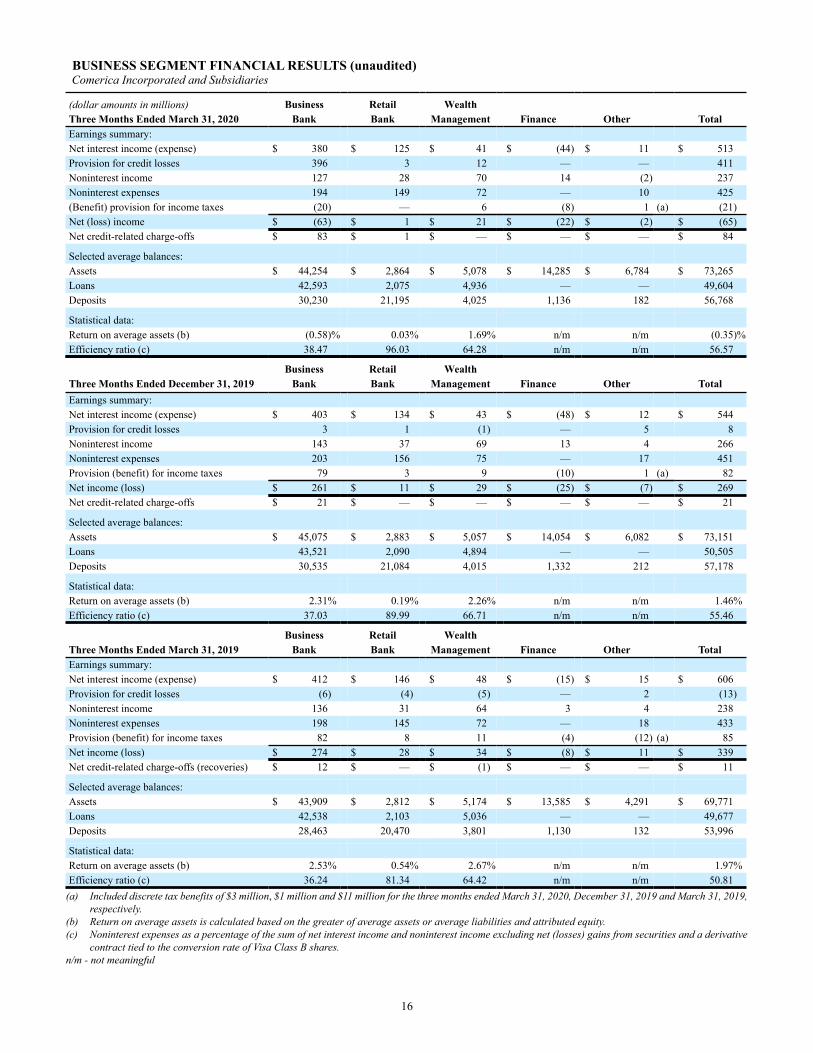
BUSINESS SEGMENT FINANCIAL RESULTS (unaudited) Comerica Incorporated and Subsidiaries
(dollar amounts in millions) Business Retail WealthThree Months Ended March 31, 2020 Bank Bank Management Finance Other TotalEarnings summary:Net interest income (expense) $ 380 $ 125 $ 41 $ (44) $ 11 $ 513Provision for credit losses 396 3 12 — — 411Noninterest income 127 28 70 14 (2) 237Noninterest expenses 194 149 72 — 10 425(Benefit) provision for income taxes (20) — 6 (8) 1 (a) (21)Net (loss) income $ (63) $ 1 $ 21 $ (22) $ (2) $ (65)Net credit-related charge-offs $ 83 $ 1 $ — $ — $ — $ 84
Selected average balances:Assets $ 44,254 $ 2,864 $ 5,078 $ 14,285 $ 6,784 $ 73,265Loans 42,593 2,075 4,936 — — 49,604Deposits 30,230 21,195 4,025 1,136 182 56,768
Statistical data:Return on average assets (b) (0.58)% 0.03% 1.69% n/m n/m (0.35)%Efficiency ratio (c) 38.47 96.03 64.28 n/m n/m 56.57
Business Retail WealthThree Months Ended December 31, 2019 Bank Bank Management Finance Other TotalEarnings summary:Net interest income (expense) $ 403 $ 134 $ 43 $ (48) $ 12 $ 544Provision for credit losses 3 1 (1) — 5 8Noninterest income 143 37 69 13 4 266Noninterest expenses 203 156 75 — 17 451Provision (benefit) for income taxes 79 3 9 (10) 1 (a) 82Net income (loss) $ 261 $ 11 $ 29 $ (25) $ (7) $ 269Net credit-related charge-offs $ 21 $ — $ — $ — $ — $ 21
Selected average balances:Assets $ 45,075 $ 2,883 $ 5,057 $ 14,054 $ 6,082 $ 73,151Loans 43,521 2,090 4,894 — — 50,505Deposits 30,535 21,084 4,015 1,332 212 57,178
Statistical data:Return on average assets (b) 2.31% 0.19% 2.26% n/m n/m 1.46%Efficiency ratio (c) 37.03 89.99 66.71 n/m n/m 55.46
Business Retail WealthThree Months Ended March 31, 2019 Bank Bank Management Finance Other TotalEarnings summary:Net interest income (expense) $ 412 $ 146 $ 48 $ (15) $ 15 $ 606Provision for credit losses (6) (4) (5) — 2 (13)Noninterest income 136 31 64 3 4 238Noninterest expenses 198 145 72 — 18 433Provision (benefit) for income taxes 82 8 11 (4) (12) (a) 85Net income (loss) $ 274 $ 28 $ 34 $ (8) $ 11 $ 339Net credit-related charge-offs (recoveries) $ 12 $ — $ (1) $ — $ — $ 11
Selected average balances:Assets $ 43,909 $ 2,812 $ 5,174 $ 13,585 $ 4,291 $ 69,771Loans 42,538 2,103 5,036 — — 49,677Deposits 28,463 20,470 3,801 1,130 132 53,996
Statistical data:Return on average assets (b) 2.53% 0.54% 2.67% n/m n/m 1.97%Efficiency ratio (c) 36.24 81.34 64.42 n/m n/m 50.81
(a) Included discrete tax benefits of $3 million, $1 million and $11 million for the three months ended March 31, 2020, December 31, 2019 and March 31, 2019, respectively.
(b) Return on average assets is calculated based on the greater of average assets or average liabilities and attributed equity. (c) Noninterest expenses as a percentage of the sum of net interest income and noninterest income excluding net (losses) gains from securities and a derivative
contract tied to the conversion rate of Visa Class B shares. n/m - not meaningful
17
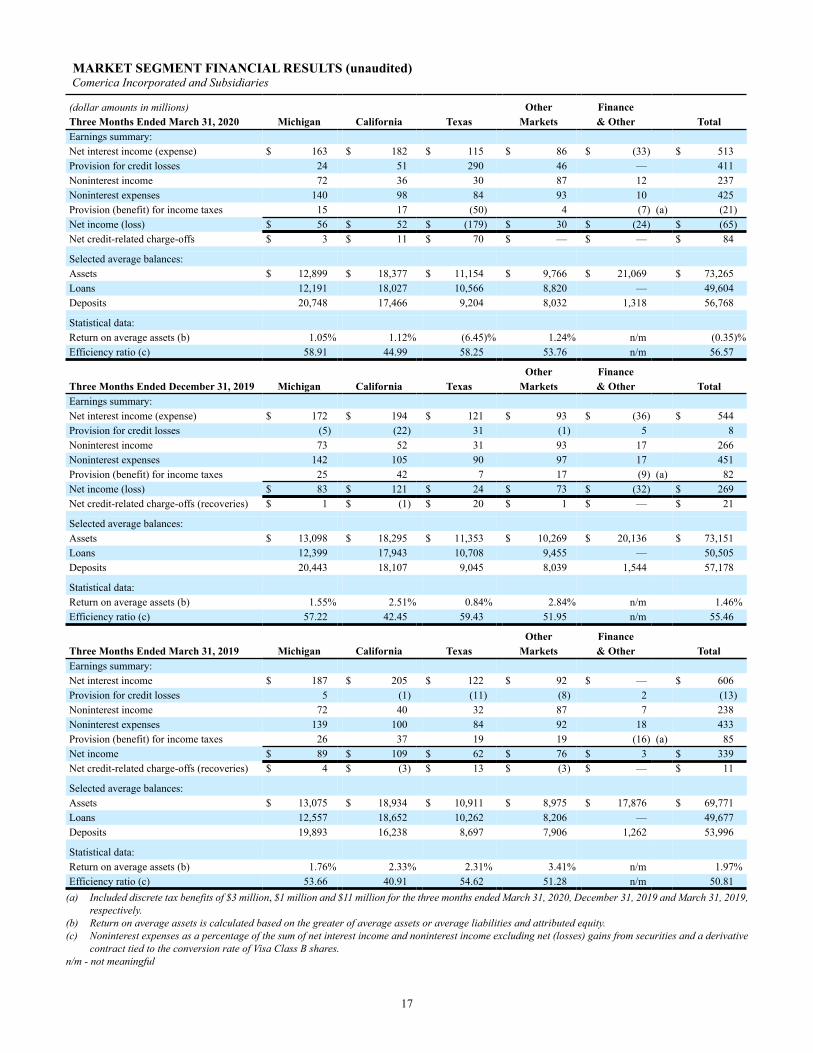
MARKET SEGMENT FINANCIAL RESULTS (unaudited) Comerica Incorporated and Subsidiaries
(dollar amounts in millions) Other FinanceThree Months Ended March 31, 2020 Michigan California Texas Markets & Other TotalEarnings summary:Net interest income (expense) $ 163 $ 182 $ 115 $ 86 $ (33) $ 513Provision for credit losses 24 51 290 46 — 411Noninterest income 72 36 30 87 12 237Noninterest expenses 140 98 84 93 10 425Provision (benefit) for income taxes 15 17 (50) 4 (7) (a) (21)Net income (loss) $ 56 $ 52 $ (179) $ 30 $ (24) $ (65)Net credit-related charge-offs $ 3 $ 11 $ 70 $ — $ — $ 84
Selected average balances:Assets $ 12,899 $ 18,377 $ 11,154 $ 9,766 $ 21,069 $ 73,265Loans 12,191 18,027 10,566 8,820 — 49,604Deposits 20,748 17,466 9,204 8,032 1,318 56,768
Statistical data:Return on average assets (b) 1.05% 1.12% (6.45)% 1.24% n/m (0.35)%Efficiency ratio (c) 58.91 44.99 58.25 53.76 n/m 56.57
Other FinanceThree Months Ended December 31, 2019 Michigan California Texas Markets & Other TotalEarnings summary:Net interest income (expense) $ 172 $ 194 $ 121 $ 93 $ (36) $ 544Provision for credit losses (5) (22) 31 (1) 5 8Noninterest income 73 52 31 93 17 266Noninterest expenses 142 105 90 97 17 451Provision (benefit) for income taxes 25 42 7 17 (9) (a) 82Net income (loss) $ 83 $ 121 $ 24 $ 73 $ (32) $ 269Net credit-related charge-offs (recoveries) $ 1 $ (1) $ 20 $ 1 $ — $ 21
Selected average balances:Assets $ 13,098 $ 18,295 $ 11,353 $ 10,269 $ 20,136 $ 73,151Loans 12,399 17,943 10,708 9,455 — 50,505Deposits 20,443 18,107 9,045 8,039 1,544 57,178
Statistical data:Return on average assets (b) 1.55% 2.51% 0.84% 2.84% n/m 1.46%Efficiency ratio (c) 57.22 42.45 59.43 51.95 n/m 55.46
Other FinanceThree Months Ended March 31, 2019 Michigan California Texas Markets & Other TotalEarnings summary:Net interest income $ 187 $ 205 $ 122 $ 92 $ — $ 606Provision for credit losses 5 (1) (11) (8) 2 (13)Noninterest income 72 40 32 87 7 238Noninterest expenses 139 100 84 92 18 433Provision (benefit) for income taxes 26 37 19 19 (16) (a) 85Net income $ 89 $ 109 $ 62 $ 76 $ 3 $ 339Net credit-related charge-offs (recoveries) $ 4 $ (3) $ 13 $ (3) $ — $ 11
Selected average balances:Assets $ 13,075 $ 18,934 $ 10,911 $ 8,975 $ 17,876 $ 69,771Loans 12,557 18,652 10,262 8,206 — 49,677Deposits 19,893 16,238 8,697 7,906 1,262 53,996
Statistical data:Return on average assets (b) 1.76% 2.33% 2.31% 3.41% n/m 1.97%Efficiency ratio (c) 53.66 40.91 54.62 51.28 n/m 50.81
(a) Included discrete tax benefits of $3 million, $1 million and $11 million for the three months ended March 31, 2020, December 31, 2019 and March 31, 2019, respectively.
(b) Return on average assets is calculated based on the greater of average assets or average liabilities and attributed equity. (c) Noninterest expenses as a percentage of the sum of net interest income and noninterest income excluding net (losses) gains from securities and a derivative
contract tied to the conversion rate of Visa Class B shares. n/m - not meaningful
18
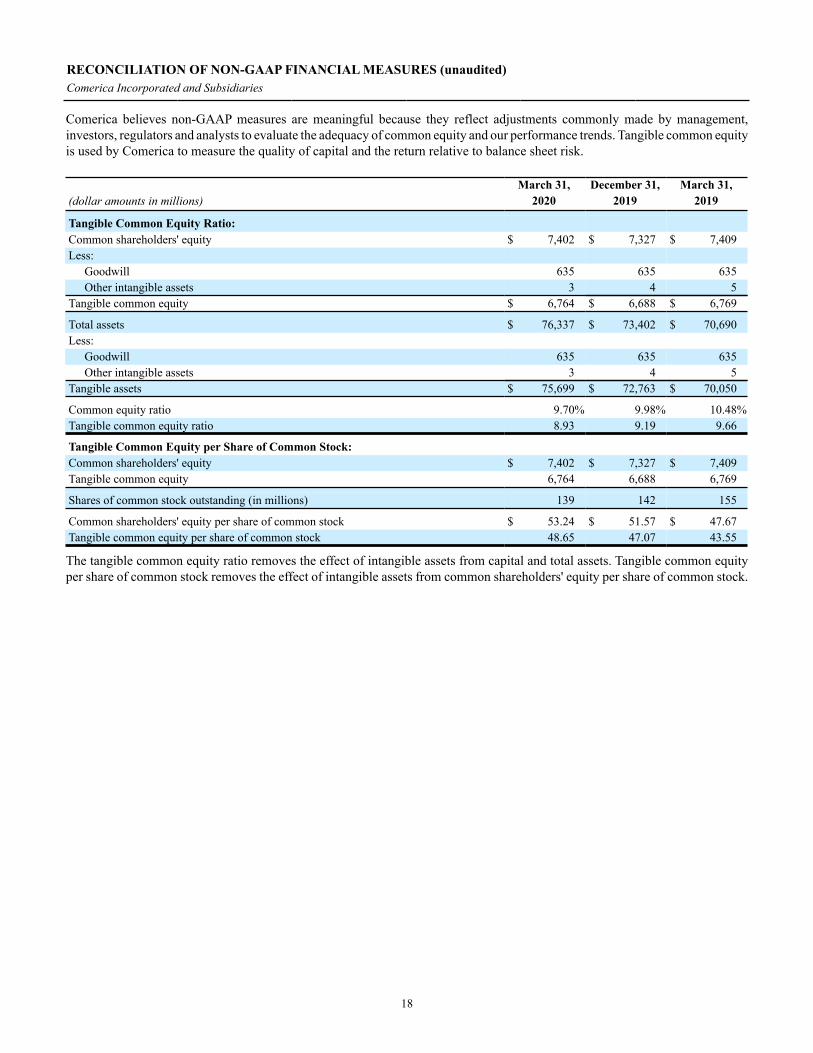
RECONCILIATION OF NON-GAAP FINANCIAL MEASURES (unaudited)Comerica Incorporated and Subsidiaries
Comerica believes non-GAAP measures are meaningful because they reflect adjustments commonly made by management, investors, regulators and analysts to evaluate the adequacy of common equity and our performance trends. Tangible common equity is used by Comerica to measure the quality of capital and the return relative to balance sheet risk.
March 31, December 31, March 31,(dollar amounts in millions) 2020 2019 2019
Tangible Common Equity Ratio:Common shareholders' equity $ 7,402 $ 7,327 $ 7,409Less:
Goodwill 635 635 635Other intangible assets 3 4 5
Tangible common equity $ 6,764 $ 6,688 $ 6,769
Total assets $ 76,337 $ 73,402 $ 70,690Less:
Goodwill 635 635 635Other intangible assets 3 4 5
Tangible assets $ 75,699 $ 72,763 $ 70,050
Common equity ratio 9.70% 9.98% 10.48%Tangible common equity ratio 8.93 9.19 9.66
Tangible Common Equity per Share of Common Stock:Common shareholders' equity $ 7,402 $ 7,327 $ 7,409Tangible common equity 6,764 6,688 6,769
Shares of common stock outstanding (in millions) 139 142 155
Common shareholders' equity per share of common stock $ 53.24 $ 51.57 $ 47.67Tangible common equity per share of common stock 48.65 47.07 43.55
The tangible common equity ratio removes the effect of intangible assets from capital and total assets. Tangible common equity per share of common stock removes the effect of intangible assets from common shareholders' equity per share of common stock.