2020 state business tax climate index · 2020 state business tax climate index note: a rank of 1 is...
TRANSCRIPT

2020 State Business Tax Climate IndexBy Jared Walczak
TAX
FOU
ND
ATION
TAX FOUNDATION | 1EX
ECU
TIVE SU
MM
ARY
Executive SummaryThe Tax Foundation’s State Business Tax Climate Index enables business leaders, government policymakers, and taxpayers to gauge how their states’ tax systems compare. While there are many ways to show how much is collected in taxes by state governments, the Index is designed to show how well states structure their tax systems and provides a road map for improvement.
The absence of a major tax is a common factor among many of the top 10 states. Property taxes and unemployment insurance taxes are levied in every state, but there are several states that do without one or more of the major taxes: the corporate income tax, the individual income tax, or the sales tax. Wyoming, Nevada, and South Dakota have no corporate or individual income tax (though Nevada imposes gross receipts taxes); Alaska has no individual income or state-level sales
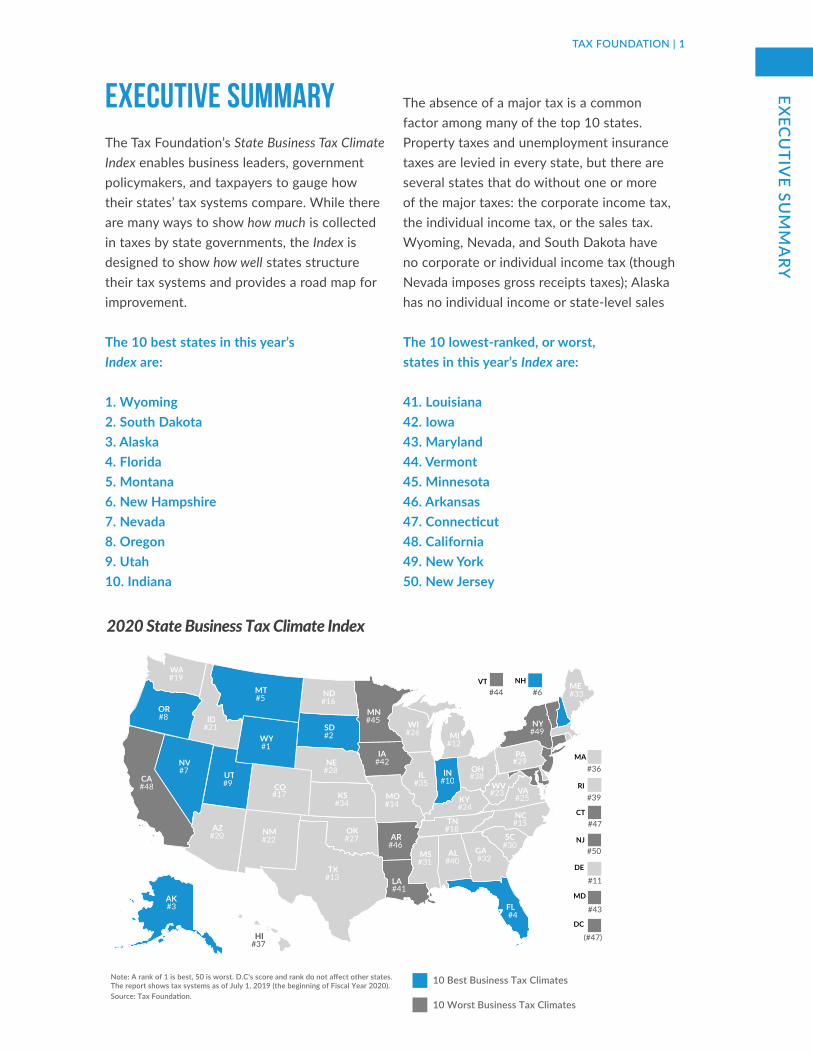
The 10 best states in this year’s Index are:
1. Wyoming2. South Dakota3. Alaska4. Florida5. Montana6. New Hampshire7. Nevada8. Oregon9. Utah10. Indiana
The 10 lowest-ranked, or worst, states in this year’s Index are:
41. Louisiana42. Iowa43. Maryland44. Vermont45. Minnesota46. Arkansas47. Connecticut48. California49. New York50. New Jersey
2020 State Business Tax Climate Index
Note: A rank of 1 is best, 50 is worst. D.C's score and rank do not affect other states. The report shows tax systems as of July 1, 2019 (the beginning of Fiscal Year 2020).Source: Tax Foundation.
10 Best Business Tax Climates
10 Worst Business Tax Climates
VA#25
NC #15
SC #30GA#32
FL #4
AL#40
MS#31
TN #18
KY #24
OH#38IN
#10IL
#35MO#14
AR#46
LA #41
IA#42
MN#45 WI
#26 MI#12
PA#29
NY#49
ME#33
TX#13
OK#27
KS#34
NE#28
SD#2
ND#16
MT#5
WY#1
CO#17
NM#22
AZ#20
UT#9
NV#7
ID#21
OR#8
WA#19
CA#48
AK#3
HI#37
WV#23
NHVT
MA
CT
RI
NJ
DE
MD
DC
#36
#39
#47
#50
#11
#43
(#47)
#6#44
2 | STATE BUSINESS TAX CLIMATE INDEXR
ECEN
T C
HA
NG
ES
tax; Florida has no individual income tax; and New Hampshire, Montana, and Oregon have no sales tax.
This does not mean, however, that a state cannot rank in the top 10 while still levying all the major taxes. Indiana and Utah, for example, levy all of the major tax types, but do so with low rates on broad bases.
The states in the bottom 10 tend to have a number of afflictions in common: complex, nonneutral taxes with comparatively high rates. New Jersey, for example, is hampered by some of the highest property tax burdens in the country, has the second highest-rate corporate income tax in the country and a particularly aggressive treatment of international income, levies an inheritance tax, and maintains some of the nation’s worst-structured individual income taxes.
Notable Ranking Changes in this Year’s IndexArizona
As part of the state’s belated conformity with the new federal tax law, Arizona trimmed its income tax rates, bringing the top rate down from 4.54 to 4.5 percent and consolidating the two lowest brackets.1 The reduction was too modest to improve Arizona’s overall rank, but drove a two-place improvement in Arizona’s rank on the individual income tax component of the Index, from 19th to 17th.
1 Jared Walczak, “Arizona Delivers Rate Cuts and Tax Conformity,” Tax Foundation, June 6, 2019, https://taxfoundation.org/arizona-income-tax-cuts-tax-conformity/.
2 Jared Walczak, “Two States Cut Taxes Due to Federal Tax Reform,” Tax Foundation, March 19, 2018, https://taxfoundation.org/two-states-cut-taxes-due-federal-tax-reform.
3 Katherine Loughead, “State Tax Changes as of July 1, 2019,” Tax Foundation, July 11, 2019, https://taxfoundation.org/state-tax-changes-effective-july-1-2019/.
Georgia
In 2018, in response to base broadening from federal tax reform, Georgia lawmakers adopted a tax cut package which reduces individual and corporate income tax rates from 6.0 to 5.5 percent in two phases, beginning with reductions to 5.75 percent for tax year 2019. Rates are scheduled to revert after 2025, when the federal changes are currently expected to sunset.2 These rate reductions helped Georgia improve four places on this year’s Index, from 36th to 32nd overall, while going from 8th to 6th on the corporate tax component, where the lower rate complements an already competitive overall tax structure, and from 38th to 36th on the individual income tax component. The state’s corporate tax component score, in both the 2019 and 2020 Index, also benefits from the state’s decision to decouple from GILTI, which was newly introduced as an Index variable this year.
Indiana
The only state to make midyear rate adjustments, Indiana made another scheduled adjustment to its corporate income tax rate on July 1, 2019, the Index’s snapshot date, bringing the rate from 5.75 to 5.5 percent.3 This reduction was not enough to improve the state’s already highly competitive overall rank, but, along with modestly negative corporate tax changes in similarly ranked states, helped Indiana improve from 18th to 11th on the corporate tax component of the Index.

TAX FOUNDATION | 3R
ECEN
T CH
AN
GES
TABLE 1.2020 State Business Tax Climate Index Ranks and Component Tax Ranks
Overall RankCorporate Tax
RankIndividual
Income Tax Rank Sales Tax RankProperty Tax Rank
Unemployment Insurance Tax Rank
Alabama 40 23 30 50 15 18Alaska 3 26 1 5 25 46Arizona 20 22 17 40 8 6Arkansas 46 34 40 46 29 23California 48 28 49 45 16 22Colorado 17 7 14 37 14 43Connecticut 47 27 43 26 50 21Delaware 11 50 41 2 6 3Florida 4 9 1 23 13 2Georgia 32 6 36 29 28 39Hawaii 37 16 47 30 11 28Idaho 21 29 26 12 4 48Illinois 35 36 13 33 40 40Indiana 10 11 15 20 2 25Iowa 42 48 42 15 35 35Kansas 34 35 23 38 20 14Kentucky 24 17 18 14 36 49Louisiana 41 37 32 48 33 4Maine 33 38 22 8 43 32Maryland 43 32 45 19 42 33Massachusetts 36 39 11 13 48 50Michigan 12 18 12 9 24 17Minnesota 45 44 46 28 26 34Mississippi 31 10 27 34 37 5Missouri 14 5 24 24 7 9Montana 5 21 25 3 12 20Nebraska 28 31 21 10 41 11Nevada 7 25 5 44 10 47New Hampshire 6 43 9 1 44 45New Jersey 50 49 50 42 47 30New Mexico 22 20 31 41 1 8New York 49 13 48 43 46 38North Carolina 15 3 16 21 34 10North Dakota 16 19 20 27 3 13Ohio 38 42 44 32 9 7Oklahoma 27 8 33 39 19 1Oregon 8 33 38 4 18 36Pennsylvania 29 46 19 17 21 42Rhode Island 39 40 29 25 45 31South Carolina 30 4 34 31 30 26South Dakota 2 1 1 35 22 44Tennessee 18 24 8 47 31 24Texas 13 47 6 36 38 12Utah 9 12 10 22 5 15Vermont 44 45 39 16 49 16Virginia 25 14 35 11 32 41Washington 19 41 6 49 27 19West Virginia 23 15 28 18 17 29Wisconsin 26 30 37 7 23 37Wyoming 1 1 1 6 39 27District of Columbia 47 15 45 36 49 35Note: A rank of 1 is best, 50 is worst. Rankings do not average to the total. States without a tax rank equally as 1. D.C.’s score and rank do not affect other states. The report shows tax systems as of July 1, 2019 (the beginning of Fiscal Year 2020).Source: Tax Foundation.

4 | STATE BUSINESS TAX CLIMATE INDEXR
ECEN
T C
HA
NG
ES
Iowa
This year marked the first phase of Iowa’s tax reform package, which will ultimately convert the state’s nine-bracket individual income tax, with a top rate of 8.98 percent, to a four-bracket tax with a top rate of 6.5 percent, while increasing Section 179 small business expensing and eliminating the state’s unusual policy of federal deductibility. Modest sales tax base broadening also features in the package, and the corporate rate will decline from 12 to 9.8 percent, though that rate reduction remains several years out. This year, the top marginal individual income tax rate was cut from 8.98 to 8.53 percent and the Section 179 expensing allowance rose from $70,000 to $100,000, yielding an improvement of one place on the Index overall, from 43rd to 42nd. Further improvements can be anticipated once additional reforms phase in.
Kansas
Through a combination of legislative inaction, vetoes, and agency actions, Kansas has taken an aggressive stance on the taxation of international income and is moving forward with sales tax collection requirements for remote sellers without adopting a safe harbor for small sellers. Because many of its peers have taken a less aggressive approach to the taxation of international income, and no other state has adopted a remote sales tax regime without a de minimis threshold, Kansas dropped seven places on the Index overall, from 27th to 34th.
4 Jared Walczak, “Missouri Governor Set to Sign Income Tax Cuts,” Tax Foundation, July 11, 2018, https://taxfoundation.org/missouri-governor-set-sign-income-tax-cuts/.
Massachusetts
Massachusetts adopted a payroll tax of 0.63 percent in addition to its individual income tax, which phased down from a 5.1 to a 5.05 percent flat rate. (We consider the 0.63 percent tax an increase in the rate on wage income for purposes of the Index.) The state also increased unemployment insurance rates, reestablished a sales tax holiday, and made other changes which resulted in a decline from 33rd to 36th overall on the Index.
Missouri
A reduction in the state’s top individual income tax rate, from 5.9 to 5.4 percent, along with the consolidation of an income tax bracket, improved the state two places on the individual income tax component, from 26th to 24th. Reforms adopted in 2018 will see the individual income tax rate continue to phase down in future years, with a target of 5.1 percent.4 Next year, the state will no longer give companies the option of choosing the apportionment formula most favorable to them, but this consolidation into a single apportionment formula will pay down a significant corporate income tax rate reduction, from 6.25 to 4 percent, which will further improve the state’s rank.

TAX FOUNDATION | 5R
ECEN
T CH
AN
GES
TABLE 2.State Business Tax Climate Index (2014–2020)
Prior Year Ranks 2019 2020 2019-2020 ChangeState 2014 2015 2016 2017 2018 Rank Score Rank Score Rank ScoreAlabama 39 40 40 38 39 40 4.57 40 4.53 0 -0.04Alaska 4 4 3 3 3 3 7.27 3 7.22 0 -0.05Arizona 19 22 20 18 19 20 5.22 20 5.26 0 0.04Arkansas 41 41 45 42 42 46 4.29 46 4.34 0 0.05California 48 48 48 48 48 49 3.97 48 4.02 1 0.05Colorado 20 20 18 19 17 16 5.34 17 5.30 -1 -0.04Connecticut 47 47 47 47 47 47 4.12 47 4.23 0 0.11Delaware 18 13 14 20 20 11 5.57 11 5.57 0 0.00Florida 5 5 4 4 4 4 6.85 4 6.80 0 -0.05Georgia 30 32 34 34 34 36 4.84 32 4.91 4 0.06Hawaii 29 31 32 26 26 37 4.71 37 4.68 0 -0.04Idaho 15 18 21 21 21 21 5.22 21 5.23 0 0.01Illinois 31 36 27 24 28 35 4.85 35 4.87 0 0.02Indiana 9 9 9 8 8 10 5.70 10 5.59 0 -0.10Iowa 42 42 43 43 44 43 4.40 42 4.38 1 -0.02Kansas 25 26 26 28 27 27 4.99 34 4.88 -7 -0.11Kentucky 35 38 36 37 37 24 5.08 24 5.10 0 0.02Louisiana 37 37 38 46 46 41 4.44 41 4.41 0 -0.02Maine 32 35 37 35 36 31 4.88 33 4.90 -2 0.02Maryland 40 39 39 40 40 42 4.43 43 4.37 -1 -0.06Massachusetts 28 30 29 31 29 33 4.88 36 4.81 -3 -0.07Michigan 11 12 13 12 12 17 5.34 12 5.54 5 0.20Minnesota 44 44 44 44 43 44 4.37 45 4.35 -1 -0.02Mississippi 26 28 30 32 32 30 4.94 31 4.96 -1 0.01Missouri 12 15 19 15 15 14 5.39 14 5.43 0 0.05Montana 6 6 6 6 6 5 6.22 5 6.16 0 -0.06Nebraska 36 27 28 30 31 26 5.06 28 5.01 -2 -0.06Nevada 3 3 5 5 5 6 5.93 7 5.88 -1 -0.05New Hampshire 8 8 8 9 9 7 5.91 6 6.01 1 0.10New Jersey 49 50 50 50 50 50 3.24 50 3.24 0 -0.01New Mexico 24 25 24 25 24 23 5.10 22 5.13 1 0.03New York 50 49 49 49 49 48 4.00 49 4.01 -1 0.00North Carolina 34 11 11 10 10 12 5.47 15 5.43 -3 -0.04North Dakota 17 17 17 17 18 15 5.39 16 5.36 -1 -0.03Ohio 43 43 42 39 41 38 4.68 38 4.67 0 -0.01Oklahoma 22 21 23 23 23 28 4.95 27 5.01 1 0.06Oregon 10 10 10 11 11 9 5.73 8 5.74 1 0.01Pennsylvania 33 33 33 29 30 32 4.88 29 4.97 3 0.09Rhode Island 45 45 41 41 38 39 4.63 39 4.57 0 -0.06South Carolina 27 29 31 33 33 29 4.95 30 4.96 -1 0.01South Dakota 2 2 2 2 2 2 7.28 2 7.34 0 0.06Tennessee 13 16 16 14 14 18 5.29 18 5.29 0 0.00Texas 14 14 12 13 13 13 5.42 13 5.46 0 0.04Utah 7 7 7 7 7 8 5.84 9 5.70 -1 -0.14Vermont 46 46 46 45 45 45 4.36 44 4.35 1 -0.02Virginia 21 24 25 27 25 25 5.07 25 5.02 0 -0.05Washington 16 19 15 16 16 19 5.28 19 5.28 0 0.00West Virginia 23 23 22 22 22 22 5.11 23 5.12 -1 0.01Wisconsin 38 34 35 36 35 34 4.86 26 5.01 8 0.16Wyoming 1 1 1 1 1 1 7.52 1 7.62 0 0.09District of Columbia 47 47 45 48 48 47 4.25 47 4.24 0 -0.01Note: A rank of 1 is best, 50 is worst. All scores are for fiscal years. D.C.'s score and rank do not affect other states.Source: Tax Foundation.

6 | STATE BUSINESS TAX CLIMATE INDEXR
ECEN
T C
HA
NG
ES
New Hampshire
The Granite State climbed from 7th to 6th overall, and from 46th to 43rd on the corporate tax component, by trimming the rates of both its Business Profits Tax, a corporate income tax, and its Business Enterprise Tax, a value-added tax. The Business Profits Tax rate is now 7.7 percent, down from 7.9 percent in 2018 and 8.2 percent before that, while the Business Enterprise Tax now stands at 0.6 percent, having phased down from 0.675 percent last year and 0.72 percent before that.5
North Carolina
North Carolina’s individual income tax rate decreased from 5.499 to 5.25 percent, while the corporate income tax rate—already the nation’s lowest—was cut from 3 to 2.5 percent, completing the latest in several rounds of tax reforms and rate reductions in North Carolina in recent years.6 These improvements, however, did not help the state on the Index overall, because they failed to leapfrog any states on the corporate or individual income tax components, while changes to the state’s unemployment insurance tax regime, along with improvements in other highly competitive states, slid the state three places from 12th to 15th.
5 Jared Walczak, “Tax Changes Taking Effect January 1, 2019,” Tax Foundation, Dec. 27, 2018, https://taxfoundation.org/state-tax-changes-january-2019/.
6 Nicole Kaeding, “North Carolina Continues Its Successful Tax Reforms,” Tax Foundation, Oct. 27, 2017, https://taxfoundation.org/north-carolina-continues-tax-reforms/.
7 Jared Walczak, “Modernizing Utah’s Sales Tax: A Guide for Policymakers,” Tax Foundation, June 4, 2019, https://taxfoundation.org/modernizing-utah-sales-tax/.
8 Joseph Bishop-Henchman, “D.C. Proposes Sales Tax Increase, Other Tax Changes,” Tax Foundation, May 16, 2018, https://taxfoundation.org/d-c-proposes-sales-tax-increase-tax-changes/.
Utah
Utah slid from 8th to 9th on the Index as the state increased its sales tax by 0.15 percentage points in support of Medicaid expansion,7 but barring new developments, the state is likely to reclaim its old position next year, when Oregon (now in 8th place) implements its newly-adopted gross receipts tax.
Wisconsin
The culmination of a tax package adopted in 2017, Wisconsin repealed its alternative minimum tax for individual filers effective January 2019 and improved two places on the individual component of the Index. The state also benefited greatly from other states shifting around it, increasing its overall rank dramatically, to 26th from 34th.
District of Columbia
The federal district slid eight places on the sales tax component of the Index when it raised its sales tax rate from 5.75 to 6 percent, reversing a reduction made in 2013.8 This significant movement is reflective of how many states with similar sales tax structures are tightly bunched around a 6 percent rate. The District of Columbia remains 47th overall, although D.C. is given “phantom” ranks in the Index, meaning that its ranks are given by way of example and do not affect the rankings of the 50 states.

TAX FOUNDATION | 7IN
TROD
UC
TION
AN
D M
ETHO
DO
LOG
Y
Recent and Proposed Changes Not Reflected in the 2020 State Business Tax Climate IndexArkansas
In 2019, Arkansas adopted a package of individual and corporate income tax reforms which will ultimately see the top individual income tax rate decline from 6.9 to 5.9 percent while consolidating six brackets into three, along with a phasedown of the corporate income tax rate from 6.5 to 5.9 percent, and extension of the net operating loss carryforward period from five to 10 years, among other changes.9 The state also raised the gas tax. Because most of these changes are scheduled for later years, Arkansas’ overall rank did not change this year, but they will be reflected in subsequent versions of the Index.
Mississippi
Mississippi has begun phasing out its capital stock tax, following an exemption added in 2018 with the first rate reduction, from 2.5 to 2.25 mills, in 2019. The tax will slowly phase out through 2028, but the modest rate reduction is not enough to move the needle on Index ranks.10
9 Nicole Kaeding and Jeremy Horpedahl, “Recapping the 2019 Arkansas Tax Reform,” Tax Foundation, Apr. 11, 2019, https://taxfoundation.org/recapping-2019-arkansas-tax-reform/.
10 Walczak, “Tax Changes Taking Effect January 1, 2019.”11 Mike Pare, “Tennessee On Its Way to Becoming a Bona Fide No-Income Tax State in 2021,” Chattanooga Times Free Press, Feb. 1, 2019,
https://www.timesfreepress.com/news/edge/story/2019/feb/01/hall-income-tax-ending-2021/487137/. 12 Corey L. Rosenthal and Jessie Hu, “Oregon’s New Commercial Activity Tax,” The CPA Journal (September 2019), https://www.cpajournal.
com/2019/09/18/oregons-new-commercial-activity-tax/.
Tennessee
In 2016, Tennessee began phasing out its Hall Tax, a tax on interest and dividend income, though the state does not tax wage income.11 The Index includes this tax at a calculated rate to reflect its unusually narrow base. Initial reductions are too small to change any component rankings, but Tennessee’s rank will improve once the tax is fully phased out in 2021.
Oregon
In May 2019, the Oregon legislature adopted a modified gross receipts tax, imposed at $250 plus a rate of 0.57 percent on Oregon gross receipts above $1 million. Taxpayers will be permitted to subtract 35 percent of the greater of compensation or the cost of goods sold, putting it somewhere between Ohio’s commercial activity tax and Texas’ franchise (“margin”) tax.12 When the new tax is implemented, Oregon will become one of only two states, with Delaware, to impose both a corporate income tax and a gross receipts tax. However, the new tax is not reflected in the current edition of the Index, as it does not go into effect until January 1, 2020.

8 | STATE BUSINESS TAX CLIMATE INDEXIN
TRO
DU
CTI
ON
AN
D M
ETH
OD
OLO
GY
IntroductionTaxation is inevitable, but the specifics of a state’s tax structure matter greatly. The measure of total taxes paid is relevant, but other elements of a state tax system can also enhance or harm the competitiveness of a state’s business environment. The State Business Tax Climate Index distills many complex considerations to an easy-to-understand ranking.
The modern market is characterized by mobile capital and labor, with all types of businesses, small and large, tending to locate where they have the greatest competitive advantage. The evidence shows that states with the best tax systems will be the most competitive at attracting new businesses and most effective at generating economic and employment growth. It is true that taxes are but one factor in business decision-making. Other concerns also matter–such as access to raw materials or infrastructure or a skilled labor pool–but a simple, sensible tax system can positively impact business operations with regard to these resources. Furthermore, unlike changes to a state’s health-care, transportation, or education systems, which can take decades to implement, changes to the tax code can quickly improve a state’s business climate.
It is important to remember that even in our global economy, states’ stiffest competition often comes from other states. The Department of Labor reports that most mass job relocations are from one U.S. state to another rather than to a foreign location.13 Certainly, job creation is rapid overseas, as previously underdeveloped nations enter the world economy, though in the aftermath of
13 See U.S. Department of Labor, “Extended Mass Layoffs, First Quarter 2013 ,” Table 10, May 13, 2013.14 Daniel Bunn, “Corporate Income Tax Rates Around the World, 2018,” Tax Foundation, Nov. 27, 2018, https://taxfoundation.org/
publications/corporate-tax-rates-around-the-world/. 15 Editorial, “Scale it back, Governor,” Chicago Tribune, March 23, 2007.16 Ryan Randazzo, Edythe Jenson, and Mary Jo Pitzl, “Cathy Carter Blog: Chandler getting new $5 billion Intel facility,” AZCentral.com, Mar. 6,
2013.17 Dana Hedgpeth and Rosalind Helderman, “Northrop Grumman decides to move headquarters to Northern Virginia,” The Washington Post,
April 27, 2010. 18 Susan Haigh, “Connecticut House Speaker: Tax ‘mistakes’ made in budget,” Associated Press, Nov. 5, 2015.
federal tax reform, U.S. businesses no longer face the third-highest corporate tax rate in the world, but rather one in line with averages for industrialized nations.14 State lawmakers are right to be concerned about how their states rank in the global competition for jobs and capital, but they need to be more concerned with companies moving from Detroit, Michigan, to Dayton, Ohio, than from Detroit to New Delhi, India. This means that state lawmakers must be aware of how their states’ business climates match up against their immediate neighbors and to other regional competitor states.
Anecdotes about the impact of state tax systems on business investment are plentiful. In Illinois early last decade, hundreds of millions of dollars of capital investments were delayed when then-Governor Rod Blagojevich (D) proposed a hefty gross receipts tax.15 Only when the legislature resoundingly defeated the bill did the investment resume. In 2005, California-based Intel decided to build a multibillion-dollar chip-making facility in Arizona due to its favorable corporate income tax system.16 In 2010, Northrup Grumman chose to move its headquarters to Virginia over Maryland, citing the better business tax climate.17 In 2015, General Electric and Aetna threatened to decamp from Connecticut if the governor signed a budget that would increase corporate tax burdens, and General Electric actually did so.18 Anecdotes such as these reinforce what we know from economic theory: taxes matter to businesses, and those places with the most competitive tax systems will reap the benefits of business-friendly tax climates.

TAX FOUNDATION | 9IN
TROD
UC
TION
AN
D M
ETHO
DO
LOG
Y
Tax competition is an unpleasant reality for state revenue and budget officials, but it is an effective restraint on state and local taxes. When a state imposes higher taxes than a neighboring state, businesses will cross the border to some extent. Therefore, states with more competitive tax systems score well in the Index, because they are best suited to generate economic growth.
State lawmakers are mindful of their states’ business tax climates, but they are sometimes tempted to lure business with lucrative tax incentives and subsidies instead of broad-based tax reform. This can be a dangerous proposition, as the example of Dell Computers and North Carolina illustrates. North Carolina agreed to $240 million worth of incentives to lure Dell to the state. Many of the incentives came in the form of tax credits from the state and local governments. Unfortunately, Dell announced in 2009 that it would be closing the plant after only four years of operations.19 A 2007 USA TODAY article chronicled similar problems other states have had with companies that receive generous tax incentives.20
Lawmakers make these deals under the banner of job creation and economic development, but the truth is that if a state needs to offer such packages, it is most likely covering for an undesirable business tax climate. A far more effective approach is the systematic improvement of the state’s business tax climate for the long term to improve the state’s competitiveness. When assessing which changes to make, lawmakers need to remember two rules:
19 Austin Mondine, “Dell cuts North-Carolina plant despite $280m sweetener,” TheRegister.co.uk, Oct. 8, 2009.20 Dennis Cauchon, “Business Incentives Lose Luster for States,” USA TODAY, Aug. 22, 2007.
1. Taxes matter to business. Business taxes affect business decisions, job creation and retention, plant location, competitiveness, the transparency of the tax system, and the long-term health of a state’s economy. Most importantly, taxes diminish profits. If taxes take a larger portion of profits, that cost is passed along to either consumers (through higher prices), employees (through lower wages or fewer jobs), or shareholders (through lower dividends or share value), or some combination of the above. Thus, a state with lower tax costs will be more attractive to business investment and more likely to experience economic growth.
2. States do not enact tax changes (increases or cuts) in a vacuum. Every tax law will in some way change a state’s competitive position relative to its immediate neighbors, its region, and even globally. Ultimately, it will affect the state’s national standing as a place to live and to do business. Entrepreneurial states can take advantage of the tax increases of their neighbors to lure businesses out of high-tax states.
To some extent, tax-induced economic distortions are a fact of life, but policymakers should strive to maximize the occasions when businesses and individuals are guided by business principles and minimize those cases where economic decisions are influenced, micromanaged, or even dictated by a tax system. The more riddled a tax system is with politically motivated preferences, the less likely it is that business decisions will be made in response to market forces. The Index rewards those states that minimize tax-induced economic distortions.
Ranking the competitiveness of 50 very different tax systems presents many challenges, especially when a state dispenses
10 | STATE BUSINESS TAX CLIMATE INDEXIN
TRO
DU
CTI
ON
AN
D M
ETH
OD
OLO
GY
with a major tax entirely. Should Indiana’s tax system, which includes three relatively neutral taxes on sales, individual income, and corporate income, be considered more or less competitive than Alaska’s tax system, which includes a particularly burdensome corporate income tax but no statewide tax on individual income or sales?
The Index deals with such questions by comparing the states on more than 120 variables in the five major areas of taxation (corporate taxes, individual income taxes, sales taxes, unemployment insurance taxes, and property taxes) and then adding the results to yield a final, overall ranking. This approach rewards states on particularly strong aspects of their tax systems (or penalizes them on particularly weak aspects), while measuring the general competitiveness of their overall tax systems. The result is a score that can be compared to other states’ scores. Ultimately, both Alaska and Indiana score well.
Literature ReviewEconomists have not always agreed on how individuals and businesses react to taxes. As early as 1956, Charles Tiebout postulated that if citizens were faced with an array of communities that offered different types or levels of public goods and services at different costs or tax levels, then all citizens would choose the community that best satisfied their particular demands, revealing their preferences by “voting with their feet.” Tiebout’s article is the seminal work on the topic of how taxes affect the location decisions of taxpayers.
Tiebout suggested that citizens with high demands for public goods would concentrate in communities with high levels of public services and high taxes while those with low demands would choose communities with low levels of public services and low taxes. Competition among jurisdictions results in a variety of
communities, each with residents who all value public services similarly.
However, businesses sort out the costs and benefits of taxes differently from individuals. For businesses, which can be more mobile and must earn profits to justify their existence, taxes reduce profitability. Theoretically, businesses could be expected to be more responsive than individuals to the lure of low-tax jurisdictions. Research suggests that corporations engage in “yardstick competition,” comparing the costs of government services across jurisdictions. Shleifer (1985) first proposed comparing regulated franchises in order to determine efficiency. Salmon (1987) extended Shleifer’s work to look at subnational governments. Besley and Case (1995) showed that “yardstick competition” affects voting behavior, and Bosch and Sole-Olle (2006) further confirmed the results found by Besley and Case. Tax changes that are out of sync with neighboring jurisdictions will impact voting behavior.
The economic literature over the past 50 years has slowly cohered around this hypothesis. Ladd (1998) summarizes the post-World War II empirical tax research literature in an excellent survey article, breaking it down into three distinct periods of differing ideas about taxation: (1) taxes do not change behavior; (2) taxes may or may not change business behavior depending on the circumstances; and (3) taxes definitely change behavior.
Period one, with the exception of Tiebout, included the 1950s, 1960s, and 1970s and is summarized succinctly in three survey articles: Due (1961), Oakland (1978), and Wasylenko (1981). Due’s was a polemic against tax giveaways to businesses, and his analytical techniques consisted of basic correlations, interview studies, and the examination of taxes relative to other costs. He found no evidence to support the notion that taxes influence business location. Oakland was skeptical

TAX FOUNDATION | 11IN
TROD
UC
TION
AN
D M
ETHO
DO
LOG
Y
of the assertion that tax differentials at the local level had no influence at all. However, because econometric analysis was relatively unsophisticated at the time, he found no significant articles to support his intuition. Wasylenko’s survey of the literature found some of the first evidence indicating that taxes do influence business location decisions. However, the statistical significance was lower than that of other factors such as labor supply and agglomeration economies. Therefore, he dismissed taxes as a secondary factor at most.
Period two was a brief transition during the early- to mid-1980s. This was a time of great ferment in tax policy as Congress passed major tax bills, including the so-called Reagan tax cut in 1981 and a dramatic reform of the federal tax code in 1986. Articles revealing the economic significance of tax policy proliferated and became more sophisticated. For example, Wasylenko and McGuire (1985) extended the traditional business location literature to nonmanufacturing sectors and found, “Higher wages, utility prices, personal income tax rates, and an increase in the overall level of taxation discourage employment growth in several industries.” However, Newman and Sullivan (1988) still found a mixed bag in “their observation that significant tax effects [only] emerged when models were carefully specified.”
Ladd was writing in 1998, so her “period three” started in the late 1980s and continued up to 1998, when the quantity and quality of articles increased significantly. Articles that fit into period three begin to surface as early as 1985, as Helms (1985) and Bartik (1985) put forth forceful arguments based on empirical research that taxes guide business decisions. Helms concluded that a state’s ability to attract, retain, and encourage business activity is significantly affected by its pattern of taxation. Furthermore, tax increases significantly retard economic growth when the revenue is used to fund transfer payments. Bartik concluded
that the conventional view that state and local taxes have little effect on business is false.
Papke and Papke (1986) found that tax differentials among locations may be an important business location factor, concluding that consistently high business taxes can represent a hindrance to the location of industry. Interestingly, they use the same type of after-tax model used by Tannenwald (1996), who reaches a different conclusion.
Bartik (1989) provides strong evidence that taxes have a negative impact on business start-ups. He finds specifically that property taxes, because they are paid regardless of profit, have the strongest negative effect on business. Bartik’s econometric model also predicts tax elasticities of -0.1 to -0.5 that imply a 10 percent cut in tax rates will increase business activity by 1 to 5 percent. Bartik’s findings, as well as those of Mark, McGuire, and Papke (2000), and ample anecdotal evidence of the importance of property taxes, buttress the argument for inclusion of a property index devoted to property-type taxes in the Index.
By the early 1990s, the literature had expanded sufficiently for Bartik (1991) to identify 57 studies on which to base his literature survey. Ladd succinctly summarizes Bartik’s findings:
The large number of studies permitted Bartik to take a different approach from the other authors. Instead of dwelling on the results and limitations of each individual study, he looked at them in the aggregate and in groups. Although he acknowledged potential criticisms of individual studies, he convincingly argued that some systematic flaw would have to cut across all studies for the consensus results to be invalid. In striking contrast to previous reviewers, he concluded
12 | STATE BUSINESS TAX CLIMATE INDEXIN
TRO
DU
CTI
ON
AN
D M
ETH
OD
OLO
GY
that taxes have quite large and significant effects on business activity.
Ladd’s “period three” surely continues to this day. Agostini and Tulayasathien (2001) examined the effects of corporate income taxes on the location of foreign direct investment in U.S. states. They determined that for “foreign investors, the corporate tax rate is the most relevant tax in their investment decision.” Therefore, they found that foreign direct investment was quite sensitive to states’ corporate tax rates.
Mark, McGuire, and Papke (2000) found that taxes are a statistically significant factor in private-sector job growth. Specifically, they found that personal property taxes and sales taxes have economically large negative effects on the annual growth of private employment.
Harden and Hoyt (2003) point to Phillips and Gross (1995) as another study contending that taxes impact state economic growth, and they assert that the consensus among recent literature is that state and local taxes negatively affect employment levels. Harden and Hoyt conclude that the corporate income tax has the most significant negative impact on the rate of growth in employment.
Gupta and Hofmann (2003) regressed capital expenditures against a variety of factors, including weights of apportionment formulas, the number of tax incentives, and burden figures. Their model covered 14 years of data and determined that firms tend to locate property in states where they are subject to lower income tax burdens. Furthermore, Gupta and Hofmann suggest that throwback requirements are the most influential on the location of capital investment, followed by apportionment weights and tax rates, and that investment-related incentives have the least impact.
Other economists have found that taxes on specific products can produce behavioral results similar to those that were found in these general studies. For example, Fleenor (1998) looked at the effect of excise tax differentials between states on cross-border shopping and the smuggling of cigarettes. Moody and Warcholik (2004) examined the cross-border effects of beer excises. Their results, supported by the literature in both cases, showed significant cross-border shopping and smuggling between low-tax states and high-tax states.
Fleenor found that shopping areas sprouted in counties of low-tax states that shared a border with a high-tax state, and that approximately 13.3 percent of the cigarettes consumed in the United States during FY 1997 were procured via some type of cross-border activity. Similarly, Moody and Warcholik found that in 2000, 19.9 million cases of beer, on net, moved from low- to high-tax states. This amounted to some $40 million in sales and excise tax revenue lost in high-tax states.
Although the literature has largely congealed around a general consensus that taxes are a substantial factor in the decision-making process for businesses, disputes remain, and some scholars are unconvinced.
Based on a substantial review of the literature on business climates and taxes, Wasylenko (1997) concludes that taxes do not appear to have a substantial effect on economic activity among states. However, his conclusion is premised on there being few significant differences in state tax systems. He concedes that high-tax states will lose economic activity to average or low-tax states “as long as the elasticity is negative and significantly different from zero.” Indeed, he approvingly cites a State Policy Reports article that finds that the highest-tax states, such as Minnesota, Wisconsin, and New York, have acknowledged

TAX FOUNDATION | 13IN
TROD
UC
TION
AN
D M
ETHO
DO
LOG
Y
that high taxes may be responsible for the low rates of job creation in those states.21
Wasylenko’s rejoinder is that policymakers routinely overestimate the degree to which tax policy affects business location decisions and that as a result of this misperception, they respond readily to public pressure for jobs and economic growth by proposing lower taxes. According to Wasylenko, other legislative actions are likely to accomplish more positive economic results because in reality, taxes do not drive economic growth.
However, there is ample evidence that states compete for businesses using their tax systems. A recent example comes from Illinois, where in early 2011 lawmakers passed two major tax increases. The individual income tax rate increased from 3 percent to 5 percent, and the corporate income tax rate rose from 7.3 percent to 9.5 percent.22 The result was that many businesses threatened to leave the state, including some very high-profile Illinois companies such as Sears and the Chicago Mercantile Exchange. By the end of the year, lawmakers had cut deals with both firms, totaling $235 million over the next decade, to keep them from leaving the state.23
A new literature review, Kleven et al. (2019), summarizes recent evidence for tax-driven migration. Meanwhile, Giroud and Rauh (2019) use microdata on multistate firms to estimate the impact of state taxes on business activity, and find that C corporation employment and establishments have short-run corporate tax elasticities of -0.4 to -0.5, while pass-through entities show elasticities of -0.2 to -0.4, meaning that, for each percentage-point 21 State Policy Reports, Vol. 12, No. 11, Issue 1, p. 9, June 1994. 22 Both rate increases had a temporary component and were allowed to partially expire before legislators overrode a gubernatorial veto to
increase rates above where they would have been should they have been allowed to sunset.23 Benjamin Yount, “Tax increase, impact, dominate Illinois Capitol in 2011,” Illinois Statehouse News, Dec. 27, 2011. 24 A trend in tax literature throughout the 1990s was the increasing use of indices to measure a state’s general business climate. These
include the Center for Policy and Legal Studies’ Economic Freedom in America’s 50 States: A 1999 Analysis and the Beacon Hill Institute’s State Competitiveness Report 2001. Such indexes even exist on the international level, including the Heritage Foundation and The Wall Street Journal’s 2004 Index of Economic Freedom. Plaut and Pluta (1983) examined the use of business climate indices as explanatory variables for business location movements. They found that such general indices do have a significant explanatory power, helping to explain, for example, why businesses have moved from the Northeast and Midwest toward the South and Southwest. In turn, they also found that high taxes have a negative effect on employment growth.
increase in the rate, employment decreases by 0.4 to 0.5 percent for C corporations subject to the corporate income tax, and by 0.2 to 0.4 percent within pass-through businesses subject to the individual income tax.
Measuring the Impact of Tax Differentials Some recent contributions to the literature on state taxation criticize business and tax climate studies in general.24 Authors of such studies contend that comparative reports like the State Business Tax Climate Index do not take into account those factors which directly impact a state’s business climate. However, a careful examination of these criticisms reveals that the authors believe taxes are unimportant to businesses and therefore dismiss the studies as merely being designed to advocate low taxes.
Peter Fisher’s Grading Places: What Do the Business Climate Rankings Really Tell Us? now published by Good Jobs First, criticizes four indices: The U.S. Business Policy Index published by the Small Business and Entrepreneurship Council, Beacon Hill’s Competitiveness Report, the American Legislative Exchange Council’s Rich States, Poor States, and this study. The first edition also critiqued the Cato Institute’s Fiscal Policy Report Card and the Economic Freedom Index by the Pacific Research Institute. In the report’s first edition, published before Fisher summarized his objections: “The underlying problem with the … indexes, of course, is twofold: none of them actually do a very good job of measuring what it is they claim to measure, and they do not, for the most part,

14 | STATE BUSINESS TAX CLIMATE INDEXIN
TRO
DU
CTI
ON
AN
D M
ETH
OD
OLO
GY
set out to measure the right things to begin with” (Fisher 2005). In the second edition, he identified three overarching questions: (1) whether the indices included relevant variables, and only relevant variables; (2) whether these variables measured what they purport to measure; and (3) how the index combines these measures into a single index number (Fisher 2013). Fisher’s primary argument is that if the indexes did what they purported to do, then all five would rank the states similarly.
Fisher’s conclusion holds little weight because the five indices serve such dissimilar purposes, and each group has a different area of expertise. There is no reason to believe that the Tax Foundation’s Index, which depends entirely on state tax laws, would rank the states in the same or similar order as an index that includes crime rates, electricity costs, and health care (the Small Business and Entrepreneurship Council’s Small Business Survival Index), or infant mortality rates and the percentage of adults in the workforce (Beacon Hill’s State Competitiveness Report), or charter schools, tort reform, and minimum wage laws (the Pacific Research Institute’s Economic Freedom Index).
The Tax Foundation’s State Business Tax Climate Index is an indicator of which states’ tax systems are the most hospitable to business and economic growth. The Index does not purport to measure economic opportunity or freedom, or even the broad business climate, but rather the narrower business tax climate, and its variables reflect this focus. We do so not only because the Tax Foundation’s expertise is in taxes, but because every component of the Index is subject to immediate change by state lawmakers. It is by no means clear what the best course of action is for state lawmakers who want to thwart crime, for example, either in the short or long term, but they can change their tax codes now. Contrary to Fisher’s 1970s’ view that the
effects of taxes are “small or non-existent,” our study reflects strong evidence that business decisions are significantly impacted by tax considerations.
Although Fisher does not feel tax climates are important to states’ economic growth, other authors contend the opposite. Bittlingmayer, Eathington, Hall, and Orazem (2005) find in their analysis of several business climate studies that a state’s tax climate does affect its economic growth rate and that several indices are able to predict growth. Specifically, they concluded, “The State Business Tax Climate Index explains growth consistently.” This finding was confirmed by Anderson (2006) in a study for the Michigan House of Representatives, and more recently by Kolko, Neumark, and Mejia (2013), who, in an analysis of the ability of 10 business climate indices to predict economic growth, concluded that the State Business Tax Climate Index yields “positive, sizable, and statistically significant estimates for every specification” they measured, and specifically cited the Index as one of two business climate indices (out of 10) with particularly strong and robust evidence of predictive power.
Bittlingmayer et al. also found that relative tax competitiveness matters, especially at the borders, and therefore, indices that place a high premium on tax policies do a better job of explaining growth. They also observed that studies focused on a single topic do better at explaining economic growth at borders. Lastly, the article concludes that the most important elements of the business climate are tax and regulatory burdens on business (Bittlingmayer et al. 2005). These findings support the argument that taxes impact business decisions and economic growth, and they support the validity of the Index.
Fisher and Bittlingmayer et al. hold opposing views about the impact of taxes on economic growth. Fisher finds support from Robert

TAX FOUNDATION | 15IN
TROD
UC
TION
AN
D M
ETHO
DO
LOG
Y
Tannenwald, formerly of the Boston Federal Reserve, who argues that taxes are not as important to businesses as public expenditures. Tannenwald compares 22 states by measuring the after-tax rate of return to cash flow of a new facility built by a representative firm in each state. This very different approach attempts to compute the marginal effective tax rate of a hypothetical firm and yields results that make taxes appear trivial.
The taxes paid by businesses should be a concern to everyone because they are ultimately borne by individuals through lower wages, increased prices, and decreased shareholder value. States do not institute tax policy in a vacuum. Every change to a state’s tax system makes its business tax climate more or less competitive compared to other states and makes the state more or less attractive to business. Ultimately, anecdotal and empirical evidence, along with the cohesion of recent literature around the conclusion that taxes matter a great deal to business, show that the Index is an important and useful tool for policymakers who want to make their states’ tax systems welcoming to business.
MethodologyThe Tax Foundation’s State Business Tax Climate Index is a hierarchical structure built from five components:
· Individual Income Tax · Sales Tax · Corporate Income Tax · Property Tax · Unemployment Insurance Tax
Using the economic literature as our guide, we designed these five components to score each state’s business tax climate on a scale of 0 (worst) to 10 (best). Each component is devoted to a major area of state taxation and
includes numerous variables. Overall, there are 124 variables measured in this report.
The five components are not weighted equally, as they are in some indices. Rather, each component is weighted based on the variability of the 50 states’ scores from the mean. The standard deviation of each component is calculated and a weight for each component is created from that measure. The result is a heavier weighting of those components with greater variability. The weighting of each of the five major components is:
· 30.2% — Individual Income Tax · 24.0% — Sales Tax · 19.7% — Corporate Tax · 16.6% — Property Tax · 9.5% — Unemployment Insurance Tax
This improves the explanatory power of the State Business Tax Climate Index as a whole, because components with higher standard deviations are those areas of tax law where some states have significant competitive advantages. Businesses that are comparing states for new or expanded locations must give greater emphasis to tax climates when the differences are large. On the other hand, components in which the 50 state scores are clustered together, closely distributed around the mean, are those areas of tax law where businesses are more likely to de-emphasize tax factors in their location decisions. For example, Delaware is known to have a significant advantage in sales tax competition, because its tax rate of zero attracts businesses and shoppers from all over the Mid-Atlantic region. That advantage and its drawing power increase every time another state raises its sales tax.
In contrast with this variability in state sales tax rates, unemployment insurance tax systems are similar around the nation, so a small change in one state’s law could change its component ranking dramatically.

16 | STATE BUSINESS TAX CLIMATE INDEXIN
TRO
DU
CTI
ON
AN
D M
ETH
OD
OLO
GY
Within each component are two equally weighted subindices devoted to measuring the impact of the tax rates and the tax bases. Each subindex is composed of one or more variables. There are two types of variables: scalar variables and dummy variables. A scalar variable is one that can have any value between 0 and 10. If a subindex is composed only of scalar variables, then they are weighted equally. A dummy variable is one that has only a value of 0 or 1. For example, a state either indexes its brackets for inflation or does not. Mixing scalar and dummy variables within a subindex is problematic, because the extreme valuation of a dummy can overly influence the results of the subindex. To counter this effect, the Index generally weights scalar variables 80 percent and dummy variables 20 percent.
Relative versus Absolute IndexingThe State Business Tax Climate Index is designed as a relative index rather than an absolute or ideal index. In other words, each variable is ranked relative to the variable’s range in other states. The relative scoring scale is from 0 to 10, with zero meaning not “worst possible” but rather worst among the 50 states.
Many states’ tax rates are so close to each other that an absolute index would not provide enough information about the differences among the states’ tax systems, especially for pragmatic business owners who want to know which states have the best tax system in each region.
Comparing States without a Tax. One problem associated with a relative scale is that it is mathematically impossible to compare states with a given tax to states that do not have the tax. As a zero rate is the lowest possible rate and the most neutral base, since it creates the most favorable tax climate for economic growth, those states with a zero rate on individual income, corporate income, or sales
gain an immense competitive advantage. Therefore, states without a given tax generally receive a 10, and the Index measures all the other states against each other.
Three notable exceptions to this rule exist. The first is in Washington and Texas, which do not have taxes on wage income but do apply their gross receipts taxes to limited liability corporations (LLCs) and S corporations. Because these entities are generally taxed through the individual code, these two states do not score perfectly in the individual income tax component. The second exception is found in Nevada, where a payroll tax (for purposes other than unemployment insurance) is also included in the individual income tax component. The final exception is in zero sales tax states–Alaska, Montana, New Hampshire, Oregon, and Washington–which do not have general sales taxes but still do not score a perfect 10 in that component section because of excise taxes on gasoline, beer, spirits, and cigarettes, which are included in that section. Alaska, moreover, forgoes a state sales tax, but does permit local option sales taxes.
Normalizing Final Scores. Another problem with using a relative scale within the components is that the average scores across the five components vary. This alters the value of not having a given tax across major indices. For example, the unadjusted average score of the corporate income tax component is 6.76 while the average score of the sales tax component is 5.36.
In order to solve this problem, scores on the five major components are “normalized,” which brings the average score for all of them to 5.00, excluding states that do not have the given tax. This is accomplished by multiplying each state’s score by a constant value.
Once the scores are normalized, it is possible to compare states across indices. For example, because of normalization, it is possible to say

TAX FOUNDATION | 17IN
TROD
UC
TION
AN
D M
ETHO
DO
LOG
Y
that Connecticut’s score of 5.11 on corporate income taxes is better than its score of 4.75 on the sales tax.
Time Frame Measured by the Index (Snapshot Date)Starting with the 2006 edition, the Index has measured each state’s business tax climate as it stands at the beginning of the standard state fiscal year, July 1. Therefore, this edition is the 2020 Index and represents the tax climate of each state as of July 1, 2019, the first day of fiscal year 2020 for most states.
District of Columbia
The District of Columbia (D.C.) is only included as an exhibit and its scores and “phantom ranks” offered do not affect the scores or ranks of other states.
2020 Changes to MethodologyTwo recent developments have remade the state tax landscape like no other changes in decades: the adoption of the federal Tax Cuts and Jobs Act (TCJA) in late 2017 and the U.S. Supreme Court’s endorsement in mid-2018, in South Dakota v. Wayfair, of economic nexus as a basis for remote sales tax collections. As states continue to respond to these developments, the Index is evolving to reflect this expanded range of tax possibilities.
Wayfair and TCJA-related tax changes pose a challenge for continuity within the Index. When we adopt a methodological change, we backcast that change for all available years to facilitate meaningful year-to-year comparisons, so that movement in Index rank and score reflect changes in tax policy, not methodological tinkering. In this case, however, there is not much to backcast: safe harbors for smaller remote sellers did not exist prior to Wayfair, and there was no such thing as the
proper treatment of Global Intangible Low-Taxed Income (GILTI) before enactment of the TCJA. Accordingly, the incorporation of several new variables introduces a slight shakeup in rankings for fiscal years 2019 (backcast) and 2020 (current year), as states respond to these new choices in different ways.
Building on improvements to last year’s Index to capture state responses to the TCJA, the Index now contains two new variables: one dealing with whether states adopt the new net interest limitation under I.R.C. § 163(j), and the other assessing states’ treatment of GILTI, which is intended as an anti-base erosion guardrail for the federal government’s new territorial approach to international income, but which some states have latched onto as a way to reach beyond the waters’ edge to tax foreign-derived income previously out of reach.
States which decouple or almost fully decouple from GILTI (by, for instance, treating it as largely-deductible foreign dividend income and providing the § 250 deduction) are given full credit under the new GILTI variable, while states which moderately tax GILTI (for instance, by only incorporating the § 250 deduction) receive half credit, and those that tax more than 50 percent of GILTI receive the lowest score.
Similarly, two new variables were added in response to the Wayfair decision. The first pertains to an existing feature of sales tax codes which takes on new importance as states expand into remote sales tax collections, while the second only has a purpose within this new environment. The first of these two variables asks whether sales tax administration is unified, rewarding states which have a single point of collections and administration while penalizing those that require sellers to interact directly with local jurisdictions. The second examines the safe harbors established for smaller remote sellers.

18 | STATE BUSINESS TAX CLIMATE INDEXC
OR
POR
ATE
TAX
Under the new safe harbor variable, we regard optimal treatment to be a gross sales threshold of $100,000 or more, with no alternative transaction threshold. States which establish nexus based on achieving the lesser of a gross sales or transactions threshold, and the one state (Oklahoma) that has a low ($10,000) gross sales threshold, are awarded half credit, while Kansas, the only state moving forward with remote sales tax collections without implementing any safe harbor, receives the worst score. States which lack a sales tax or have not yet implemented a remote sales tax regime are awarded the optimal score.
One final complexity arises with this variable, since the Index is based on a snapshot date of July 1, but many states have adopted remote sales tax laws that, due to statutory, regulatory, or judicial delays, have yet to be fully implemented. Under normal circumstance, the Index would disregard a tax change that has been enacted but was not in effect as of July 1, but the multiplicity of reasons—many not statutory—for delays, along with many states’ inducements for sellers to voluntarily comply with the new regimes before mandatory enforcement begins, argue in favor of counting these regimes based on when they became law, not when compliance becomes or became mandatory.
This year, we also broke out our treatment of tangible personal property, with separate variables for the taxation of inventory (already in the Index) and other business tangible property (new). Finally, modest weighting changes were made to the corporate, sales, and property tax components as these new variables were added.
Past Rankings and Scores
This report includes 2014-2019 Index rankings that can be used for comparison with the 2020 rankings and scores. These can differ from previously published Index rankings and scores
due to enactment of retroactive statutes, backcasting of the above methodological changes, and corrections to variables brought to our attention since the last report was published. The scores and rankings in this report are definitive.
Corporate TaxThis component measures the impact of each state’s principal tax on business activities and accounts for 19.7 percent of each state’s total score. It is well established that the extent of business taxation can affect a business’ level of economic activity within a state. For example, Newman (1982) found that differentials in state corporate income taxes were a major factor influencing the movement of industry to Southern states. Two decades later, with global investment greatly expanded, Agostini and Tulayasathien (2001) determined that a state’s corporate tax rate is the most relevant tax in the investment decisions of foreign investors.
Most states levy standard corporate income taxes on profit (gross receipts minus expenses). Some states, however, problematically impose taxes on the gross receipts of businesses with few or no deductions for expenses. Between 2005 and 2010, for example, Ohio phased in the Commercial Activities Tax (CAT), which has a rate of 0.26 percent. Washington has the Business and Occupation (B&O) Tax, which is a multi-rate tax (depending on industry) on the gross receipts of Washington businesses. Delaware has a similar Manufacturers’ and Merchants’ License Tax, as does Virginia with its locally-levied Business/Professional/Occupational License (BPOL) tax and West Virginia with its local Business & Occupation (B&O) tax. Texas also added the Margin Tax, a complicated gross receipts tax, in 2007, and Nevada adopted the gross receipts-based multi-rate Commerce Tax in 2015. Oregon is scheduled to impose a new modified gross receipts tax beginning in 2020. However, in

TAX FOUNDATION | 19C
OR
POR
ATE TAX
TABLE 3.Corporate Tax Component of the State Business Tax Climate Index (2014–2020)
Prior Year Ranks 2019 2020 2019-2020 ChangeState 2014 2015 2016 2017 2018 Rank Score Rank Score Rank ScoreAlabama 24 25 23 14 22 22 5.33 23 5.24 -1 -0.10Alaska 26 27 28 27 26 25 5.15 26 5.12 -1 -0.02Arizona 23 23 21 19 14 15 5.56 22 5.28 -7 -0.28Arkansas 37 37 39 39 39 40 4.40 34 4.80 6 0.41California 30 32 34 33 32 38 4.52 28 4.94 10 0.42Colorado 20 13 15 18 18 5 5.95 7 5.82 -2 -0.14Connecticut 28 30 32 32 31 34 4.71 27 5.11 7 0.41Delaware 50 50 50 50 50 50 2.89 50 2.91 0 0.01Florida 13 14 16 19 19 11 5.73 9 5.63 2 -0.10Georgia 9 10 10 11 10 8 5.81 6 5.89 2 0.08Hawaii 5 5 4 6 11 12 5.73 16 5.46 -4 -0.26Idaho 18 22 22 24 25 28 5.01 29 4.93 -1 -0.08Illinois 44 45 33 26 36 37 4.53 36 4.65 1 0.12Indiana 29 28 24 23 23 18 5.52 11 5.61 7 0.09Iowa 48 48 48 48 48 47 3.86 48 3.58 -1 -0.28Kansas 36 36 38 38 38 32 4.72 35 4.66 -3 -0.07Kentucky 25 26 27 28 27 20 5.42 17 5.46 3 0.04Louisiana 17 21 36 40 40 35 4.66 37 4.62 -2 -0.04Maine 42 43 42 41 41 33 4.72 38 4.59 -5 -0.13Maryland 15 16 18 21 20 26 5.11 32 4.88 -6 -0.23Massachusetts 33 35 37 36 35 39 4.47 39 4.58 0 0.10Michigan 8 8 8 9 8 13 5.69 18 5.42 -5 -0.27Minnesota 41 41 43 43 43 44 4.20 44 4.33 0 0.13Mississippi 10 11 12 12 12 14 5.59 10 5.63 4 0.03Missouri 4 4 3 5 5 6 5.92 5 5.96 1 0.03Montana 16 17 19 13 13 9 5.77 21 5.35 -12 -0.42Nebraska 35 29 29 29 28 29 4.95 31 4.88 -2 -0.06Nevada 1 1 26 34 33 21 5.34 25 5.14 -4 -0.20New Hampshire 47 47 47 47 45 46 3.89 43 4.38 3 0.49New Jersey 38 38 40 42 42 49 3.63 49 3.56 0 -0.07New Mexico 34 34 25 25 24 23 5.32 20 5.40 3 0.08New York 22 20 11 8 7 17 5.53 13 5.58 4 0.05North Carolina 27 24 7 4 3 3 6.34 3 6.11 0 -0.23North Dakota 21 19 14 16 16 16 5.54 19 5.41 -3 -0.12Ohio 45 44 46 46 47 43 4.25 42 4.40 1 0.15Oklahoma 11 9 9 10 9 19 5.45 8 5.80 11 0.36Oregon 31 33 35 35 34 30 4.82 33 4.82 -3 0.00Pennsylvania 43 42 44 44 44 45 4.05 46 4.19 -1 0.14Rhode Island 39 39 31 31 30 36 4.63 40 4.57 -4 -0.07South Carolina 12 12 13 15 15 4 6.02 4 6.03 0 0.02South Dakota 1 1 1 1 1 1 9.58 1 10.00 0 0.42Tennessee 14 15 17 22 21 27 5.08 24 5.15 3 0.07Texas 49 49 49 49 49 48 3.80 47 3.96 1 0.17Utah 6 6 5 3 4 7 5.89 12 5.60 -5 -0.29Vermont 40 40 41 37 37 41 4.39 45 4.19 -4 -0.19Virginia 7 7 6 7 6 10 5.73 14 5.54 -4 -0.19Washington 46 46 45 45 46 42 4.30 41 4.45 1 0.15West Virginia 19 18 20 17 17 24 5.26 15 5.47 9 0.21Wisconsin 32 31 30 30 29 31 4.81 30 4.90 1 0.09Wyoming 1 1 1 1 1 1 9.58 1 10.00 0 0.42District of Columbia 38 38 38 28 26 24 5.29 15 5.52 9 0.23Note: A rank of 1 is best, 50 is worst. All scores are for fiscal years. D.C.'s score and rank do not affect other states.Source: Tax Foundation.

20 | STATE BUSINESS TAX CLIMATE INDEXIN
TRO
DU
CTI
ON
AN
D M
ETH
OD
OLO
GY
2011, Michigan passed a significant corporate tax reform that eliminated the state’s modified gross receipts tax and replaced it with a 6 percent corporate income tax, effective January 1, 2012.25 The previous tax had been in place since 2007, and Michigan’s repeal followed others in Kentucky (2006) and New Jersey (2006). Several states contemplated gross receipts taxes in 2017, but none were adopted.
Since gross receipts taxes and corporate income taxes are levied on different bases, we separately compare gross receipts taxes to each other, and corporate income taxes to each other, in the Index.
For states with corporate income taxes, the corporate tax rate subindex is calculated by assessing three key areas: the top tax rate, the level of taxable income at which the top rate kicks in, and the number of brackets. States that levy neither a corporate income tax nor a gross receipts tax achieve a perfectly neutral system in regard to business income and thus receive a perfect score.
States that do impose a corporate tax generally will score well if they have a low rate. States with a high rate or a complex and multiple-rate system score poorly.
To calculate the parallel subindex for the corporate tax base, three broad areas are assessed: tax credits, treatment of net operating losses, and an “other” category that includes variables such as conformity to the Internal Revenue Code, protections against double taxation, and the taxation of “throwback” income, among others. States that score well on the corporate tax base subindex generally will have few business tax credits, generous carryback and carryforward provisions, deductions for net operating losses, conformity to the Internal Revenue Code, and provisions that alleviate double taxation. 25 See Mark Robyn, “Michigan Implements Positive Corporate Tax Reform,” Tax Foundation, Feb. 10, 2012.
Corporate Tax RateThe corporate tax rate subindex is designed to gauge how a state’s corporate income tax top marginal rate, bracket structure, and gross receipts rate affect its competitiveness compared to other states, as the extent of taxation can affect a business’ level of economic activity within a state (Newman 1982).
A state’s corporate tax is levied in addition to the federal corporate income tax of 21 percent, substantially reduced by the Tax Cuts and Jobs Act of 2017 from a graduated-rate tax with a top rate of 35 percent, the highest rate among industrialized nations. Two states levy neither a corporate income tax nor a gross receipts tax: South Dakota and Wyoming. These states automatically score a perfect 10 on this subindex. Therefore, this section ranks the remaining 48 states relative to each other.
Top Tax Rate. Iowa’s 12 percent corporate income tax rate qualifies for the worst ranking among states that levy one, followed by New Jersey’s new 11.5 percent rate (including a surcharge). Other states with comparatively high corporate income tax rates are Pennsylvania (9.99 percent), Minnesota (9.8 percent), Alaska (9.4 percent), and California (8.84 percent). By contrast, North Carolina’s new rate of 2.5 percent is the lowest nationally, followed by North Dakota’s at 4.31 percent and Colorado’s at 4.63 percent. Other states with comparatively low top corporate tax rates are Arizona (4.9 percent), Utah (4.95 percent), and Kentucky, Mississippi, and South Carolina, all at 5 percent.
Graduated Rate Structure. Two variables are used to assess the economic drag created by multiple-rate corporate income tax systems: the income level at which the highest tax rate starts to apply and the number of tax brackets. Twenty-nine states and the District

TAX FOUNDATION | 21C
OR
POR
ATE TAX
of Columbia have single-rate systems, and they score best. Single-rate systems are consistent with the sound tax principles of simplicity and neutrality. In contrast to the individual income tax, there is no meaningful “ability to pay” concept in corporate taxation. Jeffery Kwall, the Kathleen and Bernard Beazley Professor of Law at Loyola University Chicago School of Law, notes that
graduated corporate rates are inequitable—that is, the size of a corporation bears no necessary relation to the income levels of the owners. Indeed, low-income corporations may be owned by individuals with high incomes, and high-income corporations may be owned by individuals with low incomes.26
A single-rate system minimizes the incentive for firms to engage in expensive, counterproductive tax planning to mitigate the damage of higher marginal tax rates that some states levy as taxable income rises.
The Top Bracket. This variable measures how soon a state’s tax system applies its highest corporate income tax rate. The highest score is awarded to a single-rate system that has one bracket that applies to the first dollar of taxable income. Next best is a two-bracket system where the top rate kicks in at a low level of income, since the lower the top rate kicks in, the more the system is like a flat tax. States with multiple brackets spread over a broad income spectrum are given the worst score.
Number of Brackets. An income tax system creates changes in behavior when the taxpayer’s income reaches the end of one tax rate bracket and moves into a higher bracket. At such a break point, incentives change, and as a result, numerous rate changes are 26 Jeffrey L. Kwall, “The Repeal of Graduated Corporate Tax Rates,” Tax Notes, June 27, 2011, 1395.
more economically harmful than a single-rate structure. This variable is intended to measure the disincentive effect the corporate income tax has on rising incomes. States that score the best on this variable are the 30 states—and the District of Columbia—that have a single-rate system. Alaska’s 10-bracket system earns the worst score in this category. Other states with multi-bracket systems include Arkansas (six brackets) and Louisiana (five brackets).
Corporate Tax BaseThis subindex measures the economic impact of each state’s definition of what should be subject to corporate taxation.
The three criteria used to measure the competitiveness of each state’s corporate tax base are given equal weight: the availability of certain credits, deductions, and exemptions; the ability of taxpayers to deduct net operating losses; and a host of smaller tax base issues that combine to make up the other third of the corporate tax base subindex.
Under a gross receipts tax, some of these tax base criteria (net operating losses and some corporate income tax base variables) are replaced by the availability of deductions from gross receipts for employee compensation costs and cost of goods sold. States are rewarded for granting these deductions because they diminish the greatest disadvantage of using gross receipts as the base for corporate taxation: the uneven effective tax rates that various industries pay, depending on how many levels of production are hit by the tax.
Net Operating Losses. The corporate income tax is designed to tax only the profits of a corporation. However, a yearly profit snapshot may not fully capture a corporation’s true profitability. For example, a corporation in a

22 | STATE BUSINESS TAX CLIMATE INDEXC
OR
POR
ATE
TAX
highly cyclical industry may look very profitable during boom years but lose substantial amounts during bust years. When examined over the entire business cycle, the corporation may actually have an average profit margin.
The deduction for net operating losses (NOL) helps ensure that, over time, the corporate income tax is a tax on average profitability. Without the NOL deduction, corporations in cyclical industries pay much higher taxes than those in stable industries, even assuming identical average profits over time. Simply put, the NOL deduction helps level the playing field among cyclical and noncyclical industries. Under the Tax Cuts and Jobs Act, the federal government allows losses to be carried forward indefinitely, though they may only reduce taxable income by 80 percent in any given year. Because gross receipts taxes inherently preclude the possibility of carrying net operating losses backward or forward, the Index treats states with statewide gross receipts taxes as having the equivalent of no NOL carryback or carryforward provisions.
Number of Years Allowed for Carryback and Carryforward. This variable measures the number of years allowed on a carryback or carryforward of an NOL deduction. The longer the overall time span, the higher the probability that the corporate income tax is being levied on the corporation’s average profitability. Generally, states entered FY 2020 with better treatment of the carryforward (up to a maximum of 20 years) than the carryback (up to a maximum of three years). States score well on the Index if they conform to the new federal provisions or provide their own robust system of carryforwards and carrybacks.
Caps on the Amount of Carryback and Carryforward. When companies have a larger NOL than they can deduct in one year, most states permit them to carry deductions of any amount back to previous years’ returns or forward to future returns. States that
limit those amounts are ranked lower in the Index. Two states, Idaho and Montana, limit the amount of carrybacks, though they do better than many of their peers in offering any carryback provisions at all. Of states that allow a carryforward of losses, only New Hampshire and Pennsylvania limit carryforwards. As a result, these states score poorly on this variable.
Gross Receipts Tax Deductions. Proponents of gross receipts taxation invariably praise the steadier flow of tax receipts into government coffers in comparison with the fluctuating revenue generated by corporate income taxes, but this stability comes at a great cost. The attractively low statutory rates associated with gross receipts taxes are an illusion. Since gross receipts taxes are levied many times in the production process, the effective tax rate on a product is much higher than the statutory rate would suggest. Effective tax rates under a gross receipts tax vary dramatically by industry or individual business, a stark departure from the principle of tax neutrality. Firms with few steps in their production chain are relatively lightly taxed under a gross receipts tax, and vertically-integrated, high-margin firms prosper, while firms with longer production chains are exposed to a substantially higher tax burden. The pressure of this economic imbalance often leads lawmakers to enact separate rates for each industry, an inevitably unfair and inefficient process.
Two reforms that states can make to mitigate this damage are to permit deductions from gross receipts for employee compensation costs and cost of goods sold, effectively moving toward a regular corporate income tax.
Delaware, Nevada, Ohio, and Washington score the worst, because their gross receipts taxes do not offer full deductions for either the cost of goods sold or employee compensation. Texas offers a deduction for either the cost of goods sold or employee compensation but not

TAX FOUNDATION | 23C
OR
POR
ATE TAX
both. The Virginia BPOL tax, the West Virginia B&O, and the Pennsylvania business privilege tax are not included in this survey, because they are assessed at the local level and not levied uniformly across the state.
Federal Income Used as State Tax Base. States that use federal definitions of income reduce the tax compliance burden on their taxpayers. Two states (Arkansas and Mississippi) do not conform to federal definitions of corporate income and they score poorly.
Allowance of Federal ACRS and MACRS Depreciation. The vast array of federal depreciation schedules is, by itself, a tax complexity nightmare for businesses. The specter of having 50 different schedules would be a disaster from a tax complexity standpoint. This variable measures the degree to which states have adopted the federal Accelerated Cost Recovery System (ACRS) and Modified Accelerated Cost Recovery System (MACRS) depreciation schedules. One state (California) adds complexity by failing to fully conform to the federal system.
Deductibility of Depletion. The deduction for depletion works similarly to depreciation, but it applies to natural resources. As with depreciation, tax complexity would be staggering if all 50 states imposed their own depletion schedules. This variable measures the degree to which states have adopted the federal depletion schedules. Thirteen states are penalized because they do not fully conform to the federal system: Alaska, California, Delaware, Iowa, Louisiana, Maryland, Minnesota, Mississippi, New Hampshire, North Carolina, Oklahoma, Oregon, and Tennessee.
Alternative Minimum Tax. The federal Alternative Minimum Tax (AMT) was created to ensure that all taxpayers paid some minimum level of taxes every year. Unfortunately, it does so by creating a parallel tax system to the standard corporate income tax code.
Evidence shows that the AMT does not increase efficiency or improve fairness in any meaningful way. It nets little money for the government, imposes compliance costs that in some years are actually larger than collections, and encourages firms to cut back or shift their investments (Chorvat and Knoll, 2002). As such, states that have mimicked the federal AMT put themselves at a competitive disadvantage through needless tax complexity.
Five states have an AMT on corporations and thus score poorly: California, Iowa, Kentucky, Minnesota, and New Hampshire.
Deductibility of Taxes Paid. This variable measures the extent of double taxation on income used to pay foreign taxes, i.e., paying a tax on money the taxpayer has already mailed to foreign taxing authorities. States can avoid this double taxation by allowing the deduction of taxes paid to foreign jurisdictions. Twenty-three states allow deductions for foreign taxes paid and score well. The remaining states with corporate income taxation do not allow deductions for foreign taxes paid and thus score poorly.
Indexation of the Tax Code. For states that have multiple-bracket corporate income taxes, it is important to index the brackets for inflation. That prevents de facto tax increases on the nominal increase in income due to inflation. Put simply, this “inflation tax” results in higher tax burdens on taxpayers, usually without their knowledge or consent. All 14 states with graduated corporate income taxes fail to index their tax brackets: Alaska, Arkansas, Hawaii, Iowa, Kansas, Louisiana, Maine, Mississippi, Nebraska, New Jersey, New Mexico, North Dakota, Oregon, and Vermont.

24 | STATE BUSINESS TAX CLIMATE INDEXC
OR
POR
ATE
TAX
Throwback. To reduce the double taxation of corporate income, states use apportionment formulas that seek to determine how much of a company’s income a state can properly tax. Generally, states require a company with nexus (that is, sufficient connection to the state to justify the state’s power to tax its income) to apportion its income to the state based on some ratio of the company’s in-state property, payroll, and sales compared to its total property, payroll, and sales.
Among the 50 states, there is little harmony in apportionment formulas. Many states weight the three factors equally while others weight the sales factor more heavily (a recent trend in state tax policy). Since many businesses make sales into states where they do not have nexus, businesses can end up with “nowhere income,” income that is not taxed by any state. To counter this phenomenon, many states have adopted what are called throwback rules because they identify nowhere income and throw it back into a state where it will be taxed, even though it was not earned in that state.
Throwback and throwout rules for sales of tangible property add yet another layer of tax complexity. Since two or more states can theoretically lay claim to “nowhere” income, rules have to be created and enforced to decide who gets to tax it. States with corporate income taxation are almost evenly divided between those with and without throwback rules. Twenty states do not have them, while 25 states and the District of Columbia do.
Section 168(k) Expensing. Because corporate income taxes are intended to fall on net income, they should include deductions for business expenses—including investment in machinery and equipment. Historically, however, businesses have been required to depreciate the value of these purchases over time. In recent years, the federal government offered “bonus depreciation” to accelerate the
deduction for these investments, and under the Tax Cuts and Jobs Act, investments in machinery and equipment are fully deductible in the first year, a policy known as “full expensing.” Eighteen states follow the federal government in offering full expensing, while two offer “bonus depreciation” short of full expensing.
Net Interest Limitation. Federal law now restricts the deduction of business interest, limiting the deduction to 30 percent of modified income, with the ability to carry the remainder forward to future tax years. This change was intended to eliminate the bias in favor of debt financing (over equity financing) in the federal code, but particularly when states adopt this limitation without incorporating its counterbalancing provision, full expensing, the result is higher investment costs. Thirty-five states conform to the net interest limitation.
Inclusion of GILTI. Historically, states have largely avoided taxing international income. Following federal tax reform, however, some states have latched onto the federal provision for the taxation of Global Low-Taxed Intangible Income (GILTI), intended as a guardrail for the new federal territorial system of taxation, as a means to broaden their tax bases to include foreign business activity. States which tax GILTI are penalized in the Index, while states receive partial credit for moderate taxation of GILTI (for instance, by adopting the Section 250 deduction) and are rewarded for decoupling or almost fully decoupling from GILTI (by, for instance, treating it as largely-deductible foreign dividend income in addition to providing the Section 250 deduction).
Tax Credits
Many states provide tax credits which lower the effective tax rates for certain industries and investments, often for large firms from out of state that are considering a move.

TAX FOUNDATION | 25C
OR
POR
ATE TAX
Policymakers create these deals under the banner of job creation and economic development, but the truth is that if a state needs to offer such packages, it is most likely covering for a bad business tax climate. Economic development and job creation tax credits complicate the tax system, narrow the tax base, drive up tax rates for companies that do not qualify, distort the free market, and often fail to achieve economic growth.27
A more effective approach is to systematically improve the business tax climate for the long term. Thus, this component rewards those states that do not offer the following tax credits, with states that offer them scoring poorly.
Investment Tax Credits. Investment tax credits typically offer an offset against tax liability if the company invests in new property, plants, equipment, or machinery in the state offering the credit. Sometimes, the new investment will have to be “qualified” and approved by the state’s economic development office. Investment tax credits distort the market by rewarding investment in new property as opposed to the renovation of old property.
Job Tax Credits. Job tax credits typically offer an offset against tax liability if the company creates a specified number of jobs over a specified period of time. Sometimes, the new jobs will have to be “qualified” and approved by the state’s economic development office, allegedly to prevent firms from claiming that jobs shifted were jobs added. Even if administered efficiently, job tax credits can misfire in a number of ways. They induce businesses whose economic position would be best served by spending more on new equipment or marketing to hire new employees instead. They also favor businesses that are expanding anyway, punishing firms that are
27 For example, see Alan Peters and Peter Fisher, “The Failures of Economic Development Incentives,” Journal of the American Planning Association 70(1), Winter 2004, 27; and William F. Fox and Matthew N. Murray, “Do Economic Effects Justify the Use of Fiscal Incentives?” Southern Economic Journal 71(1), July 2004, 78.
already struggling. Thus, states that offer such credits score poorly on the Index.
Research and Development (R&D) Tax Credits. Research and development tax credits reduce the amount of tax due by a company that invests in “qualified” research and development activities. The theoretical argument for R&D tax credits is that they encourage the kind of basic research that is not economically justifiable in the short run but that is better for society in the long run. In practice, their negative side effects—greatly complicating the tax system and establishing a government agency as the arbiter of what types of research meet a criterion so difficult to assess—far outweigh the potential benefits. Thus, states that offer such credits score poorly on the Index.

26 | STATE BUSINESS TAX CLIMATE INDEXIN
DIV
IDU
AL
INC
OM
E TA
X
Individual Income TaxThe individual income tax component, which accounts for 30.2 percent of each state’s total Index score, is important to business because a significant number of businesses, including sole proprietorships, partnerships, and S corporations, report their income through the individual income tax code.
Taxes can have a significant impact on an individual’s decision to become a self-employed entrepreneur. Gentry and Hubbard (2004) found, “While the level of the marginal tax rate has a negative effect on entrepreneurial entry, the progressivity of the tax also discourages entrepreneurship, and significantly so for some groups of households.” Using education as a measure of potential for innovation, Gentry and Hubbard found that a progressive tax system “discourages entry into self-employment for people of all educational backgrounds.” Moreover, citing Carroll, Holtz-Eakin, Rider, and Rosen (2000), Gentry and Hubbard contend, “Higher tax rates reduce investment, hiring, and small business income growth” (p. 7). Less neutral individual income tax systems, therefore, hurt entrepreneurship and a state’s business tax climate.
Another important reason individual income tax rates are critical for businesses is the cost of labor. Labor typically constitutes a major business expense, so anything that hurts the labor pool will also affect business decisions and the economy. Complex, poorly designed tax systems that extract an inordinate amount of tax revenue reduce both the quantity and quality of the labor pool. This is consistent with the findings of Wasylenko and McGuire (1985), who found that individual income taxes affect businesses indirectly by influencing the location decisions of individuals. A progressive, multi-rate income tax exacerbates this problem by increasing the marginal tax rate at higher
28 See Edward C. Prescott, “Why Do Americans Work So Much More than Europeans?” Federal Reserve Bank of Minneapolis Quarterly Review, July 2004. See also J. Scott Moody and Scott A. Hodge, “Wealthy Americans and Business Activity,” Tax Foundation, Aug. 1, 2004.
levels of income, continually reducing the value of work vis-à-vis the value of leisure.
For example, suppose a worker has to choose between one hour of additional work worth $10 and one hour of leisure which to him is worth $9.50. A rational person would choose to work for another hour. But if a 10 percent income tax rate reduces the after-tax value of labor to $9, then a rational person would stop working and take the hour to pursue leisure. Additionally, workers earning higher wages—$30 per hour, for example—who face progressively higher marginal tax rates—20 percent, for instance—are more likely to be discouraged from working additional hours. In this scenario, the worker’s after-tax wage is $24 per hour; therefore, those workers who value leisure more than $24 per hour will choose not to work. Since the after-tax wage is $6 lower than the pretax wage in this example, compared to only $1 lower in the previous example, more workers will choose leisure. In the aggregate, the income tax reduces the available labor supply.28
The individual income tax rate subindex measures the impact of tax rates on the marginal dollar of individual income using three criteria: the top tax rate, the graduated rate structure, and the standard deductions and exemptions which are treated as a zero percent tax bracket. The rates and brackets used are for a single taxpayer, not a couple filing a joint return.
The individual income tax base subindex takes into account measures enacted to prevent double taxation, whether the code is indexed for inflation, and how the tax code treats married couples compared to singles. States that score well protect married couples from being taxed more severely than if they had filed as two single individuals. They also protect taxpayers from double taxation by
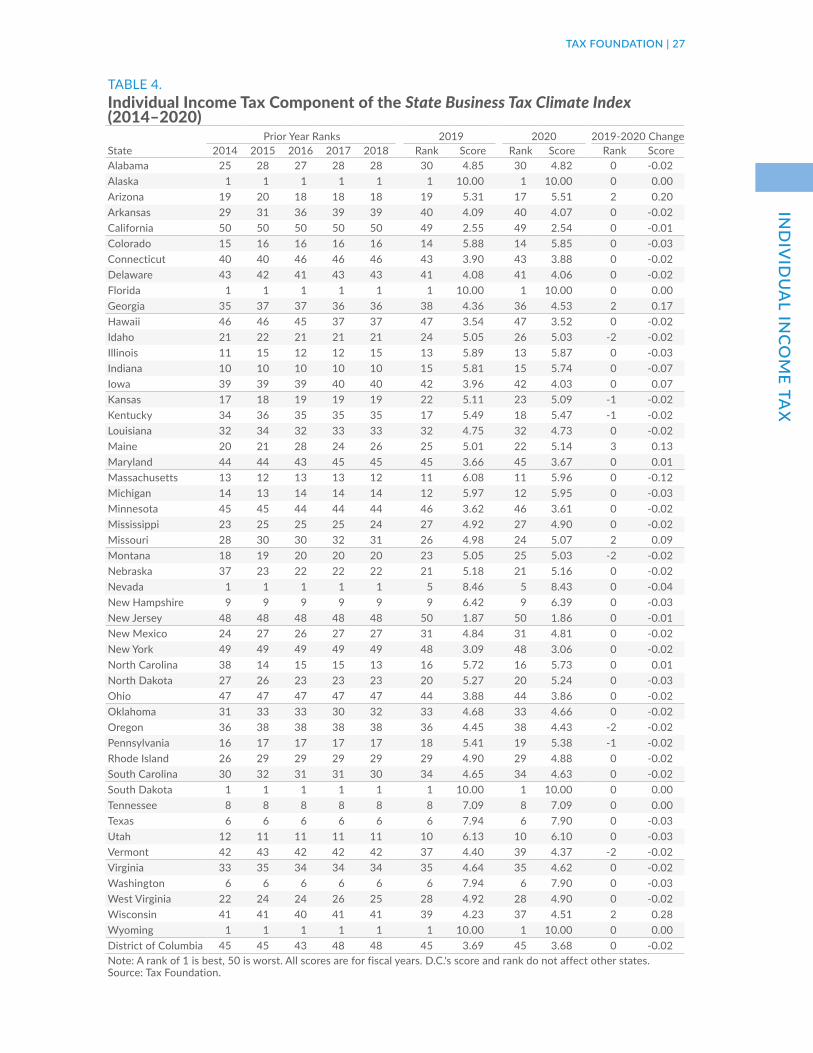
TAX FOUNDATION | 27IN
DIV
IDU
AL IN
CO
ME TA
X
TABLE 4.Individual Income Tax Component of the State Business Tax Climate Index (2014–2020)
Prior Year Ranks 2019 2020 2019-2020 ChangeState 2014 2015 2016 2017 2018 Rank Score Rank Score Rank ScoreAlabama 25 28 27 28 28 30 4.85 30 4.82 0 -0.02Alaska 1 1 1 1 1 1 10.00 1 10.00 0 0.00Arizona 19 20 18 18 18 19 5.31 17 5.51 2 0.20Arkansas 29 31 36 39 39 40 4.09 40 4.07 0 -0.02California 50 50 50 50 50 49 2.55 49 2.54 0 -0.01Colorado 15 16 16 16 16 14 5.88 14 5.85 0 -0.03Connecticut 40 40 46 46 46 43 3.90 43 3.88 0 -0.02Delaware 43 42 41 43 43 41 4.08 41 4.06 0 -0.02Florida 1 1 1 1 1 1 10.00 1 10.00 0 0.00Georgia 35 37 37 36 36 38 4.36 36 4.53 2 0.17Hawaii 46 46 45 37 37 47 3.54 47 3.52 0 -0.02Idaho 21 22 21 21 21 24 5.05 26 5.03 -2 -0.02Illinois 11 15 12 12 15 13 5.89 13 5.87 0 -0.03Indiana 10 10 10 10 10 15 5.81 15 5.74 0 -0.07Iowa 39 39 39 40 40 42 3.96 42 4.03 0 0.07Kansas 17 18 19 19 19 22 5.11 23 5.09 -1 -0.02Kentucky 34 36 35 35 35 17 5.49 18 5.47 -1 -0.02Louisiana 32 34 32 33 33 32 4.75 32 4.73 0 -0.02Maine 20 21 28 24 26 25 5.01 22 5.14 3 0.13Maryland 44 44 43 45 45 45 3.66 45 3.67 0 0.01Massachusetts 13 12 13 13 12 11 6.08 11 5.96 0 -0.12Michigan 14 13 14 14 14 12 5.97 12 5.95 0 -0.03Minnesota 45 45 44 44 44 46 3.62 46 3.61 0 -0.02Mississippi 23 25 25 25 24 27 4.92 27 4.90 0 -0.02Missouri 28 30 30 32 31 26 4.98 24 5.07 2 0.09Montana 18 19 20 20 20 23 5.05 25 5.03 -2 -0.02Nebraska 37 23 22 22 22 21 5.18 21 5.16 0 -0.02Nevada 1 1 1 1 1 5 8.46 5 8.43 0 -0.04New Hampshire 9 9 9 9 9 9 6.42 9 6.39 0 -0.03New Jersey 48 48 48 48 48 50 1.87 50 1.86 0 -0.01New Mexico 24 27 26 27 27 31 4.84 31 4.81 0 -0.02New York 49 49 49 49 49 48 3.09 48 3.06 0 -0.02North Carolina 38 14 15 15 13 16 5.72 16 5.73 0 0.01North Dakota 27 26 23 23 23 20 5.27 20 5.24 0 -0.03Ohio 47 47 47 47 47 44 3.88 44 3.86 0 -0.02Oklahoma 31 33 33 30 32 33 4.68 33 4.66 0 -0.02Oregon 36 38 38 38 38 36 4.45 38 4.43 -2 -0.02Pennsylvania 16 17 17 17 17 18 5.41 19 5.38 -1 -0.02Rhode Island 26 29 29 29 29 29 4.90 29 4.88 0 -0.02South Carolina 30 32 31 31 30 34 4.65 34 4.63 0 -0.02South Dakota 1 1 1 1 1 1 10.00 1 10.00 0 0.00Tennessee 8 8 8 8 8 8 7.09 8 7.09 0 0.00Texas 6 6 6 6 6 6 7.94 6 7.90 0 -0.03Utah 12 11 11 11 11 10 6.13 10 6.10 0 -0.03Vermont 42 43 42 42 42 37 4.40 39 4.37 -2 -0.02Virginia 33 35 34 34 34 35 4.64 35 4.62 0 -0.02Washington 6 6 6 6 6 6 7.94 6 7.90 0 -0.03West Virginia 22 24 24 26 25 28 4.92 28 4.90 0 -0.02Wisconsin 41 41 40 41 41 39 4.23 37 4.51 2 0.28Wyoming 1 1 1 1 1 1 10.00 1 10.00 0 0.00District of Columbia 45 45 43 48 48 45 3.69 45 3.68 0 -0.02Note: A rank of 1 is best, 50 is worst. All scores are for fiscal years. D.C.'s score and rank do not affect other states.Source: Tax Foundation.

28 | STATE BUSINESS TAX CLIMATE INDEXIN
DIV
IDU
AL
INC
OM
E TA
X
recognizing LLCs and S corporations under the individual tax code and indexing their brackets, exemptions, and deductions for inflation.
States that do not impose an individual income tax generally receive a perfect score, and states that do impose an individual income tax will generally score well if they have a flat, low tax rate with few deductions and exemptions. States that score poorly have complex, multiple-rate systems.
The six states without an individual income tax or non-UI payroll tax are, not surprisingly, the highest scoring states on this component: Alaska, Florida, South Dakota, Texas, Washington, and Wyoming. Nevada, which taxes wage income (but not unearned income) at a low rate under a non-UI payroll tax, also does extremely well in this component of the Index. New Hampshire and Tennessee also score well, because while they levy a significant tax on individual income in the form of interest and dividends, they do not tax wages and salaries.29 Colorado, Illinois, Indiana, Kentucky, Massachusetts, Michigan, North Carolina, Pennsylvania, and Utah score highly because they have a single, low tax rate.
Scoring near the bottom of this component are states that have high tax rates and very progressive bracket structures. They generally fail to index their brackets, exemptions, and deductions for inflation, do not allow for deductions of foreign or other state taxes, penalize married couples filing jointly, and do not recognize LLCs and S corporations.
29 Tennessee has begun the process of phasing out its tax on interest and dividend income.30 New Hampshire and Tennessee both tax only interest and dividends. To account for this, the Index converts the statutory tax rate in
both states into an effective rate as measured against the typical state income tax base that includes wages. Under a typical income tax base with a flat rate and no tax preferences, this is the statutory rate that would be required to raise the same amount of revenue as the current system. Nationally, dividends and interest account for 19.6 percent of income. For New Hampshire, its 5 percent rate was multiplied by 19.6 percent, yielding the equivalent rate of 0.98 percent. For Tennessee, with a tax rate of 2 percent, this calculation yields an equivalent rate of 0.39 percent.
Individual Income Tax Rate The rate subindex compares the states that tax individual income after setting aside the four states that do not and therefore receive perfect scores: Alaska, Florida, South Dakota, and Wyoming. Texas and Washington do not have an individual income tax, but they do tax LLC and S corporation income through their gross receipts taxes and thus do not score perfectly in this component. Nevada has a low-rate payroll tax on wage income. New Hampshire and Tennessee, meanwhile, do not tax wage and salary income but do tax interest and dividend income.
Top Marginal Tax Rate. California has the highest top income tax rate of 13.3 percent. Other states with high top rates include Hawaii (11.0 percent), New Jersey (just raised to 10.75 percent), Oregon (9.9 percent), Minnesota (9.85 percent), New York (8.82 percent), Vermont (8.75 percent), and Iowa (8.53 percent).
States with the lowest top statutory rates are North Dakota (2.9 percent), Pennsylvania (3.07 percent), Indiana (3.23 percent of federal AGI), Michigan (4.25 percent of federal AGI), Arizona (4.5 percent), Colorado (4.63 percent of federal AGI), New Mexico (4.9 percent), Utah (4.95 percent), and Ohio (4.997 percent). Alabama, Kentucky, Mississippi, New Hampshire, and Oklahoma all impose a top statutory rate of 5 percent.30 Illinois and Kansas, which previously boasted rates below 5 percent, both adopted rate increases in recent years. (Although Illinois’ statutory rate is 4.95 percent, it also imposes an additional 1.5 percent tax on pass-through businesses, discussed elsewhere,

TAX FOUNDATION | 29IN
DIV
IDU
AL IN
CO
ME TA
X
bringing the rate for these entities to 6.45 percent.)
In addition to statewide income tax rates, some states allow local-level income taxes.31 We represent these as the mean between the rate in the capital city and most populous city. In some cases, states authorizing local-level income taxes still keep the level of income taxation modest overall. For instance, Alabama, Indiana, Michigan, and Pennsylvania allow local income add-ons, but are still among the states with the lowest overall rates.
Top Tax Bracket Threshold. This variable assesses the degree to which pass-through businesses are subject to reduced after-tax return on investment as net income rises. States are rewarded for a top rate that kicks in at lower levels of income, because doing so approximates a less distortionary flat-rate system. For example, Alabama has a progressive income tax structure with three income tax rates. However, because Alabama’s top rate of 5 percent applies to all taxable income over $3,000, the state’s income tax rate structure is nearly flat.
States with flat-rate systems score the best on this variable because their top rate kicks in at the first dollar of income (after accounting for the standard deduction and personal exemption). They include Illinois, Indiana, Kentucky, Massachusetts, Michigan, Pennsylvania, and Utah, among others. States with high kick-in levels score the worst. These include New Jersey ($5 million of taxable income), New York ($1,077,550), California ($1 million), Connecticut ($500,000), and North Dakota ($433,200 of taxable income).
31 See Joseph Bishop-Henchman and Jason Sapia, “Local Income Taxes: City- and County-Level Income and Wage Taxes Continue to Wane,” Tax Foundation, Aug. 31, 2011.
32 Some states offer tax credits in lieu of standard deductions or personal exemptions. Rather than reducing a taxpayer’s taxable income before the tax rates are applied, tax credits are subtracted from a taxpayer’s tax liability. Like deductions and exemptions, the result is a lower final income tax bill. In order to maintain consistency within the component score, tax credits are converted into equivalent income exemptions or deductions.
Number of Brackets. The Index converts exemptions and standard deductions to a zero bracket before tallying income tax brackets. From an economic perspective, standard deductions and exemptions are equivalent to an additional tax bracket with a zero tax rate.
For example, Kansas has a standard deduction of $3,000 and a personal exemption of $2,250, for a combined value of $5,250. Statutorily, Kansas has a top rate on all taxable income over $30,000 and two lower brackets, one beginning at the first dollar of income and another at $15,000, so it has an average bracket width of $10,000. Because of its deduction and exemption, however, Kansas’ top rate actually kicks in at $35,250 of income, and it has three tax brackets below that with an average width of $11,750. The size of allowed standard deductions and exemptions varies considerably.32
Pennsylvania scores the best in this variable by having only one tax bracket (that is, a flat tax with no standard deduction). States with only two brackets (that is, flat taxes with a standard deduction) are Colorado, Illinois, Indiana, Kentucky, Massachusetts, Michigan, New Hampshire, North Carolina, Tennessee, and Utah. On the other end of the spectrum, Hawaii scores worst with 13 brackets, followed by California with 11 brackets, and Iowa and Missouri, both with 10 brackets.
Average Width of Brackets. Many states have several narrow tax brackets close together at the low end of the income scale, including a zero bracket created by standard deductions and exemptions. Most taxpayers never notice them, because they pass so quickly through those brackets and pay the top rate on most of their income. On the other hand, some states impose ever-increasing rates throughout

30 | STATE BUSINESS TAX CLIMATE INDEXIN
DIV
IDU
AL
INC
OM
E TA
X
the income spectrum, causing individuals and noncorporate businesses to alter their income-earning and tax-planning behavior. This subindex penalizes the latter group of states by measuring the average width of the brackets, rewarding those states where the average width is small, since in these states the top rate is levied on most income, acting more like a flat rate on all income.
Income Recapture. Connecticut and New York apply the rate of the top income tax bracket to previous taxable income after the taxpayer crosses the top bracket threshold, while Arkansas imposes different tax tables depending on the filer’s level of income. New York’s recapture provision is the most damaging and results in an approximately $22,000 penalty for reaching the top bracket. Income recapture provisions are poor policy, because they result in dramatically high marginal tax rates at the point of their kick-in, and they are nontransparent in that they raise tax burdens substantially without being reflected in the statutory rate.
Individual Income Tax BaseStates have different definitions of taxable income, and some create greater impediments to economic activity than others. The base subindex gives a 10 percent weight to the marriage penalty, a 40 percent weight to the double taxation of taxable income, and a 50 percent weight to an accumulation of other base issues, including indexation.
The states with no individual income tax of any kind achieve perfect neutrality. Texas and Washington, however, are docked slightly because they do not recognize LLCs or S corporations, and Nevada’s payroll tax keeps the state from achieving a perfect store. Of the other 43 states, Tennessee, Arizona, Idaho, Illinois, Maine, Michigan, Missouri, Montana,
and Utah have the best scores, avoiding many problems with the definition of taxable income that plague other states. Meanwhile, states where the tax base is found to cause an unnecessary drag on economic activity include New Jersey, California, Ohio, Minnesota, Maryland, Delaware, and New York.
Marriage Penalty. A marriage penalty exists when a state’s standard deduction and tax brackets for married taxpayers filing jointly are not double those for single filers. As a result, two singles (if combined) can have a lower tax bill than a married couple filing jointly with the same income. This is discriminatory and has serious business ramifications. The top-earning 20 percent of taxpayers is dominated (85 percent) by married couples. This same 20 percent also has the highest concentration of business owners of all income groups (Hodge 2003A, Hodge 2003B). Because of these concentrations, marriage penalties have the potential to affect a significant share of pass-through businesses. Twenty-three states and the District of Columbia have marriage penalties built into their income tax brackets.
Some states attempt to get around the marriage penalty problem by allowing married couples to file as if they were singles or by offering an offsetting tax credit. While helpful in offsetting the dollar cost of the marriage penalty, these solutions come at the expense of added tax complexity. Still, states that allow for married couples to file as singles do not receive a marriage penalty score reduction.
Double Taxation of Capital Income. Since most states with an individual income tax system mimic the federal income tax code, they also possess its greatest flaw: the double taxation of capital income. Double taxation is brought about by the interaction between the corporate income tax and the individual income tax. The ultimate source of most capital income—interest, dividends, and capital gains—is corporate profits. The corporate

TAX FOUNDATION | 31IN
DIV
IDU
AL IN
CO
ME TA
X
income tax reduces the level of profits that can eventually be used to generate interest or dividend payments or capital gains.33 This capital income must then be declared by the receiving individual and taxed. The result is the double taxation of this capital income—first at the corporate level and again on the individual level.
All states that tax wage income score poorly by this criterion. Tennessee and New Hampshire, which tax individuals on interest and dividends, score somewhat better because they do not tax capital gains. Nevada’s payroll tax does not apply to capital income, and thus scores perfectly on this measure, along with states which forgo all income taxation.
Federal Income Used as State Tax Base. Despite the shortcomings of the federal government’s definition of income, states that use it reduce the tax compliance burden on taxpayers. Five states score poorly because they do not conform to federal definitions of individual income: Alabama, Arkansas, Mississippi, New Jersey, and Pennsylvania.
Alternative Minimum Tax
At the federal level, the Alternative Minimum Tax (AMT) was created in 1969 to ensure that all taxpayers paid some minimum level of taxes every year. Unfortunately, it does so by creating a parallel tax system to the standard individual income tax code. AMTs are an inefficient way to prevent tax deductions and credits from totally eliminating tax liability. As such, states that have mimicked the federal AMT put themselves at a competitive disadvantage through needless tax complexity. Five states score poorly for imposing an AMT on individuals: California, Colorado, Connecticut, Iowa, and Minnesota.
33 Equity-related capital gains are not created directly by a corporation. Rather, they are the result of stock appreciations due to corporate activity such as increasing retained earnings, increasing capital investments, or issuing dividends. Stock appreciation becomes taxable realized capital gains when the stock is sold by the holder.
Credit for Taxes Paid
This variable measures the extent of double taxation on income used to pay foreign and state taxes, i.e., paying the same taxes twice. States can avoid double taxation by allowing a credit for state taxes paid to other jurisdictions.
Recognition of Limited Liability Corporation and S Corporation Status
One important development in the federal tax system was the creation of the limited liability corporation (LLC) and the S corporation. LLCs and S corporations provide businesses some of the benefits of incorporation, such as limited liability, without the overhead of becoming a traditional C corporation. The profits of these entities are taxed under the individual income tax code, which avoids the double taxation problems that plague the corporate income tax system. Every state with a full individual income tax recognizes LLCs to at least some degree, and all but Louisiana recognize S corporations in some fashion, but those that require additional state election or make the entity file through the state’s gross receipts tax (as in Delaware, Ohio, Texas, and Washington) score poorly in this variable.
Indexation of the Tax Code
Indexing the tax code for inflation is critical in order to prevent de facto tax increases on the nominal increase in income due to inflation. This “inflation tax” results in higher tax burdens on taxpayers, usually without their knowledge or consent. Three areas of the individual income tax are commonly indexed for inflation: the standard deduction, personal exemptions, and tax brackets. Twenty-five states index all three or do not impose an individual income
32 | STATE BUSINESS TAX CLIMATE INDEXSA
LES
& E
XCIS
E TA
X
tax; 15 states and the District of Columbia index one or two of the three; and 10 states do not index at all.
Sales TaxesSales tax makes up 24.0 percent of each state’s Index score. The type of sales tax familiar to taxpayers is a tax levied on the purchase price of a good at the point of sale. Due to the inclusion of some business inputs in most states’ sales tax bases, the rate and structure of the sales tax is an important consideration for many businesses. The sales tax can also hurt the business tax climate because as the sales tax rate climbs, customers make fewer purchases or seek low-tax alternatives. As a result, business is lost to lower-tax locations, causing lost profits, lost jobs, and lost tax revenue.34 The effect of differential sales tax rates among states or localities is apparent when a traveler crosses from a high-tax state to a neighboring low-tax state. Typically, a vast expanse of shopping malls springs up along the border in the low-tax jurisdiction.
On the positive side, sales taxes levied on goods and services at the point of sale to the end-user have at least two virtues. First, they are transparent: the tax is never confused with the price of goods by customers. Second, since they are levied at the point of sale, they are less likely to cause economic distortions than taxes levied at some intermediate stage of production (such as a gross receipts tax or sales taxes on business-to-business transactions).
34 States have sought to limit this sales tax competition by levying a “use tax” on goods purchased out of state and brought into the state, typically at the same rate as the sales tax. Few consumers comply with use tax obligations.
35 For example, in early 1993, Intel Corporation was considering California, New Mexico, and four other states as the site of a new billion-dollar factory. California was the only one of the six states that levied its sales tax on machinery and equipment, a tax that would have cost Intel roughly $80 million. As Intel’s Bob Perlman explained in testimony before a committee of the California state legislature, “There are two ways California’s not going to get the $80 million: with the factory or without it.” California would not repeal the tax on machinery and equipment; New Mexico got the plant.
36 Sales taxes, which are ideally levied only on sales to final-users, are a form of consumption tax. Consumption taxes that are levied instead at each stage of production are known as value-added taxes (VAT) and are popular internationally. Theoretically a VAT can avoid the economically damaging tax pyramiding effect. The VAT has never gained wide acceptance in the U.S., and only two states (Michigan and New Hampshire) have even attempted a VAT-like tax.
37 Alaska does authorize local governments to levy their own sales taxes, however, which is reflected in the state’s sales tax component score.
The negative impact of sales taxes is well documented in the economic literature and through anecdotal evidence. For example, Bartik (1989) found that high sales taxes, especially sales taxes levied on equipment, had a negative effect on small business start-ups. Moreover, companies have been known to avoid locating factories or facilities in certain states because the factory’s machinery would be subject to the state’s sales tax.35
States that create the most tax pyramiding and economic distortion, and therefore score the worst, are states that levy a sales tax that generally allows no exclusions for business inputs.36 Hawaii, New Mexico, South Dakota, and Washington are examples of states that tax many business inputs. The ideal base for sales taxation is all goods and services at the point of sale to the end-user.
Excise taxes are sales taxes levied on specific goods. Goods subject to excise taxation are typically (but not always) perceived to be luxuries or vices, the latter of which are less sensitive to drops in demand when the tax increases their price. Examples typically include tobacco, liquor, and gasoline. The sales tax component of the Index takes into account the excise tax rates each state levies.
The five states without a state sales tax—Alaska,37 Delaware, Montana, New Hampshire, and Oregon—achieve the best sales tax component scores. Among states with a sales tax, those with low general rates and broad bases, and which avoid tax pyramiding, do best. Wyoming, Wisconsin, Maine, Michigan,

TAX FOUNDATION | 33SA
LES & EXC
ISE TAX
TABLE 5.Sales Tax Component of the State Business Tax Climate Index (2014–2020)
Prior Year Ranks 2019 2020 2019-2020 ChangeState 2014 2015 2016 2017 2018 Rank Score Rank Score Rank ScoreAlabama 50 50 50 49 49 50 2.60 50 2.61 0 0.01Alaska 5 5 5 5 5 5 8.04 5 8.08 0 0.05Arizona 43 43 44 44 44 40 3.99 40 4.02 0 0.04Arkansas 46 48 48 46 46 45 3.77 46 3.58 -1 -0.19California 44 44 42 41 40 46 3.75 45 3.74 1 -0.01Colorado 37 37 36 37 37 37 4.33 37 4.34 0 0.01Connecticut 34 34 32 31 30 30 4.59 26 4.75 4 0.15Delaware 2 2 1 1 1 2 8.97 2 9.02 0 0.05Florida 23 23 23 29 31 22 4.90 23 4.86 -1 -0.04Georgia 29 28 37 34 29 29 4.62 29 4.61 0 -0.02Hawaii 31 31 27 26 26 33 4.50 30 4.60 3 0.10Idaho 14 12 15 15 16 12 5.26 12 5.33 0 0.07Illinois 35 35 33 27 27 35 4.44 33 4.47 2 0.03Indiana 21 22 18 9 9 13 5.23 20 5.00 -7 -0.23Iowa 18 18 20 20 20 17 5.10 15 5.18 2 0.08Kansas 24 25 29 28 28 27 4.65 38 4.30 -11 -0.34Kentucky 11 19 14 13 15 18 5.10 14 5.19 4 0.09Louisiana 48 46 47 50 50 48 3.02 48 3.04 0 0.02Maine 7 8 8 8 8 9 5.55 8 5.66 1 0.11Maryland 12 16 17 18 19 16 5.13 19 5.02 -3 -0.10Massachusetts 19 21 19 19 12 11 5.34 13 5.20 -2 -0.14Michigan 10 10 9 10 11 19 5.04 9 5.53 10 0.49Minnesota 30 33 26 25 25 26 4.76 28 4.63 -2 -0.13Mississippi 38 39 39 39 39 36 4.39 34 4.46 2 0.07Missouri 22 24 25 23 24 25 4.78 24 4.80 1 0.02Montana 3 3 3 3 3 3 8.88 3 8.94 0 0.06Nebraska 15 13 12 12 13 8 5.61 10 5.48 -2 -0.13Nevada 41 41 41 42 43 44 3.84 44 3.89 0 0.05New Hampshire 1 1 2 2 2 1 9.01 1 9.06 0 0.05New Jersey 40 40 40 40 42 42 3.95 42 3.98 0 0.03New Mexico 42 42 43 43 41 41 3.98 41 4.02 0 0.04New York 45 45 45 45 45 43 3.87 43 3.91 0 0.04North Carolina 26 17 21 21 21 24 4.86 21 4.92 3 0.06North Dakota 33 32 34 35 35 31 4.57 27 4.63 4 0.06Ohio 28 29 30 32 32 28 4.63 32 4.49 -4 -0.13Oklahoma 36 36 35 36 36 39 4.02 39 4.04 0 0.03Oregon 4 4 4 4 4 4 8.77 4 8.82 0 0.05Pennsylvania 20 20 22 22 22 21 4.97 17 5.05 4 0.09Rhode Island 27 27 24 24 23 23 4.88 25 4.76 -2 -0.12South Carolina 32 30 31 30 33 34 4.48 31 4.53 3 0.05South Dakota 25 26 28 33 34 32 4.50 35 4.39 -3 -0.11Tennessee 47 47 46 47 47 47 3.54 47 3.54 0 -0.01Texas 39 38 38 38 38 38 4.30 36 4.34 2 0.04Utah 17 14 13 17 18 14 5.21 22 4.91 -8 -0.30Vermont 16 15 16 16 17 20 5.03 16 5.11 4 0.08Virginia 9 9 10 11 10 10 5.47 11 5.40 -1 -0.08Washington 49 49 49 48 48 49 2.90 49 2.91 0 0.02West Virginia 13 11 11 14 14 15 5.16 18 5.04 -3 -0.11Wisconsin 8 7 7 7 7 7 5.64 7 5.78 0 0.15Wyoming 6 6 6 6 6 6 6.10 6 6.04 0 -0.06District of Columbia 34 34 33 34 35 25 4.54 36 4.38 -11 -0.16Note: A rank of 1 is best, 50 is worst. All scores are for fiscal years. D.C.'s score and rank do not affect other states.Source: Tax Foundation.
34 | STATE BUSINESS TAX CLIMATE INDEXSA
LES
& E
XCIS
E TA
X
Nebraska, and Virginia all do well, with well-structured sales taxes and modest excise tax rates.
At the other end of the spectrum, Alabama, Washington, Louisiana, Tennessee, Arkansas, and California fare the worst, imposing high rates and taxing a range of business inputs, such as utilities, services, manufacturing, and leases—and maintaining relatively high excise taxes. Tennessee has the highest combined state and local rate of 9.469 percent, closely followed by Arkansas at 9.465 percent. In general, these states levy high sales tax rates that apply to most or all business input items.
Sales Tax RateThe tax rate itself is important, and a state with a high sales tax rate reduces demand for in-state retail sales. Consumers will turn more frequently to cross-border, catalog, or online purchases, leaving less business activity in the state. This subindex measures the highest possible sales tax rate applicable to in-state retail shopping and taxable business-to-business transactions. Four states—Delaware, Montana, New Hampshire, and Oregon—do not have state or local sales taxes and thus are given a rate of zero. Alaska is sometimes counted among states with no sales tax since it does not levy a statewide sales tax. However, Alaska localities are allowed to levy sales taxes and the weighted statewide average of these taxes is 1.76 percent.
The Index measures the state and local sales tax rate in each state. A combined rate is computed by adding the general state rate to the weighted average of the county and municipal rates.
State Sales Tax Rate. Of the forty-five states (and the District of Columbia) with a statewide
38 The average local option sales tax rate is calculated as an average of local statutory rates, weighted by population. See Jared Walczak and Scott Drenkard, “State and Local Sales Tax Rates, Midyear 2016,” Tax Foundation, July 5, 2016.
sales tax, Colorado’s 2.9 percent rate is the lowest. Five states have a 4 percent state-level sales tax: Alabama, Georgia, Hawaii, New York, and Wyoming. At the other end is California with a 7.25 percent state sales tax, including a mandatory statewide local add-on tax. Tied for second-highest are Indiana, Mississippi, Rhode Island, and Tennessee (all at 7 percent). Other states with high statewide rates include Minnesota (6.88 percent) and Nevada (6.85 percent).
Local Option Sales Tax Rates. Thirty-eight states authorize the use of local option sales taxes at the county and/or municipal level, and in some states, the local option sales tax significantly increases the tax rate faced by consumers.38 Local jurisdictions in Colorado, for example, add an average of 4.73 percent in local sales taxes to the state’s 2.9 percent state-level rate, bringing the total average sales tax rate to 7.63 percent. This may be an understatement in some localities with much higher local add-ons, but by weighting each locality’s rate, the Index computes a statewide average of local rates that is comparable to the average in other states.
Alabama and Louisiana have the highest average local option sales taxes (5.16 and 5.0 percent, respectively), and in both states the average local option sales tax is higher than the state sales tax rate. Other states with high local option sales taxes include Colorado (4.73 percent), New York (4.49 percent), and Oklahoma (4.44 percent).
States with the highest combined state and average local sales tax rates are Tennessee (9.469 percent), Arkansas (9.467 percent), Louisiana (9.45 percent), Washington (9.21 percent), and Alabama (9.16 percent). At the low end are Alaska (1.76 percent), Hawaii (4.41 percent), Wyoming (5.32), Wisconsin (5.44 percent), and Maine (5.5 percent).

TAX FOUNDATION | 35SA
LES & EXC
ISE TAX
Remote Seller Protections. With the Supreme Court’s elimination of the physical presence requirement for imposing sales tax collection obligations, nearly all states are now requiring remote sellers to collect and remit sales tax. While most states have adopted safe harbors for small sellers and have a single point of administration for all state and local sales taxes, a few diverge from these practices, imposing substantial compliance costs on out-of-state retailers. Alabama, Alaska (which only has local sales taxes), Colorado, and Louisiana lack uniform administration, while Kansas does not offer a safe harbor for small sellers.
Sales Tax BaseThe sales tax base subindex is computed according to five features of each state’s sales tax:
· whether the base includes a variety of business-to-business transactions such as machinery, raw materials, office equipment, farm equipment, and business leases;
· whether the base includes goods and services typically purchased by consumers, such as groceries, clothing, and gasoline;
· whether the base includes services, such as legal, financial, accounting, medical, fitness, landscaping, and repair;
· whether the state leans on sales tax holidays, which temporarily exempt select goods from the sales tax; and
· the excise tax rate on products such as gasoline, diesel fuel, tobacco, spirits, and beer.
The top five states on this subindex—New Hampshire, Delaware, Montana, Oregon, and Alaska—are the five states without a general state sales tax. However, none receives a perfect score because each levies gasoline, diesel, tobacco, and beer excise taxes. States like Nebraska, Wyoming, Illinois, Kansas,
Colorado, Missouri, and Idaho achieve high scores on their tax base by avoiding the problems of tax pyramiding and adhering to low excise tax rates, though of these, Colorado receives poor marks for a lack of local base conformity.
States with the worst scores on the base subindex are Hawaii, Washington, Alabama, South Dakota, New Jersey, New Mexico, and Connecticut. Their tax systems hamper economic growth by including too many business inputs, excluding too many consumer goods and services, and imposing excessive rates of excise taxation.
Sales Tax on Business-to-Business Transactions (Business Inputs). When a business must pay sales taxes on manufacturing equipment and raw materials, then that tax becomes part of the price of whatever the business makes with that equipment and those materials. The business must then collect sales tax on its own products, with the result that a tax is being charged on a price that already contains taxes. This tax pyramiding invariably results in some industries being taxed more heavily than others, which violates the principle of neutrality and causes economic distortions.
These variables are often inputs to other business operations. For example, a manufacturing firm will count the cost of transporting its final goods to retailers as a significant cost of doing business. Most firms, small and large alike, hire accountants, lawyers, and other professional service providers. If these services are taxed, then it is more expensive for every business to operate.
To understand how business-to-business sales taxes can distort the market, suppose a sales tax were levied on the sale of flour to a bakery. The bakery is not the end-user because the flour will be baked into bread and sold to consumers. Economic theory is not clear as

36 | STATE BUSINESS TAX CLIMATE INDEXSA
LES
& E
XCIS
E TA
X
to which party will ultimately bear the burden of the tax. The tax could be “passed forward” onto the customer or “passed backward” onto the bakery.39 Where the tax burden falls depends on how sensitive the demand for bread is to price changes. If customers tend not to change their bread-buying habits when the price rises, then the tax can be fully passed forward onto consumers. However, if the consumer reacts to higher prices by buying less, then the tax will have to be absorbed by the bakery as an added cost of doing business.
The hypothetical sales tax on all flour sales would distort the market, because different businesses that use flour have customers with varying price sensitivity. Suppose the bakery is able to pass the entire tax on flour forward to the consumer but the pizzeria down the street cannot. The owners of the pizzeria would face a higher cost structure and profits would drop. Since profits are the market signal for opportunity, the tax would tilt the market away from pizza-making. Fewer entrepreneurs would enter the pizza business, and existing businesses would hire fewer people. In both cases, the sales tax charged to purchasers of bread and pizza would be partly a tax on a tax because the tax on flour would be built into the price. Economists call this tax pyramiding, and public finance scholars overwhelmingly oppose applying the sales tax to business inputs due to the resulting pyramiding and lack of transparency.
Besley and Rosen (1998) found that for many products, the after-tax price of the good increased by the same amount as the tax itself. That means a sales tax increase was passed along to consumers on a one-for-one basis. For other goods, however, they found that the price of the good rose by twice the amount of the tax, meaning that the tax increase translates into an even larger burden for
39 See Timothy J. Besley and Harvey S. Rosen, “Sales Taxes and Prices: An Empirical Analysis,” NBER Working Paper No. 6667, July 1998. 40 Data from John Mikesell. For older published data, see Mikesell, “State Retail Taxes in 2012: The Recovery Continues,” State Tax Notes,
June 24, 2013, 1003.
consumers than is typically thought. Note that these inputs should only be exempt from sales tax if they are truly inputs into the production process. If they are consumed by an end-user, they are properly includable in the state’s sales tax base.
States that create the most tax pyramiding and economic distortion, and therefore score the worst, are states that levy a sales tax that generally allows no exclusions for business inputs. Hawaii, New Mexico, South Dakota, and Washington are examples of states that tax many business inputs.
Sales Tax Breadth. An economically neutral sales tax base includes all final retail sales of goods and services purchased by the end-users. In practice, however, states tend to include most goods, but relatively few services, in their sales tax bases, a growing issue in an increasingly service-oriented economy. Professor John Mikesell of Indiana University estimated that, nationwide, sales taxes extend to about 36 percent of all final consumer transactions.40 Exempting any goods or services narrows the tax base, drives up the sales tax rate on those items still subject to tax, and introduces unnecessary distortions into the market. A well-structured sales tax, however, does not fall upon business inputs. Therefore, states that tax services that are business inputs score poorly on the Index, while states are rewarded for expanding their base to include more final retail sales of goods and services.
Sales Tax on Gasoline. There is no economic reason to exempt gasoline from the sales tax, as it is a final retail purchase by consumers. However, all but six states do so. While all states levy an excise tax on gasoline, these funds are often dedicated for transportation purposes, making them a form of user tax distinct from the general sales tax. The four

TAX FOUNDATION | 37SA
LES & EXC
ISE TAX
states that fully include gasoline in their sales tax base (Hawaii, Illinois, Indiana, and Michigan) get a better score. Several other states receive partial credit for applying an ad valorem tax to gasoline sales, but at a different rate than for the general sales tax. New York applies local sales taxes only.
Sales Tax on Groceries. A well-structured sales tax includes all end-user goods in the tax base, to keep the base broad, rates low, and prevent distortions in the marketplace. Many states exempt groceries to reduce the incidence of the sales tax on low-income residents. Such an exemption, however, also benefits grocers and higher-income residents, and creates additional compliance costs due to the necessity of maintaining complex, ever-changing lists of exempt and nonexempt products. Public assistance programs such as the Women, Infants, and Children (WIC) program or the Supplement Nutrition Assistance Program (SNAP) provide more targeted assistance than excluding groceries from the sales tax base. Thirteen states include or partially include groceries in their sales tax base.
Excise TaxesExcise taxes are single-product sales taxes. Many of them are intended to reduce consumption of the product bearing the tax. Others, like the gasoline tax, are often used to fund specific projects such as road construction.
Gasoline and diesel excise taxes (levied per gallon) are usually justified as a form of user tax paid by those who benefit from road construction and maintenance. Though gas taxes—along with tolls—are one of the best ways to raise revenue for transportation projects (roughly approximating a user fee for infrastructure use), gasoline represents
41 See Scott Drenkard and Joseph Bishop-Henchman, “Cigarette Taxes and Cigarette Smuggling by State, 2014” Tax Foundation, Jan. 17, 2017.
a large input for most businesses, so states that levy higher rates have a less competitive business tax climate. State excise taxes on gasoline range from 58.7 cents in Pennsylvania to 14.34 cents per gallon in Alaska. The Index relies upon calculated rates from the American Petroleum Institute, capturing states’ base excise taxes in addition to other gallonage-based fees and ad valorem taxes placed upon gasoline. General sales tax rates that apply to gasoline are included in this calculated rate, but states which include, or partially include, gasoline in the sales tax base are rewarded in the sales tax breadth measure.
Tobacco, spirits, and beer excise taxes can discourage in-state consumption and encourage consumers to seek lower prices in neighboring jurisdictions (Moody and Warcholik, 2004). This impacts a wide swath of retail outlets, such as convenience stores, that move large volumes of tobacco and beer products. The problem is exacerbated for those retailers located near the border of states with lower excise taxes as consumers move their shopping out of state—referred to as cross-border shopping.
There is also the growing problem of cross-border smuggling of products from states and areas that levy low excise taxes on tobacco into states that levy high excise taxes on tobacco. This both increases criminal activity and reduces taxable sales by legitimate retailers.41
States with the highest tobacco taxes per pack of 20 cigarettes are New York and Connecticut (at $4.35 each), Rhode Island ($4.25), Massachusetts ($3.51), and Hawaii ($3.20), while states with the lowest tobacco taxes are Missouri (17 cents), Virginia (30 cents), Georgia (37 cents), North Dakota (44 cents), and North Carolina (45 cents).

38 | STATE BUSINESS TAX CLIMATE INDEXPR
OPE
RTY
TA
X
States with the highest beer taxes on a per gallon basis are Tennessee ($1.29), Alaska ($1.07), Alabama ($1.05), Georgia ($1.01), and Hawaii ($0.93), while states with the lowest beer taxes are Wyoming (2 cents), Missouri and Wisconsin (6 cents), and Colorado, Oregon, and Pennsylvania (each at 8 cents). States with the highest spirits taxes per gallon are Washington ($32.52), Oregon ($21.98), and Virginia ($19.93).
Property TaxThe property tax component, which includes taxes on real and personal property, net worth, and the transfer of assets, accounts for 16.6 percent of each state’s Index score.
When properly structured, property taxes exceed most other taxes in comporting with the benefit principle and can be fairly economically efficient. In the realm of public finance, they are often also prized for their comparative transparency among taxes, though that transparency may contribute to the public’s generally low view of property taxes. The Tax Foundation’s Survey of Tax Attitudes found that local property taxes are perceived as the second most unfair state or local tax.42
Property taxes matter to businesses, and the tax rate on commercial property is often higher than the tax on comparable residential property. Additionally, many localities and states levy taxes on the personal property or equipment owned by a business. They can be on assets ranging from cars to machinery and equipment to office furniture and fixtures, but are separate from real property taxes, which are taxes on land and buildings.
Businesses remitted $738 billion in state and local taxes in fiscal year 2017, of which $287 billion (38.9 percent) was for property
42 See Matt Moon, “How do Americans Feel about Taxes Today?” Tax Foundation’s 2009 Survey of U.S. Attitudes on Taxes, Government Spending and Wealth Distribution, Tax Foundation, Apr. 8, 2009.
taxes. The property taxes included tax on real, personal, and utility property owned by businesses (Phillips et al. 2019). Since property taxes can be a large burden on business, they can have a significant effect on location decisions.
Mark, McGuire, and Papke (2000) find taxes that vary from one location to another within a region could be uniquely important determinants of intraregional location decisions. They find that higher rates of two business taxes—the sales tax and the personal property tax—are associated with lower employment growth. They estimate that a tax hike on personal property of one percentage point reduces annual employment growth by 2.44 percentage points.
Bartik (1985), finding that property taxes are a significant factor in business location decisions, estimates that a 10 percent increase in business property taxes decreases the number of new plants opening in a state by between 1 and 2 percent. Bartik (1989) backs up his earlier findings by concluding that higher property taxes negatively affect the establishment of small businesses. He elaborates that the particularly strong negative effect of property taxes occurs because they are paid regardless of profits, and many small businesses are not profitable in their first few years, so high property taxes would be more influential than profit-based taxes on the start-up decision.
States which keep statewide property taxes low better position themselves to attract business investment. Localities competing for business can put themselves at a greater competitive advantage by keeping personal property taxes low.
Taxes on capital stock, tangible and intangible property, inventory, real estate transfers,

TAX FOUNDATION | 39PRO
PERTY TA
X
TABLE 6.Property Tax Component of the State Business Tax Climate Index (2014–2020)
Prior Year Ranks 2019 2020 2019-2020 ChangeState 2014 2015 2016 2017 2018 Rank Score Rank Score Rank ScoreAlabama 13 13 17 18 12 16 5.50 15 5.51 1 0.02Alaska 32 33 22 24 38 25 5.09 25 5.07 0 -0.02Arizona 6 6 6 6 6 6 6.33 8 6.32 -2 -0.02Arkansas 19 19 28 25 22 29 5.00 29 5.00 0 0.00California 16 16 15 17 13 15 5.53 16 5.44 -1 -0.08Colorado 21 21 14 16 14 14 5.55 14 5.52 0 -0.03Connecticut 50 50 50 50 49 50 2.60 50 2.56 0 -0.04Delaware 8 8 9 11 20 7 6.32 6 6.34 1 0.02Florida 18 18 21 13 10 13 5.63 13 5.61 0 -0.03Georgia 30 30 24 23 23 27 5.03 28 5.01 -1 -0.02Hawaii 7 7 8 9 16 11 5.92 11 5.87 0 -0.05Idaho 3 3 4 3 3 5 6.43 4 6.49 1 0.07Illinois 42 42 41 41 45 40 4.08 40 4.10 0 0.02Indiana 5 5 5 4 4 3 6.47 2 6.52 1 0.05Iowa 31 32 35 35 39 35 4.60 35 4.62 0 0.02Kansas 28 28 19 21 19 20 5.35 20 5.32 0 -0.03Kentucky 34 35 37 37 36 36 4.51 36 4.55 0 0.04Louisiana 23 23 29 32 30 33 4.79 33 4.79 0 0.00Maine 43 43 43 43 41 42 3.84 43 3.80 -1 -0.04Maryland 45 45 44 44 42 43 3.80 42 3.85 1 0.05Massachusetts 46 46 47 47 46 48 3.35 48 3.29 0 -0.07Michigan 27 27 27 26 21 24 5.09 24 5.09 0 0.00Minnesota 25 26 23 29 28 26 5.07 26 5.07 0 0.00Mississippi 33 34 36 36 35 37 4.50 37 4.52 0 0.02Missouri 9 9 11 7 7 8 6.26 7 6.33 1 0.07Montana 10 10 12 12 9 12 5.69 12 5.74 0 0.05Nebraska 40 40 40 40 40 41 3.88 41 3.88 0 0.00Nevada 11 11 10 10 8 10 5.97 10 5.95 0 -0.02New Hampshire 41 41 42 42 44 44 3.76 44 3.77 0 0.01New Jersey 49 49 49 49 50 47 3.37 47 3.37 0 0.00New Mexico 1 1 1 1 1 1 6.69 1 6.73 0 0.04New York 44 44 45 45 47 46 3.62 46 3.61 0 -0.01North Carolina 29 29 31 33 32 34 4.76 34 4.75 0 -0.01North Dakota 2 2 2 2 2 2 6.61 3 6.51 -1 -0.09Ohio 12 12 7 8 11 9 6.07 9 6.13 0 0.06Oklahoma 14 14 18 14 15 19 5.37 19 5.35 0 -0.02Oregon 17 17 13 19 18 17 5.38 18 5.36 -1 -0.02Pennsylvania 39 39 32 22 33 22 5.19 21 5.24 1 0.05Rhode Island 47 47 46 46 43 45 3.67 45 3.63 0 -0.05South Carolina 20 20 26 27 24 30 5.00 30 4.98 0 -0.02South Dakota 15 15 20 20 25 21 5.19 22 5.21 -1 0.02Tennessee 38 38 39 31 29 31 4.85 31 4.92 0 0.07Texas 36 37 34 38 37 38 4.40 38 4.36 0 -0.03Utah 4 4 3 5 5 4 6.44 5 6.42 -1 -0.02Vermont 48 48 48 48 48 49 2.84 49 2.84 0 0.00Virginia 24 25 30 30 31 32 4.83 32 4.84 0 0.00Washington 22 22 25 28 27 28 5.02 27 5.02 1 0.00West Virginia 26 24 16 15 17 18 5.37 17 5.37 1 0.00Wisconsin 37 31 33 34 26 23 5.10 23 5.14 0 0.04Wyoming 35 36 38 39 34 39 4.32 39 4.31 0 -0.01District of Columbia 46 46 40 48 46 49 3.34 49 3.28 0 -0.07Note: A rank of 1 is best, 50 is worst. All scores are for fiscal years. D.C.'s score and rank do not affect other states.Source: Tax Foundation.

40 | STATE BUSINESS TAX CLIMATE INDEXPR
OPE
RTY
TA
X
estates, inheritance, and gifts are also included in the property tax component of the Index. The states that score the best on property tax are New Mexico, Indiana, North Dakota, Idaho, Utah, and Delaware. These states generally have low rates of property tax, whether measured per capita or as a percentage of income. They also avoid distortionary taxes like estate, inheritance, gift, and other wealth taxes. States that score poorly on the property tax component are Connecticut, Vermont, Massachusetts, New Jersey, and New York. These states generally have high property tax rates and levy several wealth-based taxes.
The property tax portion of the Index is composed of two equally weighted subindices devoted to measuring the economic impact of both rates and bases. The rate subindex consists of property tax collections (measured both per capita and as a percentage of personal income) and capital stock taxes. The base portion consists of dummy variables detailing whether each state levies wealth taxes such as inheritance, estate, gift, inventory, intangible property, and other similar taxes.43
Property Tax RateThe property tax rate subindex consists of property tax collections per capita (40 percent of the subindex score), property tax collections as a percent of personal income (40 percent of the subindex score), and capital stock taxes (20 percent of the subindex score). The heavy weighting of tax collections is due to their importance to businesses and individuals and their increasing size and visibility to all taxpayers. Both are included to gain a better understanding of how much each state collects in proportion to its population and its income. Tax collections as a percentage of personal income forms an effective rate that
43 Though not included directly in this Index for data availability reasons, tangible personal property taxes can also affect business decisions. For a comprehensive review of these taxes and reform recommendations, see Joyce Errecart, Ed Gerrish, and Scott Drenkard, “States Moving Away from Taxes on Tangible Personal Property,” Tax Foundation, Oct. 4, 2012.
gives taxpayers a sense of how much of their income is devoted to property taxes, and the per capita figure lets them know how much in actual dollar terms they pay in property taxes compared to residents of other states.
While these measures are not ideal—having effective tax rates of personal and real property for both businesses and individuals would be preferable—they are the best measures available due to the significant data constraints posed by property tax collections. Since a high percentage of property taxes are levied on the local level, there are countless jurisdictions. The sheer number of different localities makes data collection almost impossible. The few studies that tackle the subject use representative towns or cities instead of the entire state. Thus, the best source for data on property taxes is the Census Bureau, because it can compile the data and reconcile definitional problems.
States that maintain low effective rates and low collections per capita are more likely to promote growth than states with high rates and collections.
Property Tax Collections Per Capita. Property tax collections per capita are calculated by dividing property taxes collected in each state (obtained from the Census Bureau) by population. The states with the highest property tax collections per capita are New Jersey ($3,127), New Hampshire ($3,115), Connecticut ($2,927), New York ($2,782), and Vermont ($2,593). The states that collect the least per capita are Alabama ($545), Oklahoma ($699), Arkansas ($712), New Mexico ($768), and Kentucky ($7775).
Effective Property Tax Rate. Property tax collections as a percent of personal income are derived by dividing the Census Bureau’s

TAX FOUNDATION | 41PRO
PERTY TA
X
figure for total property tax collections by personal income in each state. This provides an effective property tax rate. States with the highest effective rates and therefore the worst scores are New Hampshire (5.45 percent), Vermont (5.12 percent), New Jersey (5.05 percent), Rhode Island (4.75 percent), Maine (4.74 percent), and New York (4.57 percent). States that score well with low effective tax rates are Alabama (1.39 percent), Oklahoma (1.66 percent), Arkansas and Delaware (1.79 percent), Tennessee (1.90 percent), and Kentucky (1.96 percent).
Capital Stock Tax Rate. Capital stock taxes (sometimes called franchise taxes) are levied on the wealth of a corporation, usually defined as net worth. They are often levied in addition to corporate income taxes, adding a duplicate layer of taxation and compliance for many corporations. Corporations that find themselves in financial trouble must use their limited cash flow to pay their capital stock tax. In assessing capital stock taxes, the subindex accounts for three variables: the capital stock tax rate; the maximum payment; and whether any capital stock tax is imposed in addition to a corporate income tax, or whether the business is liable for the higher of the two. The capital stock tax subindex is 20 percent of the total rate subindex.
This variable measures the rate of taxation as levied by the 16 states with a capital stock tax. Legislators have come to realize the damaging effects of capital stock taxes, and a handful of states are reducing or repealing them. Kansas completed the phaseout of its tax in 2011. West Virginia and Rhode Island fully phased out their capital stock taxes as of January 1, 2015, and Pennsylvania phased out its capital stock tax in 2016. The New York capital stock tax will phase out by 2021. Illinois will begin a phaseout in 2020, completing the process in 2024. Connecticut will phase out its tax over five years starting in 2021. States with the highest capital stock tax rates
include Connecticut (0.341 percent), Arkansas and Louisiana (0.3 percent), Massachusetts (0.26 percent), Tennessee (0.25 percent), and Mississippi (0.225 percent).
Maximum Capital Stock Tax Payment. Eight states mitigate the negative economic impact of the capital stock tax by placing a cap on the maximum capital stock tax payment. These states are Alabama, Connecticut, Delaware, Georgia, Illinois, Nebraska, New York, and Oklahoma, and among states with a capital stock tax, they receive the highest score on this variable.
Capital Stock Tax versus Corporate Income Tax. Some states mitigate the negative economic impact of the capital stock tax by allowing corporations to pay the higher of their capital stock tax or their corporate tax. These states (Connecticut, Massachusetts, and New York) are given credit for this provision. States that do not have a capital stock tax get the best scores in this subindex while the states that force companies to pay both score the worst.
Property Tax BaseThis subindex is composed of dummy variables listing the different types of property taxes each state levies. Seven taxes are included and each is equally weighted. Arizona, Delaware, Idaho, Indiana, Missouri, Montana, New Mexico, Ohio, Utah, and Wyoming score the best because they each only levy one of the seven taxes.. Maryland and Kentucky receive the worst scores because they impose many of these taxes.
Business Tangible Property Tax. This variable rewards states which remove, or substantially remove, business tangible personal property from their tax base. Taxes on tangible personal property, meaning property that can be touched or moved (as opposed to real

42 | STATE BUSINESS TAX CLIMATE INDEXPR
OPE
RTY
TA
X
estate), are a source of tax complexity and nonneutrality, incentivizing firms to change their investment decisions and relocate to avoid the tax. Seven states (Delaware, Hawaii, Illinois, Iowa, New York, Ohio, and Pennsylvania) exempt all tangible personal property from taxation, while another five states (Minnesota, New Hampshire, New Jersey, North Dakota, and South Dakota) exempt most such property from taxation except for select industries that are centrally assessed.
Intangible Property Tax. This dummy variable gives low scores to those states that impose taxes on intangible personal property. Intangible personal property includes stocks, bonds, and other intangibles such as trademarks. This tax can be highly detrimental to businesses that hold large amounts of their own or other companies’ stock and that have valuable trademarks. Ten states levy this tax in various degrees: Alabama, Iowa, Kansas, Kentucky, Louisiana, Mississippi, North Carolina, South Dakota, Tennessee, and Texas.44
Inventory Tax. Levied on the value of a company’s inventory, the inventory tax is especially harmful to large retail stores and other businesses that store large amounts of merchandise. Inventory taxes are highly distortionary, because they force companies to make decisions about production that are not entirely based on economic principles but rather on how to pay the least amount of tax on goods produced. Inventory taxes also create strong incentives for companies to locate inventory in states where they can avoid these harmful taxes. Fourteen states levy some form of inventory tax.
Asset Transfer Taxes (Estate, Inheritance, Transfer, and Gift Taxes). Four taxes levied on the transfer of assets are part of the property
44 Some states, like Kentucky, are often considered not to impose an intangible property tax but continue to levy a low millage on financial deposits.
45 For a summary of the effects of the estate tax on business, see Congressional Budget Office, “Effects of the Federal Estate Tax on Farms and Small Businesses,” July 2005. For a summary on the estate tax in general, see David Block and Scott Drenkard, “The Estate Tax: Even Worse Than Republicans Say,” Tax Foundation, Sept. 4, 2012.
tax base. These taxes, levied in addition to the federal estate tax, all increase the cost and complexity of transferring wealth and hurt a state’s business climate. These harmful effects can be particularly acute in the case of small, family-owned businesses if they do not have the liquid assets necessary to pay the estate’s tax liability.45 The four taxes are real estate transfer taxes, estate taxes, inheritance taxes, and gift taxes. Thirty-five states and the District of Columbia levy taxes on the transfer of real estate, adding to the cost of purchasing real property and increasing the complexity of real estate transactions. This tax is harmful to businesses that transfer real property often.
The federal Economic Growth and Tax Relief Reconciliation Act of 2001 (EGTRRA) lowered the federal estate tax rate through 2009 and eliminated it entirely in 2010. Prior to 2001, most states levied an estate tax that piggybacked on the federal system, because the federal tax code allowed individuals to take a dollar-for-dollar tax credit for state estate taxes paid. In other words, states essentially received free tax collections from the estate tax, and individuals did not object because their total tax liability was unchanged. EGTRRA eliminated this dollar-for-dollar credit system, replacing it with a tax deduction.
Consequently, over the past decade, some states enacted their own estate tax while others repealed their estate taxes. Some states have provisions reintroducing the estate tax if the federal dollar-for-dollar credit system is revived. This would have happened in 2011, as EGTRRA expired and the federal estate tax returned to pre-2001 levels. However, in late 2010, Congress reenacted the estate tax for 2011 and 2012 but with higher exemptions and a lower rate than pre-2001 law, and maintained the deduction for state estate taxes. The tax reform law of 2017 raised the

TAX FOUNDATION | 43PRO
PERTY TA
X
federal exemption still further. Thirty-eight states receive a high score for either (1) remaining coupled to the federal credit and allowing their state estate tax to expire or (2) not enacting their own estate tax, including two which repealed their estate tax this year. Twelve states have maintained an estate tax either by linking their tax to the pre-EGTRRA credit or by creating their own stand-alone system. These states score poorly.
Each year, some businesses, especially those that have not spent a sufficient sum on estate tax planning and on large insurance policies, find themselves unable to pay their estate taxes, either federal or state. Usually they are small- to medium-sized family-owned businesses where the death of the owner occasions a surprisingly large tax liability.
Inheritance taxes are similar to estate taxes, but they are levied on the heir of an estate instead of on the estate itself. Therefore, a person could inherit a family-owned company from his or her parents and be forced to downsize it, or sell part or all of it, in order to pay the heir’s inheritance tax. Six states have inheritance taxes and are punished in the Index, because the inheritance tax causes economic distortions. Maryland has both an estate tax and an inheritance tax, the only state to impose both now that New Jersey has completed the repeal of its estate tax.
Connecticut is the only state with a gift tax, and it scores poorly. Gift taxes are designed to stop individuals’ attempts to avoid the estate tax by giving their estates away before they die. Gift taxes have a negative impact on a state’s business tax climate because they also heavily impact individuals who have sole proprietorships, S corporations, and LLCs.

44 | STATE BUSINESS TAX CLIMATE INDEXU
NEM
PLO
YM
ENT
INSU
RA
NC
E T
AX
Unemployment Insurance Taxes
Unemployment insurance (UI) is a social insurance program jointly operated by the federal and state governments. Taxes are paid by employers into the UI program to finance benefits for workers recently unemployed. Compared to the other major taxes assessed in the State Business Tax Climate Index, UI taxes are much less well-known. Every state has one, and all 50 of them are complex, variable-rate systems that impose different rates on different industries and different bases depending upon such factors as the health of the state’s UI trust fund.46
One of the worst aspects of the UI tax system is that financially troubled businesses, for which layoffs may be a matter of survival, actually pay higher marginal rates as they are forced into higher tax rate schedules. In the academic literature, this has long been called the “shut-down effect” of UI taxes: failing businesses face climbing UI taxes, with the result that they fail sooner.
The unemployment insurance tax component of the Index consists of two equally weighted subindices, one that measures each state’s rate structure and one that focuses on the tax base. Unemployment insurance taxes comprise 9.5 percent of a state’s final Index score.
Overall, the states with the least damaging UI taxes are Oklahoma, Florida, Delaware, Louisiana, Mississippi, and Arizona. Comparatively speaking, these states have rate structures with lower minimum and maximum rates and a wage base at the federal level. In addition, they have simpler experience formulas and charging methods, and they have not complicated their systems with benefit add-ons and surtaxes.
46 See generally Joseph Bishop-Henchman, “Unemployment Insurance Taxes: Options for Program Design and Insolvent Trust Funds,” Tax Foundation, Oct. 17, 2011.
Conversely, the states with the worst UI taxes are Massachusetts, Kentucky, Idaho, Nevada, and Alaska. These states tend to have rate structures with high minimum and maximum rates and wage bases above the federal level. They also tend to feature more complicated experience formulas and charging methods, and have added benefits and surtaxes to their systems.
Unemployment Insurance Tax RateUI tax rates in each state are based on a schedule of rates ranging from a minimum rate to a maximum rate. The rate for any particular business is dependent upon the business’ experience rating: businesses with the best experience ratings will pay the lowest possible rate on the schedule while those with the worst ratings pay the highest. The rate is applied to a taxable wage base (a predetermined fraction of an employee’s wage) to determine UI tax liability.
Multiple rates and rate schedules can affect neutrality as states attempt to balance the dual UI objectives of spreading the cost of unemployment to all employers and ensuring high-turnover employers pay more.
Overall, the states with the best score on this rate subindex are Oklahoma, Florida, Delaware, Louisiana, Mississippi, and Arizona. Generally, these states have low minimum and maximum tax rates on each schedule and a wage base at or near the federal level. The states with the worst scores are Massachusetts, Kentucky, Idaho, Nevada, and Alaska.
The subindex gives equal weight to two factors: the actual rate schedules in effect in the most recent year, and the statutory rate schedules that can potentially be implemented

TAX FOUNDATION | 45U
NEM
PLOY
MEN
T INSU
RA
NC
E TAX
TABLE 7.Unemployment Insurance Tax Component of the State Business Tax Climate Index (2014–2020)
Prior Year Ranks 2019 2020 2019-2020 ChangeState 2014 2015 2016 2017 2018 Rank Score Rank Score Rank ScoreAlabama 23 25 26 14 11 12 5.41 18 5.26 -6 -0.15Alaska 26 24 22 29 25 35 4.75 46 4.31 -11 -0.44Arizona 2 4 5 11 15 13 5.41 6 5.67 7 0.27Arkansas 28 40 43 30 32 34 4.76 23 4.98 11 0.23California 14 14 13 16 13 17 5.21 22 5.05 -5 -0.16Colorado 38 35 34 42 35 40 4.59 43 4.53 -3 -0.06Connecticut 21 20 20 21 19 23 5.06 21 5.07 2 0.01Delaware 1 3 3 3 3 3 5.95 3 5.86 0 -0.09Florida 4 2 2 2 2 2 6.06 2 6.01 0 -0.05Georgia 39 39 39 35 38 38 4.65 39 4.61 -1 -0.04Hawaii 32 28 24 24 27 26 4.88 28 4.86 -2 -0.02Idaho 47 46 45 46 46 48 4.04 48 4.01 0 -0.03Illinois 41 37 37 38 42 42 4.56 40 4.58 2 0.02Indiana 10 9 15 10 10 11 5.53 25 4.96 -14 -0.57Iowa 33 33 35 34 34 33 4.78 35 4.72 -2 -0.06Kansas 7 8 11 12 12 15 5.39 14 5.41 1 0.03Kentucky 46 45 46 48 47 47 4.06 49 3.91 -2 -0.14Louisiana 5 5 4 9 4 4 5.85 4 5.79 0 -0.06Maine 37 42 41 44 44 24 4.95 32 4.80 -8 -0.14Maryland 31 21 28 26 24 28 4.87 33 4.79 -5 -0.07Massachusetts 48 48 47 49 49 50 3.40 50 3.29 0 -0.12Michigan 44 47 48 47 48 49 3.85 17 5.27 32 1.42Minnesota 34 29 29 28 37 25 4.89 34 4.78 -9 -0.11Mississippi 8 7 8 5 5 5 5.84 5 5.77 0 -0.07Missouri 13 13 12 7 7 8 5.62 9 5.56 -1 -0.07Montana 20 18 18 19 20 21 5.15 20 5.10 1 -0.05Nebraska 12 12 10 8 9 9 5.59 11 5.55 -2 -0.05Nevada 43 43 42 43 45 45 4.20 47 4.17 -2 -0.03New Hampshire 45 44 44 41 43 44 4.44 45 4.44 -1 0.00New Jersey 30 32 32 25 36 32 4.81 30 4.83 2 0.02New Mexico 11 10 7 17 16 10 5.55 8 5.61 2 0.06New York 24 31 33 32 30 31 4.81 38 4.68 -7 -0.14North Carolina 9 11 9 6 6 7 5.67 10 5.56 -3 -0.11North Dakota 16 16 16 15 14 14 5.39 13 5.46 1 0.07Ohio 6 6 6 4 8 6 5.74 7 5.67 -1 -0.07Oklahoma 3 1 1 1 1 1 6.41 1 6.35 0 -0.05Oregon 29 30 27 33 31 37 4.72 36 4.69 1 -0.03Pennsylvania 50 50 50 45 50 46 4.14 42 4.56 4 0.41Rhode Island 49 49 49 50 23 29 4.86 31 4.81 -2 -0.04South Carolina 35 36 31 37 29 27 4.87 26 4.88 1 0.01South Dakota 40 41 40 40 39 39 4.61 44 4.52 -5 -0.09Tennessee 25 26 25 23 22 22 5.08 24 4.96 -2 -0.12Texas 15 15 14 13 26 18 5.20 12 5.51 6 0.31Utah 19 22 19 22 21 16 5.36 15 5.36 1 0.01Vermont 17 17 17 20 18 20 5.18 16 5.32 4 0.14Virginia 42 38 38 39 41 43 4.56 41 4.56 2 0.01Washington 18 19 21 18 17 19 5.20 19 5.12 0 -0.08West Virginia 22 23 23 27 28 30 4.83 29 4.86 1 0.03Wisconsin 27 27 36 36 40 41 4.58 37 4.68 4 0.10Wyoming 36 34 30 31 33 36 4.73 27 4.87 9 0.14District of Columbia 25 27 27 27 30 33 4.78 35 4.74 -2 -0.04Note: A rank of 1 is best, 50 is worst. All scores are for fiscal years. D.C.'s score and rank do not affect other states.Source: Tax Foundation.

46 | STATE BUSINESS TAX CLIMATE INDEXU
NEM
PLO
YM
ENT
INSU
RA
NC
E T
AX
at any time depending on the state of the economy and the UI fund.
Tax Rates Imposed in the Most Recent YearMinimum Tax Rate. States with lower minimum rates score better. The minimum rates in effect in the most recent year range from zero percent (in Hawaii, Iowa, Kansas, Missouri, and Nebraska) to 1.9 percent (in Connecticut).
Maximum Tax Rate. States with lower maximum rates score better. The maximum rates in effect in the most recent year range from 5.4 percent (in Alaska, Florida, Idaho, Nebraska, Nevada, New Jersey, and Oregon) to 14.3 percent (in Arkansas).
Taxable Wage Base. Arizona, California, Florida, and Tennessee receive the best scores in this variable with a taxable wage base of $7,000—in line with the federal taxable wage base. The state with the highest taxable bases and, thus, the worst score on this variable, is Washington ($49,800).
Potential Rates
Due to the effect of business and seasonal cycles on UI funds, states will sometimes change UI tax rate schedules. When UI trust funds are flush, states will trend toward their lower rate schedules (“most favorable schedules”); however, when UI trust funds are low, states will trend toward their higher rate schedules (“least favorable schedules”).
Most Favorable Schedule: Minimum Tax Rate. States receive the best score in this variable with a minimum tax rate of zero, which they implement when unemployment is low and the UI fund is flush. The minimum rate on the most favorable schedule ranges from zero in 22 states to 1.0 percent in Alaska.
Most Favorable Schedule: Maximum Tax Rate. The lowest maximum rate of 5.4 percent is imposed by 20 states and the District of Columbia. The state with the highest maximum tax rate and, thus, the worst maximum tax score, is Wisconsin (10.7 percent).
Least Favorable Schedule: Minimum Tax Rate. Twelve states receive the best score on this variable with a minimum tax rate of zero percent. The state with the highest minimum tax rate and, thus, the worst minimum tax score, is Hawaii (2.4 percent).
Least Favorable Schedule: Maximum Tax Rate. Five states receive the best score in this variable with a comparatively low maximum tax rate of 5.4 percent. The state with the highest maximum tax rate and, thus, the worst maximum tax score, is Massachusetts (18.55 percent).
Unemployment Insurance Tax BaseThe UI base subindex scores states on how they determine which businesses should pay the UI tax and how much, as well as other UI-related taxes for which businesses may also be liable.
The states that receive the best scores on this subindex are Oklahoma, Delaware, Vermont, New Mexico, and Ohio. In general, these states have relatively simple experience formulas, they exclude more factors from the charging method, and they enforce fewer surtaxes.
States that receive the worst scores are Virginia, Nevada, Idaho, Maine, and Kentucky. In general, they have more complicated experience formulas, exclude fewer factors from the charging method, and have complicated their systems with add-ons and surtaxes. The three factors considered in this subindex are experience rating formulas

TAX FOUNDATION | 47U
NEM
PLOY
MEN
T INSU
RA
NC
E TAX
(40 percent of the subindex score), charging methods (40 percent of the subindex score), and a host of smaller factors aggregated into one variable (20 percent of the subindex score).
Experience Rating Formula. A business’ experience rating formula determines the rate the firm must pay—whether it will lean toward the minimum rate or maximum rate of the particular rate schedule in effect in the state at that time.
There are four basic experience formulas: contribution, benefit, payroll, and state. The first three experience formulas—contribution, benefit, and payroll—are based solely on the business’ experience and are therefore nonneutral by design.47 However, the final variable—state experience—is a positive mitigating factor because it is based on statewide experience. In other words, the state experience is not tied to the experience of any one business; therefore, it is a more neutral factor. This subindex penalizes states that depend on the contribution, benefit, and payroll experience variables while rewarding states with the state experience variable.
Charging Methods and Benefits Excluded from Charging. A business’ experience rating will vary depending on which charging method the state government uses. When a former employee applies for unemployment benefits, the benefits paid to the employee must be charged to a previous employer. There are three basic charging methods:
· Charging Most Recent or Principal Employer: Nine states charge all the benefits to one employer, usually the most recent.
47 Alaska is the only state to use the payroll experience method. This method does not use benefit payments in the formula but instead the variation in an employer’s payroll from quarter to quarter. This is a violation of tax neutrality since any decision by the employer or employee that would affect payroll may trigger higher UI tax rates.
· Charging Base-Period Employers in Inverse Chronological Order: Six states charge all base-period employers in inverse chronological order. This means that all employers within a base period of time (usually the last year, sometimes longer) will have the benefits charged against them, with the most recent employer being charged the most.
· Charging in Proportion to Base-Period Wages: Thirty-four states and the District of Columbia charge in proportion to base-period wages. This means that all employers within a base period of time (usually the last year, sometimes longer) will have the benefits charged against them in proportion to the wages they paid.
None of these charging methods could be called neutral, but at the margin, charging the most recent or principal employer is the least neutral because the business faced with the necessity of laying off employees knows it will bear the full benefit charge. The most neutral of the three is the “charging in proportion to base-period wages” since there is a higher probability of sharing the benefit charges with previous employers.
As a result, the states that charge in proportion to base-period wages receive the best score. The states that charge the most recent or principal employer receive the worst score. The states that charge base-period employers in inverse chronological order receive a median score.
Many states also recognize that certain benefit costs should not be charged to employers, especially if the separation is beyond the employer’s control. Therefore, this subindex also accounts for six types of exclusions from benefit charges:

48 | STATE BUSINESS TAX CLIMATE INDEXU
NEM
PLO
YM
ENT
INSU
RA
NC
E T
AX
· Benefit award reversed · Reimbursements on combined wage
claims · Voluntary leaving · Discharge for misconduct · Refusal of suitable work · Continues to work for employer on part-
time basis
States are rewarded for each of these exclusions because they nudge a UI system toward neutrality. For instance, if benefit charges were levied for employees who voluntarily quit, then industries with high turnover rates, such as retail, would be hit disproportionately harder. States that receive the best scores in this category are Alaska, Connecticut, Delaware, Louisiana, Missouri, Ohio, Rhode Island, and Vermont. On the other hand, the states that receive the worst scores are Virginia, Nevada, Michigan New Hampshire, Maine, Idaho, and Georgia. Most states charge the most recent or principal employer and forbid most benefit exclusions.
Solvency Tax. These taxes are levied on employers when a state’s unemployment fund falls below some defined level. Twenty-eight states have a solvency tax on the books, though they fall under different names, such as solvency adjustment tax (Alaska), supplemental assessment tax (Delaware), subsidiary tax (New York), and fund balance factor (Virginia).
Taxes for Socialized Costs or Negative Balance Employer. These are levied on employers when the state desires to recover benefit costs above and beyond the UI tax collections based on the normal experience rating process. Ten states have these taxes on the books, though they fall under different names, such as shared cost assessment tax (Alabama) and social cost factor tax (Washington).
Loan and Interest Repayment Surtaxes. Levied on employers when a loan is taken from the federal government or when bonds are sold to
pay for benefit costs, these taxes are of two general types. The first is a tax to pay off the federal loan or bond issue. The second is a tax to pay the interest on the federal loan or bond issue. States are not allowed to pay interest costs directly from the state’s unemployment trust fund. Twenty-five states and the District of Columbia have these taxes on the books, though they fall under several names, such as advance interest tax and bond assessment tax (Colorado), temporary emergency assessment tax (Delaware), and unemployment obligation assessment (Texas).
Reserve Taxes. Reserve taxes are levied on employers, to be deposited in a reserve fund separate from the unemployment trust fund. Since the fund is separate, the interest earned on it is often used to create other funds for purposes such as job training and paying the costs of the reserve tax’s collection. Four states have these taxes on the books: Idaho and Iowa (reserve tax), Nebraska (state UI tax), and North Carolina (reserve fund tax).
Surtaxes for UI Administration or Non-UI Purposes. Twenty-seven states and the District of Columbia levy surtaxes on employers, usually to fund administration but sometimes for job training or special improvements in technology. They are often deposited in a fund outside of the state’s unemployment fund. Some of the names they go by are job training tax (Arizona), reemployment service fund tax (New York), wage security tax (Oregon), and investment in South Dakota future fee (South Dakota).
Temporary Disability Insurance (TDI). A handful of states—California, Hawaii, New Jersey, and New York—have established a temporary disability insurance (TDI) program that augments the UI program by extending benefits to those unable to work because of sickness or injury. No separate tax funds these programs; the money comes right out of the states’ unemployment funds. Because the
TAX FOUNDATION | 49U
NEM
PLOY
MEN
T INSU
RA
NC
E TAX
balance of the funds triggers various taxes, the TDIs are included as a negative factor in the calculation of this subindex.
Voluntary Contributions. Twenty-five states allow businesses to make voluntary contributions to the unemployment trust fund. In most cases, these contributions are rewarded with a lower rate schedule, often saving the business more money in taxes than was paid through the contribution. The Index rewards states that allow voluntary contributions because firms are able to pay when they can best afford to instead of when they are struggling. This provision helps to mitigate the nonneutralities of the UI tax.
Time Period to Qualify for Experience Rating. Newly formed businesses, naturally, do not qualify for an experience rating because they have no significant employment history on which to base the rating. Federal rules stipulate that states can levy a “new employer” rate for one to three years, but no less than one year. From a neutrality perspective, however, this new employer rate is nonneutral in almost all cases since the rate is higher than the lowest rate schedule. The longer this rate is in effect, the worse the nonneutrality. As such, the Index rewards states with the minimum one year required to earn an experience rating and penalizes states that require the full three years.

50 | STATE BUSINESS TAX CLIMATE INDEXR
EFER
ENC
ES
ReferencesAgostini, Claudio and Soraphol Tulayasathien. “Tax Effects on Investment Location: Evidence for Foreign Direct Investment in the United States,” Office of Tax Policy Research, University of Michigan Business School (2001).
Anderson, Patrick. “Benchmarking for Success: A Comparison of State Business Taxes,” Anderson Economic Group (2006): 19-20.
Bartik, Timothy J. Who Benefits from State and Local Economic Development Policies? (Kalamazoo, MI: W.E. Upjohn Institute for Employment Research, 1991).
Bartik, Timothy J. “Small Business Start-Ups in the United States: Estimates of the Effects of Characteristics of States,” Southern Economic Journal (April 1989): 1004-1018.
Bartik, Timothy J. “Business Location Decisions in the United States: Estimates of the Effects of Unionization, Taxes, and Other Characteristics of States,” Journal of Business and Economics Statistics 3:1 (January 1985): 14-22.
Besley, Timothy J. and Anne Case. “Does Electoral Accountability Affect Economic Policy Choices? Evidence from Gubernatorial Term Limits,” Quarterly Journal of Economics 110:1 (August 1995): 769–798.
Besley, Timothy J. and Harvey S. Rosen. “Sales Taxes and Prices: An Empirical Analysis,” NBER Working Paper No. 6667 (July 1998).
Bishop-Henchman, Joseph. “Unemployment Insurance Taxes: Options for Program Design and Insolvent Trust Funds,” Tax Foundation (Oct. 17, 2011).
Bishop-Henchman, Joseph and Jason Sapia. “Local Income Taxes: City- and County-Level Income and Wage Taxes Continue to Wane,” Tax Foundation (Aug. 31, 2011).
Bittlingmayer, Gregory, Liesel Eathington, Arthur Hall and Peter F. Orazem. “Business Climate Indexes: Which Work, Which Don’t, and What Can They Say about the Kansas Economy?” The Center for Applied Economics, Kansas University (June 2005).
Bosch, Nuria and Albert Sole-Olle. “Yardstick competition and the political costs of raising taxes: An empirical analysis of Spanish municipalities,” International Tax and Public Finance 14:1 (February 2007): 71-92.
Brueckner, Jan and Luz A. Saavedra. “Do Local Governments Engage in Strategic Property-Tax Competition?” National Tax Journal 54 (June 2001): 203–229.
Brunori, David. State Tax Policy: A Political Perspective (Washington, D.C.: Urban Institute Press, September 2011).
Brunori, David. Local Tax Policy: A Federalist Perspective (Washington, D.C.: Urban Institute Press, December 2007).
Byars, Jon, Bobby McCormick, and Bruce Yandle. “Economic Freedom in America’s 50 States: a 1999 Analysis,” Center for Policy and Legal Studies, Department of Economics, Clemson University (March 1, 1999).
Carroll, Robert, Douglas Holtz-Eakin, Mark Rider, and Harvey S. Rosen. “Income Taxes and Entrepreneurs’ Use of Labor,” Journal of Labor Economics 18 (April 2000): 324-351.
Chamberlain, Andrew and Patrick Fleenor. “Tax Pyramiding: The Economic Consequences of Gross Receipts Taxes,” Tax Foundation (Dec. 4, 2006).
Chorvat, Terrence R. and Michael S. Knoll. “The Economic and Policy Implications of Repealing the Corporate Alternative Tax,” Tax Foundation (Feb. 1, 2002).
Due, John F. “Studies of State-Local Tax Influences on Location of Industry,” National Tax Journal 14 (June 1961): 163-173.
Drenkard, Scott, Liz Emanuel, and Yordan Yahiro. “State and Local Sales Taxes at Midyear 2014,” Tax Foundation (Sept. 16, 2014).
Errecart, Joyce, Ed Gerrish, and Scott Drenkard. “States Moving Away from Taxes on Tangible Personal Property,” Tax Foundation (Oct. 4, 2012).
Fetting, David. “Thomas J. Holmes on Walmart’s Location Strategy,” Fedgazette (March 1, 2006).
Fisher, Peter. Grading Places: What do the Business Climate Rankings Really Tell Us? (Washington, D.C.: Economic Policy Institute, June 2005).
Fisher, Peter. Grading Places: What Do the Business Climate Rankings Really Tell Us? Second Edition (Washington, D.C.: Good Jobs First, May 2013).
Fleenor, Patrick. “How Excise Tax Differentials Affect Interstate Smuggling and Cross-Border Sales of Cigarettes in the United States,” Tax Foundation (Oct. 1, 1998).
Fleenor, Patrick and J. Scott Moody. “A Primer on the Economic Implications of Marginal Tax Rates,” Tax Foundation (Nov. 1, 1999).
Fox, William F. and Matthew N. Murray. “Do Economic Effects Justify the Use of Fiscal Incentives?” Southern Economic Journal 71:78 (July 2004).
Gentry, William H. and R. Glenn Hubbard. “‘Success Taxes,’ Entrepreneurial Entry and Innovation,” NBER Working Paper No. 10551 (June 2004).
Giroud, Xavier, and Joshua Rauh. “State Taxation and the Reallocation of Business Activity: Evidence from Establishment-Level Data,” Journal of Political Economy 127:3 (June 2019).
Goolsbee, Austan (2004). “The impact of the corporate income tax: evidence from state organizational form data,” Journal of Public Economics 88, issue 11 (Sept. 2004): 2283-2299.
Goolsbee, Austan and Edward L. Maydew. “Coveting Thy Neighbor’s Manufacturing: The Dilemma of State Income Apportionment,” Journal of Public Economics 75:1 (January 2000).
Gupta, Sanjya and Mary Ann Hofmann. “The Effect of State Income Tax Apportionment and Tax Incentives on New Capital Expenditures,” Journal of the American Taxation Association 25, Supplement 2003 (May 2003): 1–25.
TAX FOUNDATION | 51R
EFEREN
CES
Harden, J. William and Hoyt, William H. “Do States Choose their Mix of Taxes to Minimize Employment Losses?” National Tax Journal 56 (March 2003): 7–26.
Haughton, Jonathan and Vadym Slobodyanyuk. State Competitiveness Report 2001 (Boston: Beacon Hill Institute, Suffolk University, December 2001).
Helms, L. Jay. “The Effect of State and Local Taxes on Economic Growth: A Time Series – Cross Section Approach,” The Review of Economics and Statistics 67:4 (November 1985): 574-582.
Hodge, Scott A. “Married Couples File Less Than Half of All Tax Returns, But Pay 74 Percent of all Income Taxes,” Tax Foundation (Mar. 25, 2003).
Hodge, Scott A. “Own a Business? You May be Rich: Two-Thirds of Taxpayers Hit by Highest Tax Rate Have Business Income,” Tax Foundation (May 5, 2003).
Hodge, Scott A. and J. Scott Moody. “Wealthy American and Business Activity,” Tax Foundation (Aug. 1, 2004).
Hodge, Scott A. and Andre Dammert. “U.S. Lags while Competitors Accelerate Corporate Income Tax Reform,” Tax Foundation Fiscal Fact No. 184 (Aug. 5, 2009).
Internal Revenue Service. “Individual Income Tax Returns 2013,” Rev. 08-2015.
Kleven, Henrik, Camille Landais, Mathilde Muñoz, and Stefanie Stantcheva. “Taxation and Migration: Evidence and Policy Implications,” National Bureau of Economic Research Working Paper No. 25740 (April 2019).
Kolko, Jed, David Neumark, and Marisol Cuellar Meija. (2013). “What Do Business Climate Indexes Teach Us About State Policy and Economic Growth?” Journal of Regional Science 53:2 (Apr. 28, 2013): 220-255.
Kwall, Jeffrey K. “The Repeal of Graduated Corporate Tax Rates,” Tax Notes (June 27, 2011).
Ladd, Helen F. Local Government Tax and Land Use Policies in the United States: Understanding the Links (Northampton, MA: Edward Elgar Publishing, February 1998).
Ladd, Helen F. (1992). “Mimicking of Local Tax Burdens Among Neighboring Counties,” Public Finance Review 20:4 (Oct. 1, 1992): 450-467.
Mark, Stephen T., Therese J. Mc Quire, and Leslie E. Papke. “The Influence of Taxes on Employment and Population Growth: Evidence from the Washington, D.C. Metropolitan Area,” National Tax Journal 53 (March 2000): 105-123.
McQuire, Therese J. and Michael Wasylenko. “Jobs and Taxes: The Effects of Business Climate on States’ Employment Growth Rates,” National Tax Journal 38 (December 1985): 497–511.
Mikesell, John L. “Gross Receipts Taxes in State Government Finance: A Review of Their History and Performance,” Tax Foundation (Jan. 31, 2007).
Mikesell, John L. “State Retail Taxes in 2012: The Recovery Continues,” State Tax Notes (Dec. 26, 2012).
Miles, Marc A., Edwin J. Feulner, and Mary Anastasia Miles O’Grady. The 2004 Index of Economic Freedom: Establishing the Link Between Economic Freedom and Prosperity, The Heritage Foundation and The Wall Street Journal (January 2004).
Moody, J., and Scott and Wendy P. Warcholik. “How Tax Competition Affects Cross-Border Sales of Beer in the United States,” Tax Foundation (March 2004).
Moon, Matt. (2009). “How Do Americans Feel About Taxes Today? Tax Foundation’s 2009 Survey of U.S. Attitudes on Taxes, Government Spending, and Wealth Distribution,” Tax Foundation (Apr. 8, 2009).
Newman, Robert J. (1983). “Industry Migration and Growth in the South,” The Review of Economics and Statistics 65:1 (February 1983): 76-86.
Newman, Robert and Dennis Sullivan. “Econometric Analysis of Business Tax Impacts on Industrial Location: What do we know and how do we know it?” Journal of Urban Economics 23:2 (March 1988): 215–234.
Oakland, William H. “Econometric Analysis of Business Tax Impacts on Industrial Location: A Survey,” Metropolitan Financing and Growth Management Policies, Committee on Taxation, Resources and Economic Development, University of Wisconsin, Madison (1978): 13–30.
Papke, James A. and Leslie E. Papke. “Measuring Differential State-Local Tax Liabilities and Their Implications for Business Investment Location,” National Tax Journal 39:3 (September 1986): 357–366.
Peters, Alan and Peter Fisher. “The Failure of Economic Development Incentives,” Journal of the American Planning Association 70:27 (2004).
Phillips, Andrew, Caroline Sallee, and Muath Ibaid, “Total State and Local Business Taxes: State-by-State Estimates for Fiscal Year 2017,” Council On State Taxation (COST) with Ernst and Young LLP and the State Tax Research Institute (November 2018).
Poletti, Therese. “Incentive-rich Arizona to House New Intel Plant,” The (San Jose) Mercury News (July 26, 2005).
Pomp, Richard. “Reforming a State Corporate Income Tax,” Albany Law Review 51:3/4 (Spring/Summer 1987).
Plaut, Thomas R. and Joseph E. Pluta. “Business Climate, Taxes and Expenditures, and State Industrial Growth in the United States,” Southern Economic Journal 50:1 (July 1983): 99–119.
Robyn, Mark A. and Gerald T. Prante. “State-Local Tax Burdens Fall in 2009 as Tax Revenues Shrink Faster than Income,” Tax Foundation (Feb. 23, 2011).
Salmon, Pierre. “Decentralisation as an Incentive Scheme,” Oxford Review of Economic Policy 3:2 (1987): 24–43.
Shleifer, Andrei. “A theory of yardstick competition,” Rand Journal of Economics 16:3 (Autumn 1985): 320–328.
Sullivan, Martin. “The States’ Fiscal Mess: How Bad Is It?” Tax Notes, 98:4 (2003): 482-486.
52 | STATE BUSINESS TAX CLIMATE INDEXR
EFER
ENC
ES
Tannenwald, Robert. “State Business Tax Climate: How Should it be Measured and How Important is it?” New England Economic Review, Federal Reserve Bank of Boston (January/February 1996): 23-38.
Tax Foundation. Location Matters: A Comparative Analysis of State Tax Costs on Business (2012).
Tax Foundation. Facts & Figures: How Does Your State Compare? (2015).
Tiebout, Charles. “A Pure Theory of Local Public Expenditures,” Journal of Political Economy 64:5 (1956): 416–424.
Vedder, Richard. “Taxes and Economic Growth,” The Taxpayers Network, Inc. (2001).
Wasylenko, Michael. “Taxation and Economic Development: The State of Economic Literature,” New England Economic Review, Federal Reserve Bank of Boston (March/April 1997): 37–52.
Wasylenko, Michael. “The Location of Firms: The Role of Taxes and Fiscal Incentives,” Urban Affairs Annual Review 20 (1981): 155-189.

DATA
TAB
LESTAX FOUNDATION | 53
Table 8.State Corporate Income Tax Rates (as of July 1, 2019)State Rates Brackets Gross Receipts Tax
Rate (a)Alabama 6.5% > $0 Alaska 0.0% > $0
2.0% > $25,000 3.0% > $49,000 4.0% > $74,000 5.0% > $99,000 6.0% > $124,000 7.0% > $148,000 8.0% > $173,000 9.0% > $198,000 9.4% > $222,000
Arizona 4.9% > $0 Arkansas 1.0% > $0
2.0% > $3,000 3.0% > $6,000 5.0% > $11,000 6.0% > $25,000 6.5% > $100,000
California 8.84% > $0 Colorado 4.63% > $0 Connecticut (b) 8.25% > $0 Delaware 8.7% > $0 0.0945% - 0.7543% (c)Florida 5.5% > $0 Georgia 5.75% > $0 Hawaii 4.4% > $0
5.4% > $25,000 6.4% > $100,000
Idaho 6.925% > $0 Illinois (d) 9.5% > $0 Indiana (e) 5.5% > $0 Iowa 6.0% > $0
8.0% > $25,000 10.0% > $100,000 12.0% > $250,000
Kansas 4.0% > $0 7.0% > $50,000
Kentucky 5.0% > $0 Louisiana 4.0% > $0
5.0% > $25,000 6.0% > $50,000 7.0% > $100,000 8.0% > $200,000
Maine 3.5% > $0 7.93% > $350,000 8.33% > $1,050,000 8.93% > $3,500,000
Maryland 8.25% > $0 Massachusetts 8.0% > $0 Michigan 6.0% > $0 Minnesota 9.8% > $0 Mississippi 3.0% > $0
4.0% > $5,000 5.0% > $10,000
Missouri 6.25% > $0 Montana 6.75% > $0 Nebraska 5.58% > $0
7.81% > $100,000 Nevada (f) None 0.051% - 0.331% (c)New Hampshire 7.9% > $0
New Jersey (g) 6.5% > $0 7.5% > $50,000 9.0% > $100,000
11.5% > $1,000,000 New Mexico 4.8% > $0
5.9% > $500,000 New York 6.5% > $0 North Carolina 2.5% > $0 North Dakota 1.41% > $0
3.55% > $25,000 4.31% > $50,000
Ohio (a) 0.26%Oklahoma 6.0% > $0 Oregon 6.6% > $0
7.6% > $1,000,000 Pennsylvania 9.99% > $0 Rhode Island 7.0% > $0 South Carolina 5.0% > $0 South Dakota NoneTennessee 6.5% > $0 Texas (a) 0.331% - 0.75% (c)Utah 4.95% > $0 Vermont 6.0% > $0
7.0% > $10,000 8.5% > $25,000
Virginia 6.0% > $0 0.02% - 0.58% (c)Washington (a) 0.13% - 3.3% (c)West Virginia 6.5% > $0 Wisconsin 7.9% > $0 Wyoming NoneDistrict of Columbia 8.25% > $0 Note: In addition to regular income taxes, many states impose other taxes on corporations such as gross receipts taxes and franchise taxes. Some states also impose an alternative minimum tax (see Table 12). Some states impose special rates on financial institutions.(a) While many states collect gross receipts taxes from public utilities and other sectors, and some states label their sales tax as a gross receipts tax, we show only those state gross receipts taxes that broadly tax all business as a percentage of gross receipts: the Delaware Manufacturers & Merchants’ License Tax, the Nevada Commerce Tax, the Ohio Commercial Activities Tax, the Texas Margin Tax, the Virginia locally-levied Business/Professional/Occupational License Tax, and the Washington Business & Occupation Tax. Ohio, Texas, and Washington do not have a corporate income tax but do have a gross receipts tax, while Delaware and Virginia have a gross receipts tax in addition to the corporate income tax.(b) Connecticut’s rate includes a 10% surtax that effectively increases the rate from 7.5% to 8.25%. The surtax is required by businesses with at least $100 million annual gross income.(c) Gross receipts tax rates vary by industry in these states. Texas has only two rates: 0.375% on retail and wholesale and 0.75% on all other industries. Virginia’s tax is locally levied and rates vary by business and by jurisdiction. Washington has over 30 different industry classifications and rates, while Nevada has 26.(d) Illinois’ rate includes two separate corporate income taxes, one at a 7% rate and one at a 2.5% rate. (e) Indiana’s rate is scheduled to decrease to 4.9% by 2022.(f) Nevada also levies a payroll tax, the Modified Business Tax, which is reflected in the individual income tax component of the Index.(g) In New Jersey, the rates indicated apply to a corporation’s entire net income rather than just income over the threshold. A temporary surcharge is in effect bringing the rate to 11.5% for businesses with income above $1 million. In 2020, the surtax will bring the rate to 10.5%.Source: Tax Foundation; state tax statutes, forms, and instructions; Bloomberg Tax.
Table 8, Continued.State Corporate Income Tax Rates (as of July 1, 2019)State Rates Brackets Gross Receipts Tax
Rate (a)
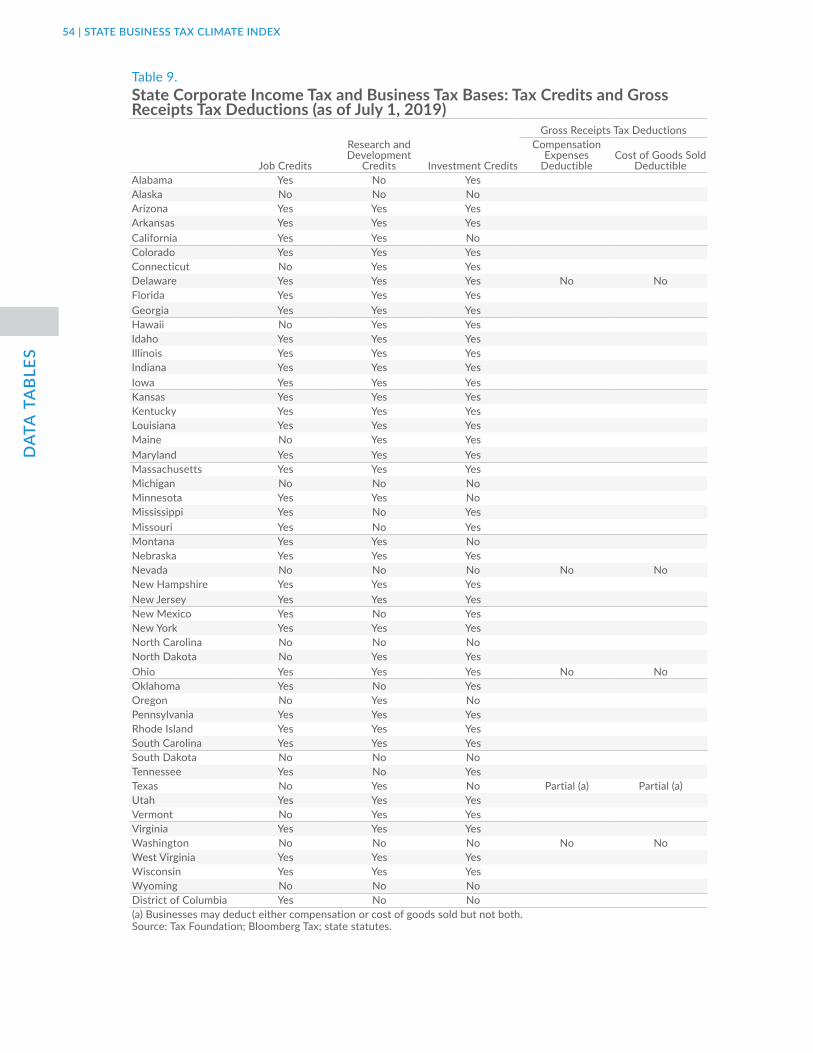
DAT
A T
AB
LES
54 | STATE BUSINESS TAX CLIMATE INDEX
Table 9.State Corporate Income Tax and Business Tax Bases: Tax Credits and Gross Receipts Tax Deductions (as of July 1, 2019)
Job Credits
Research and Development
Credits Investment Credits
Gross Receipts Tax DeductionsCompensation
Expenses Deductible
Cost of Goods Sold Deductible
Alabama Yes No YesAlaska No No NoArizona Yes Yes YesArkansas Yes Yes YesCalifornia Yes Yes NoColorado Yes Yes YesConnecticut No Yes YesDelaware Yes Yes Yes No NoFlorida Yes Yes YesGeorgia Yes Yes YesHawaii No Yes YesIdaho Yes Yes YesIllinois Yes Yes YesIndiana Yes Yes YesIowa Yes Yes YesKansas Yes Yes YesKentucky Yes Yes YesLouisiana Yes Yes YesMaine No Yes YesMaryland Yes Yes YesMassachusetts Yes Yes YesMichigan No No NoMinnesota Yes Yes NoMississippi Yes No YesMissouri Yes No YesMontana Yes Yes NoNebraska Yes Yes YesNevada No No No No NoNew Hampshire Yes Yes YesNew Jersey Yes Yes YesNew Mexico Yes No YesNew York Yes Yes YesNorth Carolina No No NoNorth Dakota No Yes YesOhio Yes Yes Yes No NoOklahoma Yes No YesOregon No Yes NoPennsylvania Yes Yes YesRhode Island Yes Yes YesSouth Carolina Yes Yes YesSouth Dakota No No NoTennessee Yes No YesTexas No Yes No Partial (a) Partial (a)Utah Yes Yes YesVermont No Yes YesVirginia Yes Yes YesWashington No No No No NoWest Virginia Yes Yes YesWisconsin Yes Yes YesWyoming No No NoDistrict of Columbia Yes No No(a) Businesses may deduct either compensation or cost of goods sold but not both.Source: Tax Foundation; Bloomberg Tax; state statutes.
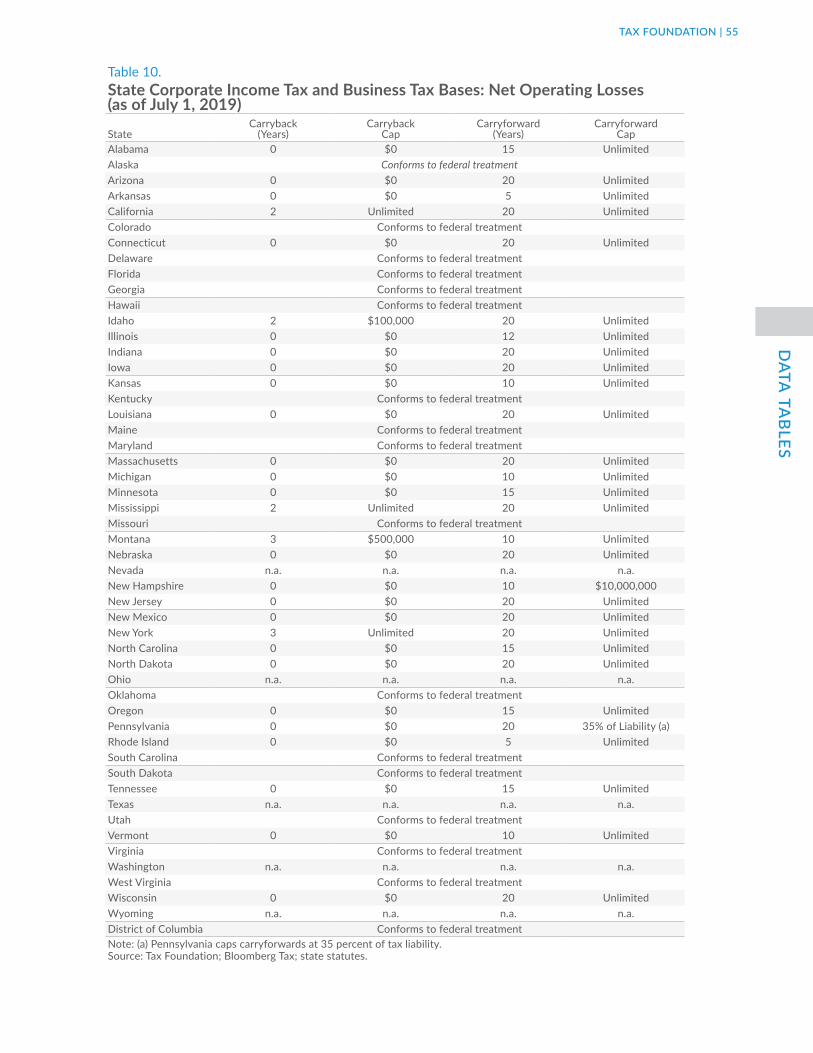
DATA
TAB
LESTAX FOUNDATION | 55
Table 10.State Corporate Income Tax and Business Tax Bases: Net Operating Losses (as of July 1, 2019)
StateCarryback
(Years)Carryback
CapCarryforward
(Years)Carryforward
CapAlabama 0 $0 15 UnlimitedAlaska Conforms to federal treatmentArizona 0 $0 20 UnlimitedArkansas 0 $0 5 UnlimitedCalifornia 2 Unlimited 20 UnlimitedColorado Conforms to federal treatmentConnecticut 0 $0 20 UnlimitedDelaware Conforms to federal treatmentFlorida Conforms to federal treatmentGeorgia Conforms to federal treatmentHawaii Conforms to federal treatmentIdaho 2 $100,000 20 UnlimitedIllinois 0 $0 12 UnlimitedIndiana 0 $0 20 UnlimitedIowa 0 $0 20 UnlimitedKansas 0 $0 10 UnlimitedKentucky Conforms to federal treatmentLouisiana 0 $0 20 UnlimitedMaine Conforms to federal treatmentMaryland Conforms to federal treatmentMassachusetts 0 $0 20 UnlimitedMichigan 0 $0 10 UnlimitedMinnesota 0 $0 15 UnlimitedMississippi 2 Unlimited 20 UnlimitedMissouri Conforms to federal treatmentMontana 3 $500,000 10 UnlimitedNebraska 0 $0 20 UnlimitedNevada n.a. n.a. n.a. n.a.New Hampshire 0 $0 10 $10,000,000New Jersey 0 $0 20 UnlimitedNew Mexico 0 $0 20 UnlimitedNew York 3 Unlimited 20 UnlimitedNorth Carolina 0 $0 15 UnlimitedNorth Dakota 0 $0 20 UnlimitedOhio n.a. n.a. n.a. n.a.Oklahoma Conforms to federal treatmentOregon 0 $0 15 UnlimitedPennsylvania 0 $0 20 35% of Liability (a)Rhode Island 0 $0 5 UnlimitedSouth Carolina Conforms to federal treatmentSouth Dakota Conforms to federal treatmentTennessee 0 $0 15 UnlimitedTexas n.a. n.a. n.a. n.a.Utah Conforms to federal treatmentVermont 0 $0 10 UnlimitedVirginia Conforms to federal treatmentWashington n.a. n.a. n.a. n.a.West Virginia Conforms to federal treatmentWisconsin 0 $0 20 UnlimitedWyoming n.a. n.a. n.a. n.a.District of Columbia Conforms to federal treatmentNote: (a) Pennsylvania caps carryforwards at 35 percent of tax liability.Source: Tax Foundation; Bloomberg Tax; state statutes.

DAT
A T
AB
LES
56 | STATE BUSINESS TAX CLIMATE INDEX
Table 11.State Corporate Income Tax and Business Tax Bases: Treatment of Capital Investment (as of July 1, 2019)
Section 168(k) ExpensingConforms to Section 163(j)
Limitation GILTI InclusionAlabama 100% Yes Mostly ExcludedAlaska 100% Yes Decouples/95% ExclusionArizona 0% Yes Decouples/95% ExclusionArkansas 0% No Decouples/95% ExclusionCalifornia 0% No Decouples/95% ExclusionColorado 100% Yes Mostly ExcludedConnecticut 0% No Decouples/95% ExclusionDelaware 100% Yes Mostly ExcludedFlorida 0% Yes Decouples/95% ExclusionGeorgia 0% No Decouples/95% ExclusionHawaii 0% Yes Decouples/95% ExclusionIdaho 0% Yes Mostly ExcludedIllinois 100% Yes Decouples/95% ExclusionIndiana 0% No Decouples/95% ExclusionIowa 0% Yes Mostly ExcludedKansas 100% Yes Mostly ExcludedKentucky 0% Yes Decouples/95% ExclusionLouisiana 100% Yes Mostly ExcludedMaine 0% Yes Taxes 50% or more of GILTIMaryland 0% Yes Taxes 50% or more of GILTIMassachusetts 0% Yes Decouples/95% ExclusionMichigan 0% Yes Decouples/95% ExclusionMinnesota 20% Yes Decouples/95% ExclusionMississippi 0% No Decouples/95% ExclusionMissouri 100% Yes Decouples/95% ExclusionMontana 100% Yes Mostly ExcludedNebraska 100% Yes Mostly ExcludedNevada n.a. n.a. n.a.New Hampshire 0% No Decouples/95% ExclusionNew Jersey 0% Yes Taxes 50% or more of GILTINew Mexico 100% Yes Decouples/95% ExclusionNew York 0% Yes Decouples/95% ExclusionNorth Carolina 15% Yes Decouples/95% ExclusionNorth Dakota 100% Yes Mostly ExcludedOhio n.a. n.a. n.a.Oklahoma 100% Yes Decouples/95% ExclusionOregon 100% Yes Mostly ExcludedPennsylvania 0% Yes Decouples/95% ExclusionRhode Island 0% Yes Mostly ExcludedSouth Carolina 0% No Decouples/95% ExclusionSouth Dakota n.a. n.a. n.a.Tennessee 0% Yes Decouples/95% ExclusionTexas n.a. n.a. n.a.Utah 100% Yes Taxes 50% or more of GILTIVermont 0% Yes Taxes 50% or more of GILTIVirginia 0% Yes Decouples/95% ExclusionWashington n.a. n.a. n.a.West Virginia 100% Yes Mostly ExcludedWisconsin 0% No Decouples/95% ExclusionWyoming n.a. n.a. n.a.District of Columbia 0% No Mostly ExcludedNote: “Mostly Excluded” means GILTI may apply or that the deduction is less than 95%.Source: Tax Foundation; Bloomberg Tax; state statutes.

DATA
TAB
LESTAX FOUNDATION | 57
Table 12.State Corporate Income Tax and Business Tax Bases: Other Variables (as of July 1, 2019)
Federal Income Used as State
Tax Base
Allows Federal ACRS
or MACRS Depreciation
Allows Federal
DepletionThrowback
Rule
Foreign Tax
DeductibilityCorporate
AMT
Brackets Indexed for
InflationAlabama Yes Yes Yes Yes Yes No Flat CITAlaska Yes Yes Partial Yes No No NoArizona Yes Yes Yes No No No Flat CITArkansas No Yes Yes Yes Yes No NoCalifornia Yes No Partial Yes No Yes Flat CITColorado Yes Yes Yes Yes No No Flat CITConnecticut Yes Yes Yes No Yes No NoDelaware Yes Yes Partial No No No Flat CITFlorida Yes Yes Yes No Yes Yes Flat CITGeorgia Yes Yes Yes No No No Flat CITHawaii Yes Yes Yes Yes Yes No NoIdaho Yes Yes Yes Yes Yes No Flat CITIllinois Yes Yes Yes Yes Yes No Flat CITIndiana Yes Yes Yes No Yes No Flat CITIowa Yes Yes Partial No Yes Yes NoKansas Yes Yes Yes Yes No No NoKentucky Yes Yes Yes No No Yes Flat CITLouisiana Yes Yes Partial Yes Yes No NoMaine Yes Yes Yes Yes Yes No NoMaryland Yes Yes Partial No Yes No Flat CITMassachusetts Yes Yes Yes Yes No No Flat CITMichigan Yes Yes Yes No No No Flat CITMinnesota Yes Yes Partial No No Yes Flat CITMississippi No Yes Partial Yes No No NoMissouri Yes Yes Yes Yes Yes No Flat CITMontana Yes Yes Yes Yes No No Flat CITNebraska Yes Yes Yes No Yes No NoNevada Yes Yes Yes No Yes No GRTNew Hampshire Yes Yes Partial Yes No Yes Flat CITNew Jersey Yes Yes Yes No No No NoNew Mexico Yes Yes Yes Yes Yes No NoNew York Yes Yes Yes No Yes No Flat CITNorth Carolina Yes Yes Partial No No No Flat CITNorth Dakota Yes Yes Yes Yes No No NoOhio Yes Yes Yes No Yes No GRTOklahoma Yes Yes Partial Yes No No Flat CITOregon Yes Yes Partial Yes No No NoPennsylvania Yes Yes Yes No No No Flat CITRhode Island Yes Yes Yes Yes Yes No Flat CITSouth Carolina Yes Yes Yes No No No Flat CITSouth Dakota n.a. n.a. n.a. n.a. n.a. n.a. n.a.Tennessee Yes Yes Partial No Yes No Flat CITTexas Partial Yes Yes No Yes No GRTUtah Yes Yes Yes Yes No No Flat CITVermont Yes Yes Yes Yes Yes No NoVirginia Yes Yes Yes No No No Flat CITWashington Yes Yes Yes No Yes No GRTWest Virginia Yes Yes Yes Yes No No Flat CITWisconsin Yes Yes Yes Yes No No Flat CITWyoming n.a. n.a. n.a. n.a. n.a. n.a. n.a.District of Columbia Yes Yes Yes Yes Partial No Flat CITSource: Tax Foundation; Bloomberg Tax; state statutes.

DAT
A T
AB
LES
58 | STATE BUSINESS TAX CLIMATE INDEX
Table 13.State Individual Income Tax Rates (as of July 1, 2019)
State Rates Brackets (a) Standard Deduction Personal Exemption Average Local
Income Tax Rates (c)Single Per Filer (b) Per DependentAlabama 2.0% > $0 $2,500 $1,500 $1,000 (d) 0.50%
4.0% > $500 5.0% > $3,000
Alaska No Income Tax NoneArizona 2.59% > $0 $5,183 $2,200 $2,300 None
3.34% > $26,500 4.17% > $53,000 4.50% > $159,000 4.54% > $155,159
Arkansas (e, f) 0.9% > $0 $2,200 $118 (g) $367 (g) None2.5% > $4,5003.5% > $8,9004.5% > $13,4006.0% > $22,2006.9% > $37,200
California (e) 1.0% > $0 $4,401 $118 (g) $367 (g) None2.0% > $8,5444.0% > $20,2556.0% > $31,9698.0% > $44,3779.3% > $56,085
10.3% > $286,49211.3% > $343,78812.3% > $572,98013.3% > $1,000,000
Colorado 4.63% of federal income n.a. n.a. n.a. NoneConnecticut (f) 3.0% > $0 n.a. $15,000 (d) $0 None
5.0% > $10,000 5.50% > $50,000
6.0% > $100,000 6.50% > $200,000 6.90% > $250,000 6.99% > $500,000
Delaware 2.20% > $2,000 $3,250 $110 (g) $110 (g) 0.625%3.90% > $5,000 4.80% > $10,000 5.20% > $20,000 5.55% > $25,000 6.60% > $60,000
Florida No Income Tax NoneGeorgia 1.0% > $0 $4,600 $2,700 $3,000 None
2.0% > $750 3.0% > $2,250 4.0% > $3,750 5.0% > $5,250
5.75% > $7,000 Hawaii 1.40% > $0 $2,200 $1,144 (d) $1,144 None
3.20% > $2,4005.50% > $4,8006.40% > $9,6006.80% > $14,4007.20% > $19,2007.60% > $24,0007.90% > $36,0008.25% > $48,0009.00% > $150,000
10.00% > $175,00011.00% > $200,000

DATA
TAB
LESTAX FOUNDATION | 59
Idaho (e) 1.125% > $0 $12,200 (j) n.a. n.a. None3.125% > $1,5413.625% > $3,0814.625% > $4,6225.625% > $6,1626.625% > $7,7036.925% > $11,554
Illinois (h) 4.95% of federal adjusted gross income
with modification
$0 $2,175 $2,175 None
Indiana 3.23% of federal adjusted gross income
with modification
$0 $1,000 $1,500 2.02%
Iowa (e) 0.33% > $0 $2,080 $40 (g) $40 (g) 0.213%0.67% > $1,6382.25% > $3,2764.14% > $6,5525.63% > $14,7425.96% > $24,5706.25% > $32,7607.44% > $49,1408.53% > $73,710
Kansas 3.10% > $2,500 $3,000 $2,250 $2,250 None5.25% > $15,000 5.70% > $30,000
Kentucky 5.0% > $0 $2,590 n.a. n.a. 2.075%Louisiana 2.0% > $0 n.a. $4,500 (i) $1,000 None
4.0% > $12,500 6.0% > $50,000
Maine (e) 5.80% > $0 $12,200 $4,200 $300 (g) None6.75% > $21,8507.15% > $51,700
Maryland 2.0% > $0 $2,300 $3,200 (d) $0 2.85%3.0% > $1,000 4.0% > $2,000
4.75% > $3,000 5.0% > $100,000
5.25% > $125,000 5.50% > $150,000 5.75% > $250,000
Massachusetts 5.05% > $0 n.a. $4,400 $1,000 NoneMichigan 4.25% of federal
adjusted gross income with modification
$0 $4,000 n.a. 1.70%
Minnesota (e) 5.35% > $0 $12,000 (j) n.a. n.a. None7.05% > $26,520 7.85% > $87,110 9.85% > $161,720
Mississippi 3.0% > $0 $2,300 $6,000 $1,500 None4.0% > $5,000 5.0% > $10,000
Missouri 1.5% > $103 $12,200 (j) n.a. n.a. 0.50%2.0% > $1,0532.5% > $2,1063.0% > $3,1593.5% > $4,2124.0% > $5,2654.5% > $6,3185.0% > $7,3715.4% > $8,424
Table 13, Continued.State Individual Income Tax Rates (as of July 1, 2019)
State Rates Brackets (a) Standard Deduction Personal Exemption Average Local
Income Tax Rates (c)Single Per Filer (b) Per Dependent
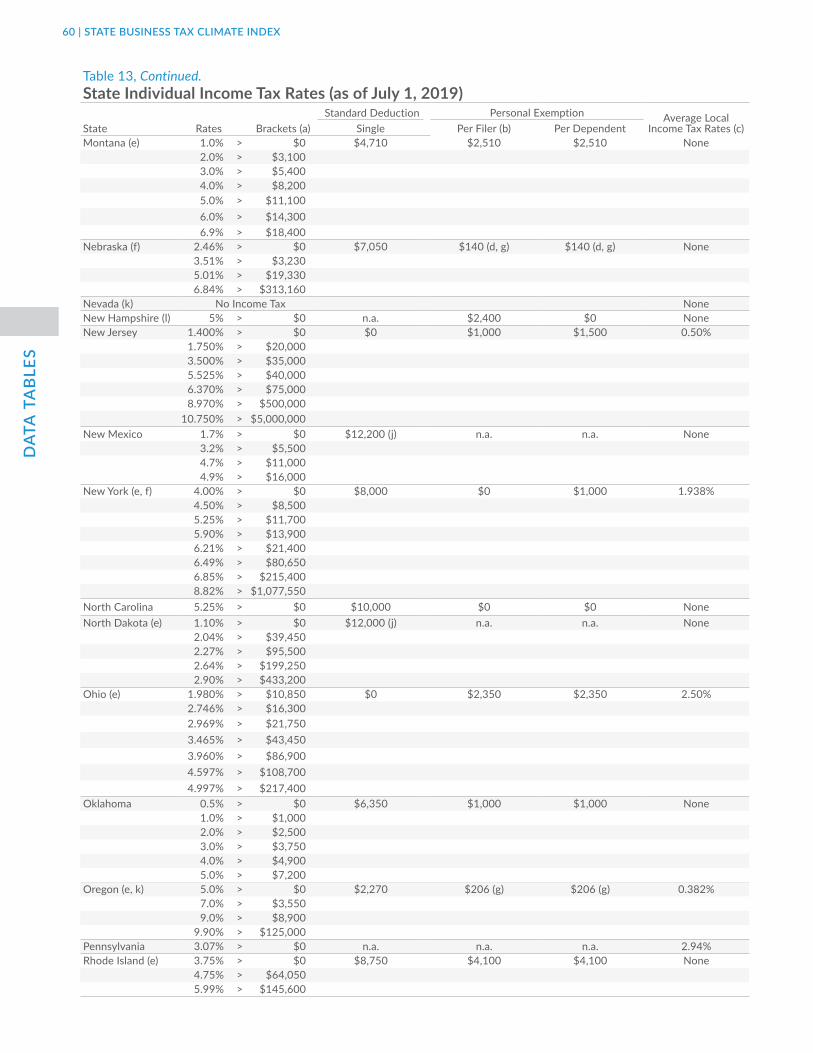
DAT
A T
AB
LES
60 | STATE BUSINESS TAX CLIMATE INDEX
Table 13, Continued.State Individual Income Tax Rates (as of July 1, 2019)
State Rates Brackets (a) Standard Deduction Personal Exemption Average Local
Income Tax Rates (c)Single Per Filer (b) Per DependentMontana (e) 1.0% > $0 $4,710 $2,510 $2,510 None
2.0% > $3,1003.0% > $5,4004.0% > $8,2005.0% > $11,1006.0% > $14,3006.9% > $18,400
Nebraska (f) 2.46% > $0 $7,050 $140 (d, g) $140 (d, g) None3.51% > $3,2305.01% > $19,3306.84% > $313,160
Nevada (k) No Income Tax NoneNew Hampshire (l) 5% > $0 n.a. $2,400 $0 NoneNew Jersey 1.400% > $0 $0 $1,000 $1,500 0.50%
1.750% > $20,000 3.500% > $35,000 5.525% > $40,000 6.370% > $75,000 8.970% > $500,000
10.750% > $5,000,000 New Mexico 1.7% > $0 $12,200 (j) n.a. n.a. None
3.2% > $5,500 4.7% > $11,000 4.9% > $16,000
New York (e, f) 4.00% > $0 $8,000 $0 $1,000 1.938%4.50% > $8,5005.25% > $11,7005.90% > $13,9006.21% > $21,4006.49% > $80,6506.85% > $215,4008.82% > $1,077,550
North Carolina 5.25% > $0 $10,000 $0 $0 NoneNorth Dakota (e) 1.10% > $0 $12,000 (j) n.a. n.a. None
2.04% > $39,450 2.27% > $95,500 2.64% > $199,250 2.90% > $433,200
Ohio (e) 1.980% > $10,850 $0 $2,350 $2,350 2.50%2.746% > $16,3002.969% > $21,7503.465% > $43,4503.960% > $86,9004.597% > $108,7004.997% > $217,400
Oklahoma 0.5% > $0 $6,350 $1,000 $1,000 None1.0% > $1,000 2.0% > $2,500 3.0% > $3,750 4.0% > $4,900 5.0% > $7,200
Oregon (e, k) 5.0% > $0 $2,270 $206 (g) $206 (g) 0.382%7.0% > $3,5509.0% > $8,900
9.90% > $125,000Pennsylvania 3.07% > $0 n.a. n.a. n.a. 2.94%Rhode Island (e) 3.75% > $0 $8,750 $4,100 $4,100 None
4.75% > $64,0505.99% > $145,600

DATA
TAB
LESTAX FOUNDATION | 61
South Carolina (e) 0.0% > $0 $6,350 $4,050 $4,050 None3.0% > $3,030 4.0% > $6,060 5.0% > $9,090 6.0% > $12,120 7.0% > $15,160
South Dakota No Income Tax NoneTennessee (l) 2% > $0 $0 $1,250 $0 NoneTexas No Income Tax NoneUtah 4.95% > $0 (m) (m) (m) NoneVermont (e) 3.35% > $0 $6,000 $4,150 $4,150 None
6.60% > $39,600 7.60% > $96,000 8.75% > $200,200
Virginia 2.0% > $0 $3,000 $930 $930 None3.0% > $3,000 5.0% > $5,000
5.75% > $17,000 Washington No Income Tax NoneWest Virginia 3.0% > $0 $0 $2,000 $2,000 None
4.0% > $10,000 4.50% > $25,000
6.0% > $40,000 6.50% > $60,000
Wisconsin (e) 4.00% > $0 $10,380 (d) $700 $700 None5.84% > $11,760 6.27% > $23,520 7.65% > $258,950
Wyoming No Income Tax NoneDistrict of Columbia 4.0% > $0 $12,200 n.a. n.a. None
6.0% > $10,000 6.50% > $40,000 8.50% > $60,000 8.75% > $350,000 8.95% > $1,000,000
(a) Brackets are for single taxpayers. Some states double bracket widths for joint filers (AL, AZ, CT, HI, ID, KS, LA, ME, NE, OR). New York doubles all except the top two brackets. Some states increase but do not double brackets for joint filers (CA, GA, MN, NM, NC, ND, OK, RI, VT, WI). Maryland decreases some and increases others. New Jersey adds a 2.45% rate and doubles some bracket widths. Consult the Tax Foundation website for tables for joint filers. (b) Married joint filers generally receive double the single exemption. (c) The average local income tax rate is calculated by taking the mean of the income tax rate in the most populous city and the capital city. (d) Subject to phaseout for higher-income taxpayers. (e) Bracket levels are adjusted for inflation each year.(f) Arkansas, Connecticut, Nebraska, and New York have an income “recapture” provision whereby the benefit of lower tax brackets is removed for the top bracket. See the individual income tax section for details. (g) Tax credit. (h) Illinois imposes an additional 1.5% tax on pass-through businesses, bringing the combined rate to 6.45%.(i) The standard deduction and personal exemptions are combined: $4,500 for single and married filing separately; $9,000 married filing jointly. (j) These states adopt the same standard deductions or (now zeroed-out) personal exemptions as the federal government. In some cases, the link is implicit in the fact that the state tax calculations begin with federal taxable income. (k) Nevada imposes a payroll tax of 1.45%, which is included in the Index as a tax on wage income only. Oregon imposes a payroll tax of 0.1% in addition to its income tax; this is also reflected in Index calculations.(l) Tax applies to interest and dividend income only. (m) Utah’s standard deduction and personal exemption are combined into a single credit equal to 6% of the taxpayer’s federal standard deduction (or itemized deductions) plus three-fourths of the taxpayer’s federal exemptions. This credit is phased out for higher-income taxpayers.
Source: Tax Foundation; state tax forms and instructions; state statutes.
Table 13, Continued.State Individual Income Tax Rates (as of July 1, 2019)
State Rates Brackets (a) Standard Deduction Personal Exemption Average Local
Income Tax Rates (c)Single Per Filer (b) Per Dependent

DAT
A T
AB
LES
62 | STATE BUSINESS TAX CLIMATE INDEX
Table 14.State Individual Income Tax Bases: Marriage Penalty, Capital Income, and Indexation (as of July 1, 2019)
Marriage Penalty
Capital Income Taxed Indexed for Inflation
Interest Dividends Capital Gains Tax BracketsStandard
DeductionPersonal
ExemptionAlabama No Yes Yes Yes No No NoAlaska n.a. n.a. n.a. n.a. n.a. n.a. n.a.Arizona No Yes Yes Yes Yes Yes YesArkansas Yes Yes Yes Yes Yes No YesCalifornia Yes Yes Yes Yes Partial Yes YesColorado No Yes Yes Yes Yes Yes YesConnecticut No Yes Yes Yes No Yes NoDelaware Yes Yes Yes Yes No No NoFlorida n.a. n.a. n.a. n.a. n.a. n.a. n.a.Georgia Yes Yes Yes Yes No No NoHawaii No Yes Yes Yes No No NoIdaho No Yes Yes Yes Yes Yes YesIllinois No Yes Yes Yes Yes Yes YesIndiana No Yes Yes Yes Yes Yes NoIowa Yes Yes Yes Yes Yes Yes NoKansas No Yes Yes Yes No No NoKentucky No Yes Yes Yes Yes Yes YesLouisiana No Yes Yes Yes No No NoMaine No Yes Yes Yes Yes Yes YesMaryland Yes Yes Yes Yes No Yes NoMassachusetts No Yes Yes Yes Yes Yes NoMichigan No Yes Yes Yes Yes Yes YesMinnesota Yes Yes Yes Yes Yes Yes YesMississippi Yes Yes Yes Yes No No NoMissouri Yes Yes Yes Yes Yes Yes YesMontana Yes Yes Yes Yes Yes Yes YesNebraska No Yes Yes Yes Yes Yes YesNevada n.a. n.a. n.a. n.a. n.a. n.a. n.a.New Hampshire No Yes Yes No Yes Yes NoNew Jersey Yes Yes Yes Yes No Yes NoNew Mexico Yes Yes Yes Yes No Yes YesNew York Yes Yes Yes Yes No No NoNorth Carolina No Yes Yes Yes Yes No YesNorth Dakota Yes Yes Yes Yes Yes Yes YesOhio Yes Yes Yes Yes Yes Yes YesOklahoma Yes Yes Yes Yes No No NoOregon No Yes Yes Yes Partial Yes YesPennsylvania No Yes Yes Yes Yes Yes YesRhode Island Yes Yes Yes Yes Yes Yes YesSouth Carolina Yes Yes Yes Yes Yes Yes YesSouth Dakota n.a. n.a. n.a. n.a. n.a. n.a. n.a.Tennessee No Yes Yes No Yes Yes NoTexas n.a. n.a. n.a. n.a. n.a. n.a. n.a.Utah No Yes Yes Yes Yes Yes YesVermont Yes Yes Yes Yes Yes Yes YesVirginia Yes Yes Yes Yes No No NoWashington n.a. n.a. n.a. n.a. n.a. n.a. n.a.West Virginia Yes Yes Yes Yes No Yes NoWisconsin Yes Yes Yes Yes Yes Yes NoWyoming n.a. n.a. n.a. n.a. n.a. n.a. n.a.District of Columbia Yes Yes Yes Yes No Yes YesSource: Tax Foundation; Bloomberg Tax; state statutes.

DATA
TAB
LESTAX FOUNDATION | 63
Table 15.State Individual Income Tax Bases: Other Variables (as of July 1, 2019)
State
Federal Income Used as
State Tax Base
Credits for Taxes Paid to Other States AMT Levied
Recognition of LLC Status
Recognition of S-Corp Status
Section 179 Expensing Limit
Alabama No Yes No Yes Yes $1,000,000Alaska Yes Yes No Yes Yes $1,000,000Arizona Yes Yes No Yes Yes $1,000,000Arkansas No Yes No Yes Partial $25,000California Yes Yes Yes Yes Yes $25,000Colorado Yes Yes Yes Yes Yes $1,000,000Connecticut Yes Yes Yes Yes Yes $200,000Delaware Yes Yes No No No $1,000,000Florida n.a. n.a. n.a. Yes Yes $1,000,000Georgia Yes Yes No Yes Yes $1,000,000Hawaii Yes Yes No Yes Yes $25,000Idaho Yes Yes No Yes Yes $1,000,000Illinois Yes Yes No Yes Yes $1,000,000Indiana Yes Yes No Yes Yes $25,000Iowa Yes Yes Yes Yes Yes $100,000Kansas Yes Yes No Yes Yes $1,000,000Kentucky Yes Yes No Yes Yes $25,000Louisiana Yes Yes No Yes No $1,000,000Maine Yes Yes No Yes Yes $1,000,000Maryland Yes Yes No Yes Yes $25,000Massachusetts Yes Yes No Yes Yes $1,000,000Michigan Yes Yes No Yes Yes $1,000,000Minnesota Yes Yes Yes Yes Yes $25,000Mississippi No Yes No Yes Yes $1,000,000Missouri Yes Yes No Yes Yes $1,000,000Montana Yes Yes No Yes Yes $1,000,000Nebraska Yes Yes No Yes Yes $1,000,000Nevada n.a. n.a. n.a. Yes Yes $1,000,000New Hampshire Yes No No No No $1,000,000New Jersey No Yes No Yes Partial $25,000New Mexico Yes Yes No Yes Yes $1,000,000New York Yes Yes No Yes Partial $1,000,000North Carolina Yes Yes No Yes Yes $25,000North Dakota Yes Yes No Yes Yes $1,000,000Ohio Yes Yes No No No $1,000,000Oklahoma Yes Yes No Yes Yes $1,000,000Oregon Yes Yes No Yes Yes $1,000,000Pennsylvania No Yes No Yes Yes $25,000Rhode Island Yes Yes No Yes Yes $1,000,000South Carolina Yes Yes No Yes Yes $1,000,000South Dakota n.a. n.a. n.a. n.a. n.a. n.a.Tennessee Yes Yes No Yes No $1,000,000Texas n.a. n.a. n.a. No No $1,000,000Utah Yes Yes No Yes Yes $1,000,000Vermont Yes Yes No Yes Yes $1,000,000Virginia Yes Yes No Yes Yes $1,000,000Washington n.a. n.a. n.a. No No $1,000,000West Virginia Yes Yes No Yes Yes $1,000,000Wisconsin Yes Yes No Yes Yes $1,000,000Wyoming n.a. n.a. n.a. n.a. n.a. n.a.District of Columbia Yes Yes No Yes No $25,000Source: Tax Foundation; Bloomberg Tax; state statutes.

DAT
A T
AB
LES
64 | STATE BUSINESS TAX CLIMATE INDEX
Table 16.State Sales and Excise Tax Rates (as of July 1, 2019)
=Sales Taxes Excise Taxes
State Sales Tax Rate
Average Local Rate
Gasoline (cents per gallon) (e)
Diesel (cents per gallon) (e)
Cigarettes (dollars per pack of 20)
Beer (dollars per
gallon)
Spirits (dollars per gallon) (g)
Alabama 4.00% 5.16% 21.21 22.15 $0.68 $1.05 (f) $18.27 (h)Alaska n.a. 1.76% 14.34 14.31 $2.00 $1.07 $12.80Arizona 5.60% 2.79% 19.00 27.00 $2.00 $0.16 $3.00Arkansas 6.50% 2.97% 21.80 22.80 $1.15 $0.34 $7.73California (a) 7.25% 1.41% 55.18 85.83 $2.87 $0.20 $3.30Colorado 2.90% 4.73% 22.00 20.50 $0.84 $0.08 $2.28Connecticut 6.35% n.a. 36.85 43.90 $4.35 $0.23 $5.40Delaware n.a. n.a. 23.00 22.00 $2.10 $0.26 $4.50Florida 6.00% 1.05% 41.99 34.97 $1.34 $0.48 $6.50Georgia 4.00% 3.33% 35.28 40.07 $0.37 $1.01 (f) $3.79Hawaii (b) 4.00% 0.41% 46.76 49.25 $3.20 $0.93 $5.98Idaho 6.00% 0.03% 36.87 33.00 $0.57 $0.15 $10.95 (h)Illinois 6.25% 2.53% 36.87 39.02 $1.98 $0.23 $8.55Indiana 7.00% n.a. 42.90 49.00 $1.00 $0.12 $2.68Iowa 6.00% 0.82% 30.70 32.50 $1.36 $0.19 $13.07 (h)Kansas 6.50% 2.17% 24.03 26.03 $1.29 $0.18 $2.50Kentucky 6.00% n.a. 26.00 23.00 $1.10 $0.87 $8.04Louisiana 4.45% 5.00% 20.01 20.01 $1.08 $0.40 $3.03Maine 5.50% n.a. 30.01 31.21 $2.00 $0.35 $5.83 (h)Maryland 6.00% n.a. 35.30 36.05 $2.00 $0.54 $5.02Massachusetts 6.25% n.a. 26.54 26.54 $3.51 $0.11 $4.05Michigan 6.00% n.a. 42.86 44.20 $2.00 $0.20 $11.99 (h)Minnesota 6.88% 0.56% 28.60 28.60 $3.04 $0.49 $8.96Mississippi 7.00% 0.07% 18.79 18.40 $0.68 $0.43 $8.15Missouri 4.225% 3.93% 17.35 17.35 $0.17 $0.06 $2.00Montana (c) n.a. n.a. 32.25 30.00 $1.70 $0.14 $9.78Nebraska 5.50% 1.38% 30.50 29.90 $0.64 $0.31 $3.75Nevada 6.85% 1.29% 33.78 28.56 $1.80 $0.16 $3.60New Hampshire n.a. n.a. 23.83 23.83 $1.78 $0.30 $0.00 (h)New Jersey (d) 6.625% -0.03% 41.40 48.50 $2.70 $0.12 $5.50New Mexico (b) 5.125% 2.69% 18.88 22.88 $1.66 $0.41 $6.06New York 4.00% 4.49% 45.35 45.32 $4.35 $0.14 $6.44North Carolina 4.75% 2.22% 36.45 36.45 $0.45 $0.62 $14.63 (h)North Dakota (b) 5.00% 1.85% 23.00 23.00 $0.44 $0.42 $4.92Ohio 5.75% 1.42% 28.01 28.01 $1.60 $0.18 $9.87 (h)Oklahoma 4.50% 4.44% 20.00 20.00 $2.03 $0.40 $5.56Oregon n.a. n.a. 36.77 36.01 $1.33 $0.08 $21.98 (h)Pennsylvania 6.00% 0.34% 58.70 75.20 $2.60 $0.08 $7.24 (h)Rhode Island 7.00% n.a. 34.00 34.00 $4.25 $0.12 $5.40South Carolina 6.00% 1.46% 20.75 20.75 $0.57 $0.77 $5.42South Dakota (b) 4.50% 1.90% 30.00 30.00 $1.53 $0.27 $4.67Tennessee 7.00% 2.47% 26.40 25.40 $0.62 $1.29 $4.46Texas 6.25% 1.94% 20.00 20.00 $1.41 $0.20 $2.40Utah (a) 6.10% 1.07% 30.01 30.01 $1.70 $0.41 $15.38 (h)Vermont 6.00% 0.22% 30.46 32.00 $3.08 $0.27 $7.72 (h)Virginia (a) 5.30% 0.35% 20.66 24.71 $0.30 $0.26 $19.93 (h)Washington 6.50% 2.71% 49.40 49.40 $3.03 $0.26 $32.52West Virginia 6.00% 0.40% 35.70 35.70 $1.20 $0.18 $7.67 (h)Wisconsin 5.00% 0.44% 32.90 32.90 $2.52 $0.06 $3.25Wyoming 4.00% 1.32% 24.00 24.00 $0.60 $0.02 $0.00 (h)District of Columbia 6.00% n.a. 23.50 23.50 $4.50 $0.71 $6.19(a) Some state sales taxes include a local component collected uniformly across the state: California (1.25%), Utah (1.25%), and Virginia (1%). We include these in their state sales tax rates.(b) Sales tax rates in Hawaii, New Mexico, North Dakota, and South Dakota are not strictly comparable to other states due to broad bases that include many services.(c) Special taxes in Montana’s resort areas are not included in our analysis.(d) Some counties in New Jersey are not subject to statewide sales tax rates and collect a local rate of 3.3125%. Their average local score is represented as a negative.(e) Calculated rate including excise taxes, additional fees levied per gallon (such as storage tank and environmental fees), local excise taxes, and sales or gross receipts taxes.(f) Includes a statewide local tax of 52 cents in Alabama and 53 cents in Georgia.(g) May include taxes that are levied based on container size.(h) These states outlaw private liquor sales and utilize state-run stores. These are called “control states,” while “license states” are those that permit private wholesale and retail sales. All license states have an excise tax rate in law, expressed in dollars per gallon. Control states levy no statutory tax but usually raise comparable revenue by charging higher prices. The Distilled Spirits Council of the U.S. has computed approximate excise tax rates for control states by comparing prices of typical products sold in their state-run stores to the pretax prices of liquor in states where liquor is privately sold. In New Hampshire, average liquor prices charged in state-run stores are lower than pretax prices in license states. Washington privatized its liquor sales but enacted tax increases as a part of the package. Source: Tax Foundation; Bloomberg Tax; American Petroleum Institute; Distilled Spirits Council of the United States; Campaign for Tobacco-Free Kids.

DATA
TAB
LESTAX FOUNDATION | 65
Table 17.State Sales Tax Bases: Exemptions for Business-to-Business Transactions (as of July 1, 2019)
Specific Exemption
Farm Equipment
Office Equipment
Manufacturing Machinery
Manufacturing Raw Materials
Busines Fuel &
UtilitiesBusiness Lease
& RentalsInformation
ServicesAlabama No Taxable Taxable Taxable Exempt Exempt Taxable TaxableAlaska n.a. n.a. n.a. n.a. n.a. n.a. n.a. n.a.Arizona No Exempt Taxable Exempt Exempt Taxable Taxable ExemptArkansas No Exempt Taxable Exempt Exempt Taxable Taxable ExemptCalifornia No Taxable Taxable Exempt Exempt Exempt Taxable ExemptColorado No Exempt Taxable Exempt Exempt Exempt Taxable ExemptConnecticut No Exempt Taxable Exempt Exempt Exempt Taxable TaxableDelaware n.a. n.a. n.a. n.a. n.a. n.a. n.a. n.a.Florida No Exempt Taxable Exempt Exempt Exempt Taxable ExemptGeorgia No Exempt Taxable Exempt Exempt Taxable Taxable ExemptHawaii No Taxable Taxable Taxable Taxable Taxable Taxable TaxableIdaho No Exempt Taxable Exempt Exempt Exempt Taxable ExemptIllinois No Exempt Taxable Exempt Exempt Exempt Exempt ExemptIndiana No Exempt Taxable Exempt Exempt Exempt Taxable ExemptIowa No Exempt Taxable Exempt Exempt Exempt Taxable ExemptKansas No Exempt Taxable Exempt Exempt Exempt Taxable ExemptKentucky No Exempt Taxable Taxable Exempt Exempt Taxable ExemptLouisiana No Taxable Taxable Exempt Exempt Exempt Taxable ExemptMaine No Exempt Taxable Exempt Exempt Exempt Taxable ExemptMaryland No Exempt Taxable Exempt Exempt Exempt Taxable ExemptMassachusetts No Exempt Taxable Exempt Exempt Exempt Taxable ExemptMichigan No Exempt Taxable Exempt Exempt Exempt Taxable ExemptMinnesota No Exempt Taxable Exempt Exempt Exempt Taxable ExemptMississippi No Partial Taxable Taxable Exempt Taxable Taxable ExemptMissouri No Exempt Taxable Exempt Exempt Exempt Taxable ExemptMontana n.a. n.a. n.a. n.a. n.a. n.a. n.a. n.a.Nebraska No Exempt Taxable Exempt Exempt Exempt Exempt ExemptNevada No Exempt Taxable Taxable Exempt Taxable Taxable ExemptNew Hampshire n.a. n.a. n.a. n.a. n.a. n.a. n.a. n.a.New Jersey No Exempt Taxable Exempt Exempt Taxable Taxable TaxableNew Mexico No Taxable Taxable Taxable Exempt Exempt Taxable TaxableNew York No Exempt Taxable Exempt Exempt Exempt Taxable TaxableNorth Carolina No Exempt Taxable Exempt Exempt Exempt Taxable ExemptNorth Dakota No Partial Taxable Taxable Exempt Taxable Taxable ExemptOhio No Exempt Taxable Exempt Exempt Exempt Taxable TaxableOklahoma No Exempt Taxable Exempt Exempt Exempt Taxable ExemptOregon n.a. n.a. n.a. n.a. n.a. n.a. n.a. n.a.Pennsylvania No Exempt Taxable Exempt Exempt Exempt Taxable ExemptRhode Island No Exempt Taxable Exempt Exempt Exempt Taxable ExemptSouth Carolina No Exempt Taxable Exempt Exempt Exempt Taxable TaxableSouth Dakota No Taxable Taxable Taxable Exempt Taxable Taxable TaxableTennessee No Exempt Taxable Exempt Exempt Taxable Taxable ExemptTexas No Exempt Taxable Exempt Exempt Exempt Taxable TaxableUtah No Exempt Taxable Exempt Exempt Exempt Taxable ExemptVermont No Exempt Taxable Exempt Exempt Exempt Taxable ExemptVirginia No Exempt Taxable Exempt Exempt Exempt Taxable ExemptWashington No Taxable Taxable Exempt Exempt Taxable Taxable TaxableWest Virginia No Exempt Taxable Exempt Exempt Exempt Taxable TaxableWisconsin No Exempt Taxable Exempt Exempt Exempt Taxable ExemptWyoming No Exempt Taxable Exempt Exempt Exempt Taxable ExemptDistrict of Columbia No Taxable Taxable Taxable Exempt Exempt Taxable TaxableNote: States with no sales tax (DE, MT, NH, and OR) are listed as “not applicable” (n.a.) within Table 17. Alaska has a local option sales tax.Source: Tax Foundation; Bloomberg Tax; state statutes.
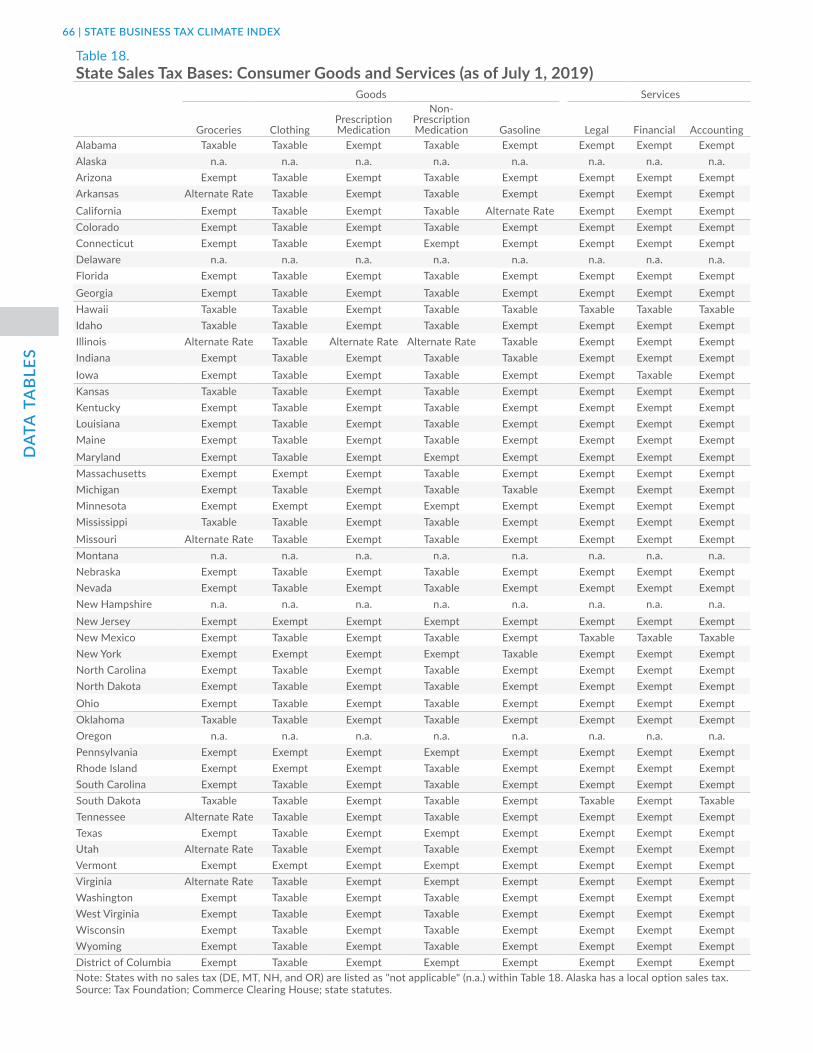
DAT
A T
AB
LES
66 | STATE BUSINESS TAX CLIMATE INDEX
Table 18.State Sales Tax Bases: Consumer Goods and Services (as of July 1, 2019)
Goods Services
Groceries ClothingPrescription Medication
Non-Prescription Medication Gasoline Legal Financial Accounting
Alabama Taxable Taxable Exempt Taxable Exempt Exempt Exempt ExemptAlaska n.a. n.a. n.a. n.a. n.a. n.a. n.a. n.a.Arizona Exempt Taxable Exempt Taxable Exempt Exempt Exempt ExemptArkansas Alternate Rate Taxable Exempt Taxable Exempt Exempt Exempt ExemptCalifornia Exempt Taxable Exempt Taxable Alternate Rate Exempt Exempt ExemptColorado Exempt Taxable Exempt Taxable Exempt Exempt Exempt ExemptConnecticut Exempt Taxable Exempt Exempt Exempt Exempt Exempt ExemptDelaware n.a. n.a. n.a. n.a. n.a. n.a. n.a. n.a.Florida Exempt Taxable Exempt Taxable Exempt Exempt Exempt ExemptGeorgia Exempt Taxable Exempt Taxable Exempt Exempt Exempt ExemptHawaii Taxable Taxable Exempt Taxable Taxable Taxable Taxable TaxableIdaho Taxable Taxable Exempt Taxable Exempt Exempt Exempt ExemptIllinois Alternate Rate Taxable Alternate Rate Alternate Rate Taxable Exempt Exempt ExemptIndiana Exempt Taxable Exempt Taxable Taxable Exempt Exempt ExemptIowa Exempt Taxable Exempt Taxable Exempt Exempt Taxable ExemptKansas Taxable Taxable Exempt Taxable Exempt Exempt Exempt ExemptKentucky Exempt Taxable Exempt Taxable Exempt Exempt Exempt ExemptLouisiana Exempt Taxable Exempt Taxable Exempt Exempt Exempt ExemptMaine Exempt Taxable Exempt Taxable Exempt Exempt Exempt ExemptMaryland Exempt Taxable Exempt Exempt Exempt Exempt Exempt ExemptMassachusetts Exempt Exempt Exempt Taxable Exempt Exempt Exempt ExemptMichigan Exempt Taxable Exempt Taxable Taxable Exempt Exempt ExemptMinnesota Exempt Exempt Exempt Exempt Exempt Exempt Exempt ExemptMississippi Taxable Taxable Exempt Taxable Exempt Exempt Exempt ExemptMissouri Alternate Rate Taxable Exempt Taxable Exempt Exempt Exempt ExemptMontana n.a. n.a. n.a. n.a. n.a. n.a. n.a. n.a.Nebraska Exempt Taxable Exempt Taxable Exempt Exempt Exempt ExemptNevada Exempt Taxable Exempt Taxable Exempt Exempt Exempt ExemptNew Hampshire n.a. n.a. n.a. n.a. n.a. n.a. n.a. n.a.New Jersey Exempt Exempt Exempt Exempt Exempt Exempt Exempt ExemptNew Mexico Exempt Taxable Exempt Taxable Exempt Taxable Taxable TaxableNew York Exempt Exempt Exempt Exempt Taxable Exempt Exempt ExemptNorth Carolina Exempt Taxable Exempt Taxable Exempt Exempt Exempt ExemptNorth Dakota Exempt Taxable Exempt Taxable Exempt Exempt Exempt ExemptOhio Exempt Taxable Exempt Taxable Exempt Exempt Exempt ExemptOklahoma Taxable Taxable Exempt Taxable Exempt Exempt Exempt ExemptOregon n.a. n.a. n.a. n.a. n.a. n.a. n.a. n.a.Pennsylvania Exempt Exempt Exempt Exempt Exempt Exempt Exempt ExemptRhode Island Exempt Exempt Exempt Taxable Exempt Exempt Exempt ExemptSouth Carolina Exempt Taxable Exempt Taxable Exempt Exempt Exempt ExemptSouth Dakota Taxable Taxable Exempt Taxable Exempt Taxable Exempt TaxableTennessee Alternate Rate Taxable Exempt Taxable Exempt Exempt Exempt ExemptTexas Exempt Taxable Exempt Exempt Exempt Exempt Exempt ExemptUtah Alternate Rate Taxable Exempt Taxable Exempt Exempt Exempt ExemptVermont Exempt Exempt Exempt Exempt Exempt Exempt Exempt ExemptVirginia Alternate Rate Taxable Exempt Exempt Exempt Exempt Exempt ExemptWashington Exempt Taxable Exempt Taxable Exempt Exempt Exempt ExemptWest Virginia Exempt Taxable Exempt Taxable Exempt Exempt Exempt ExemptWisconsin Exempt Taxable Exempt Taxable Exempt Exempt Exempt ExemptWyoming Exempt Taxable Exempt Taxable Exempt Exempt Exempt ExemptDistrict of Columbia Exempt Taxable Exempt Exempt Exempt Exempt Exempt ExemptNote: States with no sales tax (DE, MT, NH, and OR) are listed as "not applicable" (n.a.) within Table 18. Alaska has a local option sales tax.Source: Tax Foundation; Commerce Clearing House; state statutes.

DATA
TAB
LESTAX FOUNDATION | 67
Table 18, Continued.State Sales Tax Bases: Consumer Goods and Services (as of July 1, 2019)
Services
State Medical Landscaping RepairReal Estate
Services Parking Dry Cleaning Fitness Barber VeterinaryAlabama Exempt Exempt Exempt Exempt Exempt Exempt Exempt Exempt ExemptAlaska n.a. n.a. n.a. n.a. n.a. n.a. n.a. n.a. n.a.Arizona Exempt Taxable Exempt Exempt Exempt Exempt Taxable Exempt ExemptArkansas Exempt Taxable Taxable Exempt Taxable Taxable Taxable Exempt ExemptCalifornia Exempt Exempt Exempt Exempt Exempt Exempt Exempt Exempt ExemptColorado Exempt Exempt Exempt Exempt Exempt Exempt Exempt Exempt ExemptConnecticut Exempt Taxable Taxable Exempt Taxable Taxable Taxable Exempt ExemptDelaware n.a. n.a. n.a. n.a. n.a. n.a. n.a. n.a. n.a.Florida Exempt Exempt Taxable Exempt Exempt Exempt Taxable Exempt ExemptGeorgia Exempt Exempt Exempt Exempt Exempt Exempt Exempt Exempt ExemptHawaii Taxable Taxable Taxable Exempt Exempt Taxable Taxable Taxable TaxableIdaho Exempt Exempt Exempt Exempt Exempt Exempt Taxable Exempt ExemptIllinois Exempt Exempt Exempt Exempt Exempt Exempt Exempt Exempt ExemptIndiana Exempt Exempt Exempt Exempt Exempt Exempt Exempt Exempt ExemptIowa Exempt Taxable Taxable Exempt Taxable Taxable Taxable Taxable ExemptKansas Exempt Exempt Taxable Exempt Exempt Taxable Taxable Exempt ExemptKentucky Exempt Taxable Exempt Exempt Exempt Taxable Taxable Exempt TaxableLouisiana Exempt Exempt Taxable Exempt Taxable Taxable Taxable Exempt ExemptMaine Exempt Exempt Exempt Exempt Exempt Taxable Exempt Exempt ExemptMaryland Exempt Exempt Exempt Exempt Exempt Exempt Exempt Exempt ExemptMassachusetts Exempt Exempt Exempt Exempt Exempt Exempt Exempt Exempt ExemptMichigan Exempt Exempt Exempt Exempt Exempt Taxable Exempt Exempt ExemptMinnesota Exempt Taxable Exempt Exempt Taxable Taxable Taxable Exempt ExemptMississippi Exempt Taxable Taxable Exempt Taxable Taxable Exempt Exempt ExemptMissouri Exempt Exempt Exempt Exempt Exempt Exempt Taxable Exempt ExemptMontana n.a. n.a. n.a. n.a. n.a. n.a. n.a. n.a. n.a.Nebraska Exempt Taxable Taxable Exempt Exempt Exempt Exempt Exempt ExemptNevada Exempt Exempt Exempt Exempt Exempt Exempt Exempt Exempt ExemptNew Hampshire n.a. n.a. n.a. n.a. n.a. n.a. n.a. n.a. n.a.New Jersey Exempt Taxable Taxable Exempt Taxable Exempt Taxable Exempt ExemptNew Mexico Taxable Taxable Taxable Exempt Taxable Taxable Taxable Taxable TaxableNew York Exempt Taxable Taxable Exempt Taxable Exempt Exempt Exempt ExemptNorth Carolina Exempt Exempt Taxable Exempt Exempt Taxable Exempt Exempt ExemptNorth Dakota Exempt Exempt Exempt Exempt Exempt Exempt Exempt Exempt ExemptOhio Exempt Taxable Taxable Exempt Exempt Taxable Taxable Exempt ExemptOklahoma Exempt Exempt Exempt Exempt Taxable Exempt Taxable Exempt ExemptOregon n.a. n.a. n.a. n.a. n.a. n.a. n.a. n.a. n.a.Pennsylvania Exempt Taxable Taxable Exempt Exempt Taxable Exempt Exempt ExemptRhode Island Exempt Exempt Exempt Exempt Exempt Exempt Exempt Exempt ExemptSouth Carolina Exempt Exempt Exempt Exempt Exempt Taxable Exempt Exempt ExemptSouth Dakota Exempt Taxable Taxable Taxable Taxable Taxable Taxable Taxable TaxableTennessee Exempt Exempt Taxable Exempt Taxable Taxable Exempt Exempt ExemptTexas Exempt Taxable Taxable Exempt Taxable Taxable Taxable Exempt ExemptUtah Exempt Exempt Taxable Exempt Exempt Taxable Taxable Exempt ExemptVermont Exempt Exempt Exempt Exempt Exempt Exempt Exempt Exempt ExemptVirginia Exempt Exempt Exempt Exempt Exempt Exempt Exempt Exempt ExemptWashington Exempt Taxable Taxable Exempt Taxable Taxable Taxable Exempt TaxableWest Virginia Exempt Taxable Taxable Exempt Taxable Taxable Exempt Exempt ExemptWisconsin Exempt Taxable Taxable Exempt Taxable Taxable Exempt Exempt ExemptWyoming Exempt Exempt Taxable Exempt Exempt Taxable Exempt Exempt ExemptDistrict of Columbia Exempt Taxable Taxable Exempt Taxable Taxable Taxable Exempt ExemptNote: States with no sales tax (DE, MT, NH, and OR) are listed as “not applicable” (n.a.) within Table 18. Alaska has a local option sales tax.Source: Tax Foundation; Bloomberg Tax; state statutes.

DAT
A T
AB
LES
68 | STATE BUSINESS TAX CLIMATE INDEX
Table 19.Sales Tax Structure (as of July 1, 2019)State
Uniform Base Definitions
Unified Tax Administration
Safe Harbor for Remote Sellers
Sales Tax Holidays
Alabama Yes No Gross Sales Threshold YesAlaska No No n.a. NoArizona No Yes Gross Sales Threshold NoArkansas Yes Yes Sales or Transactions Threshold YesCalifornia Yes Yes Gross Sales Threshold NoColorado No No Gross Sales Threshold NoConnecticut Yes Yes Gross Sales Threshold YesDelaware n.a. n.a. n.a. NoFlorida Yes Yes n.a. YesGeorgia Yes Yes Gross Sales Threshold NoHawaii Yes Yes Sales or Transactions Threshold NoIdaho No Yes Gross Sales Threshold NoIllinois Yes Yes Sales or Transactions Threshold NoIndiana Yes Yes Sales or Transactions Threshold NoIowa Yes Yes Gross Sales Threshold YesKansas Yes Yes No Safe Harbor NoKentucky Yes Yes Sales or Transactions Threshold NoLouisiana No No Sales or Transactions Threshold YesMaine Yes Yes Sales or Transactions Threshold NoMaryland Yes Yes Sales or Transactions Threshold YesMassachusetts Yes Yes Gross Sales Threshold YesMichigan Yes Yes Gross Sales Threshold NoMinnesota Yes Yes Sales or Transactions Threshold NoMississippi Yes Yes Gross Sales Threshold YesMissouri Yes Yes n.a. YesMontana n.a. n.a. n.a. NoNebraska Yes Yes Sales or Transactions Threshold NoNevada Yes Yes Sales or Transactions Threshold NoNew Hampshire n.a. n.a. n.a. NoNew Jersey Yes Yes Sales or Transactions Threshold NoNew Mexico Yes Yes Gross Sales Threshold YesNew York Yes Yes Gross Sales Threshold NoNorth Carolina Yes Yes Sales or Transactions Threshold NoNorth Dakota Yes Yes Gross Sales Threshold NoOhio Yes Yes Sales or Transactions Threshold YesOklahoma Yes Yes Low Gross Sales Threshold YesOregon n.a. n.a. n.a. NoPennsylvania Yes Yes Gross Sales Threshold NoRhode Island Yes Yes Sales or Transactions Threshold NoSouth Carolina Yes Yes Gross Sales Threshold YesSouth Dakota Yes Yes Sales or Transactions Threshold NoTennessee Yes Yes Gross Sales Threshold YesTexas Yes Yes Gross Sales Threshold YesUtah Yes Yes Sales or Transactions Threshold NoVermont Yes Yes Sales or Transactions Threshold NoVirginia Yes Yes Sales or Transactions Threshold YesWashington Yes Yes Gross Sales Threshold NoWest Virginia Yes Yes Sales or Transactions Threshold NoWisconsin Yes Yes Sales or Transactions Threshold YesWyoming Yes Yes Sales or Transactions Threshold NoDistrict of Columbia Yes Yes Sales or Transactions Threshold NoSource: Tax Foundation; state statutes.

DATA
TAB
LESTAX FOUNDATION | 69
Table 20.State Property Tax Rates and Capital Stock Tax Rates (as of July 1, 2019)
Property Tax Collections Per
Capita
Property Tax as a Percentage of Personal Income
Capital Stock Tax Rate
Capital Stock Max Payment
Payment Options for CST and CIT
Alabama $545 1.39% 0.175% $15,000 Pay bothAlaska $2,047 3.66% None n.a. n.a.Arizona $1,062 2.61% None n.a. n.a.Arkansas $712 1.79% 0.3% Unlimited Pay bothCalifornia $1,559 2.71% None n.a. n.a.Colorado $1,425 2.72% None n.a. n.a.Connecticut $2,927 4.21% 0.341% $1,000,000 Pay highestDelaware $860 1.79% 0.04% $200,000 Pay bothFlorida $1,263 2.74% None n.a. n.a.Georgia $1,159 2.72% (a) $5,000 Pay bothHawaii $1,140 2.24% None n.a. n.a.Idaho $944 2.33% None n.a. n.a.Illinois $2,120 4.04% 0.1% $2,000,000 Pay bothIndiana $967 2.22% None n.a. n.a.Iowa $1,582 3.41% None n.a. n.a.Kansas $1,490 3.14% None n.a. n.a.Kentucky $775 1.96% None n.a. n.a.Louisiana $887 2.08% 0.3% Unlimited Pay bothMaine $2,124 4.74% None n.a. n.a.Maryland $1,547 2.63% None n.a. n.a.Massachusetts $2,357 3.62% 0.26% Unlimited Pay highestMichigan $1,413 3.16% None n.a. n.a.Minnesota $1,567 2.97% None n.a. n.a.Mississippi $988 2.76% 0.225% Unlimited Pay bothMissouri $971 2.23% None n.a. n.a.Montana $1,517 3.44% None n.a. n.a.Nebraska $1,909 3.84% (a) $11,995 Pay bothNevada $994 2.24% None n.a. n.a.New Hampshire $3,115 5.45% None n.a. n.a.New Jersey $3,127 5.05% None n.a. n.a.New Mexico $768 1.97% None n.a. n.a.New York $2,782 4.57% 0.05% $5,000,000 Pay highestNorth Carolina $975 2.28% 0.15% Unlimited Pay bothNorth Dakota $1,296 2.46% None n.a. n.a.Ohio $1,264 2.80% None n.a. n.a.Oklahoma $699 1.66% 0.125% $20,000 Pay bothOregon $1,444 3.11% None n.a. n.a.Pennsylvania $1,477 2.87% None n.a. n.a.Rhode Island $2,415 4.75% None n.a. n.a.South Carolina $1,164 2.89% 0.1% Unlimited Pay bothSouth Dakota $1,394 2.87% None n.a. n.a.Tennessee $836 1.90% 0.25% Unlimited Pay bothTexas $1,762 3.82% None n.a. n.a.Utah $1,019 2.42% None n.a. n.a.Vermont $2,593 5.12% None n.a. n.a.Virginia $1,545 2.90% None n.a. n.a.Washington $1,436 2.59% None n.a. n.a.West Virginia $915 2.48% None n.a. n.a.Wisconsin $1,624 3.42% None n.a. n.a.Wyoming $2,393 4.32% 0.02% Unlimited Pay bothDistrict of Columbia $3,535 4.56% None n.a. n.a.(a) Based on a fixed dollar payment schedule. Effective tax rates decrease as taxable capital increases.Note: States without a capital stock tax are listed as "not applicable" (n.a.) within Table 20.Source: Tax Foundation calculations from U.S. Census Bureau data; Bloomberg Tax; state statutes.

DAT
A T
AB
LES
70 | STATE BUSINESS TAX CLIMATE INDEX
Table 21.State Property Tax Bases (as of July 1, 2019)
Tangible Personal
Property TaxIntangible
Property Tax Inventory TaxReal Estate Transfer Tax Estate Tax Inheritance Tax Gift Tax
Alabama Yes Yes No Yes No No NoAlaska Yes No Partial No No No NoArizona Yes No No No No No NoArkansas Yes No Yes Yes No No NoCalifornia Yes No No Yes No No NoColorado Yes No No Yes No No NoConnecticut Yes No No Yes Yes No YesDelaware No No No Yes No No NoFlorida Yes No No Yes No No NoGeorgia Yes No Partial Yes No No NoHawaii No No No Yes Yes No NoIdaho Yes No No No No No NoIllinois No No No Yes Yes No NoIndiana Yes No No No No No NoIowa No Yes No Yes No Yes NoKansas Yes Yes No No No No NoKentucky Yes Yes Yes Yes No Yes NoLouisiana Yes Yes Yes No No No NoMaine Yes No No Yes Yes No NoMaryland Yes No Yes Yes Yes Yes NoMassachusetts Yes No Partial Yes Yes No NoMichigan Yes No Partial Yes No No NoMinnesota Partial No No Yes Yes No NoMississippi Yes Yes Yes No No No NoMissouri Yes No No No No No NoMontana Yes No No No No No NoNebraska Yes No No Yes No Yes NoNevada Yes No No Yes No No NoNew Hampshire Partial No No Yes No No NoNew Jersey Partial No No Yes No Yes NoNew Mexico Yes No No No No No NoNew York No No No Yes Yes No NoNorth Carolina Yes Yes No Yes No No NoNorth Dakota Partial No No No No No NoOhio No No No Yes No No NoOklahoma Yes No Yes Yes No No NoOregon Yes No No No Yes No NoPennsylvania No No No Yes No Yes NoRhode Island Yes No No Yes Yes No NoSouth Carolina Yes No No Yes No No NoSouth Dakota Partial Yes No Yes No No NoTennessee Yes Yes No Yes No No NoTexas Yes Yes Yes No No No NoUtah Yes No No No No No NoVermont Yes No Partial Yes Yes No NoVirginia Yes No Yes Yes No No NoWashington Yes No No Yes Yes No NoWest Virginia Yes No Yes Yes No No NoWisconsin Yes No No Yes No No NoWyoming Yes No No No No No NoDistrict of Columbia Yes No No Yes Yes No NoSource: Tax Foundation; Bloomberg Tax; state statutes.

DATA
TAB
LESTAX FOUNDATION | 71
Table 22.State Unemployment Insurance Tax Rates (Rates in Effect on July 1, 2019)
Most Favorable Schedule Least Favorable Schedule
StateMinimum
RateMaximum
RateTaxable
Wage BaseMinimum
RateMaximum
RateMinimum
RateMaximum
RateAlabama 0.65% 6.80% $8,000 0.14% 5.40% 0.65% 6.80%Alaska 1.00% 5.40% $39,900 1.00% 6.50% 1.00% 6.50%Arizona 0.04% 11.80% $7,000 0.02% 5.40% 0.02% 5.40%Arkansas 0.40% 14.30% $10,000 0.10% 6.00% 0.10% 6.00%California 1.60% 6.20% $7,000 0.10% 5.40% 1.50% 6.20%Colorado 0.62% 8.15% $13,100 0.51% 6.28% 0.75% 10.39%Connecticut 1.90% 6.80% $15,000 0.50% 5.40% 0.50% 5.40%Delaware 0.30% 8.20% $16,500 0.10% 8.00% 0.10% 8.00%Florida 0.10% 5.40% $7,000 0.10% 5.40% 0.10% 5.40%Georgia 0.04% 8.10% $9,500 0.01% 5.40% 0.04% 8.10%Hawaii 0.00% 5.60% $46,800 0.00% 5.40% 2.40% 6.60%Idaho 0.25% 5.40% $40,000 0.18% 5.40% 0.96% 6.80%Illinois 0.48% 6.88% $12,960 0.00% 6.40% 0.00% 6.40%Indiana 0.50% 7.40% $9,500 0.00% 5.40% 0.75% 10.20%Iowa 0.00% 7.50% $30,600 0.00% 7.00% 0.00% 9.00%Kansas 0.00% 7.10% $14,000 0.20% 7.60% 0.20% 7.60%Kentucky 0.30% 9.00% $10,500 0.00% 9.00% 1.00% 10.00%Louisiana 0.10% 6.20% $7,700 0.09% 6.00% 0.09% 6.00%Maine 0.06% 5.46% $12,000 0.00% 5.40% 0.00% 5.40%Maryland 0.30% 7.50% $8,500 0.30% 7.50% 2.20% 13.50%Massachusetts 1.00% 12.65% $15,000 0.56% 8.62% 1.21% 18.55%Michigan 0.78% 12.77% $9,000 0.00% 6.30% 0.00% 6.30%Minnesota 0.20% 9.10% $34,000 0.10% 9.00% 0.40% 9.30%Mississippi 0.20% 5.60% $14,000 0.00% 5.40% 0.00% 5.40%Missouri 0.00% 9.75% $12,500 0.00% 5.40% 0.00% 7.80%Montana 0.13% 6.30% $33,000 0.00% 6.12% 1.62% 6.12%Nebraska 0.00% 5.40% $9,000 No Schedule No ScheduleNevada 0.30% 5.40% $31,200 0.25% 5.40% 0.25% 5.40%New Hampshire 0.10% 7.50% $14,000 0.10% 7.00% 0.10% 8.50%New Jersey 0.40% 5.40% $34,400 0.30% 5.40% 1.30% 7.70%New Mexico 0.33% 6.40% $24,800 0.33% 5.40% 0.33% 5.40%New York 1.30% 9.10% $11,400 0.00% 5.90% 1.50% 8.90%North Carolina 0.06% 5.76% $24,300 0.06% 5.76% 0.06% 5.76%North Dakota 0.15% 9.75% $36,400 0.01% No Schedule No ScheduleOhio 0.15% 9.20% $9,500 0.00% 6.30% 0.30% 6.70%Oklahoma 0.15% 5.50% $18,100 0.01% 5.50% 0.30% 9.20%Oregon 0.15% 5.40% $40,600 0.50% 5.40% 2.20% 5.40%Pennsylvania 0.15% 11.03% $10,000 0.00% 8.95% 0.00% 8.95%Rhode Island 0.15% 9.41% $23,601 0.21% 7.40% 1.20% 10.00%South Carolina 0.15% 5.46% $14,000 0.00% 5.40% 0.00% 5.40%South Dakota 0.15% 9.90% $15,000 0.00% 9.35% 0.00% 9.45%Tennessee 0.15% 10.00% $7,000 0.01% 10.00% 0.50% 10.00%Texas 0.15% 6.36% $9,000 0.00% 6.00% 0.00% 6.00%Utah 0.15% 7.10% $35,300 0.00% 7.00% 0.00% 7.00%Vermont 0.15% 6.50% $15,600 0.40% 5.40% 1.30% 8.40%Virginia 0.15% 6.21% $8,000 0.00% 5.40% 0.10% 6.20%Washington 0.15% 5.72% $49,800 0.00% 5.40% No ScheduleWest Virginia 0.15% 8.50% $12,000 0.00% 7.50% 1.50% 7.50%Wisconsin 0.15% 12.00% $14,000 0.00% 10.70% 0.07% 10.70%Wyoming 0.15% 8.78% $25,400 0.00% 8.50% 0.00% 8.50%District of Columbia 0.15% 7.20% $9,000 0.10% 5.40% 1.90% 7.40%Source: National Foundation for Unemployment Compensation and Workers' Compensation, Highlights of State Unemployment Compensation Laws (2019).

DAT
A T
AB
LES
72 | STATE BUSINESS TAX CLIMATE INDEX
Table 23.State Unemployment Insurance Tax Bases: Experience Formulas and Charging Methods (as of July 1, 2019)
StateExperience Formula
Based On
Benefits Are Charged to
Employers in Proportion to Base
Period Wages
Company Charged for Benefits If
Employee’s Benefit Award
Reversed
Reimbursements on Combined Wage Claims
Employee Left
Voluntarily
Employee Discharged for
Misconduct
Employee Refused Suitable
Work
Employee Continues
to Work for Employer Part-Time
Alabama Benefits Ratio Yes No Yes No No Yes NoAlaska Payroll Decline n.a. n.a. n.a. n.a n.a. n.a. n.a.Arizona Reserve Ratio Yes No No No No Yes NoArkansas Reserve Ratio Yes No Yes No No Yes NoCalifornia Reserve Ratio Yes No Yes No No Yes NoColorado Reserve Ratio No (a) No No No No Yes NoConnecticut Benefits Ratio Yes No No No No No NoDelaware Benefit Wage Ratio Yes No No No No No NoFlorida Benefits Ratio Yes No Yes No No No NoGeorgia Reserve Ratio No (b) No No No No No YesHawaii Reserve Ratio Yes Yes No No No No NoIdaho Reserve Ratio No (c) No No No No Yes NoIllinois Benefits Ratio No (b) No No No No No NoIndiana Reserve Ratio No (a) No No No No Yes NoIowa Benefits Ratio No (a) No No No No No NoKansas Reserve Ratio Yes Yes Yes No No Yes NoKentucky Reserve Ratio No (b) No No No No No NoLouisiana Reserve Ratio Yes No No No No No NoMaine Reserve Ratio No (b) No Yes No No No NoMaryland Benefits Ratio Yes No Yes No Yes Yes NoMassachusetts Reserve Ratio No (a) No Yes Yes Yes Yes NoMichigan Benefits Ratio Yes Yes No No No No NoMinnesota Benefits Ratio Yes No No No No Yes NoMississippi Benefits Ratio Yes Yes Yes No No No NoMissouri Reserve Ratio Yes No No No No No NoMontana Reserve Ratio Yes No Yes No No Yes NoNebraska Reserve Ratio No (a) No Yes No No Yes NoNevada Reserve Ratio No (c) Yes No No No Yes YesNew Hampshire Reserve Ratio No (b) No No No No No NoNew Jersey Reserve Ratio Yes No Yes No No No YesNew Mexico Benefits Ratio Yes No Yes No No No NoNew York Reserve Ratio Yes No Yes No No Yes NoNorth Carolina Reserve Ratio Yes Yes Yes No No Yes NoNorth Dakota Reserve Ratio Yes No Yes No No Yes NoOhio Reserve Ratio Yes No No No No No NoOklahoma Benefit Wage Ratio Yes No Yes No No No NoOregon Benefits Ratio Yes No No No No Yes NoPennsylvania Benefits Ratio Yes No No No No Yes NoRhode Island Reserve Ratio Yes No No No No No NoSouth Carolina Benefits Ratio No (b) No No No No No NoSouth Dakota Reserve Ratio No (a) No Yes No No Yes YesTennessee Reserve Ratio Yes No No No No Yes NoTexas Benefits Ratio Yes No Yes No No Yes YesUtah Benefits Ratio Yes No No No No Yes NoVermont Benefits Ratio Yes No No No No No NoVirginia Benefits Ratio No (b) Yes No Yes Yes Yes YesWashington Benefits Ratio Yes Yes Yes No No Yes NoWest Virginia Reserve Ratio Yes No Yes No No Yes NoWisconsin Reserve Ratio Yes Yes No No No No YesWyoming Benefits Ratio Yes No Yes No No Yes NoDistrict of Columbia Reserve Ratio Yes Yes Yes No No Yes No(a) Benefits charged to base-period employers, most recent first (inverse order).(b) Benefits charged to most recent employer.(c) Benefits charged to employer who paid largest amount of wages.Note: Alaska uses a payroll decline experience formula, so other features are listed as not applicable (n.a.).Source: National Foundation for Unemployment Compensation and Workers’ Compensation, Highlights of State Unemployment Compensation Laws (2019).

About the TAx FoundationThe Tax Foundation is the world’s leading independent tax policy research organization. Since 1937, our research, analysis, and experts have informed smarter tax policy in the United States and abroad. Our Center for Global Tax Reform produces timely and high-quality data, research, and analysis on taxation in countries around the world that influences the debate toward economically principled policies.
Center for state Tax PolicyMichael Lucci Vice President of State Projects
Jared Walczak Director of State Tax Policy
Ulrik Boesen Senior Policy Analyst, Excise Taxes
Katherine Loughead Policy Analyst
Janelle Cammenga Policy Analyst

PRINCIPLED INSIGHTFUL ENGAGED
The Tax Foundation’s State Business Tax Climate Index enables business leaders, government policymakers, and taxpayers to gauge how their states’ tax systems compare. While there are many ways to show how much is collected in taxes by state governments, the Index is designed to show how well states structure their tax systems, and provides a road map to improving these structures.
The Tax Foundation is the nation’s leading independent tax policy research organization. Since 1937, our principled research, insightful analysis, and engaged experts have informed smarter tax policy at the federal, state, and global levels.
©2019 Tax Foundation
Editor, Rachel Shuster Designer, Dan Carvajal
Tax Foundation1325 G Street, N.W. Suite 950Washington, D.C. 20005202.464.6200
taxfoundation.org
TAX
FOU
ND
ATION