2020 third quarter briefing
TRANSCRIPT

November 2020
2020 Third Quarter Briefing

Introduction of Cathay FHC
9M20 Business Overview
Overseas Expansion
Business Performance Summary
Cathay United BankCathay LifeCathay Century
Cathay’s CSR Efforts Appendix
2
Agenda

Cathay FHC: largest FHC, comprehensive products
3
2nd biggest non-life insurer
Market share in total premium income: 11.8% (9M20).
Investment banking, brokerage, and prop trading businesses
Strong underwriting and capital raising platform
Diversified products and services
One of the largest private banks in terms of total assets
No. 2 credit card issuer
The largest brokerage settlement bank
No. 1 life insurer in terms of total assets and total premium
Market share in total premium: 17.4% (9M20).
Building global asset management platform
Largest AUM among asset managers in Taiwan
Cathay FHC
Cathay United Bank
100%
Cathay Century
100%
Cathay Life
100%
Asset Management
Cathay Securities
100%
Cathay Venture
100%
CUB (China)(100%)
Indovina Bank(50%)
Cathay Century (China) (49%)
Cathay Century (Vietnam)
(100%)
Cathay LujiazuiLife (China)
(50%)
Cathay Life (Vietnam)
(100%)
Cathay Futures(100%)
Chairman: Mr. Hong-Tu TsaiVice Chairman: Mr. Tsu-Pei ChenPresident: Mr. Chang-Ken Lee
Cathay Securities Investment Trust
(100%)
Conning (100%)
CDBS-CAM(33%)
Cathay Securities (HK)
(100%)
CUBC Bank(100%)

365309
224
147114
197 138 130 118 102
Cathay Fubon CTBC Taiwan Shin Kong Cooperative Mega First CDF Hua Nan
Privately owned Government-run
18.715.9
13.111.1
8.15.1
13.6
-
9.6 9.5 8.2
Cathay Fubon Mega CTBC E. Sun First Cooperative Hua Nan Yuanta Taishin
Privately owned Government-run
Market leader in Taiwan’s FIG sector
4
Largest listed financials group by market capitalization and assets.
Ranking of total asset (US$bn)
Ranking of market cap (US$bn)
Note: Market capitalization as of November 30, 2020
Note: Total assets as of September 30, 2020

• Transformed CSR Committee to Corporate Sustainability Committee, supervised by the Board• Formed Responsible Investment team
5
2011
• Established CSR Committee
2012
• Published the first CSR report
2014
2015• Cathay United Bank signed Equator Principles, the first in Taiwan• Included in DJSI Emerging Market Index
2016
• Cathay Life self-complied to PSI• Joined Asia Investor Group on
Climate Change (AIGCC)
2017
• Cathay Century P&C Insurance self-complied to PSI
• The only Taiwan FIG participated in CDP Non-Disclosure Campaign &Climate Action 100+ Initiatives
2018
• Cathay United Bank self-complied to PRB
• Included in DJSI World Index
• Pioneered to sing on TCFD initiative
2019
• Ranked as Leader (A-) by CDP
• Leading position in investment engagement: CA100+, AIGCC
• Active in engagement with government
Cathay FHC’s continuous effort in ESG integration
C
C

Participating in global and domestic ESG initiatives
6
Initiatives Joined company / Time
CDP • Cathay FHC (2012)
Low Carbon Investment Registry • Cathay FHC (2014)
Taiwan Stewardship Principles • Cathay Life & Cathay SITE (2016)
• Cathay Century Insurance (2017)
• Cathay United Bank & Cathay Securities (2018)
Asia Investor Group on Climate Change (AIGCC)
• Cathay FHC (2016)
CDP Non-disclosure engagement campaign • Cathay FHC (2017)
Climate Action 100+ • Cathay Life & Cathay SITE (2017)
PRI (signatory / voluntary self-complied) • Conning Inc. (PRI signatory in 2015)
• Cathay Life (voluntary self-complied in 2015)
PSI (voluntary self-complied) • Cathay Life (2016)
• Cathay Century Insurance (2017)
PRB (voluntary self-complied) • Cathay United Bank (2018)
TCFD • Cathay FHC (2018)
Note: Cathay self-complied UN initiatives as Taiwan is not the member state in UNFor more information please refer to “Cathay’s CSR Efforts” page 40~49

1.3
2.4
4.6
3.8
4.5
4.0
4.8
6.8%
10.9%
12.9%
9.7% 10.0%
8.8%9.7%
0.0%
2.0%
4.0%
6.0%
8.0%
10.0%
12.0%
14.0%
16.0%
18.0%
20.0%
0.0
0.5
1.0
1.5
2.0
2.5
3.0
3.5
4.0
4.5
5.0
5.5
FY12 FY13 FY15 FY16 FY17 FY18 FY19
EPS ROE
82%50%
32% 36% 35% 41% 35%
16%53%
66% 63% 64% 58% 60%
FY12 FY13 FY15 FY16 FY17 FY18 FY19
CUB Cathay Life
13.3 14.6 18.8 17.5 19.7 21.3 22.52.515.4
38.430.2
36.3 30.338.3
FY12 FY13 FY15 FY16 FY17 FY18 FY19
CUB Cathay Life
Cathay FHC continued to deliver solid earnings
7
Profit contributionEPS & ROE
Note: (1) FY13 figures do not reflect the impact from applying fair value method on investment property.
(2) Since Cathay FHC has more subsidiaries other than Cathay Life and CUB, besides, due to affiliate transactions, the Cathay FHC net income might not equal to the sum of Cathay Life and CUB’s.
(3) EPS has been adjusted for stock dividend (stock split).
(NT$/%) (NT$BN)
FHC 16.2 29.0 57.9 48.0 56.7 51.8 63.9
Life 2.5 15.4 38.4 30.2 36.3 30.3 38.3
CUB 13.3 14.6 18.8 17.5 19.7 21.3 22.5

4.47 3.954.76
FY17 FY18 FY19
56.751.8
63.9
FY17 FY18 FY198
Net income EPS
8
(NT$BN) (NT$)
23%-9%
9M20 earnings has already surpassed 2019 full year's figure driven by sound investment performance.
Cathay FHC – Net income & EPS
3.864.55
9M19 9M20
52.264.4
9M19 9M20
24%

11.0% 12.0%8.8%
20.0%
26.7%
10.7% 10.8% 9.6%
20.1%
30.8%
CathayFHC
CUB CathayLife
CathayCentury
CathaySITE
19.1
30.6
1.6 0.5 0.5
19.2
44.8
1.9 0.6 1.0
CUB CathayLife
CathayCentury
CathaySITE
CathaySecurities
Net income of primary subsidiaries ROE
8.8% 10.9%7.3%
14.7%
26.3%
9.7% 10.3%8.0%
18.6%
26.7%
CathayFHC
CUB CathayLife
CathayCentury
CathaySITE
21.3
30.3
1.5 0.6 0.5
22.5
38.3
2.1 0.7 0.7
CUB CathayLife
CathayCentury
CathaySITE
CathaySecurities
9
Cathay FHC – Net income & ROE
9
9M19 9M20 9M19 9M20(NT$BN)
FY18 FY19 FY18 FY19
Note: Starting from 1Q18, ROE calculation was based on IFRS 9.
Life’s net income increased 47% YoY due to better investment income.
P&C, Asset Management and Securities subsidiaries delivered double digit growth in net income.

10
Book Value BVPS
(NT$BN) (NT$)
Cathay FHC – Book value & BVPS
Note:(1) Book value includes preferred shares and minority interests, BVPS represented BVPS attributable to common shareholders.(2) Starting Jan.1, 2018, the reporting was based on IFRS 9.
Book value continued to increase due to increase in the unrealized gains from financial assets and
earnings contribution.
43.7
34.0
51.654.8
FY17 FY18 FY19 9M20
608.5529.3
782.0824.6
FY17 FY18 FY19 9M20

11
9M20 Business overview
Cathay United Bank
Cathay Life
Cathay SITE
Cathay Century
Cathay Securities
Focused on value-driven strategy. Total premium grew steadily driven by the growth of renewal premium. Both FYP and FYPE ranked No.1 in the industry.
After-hedging investment yield reached 4.1%. Overall investment performance maintained stable.
Premium income grew steadily. Remained in second place with 11.8% market share.
Developed online business in China and enlarged local team in Vietnam. Overseas
premium income continued to rise.
Ranked No.1 in terms of AUM, which amounted to NT$939.4 BN.
Recognized by Asia Asset Management, Benchmark and received TFF-Bloomberg Best Fund Award in 2020.
Received “Plan to Advance Excellence for SITEs” preferential treatment from FSC.
Optimized customer experience with new digital business model.
9M20 profit increased significantly.
Delivered steady loan and deposit growth with benign credit quality.
Overseas expansion continued. Offshore earnings grew 21% YoY, accounted for 48% of pre-tax earnings.
Wealth management fee grew steadily, driven by mutual funds and securities product.

Introduction of Cathay FHC
9M20 Business Overview
Overseas Expansion
Business Performance Summary
Cathay United BankCathay LifeCathay Century
Cathay’s CSR Efforts Appendix
12
Agenda

Cathay FHC in South East Asia
Thailand Vietnam
Cambodia
Indonesia
Malaysia
Cathay United BankCathay Life
Cathay Century
Philippines
Banking
− Vietnam: Indovina Bank performed steadily.
− Cambodia: Subsidiary’s businesses grew steadily.
− Philippines: Invested 23% stake in RCBC.(3)
− Indonesia: Invested 37% stake in Bank Mayapada.(3)
− Myanmar: Planned to open Yangon branch in early 2021.
Cathay Life (Vietnam)
− Total premium grew 60% YoY to VND 1.17TN in 9M20.
− Expanded and diversified distribution channels.
Cathay Century
− Continued to expand local distribution channels to enhance growth momentum.
Laos
Myanmar
Singapore
China Vietnam Cambodia Hong Kong Singapore Malaysia Laos Philippines Thailand Myanmar Indonesia
Bank 7 36 16 1 1 1 1 1 1 1 1Life 53(1) 110(1)
P&C 26 2
Asset Mgt. 1 1Securities 2
Note: (1) Cathay Lujiazui Life and Cathay Life (Vietnam) footprints includes headquarter and branches.
(2) Footprints in Thailand and Indonesia are rep. offices.(3) Investments in RCBC and Bank Mayapada are funded by Cathay Life.(4) Cathay FHC owns 49% stake of Cathay Century (China), and 33%
stake of CDBS Cathay Asset Management.
13
Cathay FHC in China
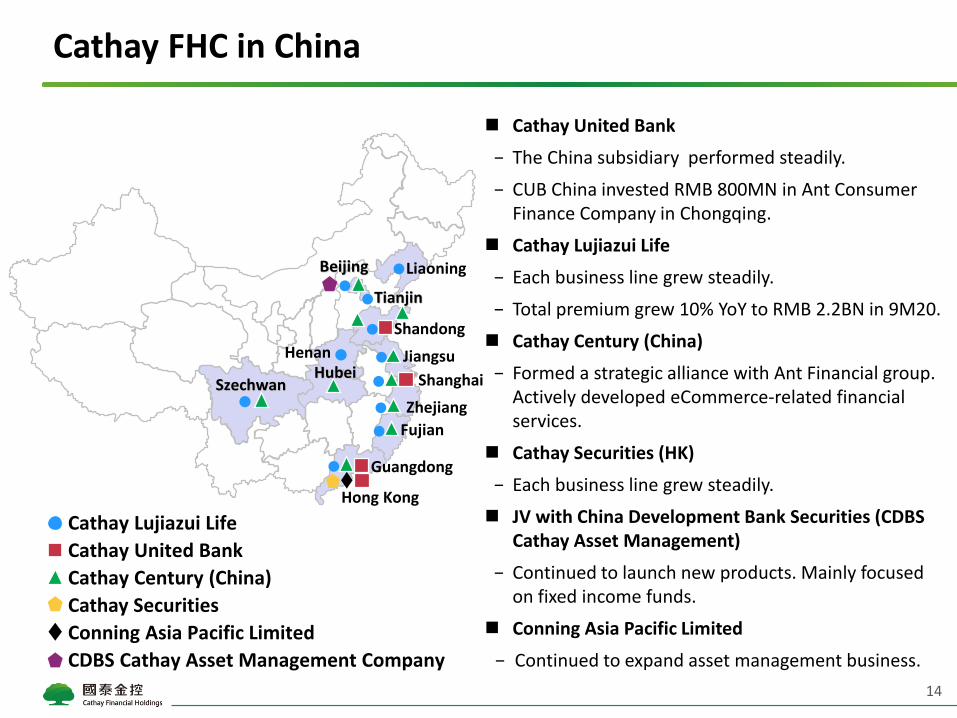
Cathay United Bank
− The China subsidiary performed steadily.
− CUB China invested RMB 800MN in Ant Consumer Finance Company in Chongqing.
Cathay Lujiazui Life
− Each business line grew steadily.
− Total premium grew 10% YoY to RMB 2.2BN in 9M20.
Cathay Century (China)
− Formed a strategic alliance with Ant Financial group. Actively developed eCommerce-related financial services.
Cathay Securities (HK)
− Each business line grew steadily.
JV with China Development Bank Securities (CDBS Cathay Asset Management)
− Continued to launch new products. Mainly focused on fixed income funds.
Conning Asia Pacific Limited
− Continued to expand asset management business.
Cathay Century (China)
Cathay United Bank
Cathay Lujiazui Life
Conning Asia Pacific Limited
CDBS Cathay Asset Management Company
Cathay Securities
Shanghai
Beijing Liaoning
Tianjin
Shandong
Jiangsu
Zhejiang
Fujian
Guangdong
Hong Kong
HubeiSzechwan
Henan
14

Introduction of Cathay FHC
9M20 Business Overview
Overseas Expansion
Business Performance Summary
Cathay United BankCathay LifeCathay Century
Cathay’s CSR Efforts Appendix
15
Agenda
Time deposit
Demand deposit (NT$BN)
CorporateMortgageConsumerCredit card related (NT$BN)
Deposit breakdown Loan breakdown
16
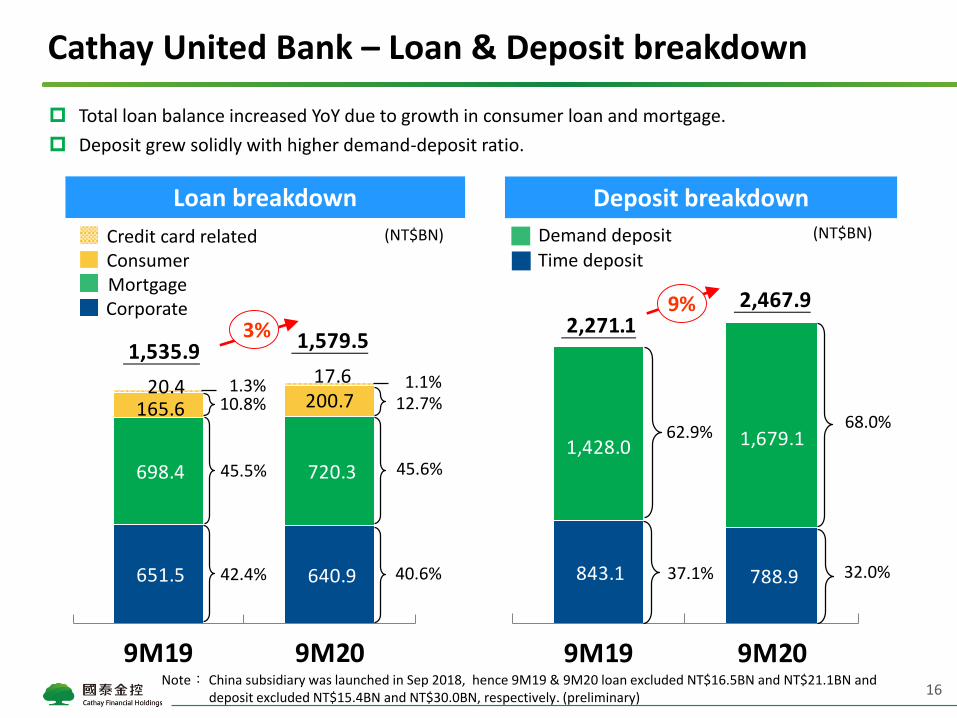
Cathay United Bank – Loan & Deposit breakdown
Note: China subsidiary was launched in Sep 2018, hence 9M19 & 9M20 loan excluded NT$16.5BN and NT$21.1BN and deposit excluded NT$15.4BN and NT$30.0BN, respectively. (preliminary)
Total loan balance increased YoY due to growth in consumer loan and mortgage.
Deposit grew solidly with higher demand-deposit ratio.
843.1 788.9
1,428.0 1,679.1
2,271.1 2,467.9
9M19 9M20
651.5 640.9
698.4 720.3
165.6 200.7 20.4
17.6 1,535.9 1,579.5
9M19 9M20
62.9%
37.1%
68.0%
32.0%
9%
1.1%1.3%
40.6%
12.7%10.8%
45.5%
42.4%
3%
45.6%

1.99%
1.76%1.88%
2.01% 2.04% 2.06% 2.06% 2.08% 2.08% 2.08% 2.06%1.93%
1.80%1.71%
1.83%
1.66% 1.67%1.81% 1.83% 1.85% 1.85%
1.80% 1.80%1.82% 1.83%
1.91%
1.82%1.76%
1.20%1.07%
1.18%1.24% 1.25% 1.26% 1.25% 1.22% 1.22% 1.22% 1.23% 1.25% 1.21% 1.18%
0.79%0.69% 0.71%
0.77% 0.79% 0.80% 0.81% 0.86% 0.86% 0.85% 0.83%
0.68% 0.59% 0.53%
FY15 FY16 FY17 1Q18 1H18 9M18 FY18 1Q19 1H19 9M19 FY19 1Q20 1H20 9M20
Avg. rate of interest-earning assets Interest spread Net interest margin Funding cost
17
1Q18 2Q18 3Q18 4Q18 1Q19 2Q19 3Q19 4Q19 1Q20 2Q20 3Q20
1.81% 1.85% 1.90% 1.83% 1.80% 1.81% 1.85% 1.86% 1.91% 1.73% 1.65%
1.24% 1.26% 1.27% 1.22% 1.22% 1.22% 1.23% 1.26% 1.25% 1.17% 1.13%
1.21% 1.22% 1.25% 1.22% 1.22% 1.22% 1.23% 1.26% 1.25% 1.17% 1.13%
Spread
NIM
NIM-pro forma excl. China(2)
Quarterly
Cathay United Bank – Interest yields
Interest spread and NIM contracted due to continued adverse impact from rate cuts.
Note: (1) Credit card related loans are included in the calculation of interest spread.(2) China subsidiary was launched in Sep 2018. Hence, since 9M18, China subsidiary results was excluded.

Gross provisionNPL & Coverage ratio
18
0.15% 0.21 %Mortgage NPL
0.23% 0.13%Mortgage NPL
Cathay United Bank – Credit quality
(NT$BN)Gross provision
RecoveryNPL ratio
Coverage ratio
Note:China subsidiary was launched in Sep 2018. Hence, 9M19 & 9M20 number excluded China subsidiary results. (NPL ratio: 0% and 0.19%, Gross provision: NT$ -18.9MN and NT$ -39MN, Recovery: NT$36.2MN and NT$ 0MN; preliminary).
Asset quality remained benign with NPL at 0.16% and coverage ratio at 1061%.
0.21% 0.16%
7.88%
10.61%
9M19 9M20
1061%788% 3.0
2.3 1.5
0.8
9M19 9M20
0.16% 0.15%
9.32% 11.37%
FY18 FY19
5.5 4.6
1.1 1.7
FY18 FY19
1137%932%

15.8% 15.0%12.2% 16.1% 15.6%
(2)(2) (2)
19
SME loans Foreign currency loans
(NT$BN)
As % of total loans
11.4% 13.8%10.7%9.2% 13.5%
(NT$BN)
Cathay United Bank – SME & FX loans
Note: (1) Total loans exclude credit card revolving balance.(2) China subsidiary was launched in Sep 2018, hence FY18, FY19 and 9M20 foreign currency loan balance excluded
NT$17.6BN , NT$18.4BN and NT$21.1BN from China subsidiary, respectively. (preliminary)
Grow SME and Foreign currency loans while ensuring asset quality.
174.0
224.0233.0
243.3 243.6
250.6261.7 264.8
FY16 FY17 FY18 FY19 9M20
130.9151.9
178.1
209.4 211.5
FY16 FY17 FY18 FY19 9M20
As % of CUB pre-tax profitsOffshore earnings
7.68.5
10.0
6.5
10.1
FY15 FY16 FY17 FY18 FY19
36.3%44.3% 45.6%
27.0%
39.9%
FY15 FY16 FY17 FY18 FY1920
(NT$BN)
-35%12% 17% 56%
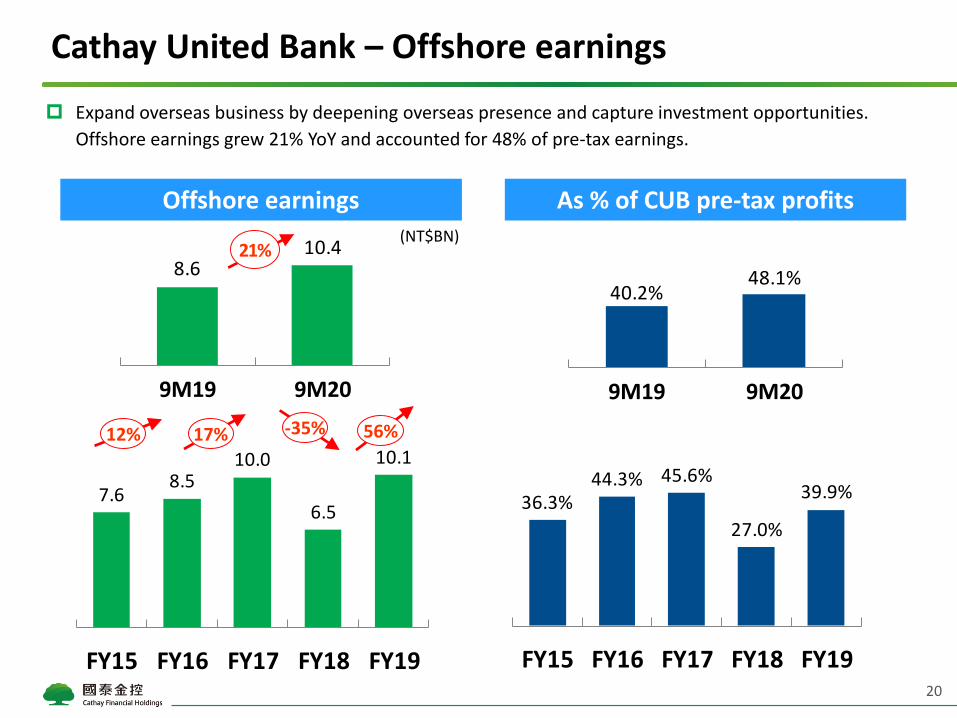
Cathay United Bank – Offshore earnings
8.610.4
9M19 9M20
21%
40.2%48.1%
9M19 9M20
Expand overseas business by deepening overseas presence and capture investment opportunities.
Offshore earnings grew 21% YoY and accounted for 48% of pre-tax earnings.

4.9 5.7 6.5 7.3 8.0
8.89.8 8.8
9.29.80.4
0.4 0.40.5
0.8
1.21.1 0.8
0.90.8
1.31.3 1.4
1.72.0
16.618.4 17.9
19.721.4
FY15 FY16 FY17 FY18 FY19
5.9 5.0
7.88.0
0.50.5
0.60.4
1.41.6
16.215.5
9M19 9M20
Quarterly fee income Annual fee income
21
(NT$BN)(NT$BN)
Cathay United Bank – Fee income
Others
Cards related
FXWealth management
Syndicated loansOthers
Cards related
FXWealth management
Syndicated loans
Note: China subsidiary was launched in Sep 2018, hence 9M19 and 9M20 fee income excluded NT$ 14.0MN and NT$23.7MN; FY18 (Sep.-Dec.) and FY19 excluded NT$ 5.8MN and NT$18.9MN from subsidiary, respectively. (preliminary)
Fee income declined 5% YoY due to decreased consumption under COVID-19 pandemic and lower credit
card fee.
3.9%
-5%
51.6%
10.4%
3.0%2.7%
32.3%
47.8%
8.9%
3.4%
36.1%
53.0%
45.9%
9.2%4.0%3.5%
37.4%
7.8%6.9%2.5%
29.8%
8%
11%
10%-3%

2,453
230 316
5,790
2,399
378 364
5,974
2,474
831 387
6,037
Mutual Funds Structuredproducts
& Securities
Trust &Custody
Insurance
22
Wealth management fee breakdown
(NT$MN) 9M19 9M20 FY17 FY18 FY19
Wealth management fee income 7,761 7,976 8,837 9,183 9,808
YoY growth (%) 4.3% 2.8% -10.1% 3.9% 6.8%
FY18 FY19FY179M19 9M20
Cathay United Bank – Wealth management fee
Wealth management fee increased 2.8% YoY, driven by strong growth in mutual funds more than
offsetting the decline in bancassurance fee.
1,719
539 288
5,158
2,344
583 284
4,658
Mutual Funds Structuredproducts
& Securities
Trust &Custody
Insurance
91.0 129.6
65.3 70.8 92.3
2.8
5.2
4.4 9.2
28.8 8.9
9.3
9.1 11.2
12.3 0.3
0.2
0.2 0.1
0.1 114.3
54.6 154.2 120.0
66.4
0.1 0.1
0.1
0.3 1.0
FY15 FY16 FY17 FY18 FY19
80.8
120.0
53.9 47.9
76.9
8.9
9.3
9.111.2
12.30.2
0.2
0.10.1
0.112.1
5.5
15.512.1
6.80.0
0.0
0.0 0.1
0.1
FY15 FY16 FY17 FY18 FY1923
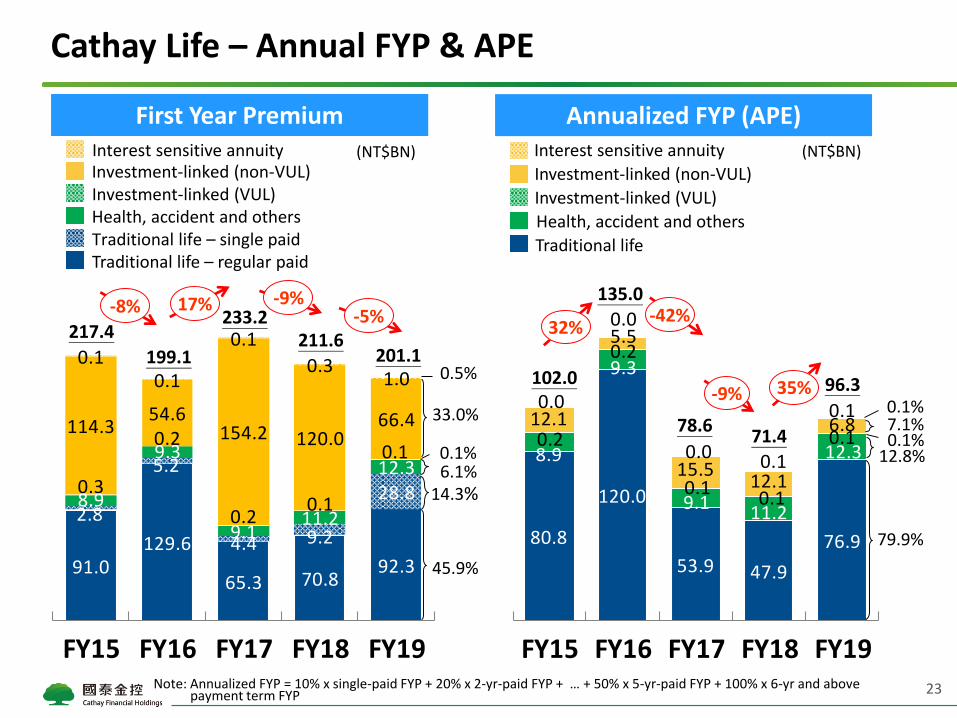
Cathay Life – Annual FYP & APE
First Year Premium
(NT$BN)
Traditional life – single paidHealth, accident and othersInvestment-linked (VUL)Investment-linked (non-VUL)Interest sensitive annuity
Traditional life – regular paid
(NT$BN)
Traditional life
Health, accident and others
Investment-linked (VUL)
Investment-linked (non-VUL)
Interest sensitive annuity
Annualized FYP (APE)
Note: Annualized FYP = 10% x single-paid FYP + 20% x 2-yr-paid FYP + … + 50% x 5-yr-paid FYP + 100% x 6-yr and above payment term FYP
12.8%
135.0-42%
78.671.4
0.1%
79.9%
7.1%0.1%
-9% 96.335%
0.1%6.1%
14.3%
0.5%
233.2211.6
45.9%
33.0%
-9%
199.1
17%
201.1
-5%217.4
-8%
102.0
32%

292.1366.1
418.1496.4
438.7483.6
73.5
84.9
94.0
101.9
106.5108.7
30.3
26.0
17.5
14.5
13.913.5
24.0
70.5
115.5
155.5
121.2 67.3
141.5
13.8
0.1
0.1
0.4 1.1561.4 561.3
645.2
768.3
680.7 674.1
FY10 FY12 FY15 FY17 FY18 FY19
307.4 341.7 327.3
75.276.3 81.210.19.8 9.8
99.7 44.5 63.0
0.2 1.0 0.1
492.6 473.3 481.4
9M18 9M19 9M20
Quarterly total premium Annual total premium
24
Cathay Life – Total premium
(NT$BN)
Traditional life
Health, accident and others
Investment-linked (VUL)
Investment-linked (non-VUL)
Interest sensitive annuity (NT$BN)
Traditional life
Health, accident and others
Investment-linked (VUL)
Investment-linked (non-VUL)
Interest sensitive annuity
Total premium increased 2% YoY, driven by the growth in renewal premium.
-4%
16.9%
0.0%13.1%
2.0%
68.0%
2%
13.1%
16.1%
0.2%10.0%
2.0%
71.7%
25.2%
4.3%5.4%
52.0%
-1%

(NT$BN)
Traditional life – single paidHealth, accident and othersInvestment-linked (VUL)Investment-linked (non-VUL)Interest sensitive annuity
Traditional life – regular paid
First Year Premium Annualized FYP (APE)
25
Cathay Life – Quarterly FYP & APE
(NT$BN)
Traditional life
Health, accident and others
Investment-linked (VUL)
Investment-linked (non-VUL)
Interest sensitive annuity
Note: Annualized FYP = 10% x single-paid FYP + 20% x 2-yr-paid FYP + … + 50% x 5-yr-paid FYP + 100% x 6-yr and above payment term FYP
FYP declined 16% YoY due to lower policy reserve rate. FYPE also declined, reflecting the increase in
sales of single-paid investment-linked products.
FYP and FYPE ranked No. 1 in the industry.
35.0
53.8
34.4
8.3
8.5
10.30.1
0.1
0.110.0
4.5
6.30.0
0.1
0.0
53.4
67.0
51.1
9M18 9M19 9M20
51.5 68.0
37.4
5.8
24.0
12.3
8.3
8.5
10.3
0.1
0.1
0.1
98.8 43.8
62.4
0.2
1.0
0.1
164.7
145.5 122.5
9M18 9M19 9M20
0.1%8.4%
10.0%
0.1%
30.5%
51.0%
-16%
20.1%
0.0%
67.3%
12.4%0.1%
26% -24%
-12%

Profit Margin 9M19 9M20
VNB/FYP 24% 21%
VNB/FYP(excl. Investment-linked (non-VUL))
33% 39%
VNB/FYPE 53% 50%
Value for New Business Value for New Business (annual)
26
(NT$BN)
(1) (1)
Cathay Life –Value of new business
Note:(1) 9M19, FY19 and 9M20 VNB were based on 2019 Embedded Value assumptions.(2) Based on 2018 Embedded Value assumptions, 9M19 & FY19 VNB were NT$45.7BN and NT$62.5BN;
VNB/FYP were both 31% , VNB/FYPE were 68% and 65%, respectively.
VNB and VNB margin declined due to lower sales volume and product mix change impacted by lower
policy reserve rate.
VNB margin increased to 39% if excluding the impact of product mix change.
(NT$BN)
Profit Margin FY15 FY16 FY17 FY18 FY19 FY19
VNB/FYP 27% 38% 22% 24% 31% 24%
VNB/FYPE 57% 56% 64% 72% 65% 50%
(2) (1)
57.6
75.5
50.5 51.5
48.0
62.5
FY15 FY16 FY17 FY18 FY19
(2)
(1)35.4 25.7
45.7
9M19 9M20
(1)(1)
(2)
YoY -27%

Cost of liability (annual)Cost of liability (quarterly)
27
5.40%
5.07%
4.83%4.78%
4.63%4.54%
4.43%
4.33%4.23%
4.11%4.03%
3.95%
FY08 FY10 FY12 FY14 FY16 FY18FY19
Note: The figures of cost of liability are reserve-based.
Cathay Life – Cost of liability
Continued to strengthen value-driven strategy. Cost of liability continued to improve.
4.05%4.03% 4.02% 4.01%
3.98%3.95%
3.92%3.89%
3.86%
9M18 FY18 1Q19 1H19 9M19 FY19 1Q20 1H20 9M20

28
Cathay Life – Investment portfolio
(NT$BN) FY17 FY18 FY19 9M20
Total investments(1) 5,502.6 5,761.0 6,415.0 6,752.5
Weight Weight Weight Amount Return Weight Amount Return
Cash & Cash equivalents 1.6% 1.1% 3.7% 237 0.6% 4.1% 276 0.4%
Equity- Domestic 8.4% 7.5% 5.0% 322 7.9% 5.6% 381 14.6%
Equity- International(2)
6.3% 6.7% 5.8% 370 6.5% 5.3% 358 4.8%
Bond- Domestic 5.5% 5.0% 7.9% 505 5.7% 8.4% 566 5.4%
Bond- International(1)(2)
55.7% 58.6% 58.9% 3,777 5.3% 59.5% 4,018 5.7%
Mortgage & Secured loans
8.1% 7.1% 5.3% 341 2.1% 4.8% 314 1.7%
Policy loans 3.0% 3.0% 2.7% 171 5.6% 2.5% 166 5.5%
Real estate 9.2% 8.7% 8.2% 526 2.7% 7.7% 530 3.0%
Others 2.4% 2.4% 2.6% 165 2.1% 143
Note: (1) Total assets excluded separate account assets; international bond includes foreign currency deposit and related adjustments(2) Yields of international equity and international bond are pre-hedge investment yields.
Dynamically adjust the investment portfolio to reduce the impact of market volatility.

After-hedging investment yield After-hedging investment yield
4.18%4.02% 4.02%
3.82% 3.95%
FY15 FY16 FY17 FY18 FY19
29
Cathay Life – Investment performance highlight
Continued to enhance credit mix in bond portfolio.
Realized capital gain into market strength.
4.27% 4.16% 4.19% 4.07% 4.10%
9M16 9M17 9M18 9M19 9M20
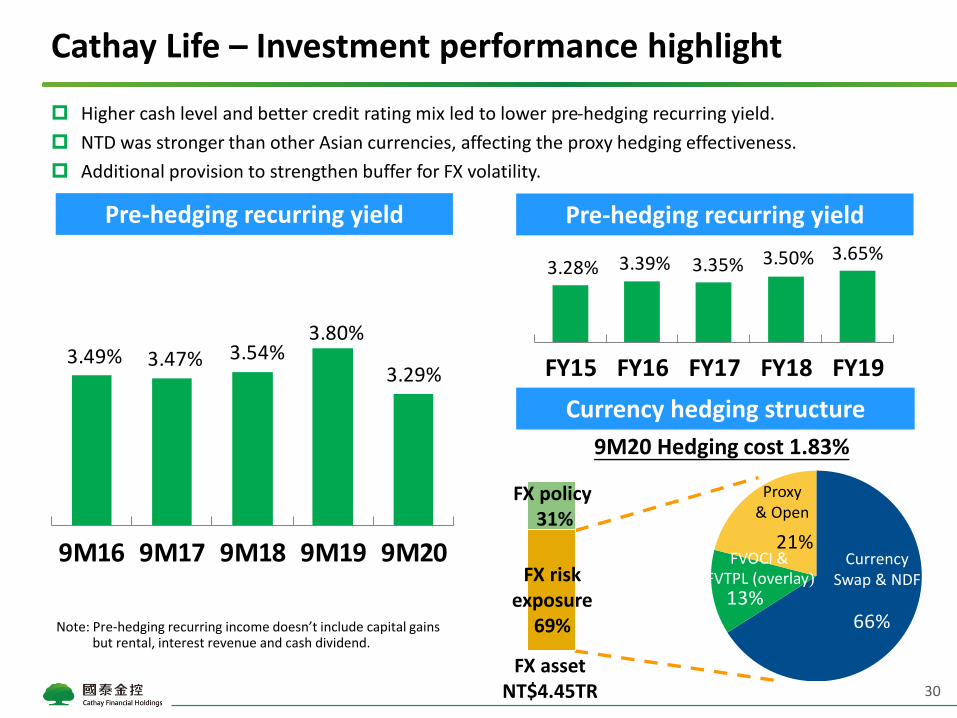
66%13%
21%
Pre-hedging recurring yield Pre-hedging recurring yield
30
3.28% 3.39% 3.35% 3.50% 3.65%
FY15 FY16 FY17 FY18 FY19
Cathay Life – Investment performance highlight
Currency hedging structure
9M20 Hedging cost 1.83%
FX assetNT$4.45TR
FX risk exposure
69%
FX policy31%
Proxy& Open
Currency Swap & NDF
FVOCI & FVTPL (overlay)
Note: Pre-hedging recurring income doesn’t include capital gains but rental, interest revenue and cash dividend.
Higher cash level and better credit rating mix led to lower pre-hedging recurring yield.
NTD was stronger than other Asian currencies, affecting the proxy hedging effectiveness.
Additional provision to strengthen buffer for FX volatility.
3.49% 3.47% 3.54%3.80%
3.29%
9M16 9M17 9M18 9M19 9M20
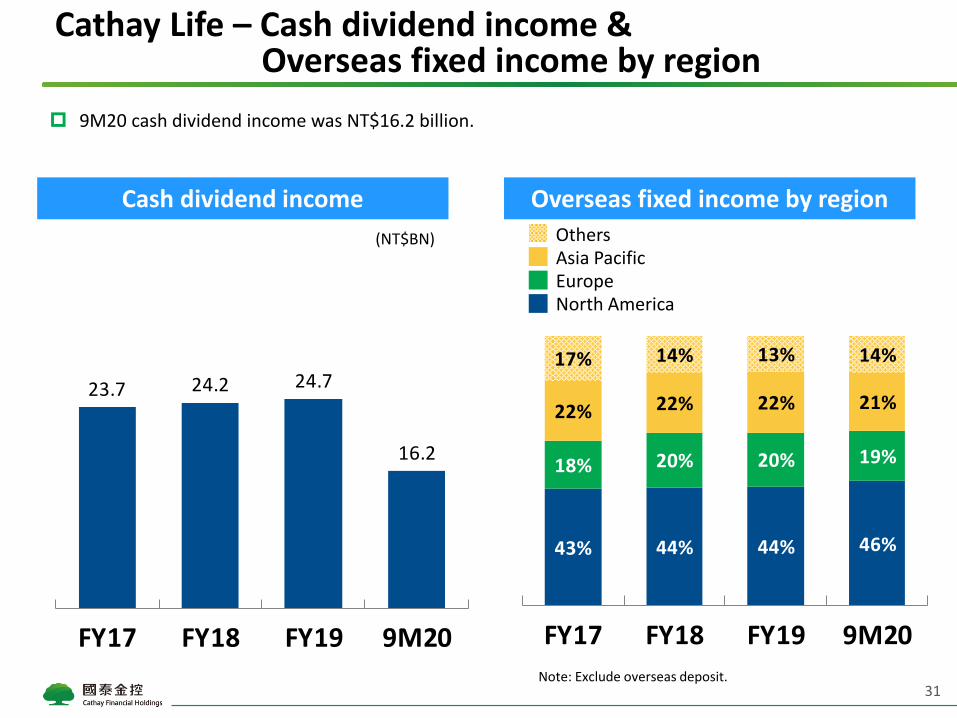
23.7 24.2 24.7
16.2
FY17 FY18 FY19 9M20
Cash dividend income Overseas fixed income by region
31
(NT$BN)
Cathay Life – Cash dividend income &Overseas fixed income by region
Asia PacificEuropeNorth America
Others
Note: Exclude overseas deposit.
9M20 cash dividend income was NT$16.2 billion.
43% 44% 44% 46%
18% 20% 20% 19%
22% 22% 22% 21%
17% 14% 13% 14%
FY17 FY18 FY19 9M20

51.6
-73.1
115.3126.2
FY17 FY19 9M20
441.2
362.1
594.5648.4
FY17 FY18 FY19 9M20
Book value Unrealized G/L of financial assets
32
(NT$BN) (NT$BN)
FY18
Book value and unrealized gain continued to increase.
Cathay Life – Book value & Unrealized G/L of financial assets
FVOCI & FVTPL (overlay approach)
AFS financial assets

First Year Premium Annualized FYP (APE)
33
Cathay Life – Distribution channel
Tied agents
Bancassurance-CUBOthers
Premium income was mainly generated by Cathay Life agents and Cathay United Bank. Group's
strong selling capability provides solid contribution to premium income and VNB.
82.7% 79.7%
14.6% 16.2%
2.7% 4.2%
9M19 9M20
59.7% 59.6%
30.3% 28.3%
10.0% 12.1%
9M19 9M20

Persistency ratio Expense ratio
34
9M19 9M20
Cathay Life – Operational indicators
Expense ratio improved due to lower underwriting cost and commission fee, resulting from lower FYP
and increased sales in investment-linked policies.
10.6%9.7%
9M19 9M20
98.0%96.5%
98.1%
95.6%
13 months 25 months

Introduction of Cathay FHC
9M20 Business Overview
Overseas Expansion
Business Performance Summary
Cathay United BankCathay LifeCathay Century
Cathay’s CSR Efforts Appendix
35
Agenda
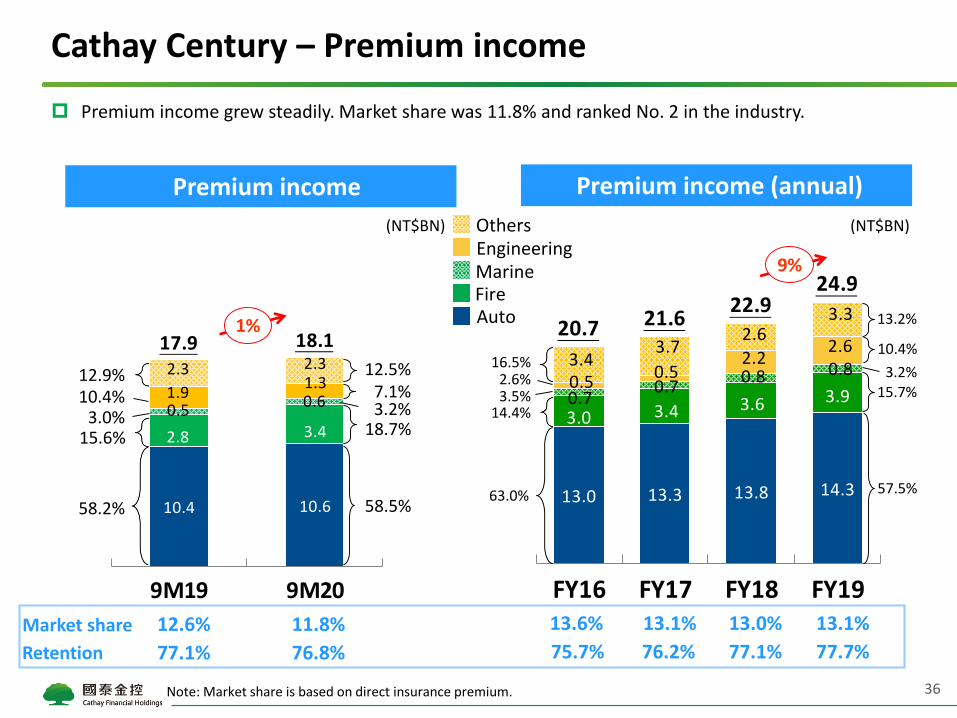
Premium income Premium income (annual)
36
(NT$BN) (NT$BN)
AutoFireMarineEngineeringOthers
Market share
Retention
13.0% 13.1%
77.1% 77.7%
13.1%
76.2%
13.6%
75.7%
11.8%
76.8%
12.6%
77.1%
Note: Market share is based on direct insurance premium.
Cathay Century – Premium income
Premium income grew steadily. Market share was 11.8% and ranked No. 2 in the industry.
10.4 10.6
2.8 3.40.5
0.61.9
1.32.3 2.3
17.9 18.1
9M19 9M20
13.0 13.3 13.8 14.3
3.0 3.4 3.6 3.90.70.7
0.8 0.80.5
0.52.2
2.63.4
3.72.6
3.320.7 21.6
22.924.9
FY16 FY17 FY18 FY19
14.4%
16.5%
3.5%
63.0%
2.6%
57.5%
10.4%
15.7%
13.2%
3.2%
1%
15.6%
12.9%
3.0%
58.2% 58.5%
7.1%
18.7%
12.5%
3.2%10.4%
9%

Distribution channel Distribution channel (annual)
37
Cathay Century – Distribution channel
Cathay P&C agentsCathay group channel
Affiliate channels
Benefiting from cross-selling synergy, over 60% of premium income was generated by the group’s channel.
63.5% 61.6%
36.3% 38.2%
0.2% 0.2%
9M19 9M20
62.2% 62.9% 63.2% 63.7%
37.6% 36.9% 36.6% 36.1%
0.2% 0.2% 0.3% 0.3%
FY16 FY17 FY18 FY19

50.3% 53.5%
31.5% 31.3%
81.8% 84.8%
FY18 FY19
57.4% 58.4%
34.8% 34.6%
92.2% 93.0%
FY18 FY19
51.8% 52.1%
31.4% 31.1%
83.2% 83.2%
9M19 9M20
57.4% 57.1%
34.9% 34.6%
92.3% 91.7%
9M19 9M20
Gross combined ratio Retained combined ratio
38
Cathay Century – Combined ratio
Gross expense ratioGross loss ratio
Retained expense ratioRetained loss ratio
Gross combined ratio and retained combined ratio remained stable.

Introduction of Cathay FHC
9M20 Business Overview
Overseas Expansion
Business Performance Summary
Cathay United BankCathay LifeCathay Century
Cathay’s CSR Efforts Appendix
39
Agenda

Well-recognized corporate sustainability performance
Note: The FTSE4Good TIP Taiwan ESG Index is designed by FTSE Russell and Taiwan Index Plus Corp (TIP), wholly-owned subsidiary of Taiwan Stock Exchange.
Recognized by local regulatory authorities
Recognized by Media
Top 10 World Corporate Citizen for 7consecutive years, Top 4 in 2019
Recognized by ESG ratings agencies
Top 5 % Corporate Governance
Over 1,000 listed companies
TWSE Corporate Governance Evaluation
Included in FTSE4Good TIP Taiwan ESG Index
since 2017
Included in DJSI World & DJSI EM
Corporate Governance Award
Exemplary AwardCSR Annual Survey (Finance Division)
AESG Corporate Awards
Platinum
40

Cathay integrates sustainability into major three business groups in accordance with the international sustainable frameworks.
Integrating sustainability into our business
In 2016, Cathay Life was the first Taiwanese life insurer voluntarily complying with the PSI.
Cathay Century P&C Insurance also followed PSI framework in 2017.
CUB was the first Taiwanese bank signing the Equator Principles (EPs) in 2015.
In 2018, CUB commits to self-comply with PRB to strengthen corporate sustainability.
Conning Inc., fully owned by Cathay FHC, is the PRI signatory.
Conning’s subsidiary Octagon Credit Investors also became PRI signatory in 2020.
Corporate Sustainability (CS) team in Cathay Life & Cathay Century Insurance
Sustainable Finance Management Section in Cathay United Bank
Responsible investments team under Cathay FHC CS committee
Insurance
PSI
Cathay FHC
EPs
Banking
PRI
Asset Management
Key initiatives
Team in-charge
PRB
41

Integrating ESG issues into all business processes
Integrating ESG into Business Process
•Consider ESG emerging risks • Improve the
management of climate risk and opportunity by following TCFD framework• Set
investment/ lending limits and management procedures
• Fintech and one-stopservice• Strengthen the
green finance and inclusive finance services• Integrate ESG
issues to the underwriting and lending processes
•Paperless operations and Fintech•GHG inventory
and carbon emission reduction•Water and
waste control
•Review the product details and offer flexibility to customers when significant ESG incidents occur •Trigger critical
disaster claims mechanism when significant ESG incidents occur •Disclose EPs
projects
•Exclusion policy•ESG
integration • Sustainability
themed investing •Corporate
engagement and shareholders’ actions • Investment
mandate management
Risk Management
Products & Services
OperationAfter-Sales
ManagementInvestment
Business Processes
42

Integrating ESG into responsible investment and lending
43
Investment/ Lending Process Engagements after Investment/ Lending
Negative/ exclusionary screening 1
ESG integration
Investmentdecision
Financialanalysis
ESG factors
Controversialbehaviors
2
Sustainability Themed Investing
Aging society and health
Community and financial Inclusive
Low Carbon and Infrastructure
3
High riskDecline
Moderate riskProceed with conditions
Low riskInvestment/lending
Engagement & shareholder actions
Encourage investees/borrowers to improve transparency
Corporate engagement
Exercise voting rights
4
Mandate investment management
Check whether asset managers are PRI signatories and monitor their responsible investment performance
5

44
Implementing responsible investment across multiple asset classes
Corporate loans under ESG management
Funds and mandate assets under ESG management
Real assets under ESG management
Equities and bonds applicable for exclusion policy
Assets that are defined as themed investment
Equities and bonds applicable for ESG review process
100%
100%
100%
90%
17%
63%
AUM NT$ 6.6 TN
Responsible investment/lending policies
• Responsible Investment and Lending Policy
• Investment and Lending Exclusion Policy
• Stewardship Policy
• Engagement Policy
• Voting Policy
• Rules Governing Project Finance and Equator Principles
• Responsible Property Investment and Management Policy
NT$6.6 TN assets under responsible investment and lending

45
Cathay FHC was the only Taiwan financial institution to join the Low Carbon Investment Registry initiated by GIC in 2014.
The low carbon investment amount registered in 2019 reached US$ 5.49 billion.
Participated in “Global Investor Statement to Governments on Climate Change” since 2014, urging governments of the G7 and G20 nations to fulfill their commitments to Paris Agreement.
Signed “The Investor Agenda” in 2018 to support low carbon investment, corporate engagement, TCFD climate disclosures and policy advocacy.
Supported TCFD initiative since 2018, actively managing climate-related risks.
Low Carbon Investment Registry
Climate Governance Initiatives
Cathay FHC joined AIGCC in 2016 and participates in the monthly conference calls discussing global trends in climate change.
Sophia Cheng, CIO of Cathay FHC, was appointed as the chair of AIGCC in November 2018.
Asia Investor Group on Climate Change (AIGCC)
Actively participating in Global ESG initiatives

46
Engaging with investee companies of ESG improvement
More than 500 signatories with AUM over USD 47 trillion have joined Climate Action 100+ to engage 100 systemically important emitters and encourage them to curb emissions, improve governance and strengthen climate-related financial disclosures. Cathay Life and Cathay SITE are only two signatories in Taiwan.
Cathay has been engaging with Taiwanese companies.
The only financial institution in Taiwan has participated in the CDP non-discloser engagement campaign for 3 consecutive years, encouraging Cathay‘s investee companies to respond to CDP questionnaires.
Cathay’ response rate in 2017 and 2018 was higher than the overall response rate.The response rate in 2019 ranked top 9 globally.
CDP non-disclosure campaign
Investee engagement
Engagement policies and strategies
Cathay defined “climate change” and “ESG” as the main engagement strategy.
Aimed to strengthen Taiwan corporates’ awareness and capability in response to climate risks and opportunities.
Urged Taiwan corporates to enhance ESG disclosures in line with global standards.

Bring positive environmental impact by solar & wind power loan
47
Cumulative insured amount for hydroelectric power plants, solar power plants, and offshore wind farms constructions and equipment
Environment Impact
Total installed capacity of solar power and wind turbines financing as of the end of 2019
1,285MW
Expected CO2 emissions reduction per years
1.6 millionMetric tons
Carbon emissions reduced by solar power devices and offshore wind turbines in 2019 equal to carbon absorption of Da’an Forest Park
4,283Da’an Forest Parks
91.3 billion
Green vehicles insured as of 2019
Public bicycles riders insured as of 2019
21,832Green vehicles
17.2 millionBicycle riders
Solar Power
Wind Power
Green Insurance
1861
120178
216288
361
477517
2011 2012 2013 2014 2015 2016 2017 2018 2019

Commitment to TCFD implementation
2018
TCFD released final Recommendations report
Signed on TCFD initiative and committed to disclose climate-related information align with TCFD recommendations.Benchmark global best practices on TCFD implementation.
2018/05
2015/12
Cathay FHC worked with consultants to build climate-related governance and strategies, identify climate risks/opportunities, and worked on scenario analysis.
…
Supported by global companies and investors
CEO appointed the Chief Risk Officer (CRO) to supervise and manage climate-related risks in assets and liabilities.2018/11
Cathay established TCFD task force led by the CRO to manage the impact of climate-related risks on important assets and products.
2018/12
Cathay TCFD task force reported scheduled milestone and communicated with external stakeholders.2019/04
Cathay TCFD task force planned to put emphasis on comprehensive quantitative analysis and scenario analysis of climate risks, and to incorporate the results of these analysis to improve management processes.
2019/08
Submitted climate-related risk supervision results to the Board of Directors.
How companies can engage in TCFD initiative:
1. Agree with the wording of the commitment2. Sign the commitment3. Report climate-related financial information
following the TCFD recommendations as fully as practicable within 3 years
4. Use the CDSB Framework or other applicable reporting frameworks for disclosure
48
2017
2018/02
Financial Stability Board (FSB) established TCFD
2019
2020

Integrating climate risks/opportunities into businesses
Corporate lending Self-owned real estate & mortgages
Responsible securities Life & property insurance Products
TCFD riskAssessment &management
Responsible lending process
Automated ESG Risk ratingand management mechanism
Stress testImplemented internal carbonpricing to assess the potential
impact of high carbon emission customers
Carbon footprint
Stewardship
Asset allocation
• Identify high risk investee by calculating the carbon foot printing
• Set climate change as the topic of engagement
• Active management for fiduciaries to consider climate-related factors when making investments
• ESG risk review process• Low-carbon investments• Continue to look into
industries with high climate-related risks
Product pricing and exposure
calculation
Regular assessments using natural catastrophe
model
Risk management and product
design feedback
Climate impact
Temperature rise
typhoon
Assessment ofclimate-related risks
Reinsurance for risk dispersion
Product pricing adequacy evaluation
49
Identification
Management Response
Assessment
Physical risks to real estate caused by
typhoons and floods
Loss estimates generated by NATCAT model and scenario
analysis
Implemented visualizedsystem and management
Exclusion of high risk areas and insurance for high value assetsTransition Risk
Physical Risk

Introduction of Cathay FHC
9M20 Business Overview
Overseas Expansion
Business Performance Summary
Cathay United BankCathay LifeCathay Century
Cathay’s CSR Efforts Appendix
50
Agenda

Embedded Value & Appraisal Value
51
NT$BN, except for per share figures
Valuation date 2018/12/31 2019/12/31
In-force business investment yield
3.95% ~ Year 2038 5.00%for NTD policies
4.64% ~ Year 2038 5.78%for USD policies
(Equivalent investment yield: 4.38%Rolling over to 2019: 4.44%)
3.57% ~ Year 2039 4.61%for NTD policies
4.36% ~ Year 2039 5.24%for USD policies
(Equivalent investment yield: 3.86%)
Risk discount rate 10% 9.5%Adjusted net worth 387 621
Value of in-force business 722 550Cost of capital (CoC) -210 -236
Value of in-force business (After CoC) 512 314Embedded Value (EV) 898 935
EV / per share 156.9 (71.5) 159.8 (74.1)
Future one year’s new businessinvestment yield
3.13%~ Year 2038 4.86%for NTD policies
4.66% ~ Year 2038 5.79%for USD policies
2.41%~ Year 2039 4.35%for NTD policies
3.86% ~ Year 2039 5.15%for USD policies
Value of future one year’snew business (After CoC) 52.0 35.0
Appraisal Value (AV) 1,351 1,242AV / per share 235.9 (107.5) 212.3 (98.4)
Note: (1) EV/AV calculation does not include business of Cathay Life in China and Vietnam.(2) per share = per share of Cathay Life; (per share) = per share of Cathay FHC(3) The outstanding shares of Cathay Life in 2018 and 2019 are 5.73bn and 5.85bn, respectively. (4) The outstanding shares of Cathay FHC in 2018 and 2019 are 12.56bn and 12.62bn, respectively.(5) May not sum to total due to rounding.
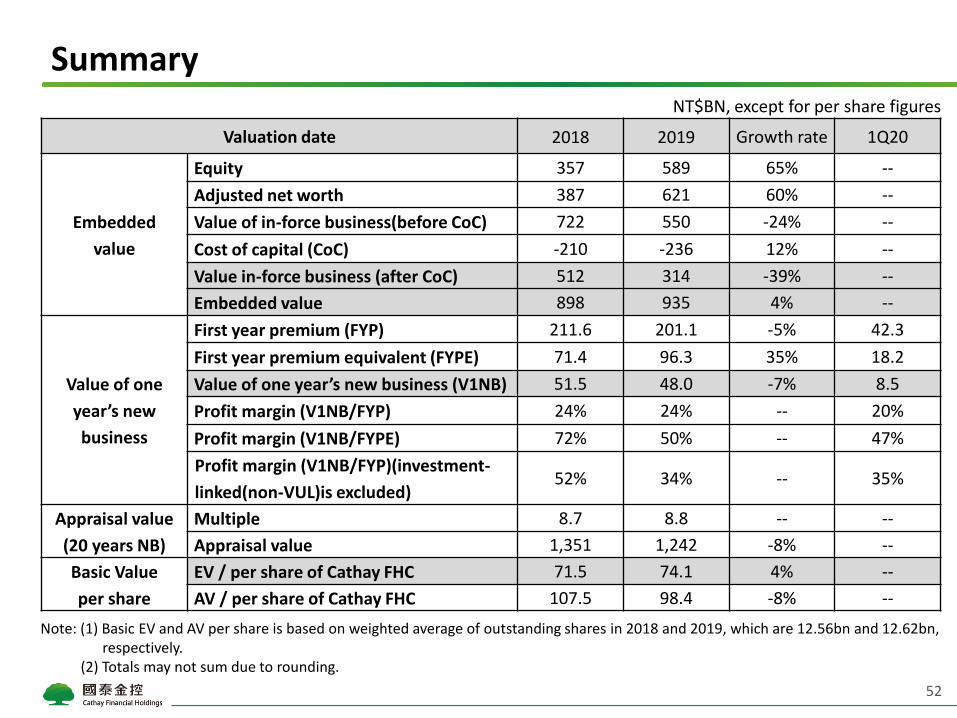
Summary
52
Valuation date 2018 2019 Growth rate 1Q20
Embedded
value
Equity 357 589 65% --
Adjusted net worth 387 621 60% --
Value of in-force business(before CoC) 722 550 -24% --
Cost of capital (CoC) -210 -236 12% --
Value in-force business (after CoC) 512 314 -39% --
Embedded value 898 935 4% --
Value of one
year’s new
business
First year premium (FYP) 211.6 201.1 -5% 42.3
First year premium equivalent (FYPE) 71.4 96.3 35% 18.2
Value of one year’s new business (V1NB) 51.5 48.0 -7% 8.5
Profit margin (V1NB/FYP) 24% 24% -- 20%
Profit margin (V1NB/FYPE) 72% 50% -- 47%
Profit margin (V1NB/FYP)(investment-
linked(non-VUL)is excluded)52% 34% -- 35%
Appraisal value
(20 years NB)
Multiple 8.7 8.8 -- --
Appraisal value 1,351 1,242 -8% --
Basic Value
per share
EV / per share of Cathay FHC 71.5 74.1 4% --
AV / per share of Cathay FHC 107.5 98.4 -8% --
NT$BN, except for per share figures
Note: (1) Basic EV and AV per share is based on weighted average of outstanding shares in 2018 and 2019, which are 12.56bn and 12.62bn, respectively.
(2) Totals may not sum due to rounding.

Investment return assumptions for the value of in force business of NTD-denominated policies as of the
end of 2018 & 2019.
Investment return assumptions for the value of in force business of USD-denominated policies as of the
end of 2018 & 2019.
Economic Assumptions:In-force business investment yield
53

54
Economic Assumptions:Future one year’s new business investment yield Investment return assumptions for the value of future one year’s new business of NTD-denominated
policies as of the end of 2018 & 2019.
Investment return assumptions for the value of future one year’s new business of USD-denominated
policies as of the end of 2018 & 2019.
policy year
policy year
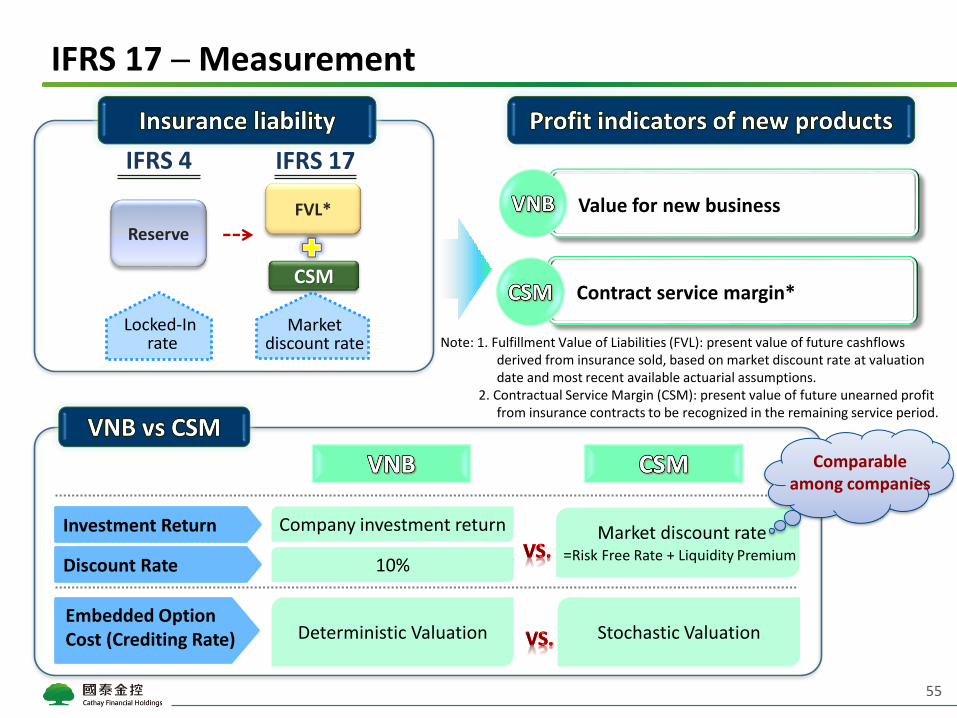
IFRS 17 ─ Measurement
55
Value for new business
Contract service margin*
Note: 1. Fulfillment Value of Liabilities (FVL): present value of future cashflows derived from insurance sold, based on market discount rate at valuation date and most recent available actuarial assumptions.
2. Contractual Service Margin (CSM): present value of future unearned profit from insurance contracts to be recognized in the remaining service period.
Investment Return
Comparable among companies
Embedded Option Cost (Crediting Rate)
Discount Rate
Reserve
Locked-Inrate
CSM
IFRS 4 IFRS 17
FVL*
Market discount rate

IFRS 17 – Adoption date
56
Retrospect IFRS17 to policy underwriting date. This
requires full historic data throughout adoption date
Retrospective Approach
The impact of legacy book can be offset by
new book
Fair Value Approach
Use reasonable and supportable
information to derive similar results to
Retrospective Approach
Modified Retrospective Approach
Apply “Modified Retrospective “ or “Fair Value” Approach
If Impracticable
Note: Legacy book - contracts with guaranteed rates ≥ 4%
Note: New book - contracts with guaranteed rates <4%

Accounting impact from IFRS 17
IFRS 17 implementation changes the measurement of insurance liability. It does not affect the value of insurance contracts but affects the timing of profit recognition for insurance services.
Insurers need to mark to market both assets and liabilities.
It may increase the volatility of shareholders’ equity, hence asset-liability management expertise is critical.
57

58
IFRS 17 impact & preparation
Capital plan
Value-driven product strategy CSM-focused products
The impact from legacy book is fully reflected on adoption date Reduce the interest expense of insurance liability thereafter
12
3
Cathay
Competitor
Capital market volatility and IFRS 17 adoption
Build adequate capital buffer Early preparation ahead of the industry
Protection products with superior CSM margin (CSM/FYP) Savings products with positive CSM
Better risk-pricing disciplines among competitors restore industry profit margins Strong ALM expertise is critical for achieving stable financial performance
Healthier Industry development
Benefiting from IFRS 17
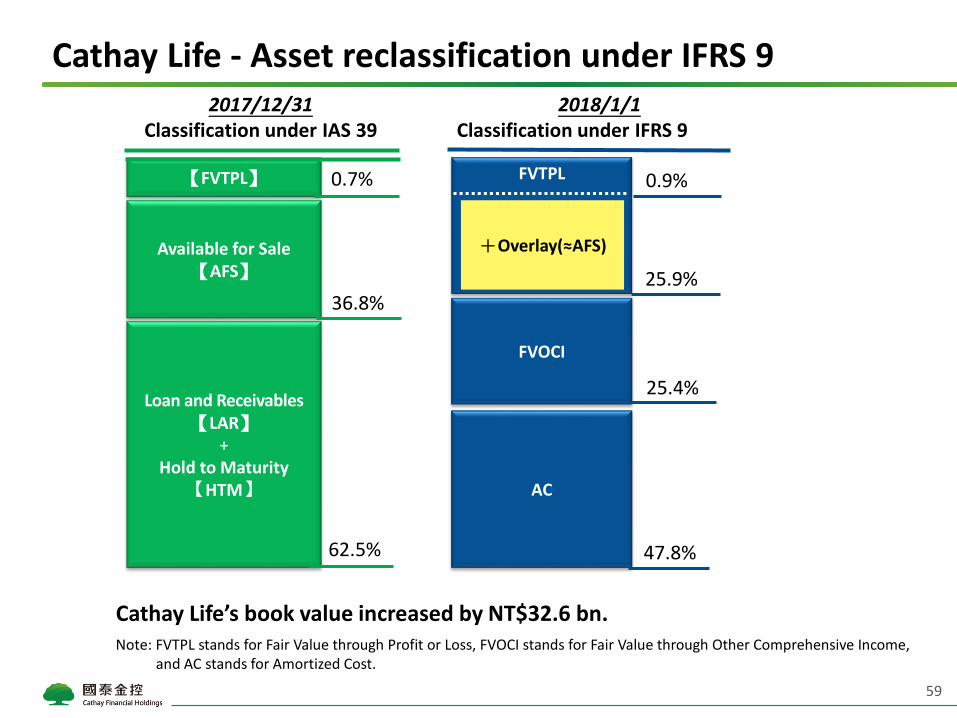
Cathay Life - Asset reclassification under IFRS 9
FVTPL
FVOCI
AC
0.9%
25.9%
25.4%
47.8%
+Overlay(≈AFS)
Loan and Receivables【LAR】
+Hold to Maturity
【HTM】
Available for Sale【AFS】
【FVTPL】 0.7%
36.8%
62.5%
Note: FVTPL stands for Fair Value through Profit or Loss, FVOCI stands for Fair Value through Other Comprehensive Income, and AC stands for Amortized Cost.
Cathay Life’s book value increased by NT$32.6 bn.
2017/12/31Classification under IAS 39
2018/1/1Classification under IFRS 9
59

Note: SPPI means cash flow are solely payments of the principal and interests on the principal amount outstanding. Interests consist of the consideration of time value and credit risk associated with the principal.
Asset classification under IFRS 9 with overlay approach
Debt Equity
‘Contractual cash flow characteristic’ test (SPPI test)*
‘Business model’ assessment
If designating to value at fair value
Amortized Cost
FVOCI(with recycling)
FVTPLFVOCI
(no recycling)
Held for trading
If recognizing volatility of fair value to OCI
(FVOCI option)
Eligible for overlay approach if the asset is not FVTPL under IAS 39
Held-to-Collect contractual cash flow
Held-to-Collect contractual cash flow & sell
Neither 1 or 2
1 2
PASS
FAIL Yes
No
Yes
No
Yes
No No
60
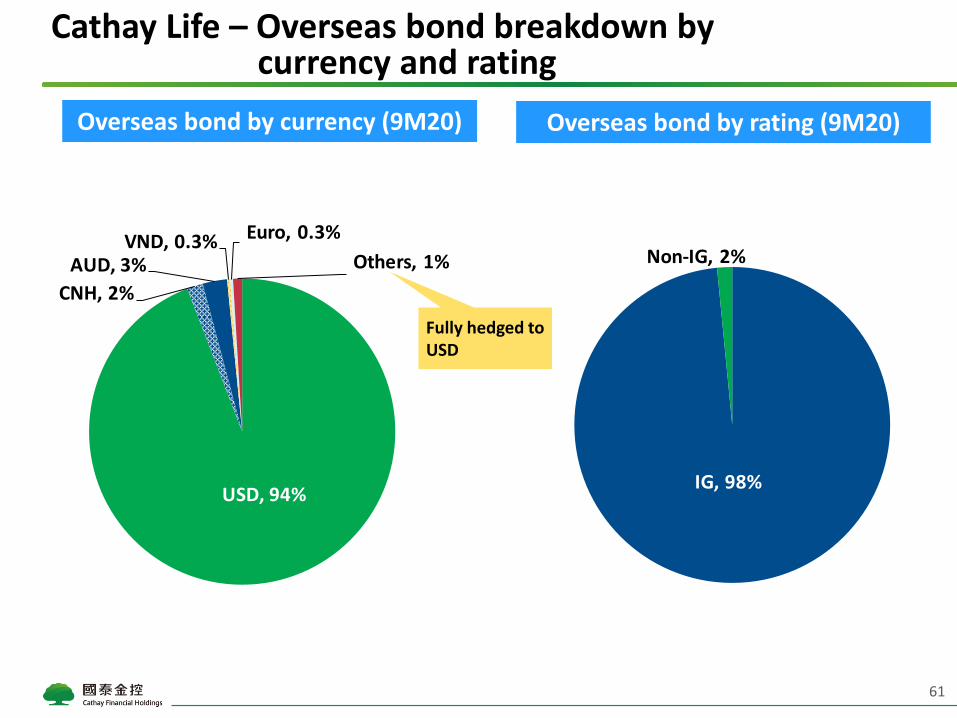
IG, 98%
Non-IG, 2%
USD, 94%
CNH, 2%
AUD, 3%VND, 0.3% Euro, 0.3%
Others, 1%
61
Cathay Life – Overseas bond breakdown by currency and rating
Overseas bond by currency (9M20) Overseas bond by rating (9M20)
Fully hedged to USD

309.5 291.7
346.0 346.8
FY17 FY18 FY19 1H20
141.1
127.1
139.0 132.8
FY17 FY18 FY19 1H20
11.7 11.8 12.3 12.7
4.2 3.1 2.8 2.6
FY17 FY18 FY19 1H20
62
Capital adequacy
CUB Capital Adequacy (%)
Cathay FHC CAR (%)15.9 15.0 15.3
Tier2
Tier1
BIS 15.1
Cathay Life RBC (%)
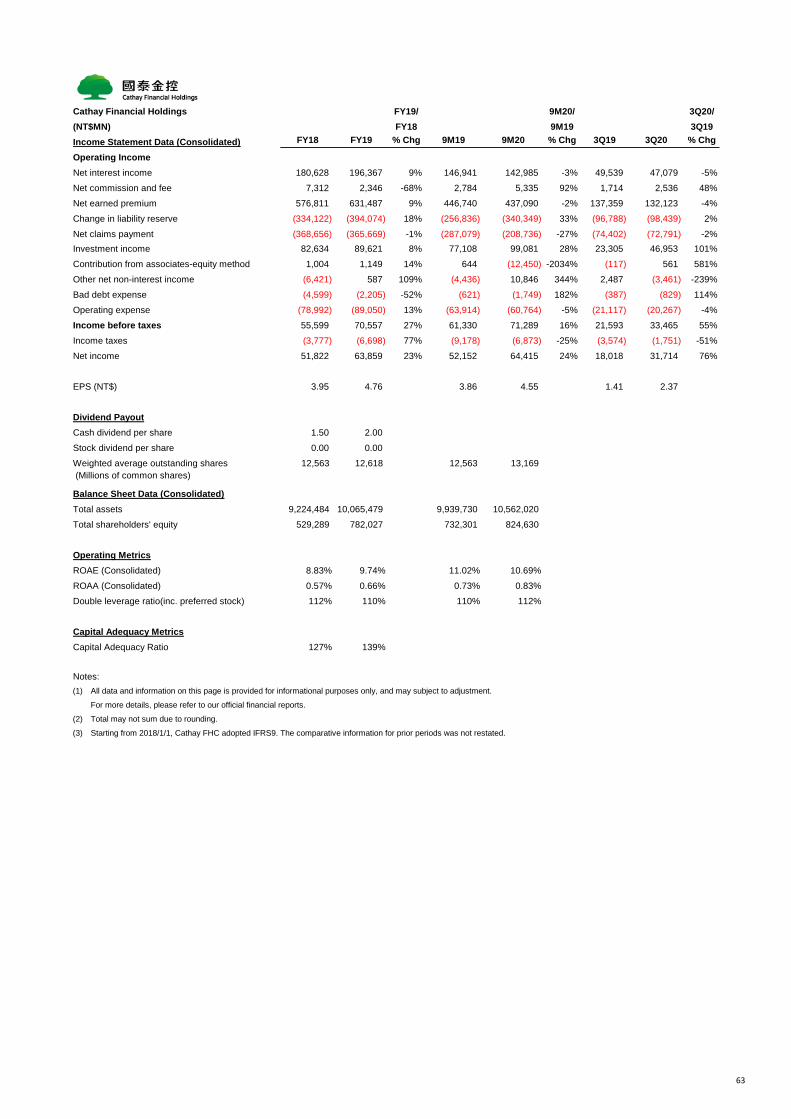
Cathay Financial Holdings FY19/ 9M20/ 3Q20/
(NT$MN) FY18 9M19 3Q19
Income Statement Data (Consolidated) FY18 FY19 % Chg 9M19 9M20 % Chg 3Q19 3Q20 % Chg
Operating Income
Net interest income 180,628 196,367 9% 146,941 142,985 -3% 49,539 47,079 -5%
Net commission and fee 7,312 2,346 -68% 2,784 5,335 92% 1,714 2,536 48%
Net earned premium 576,811 631,487 9% 446,740 437,090 -2% 137,359 132,123 -4%
Change in liability reserve (334,122) (394,074) 18% (256,836) (340,349) 33% (96,788) (98,439) 2%
Net claims payment (368,656) (365,669) -1% (287,079) (208,736) -27% (74,402) (72,791) -2%
Investment income 82,634 89,621 8% 77,108 99,081 28% 23,305 46,953 101%
Contribution from associates-equity method 1,004 1,149 14% 644 (12,450) -2034% (117) 561 581%
Other net non-interest income (6,421) 587 109% (4,436) 10,846 344% 2,487 (3,461) -239%
Bad debt expense (4,599) (2,205) -52% (621) (1,749) 182% (387) (829) 114%
Operating expense (78,992) (89,050) 13% (63,914) (60,764) -5% (21,117) (20,267) -4%
Income before taxes 55,599 70,557 27% 61,330 71,289 16% 21,593 33,465 55%
Income taxes (3,777) (6,698) 77% (9,178) (6,873) -25% (3,574) (1,751) -51%
Net income 51,822 63,859 23% 52,152 64,415 24% 18,018 31,714 76%
EPS (NT$) 3.95 4.76 3.86 4.55 1.41 2.37
Dividend Payout
Cash dividend per share 1.50 2.00
Stock dividend per share 0.00 0.00
Weighted average outstanding shares 12,563 12,618 12,563 13,169
(Millions of common shares)
Balance Sheet Data (Consolidated)
Total assets 9,224,484 10,065,479 9,939,730 10,562,020
Total shareholders' equity 529,289 782,027 732,301 824,630
Operating Metrics
ROAE (Consolidated) 8.83% 9.74% 11.02% 10.69%
ROAA (Consolidated) 0.57% 0.66% 0.73% 0.83%
Double leverage ratio(inc. preferred stock) 112% 110% 110% 112%
Capital Adequacy Metrics
Capital Adequacy Ratio 127% 139%
Notes:
(1) All data and information on this page is provided for informational purposes only, and may subject to adjustment.
For more details, please refer to our official financial reports.
(2) Total may not sum due to rounding.
(3) Starting from 2018/1/1, Cathay FHC adopted IFRS9. The comparative information for prior periods was not restated.
63

Cathay Life FY19/ 9M20/ 3Q20/
(NT$MN) FY18 9M19 3Q19
Income Statement Data (Consolidated) FY18 FY19 % Chg 9M19 9M20 % Chg 3Q19 3Q20 % Chg
Net written premium 559,386 608,641 9% 430,348 420,602 -2% 131,838 126,526 -4%
Net earned premium 558,929 607,820 9% 430,221 420,714 -2% 131,601 126,488 -4%
Reinsurance commission earned 762 356 -53% 22 13 -42% 8 6 -29%
Fee income 9,148 8,450 -8% 6,229 6,410 3% 2,162 2,231 3%
Recurring investment income 197,281 228,037 16% 180,523 163,112 -10% 70,256 57,286 -18%
Gain on disposal of investment
Realized gain (loss)-Equity 49,374 38,929 -21% 28,718 58,509 104% 2,936 22,862 679%
Realized gain (loss)-Debt 15,092 36,365 141% 21,970 54,175 147% 8,141 15,665 92%
Gain on investment property (740) 912 223% 622 1,882 203% (5) (16) -223%
FX and others, net (44,019) (61,689) -40% (46,247) (73,083) -58% (17,275) (15,525) 10%
Investment income, net 216,988 242,553 12% 185,585 204,595 10% 64,053 80,273 25%
Other operating income 5,508 6,107 11% 4,406 5,418 23% 1,463 2,245 53%
Separate account revenues 28,084 63,653 127% 46,299 33,215 -28% 7,629 22,543 195%
Net claims payment (357,244) (349,158) -2% (275,855) (197,282) -28% (70,501) (68,911) -2%
Changes in liability reserves (333,716) (393,679) 18% (256,549) (340,476) 33% (96,663) (98,253) 2%
Acquisition and commission expense (33,900) (43,834) 29% (29,801) (26,138) -12% (9,334) (8,317) -11%
Other operating costs (7,765) (6,394) -18% (4,375) (5,291) 21% (1,464) (2,093) 43%
Financial cost (2,331) (2,730) 17% (2,026) (1,767) -13% (750) (727) -3%
Separate account expense (28,084) (63,653) 127% (46,299) (33,215) -28% (7,629) (22,543) 195%
Operating expense (29,165) (30,692) 5% (22,846) (21,934) -4% (7,630) (7,352) -4%
Net non-operating income 1,312 1,710 30% 1,195 1,197 0% 334 348 4%
Income taxes 1,773 (2,216) 225% (5,629) (610) -89% (2,498) (880) -65%
Net income 30,297 38,293 26% 30,577 44,848 47% 10,783 25,058 132%
Balance Sheet Data
Total assets 6,391,395 7,085,624 6,945,778 7,426,199
General account 5,844,430 6,478,081 6,353,155 6,834,164
Separate account 546,964 607,542 592,623 592,036
Reserves for life insurance liabilities 5,313,167 5,683,424 5,583,924 5,977,033
Total liabilities 6,029,265 6,491,106 6,384,654 6,777,799
Total shareholders' equity 362,129 594,518 561,125 648,400
Operating Metrics (Standalone)
First Year Premium(FYP) 211,588 201,064 145,456 122,546
First Year Premium Equivalent(FYPE) 71,372 96,313 67,021 51,135
Expense ratio 9.6% 10.6% 10.6% 9.7%
13-M persistency ratio 98.4% 98.0% 98.0% 98.1%
25-M persistency ratio 94.7% 96.4% 96.5% 95.6%
ROAE 7.25% 8.01% 8.83% 9.62%
ROAA 0.48% 0.57% 0.61% 0.82%
Capital Adequacy Metrics (Standalone)
RBC ratio 292% 346%
Notes:
(1) All data and information on this page is provided for informational purposes only, and may subject to adjustment.
For more details, please refer to our official financial reports.
(2) Total may not sum due to rounding.
(3) Starting from 2018/1/1, Cathay Life adopted IFRS9. The comparative information for prior periods was not restated.
64
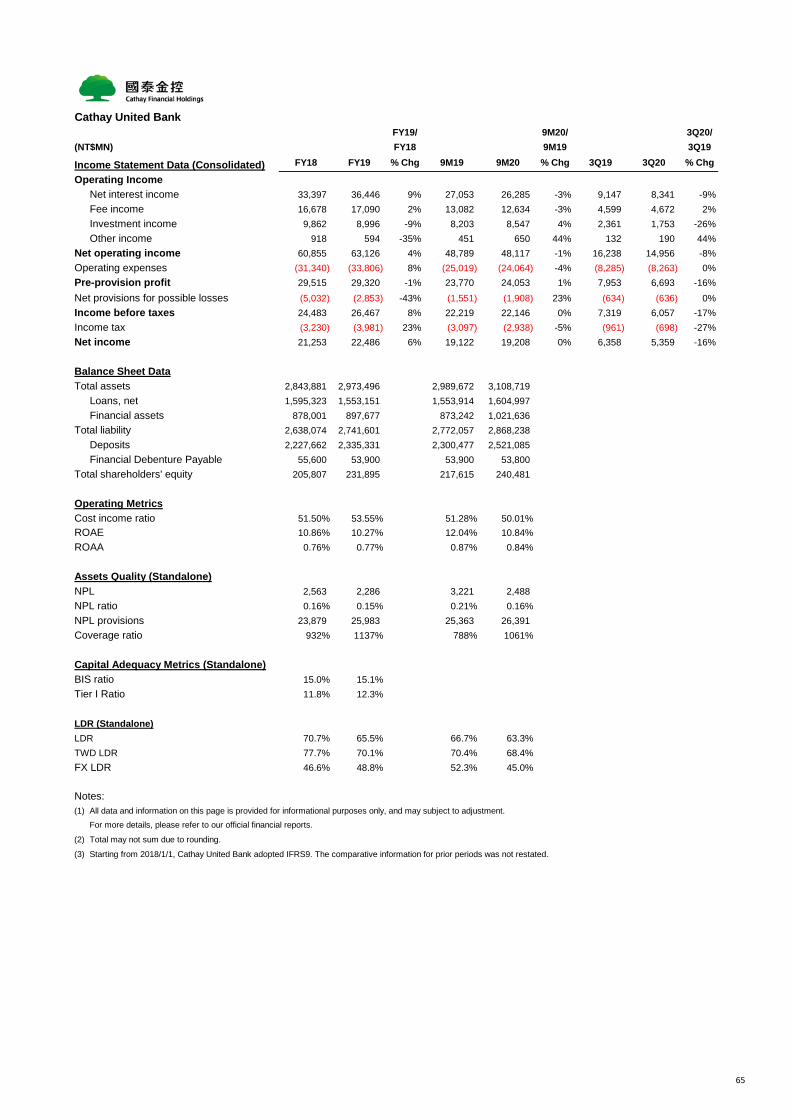
Cathay United Bank
FY19/ 9M20/ 3Q20/
(NT$MN) FY18 9M19 3Q19
Income Statement Data (Consolidated) FY18 FY19 % Chg 9M19 9M20 % Chg 3Q19 3Q20 % Chg
Operating Income
Net interest income 33,397 36,446 9% 27,053 26,285 -3% 9,147 8,341 -9%
Fee income 16,678 17,090 2% 13,082 12,634 -3% 4,599 4,672 2%
Investment income 9,862 8,996 -9% 8,203 8,547 4% 2,361 1,753 -26%
Other income 918 594 -35% 451 650 44% 132 190 44%
Net operating income 60,855 63,126 4% 48,789 48,117 -1% 16,238 14,956 -8%
Operating expenses (31,340) (33,806) 8% (25,019) (24,064) -4% (8,285) (8,263) 0%
Pre-provision profit 29,515 29,320 -1% 23,770 24,053 1% 7,953 6,693 -16%
Net provisions for possible losses (5,032) (2,853) -43% (1,551) (1,908) 23% (634) (636) 0%
Income before taxes 24,483 26,467 8% 22,219 22,146 0% 7,319 6,057 -17%
Income tax (3,230) (3,981) 23% (3,097) (2,938) -5% (961) (698) -27%
Net income 21,253 22,486 6% 19,122 19,208 0% 6,358 5,359 -16%
Balance Sheet Data
Total assets 2,843,881 2,973,496 2,989,672 3,108,719
Loans, net 1,595,323 1,553,151 1,553,914 1,604,997
Financial assets 878,001 897,677 873,242 1,021,636
Total liability 2,638,074 2,741,601 2,772,057 2,868,238
Deposits 2,227,662 2,335,331 2,300,477 2,521,085
Financial Debenture Payable 55,600 53,900 53,900 53,800
Total shareholders' equity 205,807 231,895 217,615 240,481
Operating Metrics
Cost income ratio 51.50% 53.55% 51.28% 50.01%
ROAE 10.86% 10.27% 12.04% 10.84%
ROAA 0.76% 0.77% 0.87% 0.84%
Assets Quality (Standalone)
NPL 2,563 2,286 3,221 2,488
NPL ratio 0.16% 0.15% 0.21% 0.16%
NPL provisions 23,879 25,983 25,363 26,391
Coverage ratio 932% 1137% 788% 1061%
Capital Adequacy Metrics (Standalone)
BIS ratio 15.0% 15.1%
Tier I Ratio 11.8% 12.3%
LDR (Standalone)
LDR 70.7% 65.5% 66.7% 63.3%
TWD LDR 77.7% 70.1% 70.4% 68.4%
FX LDR 46.6% 48.8% 52.3% 45.0%
Notes:
(1) All data and information on this page is provided for informational purposes only, and may subject to adjustment.
For more details, please refer to our official financial reports.
(2) Total may not sum due to rounding.
(3) Starting from 2018/1/1, Cathay United Bank adopted IFRS9. The comparative information for prior periods was not restated.
65

Cathay Century
FY19/ 9M20/ 3Q20/
(NT$MM) FY18 9M19 3Q19
Income Statement Data (Consolidated) FY18 FY19 % Chg 9M19 9M20 % Chg 3Q19 3Q20 % Chg
Premium income 23,186 25,343 9% 18,194 18,436 1% 6,029 6,045 0%
Net written premium 17,797 19,550 10% 13,952 14,132 1% 4,720 4,777 1%
Net earned premium 17,349 19,077 10% 13,881 14,086 1% 4,806 4,718 -2%
Reinsurance commission earned 556 572 3% 427 412 -4% 129 128 0%
Fee income 43 42 -1% 33 35 7% 10 11 7%
Investment 640 1,020 59% 764 950 24% 363 535 48%
Interest income 559 555 -1% 411 417 1% 142 136 -4%
Other investment income, net 81 465 473% 352 533 51% 220 399 81%
Other operating income 0 0 0% 0 0 0% 0 0 0%
Net claims payment (9,408) (10,321) 10% (7,482) (7,938) 6% (2,583) (2,588) 0%
Changes in liability reserves (406) (395) -3% (287) 127 -144% (124) (186) 49%
Commissions and other operating costs (3,043) (3,409) 12% (2,394) (2,446) 2% (825) (804) -3%
Operating expenses (3,848) (4,097) 6% (2,979) (3,033) 2% (1,013) (994) -2%
Operating income 1,883 2,490 32% 1,962 2,193 12% 761 820 8%
Net non-operating income (24) 5 123% (0) 0 231% (0) (0) 59%
Income taxes (349) (389) 11% (314) (326) 4% (110) (83) -25%
Net income 1,510 2,106 40% 1,648 1,867 13% 651 737 13%
Balance Sheet Data
Total assets 37,956 43,008 40,758 41,656
Total stockholders' equity 10,025 12,656 11,946 12,112
Operating Metrics
Gross Combined ratio 81.8% 84.8% 83.2% 83.2%
Net Combined ratio 92.2% 93.0% 92.3% 91.7%
ROAE 14.69% 18.57% 20.00% 20.10%
ROAA 3.96% 5.19% 5.57% 5.88%
Capital Adequacy Metrics
RBC ratio (Standalone) 370% 339%
Notes:
(1) All data and information on this page is provided for informational purposes only, and may subject to adjustment.
For more details, please refer to our official financial reports.
(2) Total may not sum due to rounding.
(3) Starting from 2018/1/1, Cathay Century adopted IFRS9. The comparative information for prior periods was not restated.
66

Disclaimer
This document is provided by Cathay Financial Holding Co., Ltd. (the "Company"). Except for the numbers and information included in the Company's financial
statements, the information contained in this document has not been audited or reviewed by any accountant or independent expert. The Company makes no express
or implied representations or warranties as to the fairness, accuracy, completeness, or correctness of such information or opinions. This document is provided as of
the date herein and will not be updated to reflect any changes hereafter. The Company, its affiliates and their representatives do not accept any responsibility or
liability for any damage caused by their negligence or any other reasons, nor do they accept responsibility or liability for any loss or damages arising from the use of
this document or the information contained herein or anything related to this document.
This document may contain forward-looking statements, including but not limited to all statements that address activities, events or developments that the Company
expects or anticipates to take place in the future based on the projections of the Company toward the future, and various factors and uncertainness beyond the
Company's control. Therefore, the actual results may differ materially from those contained in the forward-looking statements.
This document is not and cannot be construed as an offer to purchase or sell securities or other financial products or solicitation of an offer.
This document may not be directly or indirectly reproduced, redistributed or forwarded to any other person and may not be published in whole or in part for any
purpose.