#2021-016 - unu-merit
TRANSCRIPT

#2021-016
Will the AI revolution be labour‐friendly? Some micro evidence from the supply side G. Damioli, V. Van Roy, D. Vertesy and M. Vivarelli
Published 20 April 2021 Maastricht Economic and social Research institute on Innovation and Technology (UNU‐MERIT) email: [email protected] | website: http://www.merit.unu.edu Boschstraat 24, 6211 AX Maastricht, The Netherlands Tel: (31) (43) 388 44 00

UNU-MERIT Working Papers ISSN 1871-9872
Maastricht Economic and social Research Institute on Innovation and Technology UNU-MERIT UNU-MERIT Working Papers intend to disseminate preliminary results of research carried out at UNU-MERIT to stimulate discussion on the issues raised.

1
Will the AI revolution be labour-friendly?
Some micro evidence from the supply side
G. Damiolia, V. Van Roya, D. Vertesyb, c, M. Vivarellic, d
a European Commission, Joint Research Centre b International Telecommunication Union c UNU-MERIT, Maastricht d Catholic University of Milan, Italy
Abstract
This study investigates the possible job-creation impact of AI technologies, focusing on the supply side, namely the providers of the new knowledge base. The empirical analysis is based on a worldwide longitudinal dataset of 3,500 front-runner companies that patented the relevant technologies over the period 2000-2016. Obtained from GMM-SYS estimates, our results show a positive and significant impact of AI patent families on employment, supporting the labour-friendly nature of product innovation in the AI supply industries. However, this effect is small in magnitude and limited to service sectors and younger firms, which are the leading actors of the AI revolution. Finally, some evidence of increasing returns seems to emerge; indeed, the innovative companies which are more focused on AI technologies are those obtaining the larger impacts in terms of job creation. Keywords: Innovation, technological change, patents, employment, job-creation. JEL classification: O33 Acknowledgements: The authors are grateful to the participants of the Workshop “The Economics and Management of AI Technologies” (Bureau d'Economie Théorique et Appliquée, Université de Strasbourg) and of the GLO Virtual Seminar. Giacomo Damioli acknowledges financial support from the European Union’s Horizon 2020 Framework Programme under the ‘Innova Measure IV’ project (Grant agreement no. 857088). Marco Vivarelli acknowledges the support by the Italian Ministero dell’Istruzione, dell’Università e della Ricerca (PRIN-2017, project 201799ZJSN: “Technological change, industry evolution and employment dynamics”; principal investigator: Marco Vivarelli).
Disclaimer: The scientific output expressed here does not imply a policy position of the European Commission or the International Telecommunication Union and their Member States. Neither the European Commission nor any person acting on behalf of the Commission is responsible for the use that might be made of this study.
Corresponding author: Giacomo Damioli, European Commission, Joint Research Centre, Ispra, Italy - [email protected]

2
1. Introduction
The past two decades have witnessed major developments in artificial intelligence (AI) technologies. Similar to previous technological revolutions - as the diffusion of the ICTs in the last decades of the past century - AI displays a remarkable disrupting potential across firms, industries, economies and societies.
In particular, the possible adverse impact of AI diffusion and robotics on employment has generated concerns and vivid discussions in the academic debate and in the society as a whole. Indeed, the arrival of internet of things, self-driving autonomous cars and widespread robots has raised again a fear of a new wave of ‘technological unemployment’. In this vein, according to Brynjolfsson and McAfee (2011 and 2014), the root of the current employment problems is not the Great Recession, but rather a “Great Restructuring” having an ever-bigger impact on jobs, skills, and the whole economy. In fact, AI, self-learning algorithms and human-imitating robots can perform tasks usually requiring human beings’ intelligence and dexterity (such as speech recognition, decision-making advise, disease diagnostics, complex documents translation, performance of unhealthy and dangerous tasks and so forth; see Frey and Osborne 2017). Moreover, Dobbs et al. (2015) from the McKinsey Global Institute estimate that, compared to the industrial revolution of the XIX century, automation and AI’s disruption of society is happening 10 times faster and at 300 times the scale. This kind of disruptive potentiality might affect each job and every task, although ‘matching tasks’ that are close substitutes for capabilities of AI are the most affected group so far (by, for instance, Uber, Airbnb, Linkedin, Amazon; see Ernst et al. 2018).
However, one of the limitations of the current debate and the extant literature (see next section) is their sole focus on the demand side (that is the adoption of AI and robots as labour-saving process innovations in the downstream industries), while there is an obvious gap to be filled with regard to the supply side, that is the possible job-creation effect of AI technologies, conceived as product innovations in the upstream sectors. Indeed, if we adopt a Schumpeterian perspective (see Schumpeter, 1912; Porto et al., 2021), technological change cannot be reduced to labour-saving process innovation. The other side of the coin is the introduction of new products (both in manufacturing and services) which entail the raise of new branches of production and the creation of additional employment opportunities.
As was the case of ICT, AI and robots may be seen at the same time as labour saving process innovations in the user sectors (think, for instance, to the massive adoption of robots in the automotive industry) and as labour-friendly product innovations in the supply industries (think, for instance, to the electronic industry, where robots are produced, or to the scientific and technical services, where AI algorithms are conceived). In this framework, AI products not only entail the emergence of entire new sectors or a substantial expansion of existing ones (such as those related to robotisation), but also the creation of brand-new employment opportunities such as those related to data processing, transactional procedures, customerisation, remote collaboration, etc.
The aim of this study is precisely to assess the possible job-creation impact of AI technologies, focusing on the supply side, namely the providers of the new knowledge base. In more detail, our analysis will be based on a worldwide set of 3,500 front-runner companies that patented the relevant technologies over the 2000-2016 time span. Controlling for the other main drivers of employment at the firm level - namely output, cost of labour and capital formation - our

3
purpose is to detect a possible labour-friendly impact of AI and robots, seen as product innovations within the supply side of the new technologies.1
The paper is organised as follows. Section 2 summarises the extant literature, emphasising its limited focus on the labour-saving impact detectable in the adoption of new technologies. Section 3 describes the microeconometric methodology used in our analysis. Section 4 discusses the data and the sample used for the empirical analysis. Section 5 presents and discusses the main results. Finally, Section 6 wraps up and puts forward some conclusions and tentative policy implications.
2. The literature
As mentioned above, the extant economic literature focuses on the possible labour-saving effect of AI and robots, conceived as process innovation in the user industries. In doing so, recent contributions belong to a long-lasting tradition of studies devoted to the controversial relationship between technology and employment (for a long-term historical analysis, see Staccioli and Virgillito, 2021; for a recent theoretical reprise of the issue, see Acemoglu and Restrepo, 2018 and 2019).
Indeed, the relationship between innovation and employment is a ‘classical’ controversy, where a clash between two views can be singled out. One states that labour-saving innovations create technological unemployment, as a direct effect. The other view argues that product innovations and indirect (income and price) effects can counterbalance the direct effect of job destruction brought about by the process innovations incorporated in new machineries and equipment (for fully articulated surveys, see Pianta, 2005; Vivarelli, 2014; Calvino and Virgillito, 2018; Ugur et al., 2018; Barbieri et al., 2020).
As far as the employment consequences of the current widespread diffusion of AI and robots are concerned, the empirical literature provides both macroeconomic forecasting scenarios and some sectoral and microeconomic evidence.
As far as the macro scenarios are concerned, Frey and Osborne (2017), using a Gaussian process classifier applied to data from O*Net and US Department of Labor, predict that 47% of the occupational categories, mostly middle- and low-skilled professions, are at high risk of being substituted by AI algorithms and robots (including a wide range of service/white-collar/cognitive tasks such as accountancy, health professions, logistics, legal works, translation and technical writing).
However, Arntz et al. (2016 and 2017), proposing the same exercise but using also information on task-content of jobs at individual-level, conclude that only 9% of US jobs are at potential risk of automation. Their main message is that, within the same occupation, some tasks can be automatised while others cannot and therefore the associated job can be preserved.
Extending the analysis to a multi-country approach, Nedelkoska and Quintini (2018) estimate the risk of automation for individual jobs in 32 OECD countries. Their evidence shows that
1 Notice that our research purpose is to investigate the possible labour friendly nature of the new knowledge basis; therefore, our empirical sample does not aim to be representative but is deliberately limited to those companies that are active in AI and robotic patenting.

4
about 14% of jobs are highly automatable (probability of automation over 70%), while another 32% of jobs present a risk of being substituted in between 50 and 70%, pointing to the possibility of significant changes in the way these jobs will be carried out as a result of automation.
At the European level, Pouliakas (2018) - using data on tasks and skill needs collected by the European Skills and Jobs Survey (ESJS) - bundles jobs according to their estimated risk of automation. Following Frey and Osborne (2017) and Nedelkoska and Quintini (2018), the author utilises highly disaggregated job descriptions and shows that 14% of EU adult workers are found to face a very high risk of automation.
Turning our attention to the sectoral and microeconomic evidence, the extant empirical literature has particularly focused on robotisation.
For instance, Acemoglu and Restrepo (2020) investigate the employment effect of the exposure to robots, using the sectoral “International Federation of Robotics” (IFR) data (national penetration rates instrumented by European data). According to their 2SLS estimates, robotisation has a significant negative impact on the change in employment and wages in each US local labour market over the period 1990 -2007. In more detail, they show that one more robot per thousand workers reduces the employment/population ratio by about 0.18/0.34%.
Following the approach adopted by Acemoglu and Restrepo, Chiacchio et al. (2018) apply it in the context of EU labour markets. They assess the impact of industrial robots on employment and wages in 116 NUTS regions of six EU countries, namely Finland, France, Germany, Italy, Spain, and Sweden, largely representative of the European automation. Their results suggest that robot introduction is negatively associated with the employment rate (one more robot per thousand workers reducing the employment/population ratio by about 0.16/0.20%).
Graetz and Michaels (2018) use panel data on robot adoption (IFR and EUKLEMS data to estimate robot density) within industries in 17 countries from 1993 to 2007. Dividing employees in three skills’ groups (namely high-, medium- and low-skilled workers), their estimated employment coefficients for the two higher-skilled groups result positive (but limited in magnitude and not always significant), while the coefficient for the low-skilled workers turns out to be large and negative. However, their main finding is at odds with the studies discussed above, since they conclude that robots do not significantly reduce total employment, although they do reduce the low-skilled workers’ employment share.
Finally, Dauth et al. (2017) propose a local empirical exercise on Germany using IFR data over the 1994-2014 time-span, using a measure of local robot exposure for every region. They find no evidence that robots cause total job losses, although they provide evidence that robots do affect the composition of aggregate employment: while industrial robots have a negative impact on employment in the manufacturing sector, there are positive and significant spillover effects as employment in the non-manufacturing sectors increases and, overall, counterbalances the negative impact in manufacturing.
As obvious on the basis of what discussed so far, the extant literature only focuses on the possibly negative employment impact of AI and (particularly) robots conceived as process innovations, while there is no evidence so far about the possible positive employment effect of these new technologies, considered as product innovations in the supply sectors. This is unfortunate, since product innovations are theoretically considered as drivers of job creation

5
(see Katsoulacos, 1984; Vivarelli, 1995; Edquist et al., 2001) and several empirical studies have provided evidence in support of this view (see Freeman and Soete, 1987 and 1994; Bogliacino and Pianta, 2010; Bogliacino et al., 2012; Van Roy et al., 2018).
However, the labour-friendly impact of product innovations may vary according to their nature. Indeed, new products may be either brand-new entities or substitutes of obsolete ones. If revenues from new products cannibalise the sales of old ones, the net result in terms of employment expansion might be ambiguous. For instance, a new AI algorithm might be alternatively an entire novelty or an advanced substitute of a previous version of a given software package.
In other words the “welfare effect” should be compared with the “substitution effect” (using the terminology originally put forward by Katsoulacos, 1984 and 1986; see also Vivarelli, 1995 and Dosi et al., 2021). Empirically, this means that the expected sign of the correlation between product innovation and employment is positive, but uncertain in magnitude.
The aim of the next sections is to fill the discussed gap in the recent literature devoted to the employment impact of automation, providing some novel evidence on the link between product innovation and employment using longitudinal data from the front-runner companies in patenting AI and robot technologies worldwide.
3. Econometric methodology
Similarly to the prior microeconometric literature investigating the employment effects of technological change using longitudinal firm-level datasets (see Van Reenen, 1997; Lachenmaier and Rottmann, 2011; Bogliacino et al., 2012; Van Roy et al., 2018), we derive our empirical specification from a stochastic version of a standard labour demand, augmented with an innovation proxy. Along these lines, the labour demand function for a panel of firms i over time t is defined as:
𝒍𝒊,𝒕 𝜷𝟏 𝒚𝒊,𝒕 𝜷𝟐 𝒘𝒊,𝒕 𝜷𝟑 𝑰𝒊,𝒕 𝜷𝟒 𝒊𝒏𝒏𝒐𝒗𝒊,𝒕 𝝁𝒊 𝜺𝒊,𝒕 with: i = 1, .., n; t = 1, .., T
(1)
Lower case letters denote natural logarithms, l corresponds to labour (proxied by employment level), y to output (proxied by turnover), w to wages (proxied by labour cost per employee), and I to gross investments (proxied by growth in fixed capital). The labour demand function is augmented with a variable innov capturing technological change due to innovations. Lastly, 𝜇 is an unobserved firm-specific and time-invariant effect and 𝜀 the usual error term.
We subsequently move from this static expression (1) to a dynamic specification as in (2) in order to account for viscosity in labour demand (see Arellano and Bond, 1991; Van Reenen, 1997):
𝒍𝒊,𝒕 𝜶 𝒍𝒊,𝒕 𝟏 𝜷𝟏 𝒚𝒊,𝒕 𝜷𝟐 𝒘𝒊,𝒕 𝜷𝟑 𝑰𝒊,𝒕 𝜷𝟒 𝒊𝒏𝒏𝒐𝒗𝒊,𝒕 𝝁𝒊 𝜺𝒊,𝒕 (2)

6
𝒘𝒊𝒕𝒉: i = 1, .., n; t = 1, .., T
As measure for technological change, we use AI and non-AI patent families (respectively denoted by 𝑃𝑎𝑡 , and 𝑃𝑎𝑡 , ), as outlined in specification (3). In essence, this specification aims to proxy for the technological progress brought about by firms through the development of innovative and marketable (and hence patentable) technologies in AI and non-AI related fields:
𝜷𝟒𝒊𝒏𝒏𝒐𝒗𝒊,𝒕 𝜸 𝑷𝒂𝒕𝒊,𝒕𝑨𝑰 𝜹 𝑷𝒂𝒕𝒊,𝒕
𝑵𝒐𝒏 𝑨𝑰 𝒘𝒊𝒕𝒉: i = 1, .., n; t = 1, .., T
(3)
Dynamic labour demand specifications as in (2) suffer from simultaneity and endogeneity problems, which may lead to a biased estimation of the different covariates if they are not accounted for by the empirical model.2 To tackle both problems, we use a system GMM approach as developed by Blundell and Bond (1998, 2000). The system GMM model employs instrumental variables to provide consistent and efficient estimates when dealing with dynamic panel data, as is the case for our data. In a system of equations (i.e. in level equations and equations in differences), lagged and differenced lagged variables are used to solve for persistency in times series and endogeneity.
Unfortunately, possible problems of endogeneity are not confined to the lagged dependent variable. Other explanatory variables of the labour demand function may also be affected as pointed out in prior literature (e.g. Bogliacino et al., 2012; Van Roy et al., 2018). It might be the case that wage and employment are simultaneously decided, while the output and investment decisions may be jointly affected by a temporary shock. Therefore, in line with previous studies, all the explanatory variables have been considered as potentially endogenous to labour demand and instrumented when needed.
In more detail, in the level equation, we used differenced values of the explanatory variables as instruments, i.e. twice-lagged or thrice-lagged differences in labour demand, AI and non-AI patent families, gross investments and cost of labour. The level equations also include a set of sector, country and year dummies. In the equations in differences we employed twice-lagged or thrice-lagged values of the above-mentioned right-hand side variables as instruments. The lag limits of the instruments were chosen both to satisfy the outcomes of the autocorrelation tests3 and to limit instrument proliferation, as highlighted in Roodman (2009a, b).
2 For instance, a pooled ordinary least squares (POLS) estimation of the labour demand leads to a biased coefficient estimate of the lagged dependent variable, as the firm-specific part of the error term is positively correlated with the lagged dependent variable. 3 Reported in the relevant tables.

7
4. Data and sample
4.1 Data
Our novel dataset is based on a worldwide panel of firms patenting in AI. While traditionally considered as a proper measure of a commercially valuable innovation output (Griliches, 1990; Ernst, 1995), limitations of patents in capturing innovations are well known (e.g. Hussinger, 2006; Hall et al., 2014): for instance, the fact that companies may prefer not to patent their inventions to keep them secret. Moreover, patents better proxy product rather than process innovations, which are often embodied in machineries and can be more easily kept secret than products (Levin et al., 1987; Lissoni et al., 2013). Yet, patents have the appealing advantage to allow identifying on a global scale firms that innovate in AI. Accordingly, an increasing number of studies relies on patents to track and analyse the development and adoption of AI technologies in production processes and their economic consequences (Webb et al., 2018; WIPO, 2019; Baruffaldi et al., 2020; Van Roy et al., 2020; Damioli et al., 2021; Martinelli et al., 2021).
However, the identification of patents related to AI technologies is a challenging task. There are neither an established definition of the boundaries of the AI technological domain, nor an agreed methodology to empirically singling it out. On the one hand, conceptual definitions of AI typically insist on the ability of a system to perform human-like cognitive functions (learning, understanding, reasoning and interacting) aiming to obtain rational outcomes (Ertel, 2018; Russell and Norvig, 2016). On the other hand, albeit AI technologies focus on a core of software technologies including, inter alia, machine learning, neural networks, logic programming and speech recognition, various studies consider a broader definition of AI including a combination of software and hardware components, as well as functional applications such as robots and “big data” (European Commission, 2018; Fujii and Managi, 2018; WIPO, 2019).
Van Roy et al. (2020), on which this study relies upon for the selection of patents, follow the latter more comprehensive view by applying a keyword-based approach consisting in the search for specific terms in the title or the abstract of patents. An analogous approach to select AI patents has been pursued in previous studies on AI and robotics technologies (Keisner et al., 2015; De Prato et al., 2019; European Commission, 2018; Cockburn et al., 2019; WIPO, 2019; Baruffaldi et al., 2020). Some of these studies applied their keywords’ search to patents falling in pre-selected technological classes (Keisner et al., 2015; Cockburn et al., 2019; WIPO, 2019), while others relied on all patents falling in specific technological classes mapping to AI technology areas (e.g. Inaba and Squicciarini, 2017; Fujii and Managi, 2018; OECD, 2017).4
In this study, we rather prefer unrestricting our patents to pre-determined technological classes in reason of the transversal nature of AI technologies that, as any other general-purpose technology, cut through many scientific disciplines and technological domains (Bianchini et al., 2020; WIPO, 2019). Our list of keywords takes stock of the findings of prior relevant literature and is shown in Table A1 in Appendix A.
4 Recent studies (e.g., Bianchini et al., 2020, Baruffaldi et al., 2020) also developed machine learning techniques to parse the corpus of publications and patents in order to identify AI-related content. Yet, such an approach is considered to be still at an initial stage of development requiring further improvements in order to able to provide robust results (Baruffaldi et al., 2020).

8
Text-mining searches have been conducted to retrieve the keywords in either the patent title or the abstract of the Spring 2018 edition of the PATSTAT database of the European Patent Office covering more than 90 patent authorities including all the major countries. (see Van Roy et al., 2020 for additional details). We grouped retrieved patents in patent families to avoid double counting of the same or similar inventions filed in different patent offices. We then obtained key company characteristics of AI patent applicants through Bureau van Dijk Electronic Publishing (BvD) ORBIS databases. While the issues of coverage and data availability are known limitations of ORBIS, these are by far outweighed by its advantage of offering a comprehensive cross-country micro-level dataset for scientific research purposes (e.g. Gal, 2013; Hallak and Harasztosi, 2019). We used patent application numbers to track applicant firms in the ORBIS Intellectual Property database, which we also exploited to retrieve all other non-AI patent applications of such firms, and matched location and economic information from the ORBIS Companies database. Figure A1 in Appendix A shows a synopsis chart illustrating the data collection process.
4.2 Variables and sample
After excluding observations with missing values in employment, value added, fixed assets or cost of labour and outliers in both levels and growth rates5, our final dataset covers 3,510 firms (resulting in 26,137 observations) active in AI patenting over the years 2000–2016. It provides a worldwide coverage and includes firms belonging to manufacturing and service sectors. It comprises information on firms’ patenting activities in AI and non-AI related fields, accounting information (including employment, turnover, value added, capital formation, and cost of labour), year of birth or consolidation, country location, and industrial activity (NACE sector at 2-digit level).
Our dependent variable is the natural logarithm of the number of firm employees in head counts.6 Explanatory variables are derived from a standard labour demand function and include the natural logarithm of firm turnover, labour cost per employee and gross investments measured as the annual change in fixed assets. We expect a positive impact on labour demand of turnover and gross investments and a negative impact of labour cost. The models also control for industry-, year- and country-specific differences in employment dynamics.
The key explanatory variable of interest is the natural logarithm of the number of AI patent families, which measure the development and adoption of the AI technology as broadly defined in the previous sub-section. In addition to AI patent families, we also take into account innovative efforts in non-AI related fields through the number of non-AI patent families.
Since patents can differ both in economic and technological value, simple patent count may give a distorted measure of a firm's technological basis. Therefore, other indicators have been proposed to correct for quality or value of patents, such as forward citation-weighted patents and family size (Harhoff et al., 2003; Hall et al., 2005; Gambardella et al., 2008; Neuhäusler et al., 2011; Squicciarini et al., 2013; Van Roy et al., 2018). Weighting patents with forward citations is particularly difficult in the case of AI, as the real take-off of AI patenting activities take place relatively late (since the late 2000s), and boomed only from 2015 onwards
5 Data cleaning and outlier treatment are described in Appendix A. 6 The description of the variables used in the empirical analysis is summarised in Table B1 of Appendix B.
9
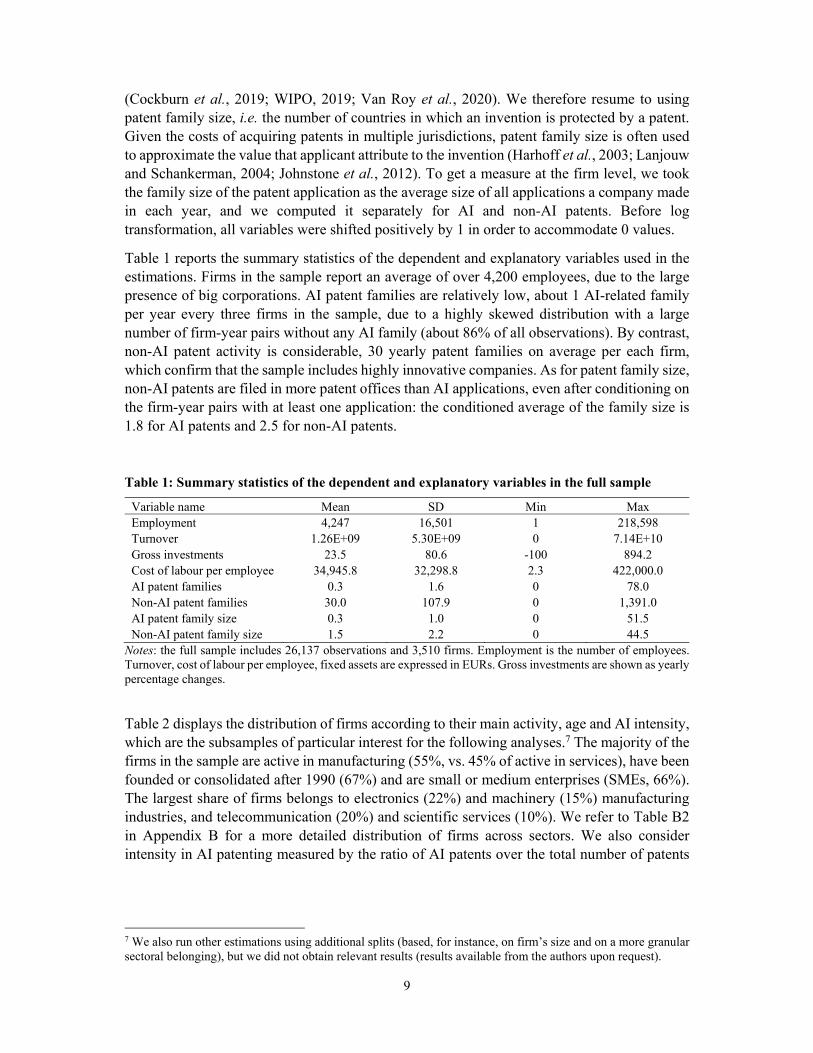
(Cockburn et al., 2019; WIPO, 2019; Van Roy et al., 2020). We therefore resume to using patent family size, i.e. the number of countries in which an invention is protected by a patent. Given the costs of acquiring patents in multiple jurisdictions, patent family size is often used to approximate the value that applicant attribute to the invention (Harhoff et al., 2003; Lanjouw and Schankerman, 2004; Johnstone et al., 2012). To get a measure at the firm level, we took the family size of the patent application as the average size of all applications a company made in each year, and we computed it separately for AI and non-AI patents. Before log transformation, all variables were shifted positively by 1 in order to accommodate 0 values.
Table 1 reports the summary statistics of the dependent and explanatory variables used in the estimations. Firms in the sample report an average of over 4,200 employees, due to the large presence of big corporations. AI patent families are relatively low, about 1 AI-related family per year every three firms in the sample, due to a highly skewed distribution with a large number of firm-year pairs without any AI family (about 86% of all observations). By contrast, non-AI patent activity is considerable, 30 yearly patent families on average per each firm, which confirm that the sample includes highly innovative companies. As for patent family size, non-AI patents are filed in more patent offices than AI applications, even after conditioning on the firm-year pairs with at least one application: the conditioned average of the family size is 1.8 for AI patents and 2.5 for non-AI patents.
Table 1: Summary statistics of the dependent and explanatory variables in the full sample
Variable name Mean SD Min Max Employment 4,247 16,501 1 218,598 Turnover 1.26E+09 5.30E+09 0 7.14E+10 Gross investments 23.5 80.6 -100 894.2 Cost of labour per employee 34,945.8 32,298.8 2.3 422,000.0 AI patent families 0.3 1.6 0 78.0 Non-AI patent families 30.0 107.9 0 1,391.0 AI patent family size 0.3 1.0 0 51.5 Non-AI patent family size 1.5 2.2 0 44.5
Notes: the full sample includes 26,137 observations and 3,510 firms. Employment is the number of employees. Turnover, cost of labour per employee, fixed assets are expressed in EURs. Gross investments are shown as yearly percentage changes.
Table 2 displays the distribution of firms according to their main activity, age and AI intensity, which are the subsamples of particular interest for the following analyses.7 The majority of the firms in the sample are active in manufacturing (55%, vs. 45% of active in services), have been founded or consolidated after 1990 (67%) and are small or medium enterprises (SMEs, 66%). The largest share of firms belongs to electronics (22%) and machinery (15%) manufacturing industries, and telecommunication (20%) and scientific services (10%). We refer to Table B2 in Appendix B for a more detailed distribution of firms across sectors. We also consider intensity in AI patenting measured by the ratio of AI patents over the total number of patents
7 We also run other estimations using additional splits (based, for instance, on firm’s size and on a more granular sectoral belonging), but we did not obtain relevant results (results available from the authors upon request).

10
in the period. In particular, we consider AI-specialised companies those with the ratio of AI patents over total patents above the revealed median in our sample (4.8%).8
In terms of geographical distribution, the majority of firms are located in Asia (61%). This large percentage is driven by the dominating AI patenting activity of Japanese and South-Korean firms as highlighted in prior studies (WIPO, 2019; Van Roy et al., 2020). About 31% of the firms are located in Europe, with highest percentages in Germany, France and the United Kingdom. Lastly, firms in the United States constitute around 6% of the sample.9
Table 2: Distribution of firms across sectors, age, AI intensity and firm size
Full sample Observations Firms Numbers Perc. Numbers Perc. Sector
Services 10,871 41.59 1,573 44.81 Manufacturing 15,266 58.41 1,937 55.19 Age of firm
Founded before 1990 9,933 38.00 1,165 33.19 Founded after 1990 16,204 62.00 2,345 66.81 AI intensity
AI-specialised 12994 49.71 1,839 52.39 Non-AI-specialised 13,143 50.29 1,671 47.61 Firm size
SME 15,995 61.20 2,306 65.70 Large 10,142 38.80 1,422 40.51 Total 26,137 100.00 3,510 100.00
Notes: Age is defined based on the year of foundation or consolidation of the firm. AI-specialised companies are those with the share of AI patents over total patents in the period above the median. SMEs are defined following the EC recommendation in which SMEs are denoted as firms with a number of employees below 250 and a turnover equal to or below € 50 million (European Commission, 2003). The number of SMEs and large firms does not sum up to the total number of firms because 218 firms have changed size category over the period.
Correlations among the log-normal variables are presented in
Table 3 for the full sample. We note the positive correlations between explanatory variables are low and indicate no issue of multicollinearity.10
8 We also tried alternative thresholds for defining a firm as AI-specialized, namely to have the ratio above 10% or above the sample mean (14.4%), and found results analogous to those reported in the following tables. 9 The low share of firms based in the United States and China depend on a recognised bias in ORBIS, that is its low coverage of these countries. Given this limitation in our data, we nevertheless opted to include U.S. and China to enhance the geographic coverage of the sample. We refer to Table B3 in Appendix B for a more detailed distribution of firms across regions and countries. 10 The relative high correlations between patent families and family size of the same kind (AI vs. non-AI) do not constitute an issue, since we enter them separately in different models.

11
Table 3: Correlation matrix
[1] [2] [3] [4] [5] [6] [7] [8] [9] [1] Employment t 1 [2] Employment t-1 0.991 1 [3] Turnover 0.935 0.932 1
[4] Gross investments -
0.046 -
0.071 -
0.044 1
[5] Labour cost per employee
0.154 0.166 0.259 -0.081 1
[6] AI patent families 0.147 0.143 0.143 0.021 -0.048 1 [7] AI patent family size 0.141 0.138 0.135 0.015 0.009 0.792 1 [8] Non-AI patent families 0.644 0.640 0.634 -0.020 0.097 0.349 0.283 1
[9] Non-AI patent family size
0.487 0.483 0.495 -0.013 0.2401 0.13 0.181 0.637 1
Notes: N=26,137 observations. Values expressed as natural logs, apart from gross investments that is expressed as the log difference of fixed assets between time t and t-1. Industry, country and year dummies are omitted due to space limitation.
5. Econometric results
5.1 Model selection
To support the chosen methodology, Table B4 in Appendix B reports the estimation coefficients for pooled ordinary least square (POLS), fixed-effects (FE) and system generalised method of moments (SYS-GMM) models. Lagged employment is highly significant in all three different estimations tested. Its magnitude ranges from 0.495 in the FE estimation, to 0.854 in the POLS estimations. While FE tends to underestimate the impact of the lagged dependent variable, POLS, by contrast, overestimates it. Solving for persistency and endogeneity, it is therefore to be expected that the SYS-GMM estimates for the lagged dependent variable fall within these two boundaries. In fact, the coefficient for lagged employment, obtained from the one-step SYS-GMM at 0.523, meets the above methodological expectation. This finding applies to the standard setup as well as to an alternative one where, for reflecting patent quality, family size is used instead of patent counts (with FE estimates for lagged employment at 0.500, SYS-GMM at 0.532 and POLS at 0.857). Unsurprisingly, labour demand is persistent and autoregressive, confirming its path dependency.
As per diagnostics for the baseline SYS-GMM model, the Wald test on the overall significance of the regressions and the LM tests on AR(1) and AR(2) autocorrelation dynamics confirm the robustness of the model. For the Hansen test on the adequate instruments, however, the null hypothesis is rejected. Blundell and Bond (2000) and Roodman (2009a) demonstrated that, for very large samples, the Hansen test tends to over-reject the null hypothesis. Following the extant literature, the model was re-estimated on random sub-samples comprising 10% of the baseline observations, where the null of the Hansen test was never rejected, suggesting the

12
validity of the selected instruments.11 Finally, given the observation that a high number of instruments may imply a downward bias in the standard errors for two-step SYS-GMM models (Roodman, 2009b), we opted for the more conservative one-step methodology.
5.2 Baseline results
The baseline estimation reported in Table 4 (applying the one-step SYS-GMM estimation on the full sample of 26,137 observations from 3,510 firms active in AI patenting) provides results that are in line with prior studies of similar setup (Bogliacino et al., 2012; Van Roy et al., 2018; Pellegrino et al., 2019). The coefficients of the explanatory variables are significant and have the expected sign. The large positive effect of lagged employment (0.52) confirms the persistence of labour demand. The positive effect of turnover is large (0.26) and highly significant, while the effect of gross investments – which can also incorporate the adoption of process innovations – is more contained (0.03), but still significant at the customary 5% level. The labour cost per employee inhibits as expected labour demand with a strong negative effect (-0.52).
Regarding our key innovation variables, model estimates show positive and highly significant effects of AI and non-AI patent families on employment. They imply a similarly moderate elasticity of labour demand to AI and non-AI patent families equal to about 3-4%. This finding supports the employment friendly nature of product innovation in general, and provides novel evidence for AI technological development. When patent family size is used, only AI patent families provide a significant positive effect on employment, while the effect of non-AI patent does not reach customary levels of statistical significance.
5.3 Sample splits
In order to enrich our understanding of the impact of AI innovation on employment, results for three sample splits are presented in Table 4 and 5, namely: sector of main economic activity, age and AI intensity as defined in Section 4.2. We note that the overlaps between the groups singled out in the three splits are sufficiently limited to allow differentiated findings.12
In all the considered subsamples, the main control variables in our specification - i.e., lagged employment, turnover, gross investments, and labour cost per employee - are significant and have the expected sign as in the baseline model.
When distinguishing companies by sectoral belonging, the coefficients for AI and non-AI patents are only significant among service sector firms, but not for manufacturing ones (we recall that about 45% of the companies in the sample are in services, about three-quarters in what could be considered as knowledge-intensive sectors).13 Compared with the baseline estimations, the employment impact for firms in service industries is stronger in magnitude and
11 Results are available from the authors upon request. 12 As shown in the Venn diagram in Figure B1 in the Appendix, about 83% of the companies from the full sample are included in the union of the three groups (services, established after 1990 and AI-intensive), and about 25% of the firms are in the intersection of the three. 13 The lack of significance of any of the patent variables in manufacturing companies is also observed when further distinguishing high-tech and low-tech manufacturing sectors (results available from the authors upon request).
13
applies for AI and non-AI patents defined according to both patent measures. In fact, it is only among services that the coefficient of both AI and non-AI patent family size is significant (0.05 and 0.03, at 1% and 5% significance levels, respectively).
Recognising that many of today’s AI and robotics innovations goes back to the booming of the ICT revolution since the 1990s, we further investigated heterogeneous effects for sub-samples comprising firms established before and after 1990.14 The results for the focal patent variables show that AI and non-AI patents are only significant for the younger companies (around 2/3rd of the firms in the sample). The effects observed for these firms turn out to be highly significant for both AI and non-AI patent counts, while patent family size leads to significant coefficients only for AI technologies, similarly to the baseline scenario.
Some companies stand out even among the technologically active firms constituting our sample, based on the relative importance of their AI patents.15 The estimation results show that AI and non-AI patents are only significant for the set of AI-specialised companies (in this case, the choice of the patent measure - count or family size - does not make any difference with regard to the level of significance). This is an important result, hinting at the magnitude of potential job creation by the leading front-runner product innovators in AI; moreover, the positive and significant effect of their non-AI patents on labour demand underlines the fact that, even for AI-specialised firms, AI turns out to be complementary to other labour friendly innovations.
Finally, in all the estimations reported in Table 4 and 5 (with the only exception of patent counts in services) the labour-friendly impact of AI technologies is larger in magnitude - and sometimes more significant - than the labour-friendly effect of non-AI innovations. If we jointly take into account this outcome and the observed role of AI-intensive firms in driving the detected job-creating effects (see above), we may conclude that the emerging AI technologies are those that drive the overall positive employment impact of product innovation in the investigated companies.
14 1990 may be an arbitrary threshold; we note however that adjusting it by 5 years has limited impact on the findings (results available from the authors upon request). 15 Recall that we refer to those specializing in AI as the firms that are above the median in the relative share of AI technologies among their patent portfolios.

14
Table 4: Results from GMM-SYS analysis: baseline estimations and estimations split by industry and age
Baseline
Industry Age of firm Services Manufacturing Founded before 1990 Founded after 1990 Employment t-1 0.523*** 0.532*** 0.539*** 0.552*** 0.479*** 0.487*** 0.274*** 0.285*** 0.553*** 0.567*** (0.034) (0.035) (0.045) (0.046) (0.047) (0.048) (0.063) (0.065) (0.038) (0.039) Turnover 0.257*** 0.264*** 0.205*** 0.211*** 0.256*** 0.264*** 0.386*** 0.383*** 0.210*** 0.225*** (0.041) (0.041) (0.048) (0.048) (0.053) (0.054) (0.114) (0.113) (0.037) (0.037) Gross investments 0.033** 0.033** 0.024* 0.024* 0.053* 0.055* 0.086* 0.086* 0.028*** 0.027*** (0.015) (0.015) (0.013) (0.013) (0.030) (0.031) (0.051) (0.051) (0.010) (0.010) Labour cost per empl. -0.518*** -0.528*** -0.433*** -0.448*** -0.569*** -0.574*** -0.650*** -0.664*** -0.465*** -0.472*** (0.035) (0.036) (0.044) (0.044) (0.057) (0.058) (0.107) (0.106) (0.034) (0.034) AI patent families 0.034*** 0.047** 0.019 0.014 0.044*** (0.013) (0.021) (0.015) (0.022) (0.015) Non-AI patent families 0.028*** 0.052*** 0.010 0.007 0.035*** (0.009) (0.015) (0.011) (0.019) (0.010) AI pat. family size 0.028*** 0.048*** 0.014 -0.003 0.042*** (0.010) (0.015) (0.012) (0.016) (0.012) Non-AI pat. family size 0.014 0.035** -0.002 0.005 0.013
(0.009) (0.014) (0.011) (0.017) (0.010) Wald test 92,449*** 555,160*** 3,897*** 3,640*** 337,965*** 13,370*** 329.4*** 349.4*** 461,221*** 374,500*** Hansen test (p-value) 6.56e+08*** 2.88e+13*** 1,106*** 585.9*** 33.36*** 30.96*** 4.32e+10*** 1.84e+10*** 51.35*** 2.05e+24*** AR (1) -11.160*** -11.040*** -8.674*** -8.646*** -7.346*** -7.276*** -3.924*** -3.953*** -11.320*** -11.170*** AR (2) -1.992** -2.116** -0.943 -1.030 -1.797* -1.937* -1.444 -1.615 -0.705 -0.803 AR (3) -0.585 -0.430 -0.510 -0.323 Instruments 108 108 83 83 90 90 92 92 98 98 Obs. 26,137 26,137 10,871 10,871 15,266 15,266 9,933 9,933 16,204 16,204 N. of firms 3,510 3,510 1,573 1,573 1,937 1,937 1,165 1,165 2,345 2,345
Notes: All variables are taken in natural logs, apart from gross investments that is expressed as the log difference of fixed assets between time t and t-1. All models include industry, country and year dummies. One-step GMM robust standard errors are reported in parentheses. Instrumental variables compromise 2-year lags. *** p<0.01, ** p<0.05, * p<0.1

15
Table 5: Results from GMM-SYS analysis: baseline estimations and estimations split by AI intensity
Baseline
AI intensity AI specialised Non-AI-specialised Employment t-1 0.523*** 0.532*** 0.579*** 0.583*** 0.440*** 0.446*** (0.034) (0.035) (0.037) (0.036) (0.052) (0.054) Turnover 0.257*** 0.264*** 0.207*** 0.210*** 0.219*** 0.241*** (0.041) (0.041) (0.043) (0.043) (0.084) (0.086) Gross investments 0.033** 0.033** 0.022* 0.021 0.052* 0.054* (0.015) (0.015) (0.013) (0.013) (0.027) (0.028) Labour cost per empl. -0.518*** -0.528*** -0.495*** -0.498*** -0.532*** -0.543*** (0.035) (0.036) (0.039) (0.039) (0.059) (0.059) AI patent families 0.034*** 0.046*** 0.029 (0.013) (0.016) (0.021) Non-AI patent families 0.028*** 0.040*** -0.001 (0.009) (0.010) (0.014) AI pat. family size 0.028*** 0.039*** 0.011 (0.010) (0.015) (0.013) Non-AI pat. family size 0.014 0.031*** -0.013 (0.009) (0.010) (0.015) Wald test 92,449*** 555,160*** 49,771*** 63,761*** 6.38e+06*** 4.42e+06*** Hansen test (p-value) 6.56e+08*** 2.88e+13*** 48.91*** 1.68e+10*** 3.12e+11*** 35.42*** AR (1) -11.160*** -11.040*** -10.330*** -10.140*** -6.688*** -6.586*** AR (2) -1.992** -2.116** -2.090** -2.203** -0.926 -1.118 AR (3) -0.585 -0.430 -0.981 -1.003 Instruments 108 108 101 101 96 96 Obs. 26,137 26,137 12,994 12,994 13,143 13,143 N. of firms 3,510 3,510 1,839 1,839 1,671 1,671
Notes: All variables are taken in natural logs, apart from gross investments that is expressed as the log difference of fixed assets between time t and t-1. All models include industry, country and year dummies. One-step GMM robust standard errors are reported in parentheses. Instrumental variables compromise 2-year lags. *** p<0.01, ** p<0.05, * p<0.1
6. Conclusions
In contrast with a literature solely devoted to forecast and assess the possible labour-saving impact of automation in the user sectors, this paper departs from a view considering AI devices (including robots) only as process innovations and investigates the possible labour-friendly nature of these technologies, seen as product innovations in the supply industries. Our main results can be summarised as follows.
Our estimates reveal a positive and significant impact of AI patent families on employment, supporting the labour-friendly nature of product innovation in the AI supply industries. Interestingly enough, this positive employment impact is additional and larger when compared to the job creation effect of other patenting activities.
However, the labour-friendly employment effect of patenting in AI technologies is small in magnitude (the estimated elasticity being equal to 3/4%) and unlikely able to compensate the possible labour-saving impact in the downstream user industries (see the studies surveyed in Section 2).
Moreover, the positive employment impact is limited to service sectors and younger firms, which are the leading actors of the AI revolution.
Finally, some evidence of increasing returns seems to emerge; indeed, the innovative companies which are more focused on AI technologies are those obtaining the larger effects in terms of job creation.

16
Putting together our results, we can conclude that the possible employment benefits of AI technologies are, at least so far, mainly coming from companies that are at the core of the current technological revolution.
These pieces of evidence suggest that technological leaders within the emergence of the AI paradigm can realise (modest) labour-friendly outcomes; however, heterogeneity is also detected, with manufacturing, older and less innovative companies unable to couple product innovation with job creation.
In terms of (tentative) policy implications, these findings call for a cautious aptitude in considering the actual magnitude of the job creation effect of new technologies: compared with the labour-saving impact implied by the usage of the AI technologies (massive according to some studies, see Section 2), the labour-friendly extent in the supply industries appears limited in magnitude and scope.
Nevertheless, industrial and innovation policies should consider promoting these new and emerging sectors, being sure to achieve positive complementary targets in terms of employment creation. In particular, the revealed evidence of possible increase returns might support an increase in subsidies targeted to those companies already fully engaged in AI patenting.
At the same time, safety nets and active labour market policies keep to being necessary to deal with the employment displacement due to the widespread diffusion of AI technologies in the user industries.
Obviously enough, this study is affected by some limitations that might be overcome by future research. In particular, our results are micro-based and focusing on companies active in AI patenting, as discussed in Section 3. On the one hand, this means that our findings cannot be generalised at a more aggregate and macroeconomic level; on the other hand, this study does not claim to be representative of the entire population of firms, but rather to investigate the link between product innovation and employment within the sub-population of companies actively engaged in AI technologies. Further research is needed to assess the employment impact of the new knowledge basis at the level of the entire economy, taking into account both innovators, non-innovators and user firms.

17
References
Acemoglu, D., & Restrepo, P. (2018). The Race between Man and Machine: Implications of Technology for Growth, Factor Shares, and Employment. American Economic Review, 108(6), 1488-1542.
Acemoglu, D., & Restrepo, P. (2019). Automation and new tasks: how technology displaces and reinstates labor. Journal of Economic Perspectives, 33(2), 3–30.
Acemoglu, D., & Restrepo, P. (2020). Robots and Jobs: Evidence from US Labor Markets. Journal of Political Economy, 128(6), 2188-2244.
Arellano, M., & Bond, S. (1991). Some tests of specification for panel data: Monte Carlo evidence and an application to employment equations. The Review of Economic Studies, 58, 277-297.
Arntz, M, Gregory, T, & Zierahn, U. (2016). The risk of automation for jobs in OECD countries: A comparative analysis. In OECD Social, Employment and Migration Working Papers, No.189, OECD Publishing.
Arntz M., Gregory, T., & Zierahn, U. (2017). Revisiting the risk of automation. Economics Letters, 159, 157-160.
Barbieri, L., Mussida, C., Piva, M., & Vivarelli, M. (2020). Testing the Employment and Skill Impact of New Technologies. In K. Zimmermann (ed.), Handbook of Labor, Human Resources and Population Economics, Springer, Cham, pp. 1-27.
Baruffaldi, S., van Beuzekom, B., Dernis, H., Harhoff, D., Rao, N., Rosenfeld, D., & Squicciarini, M. (2020). Identifying and measuring developments in artificial intelligence: Making the impossible possible. OECD Science, Technology and Industry Working Papers 2020/05.
Bianchini, S., Muller M., & Pelletier, P. (2020). Deep learning in science. arXiv:2009.01575.
Blundell, R., & Bond, S. (2000). GMM estimation with persistent panel data: an application to production functions. Econometrics Reviews, 19, 321-340.
Blundell, R., & Bond, S. (1998). Initial conditions and moment restrictions in dynamic panel data models. Journal of Econometrics, 87, 115-143.
Bogliacino, F., & Pianta, M. (2010). Innovation and employment: A reinvestigation using revised Pavitt classes. Research Policy, 39(6), 799-809.
Bogliacino, F., Piva, M., & Vivarelli, M. (2012). R&D and employment: An application of the LSDVC estimator using European data. Economics Letters, 116(1), 56-59.
Brynjolfsson, E, & McAfee, A. (2011). Race against the machine: How the digital revolution is accelerating innovation, driving productivity, and irreversibly transforming employment and the economy, Digital Frontier Press, Lexington, Massachussets.
Brynjolfsson, E, & McAfee, A. (2014). The second machine age: Work, progress, and prosperity in a time of brilliant technologies. W.W. Norton, New York.
Calvino, F., & Virgillito, M.E. (2018). The innovation employment nexus: A critical survey of theory and empirics. Journal of Economic Surveys, 32, 83-117.
Chiacchio, F., Petropoulos, G., & Pichler, D. (2018). The impact of industrial robots on EU employment and wages: A local labour market approach. Bruegel Working Paper 2.

18
Cockburn, I., Henderson, R., & Stern, S. (2019). The Impact of Artificial Intelligence on Innovation. In: A. Agrawal, J. Gans, & A. Goldfarb (Eds.) The economics of artificial intelligence: an agenda. University of Chicago Press and NBER.
Damioli, G., Van Roy, V., & Vertesy, D. (2021). The impact of artificial intelligence on labor productivity. Eurasian Business Review, 11(1), 1-25.
Dauth, W., Findeisen, S., Südekum, J., & Woessner, N. (2017). German robots - The impact of industrial robots on workers. CEPR Discussion Paper No. DP12306.
De Prato, G., López Cobo, M., Samoili, S., Righi, R., Vázquez-Prada Baillet, M., & Cardona, M. (2019) The AI Techno-Economic Segment Analysis. Selected Indicators, EUR29952 EN, Publications Office of the European Union, Luxembourg.
Dobbs, R,. Manyika, J., & Woetzel, J. (2015). The four global forces breaking all the trends. McKinsey Global Institute, London, San Francisco, Shanghai.
Dosi, G., Piva, M., Virgillito, M.E., & Vivarelli, M. (2021). Embodied and disembodied technological change: The sectoral patterns of job-creation and job-destruction. Research Policy, 50 (4), 10419.
Edquist, C., Hommen, L., & McKelvey, M. (2001). Innovation and Employment: Product Versus Process Innovation. Cheltenham: Elgar.
Ernst, E., Merola, R., & Samaan, D. (2018). The economics of artificial intelligence: Implications for the future of work. International Labour Office (ILO), Future of Work Research Paper Series 5.
Ernst, H. (1995). Patenting strategies in the German mechanical engineering industry and their relationship to firm performance. Technovation, 15, 225-240.
Ertel, W. (2018). Introduction to Artificial Intelligence: Undergraduate Topics in Computer Science. Springer International Publishing, New-York.
European Commission (2003). Commission recommendation of 6 May 2003 concerning the definition of micro, small and medium-sized enterprises. Official Journal of European Union, L124/36.
European Commission (2018). Artificial Intelligence: A European Perspective. European Commission, Joint Research Centre, Seville. doi:10.2760/936974.
Freeman, C., & Soete, L. (1987). Technical change and full employment. Basil Blackwell, Oxford.
Freeman, C., & Soete, L. (1994). Work for All or Mass Unemployment? Computerised Technical Change into the Twenty-first Century. London-New York: Pinter.
Frey, C., & Osborne, M. (2017). The future of employment: How susceptible are jobs to computerisation? Technological Forecasting and Social Change, 114, 254–280.
Fujii H, & Managi, S. (2018). Trends and priority shifts in artificial intelligence technology invention: A global patent analysis. Economic Analysis and Policy, 58, 60-69.
Gal, P.N. (2013). Measuring total factor productivity at the firm level using OECD-ORBIS. OECD Economics Department Working Papers, No. 1049, OECD Publishing, Paris, https://doi.org/10.1787/5k46dsb25ls6-en.
Gambardella, A., Harhoff, D., & Verspagen, B. (2008). The value of European patents. European Management Review, 5 (2), 69-84.
Graetz, G., & Michaels, G. (2018). Robots at work. The Review of Economics and Statistics, 100(5), 753–768.

19
Griliches, Z. (1990). Patent statistics as economic indicators: a survey. Journal of Economic Literature, 18, 1661-1707.
Hall, B., Jaffe, A., & Trajtenberg, M. (2005). Market value and patent citations. RAND Journal of economics, 16-38.
Hall, B., Helmers, C., Rogers, M., & Sena, V. (2014). The choice between formal and informal intellectual property: a review. Journal of Economic Literature, 52 (2), 375-423.
Hallak, I. & Harasztosi, P., (2019). Job Creation in Europe: A firm-level analysis, EUR 29689 EN, Publications Office of the European Union, Luxembourg, doi:10.2760/590043.
Harhoff, D., Scherer, F. M., & Vopel, K. (2003). Citations, family size, opposition and the value of patent rights. Research policy, 32(8), 1343-1363.
Hussinger, K. (2006). Is silence golden? Patents versus secrecy at the firm level. Economics of Innovation and New Technology, 15(8), 735-752.
Inaba, T., & Squicciarini, M. (2017). ICT: A new taxonomy based on the international patent classification. OECD Science, Technology and Industry Working Papers, No. 2017/01, Paris: OECD Publishing. doi:10.1787/ab16c396-en.
Katsoulacos, Y.S. (1984). Product innovation and employment. European Economic Review, 26, 83-108.
Katsoulacos, Y.S. (1986). The Employment Effect of Technical Change. Brighton: Wheatsheaf.
Keisner, A., Raffo, J., & Wunsch-Vincent, S. (2015). Breakthrough technologies – Robotics, innovation and intellectual property. WIPO Economic Research Working Paper No. 30.
Johnstone, N., Hai, I., Poirier, J., Hemar, M. & Michel, C. (2012). Environmental Policy Stringency and Technological Innovation: Evidence from Survey Data and Patent Counts. Applied Economics, 44(17), 2157–2170.
Lachenmaier, S., & Rottmann, H. (2011). Effects of innovation on employment: A dynamic panel analysis. International Journal of Industrial Organization, 29(2), 210-220.
Lanjouw, J., & Schankerman, M. (2004). Patent Quality and Research Productivity: Measuring Innovation with Multiple Indicators. Economic Journal, 114(495), 441–465.
Levin, R. C., Klevorick, A. K., Nelson, R. R., Winter, S. G., Gilbert, R., & Griliches, Z. (1987). Appropriating the returns from industrial research and development. Brookings papers on economic activity, 1987(3), 783-831.
Lissoni, F., Montobbio, F., & Zirulia, L. (2013). Inventorship and authorship as attribution rights: An enquiry into the economics of scientific credit. Journal of Economic Behavior & Organization, 95, 49-69.
Martinelli, A., Mina, A., & Moggi, M. (2021). The enabling technologies of industry 4.0: Examining the seeds of the fourth industrial revolution. Industrial and Corporate Change, Forthcoming.
Nedelkoska, L., & Quintini, G. (2018). Automation, skills use and training. In OECD Social, Employment and Migration Working Papers, No. 202, OECD Publishing.
Neuhäusler, P., Frietsch, R., Schubert, T., & Blind, K. (2011). Patents and the financial performance of firms-An analysis based on stock market data (No. 28). Fraunhofer ISI Discussion Papers-Innovation Systems and Policy Analysis.

20
OECD (2017). OECD Science, Technology and Industry Scoreboard 2017: The digital transformation, Paris: OECD Publishing, doi:10.1787/9789264268821-en.
Pellegrino, G., Piva, M., & Vivarelli, M. (2019). Beyond R&D: the role of embodied technological change in affecting employment. Journal of Evolutionary Economics, 29 (4), 1151-1171.
Pianta, M. (2005). Innovation and employment. In J. Fagerberg, D. Mowery and R.R. Nelson (eds), Handbook of Innovation. Oxford: Oxford University Press, 568-598.
Pouliakasn, K. (2018). Determinants of automation risk in the EU labour market: A skills-needs approach. IZA Discussion Paper No. 11829.
Porto, T.C., Lee, K. & Mani, S. (2021). The US–Ireland–India in the catch-up cycles in IT services: MNCs, indigenous capabilities and the roles of macroeconomic variables. Eurasian Business Review, 11(1), 59–82.
Roodman, D. (2009a). How to Do xtabond2: An Introduction to "Difference" and "System" GMM in Stata. Stata Journal, 9, 86-136.
Roodman, D. (2009b). A note on the theme of too many instruments. Oxford Bulletin of Economics and Statistics, 71, 135-158.
Russell S., & Norvig, P. (2016). Artificial Intelligence: A Modern Approach. Pearson Education Limited, Malaysia.
Schumpeter, J.A. (1912). The theory of economic development. Harvard University Press, Cambridge (Mass.) Engl. Ed. 1968.
Squicciarini, M., Dernis, H., & Criscuolo, C. (2013). Measuring patent quality. OECD Science, Technology and Industry Working Papers 2013/03.
Staccioli, J., Virgillito, M.E. (2021), Back to the past: the historical roots of labor-saving automation, Eurasian Business Review, 11(1), 27–57.
Ugur, M., Awaworyi, C., & Solomon, E. (2018). Technological innovation and employment in derived labour demand models: A hierarchical meta-regression analysis. Journal of Economics Surveys, 32(1), 50-82.
Van Reenen, J. (1997). Employment and Technological Innovation: Evidence from U.K. Manufacturing Firms, Journal of Labor Economics, 15(2), 255-284.
Van Roy, V., Vertesy, D., & Vivarelli, M. (2018). Technology and employment: Mass unemployment or job creation? Empirical evidence from European patenting firms. Research Policy, 47(9), 1762-1776.
Van Roy, V., Vertesy, D., & Damioli, G. (2020). AI and Robotics Innovation. In K. Zimmermann (Eds.) Handbook of Labor, Human Resources and Population Economics, 1-35.
Vivarelli, M. (1995). The economics of technology and employment: Theory and empirical evidence. Elgar, Cheltenham (reprinted 1997).
Vivarelli, M. (2014). Innovation, employment, and skills in advanced and developing countries: A survey of the economic literature. Journal of Economic Issues, 48(1), 123–154.
Webb, M., Short, N., Bloom, N., & Lerner, J. (2018). Some facts of high tech patenting, NBER Working Paper, no. 24793.
WIPO (2019). WIPO Technology Trends 2019: Artificial Intelligence. Geneva: World Intellectual Property Organization.

21
Appendix A: Data collection and data cleaning
Data collection
Figure A1 presents a synoptic chart illustrating the data collection process. The Tools for Innovation Monitoring (TIM), which is an analytics tool developed by the Joint Research Centre to support policy making in the field of innovation and technological development, has been used for the patent search. TIM provides access to patent documents of the PATSTAT database from the European Patent Office and allows for text-mining searches. TIM contains patents from more than 90 patent authorities including all the major patenting countries and regroups patent documents per patent family when at least one of the members of the family is in English.
To retrieve AI patents, text-mining techniques have been used to detect the keywords presented in Table A1 in either the patent title or the abstract.
Once the relevant patent families in AI have been retrieved with this text-mining technique, the patent family number has been linked with the ORBIS Intellectual Property database. Subsequently, patent applicants have been linked to their BVD ID number to obtain account information on turnover, employment, fixed capital and sector.
In a final step, the complete patent portfolio of the identified AI-active companies was retrieved to populate the dataset on non-AI patent families.
Figure A1: Data matching procedure

22
Table A1: List of keywords related to Artificial Intelligence
Artificial intelligence Face recognition Random Forest Artificial intelligent Facial recognition Reinforcement learning Artificial reality Gesture recognition Robotics Augmented realities Holographic display Self driv Augmented reality Humanoid robot Sentiment analysis Automatic classification Internet of things Smart glasses Autonomous car Knowledge Representation Speech Recognition Autonomous vehicle Machine intelligence Statistical Learning Bayesian modelling Machine learn Supervised learning Big data Machine to machine Transfer Learning Computational neuroscience Mixed reality Unmanned Aerial Vehicle Computer Vision Natural Language Processing Unmanned aircraft system Data mining Neural Network Unsupervised learning Data science Neuro-Linguistic Programming Virtual reality Decision tree Object detection Voice recognition Deep learn Predictive modeling Evolutionary Computation Probabilistic modeling
Data cleaning
Data cleaning was carried out in 3 steps. The first step was the identification of the most common clerical errors or typos in the key economic variables (number of employees, turnover, fixed assets and cost of employees) from the Orbis database (for instance, missing 000’s). Moreover, we used the imputation procedure put forward by Hallak and Harasztosi (2019); in particular, data for number of employees missing in a year between two known time points (not more than 4 years apart) were imputed applying a linear interpolation. No imputation was carried out for missing gross investments and cost of employees figures due to high annual fluctuation.
In a second step, outliers in year-on-year growth rates for the key economic variables were removed (we decided to use growth rates in order to take into account firm’s size: i.e. an additional increase of 10 employees may imply doubling the size of a small firm, while growing by a few percentage points for a large corporation). The thresholds applied corresponded to trimming a bit less than the bottom and top 1% of the growth distributions of the different variables.
Finally, in a third step, the top 1 percentile in levels were also trimmed with regard both the key economic variables as well as the patent variables.

23
Appendix B. Additional statistics
Table B1: Description of the variables
Variable name Variable definition
Employment Natural logarithm of the number of employees expressed in head counts
Turnover Natural logarithm of the turnover expressed in EURs
Gross investments Natural logarithm of fixed assets expressed in EURs in t - natural logarithm of fixed assets expressed in EURs in t-1
Labour cost per employee Natural logarithm of labour cost per employee (labour cost expressed in EURs/number of employees)
AI patent families Natural logarithm of the number of AI patent families Non-AI patent families Natural logarithm of the number of non-AI patent families AI patent family size Natural logarithm of the average size of AI patent families Non-AI patent family size Natural logarithm of the average size of non-AI patent families
Table B2: Distribution of firms across industries
Observations Firms
Numbers Perc. Numbers Perc.
Manufacturing 15,266 58.4 1,937 55.2
Primary 184 0.7 20 0.6
Food 65 0.2 11 0.3
Textile 112 0.4 16 0.5
Paper 105 0.4 14 0.4
Chemistry 784 3.0 90 2.6
Pharmaceutical 364 1.4 39 1.1
Minerals 157 0.6 18 0.5
Metal 1086 4.2 129 3.7
Electronics 5688 21.8 789 22.5
Machinery 4254 16.3 516 14.7
Transport 1468 5.6 167 4.8
Other Manufacturing 999 3.8 128 3.6
Services 10,871 41.6 1,573 44.8
Construction 812 3.1 107 3.0
Electricity/Water 153 0.6 17 0.5
Retail trade 1,601 6.1 215 6.1
Transport Services 84 0.3 13 0.4
Hotel & Catering 29 0.1 4 0.1
Telecommunication 4,538 17.4 696 19.8
Finance 132 0.5 17 0.5
Real Estate & Rental 74 0.3 14 0.4
Scientific 2,536 9.7 348 9.9
Administration/Education 756 2.9 114 3.2
Other services 156 0.6 28 0.8
Total 26,137 100 3,510 100

24
Table B3: Distribution of firms across regions and countries
Observations Firms
Numbers Perc. Numbers Perc.
Asia 14,719 56.3 2,131 60.7
Japan 10,684 40.9 1,476 42.1 South-Korea 2,782 10.6 485 13.8 Taiwan 1,111 4.3 148 4.2 Rest of Asia 142 0.5 22 0.6
Europe 10,105 38.7 1,104 31.5
Germany 2,338 8.9 286 8.1 France 1,846 7.1 177 5.0 United Kingdom 1,548 5.9 150 4.3 Italy 1,224 4.7 119 3.4 Spain 667 2.6 73 2.1 Sweden 511 2.0 59 1.7 Rest of Europe 1971 7.5 240 6.8
United States 950 3.6 223 6.4
Rest of World 363 1.4 52 1.5
Total 26,137 100 3,510 100

25
Table B4: Model selection
Pooled OLS Fixed effects SYS-GMM (one-step) Employment t-1 0.854*** 0.495*** 0.523*** (0.010) (0.027) (0.034) Turnover 0.107*** 0.208*** 0.257*** (0.009) (0.028) (0.041) Gross investments 0.100*** 0.058*** 0.033** (0.012) (0.009) (0.015) Labour cost per employee -0.094*** -0.231*** -0.518*** (0.007) (0.016) (0.035) AI patent families 0.002 0.020*** 0.034*** (0.006) (0.006) (0.013) Non-AI patent families 0.017*** 0.035*** 0.028*** (0.002) (0.004) (0.009) Constant 0.611*** 1.346*** (0.121) (0.354) R-squared 0.986 0.636 F test (22, 3509) 213.2*** Hansen test 6.560e+08*** Wald test 92449*** AR(1) -11.16*** AR(2) -1.992** AR(3) -0.585 Instruments 108 Observations 26,137 26,137 26,137 Number of firms 3,510 3,510 3,510
Notes: All variables are taken in natural logs, apart from gross investments that is expressed as the log difference of fixed assets between time t and t-1. All models include year dummies. Pooled OLS and SYS-GMM models also include industry and country dummies. Robust standard errors are reported in parentheses. For GMM estimation, instrumental variables compromise 2-year lags. *** p<0.01, ** p<0.05, * p<0.1;
Figure B1: Distribution of firms across sub-samples
Notes: N=3,510
252 (7%) 343 113 (10%) (3%)
865 (25%)
468 (13%) 669 192 (5%) (19%)
Rest: 608 (17%) Services
Founded after 1990 AI‐specialized

The UNU‐MERIT WORKING Paper Series 2021-01 Transformation towards sustainale development goals: Role of innovation by
Michiko Iizuka and Gerald Hane 2021-02 Access to social protection for platform and other non‐standard workers: A
literature review by Tamara A. Kool, Giulio Bordon and Franziska Gassmann 2021-03 Labour‐augmenting technical change data for alternative elasticities of
substitution, growth, slowdown, and distribution dynamics by Thomas Ziesemer 2021-04 Democracy and COVID‐19 Outcomes by Gokhan Karabulut, Klaus F. Zimmermann,
Mehmet Huseyin Bilgin and Asli Cansin Doker 2021-05 Patent landscaping using 'green' technological trajectories by Önder Nomaler &
Bart Verspagen 2021-06 Macroeconomic stimulus packages and income inequality in developing countries:
Lessons from the 2007‐9 Great Recession for the Covid‐19 crisis in South Africa by Alexis Habiyaremye, Peter Jacobs, Olebogeng Molewa and Pelontle Lekomanyane
2021-07 Deepening or delinking? Innovative capacity and global value chain participation in the ICT sectors by Rasmus Lema, Carlo Pietrobelli, Roberta Rabellotti and Antonio Vezzani
2021-08 COVID‐19 policy responses, mobility, and food prices: Evidence from local markets in 47 low to middle income countries by Stephan Dietrich, Valerio Giuffrida, Bruno Martorano and Georg Schm erzeck
2021-09 Attitudes towards inequality in Brazil: An analysis of a highly unequal country by Cintia Denise Granja and Ana Maria Carneiro
2021-10 Mobile phones and HIV testing: Multi‐country evidence from sub‐Saharan Africa by Francesco Iacoella and Nyasha Tirivayi
2021-11 What makes a productive Ph.D. student? by Alberto Corsini, Michele Pezzoni and Fabiana Visentin
2021-12 Do institutions and ideology matter for economic growth in Latin America in the first two decades of the 21st century? by Pamela L. Navarrete Gallo and Jo Ritzen
2021-13 How social assistance affects subjective Well‐being: Lessons from Kyrgyzstan by Franziska Gassmann, Bruno Martorano and Jennifer Waidler
2021-14 Do pandemics lead to rebellion? Policy responses to COVID‐19, inequality, and protests in the USA by Francesco Iacoella, Patricia Justino and Bruno Martorano
2021-15 Foreign R&D spillovers to the USA and strategic reactions by Thomas H.W. Ziesemer 2021-16 Will the AI revolution be labour‐friendly? Some micro evidence from the supply side
by G. Damioli, V. Van Roy, D. Vertesy and M. Vivarelli