2021 public transportation fact book
TRANSCRIPT

2021 PUBLIC TRANSPORTATION
FACT BOOK

II | APTA
2021 PUBLIC TRANSPORTATION
FACT BOOK
72nd EditionMay 2021
APTA’s Purpose Statement
APTA leads public transportation in a new mobility era, advocating to connect and build thriving communities.

APTA | 1 2021 PUBLIC TRANSPORTATION FACT BOOK | 1
CONTENTS
2 Today, Public Transit in America is…
4 National Totals Table
6 Public Transit’s Response to COVID-19: Heroes Moving Heroes
7 Public Transit System Overview Total Number of Systems, Number of Modes Operated, Number of Rail Systems, Rail and BRT Openings
10 Passenger Travel Unlinked Passenger Trips by Mode, Unlinked Passenger Miles by Mode, Average Trip Length by Mode, VMT vs. Passenger Mile Growth, Population vs. Ridership Growth, ACS Transit Commuting Statistics
13 Service Provided Vehicle Revenue Miles Operated, Vehicle Revenue Hours Operated, Average Vehicle Speed, Modal Shares of Service
15 Vehicles Vehicles Available for Maximum Service, Vehicle Age by Mode, Vehicle Accessibility, Bus Passenger Equipment, Bus Fuel Type, Total Mechanical Failures, Revenue Vehicle Maintenance
18 Infrastructure Route Miles by Mode, Passenger Station Amenities, Transit Station Accessibility, Fare Payment Technology, Maintenance Facilities
20 Employment Total Employees, Employees by Function, Employees by Mode, Transit Employee Compensation, Average Employee Compensation
20 Energy Fossil Fuel Consumption, Electricity Consumption, Rail Vehicle Miles Operated per Kilowatt Hour
21 Safety Total Transit Related Fatalities and Accidents
22 Capital and Operating Funding Total Transit Funding, Passenger Fare Revenue, Average Base Fare, Capital Funding by Source, Operating Funding by Source
25 Capital and Operating Expenses Capital Expenses, Capital Expenditures by Type, Operating Expenses, Operating Expenditures by Function, Comparative Operating Costs Among Modes
27 Transit Spending and Contracting in the Private Sector Estimated Expenditures in the Private Sector, Revenue Hours Contracted
28 Canadian Summary Passenger Boardings, Total Vehicle Miles Operated, Vehicle Age, Revenue Vehicles, Total Employees
30 Amtrak Summary Passenger Travel, Funding, Capital Investments
31 Modal Rankings National Totals for Selected Modes, 50 Largest Agencies, 50 Urbanized Areas with the Most Transit Travel, Listing of Largest Agencies by Mode, Listing of Largest Rural Agencies by Mode
45 APTA and the Fact Book Fact Book Methodology, Additional Fact Book Resources, APTA and the History of the Fact Book

2 | APTA
TODAY, PUBLIC TRANSIT IN AMERICA IS…
48%
Public transit trips are…
More Balanced
By Rail48%48%By Bus
79% of buses have
security cameras
78% of buses have
automated stop announcements
77% of buses have
exterior bike racks
More Accessorized
45.9 BILLION (1999)
55.2 BILLION (2009)
56.1 BILLION (2019)
$23.6$36.9 $43.1
More PopularTotal Passenger Miles Traveled
1,159 4.5K+1,043
More WidespreadPublic transit systems are…
Rural Urban Nonprofit
>52% Increase in Rail RidershipSince 1999
58 98
Receiving More InvestmentTransit Spending in the Private Sector
More Efficient
Heavy Rail
Light Rail/Streetcar
Increase in Vehicle Miles Operated per Kilowatt-Hour over the Past 30 Years
11%23%Increase in Population Growth
28%Increase in Public Transit Ridership
From 1995 – 2019
Growing
1999 2019
1999 20192009$ Billions
ExpandingTotal Number of Rail Systems

APTA | 3 2021 PUBLIC TRANSPORTATION FACT BOOK | 3
More Accessible*
TODAY, PUBLIC TRANSIT IN AMERICA IS…
Demand Response
Light Rail
Commuter Rail
Fixed-route Bus
Heavy Rail
51%41%
32%
83%85%99%
92% 82%100%
96%
1993
2020
Share of Hybrid Electric Buses
(According to APTA’s “Who Rides Public Transportation”)
Cities with more than 40 annual public transit trips per person have half the traffic fatality rate of those with fewer than 20 trips per person
(According to APTA’s “The Hidden Traffic Safety Report: Public Transportation”)
448K+people directly work for public transportation agencies
Long-term investment in public transit supports 50,000 jobs and $382 million in tax revenue per $1 billion invested
(According to APTA’s “Economic Impact of Public Transportation Investment: 2020 Update”)
Reducing Gasoline Consumption
Gallons of Gas Saved
each year by using public transportation
(According to TCRP “Report 226: An Update on Public Transportation’s Impacts on Greenhouse Gas Emissions”)
6.0BILLION
Saving Lives
Lowering Carbon Emissions
Driving the Economy
Creating Jobs
2010: 7.0%
2020: 18.8%(According to APTA’s 2020 Vehicle Database)
Leading in Clean Technology
84%less CO2 emissions by using the subway rather than a car
(According to TCRP “Report 226: An Update on Public Transportation’s Impacts on Greenhouse Gas Emissions”)
Share of Accessible Public Transit Vehicles
Increase in Rail RidershipSince 1999
CO2
of trips on transit directly benefit the local economy
87%
50% of trips are to and from work
37% of trips are to shopping and recreational spending
* transit system accessibility is also affected by station accessibility

4 | APTA
Statistical Category Bus Commuter Demand Transit Total Roadway Commuter Heavy Rail Light Rail Streetcar Ferryboat Total Fixed- Total All Bus Response Vanpool Modes Rail Guideway Transit (b) Modes
Other (Millions) 239.6 49.5 52.6 3.2 348.7 145.1 176.2 19.7 1.6 18.0 364.1 712.8
Operating Expense by Function Class:
Vehicle Operations (Millions) 12,096.7 525.1 1,709.1 26.5 14,654.8 2,191.7 3,108.2 954.0 72.4 443.5 6,871.2 21,526.0
Vehicle Maintenance (Millions) 3,874.7 155.5 278.7 13.7 4,401.9 1,400.4 1,566.2 504.5 44.4 109.7 3,689.3 8,091.2
Non-Vehicle Maintenance (Millions) 934.8 53.4 81.4 4.4 1,115.5 1,131.3 3,040.2 436.8 15.6 46.0 4,712.6 5,828.1
General Administration (Millions) 4,058.1 197.3 943.3 60.2 5,348.1 948.4 1,563.4 493.1 37.4 123.5 3,233.7 8,581.8
Purchased Transportation (Millions) 2,754.6 248.3 3,215.1 71.4 6,313.4 986.3 49.7 74.5 64.0 179.5 1,445.9 7,759.3
Expense, Capital Total (Millions) 4,983.4 228.4 673.4 32.2 6,330.1 4,947.6 7,915.7 4,074.1 320.2 605.8 17,956.1 24,286.1
Rolling Stock (Millions) 3,019.4 180.0 502.8 31.4 3,959.6 782.0 798.7 575.2 70.5 359.3 2,592.6 6,552.2
Facilities, Guideway, Stations, Admin. Buildings (Millions) 1,387.9 44.7 89.9 0.4 1,707.2 3,551.0 5,702.7 3,300.7 231.7 239.4 13,089.3 14,796.5
Other (Millions) 576.1 3.8 80.8 0.4 663.2 614.6 1,414.3 198.2 18.0 7.0 2,274.2 2,937.4
Revenue Vehicles Available for Maximum Service 66,847.8 5,358.3 73,155.5 15,823.6 163,852.5 7,209.3 11,198.0 2,325.0 391.0 245.9 21,879.2 185,731.7
Revenue Vehicles Operated at Maximum Service 53,182.3 4,183.0 59,034.2 13,947.0 132,501.5 6,144.0 9,601.0 1,704.0 258.0 205.0 18,283.9 150,785.4
Employees, Operating 198,040 10,272 115,073 923 327,379 31,522 49,655 13,085 1,584 6,751 104,852 432,231
Employees, Vehicle Operations 139,657 7,038 94,317 145 243,311 11,683 16,874 5,800 840 5,072 41,155 284,466
Employees, Vehicle Maintenance 32,162 1,822 8,066 153 42,648 9,313 8,794 2,781 452 697 22,676 65,324
Employees, Non-Vehicle Maintenance 6,223 365 1,950 54 8,785 7,613 19,307 2,620 146 246 30,303 39,089
Employees, General Administration 19,997 1,047 10,740 572 32,634 2,913 4,680 1,885 146 737 10,718 43,352
Employees, Capital 3,013 144 112 3 3,328 3,689 7,829 919 127 143 12,712 16,040
Diesel Fuel Consumed (Gallons, Millions) 360.2 37.0 26.7 1.1 426.6 103.7 — — — 51.6 156.9 583.5
Other Fossil Fuel Consumed (Gallons, Millions) 244.7 4.1 202.8 14.2 467.1 0.5 — — — 1.2 2.1 469.2
Electricity Consumed (kWh, Millions) 23.5 — — — 89.2 1,779.8 3,966.0 954.7 57.4 — 6,830.8 6,919.9
National Totals for Selected Modes, Report Year 2019 (a)

APTA | 5 2021 PUBLIC TRANSPORTATION FACT BOOK | 5
Statistical Category Bus Commuter Demand Transit Total Roadway Commuter Heavy Rail Light Rail Streetcar Ferryboat Total Fixed- Total All Bus Response Vanpool Modes Rail Guideway Transit (b) Modes
Other (Millions) 239.6 49.5 52.6 3.2 348.7 145.1 176.2 19.7 1.6 18.0 364.1 712.8
Operating Expense by Function Class:
Vehicle Operations (Millions) 12,096.7 525.1 1,709.1 26.5 14,654.8 2,191.7 3,108.2 954.0 72.4 443.5 6,871.2 21,526.0
Vehicle Maintenance (Millions) 3,874.7 155.5 278.7 13.7 4,401.9 1,400.4 1,566.2 504.5 44.4 109.7 3,689.3 8,091.2
Non-Vehicle Maintenance (Millions) 934.8 53.4 81.4 4.4 1,115.5 1,131.3 3,040.2 436.8 15.6 46.0 4,712.6 5,828.1
General Administration (Millions) 4,058.1 197.3 943.3 60.2 5,348.1 948.4 1,563.4 493.1 37.4 123.5 3,233.7 8,581.8
Purchased Transportation (Millions) 2,754.6 248.3 3,215.1 71.4 6,313.4 986.3 49.7 74.5 64.0 179.5 1,445.9 7,759.3
Expense, Capital Total (Millions) 4,983.4 228.4 673.4 32.2 6,330.1 4,947.6 7,915.7 4,074.1 320.2 605.8 17,956.1 24,286.1
Rolling Stock (Millions) 3,019.4 180.0 502.8 31.4 3,959.6 782.0 798.7 575.2 70.5 359.3 2,592.6 6,552.2
Facilities, Guideway, Stations, Admin. Buildings (Millions) 1,387.9 44.7 89.9 0.4 1,707.2 3,551.0 5,702.7 3,300.7 231.7 239.4 13,089.3 14,796.5
Other (Millions) 576.1 3.8 80.8 0.4 663.2 614.6 1,414.3 198.2 18.0 7.0 2,274.2 2,937.4
Revenue Vehicles Available for Maximum Service 66,847.8 5,358.3 73,155.5 15,823.6 163,852.5 7,209.3 11,198.0 2,325.0 391.0 245.9 21,879.2 185,731.7
Revenue Vehicles Operated at Maximum Service 53,182.3 4,183.0 59,034.2 13,947.0 132,501.5 6,144.0 9,601.0 1,704.0 258.0 205.0 18,283.9 150,785.4
Employees, Operating 198,040 10,272 115,073 923 327,379 31,522 49,655 13,085 1,584 6,751 104,852 432,231
Employees, Vehicle Operations 139,657 7,038 94,317 145 243,311 11,683 16,874 5,800 840 5,072 41,155 284,466
Employees, Vehicle Maintenance 32,162 1,822 8,066 153 42,648 9,313 8,794 2,781 452 697 22,676 65,324
Employees, Non-Vehicle Maintenance 6,223 365 1,950 54 8,785 7,613 19,307 2,620 146 246 30,303 39,089
Employees, General Administration 19,997 1,047 10,740 572 32,634 2,913 4,680 1,885 146 737 10,718 43,352
Employees, Capital 3,013 144 112 3 3,328 3,689 7,829 919 127 143 12,712 16,040
Diesel Fuel Consumed (Gallons, Millions) 360.2 37.0 26.7 1.1 426.6 103.7 — — — 51.6 156.9 583.5
Other Fossil Fuel Consumed (Gallons, Millions) 244.7 4.1 202.8 14.2 467.1 0.5 — — — 1.2 2.1 469.2
Electricity Consumed (kWh, Millions) 23.5 — — — 89.2 1,779.8 3,966.0 954.7 57.4 — 6,830.8 6,919.9
(a) Data for all public transportation service, urbanized area and rural. (b) Total figure represents more modes than included in this table.

The COVID-19 pandemic presented an unprecedented time of adversity for public transit agencies. Agencies and their employees rose to the many challenges, proving transit is flexible, innovative, and essential.
In mid-March 2020, the country faced a turning point in the COVID-19 pandemic. Many states and local areas instituted stay-at-home orders, reducing activity, work, and travel away from home to essential activities only. Public transit agencies felt the impact immediately; ridership dropped as people stayed home, and agencies worked to provide protection for their employees. Many agencies worked quickly to redeploy services to critical routes for essential travel and split shifts to provide social distance for employees.
By serving essential travel to jobs, grocery stores, medical facil-ities, and other loca-tions, public transit agencies and transit workers proved they are critical to our nation’s survival. Transit agencies also innovated, offering new services to pro-
vide flexible travel and serve those staying at home, and implementing policies to keep employees and riders safe. Many of them shifted some vehicles and employees to
drive meals and deliver groceries to members of the community who were not able to travel. While the federal government began requiring riders to wear masks on transit in January 2021, more than 85 percent of agencies were requiring masks in July 2020, ensuring transit was a safe travel option.
Transit agencies and transit workers have also been a crucial part of the vaccine rollout. Many agencies offered free rides to vaccination sites. Others coordinated with hospitals and medical centers to provide transportation for vulnerable individuals so they could be vaccinated. Some agencies turned their own facilities into mass vaccination sites.
Throughout the pandemic, public transit workers sacrificed to serve the public, and transit agencies and their employees demonstrated the essential nature of their service.
Public Transit’s Response to COVID-19: Heroes Moving Heroes
6 | APTA
By serving essential travel to jobs, grocery stores, medical facilities, and other locations, public transit agencies and transit workers proved they are critical to our nation’s survival.

APTA | 7 2021 PUBLIC TRANSPORTATION FACT BOOK | 7
Public transportation includes urban, rural, bus systems, paratransit, bus-rapid transit (BRT), water-borne services, subways, light rail, streetcars and other urban rail networks, and passenger rail, from commuter rail to intercity high-speed systems. Public transportation is available in every state across America, both in cities and more rural areas, providing nearly 10 billion commuter, leisure, non-emergency medical and specialized trips each year.
In 2019, approximately 6,800 organizations provided public transportation through a variety of modes. An estimated 4,580 nonprofit providers make up the majority of these organizations. Systems operating in urbanized and rural areas receive grant money from the Federal Transit Administration (FTA) and report to the National Transit Database (NTD) as full, reduced or rural systems. Of the 2,202 NTD reporting systems, 1,159 were in rural areas and 1,043 were in urbanized areas (Figure 1).1
Figure 2 depicts the number of modes operated by public transit systems, with demand response being the mode most operated. Demand response services are point-to-point operations often used by people with disabilities or people unable to travel on fixed-route service. Demand response vans may also substitute for fixed-route service at off-peak times, such as late at night.
Bus rapid transit systems offer lower-cost options for providing efficient, high-capacity transportation with features such as defined stations, traffic signal priority, and increased frequencies. The FTA defines fixed guideway BRT as operating at least 50 percent of peak service in a separate right of way, as opposed to corridor-based BRT systems, which do not. Thirteen fixed guideway BRT systems were operating in 2019, double the number from 2010. In addition, there were also 1,194 bus and 169 commuter bus systems operating. A total of 46 ferryboat systems were operational in 2019, 14 more than in 2010.
Public Transit System Overview
1 Urbanized areas are defined as areas with a population over 50,000 people.
Figure 1: The Majority of Transit Systems are in Rural Areas
Number of NTD Reporting Transit Systems
1,043
1,159
SOURCE: NATIONAL TRANSIT DATABASE
SOURCE: APTA FACT BOOK ANALYSIS * Consists of trolleybus, vanpool, ferryboat and other fixed guideway modes
Urbanized Areas Rural Areas
Figure 2: The Majority of Systems Operate Demand Response Service
Number of Systems Offering a Mode of Service
2,000
1,800
1,600
1,400
1,200
1,000
800
600
400
200
0Rail Bus
1,240
98
1,760
179
Demand Response
Other*

8 | APTA
SOURCE: APTA FACT BOOK ANALYSIS
Figure 3 shows how the number of rail systems around the country continues to grow. Of the 98 rail systems now operated by public transit agencies, only nine have been operating since the 19th century. Compared with 1999, there were 16 additional commuter/hybrid rail systems and 23 additional light rail/streetcar systems. Heavy rail systems are often referred to as “subways” or “metros” and do not interact with traffic. Light rail and streetcars constitute “surface rail” and may operate on streets, with or without their own dedicated lanes. Finally, commuter rail services are higher-speed, higher-capacity trains with less-frequent stops. Commuter rail traditionally is used to connect people from suburban areas to city centers. Hybrid rail is a subset of commuter rail operating exclusively on freight railroad right-of-way.
The number of rail systems continued to grow with the opening of one new system in 2019, TEXRail. Figure 4 lists this new system, along
with the four new BRT systems, four rail extensions, and three BRT extensions that occurred in 2019.
Figure 4: New Rail and BRT Infrastructure Expanding Public Transit’s Reach2019 Rail and BRT Openings
Urbanized Area
Fort Worth, TX
San Diego, CA
Everett, WA
Denver, CO
Phoenix, AZ
Denver, CO
Minneapolis, MN
Chicago, IL
Indianapolis, IN
Tulsa, OK
Albuquerque, NM
San Francisco, CA
Organization
Trinity Metro
San Diego Metropolitan Transit System
Community Transit
Regional Transportation District
Valley Metro
Regional Transportation District
Metro Transit
Pace
Indianapolis Public Transportation Corporation
Tulsa Transit
City of Albuquerque Transit Department
Sonoma-Marin Area Rail Transit
Mode
CR
RB
RB
CR
LR
LR
RB
RB
RB
RB
RB
CR
Figure 3: 56 More Rail Systems Now Than 30 Years AgoCount of Rail Systems
45
40
35
30
25
20
15
10
5
0
1989
1990
1991
1992
1993
1994
1995
1996
1997
1998
1999
2000
2001
2002
2003
2004
2005
2006
2007
2008
2009
2010
2011
2012
2013
2014
2015
2016
2017
2018
2019
SOURCE: APTA FACT BOOK ANALYSIS

APTA | 9 2021 PUBLIC TRANSPORTATION FACT BOOK | 9
Segment Line or Route Name
TEXRail
South Bay Rapid Second Phase
Swift Green Line
G Line
Gilbert Road Extension
Southeast Rail Extension
C Line
Pulse Milwaukee Line
Red Line Phase 1
Aero BRT
ART
Larkspur Extension
Line Segment Miles
27
11.5
16.7
11.2
2.1
2.3
8.4
7.6
13.6
18
9
2.2
Number of Added Stations
9
7
34
7
2
3
24
10
28
52
19
1
Date Opened
1/10/19
1/27/10
3/29/19
4/26/19
5/18/19
5/19/19
6/8/19
8/11/19
9/1/19
11/17/19
11/30/19
12/14/19
Project Type
New System
Extension
Extension
Extension
Extension
Extension
Extension
New System
New System
New System
New System
Extension
Figure 3: 56 More Rail Systems Now Than 30 Years AgoCount of Rail Systems
45
40
35
30
25
20
15
10
5
0
1989
1990
1991
1992
1993
1994
1995
1996
1997
1998
1999
2000
2001
2002
2003
2004
2005
2006
2007
2008
2009
2010
2011
2012
2013
2014
2015
2016
2017
2018
2019
Cities such as Charlotte and Orlando continue to add to their rail networks, making high-quality transit available to more people. Other cities, including Seattle, Los Angeles and Denver, have recently made significant investments in capital
expansion projects, resulting in increased rail ridership. From 2000 to the end of 2019, 69 new systems and 135 extensions (both rail and busway) opened, resulting in a total of 1,742 additional segment miles.
Heavy Rail Commuter and Hybrid Rail Light Rail and Streetcar
10 | APTA
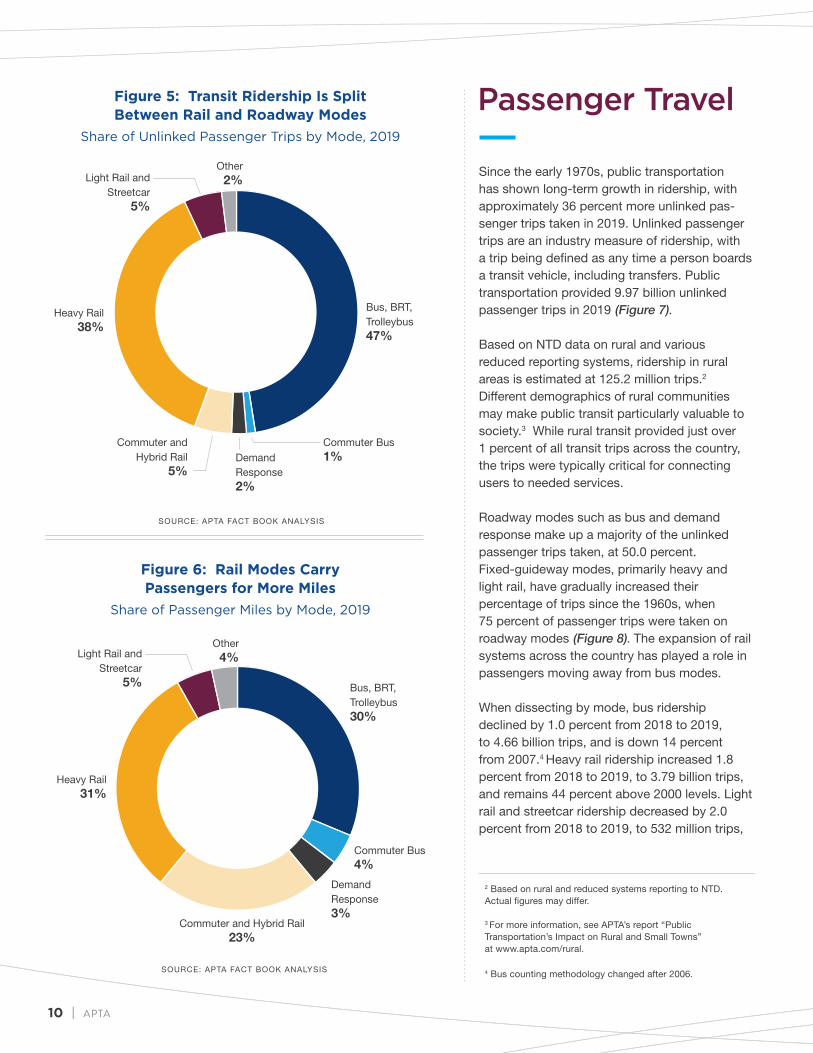
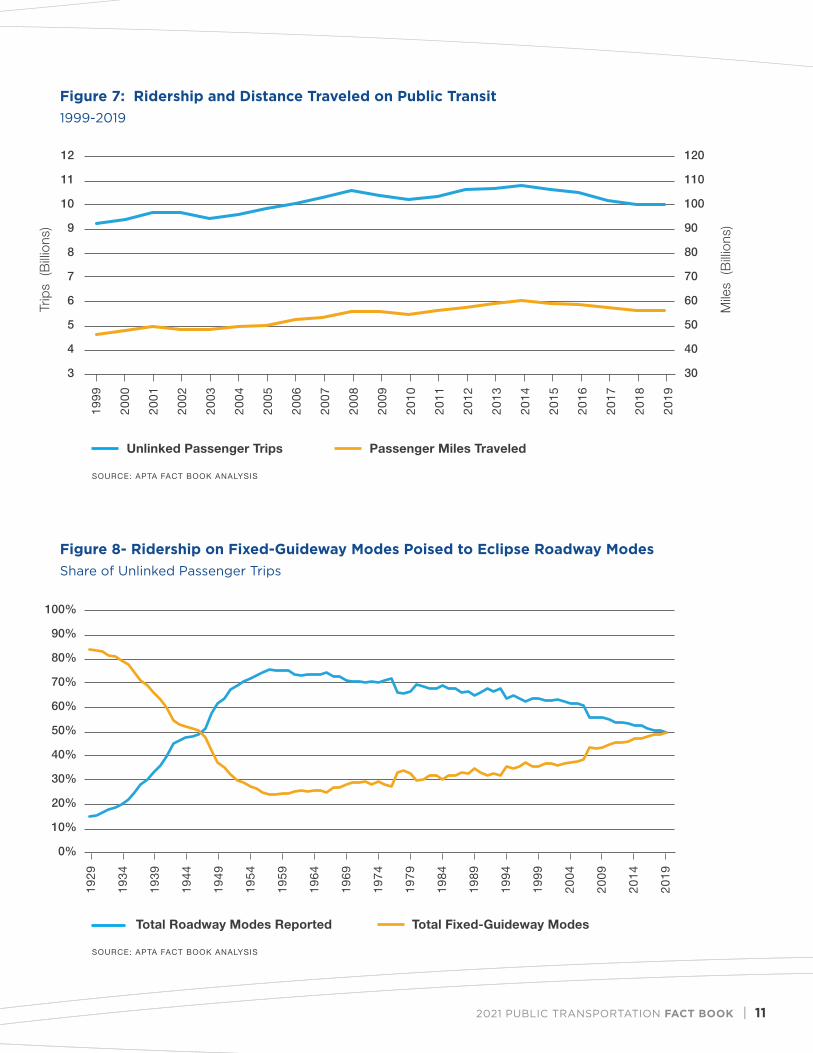
Since the early 1970s, public transportation has shown long-term growth in ridership, with approximately 36 percent more unlinked pas-senger trips taken in 2019. Unlinked passenger trips are an industry measure of ridership, with a trip being defined as any time a person boards a transit vehicle, including transfers. Public transportation provided 9.97 billion unlinked passenger trips in 2019 (Figure 7).
Based on NTD data on rural and various reduced reporting systems, ridership in rural areas is estimated at 125.2 million trips.2 Different demographics of rural communities may make public transit particularly valuable to society.3 While rural transit provided just over 1 percent of all transit trips across the country, the trips were typically critical for connecting users to needed services.
Roadway modes such as bus and demand response make up a majority of the unlinked passenger trips taken, at 50.0 percent. Fixed-guideway modes, primarily heavy and light rail, have gradually increased their percentage of trips since the 1960s, when 75 percent of passenger trips were taken on roadway modes (Figure 8). The expansion of rail systems across the country has played a role in passengers moving away from bus modes.
When dissecting by mode, bus ridership declined by 1.0 percent from 2018 to 2019, to 4.66 billion trips, and is down 14 percent from 2007.4 Heavy rail ridership increased 1.8 percent from 2018 to 2019, to 3.79 billion trips, and remains 44 percent above 2000 levels. Light rail and streetcar ridership decreased by 2.0 percent from 2018 to 2019, to 532 million trips,
Passenger Travel
2 Based on rural and reduced systems reporting to NTD. Actual figures may differ. 3 For more information, see APTA’s report “Public Transportation’s Impact on Rural and Small Towns” at www.apta.com/rural. 4 Bus counting methodology changed after 2006.
Figure 5: Transit Ridership Is Split Between Rail and Roadway Modes
Share of Unlinked Passenger Trips by Mode, 2019
Figure 6: Rail Modes Carry Passengers for More Miles
Share of Passenger Miles by Mode, 2019
SOURCE: APTA FACT BOOK ANALYSIS
SOURCE: APTA FACT BOOK ANALYSIS
Light Rail and Streetcar
5%
Light Rail and Streetcar
5%
Heavy Rail 38%
Heavy Rail 31%
Commuter and Hybrid Rail
5%
Commuter and Hybrid Rail 23%
Demand Response 2%
Demand Response 3%
Commuter Bus 1%
Commuter Bus 4%
Bus, BRT, Trolleybus 47%
Bus, BRT, Trolleybus 30%
Other2%
Other4%
APTA | 11 2021 PUBLIC TRANSPORTATION FACT BOOK | 11
Figure 7: Ridership and Distance Traveled on Public Transit1999-2019
Figure 8- Ridership on Fixed-Guideway Modes Poised to Eclipse Roadway ModesShare of Unlinked Passenger Trips
SOURCE: APTA FACT BOOK ANALYSIS
SOURCE: APTA FACT BOOK ANALYSIS
12
11
10
9
8
7
6
5
4
3
120
110
100
90
80
70
60
50
40
30
1999
2000
2001
2002
2003
2004
2005
2006
2007
2008
2009
2010
2011
2012
2013
2014
2015
2016
2017
2018
2019
Trip
s (B
illio
ns)
Mile
s (B
illio
ns)
100%
90%
80%
70%
60%
50%
40%
30%
20%
10%
0%
1929
1934
1939
1944
1949
1954
1959
1964
1969
1974
1979
1984
1989
1994
1999
2004
2009
2014
2019
Unlinked Passenger Trips
Total Roadway Modes Reported
Passenger Miles Traveled
Total Fixed-Guideway Modes

12 | APTA
though is up 66 percent from 2000. Commuter and hybrid rail ridership grew by 1.4 percent from 2018 to 2019, to 520 million trips, and is up 26 percent from 2000. Finally, demand response ridership is down 1.4 percent from 2018 to 2019, to 201 million trips.
Passenger miles are the culmination of the distances traveled by passengers on public transportation. Mirroring ridership, the number of transit passenger miles traveled increased slightly in 2019 to 56.1 billion, a 0.5 percent increase from 2018. Rail modes make up a majority of the total passenger miles taken (59 percent).
The average public transit trip length in 2019 was 5.6 miles. The longest average trip was taken on a vanpool at 36.1 miles, while the shortest average trip was taken on a trolleybus at 1.7 miles. The average trip length on light rail was 5.2 miles; heavy rail, 4.6 miles; bus, 3.7 miles; commuter bus, 24.0 miles; commuter rail, 25.1 miles; and streetcar, 2.0 miles.
Over the past two decades, the growth of public transit passenger miles has eclipsed that of
vehicle miles traveled—22 percent to 21 percent (Figure 9).5 These metrics compare the total distance traveled by riders on public transportation and the total distance traveled by drivers on highways. The growth of public transportation ridership has fallen slightly below that of the nation’s population in the last decade, 9 percent to 18 percent (Figure 10).6 Increased automobile ownership, reduced gasoline prices, mobile ride-hailing, and flexible teleworking schedules are all likely contributors to the fluctuations in travel trends.
The importance of public transit as a means of travel to work is substantial, with over 7.8 million Americans commuting to work on transit.7 That’s equivalent to 5.0 percent of workers who commute by public transportation.
The top 10 metropolitan areas ranked by percentage of public transit commuters were New York City (31.6 percent); San Francisco (18.9 percent); Boston (13.4 percent); Washington, DC (13.1 percent); Chicago (12.4 percent); Seattle (10.7 percent); Bremerton, WA. (10.5%): Bridgeport, CT (10.5%); Philadelphia (9.8 per-
Figure 9: Distance Traveled on Public Transit Grew Faster than on HighwaysVehicle Miles Traveled vs Transit Passenger Miles Growth Since 1999
35%
30%
25%
20%
15%
10%
5%
0%
1999
2000
2001
2002
2003
2004
2005
2006
2007
2008
2009
2010
2011
2012
2013
2014
2015
2016
2017
2018
2019
1999
2000
2001
2002
2003
2004
2005
2006
2007
2008
2009
2010
2011
2012
2013
2014
2015
2016
2017
2018
2019
20%18%16%14%12%10%
8%6%4%2%0%
SOURCE: APTA FACT BOOK ANALYSIS AND FHWA TRAVEL TRENDS
Transit Passenger Miles Vehicle Miles Traveled

APTA | 13 2021 PUBLIC TRANSPORTATION FACT BOOK | 13
In 2019, public transportation in the United States provided 5.12 billion vehicle revenue miles of service, equating to 338.8 million hours of revenue service, both increases over 2018 (Figure 11). Vehicle revenue miles and hours are both critical service measurements and record the distance that public transportation vehicles travel while in service, and for how long they operate in service.
Figure 12 compares the percentages of all public transportation services provided and consumed by modal grouping. More than half of vehicle revenue hours operated are provided by buses, which carry just less than half of all passengers. Since bus passengers take
shorter trips and buses operate at lower speeds compared with other modes, they carry fewer than two-fifths of all passenger miles traveled. In contrast, rail vehicles provide only 16 percent of vehicle revenue hours of service, but—due to their longer and higher-speed trips—account for 59 percent of all passenger miles traveled on public transit.
The highest average vehicle speed was provided by transit vanpool and commuter rail service, both of which carry passengers on long trips, at 37.0 and 30.7 miles per hour, respectively. Heavy rail, because of its right-of-way separate from other traffic, offers fast service in higher- density urban areas, operating at an average
Service Provided
35%
30%
25%
20%
15%
10%
5%
0%
1999
2000
2001
2002
2003
2004
2005
2006
2007
2008
2009
2010
2011
2012
2013
2014
2015
2016
2017
2018
2019
1999
2000
2001
2002
2003
2004
2005
2006
2007
2008
2009
2010
2011
2012
2013
2014
2015
2016
2017
2018
2019
20%18%16%14%12%10%
8%6%4%2%0%
SOURCE: APTA FACT BOOK ANALYSIS AND U.S. CENSUS BUREAU
Population Growth Ridership Growth
cent); and Trenton, NJ (7.7 percent). Since met-ropolitan statistical areas (MSAs) are comprised of entire counties and often include significant amounts of rural land, actual transit usage within each urban area is higher than the ACS number.
5Highway vehicle miles traveled sourced from the Federal Highway Administration’s “Travel Volume Trends.”
6Population data sourced from the U.S. Census Bureau.
7Commuting data sourced from the U.S. Census Bureau’s “American Community Survey.”
Figure 10: Transit Ridership Growth Fluctuates with Population GrowthPopulation vs Ridership Growth Since 1999

14 | APTA
speed of 19.9 miles per hour. Modes operating entirely in traffic on city streets are slower. Bus service, which operates in suburbs as well as in central cities, averages 12 miles per hour. Other modes operate at lower speeds when they are in denser areas and stop more frequently.
Transit agencies have been experimenting with new mobility pilots to expand their service reach. These may be classified as first/last-mile services, paratransit supplements or microtransit services. APTA’s “2019 Fare Database” recorded 36 transit agencies that have mobility pilots, either with Uber, Lyft, other private operators or in-house operators. For more details about new mobility initiatives, please visit the APTA Mobility Innovation Hub.8
100%
90%
80%
70%
60%
50%
40%
30%
20%
10%
0%
2% 3% 5% 2%
Unlinked Trips
Passenger Miles
Vehicle Revenue
Miles
Vehicle Revenue
Hours
49%
48%
59%
35%
23%
16%
2%
3%
29%
43%
28%
53%
Figure 11: Public Transit Agencies Continue to Provide More Service Each YearVehicle Revenue Miles (VRM) and Hours (VRH) Operated
Figure 12: Different Modes Serve Different PurposesModal Shares of Service Provided and Consumed, 2019200,000
180,000
160,000
140,000
120,000
100,000
600
550
500
450
400
350
300
250
200
6,000
5,500
5,000
4,500
4,000
3,500
3,000
2,500
2,000
Hou
rs
(Mill
ions
)
Mile
s (M
illio
ns)
1999
2000
2001
2002
2003
2004
2005
2006
2007
2008
2009
2010
2011
2012
2013
2014
2015
2016
2017
2018
2019
1999
2000
2001
2002
2003
2004
2005
2006
2007
2008
2009
2010
2011
2012
2013
2014
2015
2016
2017
2018
2019
SOURCE: APTA FACT BOOK ANALYSIS
SOURCE: APTA FACT BOOK ANALYSIS
VRM Operated VRH Operated
Bus Demand Response
Rail Other 8 https://www.apta.com/resources/mobility/Pages/default.aspx

APTA | 15 2021 PUBLIC TRANSPORTATION FACT BOOK | 15
Public transportation systems in the United States operated 150,785 railcars, buses, vans and other vehicles in a typical peak period during 2019, out of a total of 185,732 vehicles available for service (Figure 13). Demand response service and bus modes make up the majority of vehicles available, at 73,155 and
72,665, respectively. The heavy rail fleet of 11,198 vehicles is the largest among the rail modes.
The fuel distribution of the bus fleet has evolved dramatically over the past two decades (Figure 14). More than 95 percent of buses
Vehicles
Figure 13: The Transit Vehicle Fleet On a 20-Year Upward TrendRevenue Vehicles Available for Maximum Service
Figure 14: Buses Making Transition to Alternative FuelsPercentage of Buses by Fuel Source
200,000
180,000
160,000
140,000
120,000
100,000
600
550
500
450
400
350
300
250
200
6,000
5,500
5,000
4,500
4,000
3,500
3,000
2,500
2,000
Hou
rs
(Mill
ions
)
Mile
s (M
illio
ns)
1999
2000
2001
2002
2003
2004
2005
2006
2007
2008
2009
2010
2011
2012
2013
2014
2015
2016
2017
2018
2019
1999
2000
2001
2002
2003
2004
2005
2006
2007
2008
2009
2010
2011
2012
2013
2014
2015
2016
2017
2018
2019
SOURCE: APTA FACT BOOK ANALYSIS
SOURCE: 2020 APTA VEHICLE DATABASE
(a) includes Battery-Electr ic, Hydrogen and Propane Buses
100%
90%
80%
70%
60%
50%
40%
30%
20%
10%
0%2010 2011 // 2013 2014 2015 2016 2017 2018 2019 2020
Diesel Natural Gas Hybrid Biodiesel Gasoline Other (a)

16 | APTA
were diesel powered as recently as 1995, but that percentage has declined as more environmentally friendly natural gas and hybrid buses have been introduced. According to APTA’s Vehicle Database, in 2020 less than half (45 percent) of all buses were diesel powered. Hybrid electric buses saw their market share increase from 1 percent in 2005 to 18 percent in 2020. The percentage of buses powered by natural gas has increased from 19 percent in 2010 to 30 percent in 2020.
The FTA establishes a minimum useful life that a vehicle must exceed before federal financial
assistance can be used to replace it. Many vehicles are rehabilitated, thereby extending their useful lives and reducing maintenance costs. Figure 15 details how the average age of vehicles by mode compares with the stated minimum useful life.9 APTA estimates that approximately 19 percent of buses, 48 percent of commuter rail locomotives, 33 percent of commuter rail cars, 46 percent of heavy rail cars, 21 percent of light
Figure 15: Transit Fleet Age Compared to FTA Minimum Useful Life GuidelinesVehicle Age by Mode
Figure 16: Transit Buses Continue to Add Amenities and TechnologyPercentage of Buses with Passenger Equipment, 2010-2020
30
25
20
15
10
5
0
100%
80%
60%
40%
20%
0%
Bus
Automated Stop Announcement
Security or CCTV Type
Camera
Exterior Bicycle Rack
Automatic Vehicle
Locator or GPS
Traf�c Light Preemption
Wi-Fi Electric Outlets
Automatic Passenger Counter
Pedestrian Detection
FerryboatTrolleybusLight Rail and
Streetcar
Heavy RailDemand Response
Commuter Rail
Locomotives
Commuter/ Hybrid Rail
Cars
12
7
25 25
4
25 25
15
25
75%72%
94%
60%
20%
5%
41%
1%11%
2%
70%
32%
5%
84%
53%
81%
48%
26
4
24
3
6
23
18
SOURCE: 2019 APTA VEHICLE DATABASE
SOURCE: 2020 APTA VEHICLE DATABASE
2020 Average Age FTA Minimum Life
2010 2020
9 Federal requirement for “Minimum Useful Life” in FTA C 9300.1B, “Capital Investment Program Guidance and Application Instruction,” at www.fta.dot.gov.

APTA | 17 2021 PUBLIC TRANSPORTATION FACT BOOK | 17
100%
81% 82%92%
64%
96%93%100%99%
77%
100%
51%
100%90%80%70%60%50%40%30%20%10%0%
Bus TrolleybusLight Rail and Streetcar
Heavy RailDemand Response
Commuter and Hybrid Rail
rail vehicles and 49 percent of demand response vehicles exceed their useful life.
The increase in the percentage of buses with technological equipment illustrates the sustained effort by the public transportation industry to make travel safer, easier and more efficient for riders (Figure 16). The industry’s focus on security is seen in the increase in buses equipped with closed-circuit security cameras, which rose from 53 percent to 84 percent between 2010 and 2020. Enhanced passenger amenities such as automated stop announce-ments and exterior bus bicycle racks also increased, from 48 percent to 81 percent and from 72 percent to 75 percent, respectively. The growth of automatic passenger counters and vehicle location systems increase the availability of information on bus arrival times and make public transit data more accurate and accessible. Increased use of technology, such as traffic light preemption, can help better deploy transit vehicles, manage congestion and increase system performance.
APTA’s Vehicle Database now includes data on autonomous features in transit vehicles, such as emergency braking, lane-keeping assist, adaptive cruise control, pedestrian detection and collision warning/mitigation. Many of these technologies are still in their infancy as it pertains to bus transit vehicles. The 2020 Vehicle Database noted 348 buses with collision warning/mitigation, lane-keeping assist, and
pedestrian/bicyclist detection. APTA looks forward to monitoring the proliferation of these technologies.
As shown in Figure 17, the public transit vehicle fleet has reached near total accessibility for people using wheelchairs and those with other disabilities affecting travel. From 2000 to 2020, the percentage of accessible buses increased from 81 percent to 99.8 percent. Over the same period, the accessible portion of the commuter rail fleet increased from 64 percent to 82 percent, the light rail fleet increased from 77 percent to 92 percent, and the trolleybus fleet increased from 51 percent to 100 percent.
One safety priority for commuter rail public transportation systems has been the transition to positive train control (PTC). PTC is a complex signaling and communications technology designed to make commuter and intercity rail operations even safer. PTC uses a series of sensors and integrated monitoring systems that track key movement of trains and conditions on rail tracks in real time to identify potentially hazardous situations. If certain unsafe situ-ations arise, PTC will automatically trigger a train’s braking system to slow it and prevent an accident, such as a train-to-train collision. All commuter rail systems have successfully met the 2020 PTC congressional deadline and are fully implemented. Full implementation of PTC for publicly funded commuter railroads required a more than $4 billion investment.
COMMUTER RAIL: These longer- distance services typically connect suburban areas to the city center.
SURFACE RAIL: Refers to both light rail and streetcar modes. Streetcars typically do not have dedicated lanes, while light rail does.
Figure 17: Public Transit Vehicles Have Made Substantial Progress in AccessibilityPercentage of Vehicles Accessible by Mode, 2000-2020
SOURCE: 2020 APTA VEHICLE DATABASE
2000 2020

18 | APTA
Rail transit systems own track and rights-of-way, stations, administrative buildings, and maintenance facilities. Bus systems have passenger stations and stops, maintenance facilities, parking lots, administrative buildings, and dedicated roadways. Directional route miles are a National Transit Database metric that counts all the rights-of-way on which rail vehicles operate. If they operate in one direction, then the right-of-way is counted as one mile for each physical mile. If vehicles operate in both directions, then the right-of-way is counted as two miles. Neither number of routes operated along a direction, nor the number of tracks, affects the count of directional route miles (Figure 18).
Commuter and hybrid railroads have the most route mileage (more than 9,246 miles combined), while heavy rail and light rail/streetcar have 1,661 and 1,830 miles, respectively. Light rail and streetcar modes have seen an impressive gain in the percentage of total rail directional route miles since 2008, increasing by 31 percent. Commuter and hybrid rail directional route mileage increased by 13 percent over the same time period. For rail modes, this translates into 12,289 miles of revenue service track, with a total of 8,760 grade crossings.
Buses (including BRT, trolley and commuter) operate on more than 226,000 miles of streets and roads throughout the United States. Although most bus services operate in mixed traffic, they also operate on 5,030 miles of exclusive and controlled right-of-way roadway miles. Out of this, 1,206 miles are exclusive fixed-guideway, right-of-way roadways where only transit can operate, such as busways or dedicated bus lanes. The remaining lane miles are either permanent HOV lanes, or lanes that may be transit-dedicated for certain periods and open to general traffic for others (typically during off-peak times).
The industry has seen an increase in electronic devices at rail stations, making for better passenger information and improved safety. According to APTA’s 2018 Infrastructure Database, between 2000 and 2018, the number of rail stations with public address systems grew from 47 percent to 79 percent, the number of rail stations with vehicle arrival time displays grew from 3 percent to 70 percent and the number of rail stations with informational video displays grew from 12 percent to 47 percent (Figure 19). In addition, 55 percent of rail stations today have security cameras, and 21 percent have Wi-Fi. The percentage of accessible rail stations has
Infrastructure
Figure 18: Commuter and Surface Rail Service Miles GrowingRail Directional Route Miles
SOURCE: NATIONAL TRANSIT DATABASE
Heavy Rail Commuter Rail Light Rail and Streetcar Other
14,000
12,000
10,000
8,000
6,000
4,000
2,000
02008 2009 2010 2011 2012 2013 2014 2015 2016 20182017 2019
Mile
s

APTA | 19 2021 PUBLIC TRANSPORTATION FACT BOOK | 19
grown from 52 percent to 74 percent from 2002 to 2019. Figure 20 details accessibility percentages for all modes, according to the NTD.
There are 5,645 transit passenger stations across the country. A passenger station refers to a boarding area with a platform. These stations are equipped with a total of 2,781 escalators and 3,158 elevators.
Transit payment systems are also quickly evolving. The percentage of public transit systems offering “smart cards” has jumped from 12 percent in 2009 to 47 percent in 2020. Some agencies are adopting open payment systems, which can accept contactless debit/
credit cards and mobile phone payments, as well as agency smart cards. APTA’s Fare Database estimates that 25 percent of public transit systems are now offering these open payment technologies.
Dependability is critical to ensuring high-quality public transit service. In 2019, 2,373 total maintenance facilities were recorded.10 For service directly operated by transit agencies, 1,431 facilities were owned and 132 were leased. For purchased transportation service, 257 were owned by private transit providers, 286 were owned by public agencies, and 268 were leased.
Figure 19: Rail Stations Adding Customer Amenities and Improving AccessPercentage of Rail Passenger Stations with Amenities, 2000-2018
Figure 20: More Transit Stations Are AccessiblePublic Transit Station Accessibility by Mode, 2002-2019
100%90%80%70%60%50%40%30%20%10%0%
80%
60%
40%
20%
0%
Bus
Public Address Systems
Vehicle Arrival Time Displays
Security Cameras
Wi-Fi ADA Accessibility
Total StationsLight Rail and Streetcar
Heavy RailFerryboatCommuter and Hybrid Rail
98%94%
72%
55%
85%85%
57%
37%
91%
72%
82%77%
100%90%80%70%60%50%40%30%20%10%0%
80%
60%
40%
20%
0%
Bus
Public Address Systems
Vehicle Arrival Time Displays
Security Cameras
Wi-Fi ADA Accessibility
Total StationsLight Rail and Streetcar
Heavy RailFerryboatCommuter and Hybrid Rail
98%94%
72%
55%
85%85%
57%
37%
91%
72%
82%77%
SOURCE: 2018 APTA INFRASTRUCTURE DATABASE
SOURCE: NATIONAL TRANSIT DATABASE
SOURCE: NATIONAL TRANSIT DATABASE
2000
2002
2018
2019
10 Includes agency facilities that do not report based on size.

20 | APTA
In 2019, the public transportation industry employed 448,271 people. Approximately 96 percent were operating employees, and less than 4 percent were capital employees. Operating employees include workers in the vehicle operations and maintenance, non- vehicle maintenance, and general administration functions. Transit agency capital employees perform specialized activities and do not include employees of vehicle manufacturers, engineering firms, building contractors or other companies with capital investment contracts from public transit agencies.
The 2019 breakdown of transit operating employees by mode remains similar to past years, with 49 percent working with all bus modes, 27 percent with demand response, 11 percent with heavy rail, 7 percent with commuter and hybrid rail, 3 percent with surface rail, and 2 percent with the remaining modes.
Direct employees were paid a total of $17.5 billion and received benefits of $14.0 billion, for a total compensation of $31.5 billion. Adjusted for inflation, this is more than the $30.9 billion level in 2019. Average operating employee compen-sation declined by 0.8 percent to $70,389.
The public transit industry consumed 1.05 billion gallons of fossil fuels in 2019, an increase of 1.9 percent from 2018, a decrease of 0.7 percent from 2017 (Figure 22). Buses also used 25 million kilowatt-hours (kWh) of electric battery power, reflecting the increase in use of electric buses. While diesel remains the predominant fossil fuel, its market share has declined as cleaner fuels such as compressed natural gas (CNG) and biodiesel have gained in popularity. In 2019, public transit consumed 584 million gallons of diesel (compared to 661 million in 2009), 201 million gallons of CNG, 202 million gallons of gasoline, 44 million gallons of biodiesel, and 20 million gallons of other fossil fuels.
Public transit vehicles used a total of 6.89 billion kWh of electricity for propulsion power in 2019, up 2 percent from 2018. Of that, heavy rail modes were responsible for 4.00 billion kWh, commuter rail 1.78 billion kWh, light rail and streetcar 1 billion kWh, trolleybus 57 million kWh and other modes 73 million kWh. Advancements in technology and operations can help reduce energy use. For example, data indicates that electrically powered transit rail cars have become more efficient. The number of vehicle miles operated for light rail vehicles and streetcars per kWh of electricity used rose 48 percent from 1989 to 2019, and the number of vehicle miles per kWh of electricity used for heavy rail vehicles increased 11 percent for the same period.
Employment
Energy
Figure 21: Majority of Transit Employees Work in Vehicle Operations and MaintenancePercentage of Transit Employees by Function
Vehicle Operations
Facility Maintenance
Capital
Vehicle Maintenance
General Administration
SOURCE: APTA FACT BOOK ANALYSIS
10%
9%
14%
63%
4%
PEOPLE EMPLOYED in the public transportation
industry in 2019
448,271

APTA | 21 2021 PUBLIC TRANSPORTATION FACT BOOK | 21
In 2019, there were 268 transit-related fatalities. Of these, 53 were transit passengers/occupants, 11 were transit workers/employees, and the remainder were other incidents. NTD also reported 6,878 transit collision events, 68 derailments and 2,036 security events in 2018. The sum of all transit safety events increased by 2.2 percent from 2018 to 2019.
Public transportation is one of the safest mobility options, as there were 134 times more fatalities on highways (35,935) than on transit in 2018. APTA’s 2019 “The Hidden Traffic Safety Solution: Public Transportation”12 discusses the many benefits that transit offers for public safety.
Another high-level safety priority for bus and rail public transportation systems has been the draft-ing and implementation of Public Transportation Agency Safety Plans (PTASP), required by the FTA. As of August 10, 2021 more than 700 transit agencies, including APTA members throughout the United States, certified that they now have comprehensive safety plans in place to help keep riders and employees safe on their transit systems.
FTA’s Public Transportation Agency Safety Plan (PTASP) Final Rule (49 CFR Part 673) requires all bus and rail agencies receiving Urbanized Area Formula Grants to draft and implement safety plans that include Safety Management System (SMS) principles and practices. The plans address safety risk through the collection and analyzation of data, and provide a safer ride for passengers, while protecting workers and operators. Also, through the agency safety plan requirement, agencies set safety performance tar-gets that are reviewed and certified every year.
All transit systems have successfully met the requirements of 49 CFR Part 673 (originally written into law by Congress through MAP-21 and the FAST Act at 49 USC 5329) and are in full compliance with the FTA’s PTASP requirement. Transit agencies were assisted in meeting this requirement by attending webinars, workshops, technical assistance and outreach organized by APTA in conjunction with the FTA.
Safety11
Figure 22: Fuel Consumption Remains LevelTotal Fossil Fuel Consumption
Diesel CNG OtherGasoline SOURCE: APTA FACT BOOK ANALYSIS
1,200
1,000
800
600
400
200
02009 2010 2011 2012 2013 2014 2015 2016 2017 2018 2019
Gal
lons
(M
illio
ns)
11 https://www.bts.gov/topics/national-transportation-statistics. 12 https://www.apta.com/resources/reportsandpublications/Documents/APTA-Hidden-Traffic-Safety-Solution-Public- Transportation.pdf.

22 | APTA
Public transportation operations are funded by passenger fares; public transit agency earnings; and financial assistance from state, local and federal governments. Capital investment is reported only as government funds in the NTD. Adjusted for inflation, 2019 total transit funding increased by 0.8 percent to $76.07 billion (Figure 23).
Revenue generated from passenger fares varies across transit modes. The highest level of average revenue per unlinked passenger trip was generated by commuter rail ($6.50) and commuter bus ($6.00), the modes that represent the longer trip lengths for passengers. Bus and light rail had
passenger fare revenues per unlinked trip of $1.09 and $1.14, respectively. Heavy rail had an average fare per trip of $1.50. Among all modes, the average passenger fare per unlinked trip was $1.63. Overall passenger fare revenue declined by 0.6 percent in 2019 to $16.27 billion (Figure 24).
Fare policies vary across agencies, but in general, fares were lower for bus modes and relatively similar for light rail and heavy rail modes. According to APTA’s 2019 Fare Database, the average bus fare was $1.71, the average light rail fare was $2.26, the average heavy rail fare was $2.26, and the average commuter rail fare was $3.73 (Figure 25). These are all base fares and
Capital and Operating Funding
Figure 23: Total Funding For Public TransitTransit Funding (In 2019 dollars)
Figure 24: Passenger Fare Revenue Flattening with Ridership DeclinePassenger Fare Revenue, 1989-2019 (In 2019 Dollars)
1989
1990
1991
1992
1993
1994
1995
1996
1997
1998
1999
2000
2001
2002
2003
2004
2005
2006
2007
2008
2009
2010
2011
2012
2013
2014
2015
2016
2017
2018
2019
80
70
60
50
40
30
20
18
16
14
12
10
8
6
Bill
ions
Bill
ions
1989
1990
1991
1992
1993
1994
1995
1996
1997
1998
1999
2000
2001
2002
2003
2004
2005
2006
2007
2008
2009
2010
2011
2012
2013
2014
2015
2016
2017
2018
2019
1989
1990
1991
1992
1993
1994
1995
1996
1997
1998
1999
2000
2001
2002
2003
2004
2005
2006
2007
2008
2009
2010
2011
2012
2013
2014
2015
2016
2017
2018
2019
80
70
60
50
40
30
20
18
16
14
12
10
8
6
Bill
ions
Bill
ions
1989
1990
1991
1992
1993
1994
1995
1996
1997
1998
1999
2000
2001
2002
2003
2004
2005
2006
2007
2008
2009
2010
2011
2012
2013
2014
2015
2016
2017
2018
2019
SOURCE: APTA FACT BOOK ANALYSIS
SOURCE: APTA FACT BOOK ANALYSIS

APTA | 23 2021 PUBLIC TRANSPORTATION FACT BOOK | 23
SOURCE: APTA FACT BOOK ANALYSIS
Local Plus Directly Generated Assistance State Assistance Federal Assistance
refer to the minimum adult fare for a single trip on a regular service.
Figure 26 shows how capital funding sources have changed since 1989. Federal capital funds de-creased by 1.8 percent from 2018 to 2019 to $7.94 billion from 2017 to 2018 to $7.95 billion. State capital assistance (funding from state governments) increased by 66 percent to 5.60 billion. Directly generated and local capital assistance increased by 1.6 percent from 2018 to 2019 to $11.05 billion. Directly generated assistance refers to agency
funds such as passenger fare revenues, parking revenues, advertising revenues or bond revenues. Local assistance includes funds provided by a local government to a public transit agency, in many cases using local sales taxes or property taxes.
The federal role is more significant for the capital program, providing 32 percent of capital funds, compared with only 8 percent of operating funds. State assistance made up 23 percent of capital funding in 2019, while local and directly generated assistance made up 45 percent of funding.
Figure 25: Revenue Generated from Passenger Fares Varies Across ModesAverage Base Fare Comparison, 2010 and 2020 (In 2020 Dollars)
Figure 26: Local Communities Have Largest Share of Capital InvestmentCapital Funding by Source (In 2019 dollars)
1989
1990
1991
1992
1993
1994
1995
1996
1997
1998
1999
2000
2001
2002
2003
2004
2005
2006
2007
2008
2009
2010
2011
2012
2013
2014
2015
2016
2017
2018
2019
12
10
8
6
4
2
0
Bill
ions
$ 8
$ 7
$ 6
$ 5
$ 4
$ 3
$ 2
$ 1
$ 0Bus Light Rail Commuter
RailHeavy Rail Ferryboat Trolleybus
SOURCE: 2020 APTA FARE DATABASE2010 2020
24 | APTA
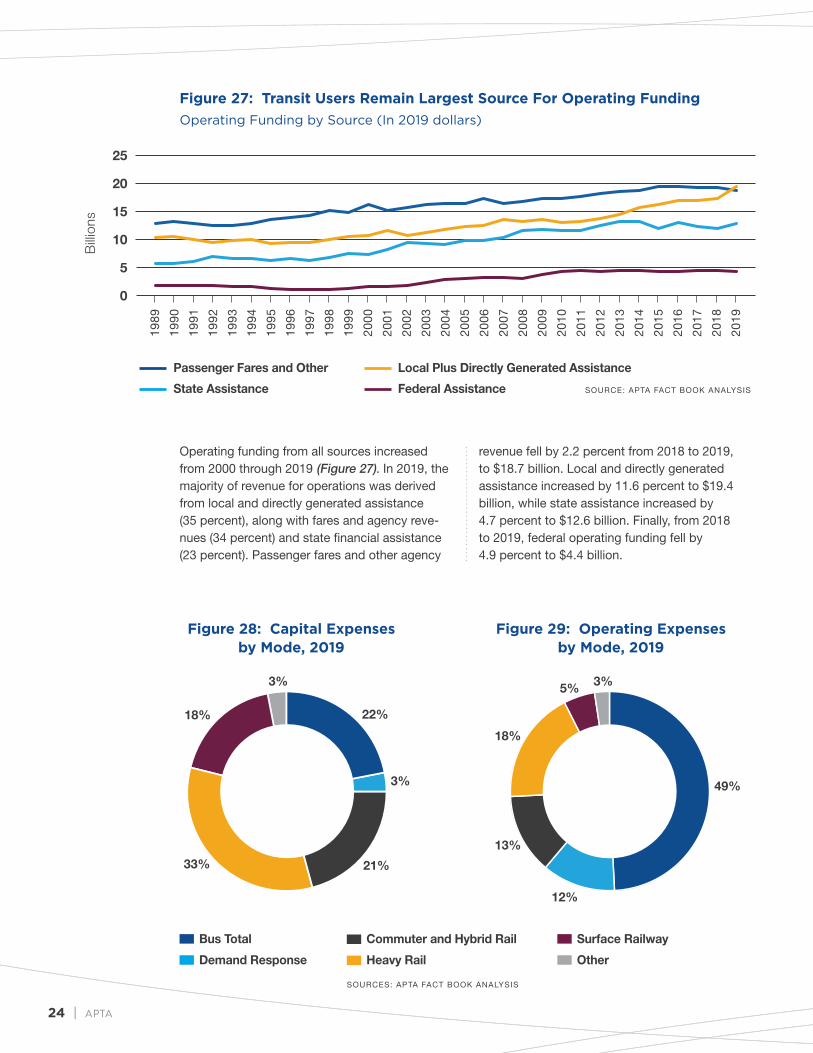
Operating funding from all sources increased from 2000 through 2019 (Figure 27). In 2019, the majority of revenue for operations was derived from local and directly generated assistance (35 percent), along with fares and agency reve-nues (34 percent) and state financial assistance (23 percent). Passenger fares and other agency
revenue fell by 2.2 percent from 2018 to 2019, to $18.7 billion. Local and directly generated assistance increased by 11.6 percent to $19.4 billion, while state assistance increased by 4.7 percent to $12.6 billion. Finally, from 2018 to 2019, federal operating funding fell by 4.9 percent to $4.4 billion.
Figure 27: Transit Users Remain Largest Source For Operating FundingOperating Funding by Source (In 2019 dollars)
Figure 28: Capital Expenses by Mode, 2019
Figure 29: Operating Expenses by Mode, 2019
25
20
15
10
5
0
Bill
ions
1989
1990
1991
1992
1993
1994
1995
1996
1997
1998
1999
2000
2001
2002
2003
2004
2005
2006
2007
2008
2009
2010
2011
2012
2013
2014
2015
2016
2017
2018
2019
SOURCE: APTA FACT BOOK ANALYSIS
Passenger Fares and Other Local Plus Directly Generated Assistance
State Assistance Federal Assistance
Bus Total Commuter and Hybrid Rail Surface Railway
OtherDemand Response Heavy Rail
SOURCES: APTA FACT BOOK ANALYSIS
3% 3%
18%
5%
33%
18%
13%
12%
21%
3%
22%
49%

APTA | 25 2021 PUBLIC TRANSPORTATION FACT BOOK | 25
In 2019, total public transportation expenditures were $76.1 billion, with $51.8 billion (68 percent) spent on operations and $24.3 billion (32 percent) on capital investments. When broken out by mode, the bus modes make up the largest amount of operating expenses at $25.1 billion, followed by heavy rail at $9.3 billion, commuter and hybrid rail at $6.8 billion, and demand response at $6.2 billion. Heavy rail had the largest amount of capital expenditures at $7.9 billion, followed by bus modes at $5.4 billion, commuter and hybrid rail at $5.0 billion and surface rail at $4.4 billion.
Of 2019 capital expenditures, 61 percent ($14.8 billion) went to facilities, 27 percent ($6.6 billion)
to rolling stock, and 12 percent ($2.9 billion) to other capital investments. Figure 30 shows this breakdown by capital expenditure subcategory.
Of 2019 operating expenditures, 42 percent went to vehicle operations ($21.5 billion), 17 percent to general administration ($8.6 billion), 16 percent to vehicle maintenance ($8.1 billion), 15 percent to purchased transportation ($7.8 billion) and 11 percent to non-vehicle maintenance ($5.8 billion).
Operating expenditures are measured by function (the type of activity performed, as already listed) and by object (labor expenses and the type of goods or services purchased).
Capital and Operating Expenses
Figure 30: Capital Expenditures by Type, 2019
Fare Revenue Collection Equipment
1%
Passenger Stations 15%
Guideway
38%
Rolling Stock (Passenger and Service Vehicle) Expenditures
27%
Other
4%Communication and Information Systems
9%
Administrative Buildings
1%
Maintenance Facilities 7%
SOURCE: APTA FACT BOOK ANALYSIS
BILLION public transportation
capital expenditures in 2018
$21.8

26 | APTA
DEMAND RESPONSE: Point-to-point operations commonly used by people with disabilities or people unable to travel on fixed-route service. Demand response vans may also substitute for fixed-route service at off-peak times (such as late at night).
Salaries, wages and fringe benefits for employees of public transit agencies account for 61 percent of total operating expenses. Operating expenses by object class are shown in Figure 31.
Figure 32 shows the variability when comparing operating costs based on different metrics. When measured by cost per vehicle mile, railway modes such as commuter rail and light rail
are more expensive than roadway modes because they use larger vehicles over shorter service miles. When measured by cost per unlinked passenger trip, heavy rail is the least expensive because of the high-capacity service offered. Demand response trips are more expensive per trip because these vehicles carry fewer passengers.
Figure 31: Total Operating Expenses by Object Category, 2019
Purchased Transportation 15%
Utilities 3%
Materials and Supplies
8%
Services 9%
Fringe Benefits 27%
Salaries and Wages 34%
Other 1%
Casualty and Liability 3%
SOURCES: APTA FACT BOOK ANALYSIS
SOURCE: APTA FACT BOOK ANALYSIS
Figure 32: Demand Response Most Expensive per Rider, Least Expensive per Distance TraveledComparative Operating Cost Among Modes, 2019
All Bus Modes
Light Rail and Streetcar
Commuter and Hybrid Rail
Heavy RailDemand Response
$30
$25
$20
$15
$10
$5
$0
Cost per Vehicle Revenue Mile Cost per Unlinked Passenger Trip
OF TOTAL OPERATING EXPENSES
from salaries, wages and fringe benefits
61%
APTA | 27 2021 PUBLIC TRANSPORTATION FACT BOOK | 27
VANPOOL: A ride-sharing arrangement providing transportation for people within a specific geographic area.
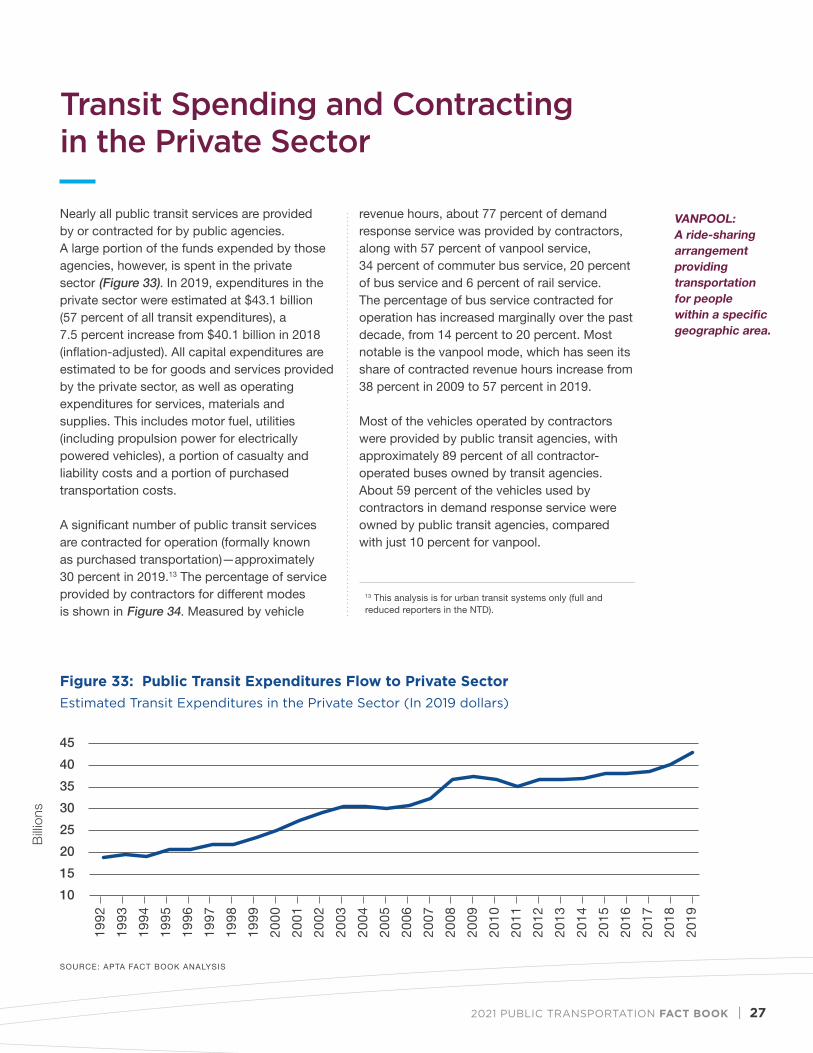
Nearly all public transit services are provided by or contracted for by public agencies. A large portion of the funds expended by those agencies, however, is spent in the private sector (Figure 33). In 2019, expenditures in the private sector were estimated at $43.1 billion (57 percent of all transit expenditures), a 7.5 percent increase from $40.1 billion in 2018 (inflation-adjusted). All capital expenditures are estimated to be for goods and services provided by the private sector, as well as operating expenditures for services, materials and supplies. This includes motor fuel, utilities (including propulsion power for electrically powered vehicles), a portion of casualty and liability costs and a portion of purchased transportation costs.
A significant number of public transit services are contracted for operation (formally known as purchased transportation)—approximately 30 percent in 2019.13 The percentage of service provided by contractors for different modes is shown in Figure 34. Measured by vehicle
revenue hours, about 77 percent of demand response service was provided by contractors, along with 57 percent of vanpool service, 34 percent of commuter bus service, 20 percent of bus service and 6 percent of rail service. The percentage of bus service contracted for operation has increased marginally over the past decade, from 14 percent to 20 percent. Most notable is the vanpool mode, which has seen its share of contracted revenue hours increase from 38 percent in 2009 to 57 percent in 2019.
Most of the vehicles operated by contractors were provided by public transit agencies, with approximately 89 percent of all contractor- operated buses owned by transit agencies. About 59 percent of the vehicles used by contractors in demand response service were owned by public transit agencies, compared with just 10 percent for vanpool.
Transit Spending and Contracting in the Private Sector
SOURCE: APTA FACT BOOK ANALYSIS
Figure 33: Public Transit Expenditures Flow to Private SectorEstimated Transit Expenditures in the Private Sector (In 2019 dollars)
45
40
35
30
25
20
15
10
1992
1993
1994
1995
1996
1997
1998
1999
2000
2001
2002
2003
2004
2005
2006
2007
2008
2009
2010
2011
2012
2013
2014
2015
2016
2017
2018
2019
Bill
ions
13 This analysis is for urban transit systems only (full and reduced reporters in the NTD).

28 | APTA
Passenger TravelInformation from 104 urban Canadian public transit systems reveals that passenger boardings (equivalent to U.S. unlinked passenger trips) in 2019 increased by 5.9 percent to 3.42 billion trips (Figure 35). The Canadian Urban Transit Association (CUTA) notes that ridership increases have been attributed to expanded
service hours and frequency, a growing student population and economic growth in metropolitan areas. With a population of 37.59 million that year, Canada’s 91 public transit trips per capita exceeds the United States’ 30 public transit trips per capita. According to CUTA, 70 percent of public transit trips were taken in the metropolitan Toronto, Montreal and Vancouver regions.
Canadian Summary14
Figure 34: Demand Response and Vanpool Services are the Most Contracted ModesPercent of Revenue Hours Contracted by Mode (Urban Systems Only)
3.4
3.2
3.0
2.8
2.6
2.4
2.2
2.0
850
800
750
700
650
600
550
500
450
400
Bill
ions
Mill
ions
2005
2006
2007
2008
2009
2010
2011
2012
2013
2014
2015
2016
2017
2018
2019
2005
2006
2007
2008
2009
2010
2011
2012
2013
2014
2015
2016
2017
2018
2019
SOURCE: CANADIAN URBAN TRANSIT ASSOCIATION
Total
Rail
Demand Response
Bus
Commuter Bus
Vanpool
0% 20% 40% 60% 80% 100%
SOURCE: APTA FACT BOOK ANALYSIS
Directly OperatedContracted
14 Source: Canadian Urban Transit Association.
Figure 35: Ridership on Upward TrendCanadian Passenger Boardings

APTA | 29 2021 PUBLIC TRANSPORTATION FACT BOOK | 29
Service ProvidedAccompanying this ridership increase was a 5.6 percent rise in total vehicle miles operated, compared with a 0.4 percent decrease in the United States (Figure 36). Total vehicle miles operated is the distance traveled by vehicles, including both revenue and “deadhead” miles.
Public transportation in Canada is also composed of specialized transit services, whose data is not included in the statistics above. Canadian specialized transit services are essentially demand response services for people who are unable to climb steps or walk long distances. According to CUTA, 332,424 registrants took more than 24.8 million passenger trips, which is 6.2 percent more than 2018 levels—which is another record. The 115 systems reporting tallied 66.2 million total vehicle miles in 2019.
VehiclesThe average standard bus age in 2019 was approximately 8.5 years, with bus fleet accessibility at 99.6. The average streetcar age was 25.6 years, the average light rail age was 17.5 years, and the average heavy rail age was 17.8 years. A total of 21,994 revenue vehicles were recorded across modes in 2019.
EmployeesThe number of Canadian transit employees in 2019 was 59,028, of which 51 percent were vehicle operators and 14 percent worked in vehicle maintenance, 17 percent in general administration, 10 percent in non-vehicle maintenance, and 8 percent in transportation operations.
Figure 36: Long-Term Growth in ServiceTotal Canadian Vehicle Miles
3.4
3.2
3.0
2.8
2.6
2.4
2.2
2.0
850
800
750
700
650
600
550
500
450
400
Bill
ions
Mill
ions
2005
2006
2007
2008
2009
2010
2011
2012
2013
2014
2015
2016
2017
2018
2019
2005
2006
2007
2008
2009
2010
2011
2012
2013
2014
2015
2016
2017
2018
2019
SOURCE: CANADIAN URBAN TRANSIT ASSOCIATION

30 | APTA
Intercity passenger rail is a critical resource for local economies and a valuable part of the transportation network. Amtrak operates more than 21,300 route miles, has more than 500 stations and employs approximately 19,600 people. An important contractor for public transit agencies, Amtrak operates commuter service for Maryland’s MARC, Connecticut DOT and Southern California’s Metrolink. Amtrak also provides infrastructure access to other public transit agencies.
Passenger TravelIn fiscal year (FY) 2020, Amtrak service and ridership was significantly impacted by the COVID-19 pandemic. FY 2020 ridership decreased by 48 percent (to 16.8 million trips) compared to FY 2019. Ridership on the Northeast Corridor decreased by 51 percent of 6.1 million trips. Ridership on state-supported routes decreased by 48 percent to 8.0 million trips, and ridership on long-distance routes decreased by 41 percent to 2.7 million trips.
FundingIn FY 2020, Amtrak decreased total revenues by 30.6 percent to $2.4 billion. It received $2.8 billion in federal appropriations in FY 2020.
Capital InvestmentsAmtrak is significantly investing to improve their capital assets. Current capital priorities include installing operational positive train control (PTC), launching a Safety Management System (SMS), state-of-good-repair work on the Northeast Corridor, new train interiors, the manufacturing of a new Acela train fleet, issuing an RFP for the replacement of the current diesel locomotive fleet, and station improvements across the nation.
Amtrak Summary15
Figure 37: FY 2020 Ridership Pandemic-ImpactedPassenger Trips (FY 2015- FY 2020)
35
30
25
20
15
10
5
0FY 2015 FY 2016 FY 2017 FY 2018 FY 2019 FY 2020
Mill
ions
15 Sources: https://www.amtrak.com/content/dam/projects/dotcom/english/public/documents/corporate/financial/ Amtrak-Audited-Consolidated-Financial-Statements- FY2020.pdf
https://www.amtrak.com/content/dam/projects/ dotcom/english/public/documents/corporate/ monthlyperformancereports/2020/Amtrak-Monthly- Performance-Report-September-2020.pdf
SOURCE: AMTRAK FY 2020 RIDERSHIP AND REVENUE
Northeast Corridor State Supported Long Distance

APTA | 31 2021 PUBLIC TRANSPORTATION FACT BOOK | 31
For complete size ranking lists of all transit agencies and urbanized areas reported in the Federal Transit Administration 2019 National Transit Database, see the 2021 Public Transportation Fact Book, Appendix B: Operating Statistics and Rankings at www.apta.com. These rankings include only public transit agencies that reported in the Federal Transit Administration FY 2019 National Transit Database.
Modal Rankings, Report Year 2019

32 | APTA
Table 1: The 50 Largest Transit Agencies (Ranked by Unlinked Passenger Trips)
TRANSIT AGENCY URBANIZED UNLINKED PASSENGER TRIPS PASSENGER MILES
AREA (THOUSANDS) (THOUSANDS)
2018 2019 2018 2019
MTA New York City Transit (NYCT) New York, NY 3,368,102.6 3,451,139.6 11,721,684.8 12,195,007.7
Chicago Transit Authority (CTA) Chicago, IL 468,068.0 455,743.5 1,992,826.7 1,959,870.4
Los Angeles County Metro. Transp. Auth. (LACMTA) Los Angeles, CA 394,361.7 379,718.1 2,014,910.7 1,962,038.4
Massachusetts Bay Transp. Auth. (MBTA) Boston, MA 372,398.8 366,716.9 1,717,994.3 1,679,893.9
Washington Metro. Area Transit Auth. (WMATA) Washington, DC 351,299.0 354,656.2 1,706,705.1 1,705,447.7
Southeastern Pennsylvania Transp. Auth. (SEPTA) Philadelphia, PA 319,425.5 308,266.5 1,330,519.5 1,423,011.3
New Jersey Transit Corporation (NJ TRANSIT) Newark, NJ 264,671.5 267,270.3 3,402,633.6 3,171,196.9
San Francisco Municipal Railway (Muni) San Francisco, CA 225,056.2 223,338.1 445,233.9 451,272.5
MTA Bus Company (MTABUS) New York, NY 137,618.5 135,080.1 381,346.4 377,941.8
King County DOT (King County Metro) Seattle, WA 129,054.2 128,666.6 621,896.0 587,078.3
San Francisco Bay Area Rapid Transit District (BART) Oakland, CA 129,044.3 128,217.0 1,789,223.2 1,774,467.0
Metropolitan Atlanta Rapid Transit Authority (MARTA) Atlanta, GA 120,162.9 117,759.1 705,533.2 704,189.5
MTA Long Island Rail Road (MTA LIRR) Jamaica, NY 105,538.1 114,241.4 3,405,961.9 3,929,860.0
Denver Regional Transportation District (RTD) Denver, CO 104,708.5 105,207.5 612,310.5 617,017.9
Tri-County Metro. Transp. District of Oregon (TriMet) Portland, OR 97,033.3 96,633.0 427,106.1 420,317.5
Maryland Transit Administration (MTA) Baltimore, MD 96,231.8 94,036.9 730,432.1 724,931.3
Metro-North Commuter Railroad Co. (MTA-MNCR) New York, NY 92,437.5 92,012.8 2,155,676.3 2,035,685.3
Port Authority Trans-Hudson Corp. (PATH) Jersey City, NJ 91,036.2 91,672.2 448,342.7 450,503.7
Metro. Transit Authority of Harris County (METRO) Houston, TX 90,300.5 89,951.2 562,857.9 581,575.9
San Diego Metropolitan Transit System (MTS) San Diego, CA 85,429.2 85,357.5 413,586.2 415,452.4
Miami-Dade Transit (MDT) Miami, FL 81,940.2 79,578.6 512,070.5 445,443.5
Metro Transit Minneapolis, MN 80,653.4 77,927.2 379,748.7 338,221.7
Dallas Area Rapid Transit (DART) Dallas, TX 62,438.8 69,301.5 426,923.1 438,897.5
Reg. Transp. Comm. of Southern Nevada (RTC) Las Vegas, NV 65,765.9 65,821.2 258,916.9 263,850.5
City and County of Honolulu DOT Services (DTS) Honolulu, HI 65,520.8 64,065.8 326,626.5 321,704.6
Port Authority of Allegheny County Pittsburgh, PA 63,463.9 64,007.9 267,132.1 272,078.5
Northeast Illinois Reg. Commuter Rail Corp. (Metra) Chicago, IL 68,446.2 61,456.7 1,518,703.4 1,365,137.9
Alameda-Contra Costa Transit District (AC Transit) Oakland, CA 52,789.9 54,067.2 207,299.1 217,911.0
Central Puget Sound Regional Transit Authority (ST) Seattle, WA 48,188.7 47,805.6 534,218.2 535,519.2
Utah Transit Authority (UTA) Salt Lake City, UT 44,176.3 44,578.2 358,146.7 355,283.7
VIA Metropolitan Transit (VIA) San Antonio, TX 39,910.8 42,510.8 183,337.5 196,044.9
City of Phoenix Public Transit Dept. (Valley Metro) Phoenix, AZ 37,790.7 41,042.6 135,945.1 145,908.0
Orange County Transportation Auth. (OCTA) Orange, CA 42,201.9 40,743.7 214,680.8 203,590.8
Bi-State Development Agency (Metro) St. Louis, MO 37,757.8 36,642.0 224,965.5 223,625.8
Santa Clara Valley Transportation Authority (VTA) San Jose, CA 37,511.2 36,433.0 191,785.8 192,366.4
Greater Cleveland Reg. Transit Auth. (GCRTA) Cleveland, OH 35,150.7 32,171.8 164,600.1 149,778.2
Capital Metropolitan Transp. Auth. (CMTA) Austin, TX 29,491.3 31,078.4 163,899.4 168,576.3
Milwaukee County Transit System (MCTS) Milwaukee, WI 30,884.6 29,423.8 109,817.3 94,803.1
Pace - Suburban Bus Division (PACE) Arlington Heights, IL 30,207.9 28,520.7 212,134.2 201,300.3
Broward County Transit Division (BCT) Plantation, FL 28,641.7 27,300.5 146,623.0 140,473.7
Westchester County Bee-Line System Mount Vernon, NY 27,704.0 26,823.2 122,155.7 118,418.2
New York City Department of Transportation New York, NY 25,002.7 25,618.0 144,028.7 144,528.5
Central Florida Regional Transp. Authority (LYNX) Orlando, FL 25,117.9 25,020.5 153,806.1 163,227.6
Charlotte Area Transit System (CATS) Charlotte, NC 22,516.6 24,278.7 116,204.4 126,140.1
Washington State Ferries Seattle, WA 24,566.4 24,255.4 193,091.1 190,973.6
Nassau Inter County Express (NICE) Garden City, NY 23,312.5 24,145.3 129,519.0 138,934.9
Niagara Frontier Transp. Auth. (NFT Metro) Buffalo, NY 25,158.9 23,982.4 87,339.3 82,621.0
Long Beach Transit (LBT) Long Beach, CA 23,820.7 23,248.2 74,007.2 75,677.4
City of Detroit Department of Transportation Detroit, MI 23,827.2 22,751.8 100,829.6 107,136.5
Ride-On Montgomery County Transit Rockville, MD 21,594.0 20,596.5 81,258.5 82,518.0

APTA | 33 2021 PUBLIC TRANSPORTATION FACT BOOK | 33
Table 2: The 50 Urbanized Areas with the Most Transit Travel (Ranked by Unlinked Passenger Trips)
URBANIZED AREA POPULATION UNLINKED PASSENGER TRIPS PASSENGER MILES
(2010 CENSUS) (THOUSANDS) (THOUSANDS)
2018 2019 2018 2019
New York-Newark, NY-NJ-CT 18,351,295 4,114,906.5 4,209,297.9 21,504,782.7 22,227,181.7
Chicago, IL-IN 8,608,208 574,216.1 553,155.6 3,844,797.9 3,645,688.1
Los Angeles-Long Beach-Anaheim, CA 12,150,996 558,777.3 538,864.0 3,017,052.8 2,947,725.2
Washington, DC-VA-MD 4,586,770 416,811.1 419,224.3 2,442,113.9 2,430,771.4
San Francisco-Oakland, CA 3,281,212 410,827.9 406,960.7 2,476,594.5 2,461,068.1
Boston, MA-NH-RI 4,181,019 382,209.6 376,391.0 1,778,238.5 1,739,028.8
Philadelphia, PA-NJ-DE-MD 5,441,567 360,559.3 347,457.4 1,710,168.7 1,753,041.7
Seattle, WA 3,059,393 218,896.7 217,909.2 1,490,335.4 1,458,392.5
Atlanta, GA 4,515,419 127,165.4 124,639.3 816,548.7 819,148.2
Miami, FL 5,502,379 127,129.0 123,322.9 841,741.4 768,344.3
Portland, OR-WA 1,849,898 110,720.2 110,112.6 470,722.8 463,342.8
Denver-Aurora, CO 2,374,203 95,326.3 97,832.2 574,138.8 588,694.0
San Diego, CA 2,956,746 97,166.0 96,911.8 591,647.3 587,874.1
Minneapolis-St. Paul, MN-WI 2,650,890 93,910.8 91,416.5 479,647.0 438,810.8
Houston, TX 4,944,332 91,017.2 90,509.2 568,658.7 586,453.8
Baltimore, MD 2,203,663 91,279.6 88,078.8 468,589.7 466,733.6
Dallas-Fort Worth-Arlington, TX 5,121,892 69,211.6 76,473.5 457,374.6 479,160.5
Phoenix-Mesa, AZ 3,629,114 70,353.4 72,065.3 360,950.4 356,626.6
Pittsburgh, PA 1,733,853 65,361.4 65,851.1 292,605.6 295,275.3
Las Vegas-Henderson, NV 1,886,011 65,765.9 65,821.2 258,916.9 263,850.5
Urban Honolulu, HI 802,459 64,802.1 63,372.8 322,765.6 317,922.1
San Jose, CA 1,664,496 44,136.7 42,801.7 334,807.5 328,015.0
San Antonio, TX 1,758,210 39,919.6 42,522.5 183,429.6 196,171.1
St. Louis, MO-IL 2,150,706 39,734.4 38,571.2 242,605.2 239,810.1
Detroit, MI 3,734,090 36,130.5 35,253.0 207,528.9 219,021.3
Cleveland, OH 1,780,673 36,027.2 33,026.0 173,165.7 158,262.7
Concord, CA 615,968 33,784.6 32,879.5 433,208.9 424,582.5
Salt Lake City-West Valley City, UT 1,021,243 31,652.9 31,971.3 202,668.4 199,408.5
Milwaukee, WI 1,376,476 32,363.2 31,401.1 121,584.9 106,091.1
Austin, TX 1,362,416 29,558.4 31,167.5 163,899.4 168,576.3
Tampa-St. Petersburg, FL 2,441,770 24,988.6 27,660.8 140,969.9 159,073.1
Charlotte, NC-SC 1,249,442 23,084.6 24,848.0 119,556.9 129,451.0
Buffalo, NY 935,906 25,144.1 23,969.0 87,288.0 82,571.6
Sacramento, CA 1,723,634 23,685.8 22,695.9 130,597.9 125,229.5
San Juan, PR 2,148,346 18,950.3 21,913.6 81,827.9 105,035.1
Orlando, FL 1,510,516 20,368.5 20,942.3 129,143.2 149,011.8
Columbus, OH 1,368,035 19,357.3 19,591.4 80,416.4 81,628.7
New Orleans, LA 899,703 21,669.3 18,893.9 66,849.3 62,163.5
Providence, RI-MA 1,190,956 18,296.2 18,044.7 83,118.6 82,899.7
Cincinnati, OH-KY-IN 1,624,827 18,323.7 17,657.6 109,922.9 97,888.3
Bridgeport-Stamford, CT-NY 923,311 17,527.7 17,299.4 201,468.7 191,284.8
Hartford, CT 924,859 17,662.1 17,205.7 116,625.8 118,457.7
Riverside-San Bernardino, CA 1,932,666 17,243.1 17,203.5 140,421.9 141,373.4
Tucson, AZ 843,168 16,767.0 15,875.5 82,384.0 66,726.8
Albany-Schenectady, NY 594,962 16,355.9 15,705.8 72,098.8 73,741.2
Kansas City, MO-KS 1,519,417 16,003.4 15,638.8 60,363.8 59,298.3
New Haven, CT 562,839 15,188.0 14,900.4 208,527.3 196,638.9
Rochester, NY 720,572 14,945.1 14,568.1 51,678.3 48,550.5
Durham, NC 347,602 15,514.9 14,507.0 131,426.3 47,985.7
Ann Arbor, MI 306,022 14,872.7 14,352.3 52,206.6 52,440.2

34 | APTA
Table 3: 50 Urbanized Areas with the Most Transit Travel (Ranked by Ridership Per Capita)
URBANIZED AREA POPULATION 2019 UNLINKED RIDERSHIP
(2010 CENSUS) PASSENGER TRIPS PER CAPITA
(THOUSANDS)
New York-Newark, NY-NJ-CT 18,351,295 4,209,297.9 229.4
San Francisco-Oakland, CA 3,281,212 406,960.7 124.0
Ames, IA 60,438 6,121.0 101.3
Washington, DC-VA-MD 4,586,770 419,224.3 91.4
Boston, MA-NH-RI 4,181,019 376,391.0 90.0
Champaign, IL 145,361 11,637.3 80.1
Urban Honolulu, HI 802,459 63,372.8 79.0
State College, PA 87,454 6,602.8 75.5
Seattle, WA 3,059,393 217,909.2 71.2
Chicago, IL-IN 8,608,208 553,155.6 64.3
Philadelphia, PA-NJ-DE-MD 5,441,567 347,457.4 63.9
Ithaca, NY 53,661 3,334.7 62.1
Portland, OR-WA 1,849,898 110,112.6 59.5
San Marcos, TX 52,826 3,047.1 57.7
Atlantic City, NJ 248,402 14,225.3 57.3
Athens-Clarke County, GA 128,754 7,272.2 56.5
Blacksburg, VA 88,542 4,975.5 56.2
Boulder, CO 114,591 6,213.9 54.2
Davis, CA 72,794 3,904.1 53.6
Concord, CA 615,968 32,879.5 53.4
Iowa City, IA 106,621 5,513.1 51.7
Gainesville, FL 187,781 9,025.4 48.1
Ann Arbor, MI 306,022 14,352.3 46.9
Waterbury, CT 194,535 9,120.5 46.9
Danbury, CT-NY 168,136 7,613.8 45.3
Los Angeles-Long Beach-Anaheim, CA 12,150,996 538,864.0 44.3
Eugene, OR 247,421 10,494.5 42.4
Durham, NC 347,602 14,507.0 41.7
Denver-Aurora, CO 2,374,203 97,832.2 41.2
Bellingham, WA 114,473 4,703.9 41.1
Baltimore, MD 2,203,663 88,078.8 40.0
Trenton, NJ 296,668 11,535.2 38.9
Pittsburgh, PA 1,733,853 65,851.1 38.0
Flagstaff, AZ 71,957 2,564.5 35.6
Lansing, MI 313,532 11,106.0 35.4
Las Vegas-Henderson, NV 1,886,011 65,821.2 34.9
Antioch, CA 277,634 9,680.1 34.9
Minneapolis-St. Paul, MN-WI 2,650,890 91,416.5 34.5
Santa Barbara, CA 195,861 6,689.2 34.2
Lafayette, IN 147,725 5,032.7 34.1
Morgantown, WV 70,350 2,341.0 33.3
San Diego, CA 2,956,746 96,911.8 32.8
Madison, WI 401,661 13,034.3 32.5
Lawrence, KS 88,053 2,847.0 32.3
Harrisonburg, VA 66,784 2,120.5 31.8
Salt Lake City-West Valley City, UT 1,021,243 31,971.3 31.3
Bloomington, IN 108,657 3,197.6 29.4
Kahului, HI 55,934 1,577.8 28.2
Atlanta, GA 4,515,419 124,639.3 27.6
New Haven, CT 562,839 14,900.4 26.5
Ridership per capita (unlinked passenger trips divided by metro area population) gives a representation for how many public transit trips a person takes yearly in that area. While many passenger trips are taken in large urbanized areas, smaller areas, particularly ones with universities, have a high ridership per capita.
(a) Total amounts reported by each agency are included in the urbanized area in which that agency is headquartered regardless of the number of urbanized areas in which the agency operates transit service.

APTA | 35 2021 PUBLIC TRANSPORTATION FACT BOOK | 35
Table 4: The 50 Largest Bus Agencies (Ranked by Unlinked Passenger Trips)
TRANSIT AGENCY URBANIZED UNLINKED PASSENGER TRIPS PASSENGER MILES
AREA (THOUSANDS) (THOUSANDS)
2018 2019 2018 2019
MTA New York City Transit (NYCT) New York, NY 691,981.4 691,616.6 1,472,423.0 1,478,429.6
Los Angeles County Metro. Transp. Auth. (LACMTA) Los Angeles, CA 273,625.4 266,887.6 1,111,245.2 1,103,847.5
Chicago Transit Authority (CTA) Chicago, IL 242,173.0 237,276.4 591,323.7 581,742.0
Southeastern Pennsylvania Transp. Auth. (SEPTA) Philadelphia, PA 161,535.2 153,956.4 455,641.2 479,782.6
New Jersey Transit Corporation (NJ Transit) Newark, NJ 151,640.6 151,065.6 1,107,572.4 1,017,328.8
MTA Bus Company (MTABUS) New York, NY 137,618.5 135,080.1 381,346.4 377,941.8
Washington Metro. Area Transit Auth. (WMATA) Washington, DC 119,681.1 123,333.1 366,498.8 367,558.8
San Francisco Municipal Railway (Muni) San Francisco, CA 111,809.1 110,803.0 220,051.9 225,220.9
King County DOT – Metro Transit Seattle, WA 104,261.6 104,362.3 505,978.8 476,447.9
Massachusetts Bay Transp. Authority (MBTA) Boston, MA 102,691.3 100,253.0 265,337.8 257,656.5
Denver Regional Transportation District (RTD) Denver, CO 70,540.5 69,731.8 319,383.0 307,035.5
Reg. Transp. Comm. of Southern Nevada (RTC) Las Vegas, NV 64,425.7 64,473.6 244,372.8 249,356.5
Maryland Transit Administration (MTA) Baltimore, MD 63,797.5 63,988.6 239,277.8 250,693.4
City and County of Honolulu (DTS) Honolulu, HI 64,119.6 62,554.4 311,654.9 305,290.9
Metro. Transit Auth. of Harris County, Texas (METRO) Houston, TX 59,555.0 59,544.0 279,810.1 306,131.6
Tri-County Metro. Transp. District of Oregon (TriMet) Portland, OR 56,690.1 56,429.2 203,723.8 200,008.8
Port Authority of Allegheny County Pittsburgh, PA 53,733.6 55,016.6 225,092.2 231,734.1
Metro Transit Minneapolis, MN 54,910.5 51,860.0 260,030.3 218,756.7
Metropolitan Atlanta Rapid Transit Auth. (MARTA) Atlanta, GA 54,354.7 51,447.8 245,601.2 243,578.3
Alameda-Contra Costa Transit District (AC Transit) Oakland, CA 49,473.4 50,484.4 164,833.3 171,068.0
Miami-Dade Transit (MDT) Miami, FL 51,469.8 49,632.1 315,222.5 249,569.1
San Diego Metropolitan Transit System (MTS) San Diego, CA 47,554.2 47,205.8 185,314.8 182,741.0
VIA Metropolitan Transit (VIA) San Antonio, TX 38,312.7 40,962.6 144,598.0 158,505.9
City of Phoenix Public Transit Dept. (Valley Metro) Phoenix, AZ 37,451.6 40,696.3 132,678.7 142,767.3
Orange County Transportation Authority (OCTA) Orange, CA 39,056.0 37,642.8 149,448.8 140,082.2
Dallas Area Rapid Transit (DART) Dallas, TX 30,011.0 37,230.8 125,148.1 146,291.3
Milwaukee County (MCTS) Milwaukee, WI 30,429.8 28,972.7 106,718.1 91,779.5
Capital Metropolitan Transportation Authority (CMTA) Austin, TX 26,879.3 28,313.3 116,078.1 115,922.3
Santa Clara Valley Transportation Authority (VTA) San Jose, CA 28,473.3 27,472.1 138,466.8 137,216.1
Westchester County New York, NY 27,373.0 26,474.1 118,800.2 114,898.8
Broward County Transit Division (BCT) Miami, FL 27,796.3 26,371.3 136,768.3 129,778.7
Pace - Suburban Bus Division (PACE) Chicago, IL 27,673.4 26,191.9 171,090.1 165,101.0
County of Nassau (NICE) New York, NY 22,980.4 23,791.0 126,842.0 136,185.0
Long Beach Transit (LBT) Los Angeles, CA 23,781.7 23,210.0 73,821.4 75,502.2
Bi-State Development Agency (METRO) St. Louis, MO 23,653.9 22,967.7 125,714.4 128,272.7
Central Florida Regional Transp. Authority (LYNX) Orlando, FL 23,239.1 22,963.8 133,174.8 140,923.0
City of Detroit (DDOT) Detroit, MI 23,495.0 22,394.9 97,496.7 103,688.2
Greater Cleveland Reg. Transit Auth. (GCRTA) Cleveland, OH 22,866.5 21,787.7 97,776.0 91,902.7
Montgomery County, Maryland Washington, DC 21,594.0 20,596.5 81,258.5 82,518.0
Utah Transit Authority (UTA) Salt Lake City, UT 19,061.4 20,250.0 79,344.4 84,921.2
Niagara Frontier Transportation Authority (NFTA) Buffalo, NY 20,435.0 19,282.8 73,140.2 68,597.0
Central Ohio Transit Authority (COTA) Columbus, OH 18,913.8 19,141.5 73,617.3 74,351.7
City of Los Angeles (LADOT) Los Angeles, CA 16,772.8 17,467.1 30,243.8 30,643.6
Rhode Island Public Transit Authority (RIPTA) Providence, RI 16,339.1 16,029.4 71,202.5 70,301.7
Capital District Transportation Authority (CDTA) Albany, NY 15,856.7 15,144.3 54,040.5 53,504.3
Charlotte Area Transit System (CATS) Charlotte, NC 15,069.6 14,932.7 64,906.6 63,280.3
Regional Transit Service - Monroe County (RTS) Rochester, NY 14,873.6 14,472.2 50,345.8 46,649.2
City of Tucson Tucson, AZ 15,205.4 14,262.8 74,155.1 57,873.1
CTTRANSIT - Hartford Division Hartford, CT 14,650.2 14,217.8 95,151.4 97,149.2
Regional Public Transportation Authority (RPTA) Phoenix, AZ 14,730.2 13,875.7 65,696.9 61,191.7
(a) Excludes Bus Rapid Transit and Commuter Bus Service Reported Separately

36 | APTA
Table 6: The 30 Largest Commuter Bus Agencies (Ranked by Unlinked Passenger Trips)
TRANSIT AGENCY URBANIZED UNLINKED PASSENGER TRIPS PASSENGER MILES
AREA (THOUSANDS) (THOUSANDS)
2018 2019 2018 2019
Central Puget Sound Regional Transit Authority (ST) Seattle, WA 18,189.3 17,494.5 256,464.9 255,140.0
MTA New York City Transit (NYCT) New York, NY 12,403.4 11,477.2 158,586.8 153,389.1
Metro. Transit Auth. of Harris County, Texas (METRO) Houston, TX 7,864.8 7,960.3 149,668.4 145,106.3
Hudson Transit Lines, Inc.(Short Line) New York, NY 4,310.0 4,061.4 196,203.4 184,866.9
Maryland Transit Administration (MTA) Baltimore, MD 3,819.8 3,623.6 109,737.2 104,182.7
Snohomish County PTBA Corp. (Community Transit) Seattle, WA 2,994.0 3,079.7 53,097.2 54,324.1
Academy Lines, Inc. New York, NY 3,281.9 3,035.6 151,141.1 142,232.7
Alameda-Contra Costa Transit District (AC Transit) San Francisco, CA 2,545.7 2,818.6 35,370.1 39,694.5
Suburban Transit Corp. (Coach USA) New York, NY 2,469.2 2,421.0 93,829.0 91,998.5
Georgia State Road and Tollway Authority (SRTA) Atlanta, GA 1,687.0 1,894.1 45,122.1 48,499.2
Rockland Coaches, Inc. New York, NY 1,996.8 1,889.0 50,090.6 46,013.8
DeCamp Bus Lines New York, NY 1,843.5 1,835.2 30,997.0 30,071.0
Roaring Fork Transportation Authority (RFTA) (blank) 1,615.3 1,618.5 — —
Lakeland Bus Lines, Inc. New York, NY 1,624.1 1,609.9 52,870.2 54,735.4
City of Los Angeles (LADOT) Los Angeles, CA 1,355.1 1,563.1 23,707.6 27,575.1
Potomac and Rappahannock Transp. Comm. (PRTC) Washington, DC 1,458.9 1,491.4 36,340.4 37,151.3
Loudoun County (LC Transit) Washington, DC 1,305.8 1,318.4 39,227.7 39,606.1
Trans-Bridge Lines, Inc. New York, NY 1,120.0 1,180.8 79,839.5 77,454.0
Peter Pan Bus Lines (PPBL) Boston, MA 231.4 857.6 — —
Jalbert Leasing, Inc. Portsmouth, NH 773.5 797.7 — —
Hampton Jitney, Inc. New York, NY 795.4 793.5 73,791.8 74,435.1
Capital Metropolitan Transportation Authority (CMTA) Austin, TX 613.9 779.9 10,387.8 14,695.7
Solano County Transit (SolTrans) Vallejo, CA 666.3 723.0 9,186.8 9,966.6
City of Charlotte North Carolina (CATS) Charlotte, NC 895.8 691.2 12,851.0 9,787.0
Ventura County Transportation Commission (VCTC) Oxnard, CA 640.1 651.6 13,549.6 12,806.5
Boston Express Bus, Inc. (BX) Boston, MA 609.4 633.8 — —
Monsey New Square Trails Corporation New York, NY 615.9 603.9 25,869.9 25,363.3
The Woodlands Township The Woodlands, TX 542.5 552.3 20,019.5 21,319.6
Utah Transit Authority (UTA) Salt Lake City, UT 563.6 549.7 12,395.9 12,128.1
Olympia Trails Bus Company, Inc. New York, NY 571.1 547.5 — —
(a) Includes only agencies reporting their operations to the National Transit Database as Commuter Bus.
Table 5: Bus Rapid Transit Agencies (Ranked by Unlinked Passenger Trips)
TRANSIT AGENCY URBANIZED UNLINKED PASSENGER TRIPS PASSENGER MILES
AREA (THOUSANDS) (THOUSANDS)
2018 2019 2018 2019
MTA New York City Transit (NYCT) New York, NY 30,275.8 30,695.7 56,084.9 57,076.2
Massachusetts Bay Transportation Authority (MBTA) Boston, MA 10,540.6 11,490.8 19,967.6 23,235.1
Los Angeles County Metropolitan Transp. Auth. (LACMTA) Los Angeles, CA 7,168.5 6,860.1 47,544.3 45,206.0
Lane Transit District (LTD) Eugene, OR 3,496.3 3,790.4 9,115.9 9,519.5
Greater Cleveland Regional Transit Authority (GCRTA) Cleveland, OH 3,764.3 2,628.5 10,019.7 6,889.6
Greater Richmond Transit Company (GRTC) Richmond, VA 57.0 1,951.4 151.7 5,817.1
Connecticut Department of Transportation (CTTransit) Hartford, CT 1,556.7 1,579.8 8,117.3 8,021.4
Transfort Fort Collins, CO 1,468.0 1,445.3 3,703.5 3,619.9
Kansas City Area Transportation Authority (KCATA) Kansas City, MO 1,160.2 1,109.6 3,193.5 2,903.9
Central Florida Regional Transportation Authority (LYNX) Orlando, FL 1,038.3 1,040.3 768.4 718.0
Roaring Fork Transportation Authority (RFTA) (b) Non-UZA 920.3 1,034.5 N/A N/A
Interurban Transit Partnership (The Rapid) Grand Rapids, MI 847.0 850.7 2,561.4 2,501.0
Indianapolis and Marion Cty Public Transp. (IndyGo) Indianapolis, IN — 704.7 — 2,550.2
(a) Includes only agencies reporting their operations to the National Transit Database as Bus Rapid Transit. (b) RFTA is a rural reporter and does not report passenger miles.

APTA | 37 2021 PUBLIC TRANSPORTATION FACT BOOK | 37
Table 7: Top 50 Largest Demand Response Agencies (Ranked by Unlinked Passenger Trips)
TRANSIT AGENCY URBANIZED UNLINKED PASSENGER TRIPS PASSENGER MILES
AREA (THOUSANDS) (THOUSANDS)
2018 2019 2018 2019
MTA New York City Transit (NYCT) New York, NY 5,086.0 4,828.4 45,491.0 43,330.2
Pace-Suburban Bus Division, ADA Para Services (PACE) Chicago, IL 3,847.0 3,566.5 36,963.2 31,820.7
Metropolitan Council Minneapolis, MN 249.1 2,573.2 2,488.1 29,755.0
Washington Metropolitan Area Transit Authority (WMATA) Washington, DC 2,261.1 2,212.7 23,930.2 21,875.3
Access Services (AS) Los Angeles, CA 2,227.2 2,208.7 25,915.4 25,870.4
Maryland Transit Administration (MTA) Baltimore, MD 2,142.0 2,152.6 20,191.1 21,977.1
Massachusetts Bay Transportation Authority (MBTA) Boston, MA 1,955.6 1,862.3 15,540.4 14,589.9
Metropolitan Transit Auth. of Harris County, Texas (METRO) Houston, TX 1,774.5 1,786.4 19,003.3 19,905.0
Miami-Dade Transit (MDT) Miami, FL 1,743.0 1,777.9 22,663.5 23,390.1
New Jersey Transit Corporation (NJ TRANSIT) New York, NY 1,635.8 1,711.3 10,131.6 10,751.0
Southeastern Pennsylvania Transportation Authority (SEPTA) Philadelphia, PA 1,554.6 1,513.1 11,119.0 10,507.1
Orange County Transportation Authority (OCTA) Orange, CA 1,490.2 1,493.6 16,572.0 16,544.6
OATS, Inc. Non-UZA 1,551.3 1,420.7 — —
Port Authority of Allegheny County Pittsburgh, PA 1,464.3 1,397.5 11,707.0 11,406.1
Regional Transportation Commission of Southern Nevada (RTC) Las Vegas, NV 1,340.2 1,347.6 14,544.0 14,494.1
City and County of Honolulu (DTS) Honolulu, HI 1,162.6 1,195.4 12,801.4 12,968.5
Denver Regional Transportation District (RTD) Denver, CO 1,226.3 1,179.0 10,744.5 10,384.1
Board of County Comm., Palm Beach County (PalmTran) Miami, FL 999.3 1,046.0 12,609.5 13,419.8
VIA Metropolitan Transit (VIA) San Antonio, TX 1,069.6 1,016.5 12,999.8 12,571.2
Delaware Transit Corporation (DTC) Philadelphia, PA 926.9 946.6 11,674.7 12,077.7
Broward County Board of County Commissioners (BCT) Miami, FL 845.4 929.1 9,854.7 10,695.0
King County Department of Metro Transit (KCM) Seattle, WA 883.3 887.9 8,840.5 8,887.8
Pace - Suburban Bus Division (PACE) Chicago, IL 929.6 884.9 6,213.0 6,068.7
Tri-County Metropolitan Transp. District of Oregon (TriMet) Portland, OR 899.0 854.2 8,306.8 7,869.6
Metropolitan Atlanta Rapid Transit Authority (MARTA) Atlanta, GA 721.6 808.9 10,036.2 10,374.0
Alameda-Contra Costa Transit District (AC Transit) San Francisco, CA 770.8 764.1 7,095.7 7,148.5
Suffolk County (ST) New York, NY 723.5 752.8 9,390.7 9,771.1
Capital Metropolitan Transportation Authority (CMTA) Austin, TX 675.6 706.9 5,591.4 6,003.7
Central Pennsylvania Transportation Authority (rabbittransit) York, PA 638.3 645.2 8,275.5 8,213.7
KI BOIS Community Action Foundation, Inc. Non-UZA 611.2 636.7 — —
Rural Transit Enterprises Coordinated, Inc. (RTEC) Non-UZA 630.3 605.4 — —
Blue Water Area Transportation Commission (BWATC) Port Huron, MI 634.7 603.9 5,375.1 5,137.5
Mass Transportation Authority (MTA) Flint, MI 537.7 582.9 5,093.3 5,463.0
Central Florida Regional Transportation Authority (LYNX) Orlando, FL 480.0 582.2 7,127.3 7,564.2
The Greater Cleveland Regional Transit Authority (GCRTA) Cleveland, OH 587.2 576.4 4,402.1 4,594.3
City of Tucson (COT) Tucson, AZ 557.3 543.2 4,211.8 4,715.3
Bi-State Development Agency (METRO) St. Louis, MO 553.4 523.4 6,305.6 6,284.4
South Central Transit Authority (SCTA) Lancaster, PA 508.5 517.9 5,219.0 5,114.4
Greater Hartford Transit District (GHTD) Hartford, CT 499.2 513.4 4,439.2 4,760.7
West Alabama Rural Public Transportation (WAPT) Non-UZA 569.7 510.5 — —
San Diego Metropolitan Transit System (MTS) San Diego, CA 596.7 507.4 6,977.5 5,663.9
Capital Area Transportation Authority (CATA) Lansing, MI 499.5 493.8 3,815.4 3,845.4
Cape Cod Regional Transit Authority (CCRTA) Barnstable Town, MA 457.1 463.6 3,451.9 3,269.3
Milwaukee County (MCTS) Milwaukee, WI 454.9 451.1 3,099.2 3,023.6
South Central Illinois Mass Transit District Non-UZA 437.5 446.2 — —
Spokane Transit Authority (STA) Spokane, WA 475.3 441.1 4,242.5 3,973.0
Central Arkansas Development Council (CADC/SCAT) Non-UZA 422.8 440.7 — —
Huron Transit Corporation (TAT) Non-UZA 405.1 434.7 — —
Santa Clara Valley Transportation Authority (VTA) San Jose, CA 385.7 431.9 4,521.2 4,843.6
Suburban Mobility Authority for Regional Transp. (SMART) Detroit, MI 404.4 422.1 3,072.0 2,937.9
(a) Excludes Demand Response Taxi Service

38 | APTA
Table 8: Top 30 Largest Transit Vanpool Agencies (Ranked by Unlinked Passenger Trips)
TRANSIT AGENCY URBANIZED UNLINKED PASSENGER TRIPS PASSENGER MILES
AREA (THOUSANDS) (THOUSANDS)
2018 2019 2018 2019
California Vanpool Authority (CalVans) Hanford, CA 3,173.8 3,434.1 126,496.0 121,788.2
King County Department of Metro Transit (KCM) Seattle, WA 3,464.7 3,300.2 65,559.8 61,644.5
Los Angeles County Metropolitan Transp. Auth. (LACMTA) Los Angeles, CA 3,428.2 3,240.7 151,003.9 142,563.8
Metropolitan Transit Auth. of Harris County, Texas (METRO) Houston, TX 1,877.3 1,791.7 58,131.6 55,659.3
San Diego Association of Governments (SANDAG) San Diego, CA 1,740.5 1,746.5 85,606.0 81,692.1
Potomac and Rappahannock Transp. Commission (PRTC) Washington, DC 1,357.1 1,449.9 62,206.1 65,137.1
Pace - Suburban Bus Division (PACE) Chicago, IL 1,507.7 1,361.3 34,117.2 29,522.0
Orange County Transportation Authority (OCTA) Los Angeles, CA 1,281.7 1,230.3 43,993.9 41,926.3
Utah Transit Authority (UTA) Salt Lake City, UT 1,174.7 1,068.4 43,052.6 37,026.6
Regional Public Transportation Authority (RPTA) Phoenix, AZ 1,035.5 1,004.0 41,156.7 35,341.7
Enterprise Rideshare - Michigan Detroit, MI 902.7 871.5 35,633.5 33,664.2
Snohomish County PTBA (Community Transit) Seattle, WA 869.4 823.8 20,155.1 18,931.4
Pierce County Transp. Benefit Area Auth. (Pierce Transit) Seattle, WA 783.6 740.2 22,201.6 21,234.3
Georgia State Road and Tollway Authority (SRTA) Atlanta, GA — 681.4 — 27,339.0
Ben Franklin Transit (BFT) Kennewick, WA 646.2 652.8 21,326.4 21,616.1
New Jersey Transit Corporation (NJ TRANSIT) New York, NY 677.6 635.2 25,137.9 22,289.8
Victor Valley Transit Authority (VVTA) Victorville, CA 607.6 572.7 29,205.6 26,049.2
Capital Metropolitan Transportation Authority (CMTA) Austin, TX 511.3 548.9 19,572.5 20,766.9
VIA Metropolitan Transit (VIA) San Antonio, TX 522.3 499.3 25,693.7 24,570.0
Dallas Area Rapid Transit (DART) Dallas, TX 483.2 495.9 18,572.9 18,228.2
Intercity Transit (I.T.) Olympia, WA 520.8 491.1 18,914.3 18,731.5
County of Miami-Dade (MDT) Miami, FL 484.5 482.0 15,412.5 15,092.0
Regional Transportation Commission of Washoe County Reno, NV 363.8 439.3 14,602.3 16,123.0
Central Florida Regional Transportation Authority (LYNX) Orlando, FL 360.5 434.3 12,735.5 14,022.4
Greater Richmond Transit Company (GRTC Transit System) Richmond, VA 398.0 387.2 29,291.2 27,910.8
Tampa Bay Area Regional Transit Authority (TBARTA) Tampa, FL 223.6 293.7 7,290.6 9,266.4
Metropolitan Transportation Commission (MTC) San Francisco, CA — 251.6 — 9,557.3
Ann Arbor Area Transportation Authority (AAATA) Ann Arbor, MI 234.4 246.6 7,463.8 8,396.9
Piedmont Authority for Regional Transportation (PART) Greensboro, NC 242.4 237.0 13,705.4 13,289.2
El Paso County Non-UZA 185.7 235.7 — —
Table 9: Trolleybus Agencies (Ranked by Unlinked Passenger Trips)
TRANSIT AGENCY URBANIZED UNLINKED PASSENGER TRIPS PASSENGER MILES
AREA (THOUSANDS) (THOUSANDS)
2018 2019 2018 2019
San Francisco Municipal Railway (Muni) San Francisco, CA 49,199.8 49,247.9 67,071.9 68,856.2
King County Department of Transp. (King County Metro) Seattle, WA 17,950.7 17,373.5 34,367.5 32,207.1
Southeastern Pennsylvania Transp. Authority (SEPTA) Philadelphia, PA 5,085.0 4,495.9 10,309.8 9,169.2
Massachusetts Bay Transportation Authority (MBTA) Boston, MA 2,570.3 3,021.2 5,976.5 7,133.6
Greater Dayton Regional Transit Authority (RTA) Dayton, OH 2,084.1 2,047.3 8,556.5 8,439.0

APTA | 39 2021 PUBLIC TRANSPORTATION FACT BOOK | 39
(a) Alaska Railroad Corporation is the only agency operating service identified as the mode “Alaska Railroad” in the National Transit Database. It is included with Commuter Rail service agencies in this table.
Table 10: Commuter Rail and Hybrid Rail Agencies (Ranked by Unlinked Passenger Trips)
TRANSIT AGENCY URBANIZED UNLINKED PASSENGER PASSENGER MILES
AREA TRIPS (THOUSANDS) (THOUSANDS)
2018 2019 2018 2019
COMMUTER RAIL AGENCIES
MTA Long Island Rail Road (MTA LIRR) New York, NY 105,538.1 114,241.4 3,405,961.9 3,929,860.0 180,793.1
MTA Metro-North Railroad (MTA-MNCR) New York, NY 91,873.4 91,433.8 2,154,521.2 2,034,489.6 95,442.3
New Jersey Transit Corporation (NJ TRANSIT) Newark, NJ 87,059.4 89,562.9 2,148,639.4 2,006,197.8 94,326.4
Northeast Illinois Reg. Commuter Railroad Corp. (Metra) Chicago, IL 68,446.2 61,456.7 1,518,703.4 1,365,137.9 52,437.4
Southeastern Pennsylvania Transp. Authority (SEPTA) Philadelphia, PA 32,246.0 34,730.1 436,335.0 465,744.5 57,112.4
Massachusetts Bay Transportation Authority (MBTA) Boston, MA 32,859.7 31,177.7 680,949.7 653,571.0 41,920.8
Peninsula Corr. Joint Powers Board, Caltrain San Francisco, CA 18,504.9 17,662.8 409,333.7 385,871.9 99,051.0
Southern California Regional Rail Authority (Metrolink) Los Angeles, CA 14,190.9 12,824.1 438,553.7 416,394.6 17,453.4
Denver Regional Transportation District Denver, CO 7,619.6 9,711.4 101,771.6 121,331.4 137,632.9
Maryland Transit Administration (MTA) Baltimore, MD 9,326.7 9,190.9 275,491.5 271,391.4 18,662.5
Utah Transit Authority (UTA) Salt Lake City, UT 5,082.2 5,193.9 129,673.5 133,685.5 43,102.7
Central Puget Sound Regional Transit Authority (ST) Seattle, WA 4,631.5 4,612.4 115,664.1 116,066.3 29,029.0
South Florida Regional Transportation Auth. (TrI-Rail) Miami, FL 4,325.9 4,465.8 120,912.1 119,189.6 29,871.2
Virginia Railway Express (VRE) Washington, DC 4,631.9 4,408.1 141,566.8 135,051.1 22,805.7
Northern Indiana Commuter Transp. District (NICTD) Chicago, IL 3,400.2 3,283.6 110,846.7 108,385.9 25,181.0
Dallas Area Rapid Transit (DART) Dallas, TX 2,038.9 2,007.0 39,672.8 35,381.6 43,133.4
Pennsylvania Department of Transportation (PENNDOT) Philadelphia, PA 1,497.9 1,567.7 129,876.4 137,797.2 10,856.6
Altamont Corridor Express (ACE) Stockton, CA 1,399.0 1,506.2 61,400.7 65,810.5 10,577.1
Central Florida Commuter Rail (SunRail) Orlando, FL 831.5 1,469.7 12,044.6 24,566.7 14,227.0
North County Transit District (NCTD) San Diego, CA 1,433.1 1,408.7 37,902.7 37,232.4 14,488.1
Metro Transit Minneapolis, MN 787.3 767.8 19,441.5 18,965.6 18,518.3
Rio Metro Regional Transit District (RMRTD) Albuquerque, NM 787.1 763.4 36,154.2 35,411.2 6,791.5
Sonoma-Marin Area Rail Transit District (SMART) Santa Rosa, CA 636.0 716.8 16,174.2 18,371.2 14,299.8
Connecticut Department of Transportation (CDOT) Hartford, CT 720.8 595.4 18,251.3 16,002.4 5,457.8
Northern New England Passenger Rail Auth. (NNEPRA) Portland, ME 551.0 547.3 45,119.3 44,297.1 2,768.3
Fort Worth Transportation Authority (FWTA) Dallas, TX — 407.4 — 6,558.7 13,155.2
Regional Transportation Authority (RTA) Nashville, TN 303.0 289.5 4,928.9 4,544.2 9,076.0
Alaska Railroad Corporation (ARRC) Anchorage, AK 199.7 203.4 24,178.1 24,172.1 354.6
HYBRID RAIL AGENCIES
New Jersey Transit Corporation (NJ TRANSIT) New York, NY 2,700.6 2,744.9 38,740.5 40,925.5 47,911.9
North County Transit District (NCTD) San Diego, CA 2,532.7 2,409.0 21,730.5 20,676.7 66,162.1
San Francisco Bay Area Rapid Transit District (BART) San Francisco, CA 207.6 2,225.1 1,463.9 15,283.3 116,009.2
Capital Metropolitan Transportation Authority (CMTA) Austin, TX 811.2 729.5 12,269.5 11,187.6 11,296.2
Denton County Transportation Authority (DCTA) Lewisville, TX 419.3 393.7 5,901.0 5,493.3 13,717.8
Tri-County Metropolitan Transp. District of Oregon (TriMet) Portland, OR 414.3 374.0 3,534.7 3,174.0 18,938.9
RIDERSHIP
PER MILE
OF TRACK

40 | APTA
Table 11: Heavy Rail Agencies (Ranked by Unlinked Passenger Trips)
TRANSIT AGENCY URBANIZED UNLINKED PASSENGER PASSENGER MILES
AREA TRIPS (THOUSANDS) (THOUSANDS)
2018 2019 2018 2019
MTA New York City Transit (NYCT) New York, NY 2,628,355.9 2,712,521.7 9,989,099.1 10,462,782.6 4,252,267.9
Washington Metro. Area Transit Auth. (WMATA) Washington, DC 229,233.3 228,974.8 1,314,002.6 1,313,511.2 977,689.2
Chicago Transit Authority (CTA) Chicago, IL 225,895.0 218,467.1 1,401,503.0 1,378,128.4 972,910.9
Massachusetts Bay Transportation Auth. (MBTA) Boston, MA 163,515.2 160,351.8 576,501.0 572,046.3 2,097,473.0
San Francisco Bay Area Rapid Transit District (BART) San Francisco, CA 127,874.5 125,105.5 1,784,699.3 1,756,364.6 565,422.9
Southeastern Pennsylvania Transp. Auth. (SEPTA) Philadelphia, PA 94,005.1 90,754.2 359,405.1 399,537.4 1,022,928.2
Port Authority Trans-Hudson Corporation (PATH) New York, NY 89,664.4 90,275.2 444,870.3 447,020.7 1,860,960.2
Metropolitan Atlanta Rapid Transit Authority (MARTA) Atlanta, GA 65,086.6 65,217.3 449,895.8 450,023.1 627,089.7
Los Angeles County Metro. Transp. Auth. (LACMTA) Los Angeles, CA 43,752.3 43,074.3 210,105.5 207,664.9 1,352,835.3
Miami-Dade Transit (MDT) Miami, FL 19,150.3 18,494.5 139,494.7 136,546.1 364,208.4
Port Authority Transit Corporation (PATCO) Philadelphia, PA 10,789.4 11,107.5 96,375.0 99,332.9 336,590.1
Staten Island Rapid Transit Operating Auth. (SIRTOA) New York, NY 8,129.7 7,731.8 50,703.8 48,222.7 269,402.4
Maryland Transit Administration (MTA) Baltimore, MD 8,917.0 7,275.3 36,790.5 32,470.5 245,954.5
Greater Cleveland Reg. Transit Authority (GCRTA) Cleveland, OH 6,273.4 5,666.7 42,165.7 36,529.7 149,241.7
Alternativa de Transporte Integrado -ATI (PRHTA) San Juan, PR 3,800.4 5,345.7 18,488.8 25,648.0 259,374.2
RIDERSHIP
PER MILE
OF TRACK

APTA | 41 2021 PUBLIC TRANSPORTATION FACT BOOK | 41
Table 12: Light Rail and Streetcar Agencies (Ranked by Unlinked Passenger Trips)
TRANSIT AGENCY URBANIZED UNLINKED PASSENGER PASSENGER MILES
AREA TRIPS (THOUSANDS) (THOUSANDS)
2018 2019 2018 2019
LIGHT RAIL AGENCIES
Los Angeles County Metro. Transp. Auth. (LACMTA) Los Angeles, CA 66,387.2 59,655.4 495,011.7 462,756.2 347,378.8
Massachusetts Bay Transportation Authority (MBTA) Boston, MA 56,768.8 56,975.6 141,734.6 137,719.1 1,113,021.4
San Francisco Municipal Railway (Muni) San Francisco, CA 49,833.6 49,795.7 136,717.1 136,469.6 803,545.9
Tri-County Metro. Transp. District of Oregon (TriMet) Portland, OR 38,919.8 38,867.6 210,180.6 207,967.8 323,869.5
San Diego Metropolitan Transit System (MTS) San Diego, CA 36,995.2 37,293.8 214,376.5 219,453.2 358,593.8
Dallas Area Rapid Transit (DART) Dallas, TX 28,873.2 28,335.8 232,288.8 227,090.3 149,821.7
Metro Transit Minneapolis, MN 24,955.6 25,299.4 100,276.9 100,499.4 556,031.7
Central Puget Sound Regional Transit Authority (ST) Seattle, WA 24,470.3 24,761.7 161,293.4 163,463.7 593,520.7
Denver Regional Transportation District (RTD) Denver, CO 25,322.1 24,585.3 180,411.5 178,266.8 226,384.0
New Jersey Transit Corporation (NJ TRANSIT) New York, NY 20,957.5 21,550.4 72,411.9 73,704.1 489,448.1
Metro. Transit Auth, of Harris County, Texas (METRO) Houston, TX 18,980.3 18,556.6 53,625.0 52,243.1 376,630.6
Utah Transit Authority (UTA) Salt Lake City, UT 17,899.7 17,128.0 89,112.6 83,098.5 186,174.0
Valley Metro Rail, Inc. Phoenix-Mesa, AZ 15,786.9 15,084.3 113,208.5 108,918.7 280,065.2
Bi-State Development Agency (Metro) St. Louis, MO 13,550.4 13,150.9 92,945.5 89,068.6 143,521.9
Sacramento Regional Transit District (SacRT) Sacramento, CA 10,372.7 9,980.9 65,530.8 63,439.9 120,396.3
Santa Clara Valley Transportation Authority (VTA) San Jose, CA 8,507.1 8,437.9 46,981.1 49,376.2 105,447.7
Charlotte Area Transit System (CATS) Charlotte, NC 5,789.0 8,006.9 29,839.0 45,024.7 213,972.5
Port Authority of Allegheny County Pittsburgh, PA 7,655.5 7,162.8 30,261.6 28,888.0 148,605.6
Maryland Transit Administration (MTA) Baltimore, MD 7,416.5 6,966.1 44,778.2 39,817.0 123,140.7
Niagara Frontier Transportation Authority (NFT Metro) Buffalo, NY 4,518.3 4,485.1 12,128.7 11,971.5 350,397.2
Greater Cleveland Reg. Transit Auth. (GCRTA) Cleveland, OH 1,638.2 1,484.9 9,580.1 8,974.5 58,002.5
Transportation Dist. Comm. of Hampton Roads (HRT) Virginia Beach, VA 1,417.4 1,429.0 4,932.5 4,798.1 98,821.3
STREETCAR AGENCIES
Southeastern Pennsylvania Transp. Authority (SEPTA) Philadelphia, PA 24,999.6 22,816.9 57,709.4 58,270.4 272,277.8
San Francisco Municipal Railway (Muni) San Francisco, CA 7,475.8 7,386.5 10,735.4 10,615.5 582,533.0
New Orleans Regional Transit Authority (NORTA) New Orleans, LA 7,747.5 5,289.3 15,572.5 12,324.1 155,568.4
City of Portland (PBOT) Portland, OR 4,879.7 4,491.4 10,171.6 5,845.8 316,293.1
Kansas City, City of Missouri Kansas City, MO 2,017.1 2,187.3 2,622.2 2,881.1 560,858.2
King County Dept. of Transp. (King County Metro) Seattle, WA 1,685.7 1,863.4 1,856.3 2,027.9 237,376.9
DDOT - Progressive Transportation Services Admin. Washington, DC 1,171.5 1,185.6 977.7 920.9 316,997.6
M-1 Rail Detroit, MI 1,192.1 1,169.2 1,812.0 1,796.0 171,943.1
Central Puget Sound Regional Transit Authority (ST) Seattle, WA 897.6 937.0 795.9 849.2 370,338.7
City of Tucson (COT) Tucson, AZ 899.9 897.0 1,484.8 1,406.5 117,407.2
Hillsborough Area Regional Transit Authority (HART) Tampa, FL 424.3 878.3 690.1 1,220.9 253,856.4
City of Milwaukee Milwaukee, WI 156.7 760.3 160.9 800.6 194,954.1
McKinney Avenue Transit Authority (MATA) Dallas, TX 519.0 571.8 664.3 722.0 126,225.4
Southwest Ohio Regional Transit Authority (SORTA) Cincinnati, OH 485.7 531.6 799.2 844.2 147,664.4
City of Memphis (MATA) Memphis, TN 109.2 371.0 89.6 452.2 37,023.5
Metropolitan Atlanta Rapid Transit Authority (MARTA) Atlanta, GA 388.0 285.1 364.7 214.1 105,976.6
Charlotte Area Transit System (CATS) Charlotte, NC 371.6 279.7 305.8 256.6 111,877.2
Dallas Area Rapid Transit (DART) Dallas, TX 148.8 226.5 223.4 355.7 75,498.7
City of El Paso (Mass Transit Department) El Paso, TX 0.0 222.8 0.0 343.1 48,961.1
Central Oklahoma Transp. and Parking Auth. (COTPA) Oklahoma City, OK 0.0 133.8 0.0 373.6 27,866.7
Rock Region Metropolitan Transit Authority (Metro) Little Rock, AR 42.9 126.9 110.5 325.9 37,988.6
City of Kenosha (KAT) Kenosha, WI 39.6 36.7 65.3 60.5 21,563.5
RIDERSHIP
PER MILE
OF TRACK

42 | APTA
Table 13: Ferryboat Agencies (Ranked by Unlinked Passenger Trips)
TRANSIT AGENCY URBANIZED UNLINKED PASSENGER TRIPS PASSENGER MILES
AREA (THOUSANDS) (THOUSANDS)
2018 2019 2018 2019
New York City Department of Transportation (NYCDOT) New York, NY 24,495.8 25,222.0 127,378.4 131,154.3
Washington State Ferries (WSF) Seattle, WA 24,566.4 24,255.4 193,091.1 190,973.6
New York City Economic Development Corporation New York, NY 4,101.9 5,670.8 22,278.3 30,949.9
Port Imperial Ferry Corporation New York, NY 4,651.3 4,966.9 19,797.3 20,658.3
San Francisco Bay Area Water Emergency Transp. Auth. San Francisco, CA 2,844.4 3,048.9 42,864.3 43,803.5
Martha’s Vineyard and Nantucket Steamship Auth. Barnstable Town, MA 3,055.3 3,004.4 37,183.6 36,673.2
BillyBey Ferry Company, LLC New York, NY 1,914.7 2,858.4 3,728.2 4,996.8
Golden Gate Bridge, Hwy and Transp. District (GGBHTD) San Francisco, CA 2,578.1 2,470.2 27,534.4 26,733.1
Puerto Rico Maritime Transport Authority (PRMTA) San Juan, PR 1,249.5 1,626.9 11,287.5 20,981.0
Massachusetts Bay Transportation Authority (MBTA) Boston, MA 1,497.3 1,584.4 11,986.6 13,942.3
Port Authority Trans-Hudson Corporation (PATH) New York, NY 1,371.8 1,397.0 3,472.3 3,483.1
Casco Bay Island Transit District (CBITD) Portland, ME 1,111.1 1,099.8 4,018.9 3,904.4
Kitsap Transit Bremerton, WA 854.7 1,038.8 5,513.5 8,593.2
New Orleans Regional Transit Authority (NORTA) New Orleans, LA 1,054.3 844.9 527.1 422.5
Chatham Area Transit Authority (CAT) Savannah, GA 853.8 787.5 324.4 299.2
Plaquemines Parish Government (PPG) New Orleans, LA 712.8 718.1 356.4 359.0
King County Department of Metro Transit (KCM) Seattle, WA 664.4 701.6 3,323.9 3,464.1
County of Pierce (Pierce County Ferry) Seattle, WA 443.0 460.5 1,754.3 1,823.6
Jacksonville Transportation Authority (JTA) Jacksonville, FL 438.0 423.8 197.1 190.7
Chicago Water Taxi (Wendella)(CWT) Chicago, IL-IN 403.0 413.0 743.3 782.4
City of Baltimore Baltimore, MD 326.1 332.6 142.8 142.1
Transportation District Comm. of Hampton Roads (HRT) Virginia Beach, VA 327.7 301.3 235.2 214.2
MTA Metro-North Railroad (MTA-MNCR) New York, NY 164.5 172.8 676.1 707.2
City of Fort Lauderdale Miami, FL 46.5 56.4 13.4 16.4
Rhode Island Department of Transportation Providence, RI 41.9 42.7 1,080.2 1,100.4
Rock Island County Met. Mass Transit Dist. (MetroLink) Davenport, IA 44.6 31.3 254.2 191.3
Central Oklahoma Transp. and Parking Auth. (COTPA) Oklahoma City, OK 8.9 3.7 21.1 9.6
(a) Table does not include rural ferryboat reporters
(a) Reported in National Transit Database Rural Data Tables.
Table 14: Other Rail Agencies (Ranked by Unlinked Passenger Trips)
TRANSIT AGENCY URBANIZED UNLINKED PASSENGER TRIPS PASSENGER MILES
AREA (THOUSANDS) (THOUSANDS)
2018 2019 2018 2019
CABLE CAR / AERIAL TRAMWAY / INCLINED PLANE
San Francisco Municipal Railway (Muni) San Francisco, CA 6,292.3 5,703.7 7,881.0 7,395.4
Town of Mountain Village (a) Mountain Village, CO 3,026.1 3,151.6 — —
City of Portland (PBOT) Portland, OR 2,068.0 2,104.4 1,323.5 1,346.8
Chattanooga Area Regional Transp. Authority (CARTA) Chattanooga, TN 489.5 491.4 489.5 422.8
Port Authority of Allegheny County Pittsburgh, PA 610.4 431.0 71.3 50.4
Cambria County Transit Authority (CamTran) Johnstown, PA 51.5 65.8 8.8 11.2
MONORAIL AND AUTOMATED GUIDEWAY TRANSIT
Miami-Dade Transit (MDT) Miami, FL 8,802.5 8,863.8 8,038.9 8,325.8
City of Seattle - Seattle Center Monorail Transit Seattle, WA 2,021.8 1,939.2 1,819.6 1,745.3
Detroit Transportation Corp. (Detroit People Mover) Detroit, MI 1,952.5 1,735.9 2,694.5 2,395.5
West Virginia University, Morgantown PRT Morgantown, WV 1,961.7 1,469.3 3,623.8 2,788.4
San Francisco Bay Area Rapid Transit District (BART) Oakland, CA 962.3 886.5 3,060.0 2,819.1
Jacksonville Transportation Authority (JTA) Jacksonville, FL 844.3 796.1 802.1 660.7

APTA | 43 2021 PUBLIC TRANSPORTATION FACT BOOK | 43
Table 15: 35 Largest Rural Bus and 15 Largest Rural Commuter Bus Agencies (Ranked by Unlinked Passenger Trips)
STATE TRANSIT AGENCY NAME UNLINKED PASSENGER TRIPS (a)
2018 2019
RURAL BUS AGENCIES
TN Pigeon Forge Mass Transit 2,967,737 3,113,887
UT Park City Municipal Corporation 2,313,740 2,659,826
CO Roaring Fork Transportation Authority (RFTA) 2,413,419 2,536,928
MD Mayor and City Council Town of Ocean City 2,423,665 2,384,263
NC AppalCart 1,782,035 1,770,402
CO Summit County (Summit Stage) 1,649,328 1,692,678
WA Pullman Transit 1,361,962 1,370,112
CO Town of Breckenridge 1,174,127 1,308,780
MA Martha’s Vineyard Transit Authority 1,347,337 1,305,195
WY Southern Teton Area Rapid Transit 1,092,067 1,131,607
CO Eagle County Regional Transp. Auth. 1,058,885 1,117,311
CO Steamboat Springs, City of 1,062,531 1,109,576
MS City of Oxford (COX) 1,353,860 1,059,006
CA Eastern Sierra Transit Authority 1,005,122 1,054,667
AK City and Borough of Juneau 1,032,304 1,036,923
VT Advance Transit, Inc. NH 868,428 886,003
IL City of Macomb 1,081,141 819,317
WA Grays Harbor Transit 782,115 792,809
FL City of Key West DOT 619,261 761,655
MS SMART Starkville-MSU Area Rapid Transit 611,905 738,871
TN City of Gatlinburg 698,439 738,219
WA Clallam Transit System (CTS) 710,987 725,104
CO Mountain Express 690,774 713,561
HI County of Kaua’i - Transportation Agency 685,474 682,372
NY City of Oneonta 663,595 660,460
ME Downeast Transportation, Inc. 591,217 637,458
CO Town of Snowmass Village 531,940 588,511
WY University of Wyoming 591,630 561,985
WA Island Transit 577,139 553,096
ID Mountain Rides Transportation Authority 499,068 540,654
VT Marble Valley Regional Transit District 507,110 523,912
OK OSU-Stillwater Community Transit 526,225 489,096
CO City of Winter Park 482,244 477,490
MI Bay Area Transportation Authority 423,019 473,180
OH Athens Transit 506,300 472,677
RURAL COMMUTER BUS AGENCIES
CO Roaring Fork Transportation Authority 1,615,266 1,618,533
HI County of Hawaii Mass Transit Agency 742,250 511,412
CA Humboldt Transit Authority 499,234 473,824
CO Gunnison Valley Transportation Authority 180,996 224,718
TX El Paso County 199,194 208,164
OR Yamhill County 155,164 146,304
VT Marble Valley Regional Transit District 129,323 141,247
PA New Castle Area Transit Authority 110,370 102,638
OR City of Sandy (SAM) 110,830 101,306
TX Capital Area Rural Transp. System 111,958 74,981
OR South Clackamas Transp. Dist. 67,028 69,258
OR Clackamas County Social Services 60,414 64,946
CA County of Sacramento Municipal Services 59,016 58,083
VT Tri-Valley Transit Inc 51,373 57,918
OR Senior Citizens of Sweet Home, Inc. 55,082 54,061
The National Transit Database publishes a separate and less detailed database for rural transit agencies which provide service outside of urbanized areas. Tables 15 and 16 include only agencies reporting to the Federal Transit Administration FY 2018 National Transit Database for Rural Areas.
(a) Sum of “regular trips” and “coordinated trips.”

44 | APTA
Table 16: 35 Largest Rural Demand Response and 15 Largest Vanpool Agencies (Ranked by Unlinked Passenger Trips)
STATE TRANSIT AGENCY NAME UNLINKED PASSENGER TRIPS (a)
2018 2019
RURAL DEMAND RESPONSE AGENCIES
MO OATS, Inc. 1,551,311 1,420,691
OK KI BOIS Community Action Foundation, Inc. 611,157 636,691
KY Rural Transit Enterprises Coordinated, Inc. 630,313 605,390
AL West Alabama Rural Public Transportation 569,681 510,522
IL South Central Illinois Mass Transit District 437,500 446,192
AR Central Arkansas Development Council 422,843 440,678
MI Huron Transit Corporation 405,067 434,668
MI Isabella County Transportation Commission 371,190 379,999
IA Southwest Iowa Planning Council /SW Iowa Transit 324,786 332,142
TX Southeast Missouri Transportation, Inc. 314,096 313,392
TX Panhandle Community Services 298,698 309,950
SD CCTS d/b/a River Cities Transit 300,087 293,843
TX Rural Economic Assistance League, Inc 271,842 287,897
KY Pennyrile Allied Community Services, Inc. 185,067 284,245
MN Arrowhead Economic Opportunity Agency, Inc. 232,795 269,606
MN Trailblazer Joint Powers Board 254,488 264,323
GA Southwest Georgia RC 250,015 261,694
IA North Iowa Area Council of Governments 354,905 257,512
KY Sandy Valley Transportation Services 176,441 248,397
CA Fresno County Rural Transit Agency 283,304 234,009
KY Bluegrass Community Action Agency 233,327 226,677
IA Heart of Iowa Regional Transit Agency 253,217 212,407
OK Grand Gateway EDA/ Pelivan 170,194 211,898
AR Area Agency on Aging of Southeast Arkansas, Inc. 214,678 211,827
IA 10-15 Regional Transit Agency 177,415 211,790
IA Regional Transit Authority/RIDES 220,603 201,954
IA East Central Iowa Council of Governments 247,878 199,396
MN United Community Action Partnership, Inc. 222,735 195,000
MN Central Community Transit 198,576 191,395
MI Yates Township Transportation System 234,820 191,159
TN Northwest TN Human Resource Agency 190,294 189,219
TN South Central TN Development District 188,159 188,238
OK Community Action Development Corporation 185,771 178,716
MI Ludington Mass Transportation Authority 180,613 177,659
VT Rural Community Transportation 152,365 174,497
RURAL COMMUTER BUS AGENCIES
TX El Paso County 185,687 235,731
WA Island Transit 158,741 145,645
WA Clallam Transit System 78,200 70,448
FL FDOT - vanpool 60,313 59,494
WA Grays Harbor Transit 76,420 48,117
WA Grant County Transportation Authority 37,169 36,089
ID Mountain Rides Transportation Authority 36,967 35,613
MT Missoula Ravalli Transportation Management Association 32,000 28,091
WA Mason County Transportation Authority 19,855 20,222
IA East Central Iowa Council of Governments — 17,319
FL Big Bend Transit 16,829 14,302
WA Okanogan Transit 9,042 12,321
WA Columbia County Public Transportation 9,359 7,815
PA Area Transportation Authority of North Central PA 8,519 7,656
WA Jefferson Transit 5,978 5,290
The National Transit Database publishes a separate and less detailed database for rural transit agencies which provide service outside of urbanized areas. Tables 15 and 16 include only agencies reporting to the Federal Transit Administration FY 2018 National Transit Database for Rural Areas.
(a) Sum of “regular trips” and “coordinated trips.”

APTA | 45 2021 PUBLIC TRANSPORTATION FACT BOOK | 45
APTA and the Fact Book
Fact Book Methodology
APTA and the History of the Fact Book
Additional Fact Book Resources Published on APTA Website

46 | APTA
The 2021 Public Transportation Fact Book includes only data for public transportation service available to the general public. With some exceptions, it does not include taxicab, unregulated jitney, school bus, sightseeing service, intercity bus, charter bus, military transportation, long-distance rail, services not available to the general public (e.g., governmental and corporate shuttles), or special application systems (e.g., amusement parks or airport systems not connected to the greater transit network).
The procedure for estimating total data in this 2021 Public Transportation Fact Book, and prior issues of the Fact Book, is to expand available data by standard statistical methods to estimate U.S. national totals. Base data are taken from the Federal Transit Administration’s National Transit Database (NTD) for 2019, which was released in December 2020. To account for public transit services not reported to the NTD, APTA expands NTD data by mode in stratified categories of similar systems based on population and other characteristics according to vehicles operated. All procedures are adapted to minimize the maximum possible error, a standard statistical procedure. These data are supplemented by sample data from other sources, including APTA’s “2020 Public Transportation Vehicle Database and 2019 Infrastructure Database,” which are based on surveys of APTA transit system members. All aggregate data are for the United States only. Data for the section on Canada are provided by the Canadian Urban Transit Association.
Because NTD data are collected for “report years,” Fact Book data are also calculated for report years. A report year is each public transit agency’s fiscal year that ends during a calendar year. For example, report year 2018 contains agency data from the fiscal year that ended in 2018.
All data in the Fact Book are reported for “modes of service.” A mode of service is not always identical with a vehicle type of the same name. For example, fixed-route bus service may in specific circumstances be provided by larger van-type vehicles and variable origins, and destination demand response service may in specific circumstances be provided by bus vehicles.
It is APTA policy to continually improve the quality of data reported in the Fact Book. Data are sought from all available sources, and statistical procedures used to verify that the data presented in the Fact Book are improved to be as accurate as possible.
Fact Book Methodology

APTA | 47 2021 PUBLIC TRANSPORTATION FACT BOOK | 47
APTA is a nonprofit international association of more than 1,500 public and private sector organizations, which represents an $80 billion industry that directly employs 448,000 people and supports millions of private sector jobs. APTA members are engaged in the areas of bus, paratransit, light rail, commuter rail, subways, waterborne services, and intercity and high-speed passenger rail. This includes: transit systems; planning, design, construction and finance firms; product and service providers; academic institutions; transit associations and state departments of transportation. APTA is the only association in North America that represents all modes of public transportation. APTA members serve the public interest by providing safe, efficient and economical transit services and products.
The Fact Book can be indirectly traced to the Bureau of Census’ “Report on Transportation in the United States at the Eleventh Census: 1890, Part II - Street Railway Transportation,”
published in Washington, D.C., by the Government Printing Office in 1895. That volume listed data for individual street railways and aggregate data for the entire street railway industry. The Census was conducted again in 1902, 1907 and 1912, but a report with data for individual railways was not published during World War I. The “Census of Electrical Industries: 1917, Electric Railways,” published by the Government Printing Office in 1920, provided summary data only; no data for individual electric railways were included. Summary data were published by the Census every five years through 1937 but was not published for 1942. In response, the APTA predecessor American Transit Association (ATA) published “The Transit Industry of the United States: Basic Data and Trends, 1942 Edition,” in March 1943. The following year the summary of transit data, titled the “Transit Fact Book 1944,” was published and dated for the year in which it was published, which has been continued as the Fact Book dating policy since then.
APTA and the History of the Fact Book

48 | APTA
The 71 previous Fact Book editions, as well as the following resources, can be accessed at apta.com/factbook.
Glossaries and CompendiumsAPTA’s Fact Book Glossary contains definitions for many of the terms used in this document. As an additional resource, APTA’s Compendium or Definitions and Acronyms reflects common terminology used in the rail industry by rail operating and planning agencies, manufacturers, consultants, engineers and general interest groups.
• Fact Book Glossary
• Compendium of Definitions and Acronyms for Rail Systems
Appendix A: Historical TablesAppendix A presents select data items for the entire time period they have been reported in the Fact Book and other statistical reports prepared by APTA and its predecessor organizations. Many data items are reported for every year beginning in the 1920s, and ridership is reported from 1907.
• 2021 Fact Book Appendix A: Historical Tables
• 2021 Appendix A tables in Excel format
Appendix B: Transit Agency and Urbanized Area Operating StatisticsAppendix B presents six operating statistics for 2019 for each public transit agency in urbanized areas (UZAs) in size order, totaled for all service modes operated by the agency and in size order for each individual mode. Data are also summed and ranked for UZAs, both for all modes totaled and for individual modes. These lists allow a simple method to determine comparably sized transit agencies. Agencies operating in rural areas
are ranked according to four operating statistics by agency totals and by mode for each agency.Data for Appendix B are taken from the Federal Transit Administration’s National Transit Database (NTD) and include only agencies reporting to the NTD.
• 2021 Appendix B tables in Excel format
Appendix C: Urbanized Area Population, Land Area and Density, 1950-2010The population, land area and density of each UZA are traced from the 1950 U.S. Census, when they were first delimited, through the 2010 Census. When UZAs were created, the Census identified which other UZAs they merged with or from which they were broken off, as well as all name changes. Population growth from year to year and separate annual tables listing urbanized areas alphabetically and by size are also included.
• Appendix C tables in Excel format
Material from the 2021 Public Transportation Fact Book may be quoted or reproduced without obtaining the permission of the American Public Transportation Association.
Suggested Identification: American Public Transportation Association: 2021 Public Transportation Fact Book, Washington, D.C., May 2021.
Additional Fact Book Resources Published on APTA Website

APTA | 49 2021 PUBLIC TRANSPORTATION FACT BOOK | 49
2021 PUBLIC TRANSPORTATION
FACT BOOK
Author
Matthew Dickens, Senior Policy [email protected]
APTA Government Affairs and Advocacy Department
Ward W. McCarragher, Vice President, Government Affairs and Advocacy
American Public Transportation Association
Paul P. Skoutelas, President and CEO
1300 I Street, NW, Suite 1200 EastWashington, DC [email protected]
Cover photo courtesy of Los Angeles Metropolitan Transportation Authority

1300 I Street NW l Suite 1200 East l Washington, DC 20005 l (202) 496-4800 l www.apta.com