2030 india roadmap - climateinvestmentfunds.org
TRANSCRIPT
2030 India RoadmapMultiplying the Transition:
Market-based solutions for catalyzing clean
energy investment in emerging economies
Sandra Esser
Rohit Gadre
Shantanu Jaiswal
October 2021
1
About Climate Investment Funds (CIF) About BloombergNEF (BNEF)
BloombergNEF (BNEF) is a strategic research provider covering
global commodity markets and the disruptive technologies driving
the transition to a low-carbon economy. Our expert coverage
assesses pathways for the power, transport, industry, buildings
and agriculture sectors to adapt to the energy transition. We help
commodity trading, corporate strategy, finance and policy
professionals navigate change and generate opportunities.
The Climate Investment Funds (CIF) is one of the world’s largest and
most ambitious climate finance mechanisms. Founded in 2008, it
represents one of the first global efforts to invest in a dedicated climate
finance vehicle. The CIF emerged from recognition by world leaders
that climate change and development are inextricably intertwined. The
CIF’s creation also recognized a need to fill a gap in the international
climate finance architecture—to deliver climate-smart investment at
scale. The CIF supports developing and emerging economies in shifting
to low carbon and climate resilient development.
BloombergNEF is working with the Climate Investment Funds to identify how financial intermediaries can mobilize clean energy investment in
emerging markets. In the context of post-pandemic sustainable recoveries and the need to meet international climate commitments such as the
Nationally Determined Contributions (NDCs), accelerating the global energy transition is now more pressing than ever. BNEF sees electrification
through clean power and transport as the basis of decarbonization, and therefore, as the backbone of the energy transition. With investors’
appetite for ESG products at an all-time high and capital needs for clean energy investment in many emerging markets often unmet, this project
looks at how to better match this supply and demand. This slide deck serves to support the dialog with stakeholders on this topic.
About
2
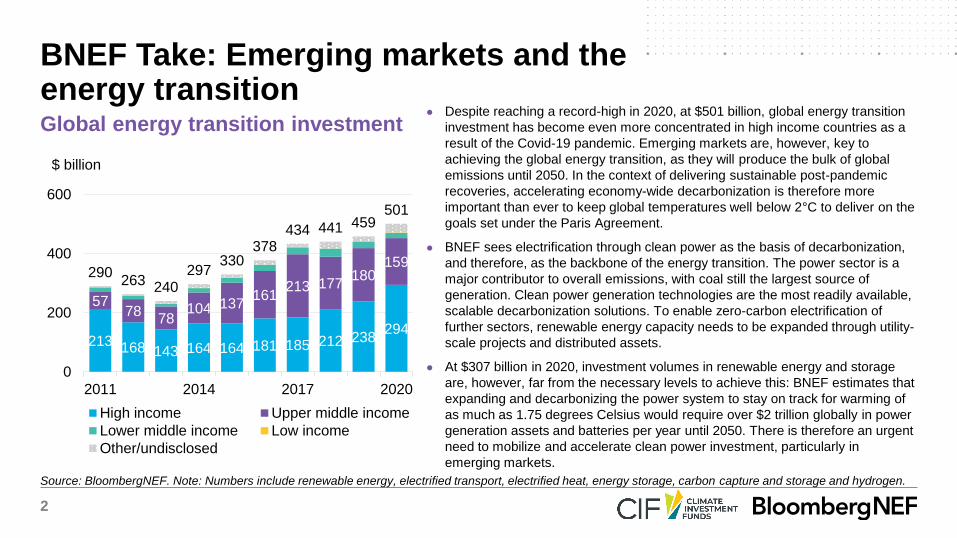
Source: BloombergNEF. Note: Numbers include renewable energy, electrified transport, electrified heat, energy storage, carbon capture and storage and hydrogen.
Global energy transition investment● Despite reaching a record-high in 2020, at $501 billion, global energy transition
investment has become even more concentrated in high income countries as a
result of the Covid-19 pandemic. Emerging markets are, however, key to
achieving the global energy transition, as they will produce the bulk of global
emissions until 2050. In the context of delivering sustainable post-pandemic
recoveries, accelerating economy-wide decarbonization is therefore more
important than ever to keep global temperatures well below 2°C to deliver on the
goals set under the Paris Agreement.
● BNEF sees electrification through clean power as the basis of decarbonization,
and therefore, as the backbone of the energy transition. The power sector is a
major contributor to overall emissions, with coal still the largest source of
generation. Clean power generation technologies are the most readily available,
scalable decarbonization solutions. To enable zero-carbon electrification of
further sectors, renewable energy capacity needs to be expanded through utility-
scale projects and distributed assets.
● At $307 billion in 2020, investment volumes in renewable energy and storage
are, however, far from the necessary levels to achieve this: BNEF estimates that
expanding and decarbonizing the power system to stay on track for warming of
as much as 1.75 degrees Celsius would require over $2 trillion globally in power
generation assets and batteries per year until 2050. There is therefore an urgent
need to mobilize and accelerate clean power investment, particularly in
emerging markets.
BNEF Take: Emerging markets and the energy transition
213 168 143 164 164 181 185 212 238294
5778
78104 137
161213 177
180159
290263 240
297330
378434 441 459
501
0
200
400
600
2011 2014 2017 2020
$ billion
High income Upper middle income
Lower middle income Low income
Other/undisclosed
3
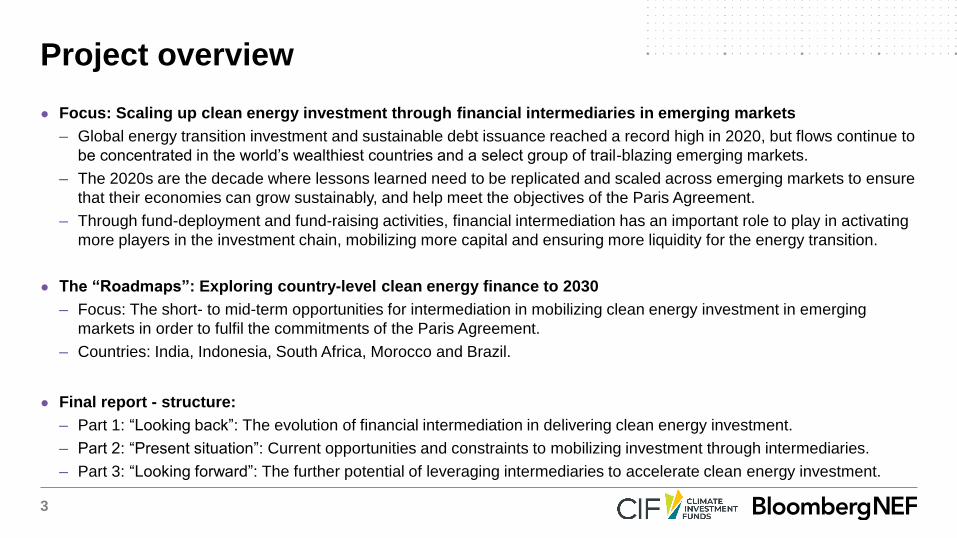
● Focus: Scaling up clean energy investment through financial intermediaries in emerging markets
– Global energy transition investment and sustainable debt issuance reached a record high in 2020, but flows continue to
be concentrated in the world’s wealthiest countries and a select group of trail-blazing emerging markets.
– The 2020s are the decade where lessons learned need to be replicated and scaled across emerging markets to ensure
that their economies can grow sustainably, and help meet the objectives of the Paris Agreement.
– Through fund-deployment and fund-raising activities, financial intermediation has an important role to play in activating
more players in the investment chain, mobilizing more capital and ensuring more liquidity for the energy transition.
● The “Roadmaps”: Exploring country-level clean energy finance to 2030
– Focus: The short- to mid-term opportunities for intermediation in mobilizing clean energy investment in emerging
markets in order to fulfil the commitments of the Paris Agreement.
– Countries: India, Indonesia, South Africa, Morocco and Brazil.
● Final report - structure:
– Part 1: “Looking back”: The evolution of financial intermediation in delivering clean energy investment.
– Part 2: “Present situation”: Current opportunities and constraints to mobilizing investment through intermediaries.
– Part 3: “Looking forward”: The further potential of leveraging intermediaries to accelerate clean energy investment.
Project overview
4
● Ministry of New and Renewable Energy (2021) Annual Report
● Ministry of New and Renewable Energy (2017) PV Rooftop Programme
● Ministry of New and Renewable Energy (2016) Tentative State-wise break-up of Renewable Power by 2022
● Ministry of New and Renewable Energy (2015) National Renewable Energy Act
● Ministry of New and Renewable Energy (2009) Jawaharlal Nehru National Solar Mission
● Ministry of Law and Justice (2003) The Electricity Act
India: Key references and background reading
5
India contents
State of the energy transition 6
Financial ecosystem, capacity and financing needs 22
Leveraging intermediaries to accelerate clean power investment 31
6
State of the energy transitionIndia
7
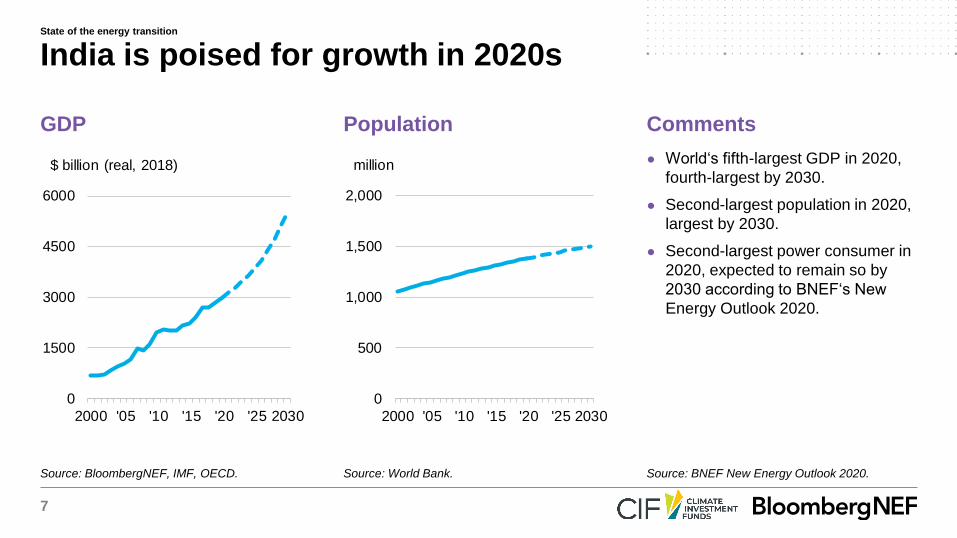
● World‘s fifth-largest GDP in 2020,
fourth-largest by 2030.
● Second-largest population in 2020,
largest by 2030.
● Second-largest power consumer in
2020, expected to remain so by
2030 according to BNEF‘s New
Energy Outlook 2020.
GDP Population Comments
India is poised for growth in 2020s
Source: BloombergNEF, IMF, OECD. Source: World Bank. Source: BNEF New Energy Outlook 2020.
0
1500
3000
4500
6000
2000 '05 '10 '15 '20 '25 2030
$ billion (real, 2018)
0
500
1,000
1,500
2,000
2000 '05 '10 '15 '20 '25 2030
million
State of the energy transition
8
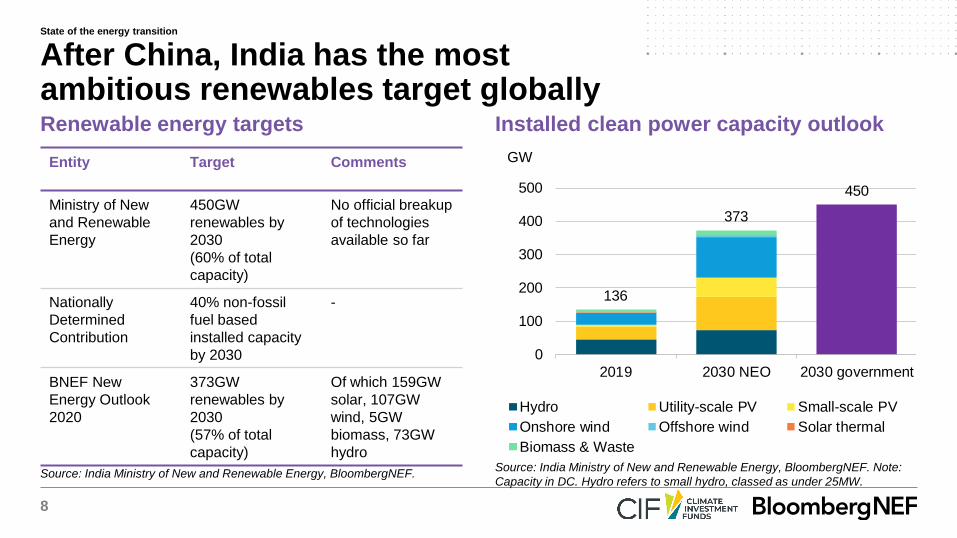
Source: India Ministry of New and Renewable Energy, BloombergNEF. Note:
Capacity in DC. Hydro refers to small hydro, classed as under 25MW.Source: India Ministry of New and Renewable Energy, BloombergNEF.
Renewable energy targets Installed clean power capacity outlook
Entity Target Comments
Ministry of New
and Renewable
Energy
450GW
renewables by
2030
(60% of total
capacity)
No official breakup
of technologies
available so far
Nationally
Determined
Contribution
40% non-fossil
fuel based
installed capacity
by 2030
-
BNEF New
Energy Outlook
2020
373GW
renewables by
2030
(57% of total
capacity)
Of which 159GW
solar, 107GW
wind, 5GW
biomass, 73GW
hydro
After China, India has the most ambitious renewables target globally
136
373
450
0
100
200
300
400
500
2019 2030 NEO 2030 government
GW
Hydro Utility-scale PV Small-scale PV
Onshore wind Offshore wind Solar thermal
Biomass & Waste
State of the energy transition
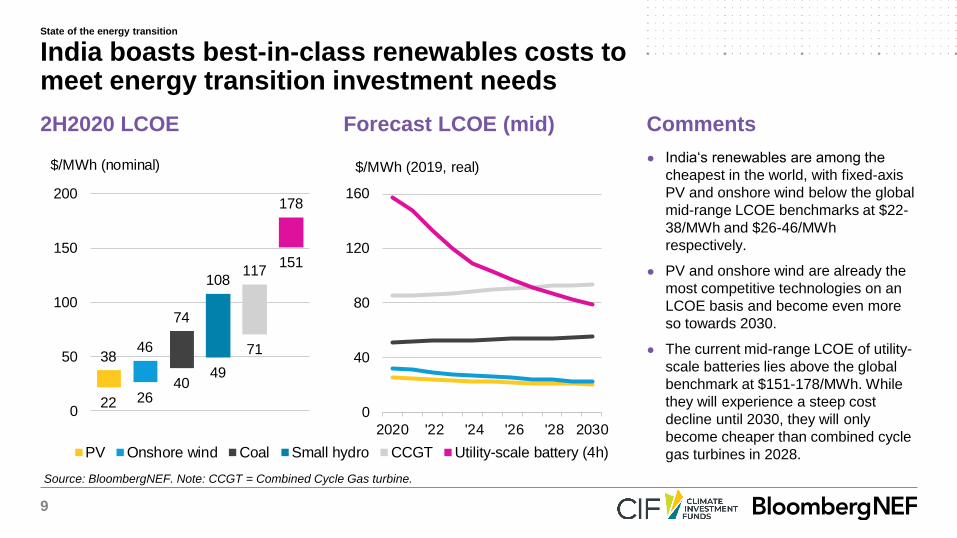
9
● India‘s renewables are among the
cheapest in the world, with fixed-axis
PV and onshore wind below the global
mid-range LCOE benchmarks at $22-
38/MWh and $26-46/MWh
respectively.
● PV and onshore wind are already the
most competitive technologies on an
LCOE basis and become even more
so towards 2030.
● The current mid-range LCOE of utility-
scale batteries lies above the global
benchmark at $151-178/MWh. While
they will experience a steep cost
decline until 2030, they will only
become cheaper than combined cycle
gas turbines in 2028.
2H2020 LCOE Forecast LCOE (mid) Comments
India boasts best-in-class renewables costs to meet energy transition investment needs
Source: BloombergNEF. Note: CCGT = Combined Cycle Gas turbine.
22 2640
49
71
151
3846
74
108117
178
0
50
100
150
200
$/MWh (nominal)
0
40
80
120
160
2020 '22 '24 '26 '28 2030
$/MWh (2019, real)
PV Onshore wind Coal Small hydro CCGT Utility-scale battery (4h)
State of the energy transition
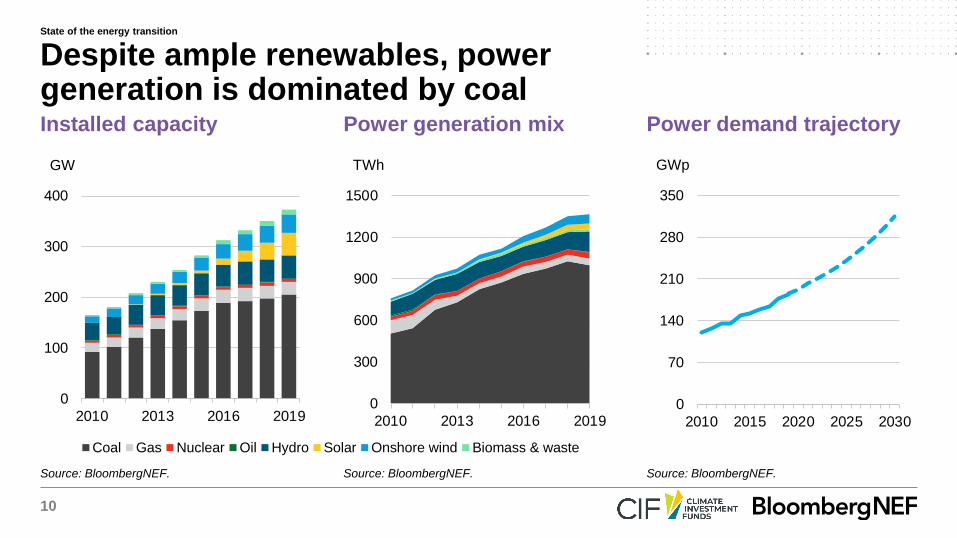
10
Installed capacity Power generation mix Power demand trajectory
Despite ample renewables, power generation is dominated by coal
Source: BloombergNEF. Source: BloombergNEF. Source: BloombergNEF.
Coal Gas Nuclear Oil Hydro Solar Onshore wind Biomass & waste
0
100
200
300
400
2010 2013 2016 2019
GW
0
300
600
900
1200
1500
2010 2013 2016 2019
TWh
0
70
140
210
280
350
2010 2015 2020 2025 2030
GWp
State of the energy transition
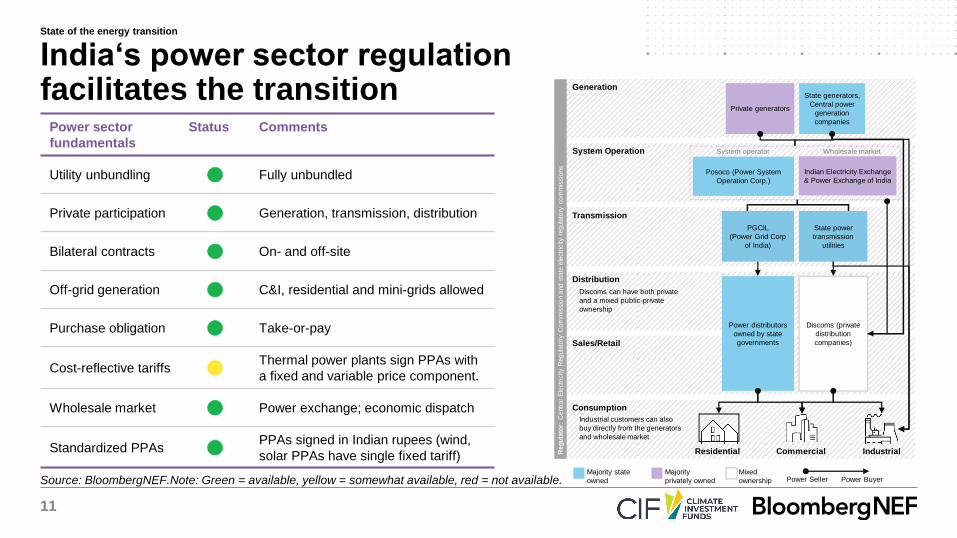
11
Source: BloombergNEF.Note: Green = available, yellow = somewhat available, red = not available.
Generation
System Operation
Transmission
Distribution
Sales/Retail
Consumption
Residential Commercial Industrial
Private generators
State generators,
Central power
generation
companies
Industrial customers can also
buy directly from the generators
and wholesale market
Discoms can have both private
and a mixed public-private
ownership
Majority state
owned
Majority
privately owned
Mixed
ownership Power Seller Power Buyer
Reg
ula
tor:
Centr
al
Ele
ctr
icity R
egula
tory
Co
mm
issio
n a
nd s
tate
ele
ctr
icity r
egula
tory
co
mm
issio
ns
System operator
Posoco (Power System
Operation Corp.)
PGCIL
(Power Grid Corp
of India)
State power
transmission
utilities
Discoms (private
distribution
companies)
Power distributors
owned by state
governments
Wholesale market
Indian Electricity Exchange
& Power Exchange of India
Power sector
fundamentals
Status Comments
Utility unbundling ⚫ Fully unbundled
Private participation ⚫ Generation, transmission, distribution
Bilateral contracts ⚫ On- and off-site
Off-grid generation ⚫ C&I, residential and mini-grids allowed
Purchase obligation ⚫ Take-or-pay
Cost-reflective tariffs ⚫Thermal power plants sign PPAs with
a fixed and variable price component.
Wholesale market ⚫ Power exchange; economic dispatch
Standardized PPAs ⚫PPAs signed in Indian rupees (wind,
solar PPAs have single fixed tariff)
India‘s power sector regulation facilitates the transition
State of the energy transition
12
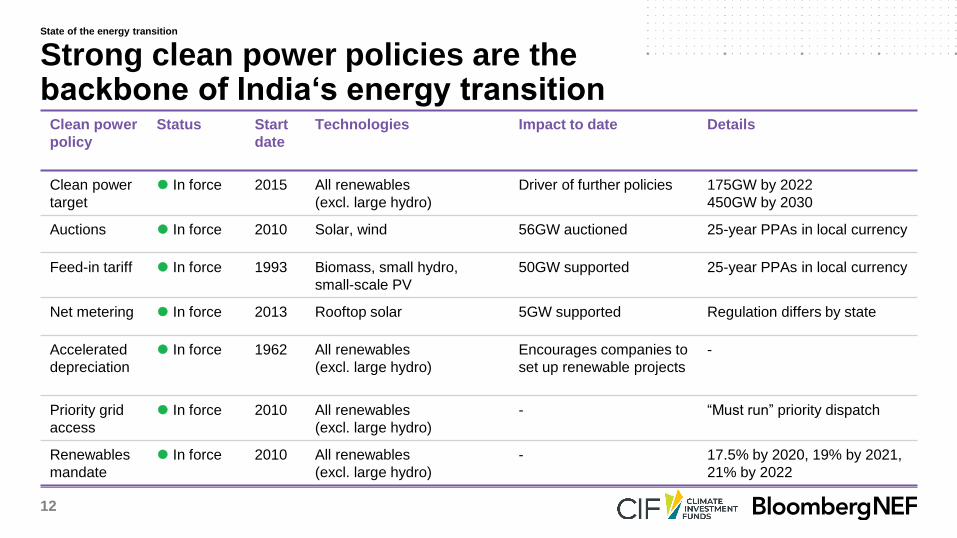
Clean power
policy
Status Start
date
Technologies Impact to date Details
Clean power
target
⚫ In force 2015 All renewables
(excl. large hydro)
Driver of further policies 175GW by 2022
450GW by 2030
Auctions ⚫ In force 2010 Solar, wind 56GW auctioned 25-year PPAs in local currency
Feed-in tariff ⚫ In force 1993 Biomass, small hydro,
small-scale PV
50GW supported 25-year PPAs in local currency
Net metering ⚫ In force 2013 Rooftop solar 5GW supported Regulation differs by state
Accelerated
depreciation
⚫ In force 1962 All renewables
(excl. large hydro)
Encourages companies to
set up renewable projects
-
Priority grid
access
⚫ In force 2010 All renewables
(excl. large hydro)
- “Must run” priority dispatch
Renewables
mandate
⚫ In force 2010 All renewables
(excl. large hydro)
- 17.5% by 2020, 19% by 2021,
21% by 2022
Strong clean power policies are the backbone of India‘s energy transition
State of the energy transition
13
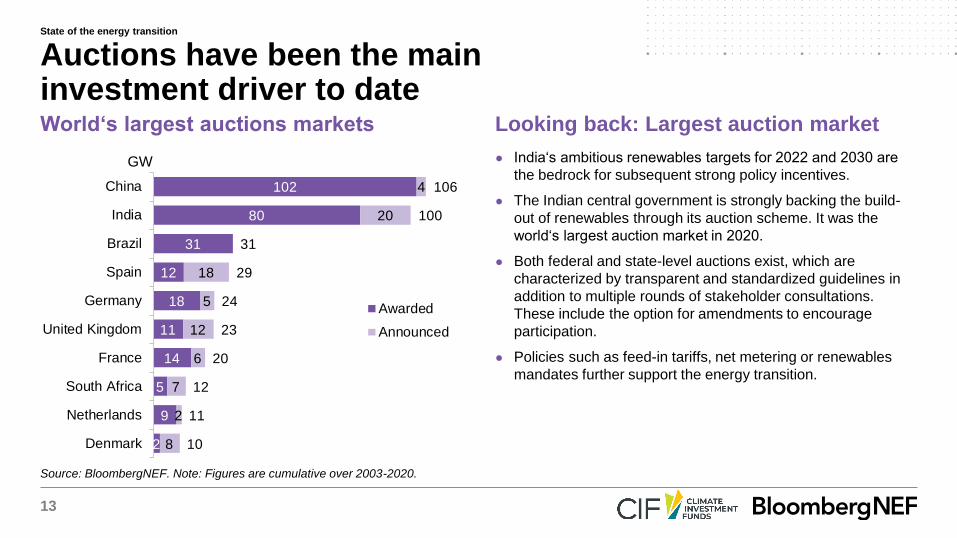
Source: BloombergNEF. Note: Figures are cumulative over 2003-2020.
World‘s largest auctions markets Looking back: Largest auction market
● India‘s ambitious renewables targets for 2022 and 2030 are
the bedrock for subsequent strong policy incentives.
● The Indian central government is strongly backing the build-
out of renewables through its auction scheme. It was the
world‘s largest auction market in 2020.
● Both federal and state-level auctions exist, which are
characterized by transparent and standardized guidelines in
addition to multiple rounds of stakeholder consultations.
These include the option for amendments to encourage
participation.
● Policies such as feed-in tariffs, net metering or renewables
mandates further support the energy transition.
Auctions have been the main investment driver to date
2
9
5
14
11
18
12
31
80
102
8
2
7
6
12
5
18
20
4
10
11
12
20
23
24
29
31
100
106
Denmark
Netherlands
South Africa
France
United Kingdom
Germany
Spain
Brazil
India
China
GW
Awarded
Announced
State of the energy transition
14
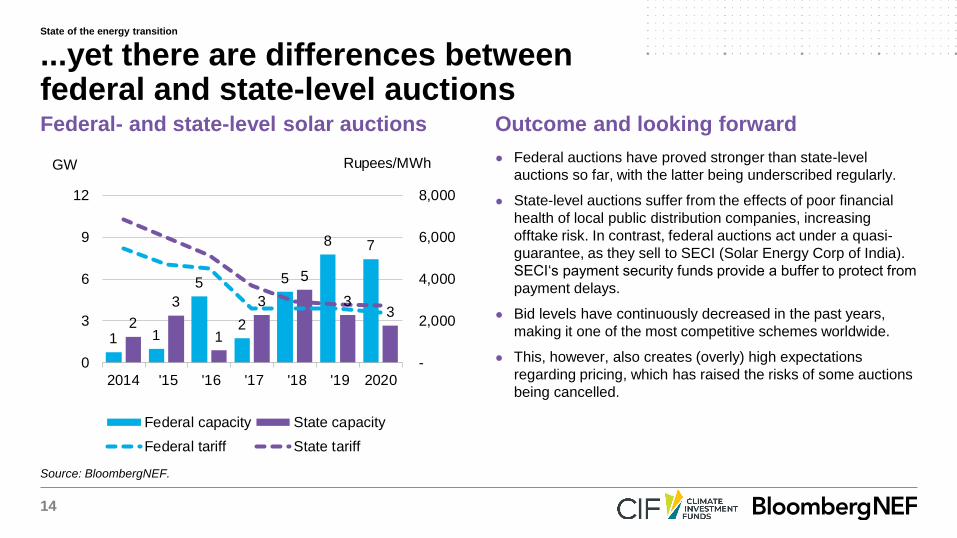
Source: BloombergNEF.
Federal- and state-level solar auctions Outcome and looking forward
● Federal auctions have proved stronger than state-level
auctions so far, with the latter being underscribed regularly.
● State-level auctions suffer from the effects of poor financial
health of local public distribution companies, increasing
offtake risk. In contrast, federal auctions act under a quasi-
guarantee, as they sell to SECI (Solar Energy Corp of India).
SECI‘s payment security funds provide a buffer to protect from
payment delays.
● Bid levels have continuously decreased in the past years,
making it one of the most competitive schemes worldwide.
● This, however, also creates (overly) high expectations
regarding pricing, which has raised the risks of some auctions
being cancelled.
...yet there are differences between federal and state-level auctions
1 1
5
2
5
8 7
2
3
1
3
5
33
-
2,000
4,000
6,000
8,000
0
3
6
9
12
2014 '15 '16 '17 '18 '19 2020
GW
Federal capacity State capacity
Federal tariff State tariff
Rupees/MWh
State of the energy transition
15
Drivers Bottlenecks
● Alongside India‘s strong renewables policies such as
auctions, a number of other favorable policy incentives
exist to support the market.
● Fiscal incentives include lower corporate tax for power
generation, investment subsidies for small-scale solar
installations as well as exemptions from Interstate
Transmission System charges for solar and wind projects
commissioned before June 2023.
● The federal government is also pushing to strengthen the
grid through the Green Energy Corridor program or the
build-out of grid connection infrastructure in the context
of its solar parks program.
● A major bottleneck of the Indian renewables market is a
persistent tariff deficit, leading distribution companies into
severe financial stress. Subsidized retail power prices, in
addition to collection inefficiences, make it difficult for
public distribution companies to recoup costs.
Privatization has been suggested, but opposed so far.
● While currently still limited, issues surrounding grid
integration of large volumes of intermittent renewables
will increasingly prove to be a stumbling block to India‘s
energy transition. The grid currently lacks strength,
flexibility, digitalization and demand-side response
measures, all of which will be key to scaling up clean
power in the future.
● In terms of project development bottlenecks, lengthy,
bureaucratic land acquisition processes can prove a
hindrance to rapid commissioning of assets.
Aside from auctions, further drivers, but also bottlenecks exist
State of the energy transition
16
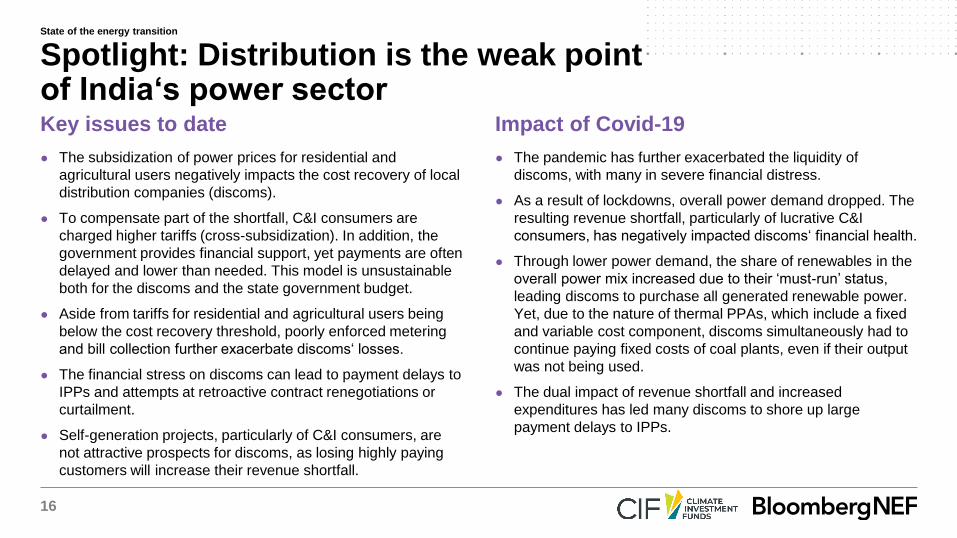
Key issues to date Impact of Covid-19
● The subsidization of power prices for residential and
agricultural users negatively impacts the cost recovery of local
distribution companies (discoms).
● To compensate part of the shortfall, C&I consumers are
charged higher tariffs (cross-subsidization). In addition, the
government provides financial support, yet payments are often
delayed and lower than needed. This model is unsustainable
both for the discoms and the state government budget.
● Aside from tariffs for residential and agricultural users being
below the cost recovery threshold, poorly enforced metering
and bill collection further exacerbate discoms‘ losses.
● The financial stress on discoms can lead to payment delays to
IPPs and attempts at retroactive contract renegotiations or
curtailment.
● Self-generation projects, particularly of C&I consumers, are
not attractive prospects for discoms, as losing highly paying
customers will increase their revenue shortfall.
● The pandemic has further exacerbated the liquidity of
discoms, with many in severe financial distress.
● As a result of lockdowns, overall power demand dropped. The
resulting revenue shortfall, particularly of lucrative C&I
consumers, has negatively impacted discoms‘ financial health.
● Through lower power demand, the share of renewables in the
overall power mix increased due to their ‘must-run’ status,
leading discoms to purchase all generated renewable power.
Yet, due to the nature of thermal PPAs, which include a fixed
and variable cost component, discoms simultaneously had to
continue paying fixed costs of coal plants, even if their output
was not being used.
● The dual impact of revenue shortfall and increased
expenditures has led many discoms to shore up large
payment delays to IPPs.
Spotlight: Distribution is the weak point of India‘s power sector
State of the energy transition
17
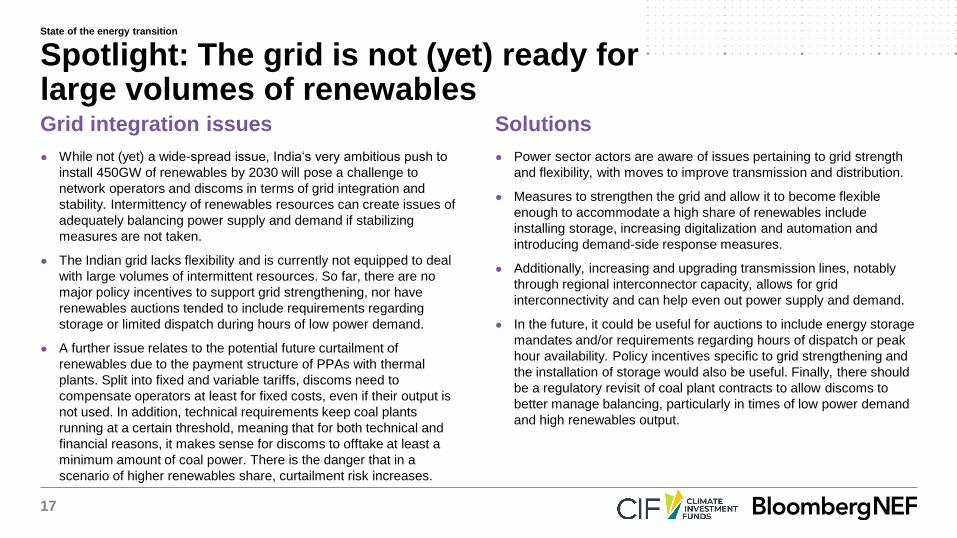
Grid integration issues Solutions
● While not (yet) a wide-spread issue, India‘s very ambitious push to
install 450GW of renewables by 2030 will pose a challenge to
network operators and discoms in terms of grid integration and
stability. Intermittency of renewables resources can create issues of
adequately balancing power supply and demand if stabilizing
measures are not taken.
● The Indian grid lacks flexibility and is currently not equipped to deal
with large volumes of intermittent resources. So far, there are no
major policy incentives to support grid strengthening, nor have
renewables auctions tended to include requirements regarding
storage or limited dispatch during hours of low power demand.
● A further issue relates to the potential future curtailment of
renewables due to the payment structure of PPAs with thermal
plants. Split into fixed and variable tariffs, discoms need to
compensate operators at least for fixed costs, even if their output is
not used. In addition, technical requirements keep coal plants
running at a certain threshold, meaning that for both technical and
financial reasons, it makes sense for discoms to offtake at least a
minimum amount of coal power. There is the danger that in a
scenario of higher renewables share, curtailment risk increases.
● Power sector actors are aware of issues pertaining to grid strength
and flexibility, with moves to improve transmission and distribution.
● Measures to strengthen the grid and allow it to become flexible
enough to accommodate a high share of renewables include
installing storage, increasing digitalization and automation and
introducing demand-side response measures.
● Additionally, increasing and upgrading transmission lines, notably
through regional interconnector capacity, allows for grid
interconnectivity and can help even out power supply and demand.
● In the future, it could be useful for auctions to include energy storage
mandates and/or requirements regarding hours of dispatch or peak
hour availability. Policy incentives specific to grid strengthening and
the installation of storage would also be useful. Finally, there should
be a regulatory revisit of coal plant contracts to allow discoms to
better manage balancing, particularly in times of low power demand
and high renewables output.
Spotlight: The grid is not (yet) ready for large volumes of renewables
State of the energy transition
18
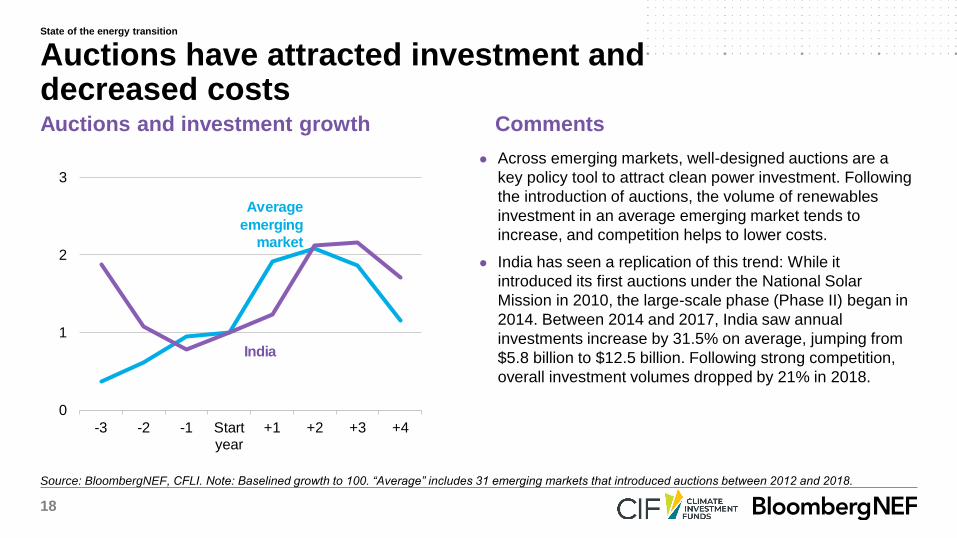
Source: BloombergNEF, CFLI. Note: Baselined growth to 100. “Average” includes 31 emerging markets that introduced auctions between 2012 and 2018.
Auctions and investment growth Comments
● Across emerging markets, well-designed auctions are a
key policy tool to attract clean power investment. Following
the introduction of auctions, the volume of renewables
investment in an average emerging market tends to
increase, and competition helps to lower costs.
● India has seen a replication of this trend: While it
introduced its first auctions under the National Solar
Mission in 2010, the large-scale phase (Phase II) began in
2014. Between 2014 and 2017, India saw annual
investments increase by 31.5% on average, jumping from
$5.8 billion to $12.5 billion. Following strong competition,
overall investment volumes dropped by 21% in 2018.
Auctions have attracted investment and decreased costs
0
1
2
3
-3 -2 -1 Startyear
+1 +2 +3 +4
India
Average
emerging
market
State of the energy transition

19
Source: BloombergNEF. Note: LCOE = Levelized cost of electricity.
Renewable energy investment Renewables investment characteristics
● After China, India secured the highest clean power
investment across emerging markets between 2011 and
2020, at $89 billion.
● The majority of this investment targeted PV and wind,
which absorbed $49 billion and $34 billion respectively.
● Falling investment levels in recent years are mainly
attributable to a fall in technology costs (particularly of
PV) in the wake of India‘s highly competitive auction.
Between 2014 and 2020, the levelized cost of electricity
for PV fell 22% annually, whilst for wind it dropped 13%.
Investment volumes are decreasing on the back of falling technology costs
11
6
56
8
13 13
1110
6
0
40
80
120
160
0
5
10
15
20
2011 2014 2017 2020
$ billion $/MWh
Wind Solar Small hydroBiomass & waste Biofuels Wind LCOESolar LCOE
State of the energy transition
20
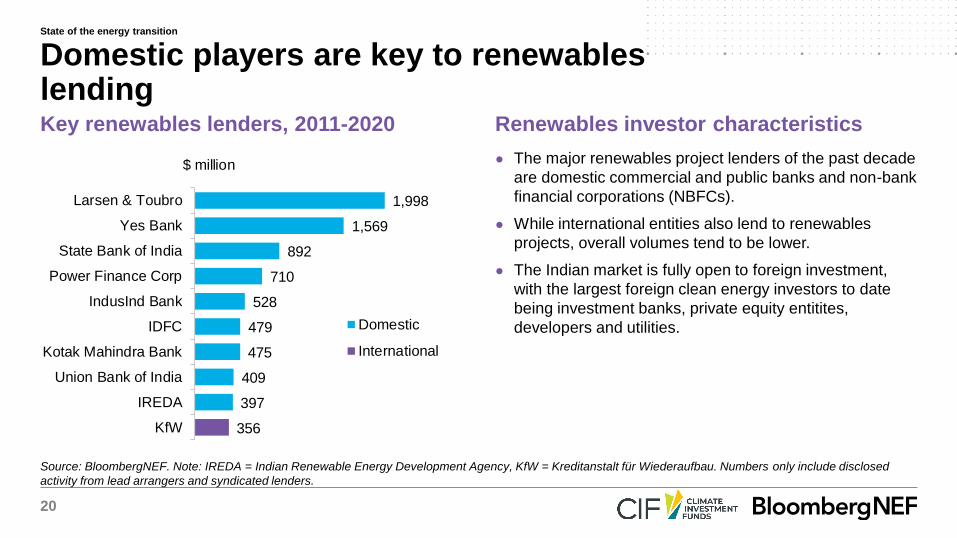
Source: BloombergNEF. Note: IREDA = Indian Renewable Energy Development Agency, KfW = Kreditanstalt für Wiederaufbau. Numbers only include disclosed
activity from lead arrangers and syndicated lenders.
Key renewables lenders, 2011-2020 Renewables investor characteristics
● The major renewables project lenders of the past decade
are domestic commercial and public banks and non-bank
financial corporations (NBFCs).
● While international entities also lend to renewables
projects, overall volumes tend to be lower.
● The Indian market is fully open to foreign investment,
with the largest foreign clean energy investors to date
being investment banks, private equity entitites,
developers and utilities.
Domestic players are key to renewables lending
356
397
409
475
479
528
710
892
1,569
1,998
KfW
IREDA
Union Bank of India
Kotak Mahindra Bank
IDFC
IndusInd Bank
Power Finance Corp
State Bank of India
Yes Bank
Larsen & Toubro
$ million
Domestic
International
State of the energy transition
21
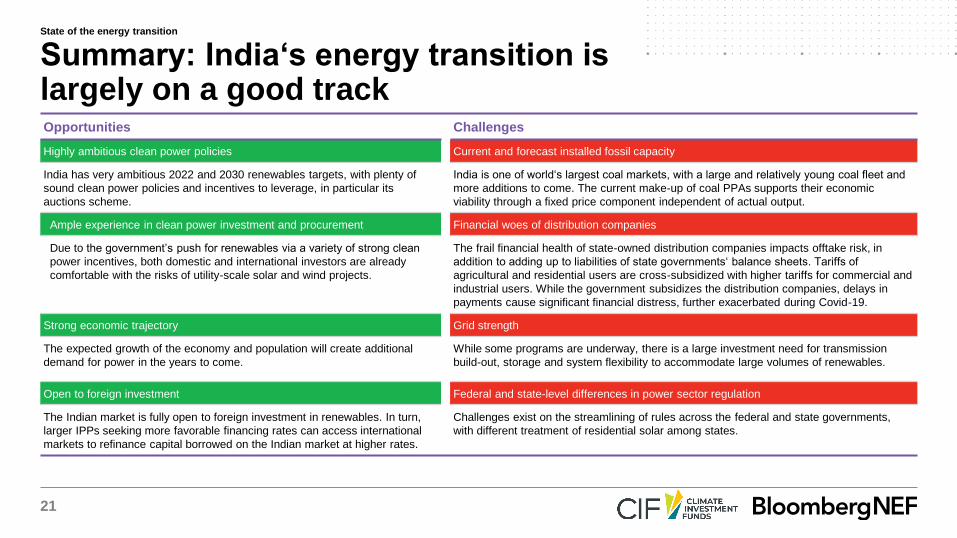
Opportunities Challenges
Highly ambitious clean power policies Current and forecast installed fossil capacity
India has very ambitious 2022 and 2030 renewables targets, with plenty of
sound clean power policies and incentives to leverage, in particular its
auctions scheme.
India is one of world‘s largest coal markets, with a large and relatively young coal fleet and
more additions to come. The current make-up of coal PPAs supports their economic
viability through a fixed price component independent of actual output.
Ample experience in clean power investment and procurement Financial woes of distribution companies
Due to the government’s push for renewables via a variety of strong clean
power incentives, both domestic and international investors are already
comfortable with the risks of utility-scale solar and wind projects.
The frail financial health of state-owned distribution companies impacts offtake risk, in
addition to adding up to liabilities of state governments‘ balance sheets. Tariffs of
agricultural and residential users are cross-subsidized with higher tariffs for commercial and
industrial users. While the government subsidizes the distribution companies, delays in
payments cause significant financial distress, further exacerbated during Covid-19.
Strong economic trajectory Grid strength
The expected growth of the economy and population will create additional
demand for power in the years to come.
While some programs are underway, there is a large investment need for transmission
build-out, storage and system flexibility to accommodate large volumes of renewables.
Open to foreign investment Federal and state-level differences in power sector regulation
The Indian market is fully open to foreign investment in renewables. In turn,
larger IPPs seeking more favorable financing rates can access international
markets to refinance capital borrowed on the Indian market at higher rates.
Challenges exist on the streamlining of rules across the federal and state governments,
with different treatment of residential solar among states.
Summary: India‘s energy transition is largely on a good track
State of the energy transition
22
Financial ecosystem, capacity and financing needsIndia
23
Source: CFLI, BloombergNEF.
Pensio
n
funds
Insurance
companies
Other
inst.investors
Sovereign
wealth funds
Active funds Passive funds
(index tracking)
Commercial
banks
Project
developers
Listed
corporations
Pensio
n
funds
Asset owners
Other
corporations
Asset managers
Banks
Pension
funds
Corporations
Investment
banks
Delegate
assets
Sell shares & bonds
Exchanges &
trading
platforms
Index
providersDevelopment
finance
institutions
Co-lend
Lend &
provide risk-sharing tools
Governments
Build, own & operateSubsidies,
incentives, policies
influence investments
List
shares
Assets in the real economy
Lend Underwrite shares
& bonds
Ownership
Direct ownership,
ownership through shares
& lending through bonds
0
0.02
1
Public sector
Private finance
Private non-finance
Central banks & financial regulators
Credit rating agencies
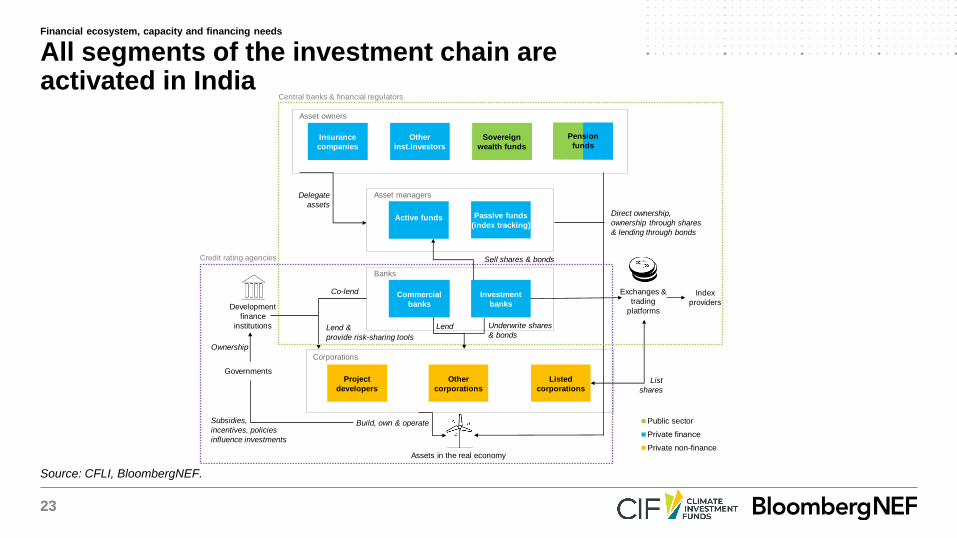
All segments of the investment chain are activated in India
Financial ecosystem, capacity and financing needs
24
Source: BloombergNEF.
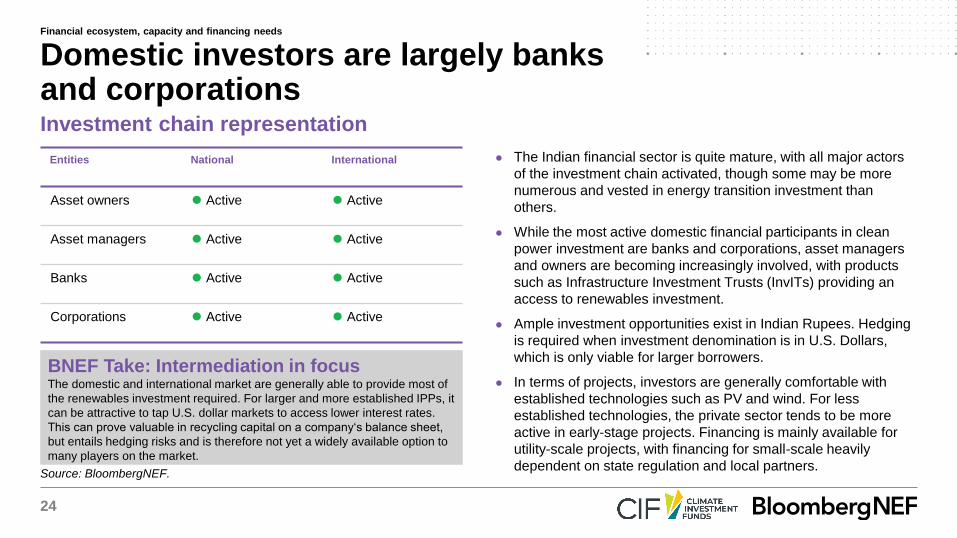
Investment chain representation
Entities National International
Asset owners ⚫ Active ⚫ Active
Asset managers ⚫ Active ⚫ Active
Banks ⚫ Active ⚫ Active
Corporations ⚫ Active ⚫ Active
● The Indian financial sector is quite mature, with all major actors
of the investment chain activated, though some may be more
numerous and vested in energy transition investment than
others.
● While the most active domestic financial participants in clean
power investment are banks and corporations, asset managers
and owners are becoming increasingly involved, with products
such as Infrastructure Investment Trusts (InvITs) providing an
access to renewables investment.
● Ample investment opportunities exist in Indian Rupees. Hedging
is required when investment denomination is in U.S. Dollars,
which is only viable for larger borrowers.
● In terms of projects, investors are generally comfortable with
established technologies such as PV and wind. For less
established technologies, the private sector tends to be more
active in early-stage projects. Financing is mainly available for
utility-scale projects, with financing for small-scale heavily
dependent on state regulation and local partners.
Domestic investors are largely banks and corporations
BNEF Take: Intermediation in focusThe domestic and international market are generally able to provide most of
the renewables investment required. For larger and more established IPPs, it
can be attractive to tap U.S. dollar markets to access lower interest rates.
This can prove valuable in recycling capital on a company‘s balance sheet,
but entails hedging risks and is therefore not yet a widely available option to
many players on the market.
Financial ecosystem, capacity and financing needs
25
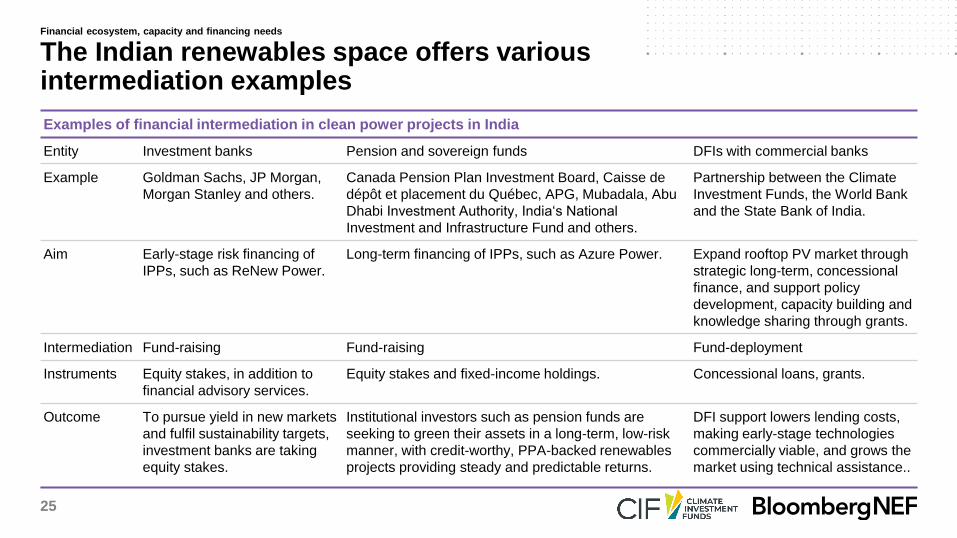
Examples of financial intermediation in clean power projects in India
Entity Investment banks Pension and sovereign funds DFIs with commercial banks
Example Goldman Sachs, JP Morgan,
Morgan Stanley and others.
Canada Pension Plan Investment Board, Caisse de
dépôt et placement du Québec, APG, Mubadala, Abu
Dhabi Investment Authority, India‘s National
Investment and Infrastructure Fund and others.
Partnership between the Climate
Investment Funds, the World Bank
and the State Bank of India.
Aim Early-stage risk financing of
IPPs, such as ReNew Power.
Long-term financing of IPPs, such as Azure Power. Expand rooftop PV market through
strategic long-term, concessional
finance, and support policy
development, capacity building and
knowledge sharing through grants.
Intermediation Fund-raising Fund-raising Fund-deployment
Instruments Equity stakes, in addition to
financial advisory services.
Equity stakes and fixed-income holdings. Concessional loans, grants.
Outcome To pursue yield in new markets
and fulfil sustainability targets,
investment banks are taking
equity stakes.
Institutional investors such as pension funds are
seeking to green their assets in a long-term, low-risk
manner, with credit-worthy, PPA-backed renewables
projects providing steady and predictable returns.
DFI support lowers lending costs,
making early-stage technologies
commercially viable, and grows the
market using technical assistance..
The Indian renewables space offers various intermediation examples
Financial ecosystem, capacity and financing needs
26
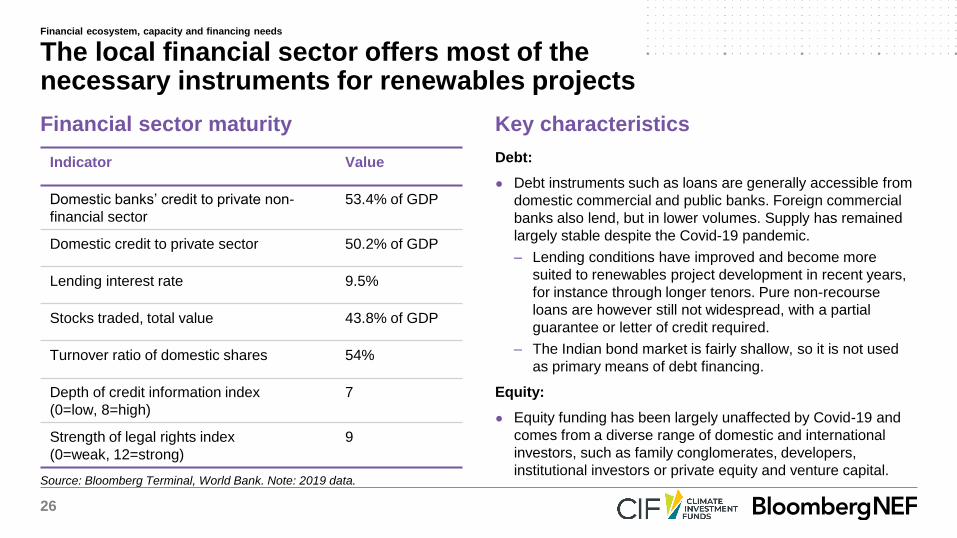
Source: Bloomberg Terminal, World Bank. Note: 2019 data.
Financial sector maturity Key characteristics
Indicator Value
Domestic banks’ credit to private non-
financial sector
53.4% of GDP
Domestic credit to private sector 50.2% of GDP
Lending interest rate 9.5%
Stocks traded, total value 43.8% of GDP
Turnover ratio of domestic shares 54%
Depth of credit information index
(0=low, 8=high)
7
Strength of legal rights index
(0=weak, 12=strong)
9
Debt:
● Debt instruments such as loans are generally accessible from
domestic commercial and public banks. Foreign commercial
banks also lend, but in lower volumes. Supply has remained
largely stable despite the Covid-19 pandemic.
– Lending conditions have improved and become more
suited to renewables project development in recent years,
for instance through longer tenors. Pure non-recourse
loans are however still not widespread, with a partial
guarantee or letter of credit required.
– The Indian bond market is fairly shallow, so it is not used
as primary means of debt financing.
Equity:
● Equity funding has been largely unaffected by Covid-19 and
comes from a diverse range of domestic and international
investors, such as family conglomerates, developers,
institutional investors or private equity and venture capital.
The local financial sector offers most of the necessary instruments for renewables projects
Financial ecosystem, capacity and financing needs
27
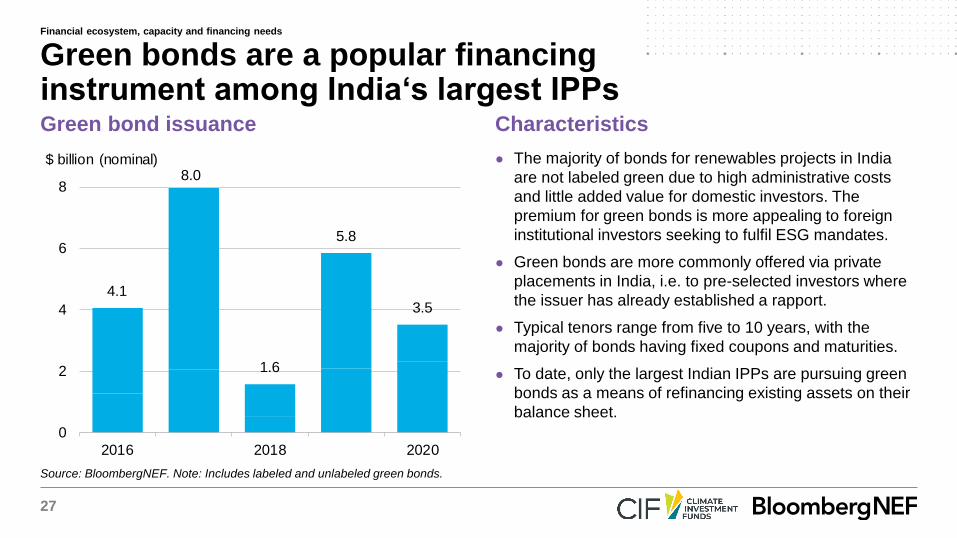
Source: BloombergNEF. Note: Includes labeled and unlabeled green bonds.
Green bond issuance Characteristics
● The majority of bonds for renewables projects in India
are not labeled green due to high administrative costs
and little added value for domestic investors. The
premium for green bonds is more appealing to foreign
institutional investors seeking to fulfil ESG mandates.
● Green bonds are more commonly offered via private
placements in India, i.e. to pre-selected investors where
the issuer has already established a rapport.
● Typical tenors range from five to 10 years, with the
majority of bonds having fixed coupons and maturities.
● To date, only the largest Indian IPPs are pursuing green
bonds as a means of refinancing existing assets on their
balance sheet.
Green bonds are a popular financing instrument among India‘s largest IPPs
4.1
8.0
1.6
5.8
3.5
0
2
4
6
8
2016 2018 2020
$ billion (nominal)
Financial ecosystem, capacity and financing needs
28
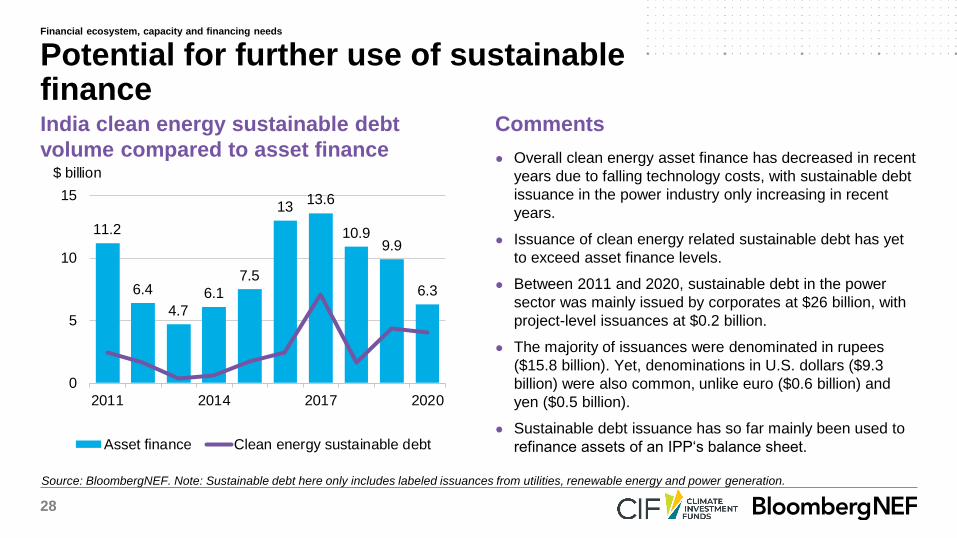
Source: BloombergNEF. Note: Sustainable debt here only includes labeled issuances from utilities, renewable energy and power generation.
India clean energy sustainable debt
volume compared to asset finance
Comments
● Overall clean energy asset finance has decreased in recent
years due to falling technology costs, with sustainable debt
issuance in the power industry only increasing in recent
years.
● Issuance of clean energy related sustainable debt has yet
to exceed asset finance levels.
● Between 2011 and 2020, sustainable debt in the power
sector was mainly issued by corporates at $26 billion, with
project-level issuances at $0.2 billion.
● The majority of issuances were denominated in rupees
($15.8 billion). Yet, denominations in U.S. dollars ($9.3
billion) were also common, unlike euro ($0.6 billion) and
yen ($0.5 billion).
● Sustainable debt issuance has so far mainly been used to
refinance assets of an IPP‘s balance sheet.
Potential for further use of sustainable finance
11.2
6.4
4.7
6.1
7.5
1313.6
10.99.9
6.3
0
5
10
15
2011 2014 2017 2020
$ billion
Asset finance Clean energy sustainable debt
Financial ecosystem, capacity and financing needs
29
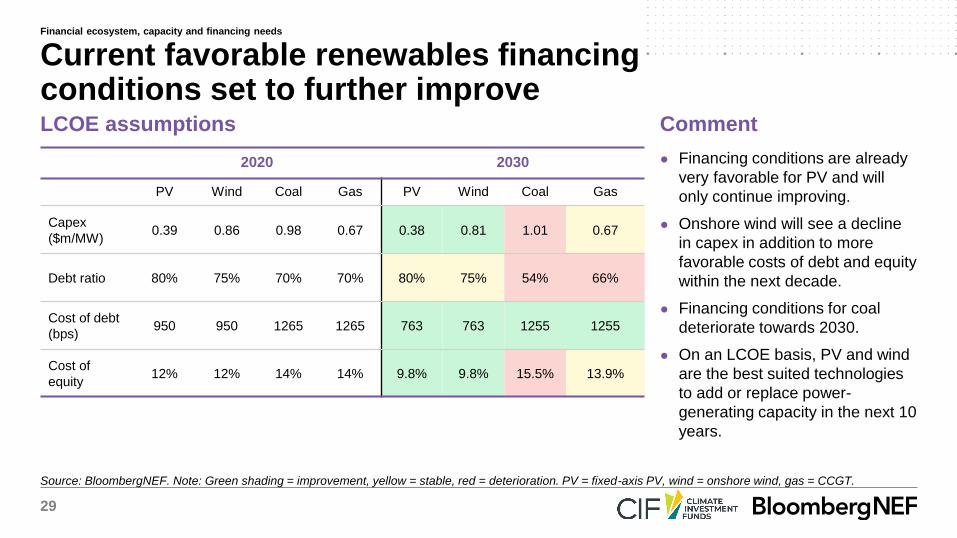
Source: BloombergNEF. Note: Green shading = improvement, yellow = stable, red = deterioration. PV = fixed-axis PV, wind = onshore wind, gas = CCGT.
LCOE assumptions Comment
2020 2030
PV Wind Coal Gas PV Wind Coal Gas
Capex
($m/MW) 0.39 0.86 0.98 0.67 0.38 0.81 1.01 0.67
Debt ratio 80% 75% 70% 70% 80% 75% 54% 66%
Cost of debt
(bps)950 950 1265 1265 763 763 1255 1255
Cost of
equity12% 12% 14% 14% 9.8% 9.8% 15.5% 13.9%
● Financing conditions are already
very favorable for PV and will
only continue improving.
● Onshore wind will see a decline
in capex in addition to more
favorable costs of debt and equity
within the next decade.
● Financing conditions for coal
deteriorate towards 2030.
● On an LCOE basis, PV and wind
are the best suited technologies
to add or replace power-
generating capacity in the next 10
years.
Current favorable renewables financing conditions set to further improve
Financial ecosystem, capacity and financing needs
30
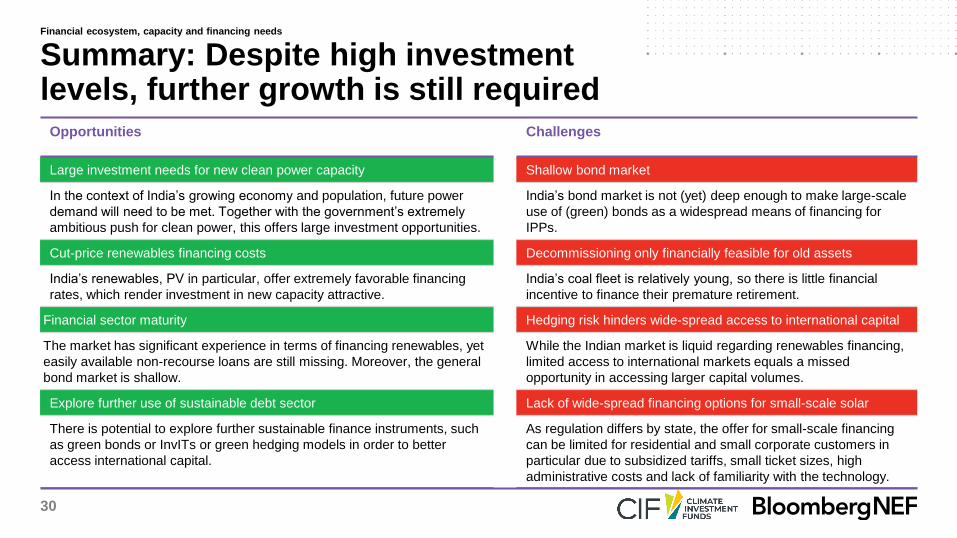
Opportunities Challenges
Large investment needs for new clean power capacity Shallow bond market
In the context of India’s growing economy and population, future power
demand will need to be met. Together with the government’s extremely
ambitious push for clean power, this offers large investment opportunities.
India’s bond market is not (yet) deep enough to make large-scale
use of (green) bonds as a widespread means of financing for
IPPs.
Cut-price renewables financing costs Decommissioning only financially feasible for old assets
India’s renewables, PV in particular, offer extremely favorable financing
rates, which render investment in new capacity attractive.
India’s coal fleet is relatively young, so there is little financial
incentive to finance their premature retirement.
Financial sector maturity Hedging risk hinders wide-spread access to international capital
The market has significant experience in terms of financing renewables, yet
easily available non-recourse loans are still missing. Moreover, the general
bond market is shallow.
While the Indian market is liquid regarding renewables financing,
limited access to international markets equals a missed
opportunity in accessing larger capital volumes.
Explore further use of sustainable debt sector Lack of wide-spread financing options for small-scale solar
There is potential to explore further sustainable finance instruments, such
as green bonds or InvITs or green hedging models in order to better
access international capital.
As regulation differs by state, the offer for small-scale financing
can be limited for residential and small corporate customers in
particular due to subsidized tariffs, small ticket sizes, high
administrative costs and lack of familiarity with the technology.
Summary: Despite high investment levels, further growth is still required
Financial ecosystem, capacity and financing needs
31
Leveraging intermediaries to accelerate clean power investmentIndia
32
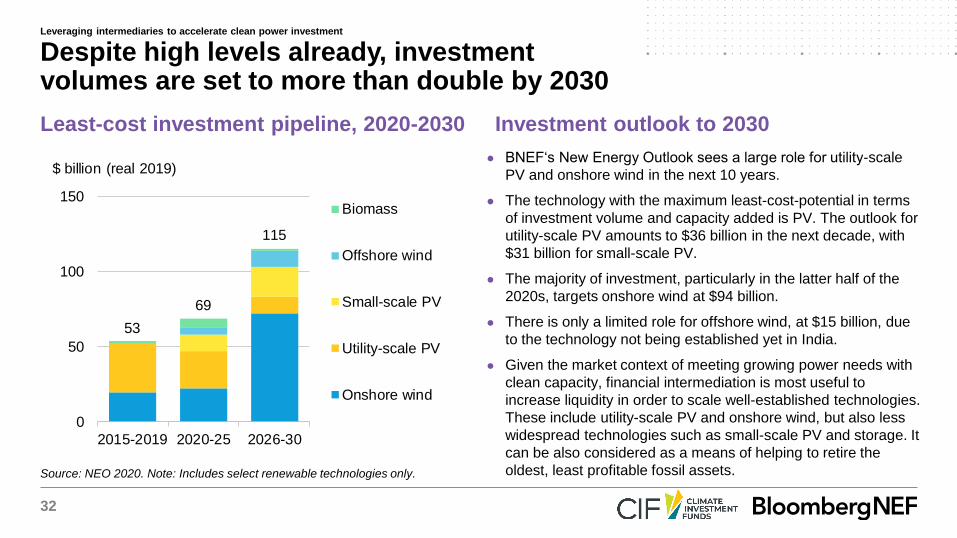
Source: NEO 2020. Note: Includes select renewable technologies only.
Least-cost investment pipeline, 2020-2030 Investment outlook to 2030
● BNEF‘s New Energy Outlook sees a large role for utility-scale
PV and onshore wind in the next 10 years.
● The technology with the maximum least-cost-potential in terms
of investment volume and capacity added is PV. The outlook for
utility-scale PV amounts to $36 billion in the next decade, with
$31 billion for small-scale PV.
● The majority of investment, particularly in the latter half of the
2020s, targets onshore wind at $94 billion.
● There is only a limited role for offshore wind, at $15 billion, due
to the technology not being established yet in India.
● Given the market context of meeting growing power needs with
clean capacity, financial intermediation is most useful to
increase liquidity in order to scale well-established technologies.
These include utility-scale PV and onshore wind, but also less
widespread technologies such as small-scale PV and storage. It
can be also considered as a means of helping to retire the
oldest, least profitable fossil assets.
Despite high levels already, investment volumes are set to more than double by 2030
53
69
115
0
50
100
150
2015-2019 2020-25 2026-30
$ billion (real 2019)
Biomass
Offshore wind
Small-scale PV
Utility-scale PV
Onshore wind
Leveraging intermediaries to accelerate clean power investment
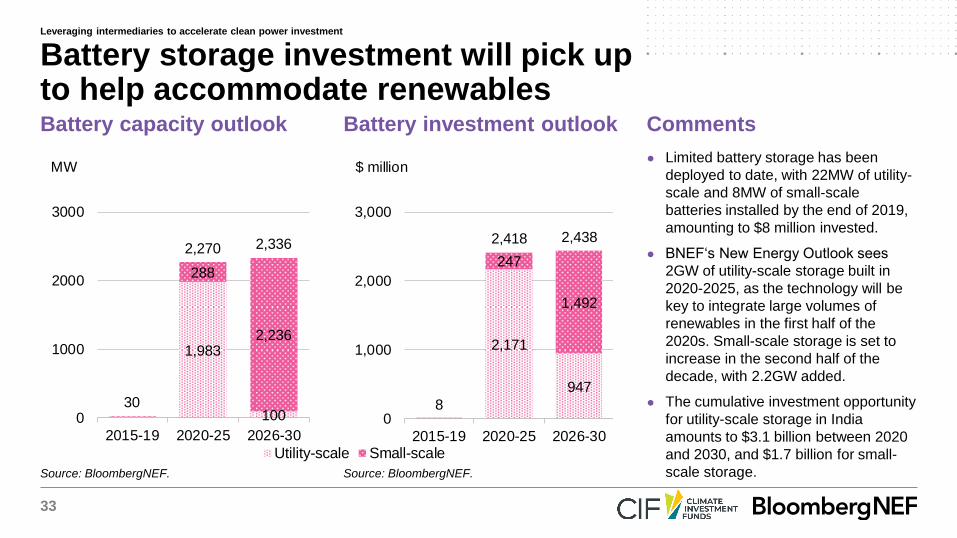
33
● Limited battery storage has been
deployed to date, with 22MW of utility-
scale and 8MW of small-scale
batteries installed by the end of 2019,
amounting to $8 million invested.
● BNEF‘s New Energy Outlook sees
2GW of utility-scale storage built in
2020-2025, as the technology will be
key to integrate large volumes of
renewables in the first half of the
2020s. Small-scale storage is set to
increase in the second half of the
decade, with 2.2GW added.
● The cumulative investment opportunity
for utility-scale storage in India
amounts to $3.1 billion between 2020
and 2030, and $1.7 billion for small-
scale storage.
Battery capacity outlook Battery investment outlook Comments
Battery storage investment will pick up to help accommodate renewables
Source: BloombergNEF. Source: BloombergNEF.
Utility-scale Small-scale
1,983
100
288
2,236
30
2,270 2,336
0
1000
2000
3000
2015-19 2020-25 2026-30
MW
2,171
947
247
1,492
8
2,418 2,438
0
1,000
2,000
3,000
2015-19 2020-25 2026-30
$ million
Leveraging intermediaries to accelerate clean power investment
34
Source: CFLI, BloombergNEF.
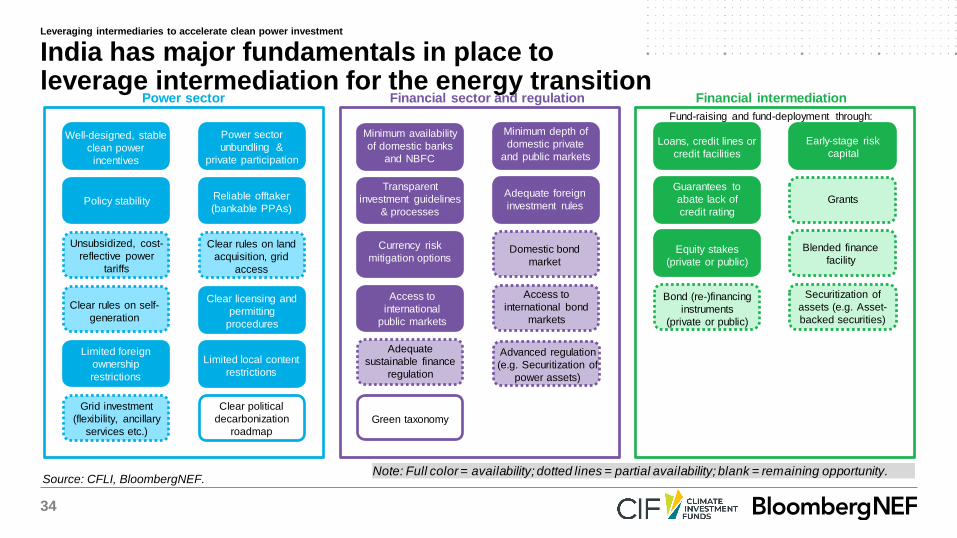
India has major fundamentals in place toleverage intermediation for the energy transition
Leveraging intermediaries to accelerate clean power investment
Power sector
Fund-raising and fund-deployment through:
Financial intermediation
Loans, credit lines or
credit facilities
Early-stage risk
capital
Grants
Guarantees to
abate lack of
credit rating
Bond (re-)financing
instruments
(private or public)
Blended finance
facilityEquity stakes
(private or public)
Securitization of
assets (e.g. Asset-
backed securities)
Note: Full color = availability; dotted lines = partial availability; blank = remaining opportunity.
Well-designed, stable
clean power
incentives
Policy stability
Unsubsidized, cost-
reflective power
tariffs
Clear rules on self-
generation
Grid investment
(flexibility, ancillary
services etc.)
Limited foreign
ownership
restrictions
Power sector
unbundling &
private participation
Reliable offtaker
(bankable PPAs)
Clear licensing and
permitting
procedures
Limited local content
restrictions
Clear rules on land
acquisition, grid
access
Clear political
decarbonization
roadmap
Financial sector and regulation
Transparent
investment guidelines
& processes
Adequate foreign
investment rules
Currency risk
mitigation options
Minimum availability
of domestic banks
and NBFC
Minimum depth of
domestic private
and public markets
Access to
international bond
markets
Access to
international
public markets
Advanced regulation
(e.g. Securitization of
power assets)
Adequate
sustainable finance
regulation
Domestic bond
market
Green taxonomy
35
● The roaring success of the Indian renewables market is testament to having all the necessary market fundamentals in
order to attract investment. In the past decade, India has established itself as the world‘s largest renewables market
following China and has attracted the second-highest volume of renewable energy investment across emerging markets.
● In the power sector, characteristics such as a strong enabling framework, power sector unbundling and policy stability
have been some of the key drivers in clean power investment in the past decade.
– Acceleration opportunity: meeting growing power demand through clean capacity and enhancing the grid to make it
ready for variable resources offer ample investment opportunities going forward. Exploring further capital market
options to finance utility-scale PV and wind assets, in addition to spreading the use of small-scale and self-generation
projects through better-suited financing models offer some of the avenues to unleash new investment.
● In the financial sector, clear investment rules, a diverse set up of banks and non-bank financial companies as well as the
variety of debt and equity instruments have helped provide financing for renewables in the past.
– Acceleration opportunity: making greater and flexible use of (re-)financing instruments such as bonds offers
opportunities to access larger volumes of investment. Tapping international institutional investors is currently limited to
only the largest IPPs in the market, as issuing U.S.-dollar denominated green bonds incurs significant hedging risks in
addition to the cost of certification. Further models such as securitization could also be increasingly explored, for
instance to pool small-scale assets.
India has most necessary prequisites in place to scale the use of intermediation
Leveraging intermediaries to accelerate clean power investment

36
Investment opportunities Enabling environment opportunities
● Especially domestic, but also international financial intermediaries will
play a significant role in providing capital to state-owned utilities, IPPs
and, to some extent, larger industrials. These will likely deploy mature
and proven renewables technologies, in particular solar PV, but
technologies such as storage will also be important to accommodate the
increasing share of intermittent renewables.
● To access fresh liquidity, the role of capital recycling and other forms of
accessing further investors must be considered. Existing debt can be
refinanced on the domestic market via public or private placement
(green) bonds. Due to the limited depth of the Indian bond market,
however, funds such as InvITs can also be considered. If hedging risks
can be addressed sufficiently going forward, this could also open up
channels to international institutional investors.
● DFI funds would be very valuable in helping to bring down the cost of
utility-scale storage. Thinking beyond the period of 2030, it could also be
useful to explore the de-risking of unproven and costly technologies in
the Indian market such as offshore wind and green hydrogen.
● As the domestic and international intermediaries are familiar with
renewables, there is likely no DFI support needed to access traditional
means of capital for most players in the utility-scale clean power market.
That said, DFIs could, however, assist especially smaller to mid-size
utilities and IPPs in their first bond issuance or in structuring an InvIT.
● Given the fairly shallow Indian bond market, DFI support could also be
useful in facilitating private placements or bond-issuing/-purchasing
programs with institutional investors. In terms of accessing international
capital markets, further options could include looking into green hedging
instruments.
● Technical assistance regarding the streamlining of state-level auction
frameworks and discom business models can help clarify regulatory
uncertainty and decrease offtake risk to support the build-out of utility-
scale capacity (see Slide 37).
Action area 1: Meeting growing power needs through clean capacityGiven the country’s growing power demand and in line with its 2030 renewable energy target, India needs to scale up clean utility-scale
capacity going forward. This is also of importance when thinking of renewables capacity needed to supply the electrification of mobility, for
instance, which is becoming a greater focus area for India.
Leveraging intermediaries to accelerate clean power investment
37
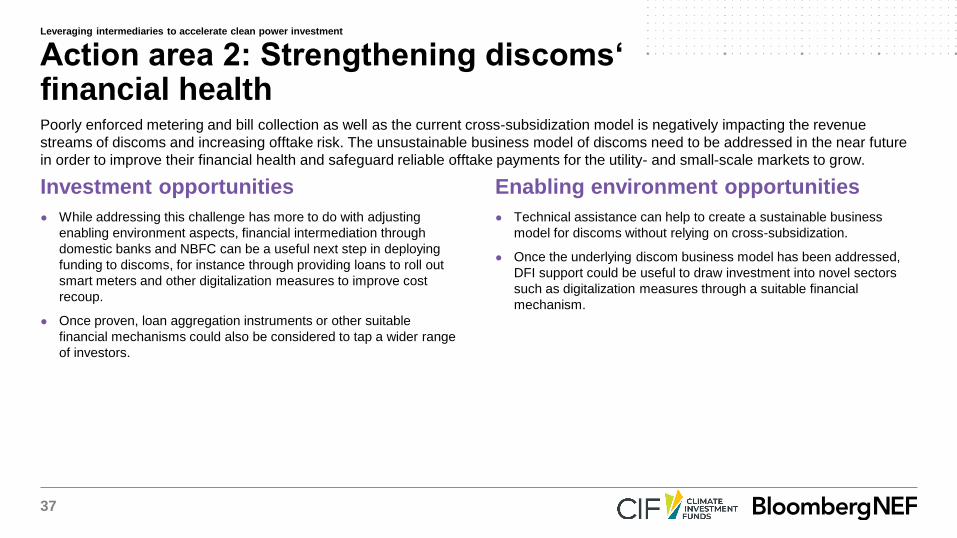
Investment opportunities Enabling environment opportunities
● While addressing this challenge has more to do with adjusting
enabling environment aspects, financial intermediation through
domestic banks and NBFC can be a useful next step in deploying
funding to discoms, for instance through providing loans to roll out
smart meters and other digitalization measures to improve cost
recoup.
● Once proven, loan aggregation instruments or other suitable
financial mechanisms could also be considered to tap a wider range
of investors.
● Technical assistance can help to create a sustainable business
model for discoms without relying on cross-subsidization.
● Once the underlying discom business model has been addressed,
DFI support could be useful to draw investment into novel sectors
such as digitalization measures through a suitable financial
mechanism.
Action area 2: Strengthening discoms‘ financial healthPoorly enforced metering and bill collection as well as the current cross-subsidization model is negatively impacting the revenue
streams of discoms and increasing offtake risk. The unsustainable business model of discoms need to be addressed in the near future
in order to improve their financial health and safeguard reliable offtake payments for the utility- and small-scale markets to grow.
Leveraging intermediaries to accelerate clean power investment
38
Investment opportunities Enabling environment opportunities
● Domestic intermediaries especially will be key to deploying and
raising funds for transmission and distribution investment.
● Investment opportunities for transmission include the financing of
regional intra- and inter-state transmission capacity (‘green
corridors’) and interconnectors, such as through loans or InvITs.
● Investment opportunities for distribution include:
– Supporting discoms in financing flexibility measures of the
distribution network, e.g. through loans.
– Using concessional finance to lower the cost for IPPs or discoms
to install utility-scale storage, e.g. through supporting them in
raising capital for projects.
– “Proving” and scaling up demand-side response measures and
small-scale storage.
● DFIs can help domestic intermediaries to gain familiarity with lending
to more novel forms of network upgrades, such as digitalization,
flexibility and demand-side response measures through blending DFI
funding. In addition, help to aggregate such loans into a package like
InvITs could help to access a wider range of investors.
● Technical assistance can be valuable in designing sound policy
incentives to spur the build-out of storage, such as energy storage
mandates or subsidies. A further idea could be to mandate the
inclusion of storage in federal and state-level auctions. Support for
policy development can also be useful in terms of designing
regulations on flexibility and balancing requirements.
● Capacity building and knowledge sharing can be key in supporting
discoms in the implementation of flexibility and storage measures.
Action area 3: Preparing the grid for a large share of renewablesIn order to accommodate large volumes of renewable capacity as foreseen under the government‘s 450GW by 2030 target, measures
to facilitate grid integration will be necessary. Ample investment opportunities exist to strengthen the grid and make it more flexible.
Leveraging intermediaries to accelerate clean power investment
39
Investment opportunities Enabling environment opportunities
● While larger C&I are already largely able to obtain the necessary
financing, the market for smaller entities like SMEs still needs to mature.
While this mainly involves enabling environment activities, supporting
the development of self-generation projects coupled with storage
through technical assistance and DFI funds could help to “prove” and
grow the market.
● As the subsidized business model of the residential sector hampers
profitability, the sector is currently not of interest to many domestic
intermediaries. If at all, domestic banks or NBFC can deploy loans,
credit lines or leases to install rooftop solar, also in combination with
small-scale storage, yet this entails risks for the lenders. Community-
ownership models could help to diversify risk and abate the challenge of
scale and relative costs, yet would not address the underlying problem
of non-cost reflective tariffs. Once the enabling environment issues are
addressed, this would open opportunities for aggregation of small-scale
projects, such as rooftop ABS, if aspects such as lacking credit ratings
of households are properly accounted for.
● While DFI funding could be blended with loans, credit lines or leases of
domestic banks or NBFC, this does not address the underlying
fundamentals hampering the smaller commercial and residential market.
DFI support should therefore mainly focus on enabling environment
activities, such as supporting an overhaul of the current tariff structure
and discom business model.
● DFI support can also be valuable in terms of policy development: In
order to expand the small-scale market, clear and stable regulations
need to be streamlined in federal and state legislation for net metering
and grid charges.
● Once these market fundamentals are addressed, this would create
greater appetite among domestic intermediaries and allow to consider
further options, such as the securitization of rooftop projects.
Action area 4: Scaling up the self-generation and small-scale marketGrowing the C&I and residential market will support India’s energy transition. The market for smaller commercial and residential customers is
currently underserved due to a lack of sufficient collateral, low ticket size, differing state regulations and high administrative costs for small
systems. There is also little incentive for residential users benefiting from subsidized tariffs to switch to self-generation.
Leveraging intermediaries to accelerate clean power investment
40
Investment opportunities Enabling environment opportunities
● While this will mainly require technical assistance at the outset,
domestic, but also international intermediaries with a focus on ESG can
be valuable players in raising funds to phase out coal. Utilities and IPPs
require suitable financing mechanisms to retire coal assets and, ideally,
provide funding for new renewables projects and impacted communities.
● Investment opportunities include:
– Green or transition bonds at the project or corporate level or bonds
raised off a securitized project portfolio. Given the novelty and
relative shallowness of the Indian bond market, these types of bonds
are most likely to be successful with initial support from DFIs, e.g.
through funding and/or specifically designed bond-issuing/-
purchasing collaborations.
– Using decarbonization loans to monetize the reduction of emissions
and provide funding for new clean capacity.
● Due to socioeconomic and political challenges, DFI support in a just
transition from coal will mainly comprise technical assistance. The coal
transition requires a clear decarbonization commitment from the highest
political level and collaboration between a variety of stakeholders, from
mine operators holding long-term coal offtake contracts with power
plants to discoms and state governments. Technical assistance can
provide valuable support in this process.
● In addition, support for regulatory changes can include revisiting the
structure of thermal PPAs, as the current split into fixed and variable
charges disproportionately benefits coal plant operators, negatively
impacts discoms‘ expenditures and poses curtailment risk to renewables
in times of low power demand and high renewables output.
● DFI support will be crucial to prove the model of coal retirement finance
and support in its design, implementation and financing. This can
involve putting in place a framework to allow for the retirement of assets
which are uneconomic and/or undepreciated, helping to structure a
securitized instrument or bond and stepping in at a first-loss position.
Action area 5: Enabling a just transition away from coalOne of the key challenges to decarbonizing India‘s power sector is to ensure that newly added capacity is clean and that existing coal
assets are retired where possible. In combination with concerns surrounding local pollution, it is likely most feasible to retire the oldest
and most emissions-intensive plants first.
Leveraging intermediaries to accelerate clean power investment
41
Copyright
© Bloomberg Finance L.P. 2021. This publication is the copyright of Bloomberg Finance L.P. in connection with BloombergNEF. No portion of this document may be
photocopied, reproduced, scanned into an electronic system or transmitted, forwarded or distributed in any way without prior consent of BloombergNEF.
Disclaimer
The BloombergNEF ("BNEF"), service/information is derived from selected public sources. Bloomberg Finance L.P. and its affiliates, in providing the
service/information, believe that the information it uses comes from reliable sources, but do not guarantee the accuracy or completeness of this information, which is
subject to change without notice, and nothing in this document shall be construed as such a guarantee. The statements in this service/document reflect the current
judgment of the authors of the relevant articles or features, and do not necessarily reflect the opinion of Bloomberg Finance L.P., Bloomberg L.P. or any of their
affiliates (“Bloomberg”). Bloomberg disclaims any liability arising from use of this document, its contents and/or this service. Nothing herein shall constitute or be
construed as an offering of financial instruments or as investment advice or recommendations by Bloomberg of an investment or other strategy (e.g., whether or not
to “buy”, “sell”, or “hold” an investment). The information available through this service is not based on consideration of a subscriber’s individual circumstances and
should not be considered as information sufficient upon which to base an investment decision. You should determine on your own whether you agree with the
content. This service should not be construed as tax or accounting advice or as a service designed to facilitate any subscriber’s compliance with its tax, accounting or
other legal obligations. Employees involved in this service may hold positions in the companies mentioned in the services/information.
The data included in these materials are for illustrative purposes only. The BLOOMBERG TERMINAL service and Bloomberg data products (the “Services”) are
owned and distributed by Bloomberg Finance L.P. (“BFLP”) except (i) in Argentina, Australia and certain jurisdictions in the Pacific islands, Bermuda, China, India,
Japan, Korea and New Zealand, where Bloomberg L.P. and its subsidiaries (“BLP”) distribute these products, and (ii) in Singapore and the jurisdictions serviced by
Bloomberg’s Singapore office, where a subsidiary of BFLP distributes these products. BLP provides BFLP and its subsidiaries with global marketing and operational
support and service. Certain features, functions, products and services are available only to sophisticated investors and only where permitted. BFLP, BLP and their
affiliates do not guarantee the accuracy of prices or other information in the Services. Nothing in the Services shall constitute or be construed as an offering of
financial instruments by BFLP, BLP or their affiliates, or as investment advice or recommendations by BFLP, BLP or their affi liates of an investment strategy or
whether or not to “buy”, “sell” or “hold” an investment. Information available via the Services should not be considered as information sufficient upon which to base an
investment decision. The following are trademarks and service marks of BFLP, a Delaware limited partnership, or its subsidiaries: BLOOMBERG, BLOOMBERG
ANYWHERE, BLOOMBERG MARKETS, BLOOMBERG NEWS, BLOOMBERG PROFESSIONAL, BLOOMBERG TERMINAL and BLOOMBERG.COM. Absence of
any trademark or service mark from this list does not waive Bloomberg’s intellectual property rights in that name, mark or logo. All rights reserved. © 2021 Bloomberg.
Copyright and disclaimer
Coverage.
Clean energy
Advanced transport
Commodities
Digital industry
BloombergNEF (BNEF) is a leading provider
of primary research on clean energy,
advanced transport, digital industry,
innovative materials, and commodities.
BNEF’s global team leverages the world’s
most sophisticated data sets to create clear
perspectives and in-depth forecasts that
frame the financial, economic and policy
implications of industry-transforming trends
and technologies.
BNEF research and analysis is accessible via
web and mobile platforms, as well as on the
Bloomberg Terminal.
Client enquiries:
Bloomberg Terminal: press <Help> key twice
Email: [email protected]
Learn more:
about.bnef.com | @BloombergNEF