2040 rtp— transit · 6. funding analysis & implementation strategies ... builds on the goals...
TRANSCRIPT

2040 RTP— TRANSIT
2040 Regional Transportation Plan - Transit
City of Colorado Springs Transit Services Division
Final July 2015

July 2015
Contents
Executive Summary ............................................................................................................................. i
1 Introduction ............................................................................................................................. 1
Preface ................................................................................................................................................ 1
Organization of the Plan ..................................................................................................................... 3
Plan Leadership & Guidance ............................................................................................................... 4
Project Partners – Steering Committee .............................................................................................. 5
Guiding Principles of the Plan ............................................................................................................. 6
2 Process ..................................................................................................................................... 8
Context ............................................................................................................................................... 9
3 Area Profile – Transit Audit ..................................................................................................... 11
Introduction ...................................................................................................................................... 11
Mountain Metropolitan Transit Profile ............................................................................................ 11
Community Profile ............................................................................................................................ 11
Travel Patterns .................................................................................................................................. 24
Mountain Metropolitan Transit System ........................................................................................... 28
Funding ............................................................................................................................................. 39
Transit Ridership ............................................................................................................................... 41
User Impressions .............................................................................................................................. 44
Other Service Providers .................................................................................................................... 51
Policy & Plan Review ......................................................................................................................... 54
Peer Cities Review ............................................................................................................................ 57
4 Stakeholder Involvement ........................................................................................................ 66
Purpose ............................................................................................................................................. 66
Stakeholder Involvement Strategy ................................................................................................... 66
Stakeholder Involvement Activities .................................................................................................. 66
Results & Key Involvement Themes ................................................................................................. 69
5 Themes, Initial Options, & Recommendations ......................................................................... 72
July 2015
Introduction ...................................................................................................................................... 72
Themes & Initial Options .................................................................................................................. 74
Recommendations ............................................................................................................................ 80
6 Funding Analysis & Implementation Strategies ........................................................................ 93
Introduction ...................................................................................................................................... 93
Funding Sources ................................................................................................................................ 93
Figures
Figure 1.1: Plan Study Area ................................................................................................................. 3
Figure 2.1: Process ..............................................................................................................................8
Figure 3.1: Study Area and PPACG Area ........................................................................................... 13
Figure 3.2: Population in 2010 .......................................................................................................... 14
Figure 3.3: Population in 2040 .......................................................................................................... 15
Figure 3.4: Low-Income Households in 2010 ................................................................................... 16
Figure 3.5: Low-Income Households in 2040 ................................................................................... 16
Figure 3.6: Household Vehicles Available in 2010 ............................................................................ 17
Figure 3.7: College Students in 2010 ................................................................................................ 19
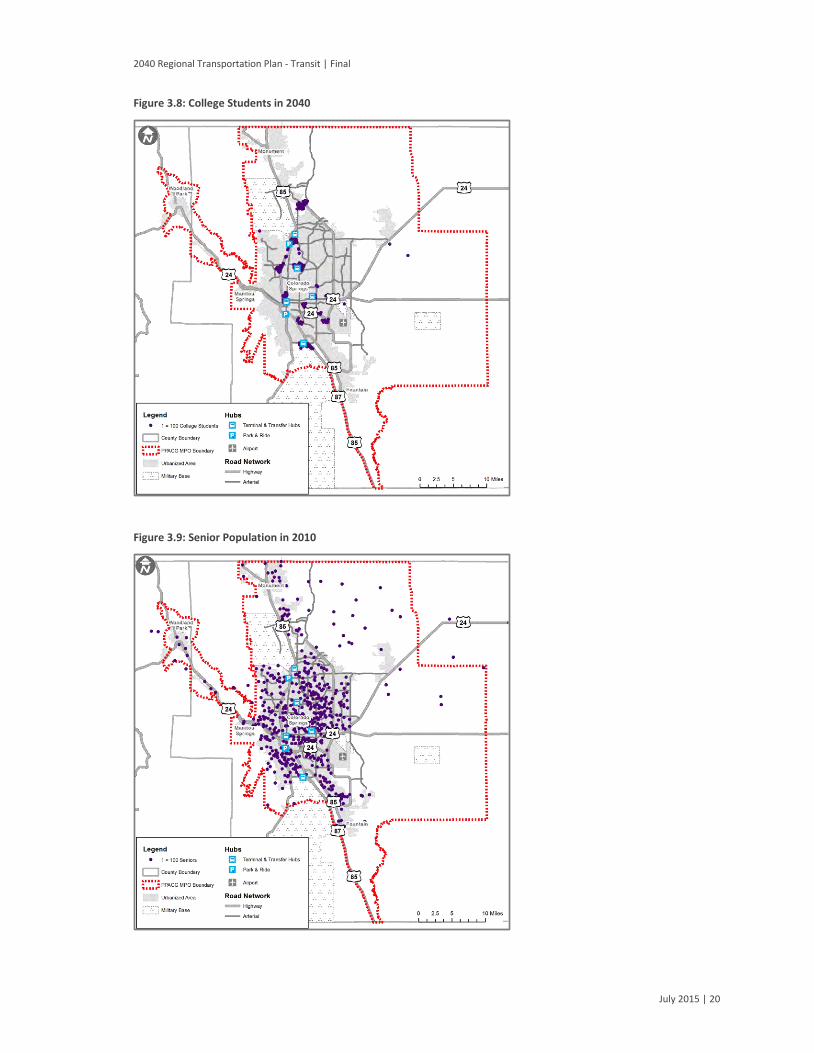
Figure 3.8: College Students in 2040 ................................................................................................ 20
Figure 3.9: Senior Population in 2010 .............................................................................................. 20
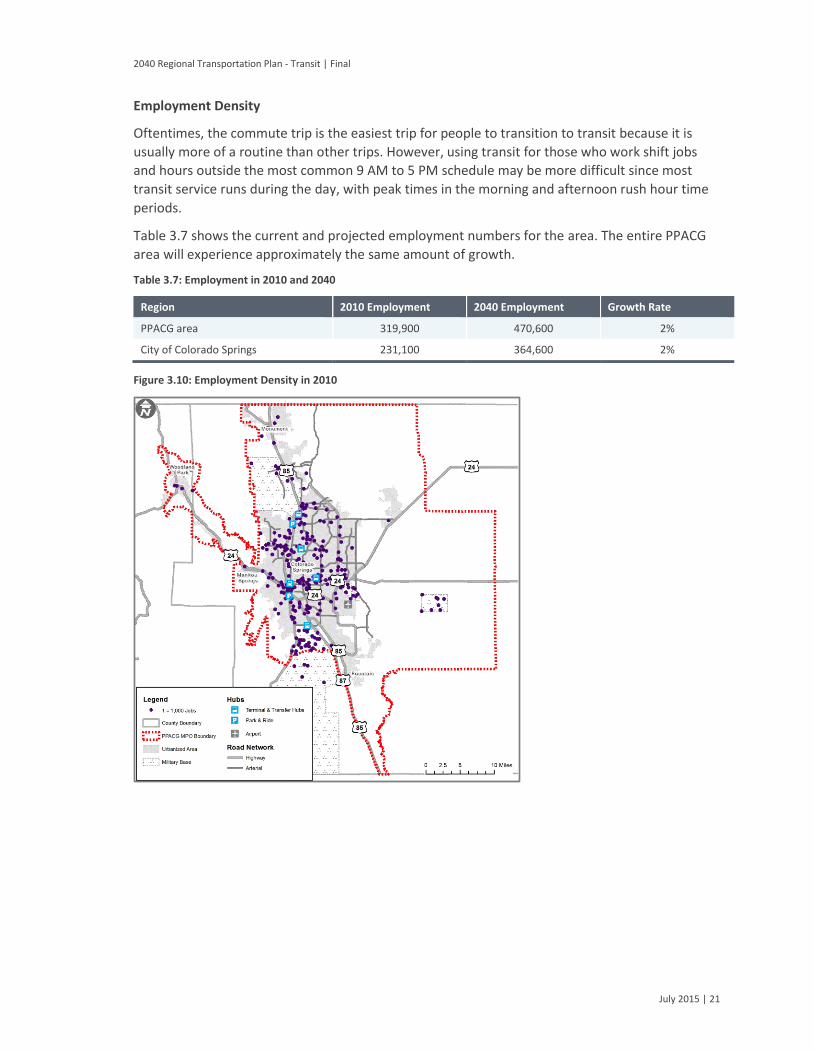
Figure 3.10: Employment Density in 2010 ........................................................................................ 21
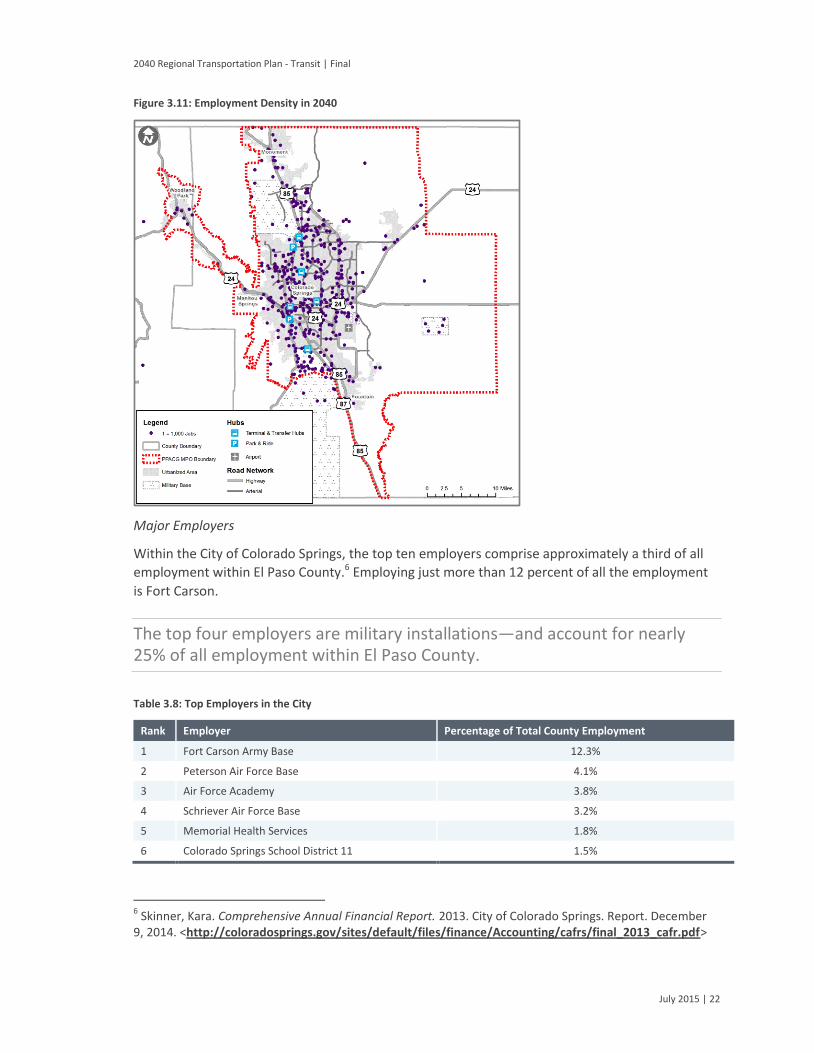
Figure 3.11: Employment Density in 2040 ........................................................................................ 22
Figure 3.12: Heavily Traveled Zones 2010 (All Modes) .................................................................... 25
Figure 3.13: Heavily Traveled Zones 2040 (All Modes) .................................................................... 26
Figure 3.14: Daily Travel Patterns 2010 (All Modes) ........................................................................ 27
Figure 3.15: Potential Daily Travel Patterns 2040 (All Modes) ......................................................... 28
Figure 3.16: 2014 Mountain Metro Service Map ............................................................................. 31
Figure 3.17: Total Daily Runs by Route ............................................................................................. 33
Figure 3.18: Daily Service Hours by Route from December 2013-May 2014 ................................... 33
Figure 3.19: Vehicle Purchase Year................................................................................................... 34

July 2015
Figure 3.20: 2013 Yearly Boardings per Stop .................................................................................... 38
Figure 3.21: 2013 Yearly Alightings per Stop .................................................................................... 39
Figure 3.22: Operating and Capital Expenses ................................................................................... 40
Figure 3.23: Transit Annual Revenues .............................................................................................. 41
Figure 3.24: 2013 Annual Ridership by Time of Day ......................................................................... 42
Figure 3.25: Average Weekday Ridership/Service Hour ................................................................... 42
Figure 3.26: 2013 Annual Ridership by Route .................................................................................. 43
Figure 3.27: 2013 Average Monthly Ridership ................................................................................. 44
Figure 3.28: Age Rider Information .................................................................................................. 46
Figure 3.29: Ethnicity Rider Information .......................................................................................... 47
Figure 3.30: Annual Household Income Rider Information .............................................................. 47
Figure 3.31: Household Vehicles Rider Information ......................................................................... 48
Figure 3.32: Mode to Bus Rider Information .................................................................................... 49
Figure 3.33: Number of Transfers Rider Information ....................................................................... 49
Figure 3.34: Reason for Riding Rider Information ............................................................................ 50
Figure 3.35: Trip Purpose Rider Information .................................................................................... 51
Figure 3.36: Map of Fountain Deviated Service ............................................................................... 52
Figure 3.37: Fountain Monthly Riders .............................................................................................. 53
Figure 3.38: Fountain Monthly Deviations ....................................................................................... 53
Figure 3.39: Operating Expense per Vehicle Revenue Hour ............................................................. 60
Figure 3.40: Operating Expense per Unlinked Passenger Trip ......................................................... 61
Figure 3.41: Unlinked Passenger Trips per Vehicle Revenue Hour .................................................. 62
Figure 3.42: Unlinked Passenger Trips per Vehicle Revenue Mile ................................................... 62
Figure 5.1: Themes and Recommendations - Process ...................................................................... 72
Figure 5.2: Recommended Route Network Structure ...................................................................... 81
Tables
Table 1.1: Project Management Team Members ............................................................................... 5
Table 1.2: Steering Committee ........................................................................................................... 5

July 2015
Table 2.1: Examination and Outreach ................................................................................................ 9
Table 2.2: Criteria Categories ........................................................................................................... 10
Table 3.1: Overview of Community Profile Demographic Information ............................................ 12
Table 3.2: Population Estimates in 2010 and 2040 .......................................................................... 13
Table 3.3: Low-Income Households in 2010 and 2040 ..................................................................... 15
Table 3.4: Zero and One Vehicles per Household in 2010 ................................................................ 17
Table 3.5: College Student Population ............................................................................................. 19
Table 3.6: Senior Population ............................................................................................................. 19
Table 3.7: Employment in 2010 and 2040 ........................................................................................ 21
Table 3.8: Top Employers in the City ................................................................................................ 22
Table 3.9: Top Industries in the City ................................................................................................. 23
Table 3.10: 2014 Service Information ............................................................................................... 32
Table 3.11: Bus Stop Amenity Information....................................................................................... 36
Table 3.12: Bus Stop Amenities ........................................................................................................ 36
Table 3.13: Bus Stop Spacing Standards ........................................................................................... 37
Table 3.14: SWOC Exercise with Steering Committee ...................................................................... 45
Table 3.15: Rider Survey Information ............................................................................................... 45
Table 3.16: Plan and Policy Review .................................................................................................. 55
Table 3.17: Peer Transit .................................................................................................................... 58
Table 3.18: Peer Transit – Cost and Ridership .................................................................................. 59
Table 3.19: Successful Contributors from Peer Cities ...................................................................... 64
Table 4.1: Key Stakeholder Input Themes ........................................................................................ 69
Table 5.1: Example Stakeholder Brainstorming Results ................................................................... 73
Table 5.2: Alternative Service Delivery Options ............................................................................... 80
Table 5.3: Proposed Level of Service by Corridor Type by Service Period ....................................... 82
Table 5.4: Criteria – Improve Service Frequency and Span .............................................................. 82
Table 5.5: Criteria – Maintain and Improve Transit Infrastructure .................................................. 83
Table 5.6: Possible New Services ...................................................................................................... 84
Table 5.7: Criteria – New Service Union Boulevard .......................................................................... 85
Table 5.8: Criteria – New Service North Memorial Hospital ............................................................ 85

July 2015
Table 5.9: Criteria – New Service St. Francis Medical Center ........................................................... 86
Table 5.10: Criteria – New Service Military Installations .................................................................. 89
Table 5.11: Criteria – Develop Expansion Standards and Policies .................................................... 90
Table 5.12: Criteria – Consider High Capacity Transit ...................................................................... 91
Table 5.13: Criteria – Consider New Governance ............................................................................. 92
Table 6.1: Funding Programs ............................................................................................................ 94
Table 6.2: Annual Service Hours and Passengers ............................................................................. 96
Table 6.3: Estimated Funding Revenues (constant 2014 dollars, thousands) .................................. 96
Table 6.4: Estimated Funding Revenues in the Near Term, 2015-2020 (constant 2014 dollars,
thousands) ........................................................................................................................................ 97
Table 6.5: Prioritized Project List Identified within Constrained Plan, Timeframe, and Cost
(constant 2014 dollars, thousands) .................................................................................................. 98
Table 6.6: Estimated Expenditures in Fiscally Constrained Plan in Five-Year Increments (constant
2014 dollars, thousands) ................................................................................................................ 100
Table 6.7: Estimated Expenditures in Fiscally Constrained Plan in the Near Term, 2015-2020
(constant 2014 dollars, thousands) ................................................................................................ 101
Appendices
Appendix A – Funding and Financial Assumptions
2040 Regional Transportation Plan - Transit | Final
July 2015 | i
Executive Summary
In the spring of 2014, the City of Colorado Springs Transit Services Division (Transit) and the Pikes
Peak Area Council of Governments (PPACG) partnered to examine the public transit services
provided throughout the PPACG area and create a Transit Plan and a Specialized Transportation
Coordination Plan as elements to be included in the PPACG 2040 Moving Forward Regional
Transportation Plan (2040 RTP). These plans provide near-, mid-, and long-term visions for
potential public transportation growth and improvements in the PPACG area.
This Transit Plan is based on the levels and structure of public transportation as it existed at the
start of the study and aims to anticipate the needs for public transportation through 2040. This
executive summary presents a high-level overview of the development and key recommendations
of the plan.
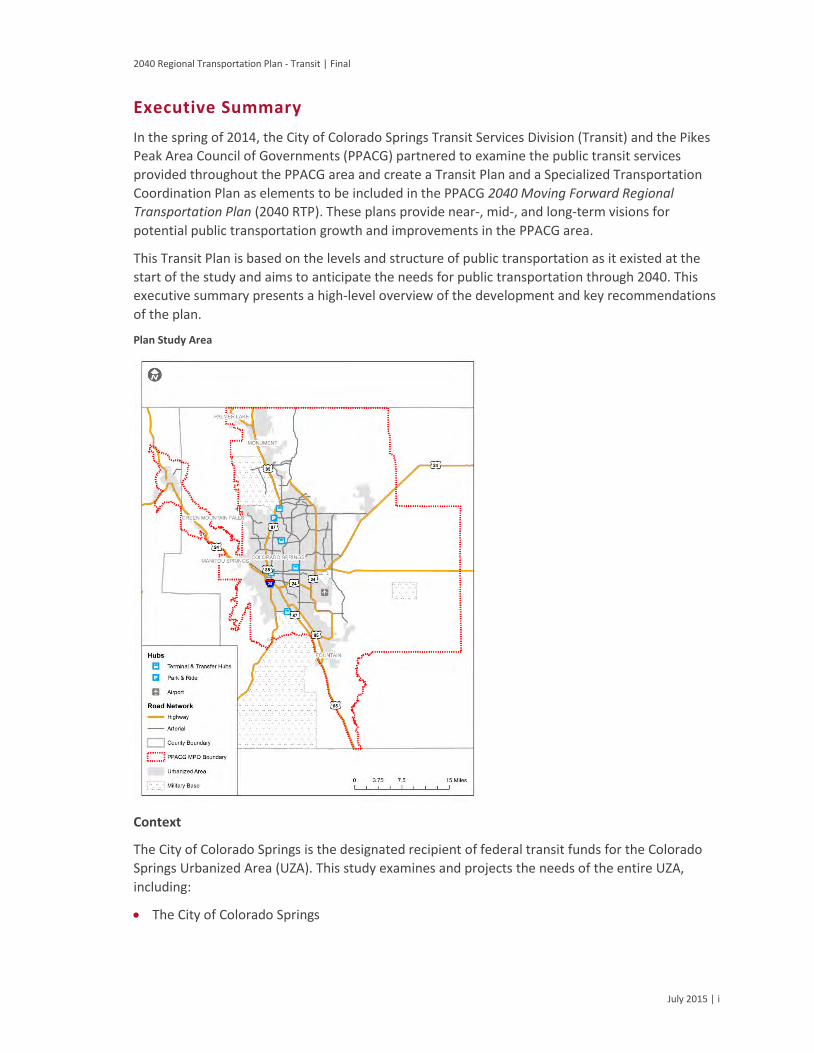
Plan Study Area
Context
The City of Colorado Springs is the designated recipient of federal transit funds for the Colorado
Springs Urbanized Area (UZA). This study examines and projects the needs of the entire UZA,
including:
The City of Colorado Springs
2040 Regional Transportation Plan - Transit | Final
July 2015 | ii
The City of Manitou Springs
Portions of the Security-Widefield
Portions of El Paso County
Portions of Teller County
The Mountain Metro fixed-route service, the Metro Mobility Americans with Disabilities Act (ADA)
required complementary paratransit service, and other coordinated Human Services Providers
(HSP) specialized transportation services are all included in the plan.
Project Guidance
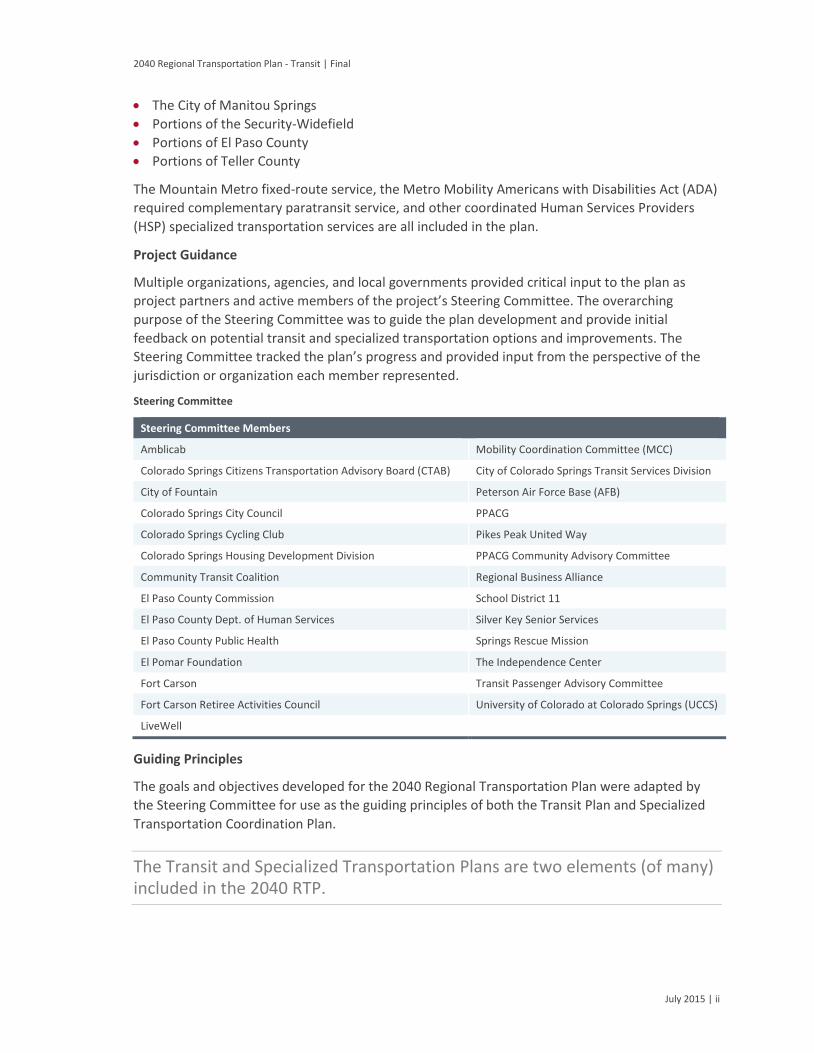
Multiple organizations, agencies, and local governments provided critical input to the plan as
project partners and active members of the project’s Steering Committee. The overarching
purpose of the Steering Committee was to guide the plan development and provide initial
feedback on potential transit and specialized transportation options and improvements. The
Steering Committee tracked the plan’s progress and provided input from the perspective of the
jurisdiction or organization each member represented.
Steering Committee
Steering Committee Members
Amblicab Mobility Coordination Committee (MCC)
Colorado Springs Citizens Transportation Advisory Board (CTAB) City of Colorado Springs Transit Services Division
City of Fountain Peterson Air Force Base (AFB)
Colorado Springs City Council PPACG
Colorado Springs Cycling Club Pikes Peak United Way
Colorado Springs Housing Development Division PPACG Community Advisory Committee
Community Transit Coalition Regional Business Alliance
El Paso County Commission School District 11
El Paso County Dept. of Human Services Silver Key Senior Services
El Paso County Public Health Springs Rescue Mission
El Pomar Foundation The Independence Center
Fort Carson Transit Passenger Advisory Committee
Fort Carson Retiree Activities Council University of Colorado at Colorado Springs (UCCS)
LiveWell
Guiding Principles
The goals and objectives developed for the 2040 Regional Transportation Plan were adapted by
the Steering Committee for use as the guiding principles of both the Transit Plan and Specialized
Transportation Coordination Plan.
The Transit and Specialized Transportation Plans are two elements (of many) included in the 2040 RTP.

2040 Regional Transportation Plan - Transit | Final
July 2015 | iii
The Regional Transportation Plan addresses all modes of transportation, and is updated at regular
intervals to reflect the changing priorities, resources, and needs for the PPACG area.
Goals
Develop a Transit Plan and Specialized Transportation Coordination Plan which:
Serves as the basis for future planning and grant approvals
Presents 5-, 10-, and 20-year scenarios
Creates strong stakeholder input and buy-in
Is aligned with state and federal plans
Builds on the goals and performance measures set forth in the 2040 RTP
Objectives
The Transit Plan objectives include:
Provide transportation choice
Improve access to jobs, schools, medical facilities, and other services, especially for people
without other transportation options
Create efficiencies and improve cost effectiveness of services
Provide congestion relief
Promote environmental stewardship
Promote economic vitality
Promote the coordination of public, private, and non-profit transportation services
Process and Stakeholder Input
The project process started with the existing transit scenario and presented broad transit service
options to residents, the business community, major employers, transit users, potential transit
users, and others for input. Cycles of gathering and analyzing input and refining the options were
used to develop the final recommendations.
Process
The process included two significant levels of examination:
Identification and community review of the ‘guiding themes’
Examination of transit scenarios as potential recommendations
2040 Regional Transportation Plan - Transit | Final
July 2015 | iv
Guiding themes were identified in the initial phases of the plan development and potential transit
improvements were grouped under those themes for further examination. The four guiding
themes used were:
Theme 1: Focus on the existing service area
Theme 2: Improve service hours and frequencies
Theme 3: Improve connectivity, transfers, and hubs
Theme 4: New service and new service models
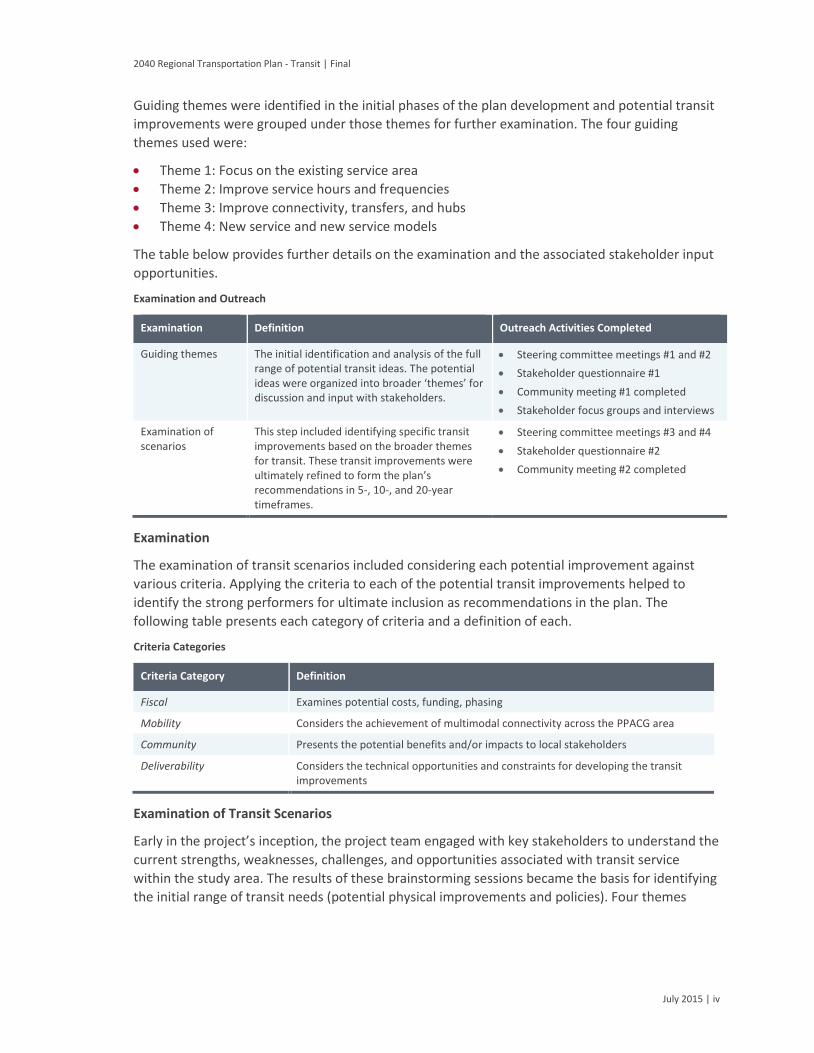
The table below provides further details on the examination and the associated stakeholder input
opportunities.
Examination and Outreach
Examination Definition Outreach Activities Completed
Guiding themes The initial identification and analysis of the full range of potential transit ideas. The potential ideas were organized into broader ‘themes’ for discussion and input with stakeholders.
Steering committee meetings #1 and #2
Stakeholder questionnaire #1
Community meeting #1 completed
Stakeholder focus groups and interviews
Examination of scenarios
This step included identifying specific transit improvements based on the broader themes for transit. These transit improvements were ultimately refined to form the plan’s recommendations in 5-, 10-, and 20-year timeframes.
Steering committee meetings #3 and #4
Stakeholder questionnaire #2
Community meeting #2 completed
Examination
The examination of transit scenarios included considering each potential improvement against
various criteria. Applying the criteria to each of the potential transit improvements helped to
identify the strong performers for ultimate inclusion as recommendations in the plan. The
following table presents each category of criteria and a definition of each.
Criteria Categories
Criteria Category Definition
Fiscal Examines potential costs, funding, phasing
Mobility Considers the achievement of multimodal connectivity across the PPACG area
Community Presents the potential benefits and/or impacts to local stakeholders
Deliverability Considers the technical opportunities and constraints for developing the transit improvements
Examination of Transit Scenarios
Early in the project’s inception, the project team engaged with key stakeholders to understand the
current strengths, weaknesses, challenges, and opportunities associated with transit service
within the study area. The results of these brainstorming sessions became the basis for identifying
the initial range of transit needs (potential physical improvements and policies). Four themes

2040 Regional Transportation Plan - Transit | Final
July 2015 | v
ultimately surfaced and were used to organize the initial set of transit improvements for
examination.
Following the initial review of the transit themes, the themes were further refined to create more-
detailed transit scenarios (packages of complementary improvements). These scenarios were
examined in comparison to the criteria to determine the top performers
The strongest improvements were advanced for future consideration.
The transit scenarios also incorporated stakeholder input through review by the Steering
Committee, online questionnaires, and community meetings. Each of the transit scenarios were
further refined based on this input, forming the ultimate recommendations of the plan.
Recommendations
The recommendations were selected to meet the goals of this plan. The recommendations focus
on expanding the current transit market to offer greater transportation choice for passengers,
while at the same time being effective and efficient with the scarce financial resources available.
The plan proposes incremental increases in frequency, span, and quality of services, which will
provide improved access to jobs, goods, and services to both choice and transit-dependent riders,
relieve traffic congestion, improve environmental conditions, and help to improve the
coordination and delivery of other transportation services offered.
Brief descriptions of the recommendations are included in the following sections.
Focus on the Existing Service Area
Develop Additional Service Planning Standards and Policies
Consider New Services and Models
Consider High-Capacity Transit
Consider New Governance
Focus on the Existing Service Area
It is recommended to focus first on improving services within the existing service area and
encouraging more transit-oriented development at strategic activity centers and corridors. A
coordinated and integrated approach in achieving these two priorities will help build ridership
and, over time, develop a culture of transit use in a cost-effective manner.
Improve Service Frequency and Span - Core and intermediate transit corridors have been
identified as a focus for improvements with the multi-hub network structure. These transit
corridors will be the initial focus of service improvements to incrementally improve the
network operations as a whole. The goal is to achieve an effective mix of 15-, 30-, and 60-
minute frequencies on a range of services.
Maintain and Improve Transit Infrastructure- Enhancing the ridership experience includes
ensuring that bus stops, transfer hubs, and terminals are safe, comfortable, and well-
maintained. Thus it is recommended that resources be allocated to ensure the general
maintenance of transit infrastructure and for improvements where required, including the
2040 Regional Transportation Plan - Transit | Final
July 2015 | vi
possible relocation of the existing Downtown Transit Terminal and improving the Citadel
Transfer Center.
Develop Additional Service Planning Standards and Policies
To equip Transit with the tools to best support the objectives of this plan, it is recommended that
the current service planning standards be expanded. Service standards are performance measures
that help define the role of transit services. The advantage of establishing standards is that they
provide a fair, consistent process for determining what and when service changes should be
made. Service standards also can help define the community’s expectations of the transit system
and can ensure that the transit system continues to meet community objectives.
The key service standard metric would be for any proposed services to demonstrate an acceptable level of ridership and revenue return.
Consider New Services and Models
During the consultation process, stakeholders raised concerns regarding the need for new transit
connections, particularly to suburban hospitals and military-related destinations. Services to new
areas would be required to meet service standards.
New or enhanced services are proposed for consideration along the Union Boulevard corridor, to
Memorial North Hospital, to St. Francis Medical Center, to the Air Force Academy, to Peterson AFB
and Schriever AFB, and to Fort Carson. Services to military installations require unique methods to
create access within secured facilities. These concepts are detailed further in the plan.
Consider High-Capacity Transit
As services and ridership improve and mature over time, there will be opportunities to consider
higher-capacity transit services, including 15-minute (or better) frequencies. There may be
opportunities to operate limited-stop express services to improve travel times for longer-distance
trips within the service area. Bus priority measures could be implemented (e.g. queue jump lanes,
dedicated transit lanes) to improve the speed and reliability of services, particularly along
corridors with higher levels of congestion. Finally, as ridership capacity becomes limited with the
operation of conventional 40’ and 60’ buses, there are further opportunities to explore Bus Rapid
Transit (BRT) and higher-capacity technologies including streetcar and light rail systems.
Consider New Governance
The establishment and success of the Pikes Peak Rural Transportation Authority (PPRTA) has
demonstrated the local desire and potential for regional cooperation, long-term funding, and
prioritization of transportation as a community asset. The 2011 Future of Regional Transit Study
(FoRT) brought together a variety of community, business, financial, and government interests to
debate and ultimately identify recommendations to address transportation needs and
opportunities throughout the Pikes Peak region. This plan is supportive of (and complements) the
recommendations included in the FoRT Study.
2040 Regional Transportation Plan - Transit | Final
July 2015 | vii
Measures should be advanced to assure long-term and stable funding for public transportation in
the PPACG area. This includes the implementation of a new governance structure for transit.
Regional planning, development, funding, and oversight of transit could provide a consistent
mechanism for funding and equitable implementation of transit throughout the PPACG area. This
regional perspective allows planning and the provision of transit to occur in a balanced manner, in
partnership with all of the local governments.
Funding
Federal, state, and regional funding support the operations, maintenance, and expansion of
Transit’s services—including Mountain Metro fixed-route services, Metro Mobility specialized ADA
services, Metro Rides transportation demand management programs, and additional specialized
transportation services provided by area non-profits.
The plan’s funding recommendations present the current funding and revenues available for
transit, as well as funding implications to maintain and improve the transit system over the course
of the plan (to 2040). An expenditure plan has been developed (referred to as the Fiscally
Constrained Plan) that identifies the priority projects that could be implemented within available
funding estimates.
The overall funding estimates were determined in consultation with Transit and PPACG.
Projected funds do not address the full range of transit and transportation needs identified for the PPACG area.
A broader list and discussion of assumptions for transit projects (referred to as the Unconstrained
Plan or Vision Plan) is also included as part of this plan.

2040 Regional Transportation Plan - Transit | Final
July 2015 | 1
1 Introduction Preface
In the spring of 2014, the City of Colorado Springs Transit Services Division (Transit) and the Pikes
Peak Area Council of Governments (PPACG) partnered to examine the public transit services
provided throughout the PPACG area and create a Transit Plan and a Specialized Transportation
Coordination Plan as elements to be included in the PPACG 2040 Moving Forward Regional
Transportation Plan (2040 RTP). These plans provide near-, mid-, and long-term visions for
potential public transportation growth and improvements in the PPACG area.
This document will serve as the Transit Chapter of the 2040 RTP, and will be included in the RTP
appendix.
This chapter presents basic context for the study including purpose and structure of the plan, the
study area, and the ultimate goals and objectives to be achieved. The 2040 Regional
Transportation Plan – Transit (Transit Plan) examined the current provision of public transit. Since
the economic downturn (2007-2010), local and state economies have struggled to regain
consistent levels of output, growth, and revenues. While the state has experienced some
economic recovery, this has generally been focused on the metropolitan areas of Denver, Greeley,
Fort Collins, and Boulder.
The Colorado Springs area has continued an upward trend in economic growth, but at a much slower pace that many other metropolitan areas in the state.
This slow recovery has continued to impact the provision of transit services. Funding for the
current transit services is provided through a variety of sources including:
The Pikes Peak Rural Transportation Authority (PPRTA) taxing district
The City of Colorado Springs
Fares and advertising revenues
Federal and state grants
Transit’s focus throughout the economic changes has been on providing the maximum amount of
service throughout the service area while maintaining its quality and reliability. This balance has
been a significant challenge, but current budget trends have continued to move in a very

2040 Regional Transportation Plan - Transit | Final
July 2015 | 2
measured, but positive direction. The small growth in funding provides the potential to continue
to improve service frequencies and reliability.
This plan aims to maximize the service improvements, planning for time frames in near-term (five years), mid-term (10 years), and long-term (20 years) time frames.
Plan Study Area & Basis
Study Area
The City of Colorado Springs is the designated recipient of federal transit funds for the Colorado
Springs Urbanized Area (UZA). This study examines and projects the needs of the entire UZA and
surrounding urbanizing area in El Paso and Teller Counties. The study area included:
The City of Colorado Springs
The City of Manitou Springs
Portions of Security-Widefield
Portions of El Paso County
Portions of Teller County
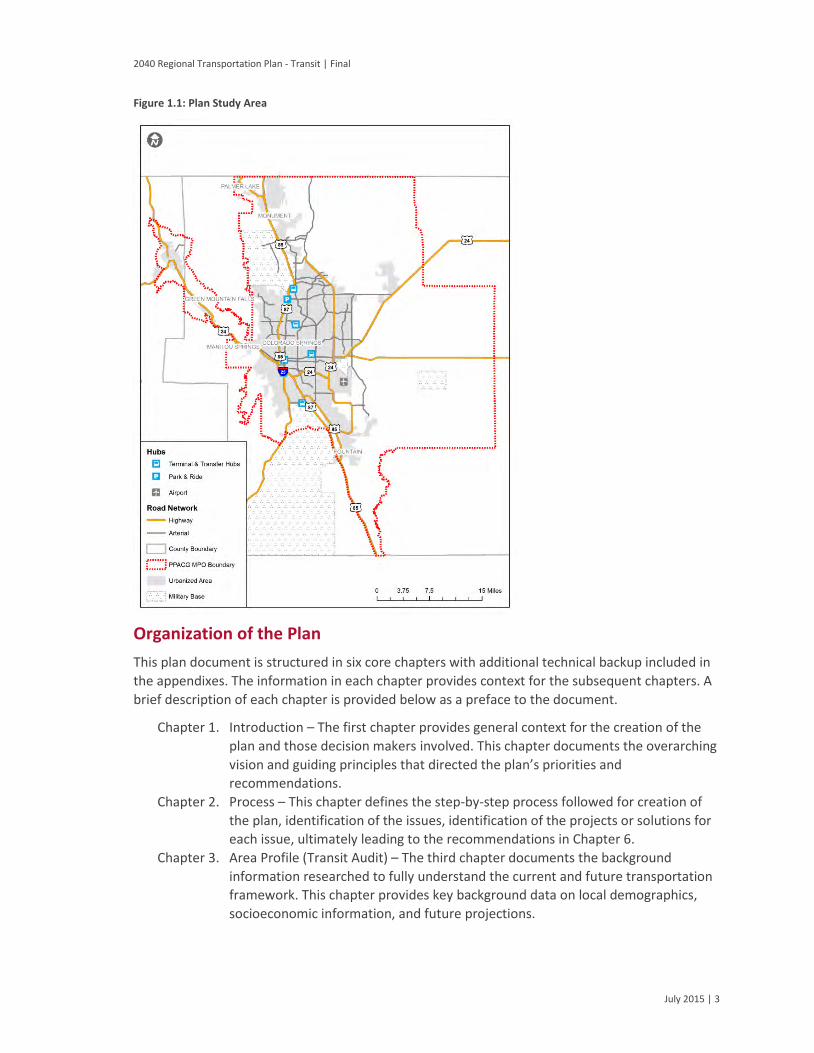
A graphic depiction of this area is included below in Figure 1.1. The plan study area extends
approximately to:
North – to the Chapel Hills Mall
South – just into the Security-Widefield area
East – to Peterson Air Force Base
West – into the City of Manitou Springs
The plan study area encompasses the current Mountain Metro service area, as well as the broader
service areas of Metro Mobility Americans with Disabilities Act (ADA) required transportation and
other coordinated providers of specialized transportation services.
Plan Basis
The substantive background, facts, statistics, and financial data are representative of the readily-
available information from April to December 2014. Ongoing adjustments to the services and
network routing to improve frequency, connectivity, and increase mobility options (many of which
are presented in this plan) are anticipated.
2040 Regional Transportation Plan - Transit | Final
July 2015 | 3
Figure 1.1: Plan Study Area
Organization of the Plan
This plan document is structured in six core chapters with additional technical backup included in
the appendixes. The information in each chapter provides context for the subsequent chapters. A
brief description of each chapter is provided below as a preface to the document.
Chapter 1. Introduction – The first chapter provides general context for the creation of the
plan and those decision makers involved. This chapter documents the overarching
vision and guiding principles that directed the plan’s priorities and
recommendations.
Chapter 2. Process – This chapter defines the step-by-step process followed for creation of
the plan, identification of the issues, identification of the projects or solutions for
each issue, ultimately leading to the recommendations in Chapter 6.
Chapter 3. Area Profile (Transit Audit) – The third chapter documents the background
information researched to fully understand the current and future transportation
framework. This chapter provides key background data on local demographics,
socioeconomic information, and future projections.

2040 Regional Transportation Plan - Transit | Final
July 2015 | 4
Chapter 4. Stakeholder Involvement – This chapter documents the range of stakeholders
engaged in the project from inception to the final plan. Several major outreach
activities, including public meetings, public presentations, and two online
questionnaires were undertaken at key milestones in the project.
Chapter 5. Themes, Initial Options, and Recommendations– This chapter details the
identification of various strengths, weaknesses, challenges, and opportunities
related to transit service with the study area. With this information as a basis, the
team scoped potential transit improvements and created themes to categorize
the options. The themes were further evaluated and ultimately formed the
recommendations of the plan in the near term, midterm, and long term. The
recommendations reflect the best performing transit improvements and the
ultimate priorities for the plan.
Chapter 6. Funding Analysis and Implementation Strategies – The final chapter sets out the
priority actions and potential funding sources for the recommendations. The
recommendations are grouped into either the financially constrained or
unconstrained project lists. The fiscally constrained list of recommendations has
budgeted funding and is recognized as such in the Regional Transportation Plan.
The unconstrained list included critical projects where funding is pending or yet to
be formally identified. Those options in the fiscally constrained plan generally
focus on the near-term potential improvements.
Plan Leadership & Guidance
Development of the transit and specialized transportation elements of the 2040 RTP are being led
by Transit and PPACG staff. Funding for these plan elements includes a combination of funds from
Transit (60%) and PPACG (40%).
Staff members from both Transit and PPACG have been the key leaders managing the plans development, budget, and schedule.
The sections below detail the structure of how the team functioned and communicated.
Additional details on the specific input provided by each group and how this input directed the
development of the plan are included in Chapter 4.
Project Management Team
A project management team (PMT) was created as a body to guide the plan development and
provide overall management throughout the process. The management team members included
representatives from the City, PPACG, and consultant team members. A list of members of the
PMT is shown in Table 1.1.
2040 Regional Transportation Plan - Transit | Final
July 2015 | 5
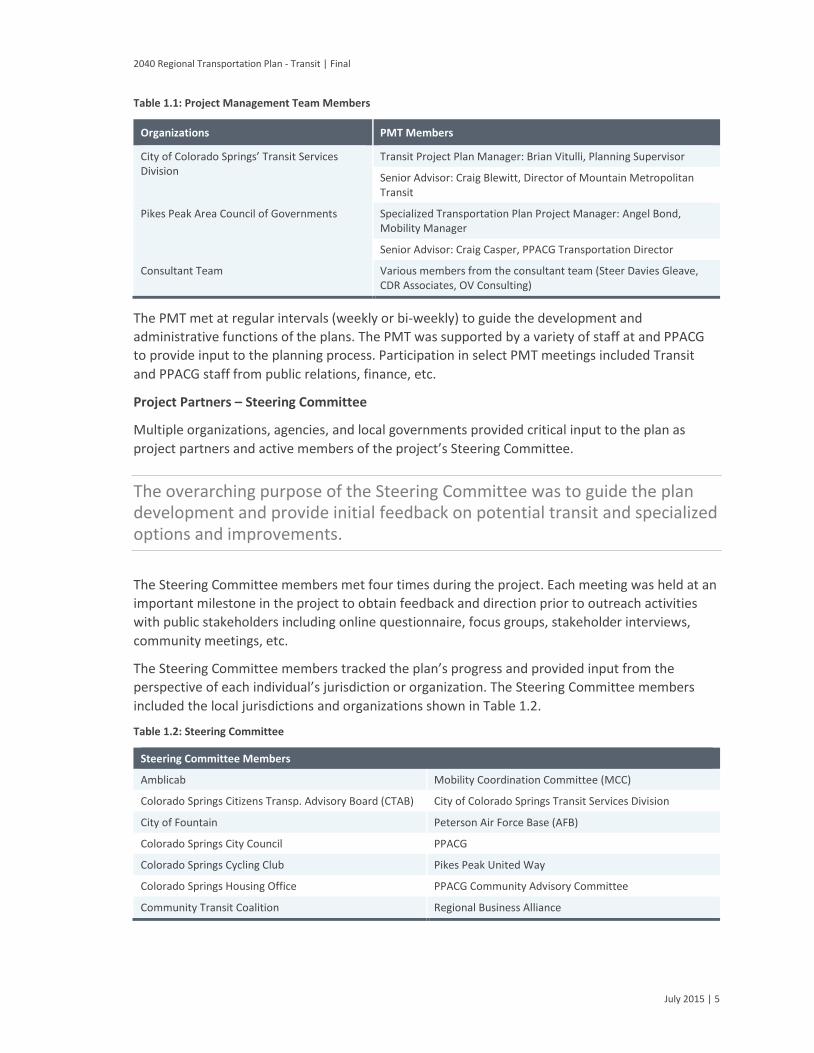
Table 1.1: Project Management Team Members
Organizations PMT Members
City of Colorado Springs’ Transit Services Division
Transit Project Plan Manager: Brian Vitulli, Planning Supervisor
Senior Advisor: Craig Blewitt, Director of Mountain Metropolitan Transit
Pikes Peak Area Council of Governments Specialized Transportation Plan Project Manager: Angel Bond, Mobility Manager
Senior Advisor: Craig Casper, PPACG Transportation Director
Consultant Team Various members from the consultant team (Steer Davies Gleave, CDR Associates, OV Consulting)
The PMT met at regular intervals (weekly or bi-weekly) to guide the development and
administrative functions of the plans. The PMT was supported by a variety of staff at and PPACG
to provide input to the planning process. Participation in select PMT meetings included Transit
and PPACG staff from public relations, finance, etc.
Project Partners – Steering Committee
Multiple organizations, agencies, and local governments provided critical input to the plan as
project partners and active members of the project’s Steering Committee.
The overarching purpose of the Steering Committee was to guide the plan development and provide initial feedback on potential transit and specialized options and improvements.
The Steering Committee members met four times during the project. Each meeting was held at an
important milestone in the project to obtain feedback and direction prior to outreach activities
with public stakeholders including online questionnaire, focus groups, stakeholder interviews,
community meetings, etc.
The Steering Committee members tracked the plan’s progress and provided input from the
perspective of each individual’s jurisdiction or organization. The Steering Committee members
included the local jurisdictions and organizations shown in Table 1.2.
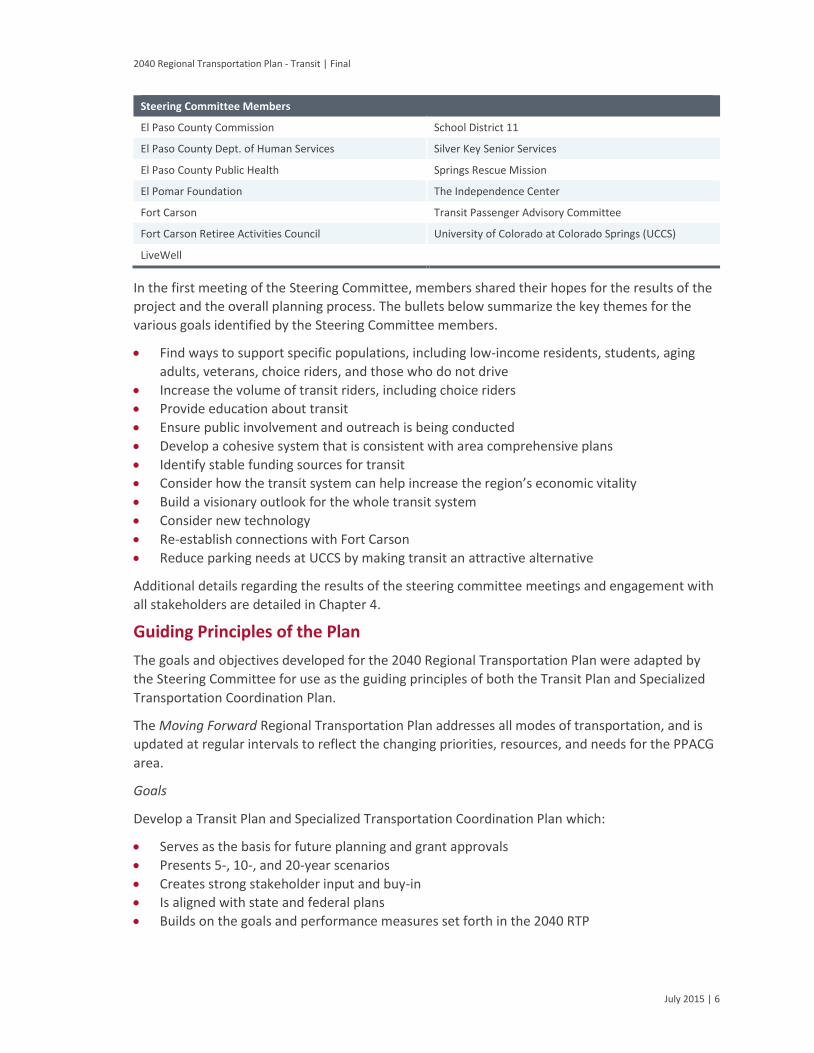
Table 1.2: Steering Committee
Steering Committee Members
Amblicab Mobility Coordination Committee (MCC)
Colorado Springs Citizens Transp. Advisory Board (CTAB) City of Colorado Springs Transit Services Division
City of Fountain Peterson Air Force Base (AFB)
Colorado Springs City Council PPACG
Colorado Springs Cycling Club Pikes Peak United Way
Colorado Springs Housing Office PPACG Community Advisory Committee
Community Transit Coalition Regional Business Alliance
2040 Regional Transportation Plan - Transit | Final
July 2015 | 6
Steering Committee Members
El Paso County Commission School District 11
El Paso County Dept. of Human Services Silver Key Senior Services
El Paso County Public Health Springs Rescue Mission
El Pomar Foundation The Independence Center
Fort Carson Transit Passenger Advisory Committee
Fort Carson Retiree Activities Council University of Colorado at Colorado Springs (UCCS)
LiveWell
In the first meeting of the Steering Committee, members shared their hopes for the results of the
project and the overall planning process. The bullets below summarize the key themes for the
various goals identified by the Steering Committee members.
Find ways to support specific populations, including low-income residents, students, aging
adults, veterans, choice riders, and those who do not drive
Increase the volume of transit riders, including choice riders
Provide education about transit
Ensure public involvement and outreach is being conducted
Develop a cohesive system that is consistent with area comprehensive plans
Identify stable funding sources for transit
Consider how the transit system can help increase the region’s economic vitality
Build a visionary outlook for the whole transit system
Consider new technology
Re-establish connections with Fort Carson
Reduce parking needs at UCCS by making transit an attractive alternative
Additional details regarding the results of the steering committee meetings and engagement with
all stakeholders are detailed in Chapter 4.
Guiding Principles of the Plan
The goals and objectives developed for the 2040 Regional Transportation Plan were adapted by
the Steering Committee for use as the guiding principles of both the Transit Plan and Specialized
Transportation Coordination Plan.
The Moving Forward Regional Transportation Plan addresses all modes of transportation, and is
updated at regular intervals to reflect the changing priorities, resources, and needs for the PPACG
area.
Goals
Develop a Transit Plan and Specialized Transportation Coordination Plan which:
Serves as the basis for future planning and grant approvals
Presents 5-, 10-, and 20-year scenarios
Creates strong stakeholder input and buy-in
Is aligned with state and federal plans
Builds on the goals and performance measures set forth in the 2040 RTP
2040 Regional Transportation Plan - Transit | Final
July 2015 | 7
Objectives
The plan objectives include:
Provide transportation choice
Improve access to jobs, schools, medical facilities, and other services, especially for people
without other transportation options
Create efficiencies and improve cost effectiveness of services
Provide congestion relief
Promote environmental stewardship
Promote economic vitality
Promote the coordination of public, private, and non-profit transportation services
The goals and objectives were referenced throughout the development of the plans to ensure consistency with the broader 2040 RTP and to ensure focus on the critical principles for each plan element.

2040 Regional Transportation Plan - Transit | Final
July 2015 | 8
2 Process Context
This chapter is intended to provide a clear understanding of the process for identification and
examination of the transit and specialized-transportation recommendations presented in the two
plans. While this chapter focuses on the process, the examination of potential transit
improvements and the recommended outcomes are presented in detail in Chapter 5.
Work began in summer 2014 with the initial Steering Committee meeting. The Committee
reviewed and confirmed the process for identifying and ultimately determining the
recommendations for both the Transit Plan and Specialized Transportation Coordination Plan.
The first Steering Committee and community meetings were used to explain the process, obtain input, and confirm direction before advancing.
The project process started with the existing transit scenario and presented broad transit service
options to residents, the business community, major employers, transit users, potential transit
users, and others for input. Cycles of gathering and analyzing input and refining the options were
used to develop the final recommendations.
Figure 2.1 graphically details the general steps in the process.
Figure 2.1: Process
2040 Regional Transportation Plan - Transit | Final
July 2015 | 9
The two major levels of examination included identification and community review of the guiding
themes and then analyzing transit scenarios as potential recommendations.
Four key themes were identified in the initial phases of the plan development for consideration by project stakeholders.
These two key levels represent the points where potential transit improvements were advanced in
the process. The initial themes identified included:
Theme 1: Focus on the existing service area
Theme 2: Improve service hours and frequencies
Theme 3: Improve connectivity, transfers, and hubs
Theme 4: New service and new service models
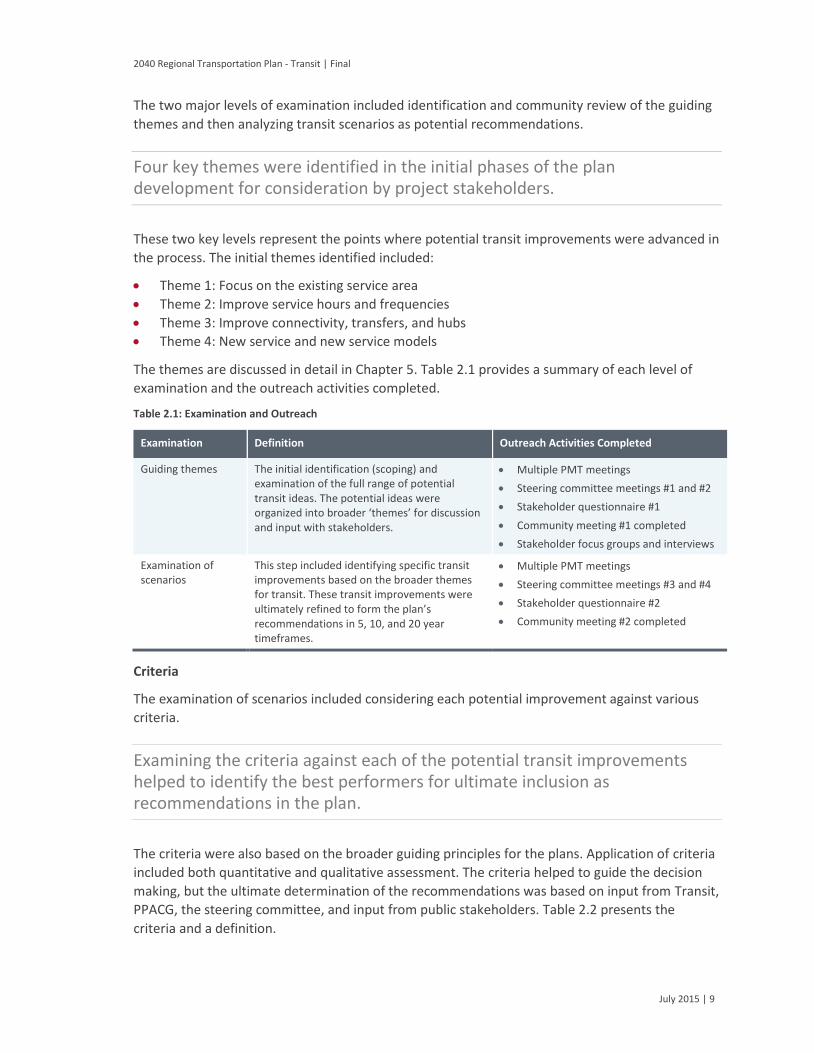
The themes are discussed in detail in Chapter 5. Table 2.1 provides a summary of each level of
examination and the outreach activities completed.
Table 2.1: Examination and Outreach
Examination Definition Outreach Activities Completed
Guiding themes The initial identification (scoping) and examination of the full range of potential transit ideas. The potential ideas were organized into broader ‘themes’ for discussion and input with stakeholders.
Multiple PMT meetings
Steering committee meetings #1 and #2
Stakeholder questionnaire #1
Community meeting #1 completed
Stakeholder focus groups and interviews
Examination of scenarios
This step included identifying specific transit improvements based on the broader themes for transit. These transit improvements were ultimately refined to form the plan’s recommendations in 5, 10, and 20 year timeframes.
Multiple PMT meetings
Steering committee meetings #3 and #4
Stakeholder questionnaire #2
Community meeting #2 completed
Criteria
The examination of scenarios included considering each potential improvement against various
criteria.
Examining the criteria against each of the potential transit improvements helped to identify the best performers for ultimate inclusion as recommendations in the plan.
The criteria were also based on the broader guiding principles for the plans. Application of criteria
included both quantitative and qualitative assessment. The criteria helped to guide the decision
making, but the ultimate determination of the recommendations was based on input from Transit,
PPACG, the steering committee, and input from public stakeholders. Table 2.2 presents the
criteria and a definition.

2040 Regional Transportation Plan - Transit | Final
July 2015 | 10
Table 2.2: Criteria Categories
Categories Definition
Fiscal Examines potential costs, funding, phasing
Mobility Considers the achievement of multimodal connectivity across the PPACG area
Community Presents the potential benefits and/or impacts to local stakeholders
Deliverability Considers the technical opportunities and constraints for developing the transit improvements

2040 Regional Transportation Plan - Transit | Final
July 2015 | 11
3 Area Profile – Transit Audit Introduction
The transit audit chapter provides the base information and existing conditions for Transit and
PPACG as they relate to the fixed-route transit system in the PPACG area.
The transit audit outlines the existing transit system, its performance, and presents a profile of the region’s population, demographics, and mobility.
This section begins with a description of Transit, describing demographic details relevant to fixed
transit service, data related to the existing system, connectivity components to encourage access
to bus stops, funding information, policy and plan review, and concludes with the peer cities
review. The peer cities review provides a brief comparison of similar fixed-route transit systems in
communities across the country.
Mountain Metropolitan Transit Profile
Transit is the City of Colorado Springs Transit Services Division. Transit staff administers contracted
services to provide a number of public transportation services in the Colorado Springs
metropolitan area, including Mountain Metro fixed-route bus service, Metro Mobility ADA-
required paratransit service, and other specialized transportation services provided by area non-
profit agencies. Transit also provides alternative transportation options through Metro Rides
programs.
Community Profile
In addition to people who do not have access to a household vehicle, transit-dependent
population groups may include low-income citizens, students, non-drivers, people with disabilities,
and seniors.1 It is widely accepted within the transit literature that a higher population or
residential density yields greater transit use.2
1 Litman, Todd. Transit Price Elasticities and Cross-Elasticities. 2004. Journal of Public Transportation. 7.2:
37-58. Web. December 19 2014. <http://www.nctr.usf.edu/jpt/pdf/JPT%207-2%20Litman.pdf>2Transit and Urban Form. 1996. TCRP Report. 16.1: 26-37. Journal. December 23, 2014.
<http://onlinepubs.trb.org/onlinepubs/tcrp/tcrp_rpt_16-1.pdf>
2040 Regional Transportation Plan - Transit | Final
July 2015 | 12
Additional factors influence transportation decision making in places with higher density, including
employment centers, corridor characteristics, transit service and other policies.2 For this transit
audit, the project team presented multiple data points to provide a clear profile of the
demographics and land use for the PPACG area. This information helped to identify both the areas
of transit-supportive land use and infrastructure; as well as gaps in the PPACG area where
improved infrastructure and adjusting land uses could provide better mobility options for
residents.
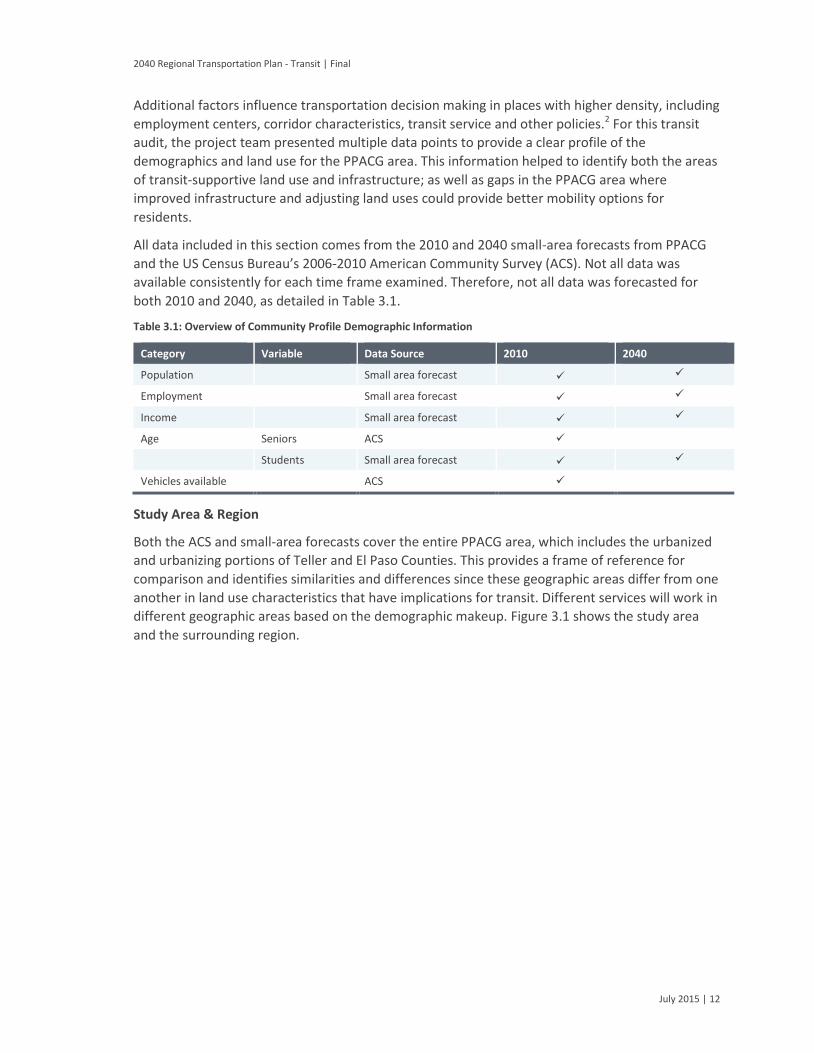
All data included in this section comes from the 2010 and 2040 small-area forecasts from PPACG
and the US Census Bureau’s 2006-2010 American Community Survey (ACS). Not all data was
available consistently for each time frame examined. Therefore, not all data was forecasted for
both 2010 and 2040, as detailed in Table 3.1.
Table 3.1: Overview of Community Profile Demographic Information
Category Variable Data Source 2010 2040
Population Small area forecast
Employment Small area forecast
Income Small area forecast
Age Seniors ACS
Students Small area forecast
Vehicles available ACS
Study Area & Region
Both the ACS and small-area forecasts cover the entire PPACG area, which includes the urbanized
and urbanizing portions of Teller and El Paso Counties. This provides a frame of reference for
comparison and identifies similarities and differences since these geographic areas differ from one
another in land use characteristics that have implications for transit. Different services will work in
different geographic areas based on the demographic makeup. Figure 3.1 shows the study area
and the surrounding region.

2040 Regional Transportation Plan - Transit | Final
July 2015 | 13
Figure 3.1: Study Area and PPACG Area
Population Density
The population within the urbanized area is anticipated to grow by approximately 100,000 people
to just more than half a million people by 2040. The PPACG area is planned to grow a little over
one percent from slightly more than half a million people to approximately 853,500 people by
2040. The statewide growth rate for Colorado is anticipated to be approximately 1.7 percent
between 2010 and 2040.3 Table 3.2: breaks down the 2010 and 2040 populations, presenting the
figures for the entire PPACG area, all urbanized areas, and the Colorado Springs urbanized area.
Table 3.2: Population Estimates in 2010 and 2040
Area 2010 Population 2040 Population Growth Rate4
PPACG area 603,600 853,500 1%
Urbanized areas 531,100 667,000 1%
3Population Totals for Colorado and Sub-state Regions. Colorado Department of Local Affairs, 2014. Web.
December 10, 2014. <http://www.colorado.gov/demography> 4 Rounded to the closest round percent.
2040 Regional Transportation Plan - Transit | Final
July 2015 | 14
Area 2010 Population 2040 Population Growth Rate4
City of Colorado Springs 409,500 558,200 1%
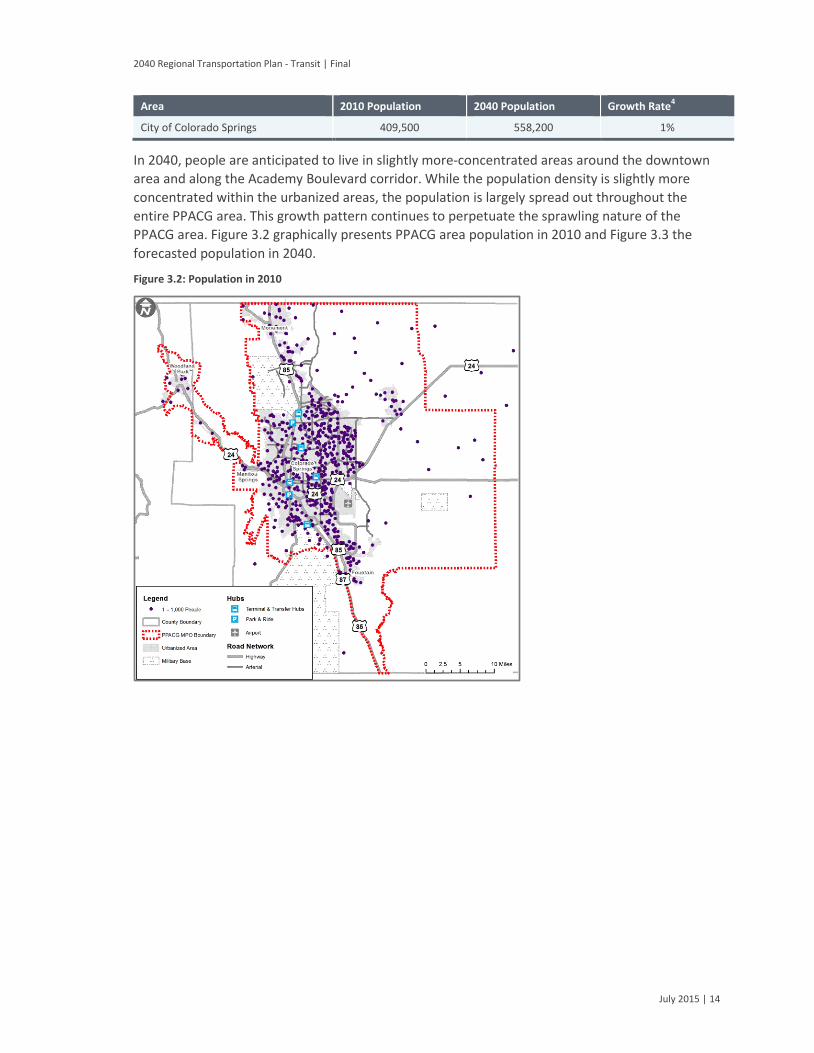
In 2040, people are anticipated to live in slightly more-concentrated areas around the downtown
area and along the Academy Boulevard corridor. While the population density is slightly more
concentrated within the urbanized areas, the population is largely spread out throughout the
entire PPACG area. This growth pattern continues to perpetuate the sprawling nature of the
PPACG area. Figure 3.2 graphically presents PPACG area population in 2010 and Figure 3.3 the
forecasted population in 2040.
Figure 3.2: Population in 2010

2040 Regional Transportation Plan - Transit | Final
July 2015 | 15
Figure 3.3: Population in 2040
Household Income
Household income is one of the greatest factors influencing transit ridership. Although not the
case for all transit agencies, many transit riders tend to have lower household incomes than the
greater population. Based on the available data, it appears low-income households would increase
by one percent across the PPACG area. The absolute numbers grow in line with the overall
population growth.
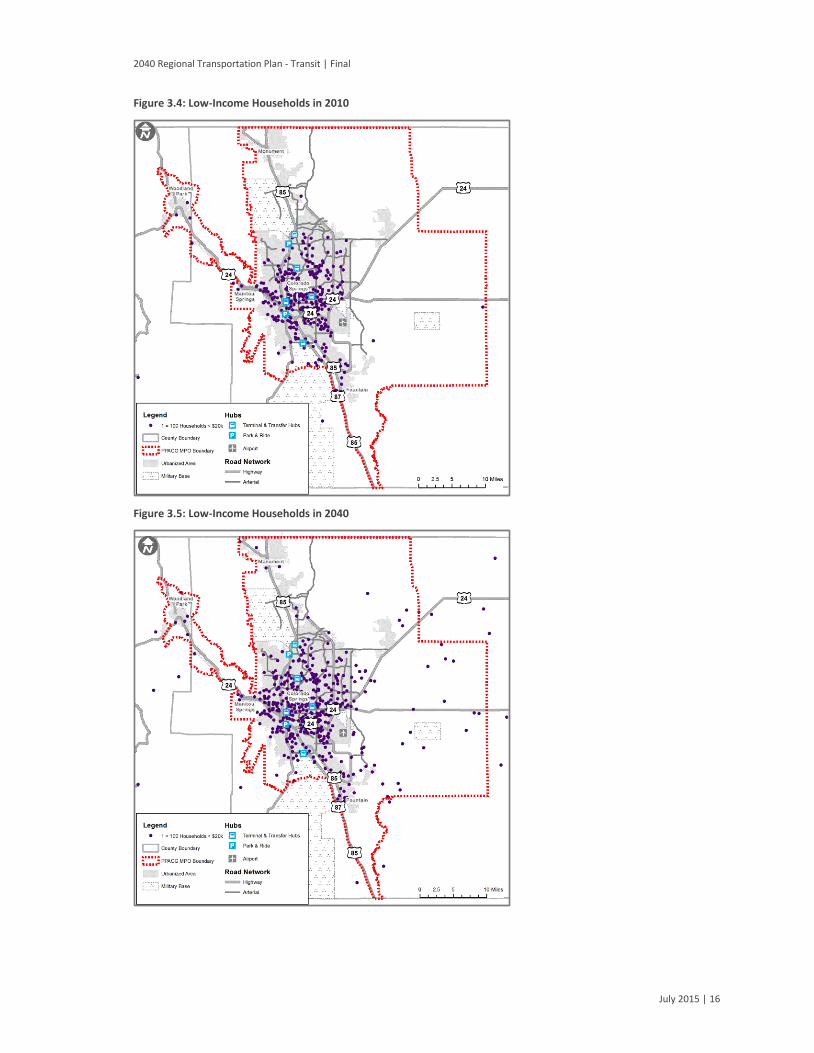
The majority of low-income households fall within the urbanized areas of the PPACG area.
Table 3.3, Figure 3.4 and Figure 3.5 shows the different concentrations of low-income households
in 2010 and 2040.
Table 3.3: Low-Income Households in 2010 and 2040
Area 2010 Households 2040 Households Growth Rate
PPACG area 34,800 47,800 1%
Urbanized area 32,400 42,200 1%
2040 Regional Transportation Plan - Transit | Final
July 2015 | 16
Figure 3.4: Low-Income Households in 2010
Figure 3.5: Low-Income Households in 2040

2040 Regional Transportation Plan - Transit | Final
July 2015 | 17
Household Vehicles Available
Those without access to a household vehicle tend to rely on transit more than the general
population for daily transportation needs. Approximately five percent of households in the PPACG
area are without a vehicle. It is likely those without a personal vehicle have access to a vehicle (or
rides from family or friends), but this still provides more limited access than a personal vehicle can
provide.
There is a slightly higher percentage of zero-vehicle households within the urbanized areas.
As Table 3.4 shows, approximately five percent of those within the PPACG area do not own a
vehicle; about 20 percent are one-vehicle households. Figure 3.6 shows the geographic
distribution across the area.
Table 3.4: Zero and One Vehicles per Household in 2010
Area Zero % of Households One % of Households
PPACG area 12,200 5% 69,300 19%
Urbanized area 11,900 6% 65,100 24%
Figure 3.6: Household Vehicles Available in 2010

2040 Regional Transportation Plan - Transit | Final
July 2015 | 18
Age
A majority of transit riders nation-wide are within the ages of 25 and 54.5The City of Colorado
Springs is also home to many college students who are more likely to be transit riders; college
students comprise approximately 11.5 percent of all transit riders.
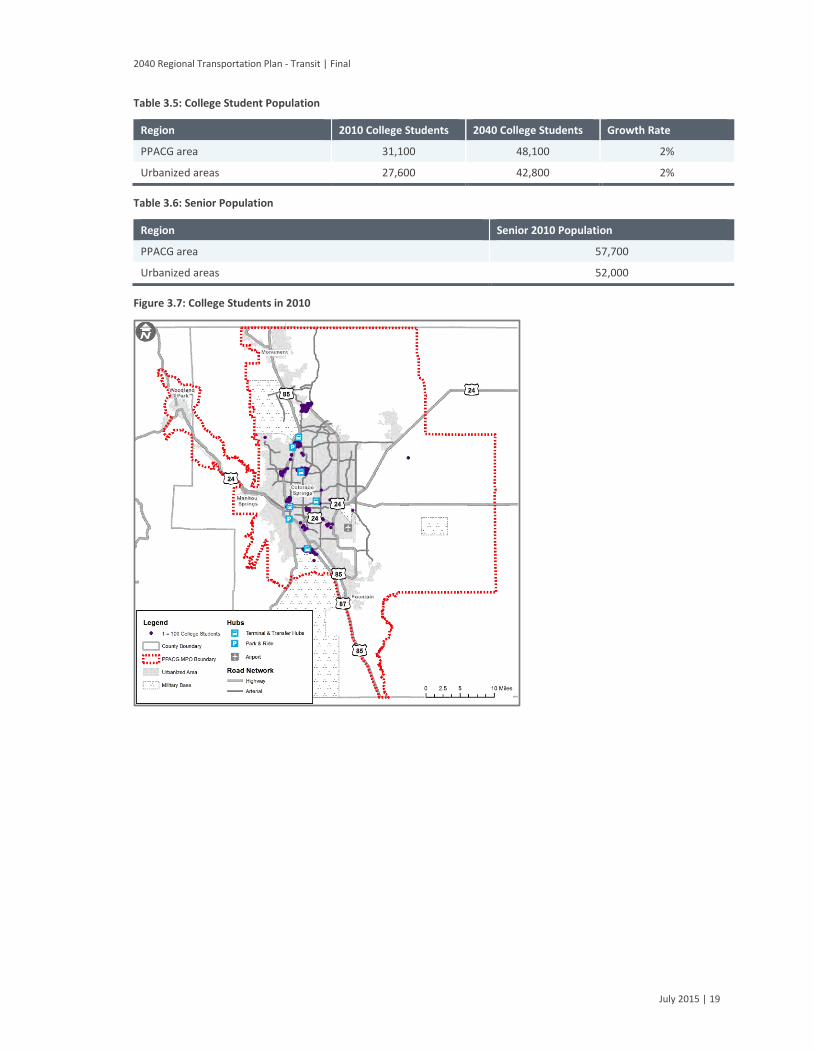
Table 3.5 shows how the college population will increase across the entire PPACG area.
While there is a slightly greater density of college students within the urbanized areas, their growth rate will be consistent across the entire PPACG area.
Based on the 2010 small-area forecast, the current population of college students is mostly
concentrated around the area’s major colleges and universities. Several technical institutes and
smaller colleges are located throughout the PPACG area. Area institutions include:
Regis University
Colorado College
Pikes Peak Community College (PPCC)/ PPCC Downtown Studio Campus
University of Colorado – Colorado Springs (UCCS)
Colorado Technical University, Colorado Springs
Webster University
IntelliTec Medical Institute
Colorado Christian University
Devry University Colorado Springs
Everest College
IntelliTec College
National American University
Newman University
Nazarene Bible College
Table 3.5 presents the college student population.
Table 3.6 presents the senior population. A slightly greater concentration of seniors is located
within the urbanized areas of the PPACG area. According to the State of Colorado Demography
Office, the total senior population for both Teller and El Paso counties is approximately 86,000.
The senior population is expected to grow to about 171,000 by 2040 in this area.3 This is almost a three percent increase in the senior population.
5 American Public Transportation Association. 2007. A Profile of Public Transportation Passenger
Demographics and Travel Characteristics Reported in On-Board Surveys. Accessed 2014 from: http://www.apta.com/resources/statistics/Documents/transit_passenger_characteristics_text_5_29_2007.pdf.
2040 Regional Transportation Plan - Transit | Final
July 2015 | 19
Table 3.5: College Student Population
Region 2010 College Students 2040 College Students Growth Rate
PPACG area 31,100 48,100 2%
Urbanized areas 27,600 42,800 2%
Table 3.6: Senior Population
Region Senior 2010 Population
PPACG area 57,700
Urbanized areas 52,000
Figure 3.7: College Students in 2010
2040 Regional Transportation Plan - Transit | Final
July 2015 | 20
Figure 3.8: College Students in 2040
Figure 3.9: Senior Population in 2010
2040 Regional Transportation Plan - Transit | Final
July 2015 | 21
Employment Density
Oftentimes, the commute trip is the easiest trip for people to transition to transit because it is
usually more of a routine than other trips. However, using transit for those who work shift jobs
and hours outside the most common 9 AM to 5 PM schedule may be more difficult since most
transit service runs during the day, with peak times in the morning and afternoon rush hour time
periods.
Table 3.7 shows the current and projected employment numbers for the area. The entire PPACG
area will experience approximately the same amount of growth.
Table 3.7: Employment in 2010 and 2040
Region 2010 Employment 2040 Employment Growth Rate
PPACG area 319,900 470,600 2%
City of Colorado Springs 231,100 364,600 2%
Figure 3.10: Employment Density in 2010
2040 Regional Transportation Plan - Transit | Final
July 2015 | 22
Figure 3.11: Employment Density in 2040
Major Employers
Within the City of Colorado Springs, the top ten employers comprise approximately a third of all
employment within El Paso County.6 Employing just more than 12 percent of all the employment
is Fort Carson.
The top four employers are military installations—and account for nearly 25% of all employment within El Paso County.
Table 3.8: Top Employers in the City
Rank Employer Percentage of Total County Employment
1 Fort Carson Army Base 12.3%
2 Peterson Air Force Base 4.1%
3 Air Force Academy 3.8%
4 Schriever Air Force Base 3.2%
5 Memorial Health Services 1.8%
6 Colorado Springs School District 11 1.5%
6 Skinner, Kara. Comprehensive Annual Financial Report. 2013. City of Colorado Springs. Report. December
9, 2014. <http://coloradosprings.gov/sites/default/files/finance/Accounting/cafrs/final_2013_cafr.pdf>

2040 Regional Transportation Plan - Transit | Final
July 2015 | 23
Rank Employer Percentage of Total County Employment
7 Academy School District #20 1.1%
8 Penrose-St. Francis Health Services 1.1%
9 City of Colorado Springs 0.9%
10 El Paso County 0.8%
Major Industries
The top five industries in the City of Colorado Springs include: 1) Retail; 2) Health Care, Social
Assistance; 3) Accommodation and Food Services; 4) Education; and 5) Professional.7
Table 3.9: Top Industries in the City
Sector Percent
Accommodation and Food Services 11.4%
Retail 11.8%
Health Care and Social Assistance 11.7%
Education 11.0%
Professional 9.2%
Admin, Support, Waste Management and Remediation 7.9%
Manufacturing 5.8%
Finance and Insurance 5.3%
Construction 4.9%
Other Services 4.1%
Information 3.8%
Public Administration 3.4%
Transportation And Utilities 2.9%
Wholesale Trade 2.2%
Arts, Entertainment, Recreation 1.8%
Real Estate and Rentals 1.8%
Management of Companies 0.5%
Agriculture and Mining 0.2%
Summary
While growth is projected to occur over the next 25 years until 2040, the growth generally is not
concentrated within the City of Colorado Springs or urbanized area. Many of the demographic
factors will continue to spread across the entire PPACG area and make it difficult for transit
services to provide effective service.
7U.S. Census Bureau. 2013. OnTheMap Application. Longitudinal-Employer Household Dynamics Program.
<http://onthemap.ces.census.gov/>
2040 Regional Transportation Plan - Transit | Final
July 2015 | 24
Travel Patterns
Developing potential improvements to the transit network requires an understanding of the
predicted travel patterns. Through the origin-destination modeling data obtained from PPACG, a
comparative assessment of the changes in travel patterns was completed for the 2010 and 2040
timeframes.
The project team examined data for future origins and destinations within the PPACG area to predict what areas may develop higher or lower transit demand.
The model was organized into 39 traffic zones (geographical areas) to observe changes in travel
patterns between now and 2040.
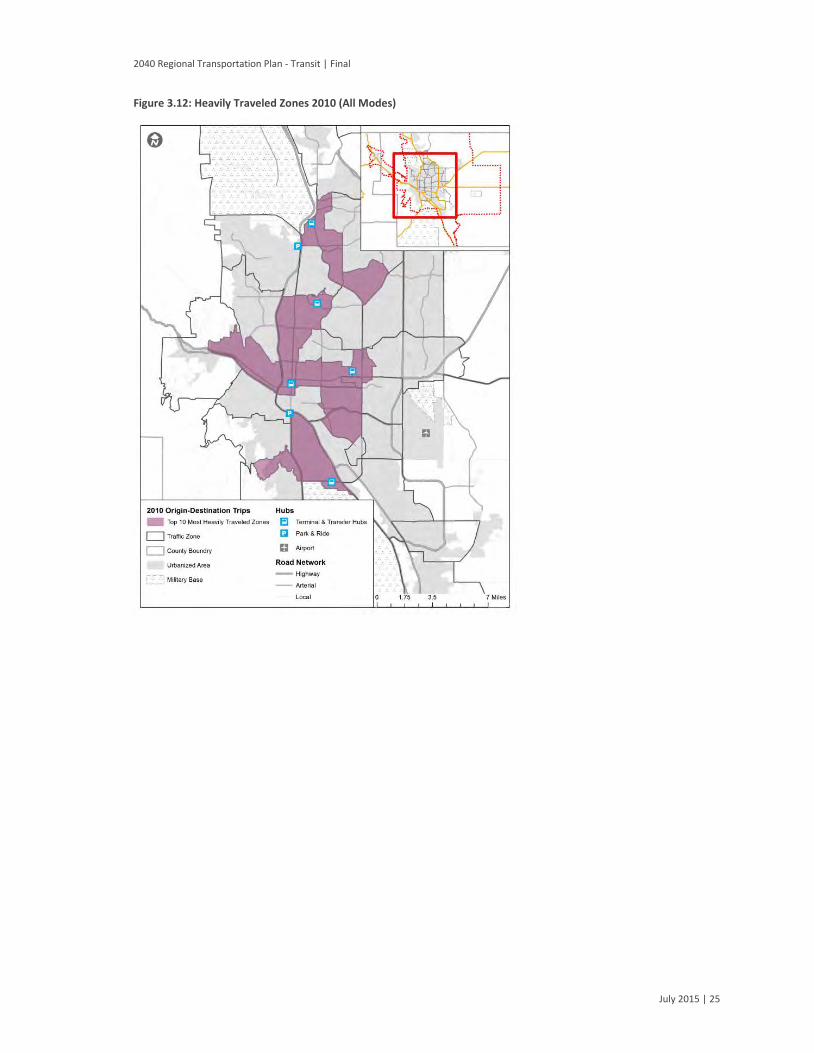
Figure 3.12 and Figure 3.13 highlight the ten traffic zones with highest number of daily trip origins
and destinations in 2010 and 2040. The data was normalized by dividing the number of trips by
the area of each traffic zone to account for various sizes of zones. The downtown area, the areas
around the Citadel and the Chapel Hills Malls, Pikes Peak Community College, Platte Avenue, and
Cascade/Nevada Avenue showed the highest concentrations of trips in both 2010 and 2040. The
areas along Colorado Avenue and around the Broadmoor Towne Center were included in the top
ten origins and destinations. However, the growth in these areas is surpassed in later years by the
areas south of the downtown and along the southern sections of Academy Boulevard.
2040 Regional Transportation Plan - Transit | Final
July 2015 | 25
Figure 3.12: Heavily Traveled Zones 2010 (All Modes)
2040 Regional Transportation Plan - Transit | Final
July 2015 | 26
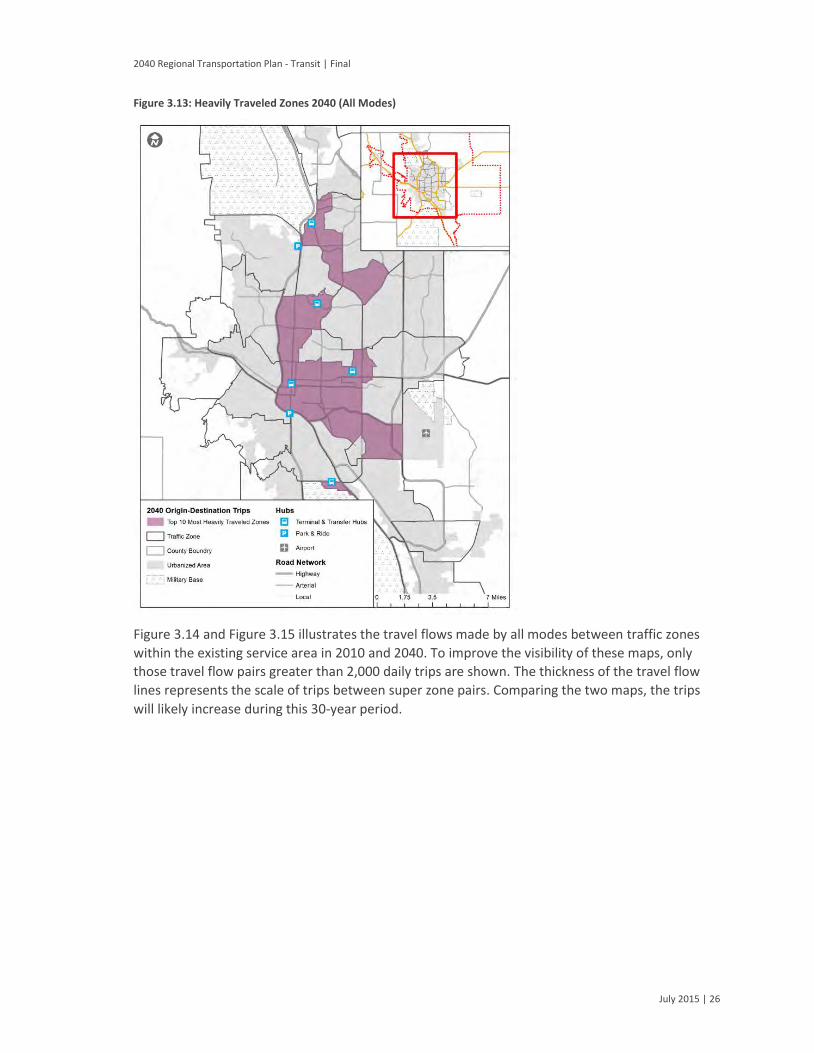
Figure 3.13: Heavily Traveled Zones 2040 (All Modes)
Figure 3.14 and Figure 3.15 illustrates the travel flows made by all modes between traffic zones
within the existing service area in 2010 and 2040. To improve the visibility of these maps, only
those travel flow pairs greater than 2,000 daily trips are shown. The thickness of the travel flow
lines represents the scale of trips between super zone pairs. Comparing the two maps, the trips
will likely increase during this 30-year period.
2040 Regional Transportation Plan - Transit | Final
July 2015 | 27
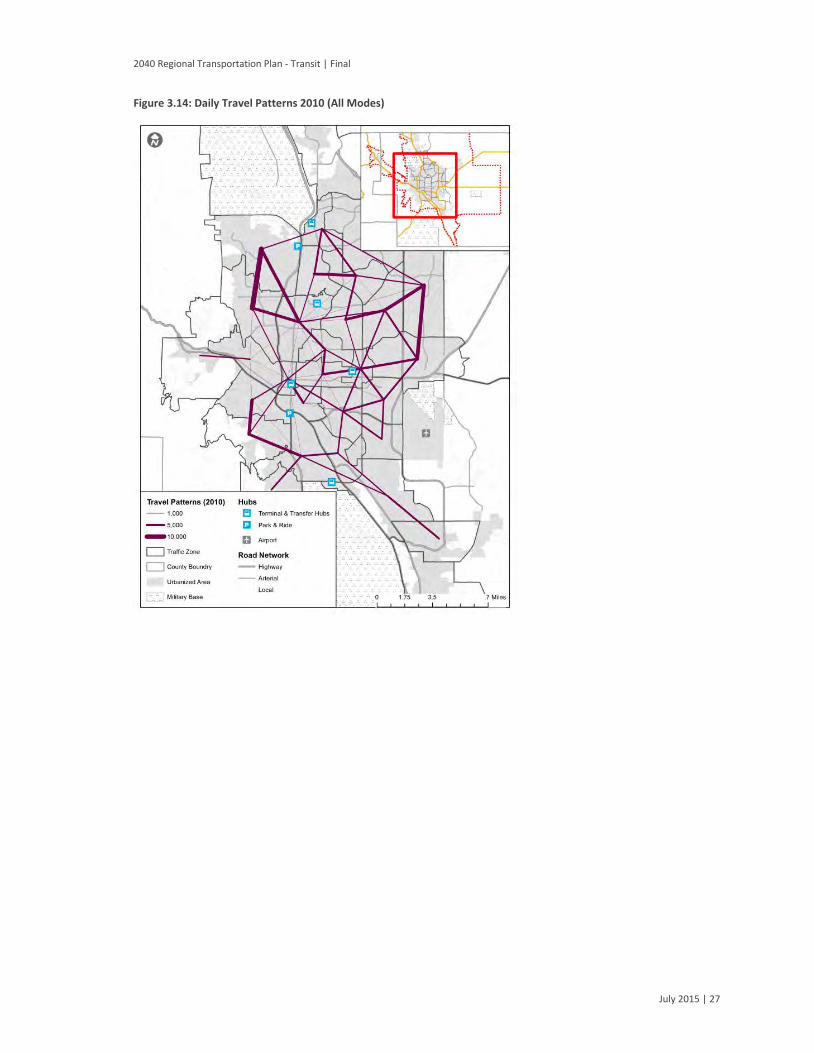
Figure 3.14: Daily Travel Patterns 2010 (All Modes)

2040 Regional Transportation Plan - Transit | Final
July 2015 | 28
Figure 3.15: Potential Daily Travel Patterns 2040 (All Modes)
Summary
Considering the above factors, the downtown traffic zone will continue to be an important hub
and destination for the transit network. Figure 3.14 shows that a high amount of trips start or end
in the downtown. Both the 2010 and 2040 maps present a significant number of trips radiating
from this concentrated traffic zone. The Citadel Mall area and the Platte Avenue corridor also
show a notable number of lines converging in both maps. Additionally, the Nevada Avenue
corridor, including UCCS, is an important destination to serve with the transit network.
Mountain Metropolitan Transit System
The substantive background, facts, statistics, and financial data are representative of the readily-
available information in 2014. Ongoing adjustments to the services and network routing to
improve frequency, connectivity, and increase mobility options (many of which are presented in
this plan) are anticipated.
Mountain Metro provides a majority of the fixed-route service in the PPACG area, with the
majority of service occurring during the weekday and limited weekend service. Mountain Metro
operates from about 5:30 AM - 9:45 PM on weekdays, on Saturdays from 6:30 AM - 7 PM, and

2040 Regional Transportation Plan - Transit | Final
July 2015 | 29
Sundays from 7:30 AM to 6 PM.8 No service is provided on New Year’s Day, Thanksgiving Day and
Christmas Day.
In addition to bus routes within the City of Colorado Springs, Mountain Metro provides service into Manitou Springs and south into the Security-Widefield area.9
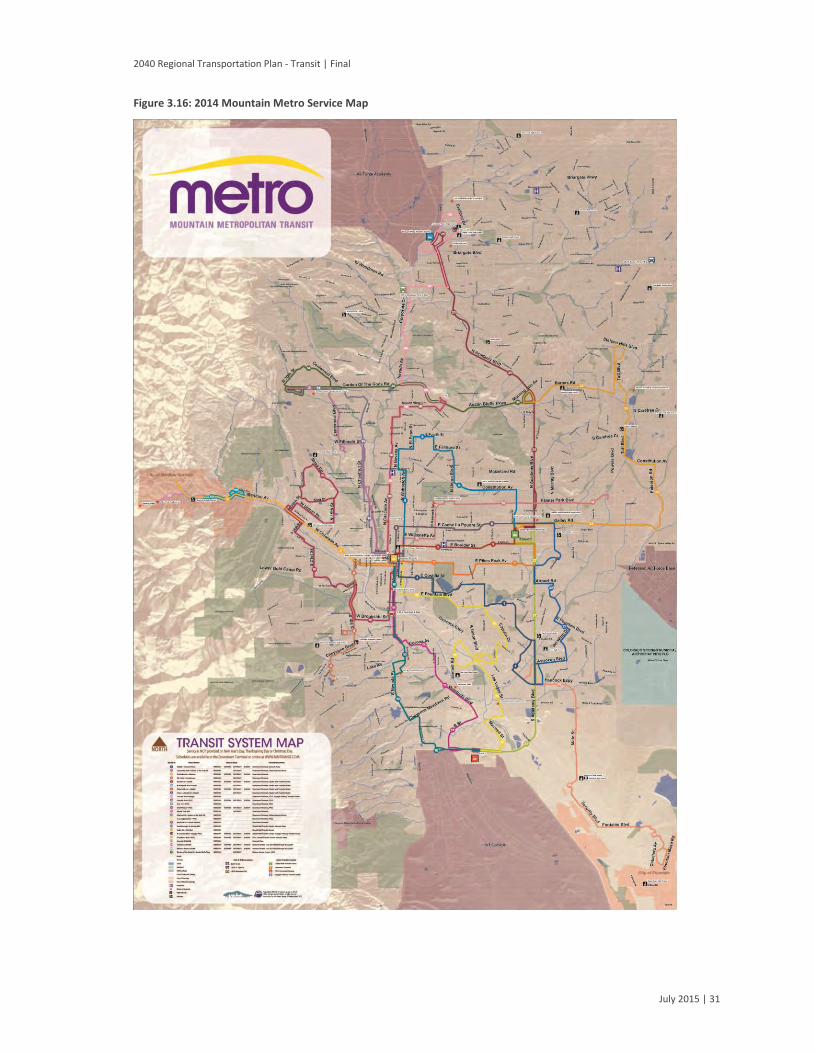
Mountain Metro Service Area
The fixed-route bus network provides service primarily within the City of Colorado Springs. The
service area extends west into the City of Manitou Springs, south into the Security-Widefield area,
east to Peterson Air Force Base, and north to the Chapel Hills Mall. Other major destinations
include: the Citadel Mall, the Colorado Springs Senior Center, El Paso County Department of
Human Services, UCCS, Colorado College, the Broadmoor Hotel, PPCC, Memorial Hospital Main,
and the U.S. Social Security Office. Mountain Metro Mobility paratransit service is also provided
within three quarters of a mile of the fixed routes as required by ADA. Figure 3.16 shows the
service area and all the routes.
Fixed Route Service Hours and Frequencies
Fares
The current Mountain Metro adult fare is $1.75 per ride.10 Passengers may request a transfer to
continue their journey. Transfers may be used on a different route, not to continue along the
same route or for the return trip. A number of special fares apply to specific groups, including:
youth, Medicare, people with disabilities, and seniors.10 Other non-cash tickets are available to
passengers, including a day pass, 31-day pass, 20-ride ticket and the Summer Haul Pass for youth
during summer months.10 Figure 3.16 summarizes the operational details of all routes.
Service Days
All 21 routes (data summer 2014) provide weekday service, but select routes provide evening ,
weekend and holiday services. Approximate hours of operation for Mountain Metro bus service
are:
Monday - Friday: 5:30 AM - 9:45 PM
Saturday: 6:30 AM - 7:00 PM
Sunday: 7:30 AM - 6:00 PM
8Operating Hours and Holidays. City of Colorado Springs. October 22, 2014.
<http://www.springsgov.com/Page.aspx?NavID=4558> 9Mountain Metropolitan Transit Services. 2009. City of Colorado Springs. November 19, 2014.
<http://transit.coloradosprings.gov/transportation/public-transportation/about-mmt/mountain-metropolitan-transit-services> 10
Fares & Tickets. City of Colorado Springs. November 20, 2014. <https://www.springsgov.com/page.aspx?navid=994>

2040 Regional Transportation Plan - Transit | Final
July 2015 | 30
Mountain Metro does not provide service on New Year's Day, Thanksgiving Day and Christmas
Day. Buses will be running according to the Sunday schedule (service on routes 1, 3, 5, 7, 9B, 11,
25) on Memorial Day, Independence Day and Labor Day.
Service Hours
Most of the service provided occurs during the peak periods and during the daytime. Peak hour
service refers to the two times during the day when most people are traveling to or from work,
generally from 6-9AM and 3-6PM. Based on current service schedules, frequencies are similar for
the peak periods and mid-day services. For the purposes of Mountain Metro Transit and this
report, we define the morning peak as 5-9AM and the afternoon peak as 3-6:30 PM.
Table 3.10 shows the number of total runs (broken out by time of day) by route. Almost all routes
that only provide weekday service run between approximately 6 AM and 6 PM. Only Route 9A
provides slightly more service from 5 AM until 8 PM south bound and from 6 AM until 7 PM north
bound.
All routes providing service on Saturdays run from approximately 6 AM -7 PM. This amounts to a
total of approximately 13 service hours for all nine routes (2014) that provide service on
Saturdays. Routes running on Sundays have slightly decreased service hours. All routes providing
service on Sundays run from approximately 7 AM - 6 PM. This results in a total of approximately
11 service hours for the seven routes (2014) that provide service on Sundays.
2040 Regional Transportation Plan - Transit | Final
July 2015 | 31
Figure 3.16: 2014 Mountain Metro Service Map

2040 Regional Transportation Plan - Transit | Final
July 2015 | 32
Table 3.10: 2014 Service Information
Service Frequency
Mountain Metro typically operates at 30- or 60-minute frequencies; service on the weekends
(either Saturday or Sunday) operates at 60-minute frequencies. Figure 3.17 presents the bus
operations statistics by route.
# Route Name
Weekday # of Runs
Weekday Service Hours
Saturday Service Hours
Sunday Service Hours
AM
Pea
k (5
-9 A
M)
Day
(9
AM
-3P
M)
PM
Pea
k (3
-6:3
0)
Even
ing
(6:3
0-1
0P
M)
1 Hillside- Hancock Plz 13 24 14 7 5AM-10PM 6AM-7PM 7AM-6PM
2 Centennial Blvd- Garden of the Gods Rd. 3 6 3 0 8AM-5PM
3 Colorado Avenue 13 24 14 7 5AM-10PM 6AM-7PM 7AM-6PM
4 8th Street 6 12 7 0 6AM-7PM
5 Boulder- Citadel 13 24 14 7 5AM-10PM 6AM-7PM 7AM-6PM
6 Wasatch- Citadel 7 12 7 0 6AM-7PM
7 Pikes Peak Avenue 13 24 14 7 5AM-10PM 6AM-7PM 7AM-6PM
8 Cache La Poudre St. 7 12 7 0 6AM-7PM
9A Cascade Ave- Voyager Pkwy Transfer Ctr 7 12 8 3 5AM-9PM
9B Cascade Ave- UCCS 6 12 7 3 5AM-10PM 6AM-7PM 7AM-6PM
10 Hwy. 115- PPCC 6 12 7 1 6AM-7PM
11 World Arena- PPCC 7 12 7 6 5AM-10PM 6AM-7PM 7AM-6PM
12 Palmer Park Blvd. 7 12 7 0 6AM-7PM 6AM-7PM
14 Chestnut- Garden of the Gods Rd. 7 12 7 0 6AM-7PM
15 Criminal Justice Center- PPCC 7 12 7 0 6AM-7PM
16 Brookside St. 6 12 6 0 6AM-7PM
22 Southborough 6 12 7 1 6AM-7PM
23 Tutt Blvd via Powers Blvd 6 12 7 2 6AM-7PM
24 Galley Rd.-Peterson AFB 5 12 7 1 6AM-7PM
25 Academy Blvd. 15 24 14 8 5AM-10PM 6AM-7PM 7AM-6PM
32 Security- Widefield 6 12 7 1 6AM-7PM
34 Garden of the Gods Rd- Austin Bluffs Pkwy 8 12 7 1 6AM-7PM 6AM-7PM

2040 Regional Transportation Plan - Transit | Final
July 2015 | 33
Figure 3.17: Total Daily Runs by Route
*Data is sourced from scheduling details during summer 2014.
Figure 3.18: Daily Service Hours by Route from December 2013-May 2014
*9A contains ridership only from UCCS to the Voyager Transfer Center. This data utilizes six months of data
(December 2013-May 2014).
2040 Regional Transportation Plan - Transit | Final
July 2015 | 34
Fleet
Mountain Metro has a total of 36 buses in their fixed route system. Of the 36 buses, 19 are 35’
long transit vehicles, 17 are 40’ long transit vehicles, and the remaining are either 25’ cutaway
vehicles or 29’ cutaway vehicles. The majority of these transit vehicles are low-floor.
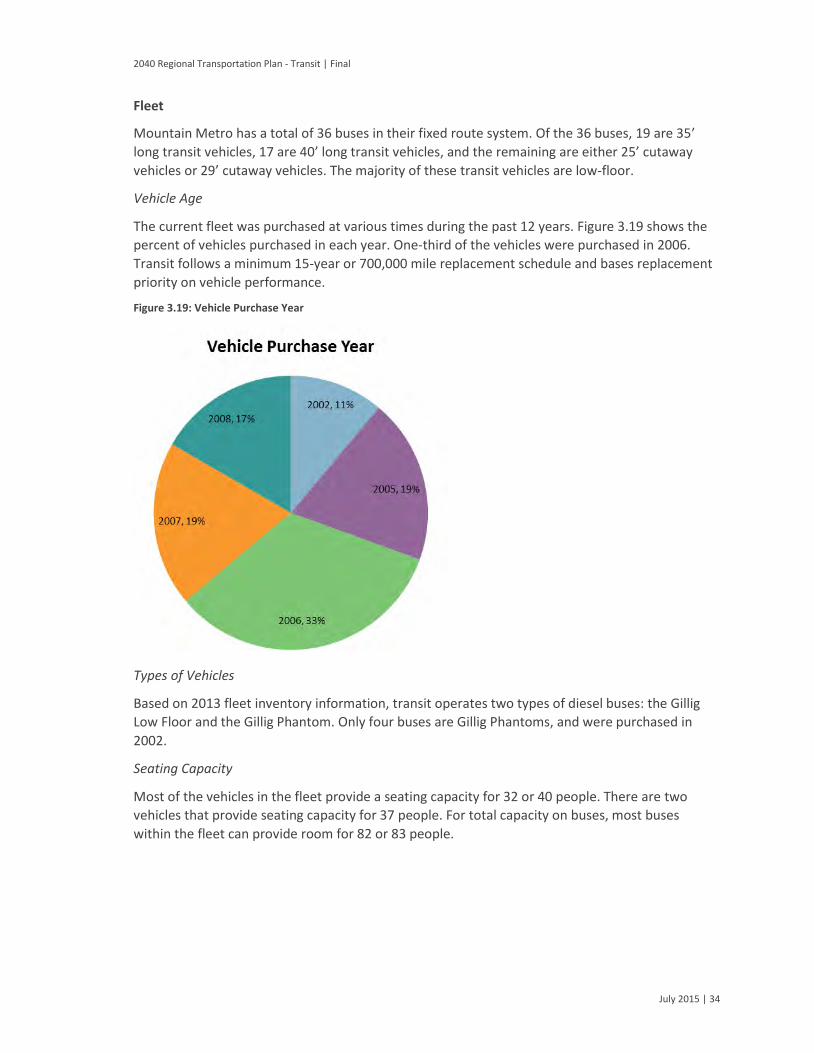
Vehicle Age
The current fleet was purchased at various times during the past 12 years. Figure 3.19 shows the
percent of vehicles purchased in each year. One-third of the vehicles were purchased in 2006.
Transit follows a minimum 15-year or 700,000 mile replacement schedule and bases replacement
priority on vehicle performance.
Figure 3.19: Vehicle Purchase Year
Types of Vehicles
Based on 2013 fleet inventory information, transit operates two types of diesel buses: the Gillig
Low Floor and the Gillig Phantom. Only four buses are Gillig Phantoms, and were purchased in
2002.
Seating Capacity
Most of the vehicles in the fleet provide a seating capacity for 32 or 40 people. There are two
vehicles that provide seating capacity for 37 people. For total capacity on buses, most buses
within the fleet can provide room for 82 or 83 people.

2040 Regional Transportation Plan - Transit | Final
July 2015 | 35
Bus Stop Connectivity
Transit riders rarely live immediately adjacent to a bus stop and must travel to access the system.
Many transit riders walk to bus stops, which makes sidewalk connections very important pieces of
the transit system.
According to the 2013 on-board survey, most people walk to the bus stop (approximately 80
percent of all riders).
For people to walk to the bus stop, they need to feel safe and have ample infrastructure.
Mountain Metro’s fixed-route bus system is structured with a combination of both ‘hub and
spoke’ and ‘grid’ patterns. The downtown area supports a grid and there are four key hubs:
Voyager Parkway Transfer Center
PPCC Transfer Center
Downtown Transit Terminal
Citadel Mall Transfer Center
While the Voyager Parkway Transfer Center only serves to transfer between two routes, the other
transit centers provide connections among a variety of routes, with the Downtown Transit
Terminal and Citadel Mall Transfer Center providing the most transfer opportunities.
Infrastructure
Most transit users must travel to access a bus stop, making connections between bus stops and
neighborhoods critical. In general, a variety of factors contribute to improving the walking
environment and improving connections between bus stops and areas:11
High-density development
Mixed-use services to provide options
Buildings with ground-level businesses and residential above
Narrow roads
Short crossing distance at crosswalks
Street furniture (including benches and trash cans)
Many crossing opportunities
On-street parking (to minimize traffic volume)
Street lighting
Bus stops need to provide adequate infrastructure for a variety of riders—especially if they may
have to wait a long time for a transfer or the next bus. The project team identified the following
components of a bus stop that benefits users:
11Walkability Improvements. 2014. Victoria Transport Policy Institute. December 15, 2014.
<http://www.vtpi.org/tdm/tdm92.htm>
2040 Regional Transportation Plan - Transit | Final
July 2015 | 36
Bike parking
Lighting
Trash cans
Shelter
Concrete pad
Connections to adjacent sidewalks
Current Stops
The Mountain Metro fixed-route system includes more than 1,000 bus stops, 80% of which have
either a bench or a bench with shelter. Bus stops that support transfers and high usage are
generally prioritized to receive amenities. Table 3.11 has information on the bus stops with and
without transfers.
Table 3.11: Bus Stop Amenity Information
Total Stops Bench Shelter Lighting Garbage Telephone Sign Post
Transfer bus stops 658 309 100 512 132 6 427
47% 15% 78% 20% 1% 65%
No transfer bus stops 440 191 45 321 59 5 311
43% 10% 73% 13% 1% 71%
As funding becomes available, Transit will continue to add bus stop amenities in a systematic
manner, consistent with the organization’s policies. Transit’s policy is to perform various impact
analyses for all changes to the system, which includes ensuring service, infrastructure, and
amenities are distributed equitably in many regards. Transit Service Planning Standards serve as a
guide for structure, amenities, and the placement of bus stops as well as outline uniform signage
requirements. Table 3.12 presents the general standards for the inclusion of infrastructure at each
Transit bus stop, provided site conditions support it and there is adequate right-of-way:
Table 3.12: Bus Stop Amenities
Amenity Stops for Consideration
Bench All
Shelter Serves single route with 40+ daily boardings
Bench or shelter Serves multiple routes
High traffic areas with advertising potential
Bustang Stops
In 2015, the Colorado Department of Transportation (CDOT) plans to begin a new intercity bus
service, known as Bustang.
Bustang service in the Colorado Springs area will provide daily connections between the Pikes Peak region and the Denver Metropolitan area.
Four Bustang stops are in the Colorado Springs area:
2040 Regional Transportation Plan - Transit | Final
July 2015 | 37
I-25/Tejon Park-n-Ride
Colorado Springs Downtown Transit Terminal (Kiowa Street and Nevada Avenue)
I-25/Woodmen Park-n-Ride
I-25/Monument Park-n-Ride
Transit currently serves three out of the four Bustang stops; only the Monument Park-n-Ride is
outside the Mountain Metro service area.
Connections to these stops will become increasingly important to deliver Bustang users to their
destinations throughout the PPACG area (and beyond).
Bus Stop Standards
Transit Service Planning Standards outline uniform signage requirements as well as guidelines for
structure, amenities, and the placement of bus stops. The spacing between stops is generally
based on the level of urban development. In more urban areas, bus stops are closer together
because a higher population density is more likely to generate supporting ridership.
Table 3.13 describes the location categories and the corresponding spacing requirements for bus
stops.
Table 3.13: Bus Stop Spacing Standards
Location Category Spacing between Stops
Urban 1,000 feet
Urban/suburban mix 1,250 feet
Suburban 1,500 feet
Suburban/rural mix 0.5 mile
Rural 1 mile
Popular Stops
Figure 3.20 and Figure 3.21 shows the current geographic concentrations of both boardings and
alightings. A number of key locations include destinations for shopping, education, human
services, and downtown employment centers.
The popular boarding locations are the following areas:
Citadel Mall
Hancock Plaza (Hancock & Academy)
West Terrance Apartments (Chelton/US 24/East Fountain)
PPCC
Broadmoor Towne Center Area
Bear Creek (west of downtown)
Downtown
West Colorado Ave (just west of downtown)
Manitou Springs
Oliver Wendell Holmes Middle School (at West Fillmore and Mesa/also near Palmer Mesa and
Mesa Valley Trail)
El Paso County Citizens Service Center
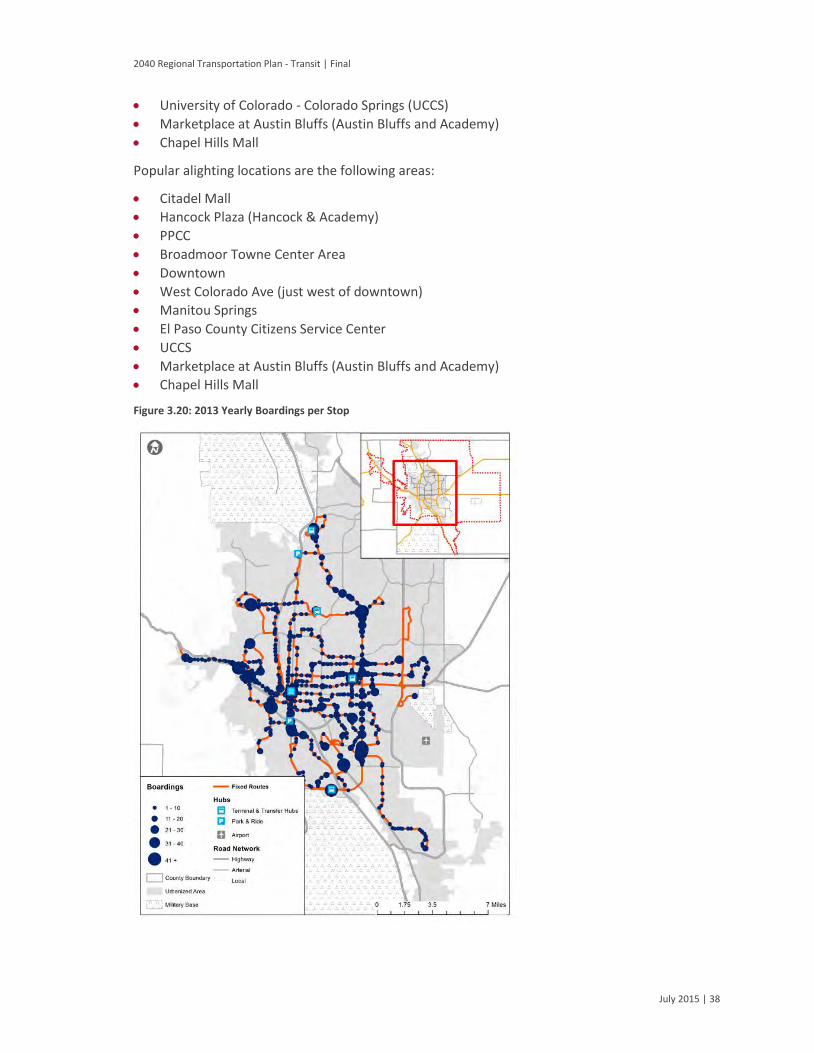
2040 Regional Transportation Plan - Transit | Final
July 2015 | 38
University of Colorado - Colorado Springs (UCCS)
Marketplace at Austin Bluffs (Austin Bluffs and Academy)
Chapel Hills Mall
Popular alighting locations are the following areas:
Citadel Mall
Hancock Plaza (Hancock & Academy)
PPCC
Broadmoor Towne Center Area
Downtown
West Colorado Ave (just west of downtown)
Manitou Springs
El Paso County Citizens Service Center
UCCS
Marketplace at Austin Bluffs (Austin Bluffs and Academy)
Chapel Hills Mall
Figure 3.20: 2013 Yearly Boardings per Stop

2040 Regional Transportation Plan - Transit | Final
July 2015 | 39
Figure 3.21: 2013 Yearly Alightings per Stop
Summary
Mountain Metro provides transit service to approximately 188 square miles but frequency and
span of service are limited. Most routes run 30- or 60-minute frequencies, and evening and
weekend services are limited. According to the 2013 onboard survey, Mountain Metro is a lifeline
service, providing service primarily for those that have few other mobility choices. Transit
recognizes the need for improvements to bus stop amenities, services, and connectivity and is
working to achieve this with limited budgets.
Funding
This section provides basic information on the 2014 Transit budget for both revenues and
expenses. This information is presented to provide context for the provision of transit described in
this chapter. Additional details on funding sources and projections are provided in Chapter 6.
Expenditures
For 2014, the total expenses totaled approximately $20.5 million.

2040 Regional Transportation Plan - Transit | Final
July 2015 | 40
The majority of the Transit budget is operational.
Approximately $2 million was spent on capital improvements. Figure 3.22 presents the annual
operating and capital expenditures.
Figure 3.22: Operating and Capital Expenses
Revenue
The two most-significant sources of funding for Transit are the FTA 5307 formula grant and PPRTA
tax revenues. The City of Colorado Springs and farebox and advertising revenue also contribute to
a significant amount of overall revenue for the 2014 budget year. Figure 3.23 graphically presents
annual revenue information.
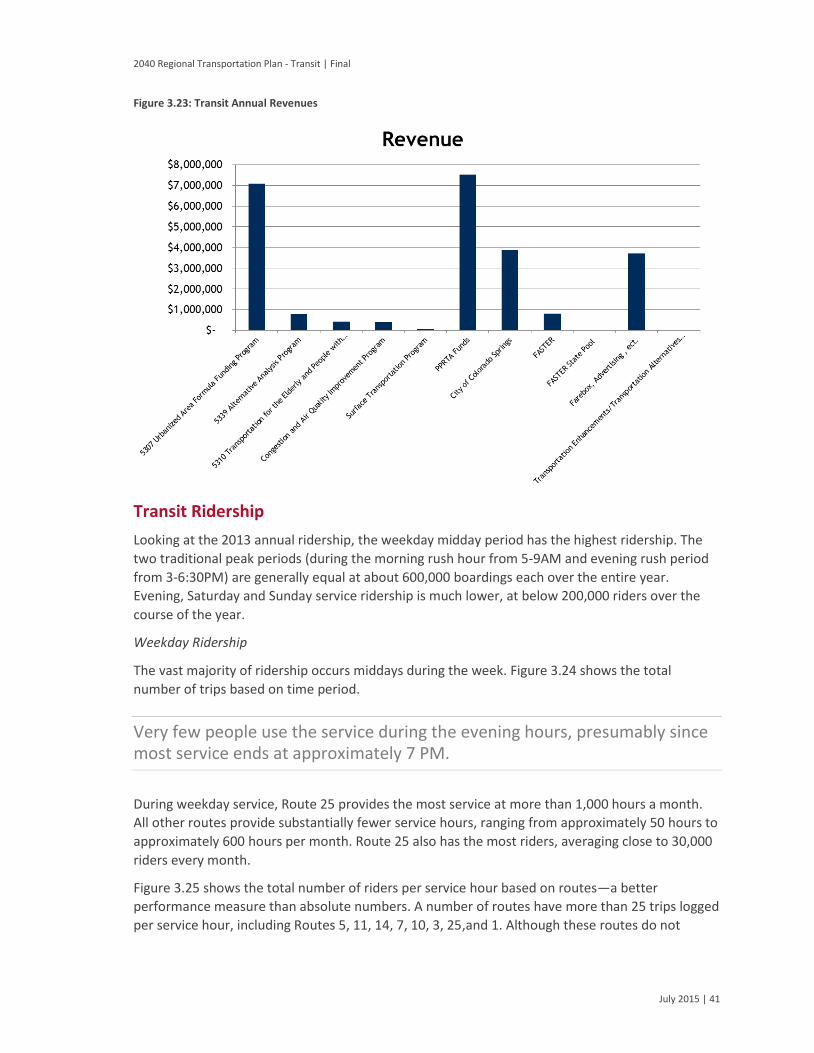
2040 Regional Transportation Plan - Transit | Final
July 2015 | 41
Figure 3.23: Transit Annual Revenues
Transit Ridership
Looking at the 2013 annual ridership, the weekday midday period has the highest ridership. The
two traditional peak periods (during the morning rush hour from 5-9AM and evening rush period
from 3-6:30PM) are generally equal at about 600,000 boardings each over the entire year.
Evening, Saturday and Sunday service ridership is much lower, at below 200,000 riders over the
course of the year.
Weekday Ridership
The vast majority of ridership occurs middays during the week. Figure 3.24 shows the total
number of trips based on time period.
Very few people use the service during the evening hours, presumably since most service ends at approximately 7 PM.
During weekday service, Route 25 provides the most service at more than 1,000 hours a month.
All other routes provide substantially fewer service hours, ranging from approximately 50 hours to
approximately 600 hours per month. Route 25 also has the most riders, averaging close to 30,000
riders every month.
Figure 3.25 shows the total number of riders per service hour based on routes—a better
performance measure than absolute numbers. A number of routes have more than 25 trips logged
per service hour, including Routes 5, 11, 14, 7, 10, 3, 25,and 1. Although these routes do not

2040 Regional Transportation Plan - Transit | Final
July 2015 | 42
provide the same service, they do perform at about the same level, with Routes 5 and 11
performing at the highest, more than 40 trips per hour. Many of the routes that provide service
during the weeknights and on the weekends likely do not have as high performance since in
general, less people ride at night and over the weekends.
Figure 3.24: 2013 Annual Ridership by Time of Day
Figure 3.25: Average Weekday Ridership/Service Hour
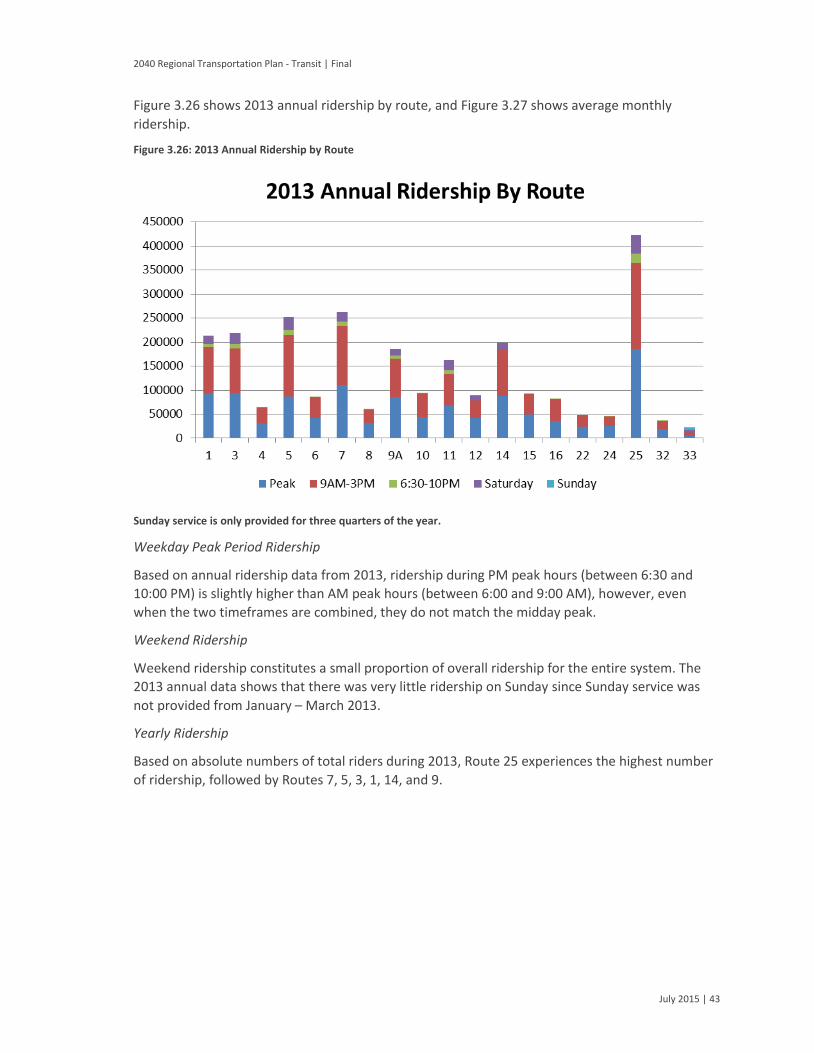
July 2015 | 43
2040 Regional Transportation Plan - Transit | Final
Figure 3.26 shows 2013 annual ridership by route, and Figure 3.27 shows average monthly
ridership.
Figure 3.26: 2013 Annual Ridership by Route
Sunday service is only provided for three quarters of the year.
Weekday Peak Period Ridership
Based on annual ridership data from 2013, ridership during PM peak hours (between 6:30 and
10:00 PM) is slightly higher than AM peak hours (between 6:00 and 9:00 AM), however, even
when the two timeframes are combined, they do not match the midday peak.
Weekend Ridership
Weekend ridership constitutes a small proportion of overall ridership for the entire system. The
2013 annual data shows that there was very little ridership on Sunday since Sunday service was
not provided from January – March 2013.
Yearly Ridership
Based on absolute numbers of total riders during 2013, Route 25 experiences the highest number
of ridership, followed by Routes 7, 5, 3, 1, 14, and 9.

2040 Regional Transportation Plan - Transit | Final
July 2015 | 44
Figure 3.27: 2013 Average Monthly Ridership
Summary
Daily ridership data shows the bulk of ridership occurs during the midday hours rather than during
rush-hour timeframes in the morning and afternoon, which is the most common pattern.
While travel volumes are usually greater in the mornings and afternoons, Mountain Metro ridership peaks midday
Many factors could contribute to this outcome of greater ridership during the midday period
instead of during the traditional morning and evening rush hour periods related to the actual
service of a particular route, including that many riders are currently transit dependent.
Most service is provided during weekdays, either during the day or peak times. Very little service
is provided past about 6 PM or 7 PM. Only six routes provide service after 7 PM and then only
during the week. Overall, five routes provide more than 100 runs of service over the course of the
entire week (Routes 1, 3, 5, 7, and 25).
User Impressions
The project team examined a variety of sources of information to summarize the general
impressions of the system from a user’s perspective. This included reviewing the results of recent
Mountain Metro rider surveys as well as input received through stakeholder outreach conducted
as part of this plan’s development. In general, users were appreciative of the service provided by
Transit.
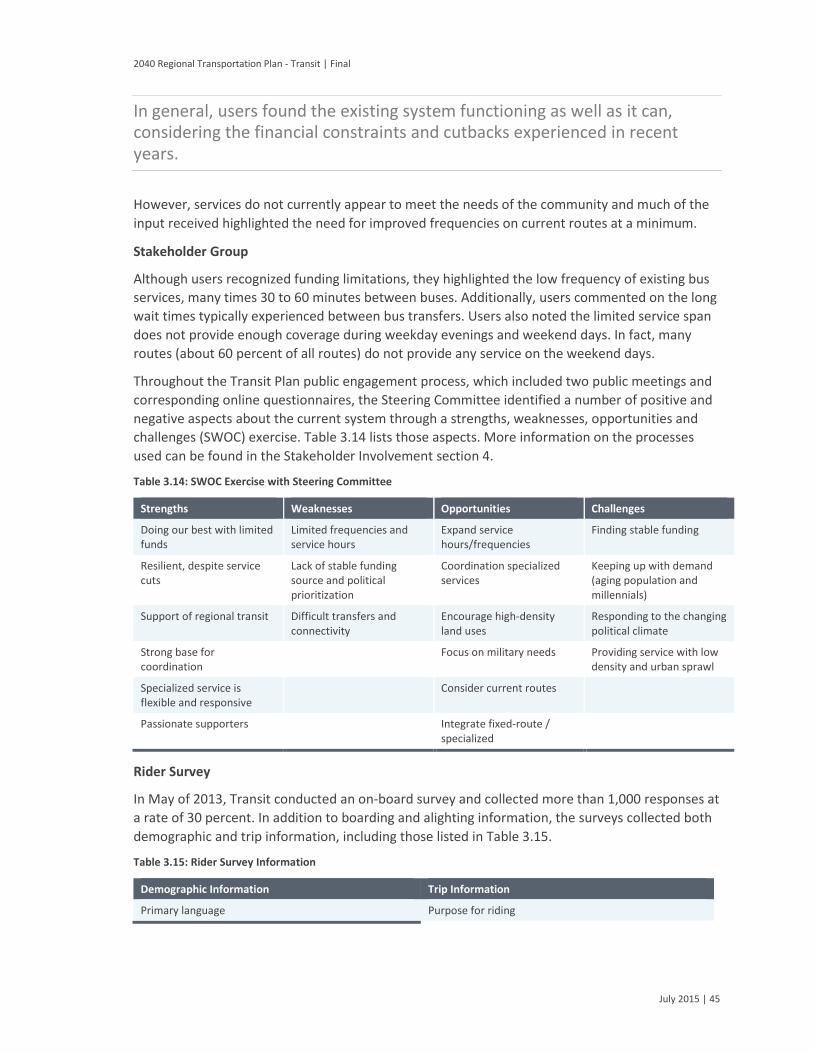
2040 Regional Transportation Plan - Transit | Final
July 2015 | 45
In general, users found the existing system functioning as well as it can, considering the financial constraints and cutbacks experienced in recent years.
However, services do not currently appear to meet the needs of the community and much of the
input received highlighted the need for improved frequencies on current routes at a minimum.
Stakeholder Group
Although users recognized funding limitations, they highlighted the low frequency of existing bus
services, many times 30 to 60 minutes between buses. Additionally, users commented on the long
wait times typically experienced between bus transfers. Users also noted the limited service span
does not provide enough coverage during weekday evenings and weekend days. In fact, many
routes (about 60 percent of all routes) do not provide any service on the weekend days.
Throughout the Transit Plan public engagement process, which included two public meetings and
corresponding online questionnaires, the Steering Committee identified a number of positive and
negative aspects about the current system through a strengths, weaknesses, opportunities and
challenges (SWOC) exercise. Table 3.14 lists those aspects. More information on the processes
used can be found in the Stakeholder Involvement section 4.
Table 3.14: SWOC Exercise with Steering Committee
Strengths Weaknesses Opportunities Challenges
Doing our best with limited funds
Limited frequencies and service hours
Expand service hours/frequencies
Finding stable funding
Resilient, despite service cuts
Lack of stable funding source and political prioritization
Coordination specialized services
Keeping up with demand (aging population and millennials)
Support of regional transit Difficult transfers and connectivity
Encourage high-density land uses
Responding to the changing political climate
Strong base for coordination
Focus on military needs Providing service with low density and urban sprawl
Specialized service is flexible and responsive
Consider current routes
Passionate supporters Integrate fixed-route / specialized
Rider Survey
In May of 2013, Transit conducted an on-board survey and collected more than 1,000 responses at
a rate of 30 percent. In addition to boarding and alighting information, the surveys collected both
demographic and trip information, including those listed in Table 3.15.
Table 3.15: Rider Survey Information
Demographic Information Trip Information
Primary language Purpose for riding

2040 Regional Transportation Plan - Transit | Final
July 2015 | 46
Demographic Information Trip Information
Age and gender Reason for riding
Annual household income Trip purpose and reasons for riding
Vehicle ownership and licensed driver Number of transfers
Occupation Transfer patterns
Ethnicity Coming from and going to
Rider’s typical source for transit information Blocks walked/to/from the bus
Age
While survey respondents generally span the entire age spectrum, over half of Mountain Metro
riders indicated they were younger than 35. Only three percent of respondents were not old
enough to drive a motor vehicle. Figure 3.28 presents rider age information.
Figure 3.28: Age Rider Information
Ethnicity
While white survey respondents comprised slightly more than half of all survey respondents, 46
percent of survey respondents were of minority ethnicities. Black and Hispanic ethnicities make up
the majority of the non-white respondents at 16 percent and 14 percent, respectively. Figure 3.29
presents rider ethnicity information.

2040 Regional Transportation Plan - Transit | Final
July 2015 | 47
Figure 3.29: Ethnicity Rider Information
Annual Household Income
In line with national demographics of transit riders, the respondents from the survey mostly fell in
the income category of $14,000 and less. Nearly half of all respondents live in a household of less
than $15,000 of annual income, while none of the respondents reported an annual income of
greater than $150,000. The majority (83 percent) lived in households with an annual income of
less than $40,000. Figure 3.30 presents rider household income information.
Figure 3.30: Annual Household Income Rider Information

2040 Regional Transportation Plan - Transit | Final
July 2015 | 48
Household Vehicles
More than half of the survey respondents lived in households with no vehicle. 26 percent of
survey responders live in a household with one vehicle, and only 16 percent reported two or more
vehicles in their households
Figure 3.31 presents rider household vehicle information.
Figure 3.31: Household Vehicles Rider Information
Mode to Bus
The vast majority of survey respondents (78 percent) arrived at their transit stop by walking. The
next most popular way to arrive was by transfer (12 percent). Only 4 percent were dropped off by
someone else, and 3 percent arrived by bicycle. Figure 3.32 presents rider information on mode
access to transit.
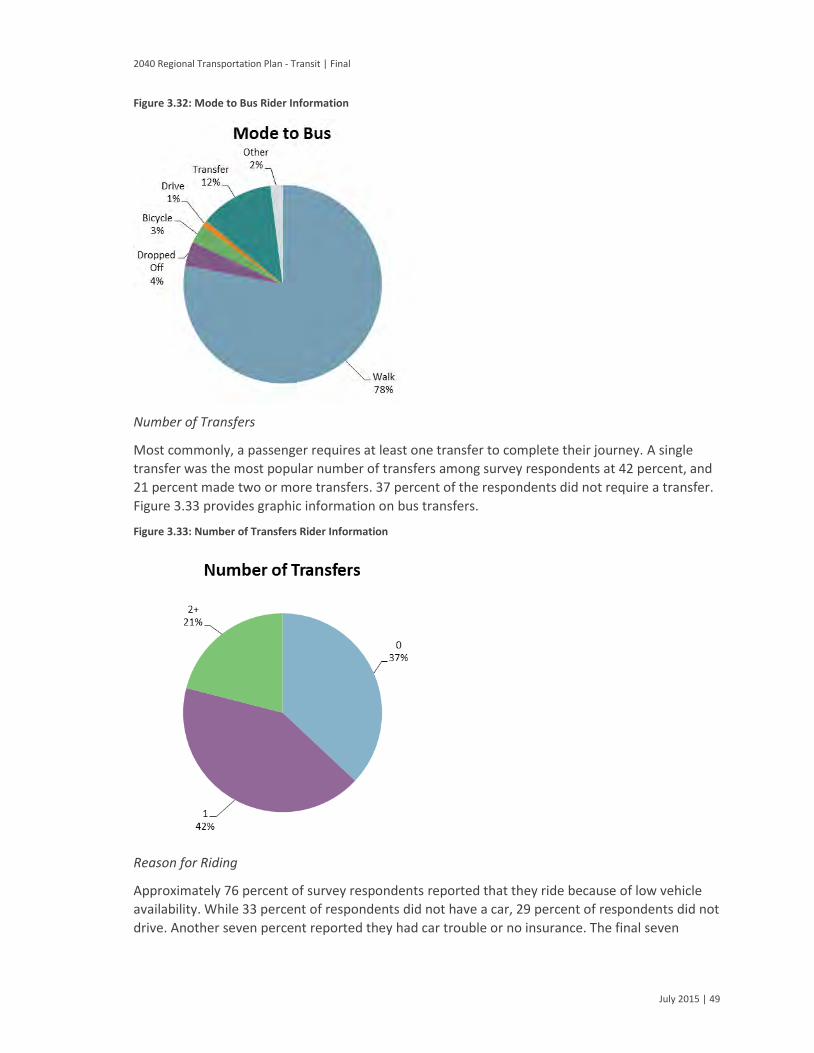
2040 Regional Transportation Plan - Transit | Final
July 2015 | 49
Figure 3.32: Mode to Bus Rider Information
Number of Transfers
Most commonly, a passenger requires at least one transfer to complete their journey. A single
transfer was the most popular number of transfers among survey respondents at 42 percent, and
21 percent made two or more transfers. 37 percent of the respondents did not require a transfer.
Figure 3.33 provides graphic information on bus transfers.
Figure 3.33: Number of Transfers Rider Information
Reason for Riding
Approximately 76 percent of survey respondents reported that they ride because of low vehicle
availability. While 33 percent of respondents did not have a car, 29 percent of respondents did not
drive. Another seven percent reported they had car trouble or no insurance. The final seven
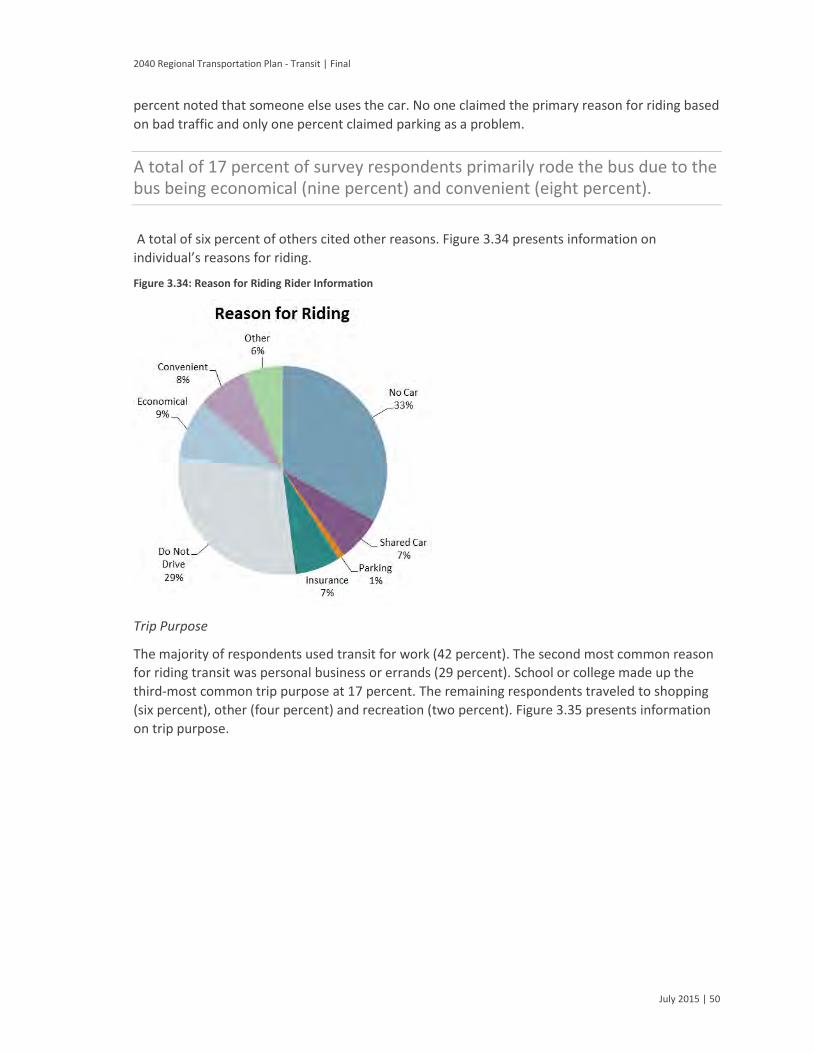
2040 Regional Transportation Plan - Transit | Final
July 2015 | 50
percent noted that someone else uses the car. No one claimed the primary reason for riding based
on bad traffic and only one percent claimed parking as a problem.
A total of 17 percent of survey respondents primarily rode the bus due to the bus being economical (nine percent) and convenient (eight percent).
A total of six percent of others cited other reasons. Figure 3.34 presents information on
individual’s reasons for riding.
Figure 3.34: Reason for Riding Rider Information
Trip Purpose
The majority of respondents used transit for work (42 percent). The second most common reason
for riding transit was personal business or errands (29 percent). School or college made up the
third-most common trip purpose at 17 percent. The remaining respondents traveled to shopping
(six percent), other (four percent) and recreation (two percent). Figure 3.35 presents information
on trip purpose.

2040 Regional Transportation Plan - Transit | Final
July 2015 | 51
Figure 3.35: Trip Purpose Rider Information
Summary
The stakeholders identified a number of factors that likely affect the makeup of the passengers
who use Mountain Metro. These rider characteristics are reflected in the respondents’ surveys.
Overall, the stakeholders identify a number of problems that would make the system more
attractive to more people including frequency, ease of access, and hours of service.
Approximately 29 percent of respondents do not drive and more than half of all respondents do
not have a household vehicle available.
Most of the respondents who completed the 2013 Onboard Survey indicated that they had little to no other choice but to use transit for transportation.
Other Service Providers
Transit provides a number of other mobility services within the community in addition to the
fixed-route bus service, including Metro Mobility and Metro Rides. Additionally, the City of
Fountain (south of Colorado Springs) provides its own bus service that connects with Mountain
Metro services at the PPCC Transfer Center. These services are further described below.
Fountain Deviated Fixed-Route Service
Fountain Municipal Transit provides service from PPCC to the Wal-Mart in Fountain. This service
operates as a deviated route to the I-25 Exit 128 Park-n-Ride as well as to Fountain-Fort Carson
High School. In the deviated route section, passengers may request to be picked up or dropped off
within three-quarters of a mile from the regular route alignment for a fare premium, as shown in
the red dashed line in Figure 3.36.
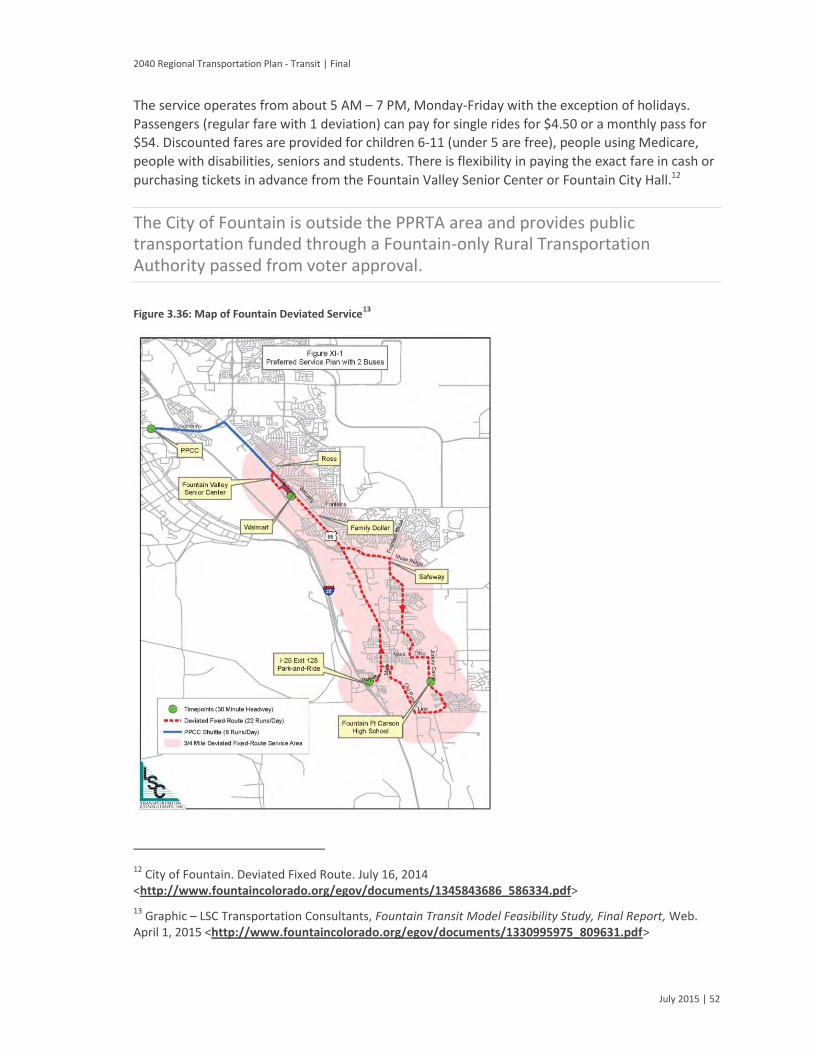
2040 Regional Transportation Plan - Transit | Final
July 2015 | 52
The service operates from about 5 AM – 7 PM, Monday-Friday with the exception of holidays.
Passengers (regular fare with 1 deviation) can pay for single rides for $4.50 or a monthly pass for
$54. Discounted fares are provided for children 6-11 (under 5 are free), people using Medicare,
people with disabilities, seniors and students. There is flexibility in paying the exact fare in cash or
purchasing tickets in advance from the Fountain Valley Senior Center or Fountain City Hall.12
The City of Fountain is outside the PPRTA area and provides public transportation funded through a Fountain-only Rural Transportation Authority passed from voter approval.
Figure 3.36: Map of Fountain Deviated Service13
12 City of Fountain. Deviated Fixed Route. July 16, 2014
<http://www.fountaincolorado.org/egov/documents/1345843686_586334.pdf>
13 Graphic – LSC Transportation Consultants, Fountain Transit Model Feasibility Study, Final Report, Web.
April 1, 2015 <http://www.fountaincolorado.org/egov/documents/1330995975_809631.pdf>
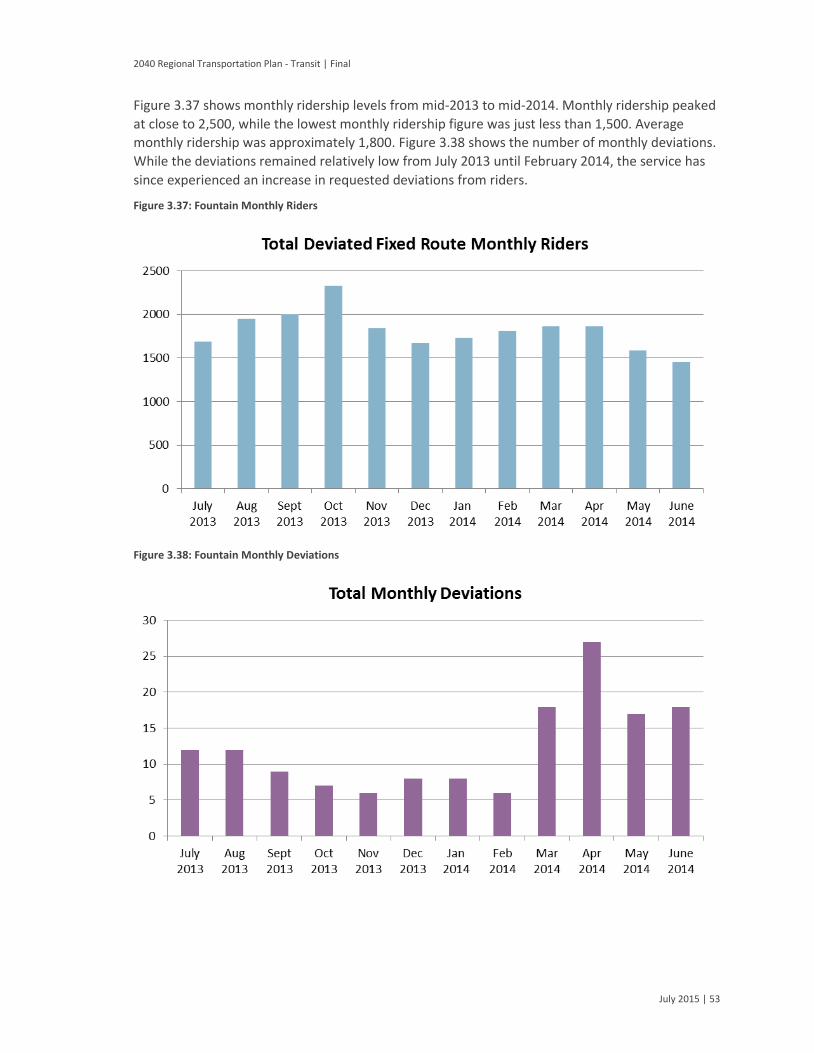
2040 Regional Transportation Plan - Transit | Final
July 2015 | 53
Figure 3.37 shows monthly ridership levels from mid-2013 to mid-2014. Monthly ridership peaked
at close to 2,500, while the lowest monthly ridership figure was just less than 1,500. Average
monthly ridership was approximately 1,800. Figure 3.38 shows the number of monthly deviations.
While the deviations remained relatively low from July 2013 until February 2014, the service has
since experienced an increase in requested deviations from riders.
Figure 3.37: Fountain Monthly Riders
Figure 3.38: Fountain Monthly Deviations

2040 Regional Transportation Plan - Transit | Final
July 2015 | 54
Metro Mobility
Metro Mobility is a federally-mandated complementary ADA paratransit service, which provides
demand-response transportation for individuals that have a disability that prevents them from
using the fixed-route bus system. This service is provided within three-quarters of a mile of all the
fixed-route service.
The three main levels of eligibility include the following:
1. Individuals unable to navigate the fixed-route system
2. Individuals who use a wheelchair or other boarding assistance device that cannot access
bus stops
3. Individuals with a specific impairment-related condition which prevents them from
traveling to or from bus stops14
Metro Mobility coordinates with other paratransit providers to provide extensive mobility for
those that cannot navigate the fixed route system. Metro Mobility also provides travel training for
individuals that may be able to use the fixed route services, if they better understood the system
and how it can accommodate their needs. Shifting clients (who are able) from paratransit service
to fixed route services can reduce costs and provide efficient mobility for clients. A separate plan
is being developed in parallel to this Transit Plan, detailing the future growth and development of
the specialized transportation system within the PPACG area. This parallel plan (the 2040 Regional
Transportation Plan – Specialized Transportation) addresses the future provision of paratransit
service and coordination by Metro Mobility and all of the other providers within the PPACG area.
Metro Rides
Transit provides other services to encourage multimodal transportation, including carpool
matching, vanpools, schoolpool matching and resources to help bicyclists combine their trips with
transit. Racks are provided on the buses as well as bicycle lockers at key Park-n-Ride locations.15
Metro Rides offers alternative transportation options to residents of the PPACG area. The program is designed to reduce congestion and pollution by encouraging people to commute by carpool, vanpool, bicycling or walking.9
Policy & Plan Review
It is critical to review and incorporate relevant elements of past transportation and land-use
planning efforts to ensure the direction set by stakeholders and decision makers is followed. To
understand past planning directions, the project team reviewed current policies and plans in place
related to fixed-route and specialized transportation. Various plans were reviewed and the key
14Eligibility Requirements and Application. City of Colorado Springs. Web. November 19, 2014
<http://www.springsgov.com/Page.aspx?navid=1977> 15
Mountain Metro Rides. 2014. City of Colorado Springs. Web. November 19, 2014. <http://transit.coloradosprings.gov/transportation/public-transportation/alternative-transportation/mountain-metro-rides>
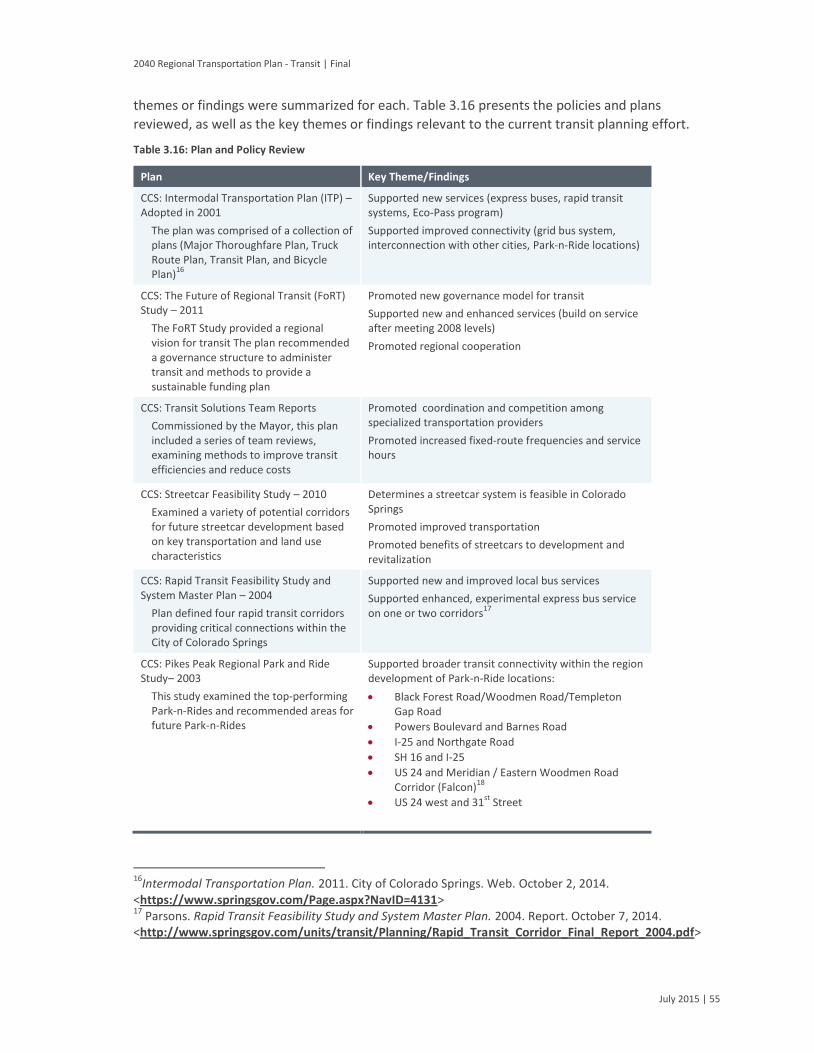
2040 Regional Transportation Plan - Transit | Final
July 2015 | 55
themes or findings were summarized for each. Table 3.16 presents the policies and plans
reviewed, as well as the key themes or findings relevant to the current transit planning effort.
Table 3.16: Plan and Policy Review
Plan Key Theme/Findings
CCS: Intermodal Transportation Plan (ITP) – Adopted in 2001
The plan was comprised of a collection of plans (Major Thoroughfare Plan, Truck Route Plan, Transit Plan, and Bicycle Plan)
16
Supported new services (express buses, rapid transit systems, Eco-Pass program)
Supported improved connectivity (grid bus system, interconnection with other cities, Park-n-Ride locations)
CCS: The Future of Regional Transit (FoRT) Study – 2011
The FoRT Study provided a regional vision for transit The plan recommended a governance structure to administer transit and methods to provide a sustainable funding plan
Promoted new governance model for transit
Supported new and enhanced services (build on service after meeting 2008 levels)
Promoted regional cooperation
CCS: Transit Solutions Team Reports
Commissioned by the Mayor, this plan included a series of team reviews, examining methods to improve transit efficiencies and reduce costs
Promoted coordination and competition among specialized transportation providers
Promoted increased fixed-route frequencies and service hours
CCS: Streetcar Feasibility Study – 2010
Examined a variety of potential corridors for future streetcar development based on key transportation and land use characteristics
Determines a streetcar system is feasible in Colorado Springs
Promoted improved transportation
Promoted benefits of streetcars to development and revitalization
CCS: Rapid Transit Feasibility Study and System Master Plan – 2004
Plan defined four rapid transit corridors providing critical connections within the City of Colorado Springs
Supported new and improved local bus services
Supported enhanced, experimental express bus service on one or two corridors
17
CCS: Pikes Peak Regional Park and Ride Study– 2003
This study examined the top-performing Park-n-Rides and recommended areas for future Park-n-Rides
Supported broader transit connectivity within the region development of Park-n-Ride locations:
Black Forest Road/Woodmen Road/Templeton Gap Road
Powers Boulevard and Barnes Road
I-25 and Northgate Road
SH 16 and I-25
US 24 and Meridian / Eastern Woodmen Road Corridor (Falcon)
18
US 24 west and 31st
Street
16Intermodal Transportation Plan. 2011. City of Colorado Springs. Web. October 2, 2014.
<https://www.springsgov.com/Page.aspx?NavID=4131> 17
Parsons. Rapid Transit Feasibility Study and System Master Plan. 2004. Report. October 7, 2014. <http://www.springsgov.com/units/transit/Planning/Rapid_Transit_Corridor_Final_Report_2004.pdf>

2040 Regional Transportation Plan - Transit | Final
July 2015 | 56
Plan Key Theme/Findings
CDOT: Interregional Connectivity Study (ICS) – 2014
Study examined high speed transit (either high speed rail or high speed Maglev) connections in Colorado
Proposed a high speed rail connection between DIA and north Colorado Springs
19
Supported regional connectivity to the proposed high speed rail
CDOT: Statewide Transit Survey of Older Adults and Adults with Disabilities – 2014
This survey examined the thoughts of seniors and persons with disabilities on transit dependency, barriers to transit, and cost
Supported improvements to transportation information/referral services
Promoted lower fares
Promoted improving access and accessibility to transit
CDOT: Statewide Transit Plan –2014
Promoted a state-wide transit system, including service to Denver from Colorado Springs
Supported statewide coordination and partnerships
Promoted transit expansion statewide (specifically new services between Colorado Springs and Denver)
PPACG: 2035 Moving Forward Update – 2012
Basis for the current planning process This plan examined all aspects of transit and transportation for the region through 2035
Set the transportation goals and priorities for the Pikes Peak region through 2035
Promoted development policies that support transit
Encouraged sustainable development of transit services
Supported the connections between land use, development, and transportation
PPACG: Regional Sustainability Plan – 2012
Plan examined long-term sustainability measures for transportation and development within the region
Encouraged a built environment with an integrated transportation system
Supported a multi-modal transportation system
Supported higher-density neighborhoods
PPACG: Pikes Peak Rural Transportation Authority – 2004 to present
Set out the policies and procedures for implementing the PPRTA sales tax measure approved in 2004
Provided key funding for core transit and mobility services within the region
Critical to the ongoing provision and expansion of transit
PPACG: Fort Carson Regional Growth Plan – 2013
Sets a structure for future growth and changing conditions for Fort Carson based on its core mission
Supports congestion relief through alternative transportation modes
Supports improved mobility on post
Supports improved connectivity between the post and various points around the region
PPACG: Transportation Improvement Program (TIP) – 2013 thru 2018
Plan sets the financial plan for regional transportation improvements
Support improved transit infrastructure and operations
Details funding mechanisms for priority transit and mobility projects throughout the region
18David Evans and Associates. Pikes Peak Regional Park and Ride Plan. 2003. Report. City of Colorado
Springs, El Paso County & PPACG. October 6, 2014. <http://www.springsgov.com/units/transit/Planning/FINAL_P-N-R_REPORT_2003.pdf> 19
Interregional Connectivity Study Executive Summary. 2014. Colorado Department of Transportation. Report. October 7, 2014. <http://www.coloradodot.info/projects/ICS/ics-draft-report-january-2014/ics-executive-summary-2-10-14.pdf/view>
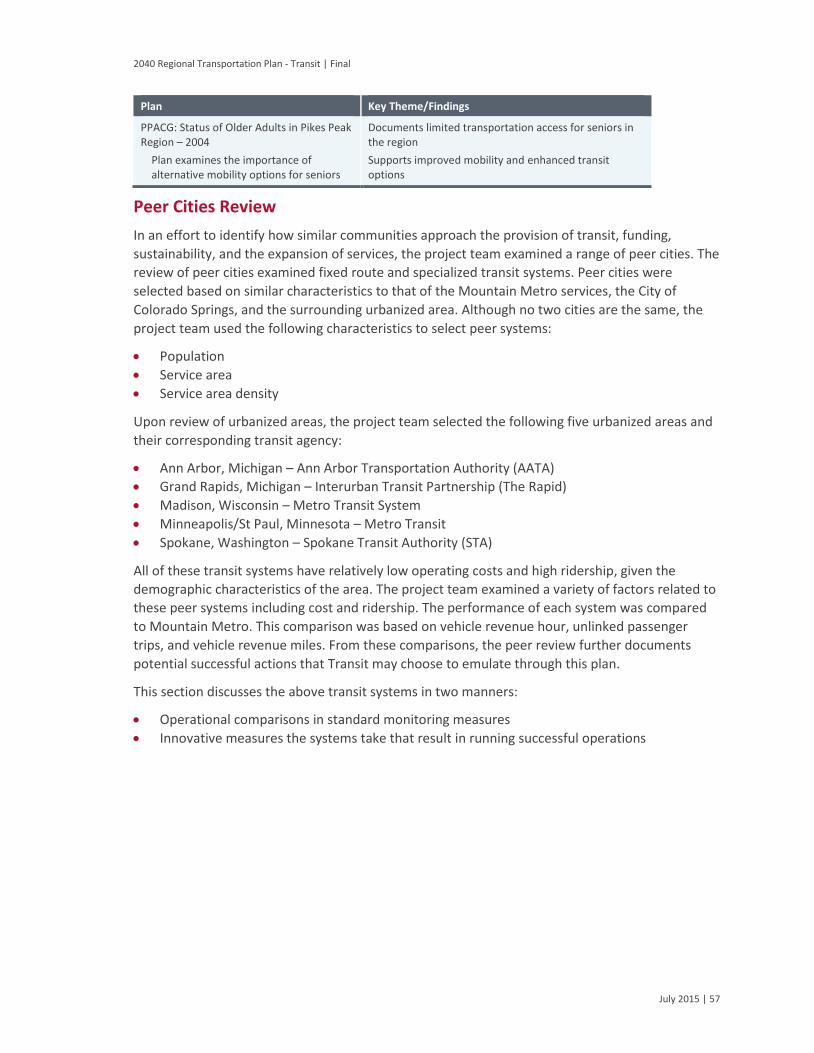
2040 Regional Transportation Plan - Transit | Final
July 2015 | 57
Plan Key Theme/Findings
PPACG: Status of Older Adults in Pikes Peak Region – 2004
Plan examines the importance of alternative mobility options for seniors
Documents limited transportation access for seniors in the region
Supports improved mobility and enhanced transit options
Peer Cities Review
In an effort to identify how similar communities approach the provision of transit, funding,
sustainability, and the expansion of services, the project team examined a range of peer cities. The
review of peer cities examined fixed route and specialized transit systems. Peer cities were
selected based on similar characteristics to that of the Mountain Metro services, the City of
Colorado Springs, and the surrounding urbanized area. Although no two cities are the same, the
project team used the following characteristics to select peer systems:
Population
Service area
Service area density
Upon review of urbanized areas, the project team selected the following five urbanized areas and
their corresponding transit agency:
Ann Arbor, Michigan – Ann Arbor Transportation Authority (AATA)
Grand Rapids, Michigan – Interurban Transit Partnership (The Rapid)
Madison, Wisconsin – Metro Transit System
Minneapolis/St Paul, Minnesota – Metro Transit
Spokane, Washington – Spokane Transit Authority (STA)
All of these transit systems have relatively low operating costs and high ridership, given the
demographic characteristics of the area. The project team examined a variety of factors related to
these peer systems including cost and ridership. The performance of each system was compared
to Mountain Metro. This comparison was based on vehicle revenue hour, unlinked passenger
trips, and vehicle revenue miles. From these comparisons, the peer review further documents
potential successful actions that Transit may choose to emulate through this plan.
This section discusses the above transit systems in two manners:
Operational comparisons in standard monitoring measures
Innovative measures the systems take that result in running successful operations
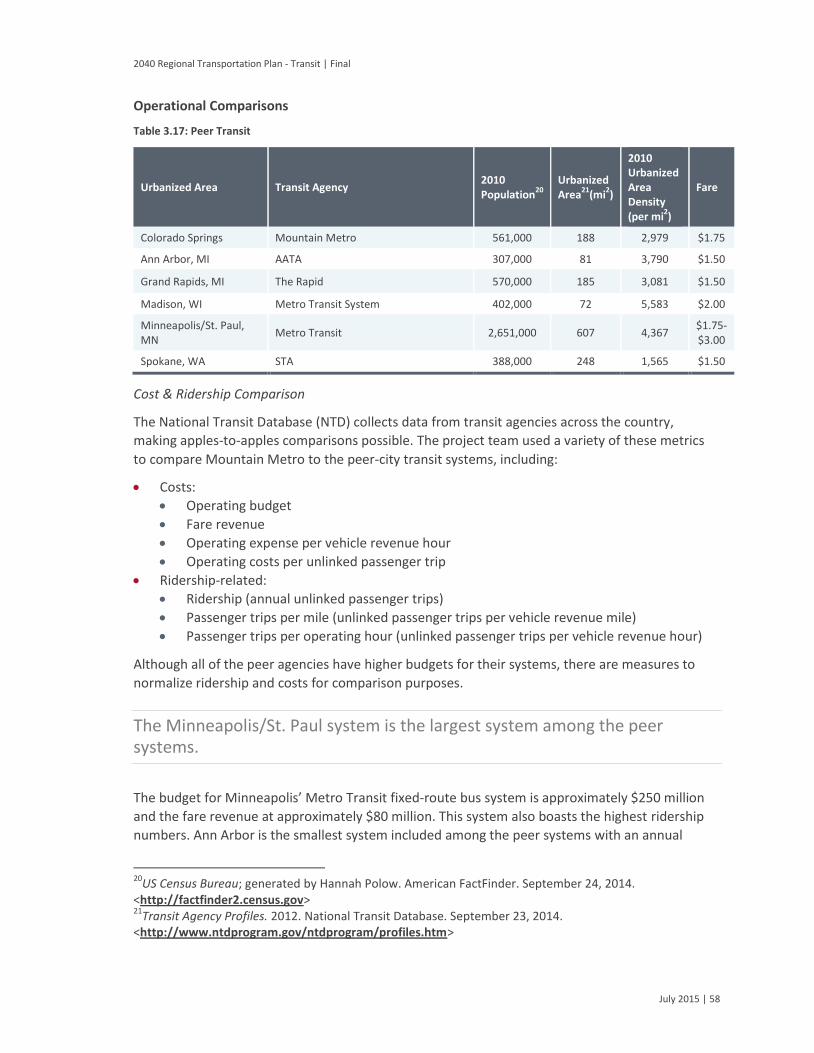
2040 Regional Transportation Plan - Transit | Final
July 2015 | 58
Operational Comparisons
Table 3.17: Peer Transit
Urbanized Area Transit Agency 2010 Population
20
Urbanized Area
21(mi
2)
2010 Urbanized Area Density (per mi
2)
Fare
Colorado Springs Mountain Metro 561,000 188 2,979 $1.75
Ann Arbor, MI AATA 307,000 81 3,790 $1.50
Grand Rapids, MI The Rapid 570,000 185 3,081 $1.50
Madison, WI Metro Transit System 402,000 72 5,583 $2.00
Minneapolis/St. Paul, MN
Metro Transit 2,651,000 607 4,367 $1.75-$3.00
Spokane, WA STA 388,000 248 1,565 $1.50
Cost & Ridership Comparison
The National Transit Database (NTD) collects data from transit agencies across the country,
making apples-to-apples comparisons possible. The project team used a variety of these metrics
to compare Mountain Metro to the peer-city transit systems, including:
Costs:
Operating budget
Fare revenue
Operating expense per vehicle revenue hour
Operating costs per unlinked passenger trip
Ridership-related:
Ridership (annual unlinked passenger trips)
Passenger trips per mile (unlinked passenger trips per vehicle revenue mile)
Passenger trips per operating hour (unlinked passenger trips per vehicle revenue hour)
Although all of the peer agencies have higher budgets for their systems, there are measures to
normalize ridership and costs for comparison purposes.
The Minneapolis/St. Paul system is the largest system among the peer systems.
The budget for Minneapolis’ Metro Transit fixed-route bus system is approximately $250 million
and the fare revenue at approximately $80 million. This system also boasts the highest ridership
numbers. Ann Arbor is the smallest system included among the peer systems with an annual
20US Census Bureau; generated by Hannah Polow. American FactFinder. September 24, 2014.
<http://factfinder2.census.gov> 21
Transit Agency Profiles. 2012. National Transit Database. September 23, 2014. <http://www.ntdprogram.gov/ntdprogram/profiles.htm>
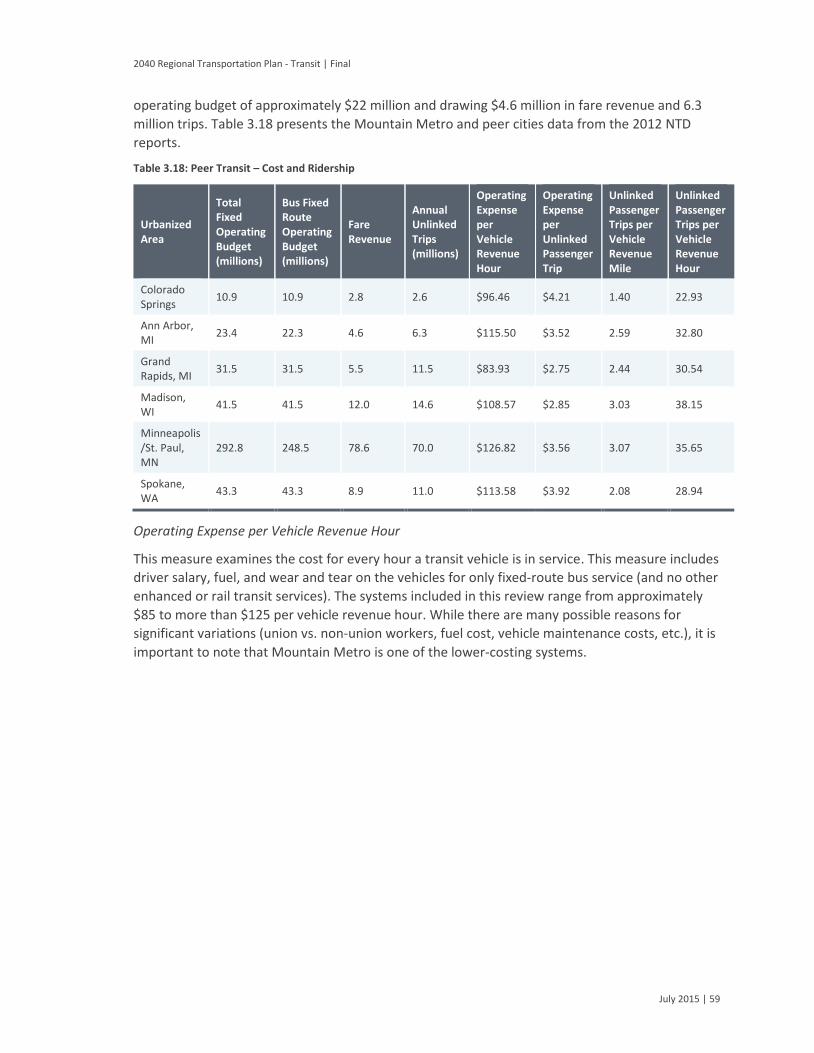
2040 Regional Transportation Plan - Transit | Final
July 2015 | 59
operating budget of approximately $22 million and drawing $4.6 million in fare revenue and 6.3
million trips. Table 3.18 presents the Mountain Metro and peer cities data from the 2012 NTD
reports.
Table 3.18: Peer Transit – Cost and Ridership
Urbanized Area
Total Fixed Operating Budget (millions)
Bus Fixed Route Operating Budget (millions)
Fare Revenue
Annual Unlinked Trips (millions)
Operating Expense per Vehicle Revenue Hour
Operating Expense per Unlinked Passenger Trip
Unlinked Passenger Trips per Vehicle Revenue Mile
Unlinked Passenger Trips per Vehicle Revenue Hour
Colorado Springs
10.9 10.9 2.8 2.6 $96.46 $4.21 1.40 22.93
Ann Arbor, MI
23.4 22.3 4.6 6.3 $115.50 $3.52 2.59 32.80
Grand Rapids, MI
31.5 31.5 5.5 11.5 $83.93 $2.75 2.44 30.54
Madison, WI
41.5 41.5 12.0 14.6 $108.57 $2.85 3.03 38.15
Minneapolis /St. Paul, MN
292.8 248.5 78.6 70.0 $126.82 $3.56 3.07 35.65
Spokane, WA
43.3 43.3 8.9 11.0 $113.58 $3.92 2.08 28.94
Operating Expense per Vehicle Revenue Hour
This measure examines the cost for every hour a transit vehicle is in service. This measure includes
driver salary, fuel, and wear and tear on the vehicles for only fixed-route bus service (and no other
enhanced or rail transit services). The systems included in this review range from approximately
$85 to more than $125 per vehicle revenue hour. While there are many possible reasons for
significant variations (union vs. non-union workers, fuel cost, vehicle maintenance costs, etc.), it is
important to note that Mountain Metro is one of the lower-costing systems.

2040 Regional Transportation Plan - Transit | Final
July 2015 | 60
Figure 3.39: Operating Expense per Vehicle Revenue Hour
Operating Expense per Unlinked Passenger Trip
Ridership is an important measure of efficiency for any transit system. This value is calculated by
NTD using the total operating expense divided by the number of unlinked passenger trips. This
measure is important because it tells the project team how much it costs the agency to provide a
trip. The Grand Rapids system has the lowest operating expense per unlinked trip, at
approximately $2.75 per trip. Mountain Metro operating costs per trip is slightly more than $4.00;
the peer systems included in this analysis fall under the $4.00 mark.

2040 Regional Transportation Plan - Transit | Final
July 2015 | 61
Figure 3.40: Operating Expense per Unlinked Passenger Trip
Unlinked Passenger Trips per Vehicle Revenue Hour
This measure examines the trips per vehicle revenue hour for the systems included in this analysis.
The project team included this measure in the analysis to understand how many trips per hour
each system carries, even though they are very different systems.
The Madison system boasts the highest number of passenger trips per hour at more than 35 passenger trips per hour.
All of the peer systems carry more trips per hour than the Colorado Springs system—in general,
close to 30 unlinked passenger trips per hour.
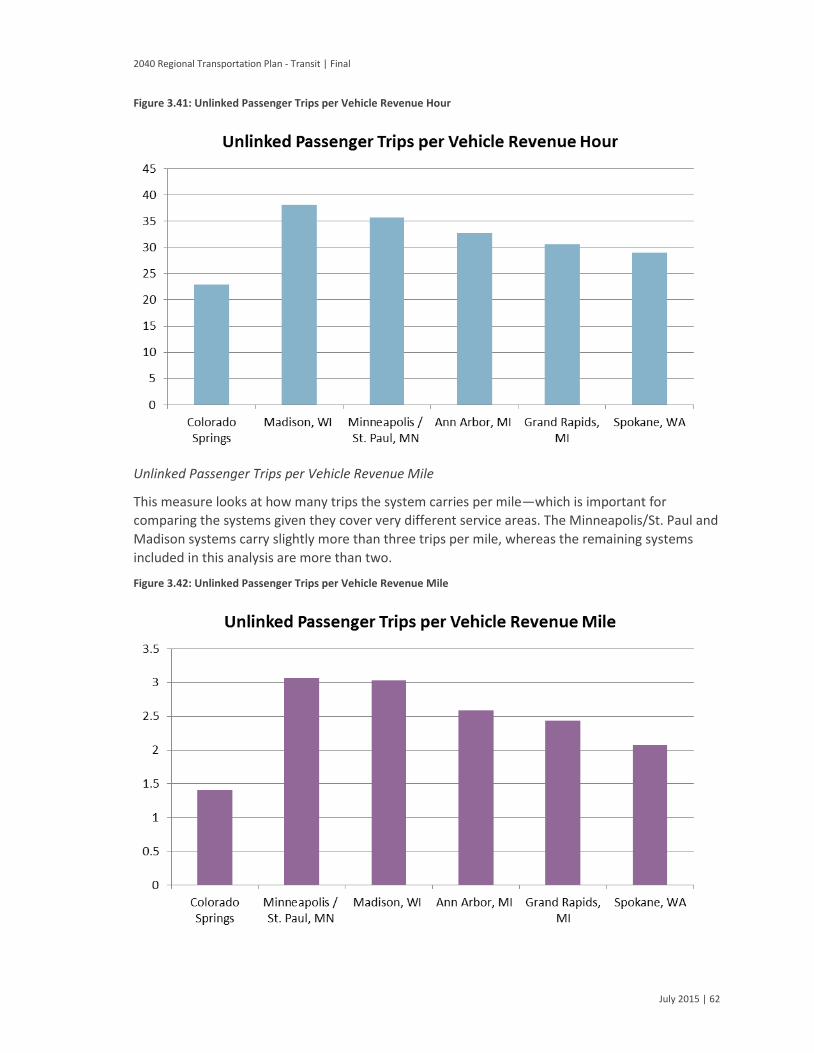
2040 Regional Transportation Plan - Transit | Final
July 2015 | 62
Figure 3.41: Unlinked Passenger Trips per Vehicle Revenue Hour
Unlinked Passenger Trips per Vehicle Revenue Mile
This measure looks at how many trips the system carries per mile—which is important for
comparing the systems given they cover very different service areas. The Minneapolis/St. Paul and
Madison systems carry slightly more than three trips per mile, whereas the remaining systems
included in this analysis are more than two.
Figure 3.42: Unlinked Passenger Trips per Vehicle Revenue Mile
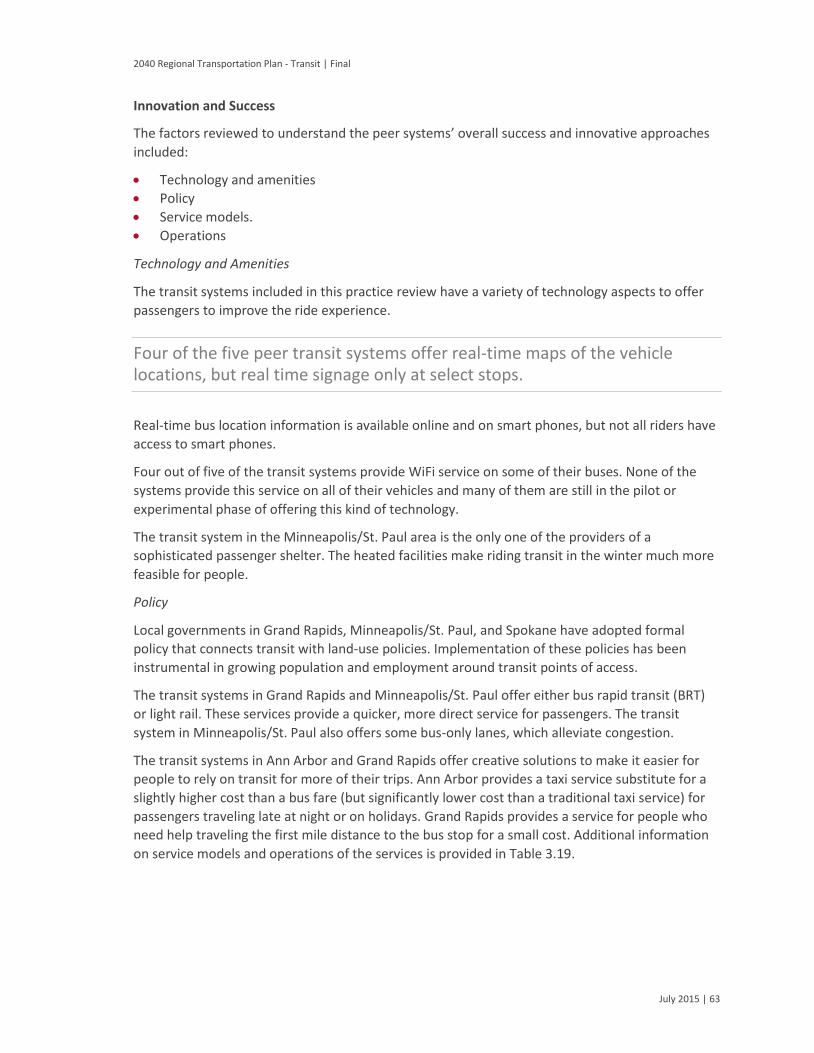
2040 Regional Transportation Plan - Transit | Final
July 2015 | 63
Innovation and Success
The factors reviewed to understand the peer systems’ overall success and innovative approaches
included:
Technology and amenities
Policy
Service models.
Operations
Technology and Amenities
The transit systems included in this practice review have a variety of technology aspects to offer
passengers to improve the ride experience.
Four of the five peer transit systems offer real-time maps of the vehicle locations, but real time signage only at select stops.
Real-time bus location information is available online and on smart phones, but not all riders have
access to smart phones.
Four out of five of the transit systems provide WiFi service on some of their buses. None of the
systems provide this service on all of their vehicles and many of them are still in the pilot or
experimental phase of offering this kind of technology.
The transit system in the Minneapolis/St. Paul area is the only one of the providers of a
sophisticated passenger shelter. The heated facilities make riding transit in the winter much more
feasible for people.
Policy
Local governments in Grand Rapids, Minneapolis/St. Paul, and Spokane have adopted formal
policy that connects transit with land-use policies. Implementation of these policies has been
instrumental in growing population and employment around transit points of access.
The transit systems in Grand Rapids and Minneapolis/St. Paul offer either bus rapid transit (BRT)
or light rail. These services provide a quicker, more direct service for passengers. The transit
system in Minneapolis/St. Paul also offers some bus-only lanes, which alleviate congestion.
The transit systems in Ann Arbor and Grand Rapids offer creative solutions to make it easier for
people to rely on transit for more of their trips. Ann Arbor provides a taxi service substitute for a
slightly higher cost than a bus fare (but significantly lower cost than a traditional taxi service) for
passengers traveling late at night or on holidays. Grand Rapids provides a service for people who
need help traveling the first mile distance to the bus stop for a small cost. Additional information
on service models and operations of the services is provided in Table 3.19.

2040 Regional Transportation Plan - Transit | Final
July 2015 | 64
Table 3.19: Successful Contributors from Peer Cities
Urbanized Area
Technology Policy Service Models Operations
Ann Arbor, MI
Real-time map
Find nearby stops with address finder
22
Late-night taxi service in lieu of transit service
23
Shared-ride taxi service when normal services do not operate23
Intelligent Transportation Systems (ITS)
Discounted passes for employees and college students
24
Grand Rapids, MI
Real-time map
Wifi on BRT
Real time signage on BRT
Transit oriented development overlay districts
Guide development to transit corridors
Service from door to closest bus stop
25
BRT line (Silver Line)
Pre-paid boarding for BRT
3 bike racks per vehicle
Subsidized college pass26
Madison, WI Real-time map
Wifi on two types of buses
Automatic payment card27
Discounted passes for employees and college students
28
Minneapolis/St Paul, MN
Real-time map
Real time signage at select park and ride facilities and transit centers
29
Heated shelters on transit corridor
Plan for sustainable growth
30
Free ride bus with service between two light rail lines (and through downtown)
31
Bus rapid transit and light rail service
32
Discounted passes for jobseekers
33 and the
homeless34
Automatic and discounted payment card
35
Passes available for purchase at retailers
35 Discounted passes
for employees and high school/college students
36
Bus only lanes on transit corridor
37
22Schedules, Maps & Tools. 2014. Ann Arbor Area Transportation Authority. Web. October 22, 2014.
<http://www.theride.org/SchedulesMapsTools/tabid/62/ctl/InteractiveMap/mid/2257/Default.aspx#FindAStop> 23
Holiday & Late Night Service. 2014. Ann Arbor Area Transportation Authority. Web. October 22, 2014. <http://www.theride.org/Services/HolidayLateNightService> 24
Employer Programs and Services. 2014. Ann Arbor Area Transportation Authority. Web. October 22, 2014. <http://www.theride.org/Services/EmployerProgramsandServices> 25
PASS. The Rapid. Web. October 22, 2014. <https://www.ridetherapid.org/additionalservices/pass> 26
College Information. The Rapid. Web. October 22, 2014. <https://www.ridetherapid.org/howtoride/collegeinformation> 27
Metro Commute Card. 2014. City of Madison. Web. October 22, 2014. <https://www.cityofmadison.com/metro/fares/commuteCard.cfm> 28
Metro Pass Program. 2014. City of Madison. Web. October 22, 2014. <https://www.cityofmadison.com/metro/fares/PassPrograms/index.cfm> 29
NexTrip Real-Time Bus Departures. 2014. Metro Transit. Web. October 22, 2014. <https://www.metrotransit.org/real-time-bus-departures> 30
Chapter 2: Transportation of Minneapolis Plan. 2009. City of Minneapolis. Web. October 22, 2014. <http://www.ci.minneapolis.mn.us/www/groups/public/@cped/documents/webcontent/convert_277813.pdf>31
Ride free, ride green along Nicollet Mall. 2014. Metro Transit. Web. October 22, 2014. <https://www.metrotransit.org/ride-free-on-nicollet-mall> 32
Metro System. 2014. Metro Transit. Web. October 22, 2014. <https://www.metrotransit.org/metro-system>

2040 Regional Transportation Plan - Transit | Final
July 2015 | 65
Urbanized Area
Technology Policy Service Models Operations
Spokane, WA
Wifi on articulated buses
38
Transit oriented policies in comprehensive plan
39
Automatic payment card40
Discounted passes for employees
41
33Job Seekers. 2014. Metro Transit. Web. October 22, 2014. <https://www.metrotransit.org/jobseekers>
34Discounted Fares for Agencies Serving the Homeless. 2014. Metro Transit. Web. October 22, 2014.
<https://www.metrotransit.org/eligiblecharitableorg> 35
Go-To Cards. 2014. Metro Transit. Web. October 22, 2014. <https://www.metrotransit.org/go-to-card> 36
Passes. 2014. Metro Transit. Web. October 22, 2014. <https://www.metrotransit.org/passes> 37
World-class express bus service on Marq2. 2014. Metro Transit. Web. October 22, 2014. <https://www.metrotransit.org/marquette-and-2nd-avenues> 38
Wireless Internet on Articulated Buses. Spokane Transit. Web. October 22, 2014. <http://www.spokanetransit.com/ride-sta/view/wireless-internet-on-articulated-buses> 39
Chapter 2 – Urban Land Use Planning Principles. Spokane County. Web. October 22, 2014. <http://www.spokanecounty.org/bp/data/Documents/CompPlan/Chapter2.pdf> 40
Smart Cards. Spokane Transit. Web. October 22, 2014. <http://www.spokanetransit.com/fares-passes/view/smart-cards/> 41
Employer Sponsored Bus Pass Program. Spokane Transit. Web. October 22, 2014. <http://www.spokanetransit.com/fares-passes/view/employer-sponsored-bus-pass-program>

2040 Regional Transportation Plan - Transit | Final
July 2015 | 66
4 Stakeholder Involvement Purpose
A thoughtful stakeholder outreach and involvement approach served as an important component
of this planning process. Input from community members, especially those who utilize the transit
system or would like to, was critical to identify system needs and develop refined
recommendations to address those needs.
The overall aim of the outreach process was to build broad public support for the plans to assist in implementation.
The following sections provide an overview of the stakeholder involvement process, including
details on the key themes collected that helped to guide the development of the plan.
Stakeholder Involvement Strategy
Early in the project, the team developed a stakeholder involvement strategy to ensure input was
received and incorporated into the development of the potential transit improvements. The
development of the stakeholder involvement strategy was predicated on the following broader
goals and objectives for public participation:
Share information on the:
Overall planning process and opportunities for participation
Current state of transit in the PPACG area
Possibilities for transit in the future include the identification of projects for both fiscally
constrained (expenditures equal available funding) and vision plans
Provide a wide range of stakeholders multiple ways for participating in the planning process.
Obtain input to fully understand the current system, including what is working well, areas for
improvement, and external challenges and opportunities that need to be considered.
Obtain continual guidance for the direction of the Transit Plan
Obtain input to help refine recommendations
Stakeholder Involvement Activities
Public involvement activities were planned at key points during the planning process to fully
realize the goals and objectives for stakeholder participation.

2040 Regional Transportation Plan - Transit | Final
July 2015 | 67
These activities worked to promote ongoing communication among stakeholders, decision-makers, and transit planners.
Steering Committee (see the Executive Summary and Introduction for membership) members
were invited to be a part of the process because they have expertise on transit and specialized
transportation-related issues and represent a larger constituency. The Steering Committee met
four times:
Steering Committee meeting #1 – This meeting provided an introduction for members. The
group reviewed and refined the expectations of the Steering Committee and concurred with
the project process and schedule. The Committee members identified key strengths,
weaknesses, opportunities and challenges (SWOC) of the existing transit and specialized
transportation systems. This information provided a common understanding to begin the
planning process and engagement with public stakeholders.
Steering Committee meeting #2 – The Committee reviewed and refined the guiding themes
and the evaluation process. The guiding themes provided a framework for the development
of potential improvements for consideration by the broader public stakeholders.
Steering Committee meeting #3 – The Committee reviewed and refined the
recommendations prior to their presentation at a community meeting.
Steering Committee meeting #4 – The Committee provided final feedback on the
prioritization of recommendations (i.e., near-, mid- and long-term) and cost estimates. The
Committee also discussed next steps including what members can do to ensure the plan is
implementable.
Community Mobility Review
Input was collected at the beginning of the process to develop a refined understanding of the
public transit system – its strengths, weaknesses, and external opportunities and challenges.
To kick off the community transit review, the team conducted one-on-one discussions with 15 representatives from the Steering Committee organizations.
The goal of these discussions was to gain individual perspectives on the current provision of
transit and specialized transportation in the PPACG area. In addition, three focus groups were held
on June 20, 2014 with system users and others affected by the availability of transit and
specialized transportation. The participants invited to the focus group meeting included:
Seniors
Young professionals
Representatives of organizations serving low-income and minority groups
Members of the business and development community
Representatives of large employers and other activity centers (shopping, etc.)
Representatives from local schools and universities

2040 Regional Transportation Plan - Transit | Final
July 2015 | 68
Specialized transportation service providers
Themes from all of the conversations were documented and incorporated into the project’s
transit audit, and shared via the project website.
Project Website
A unique project website was developed to educate stakeholders and provide opportunities for
online input.
http://www.movingforwardplan.org/transit-and-specialized-transportation-plans/
The website provided an overview of the purpose of the Transit Plan and the multiple mechanisms
to actively participate in the plan’s development. The website was linked through the 2040
Regional Transportation Plan (Moving Forward Plan) to demonstrate the Transit and Specialized
Transportation Coordination plans connection to the regional transportation planning process.
The website was continually updated with new information and documents (such as presentations and summaries from Steering Committee and community meetings).
The website included online versions of the two project questionnaires to allow simple submittal
of stakeholder comments. Contact information including an e-mail address and phone number to
reach project team members was provided for ongoing comments and questions.
Community Meetings and Questionnaires
Two community meetings were held on August 28thand November 19th of 2014. Approximately 37
community members attended the August meeting and more than 20 at the second. Both
meetings involved a presentation and a full group question and answer period. Open house
sessions before and after each main presentation provided stakeholders the opportunity to
engage directly with the project team and provide feedback. Stakeholders participated by:
Responding to key questions by writing notes and comments directly onto the flip charts used
during the session
Completing a project questionnaires
Sharing input directly with project representatives
Social media was used to provide information and gather input during the sessions to ensure
community members that were unable to attend could ask questions via Twitter. A sign language
interpreter was provided at each of the community meetings. The presentations meetings were
documented on film and published on the project website for broader review by public
stakeholders.
The first community meeting was to inform public stakeholders about the purpose and goals of
the plans and the guiding themes that would inform future recommendations. Participants were
asked to provide input on whether the guiding themes were appropriate, including any positive or
negative impacts that should be considered.
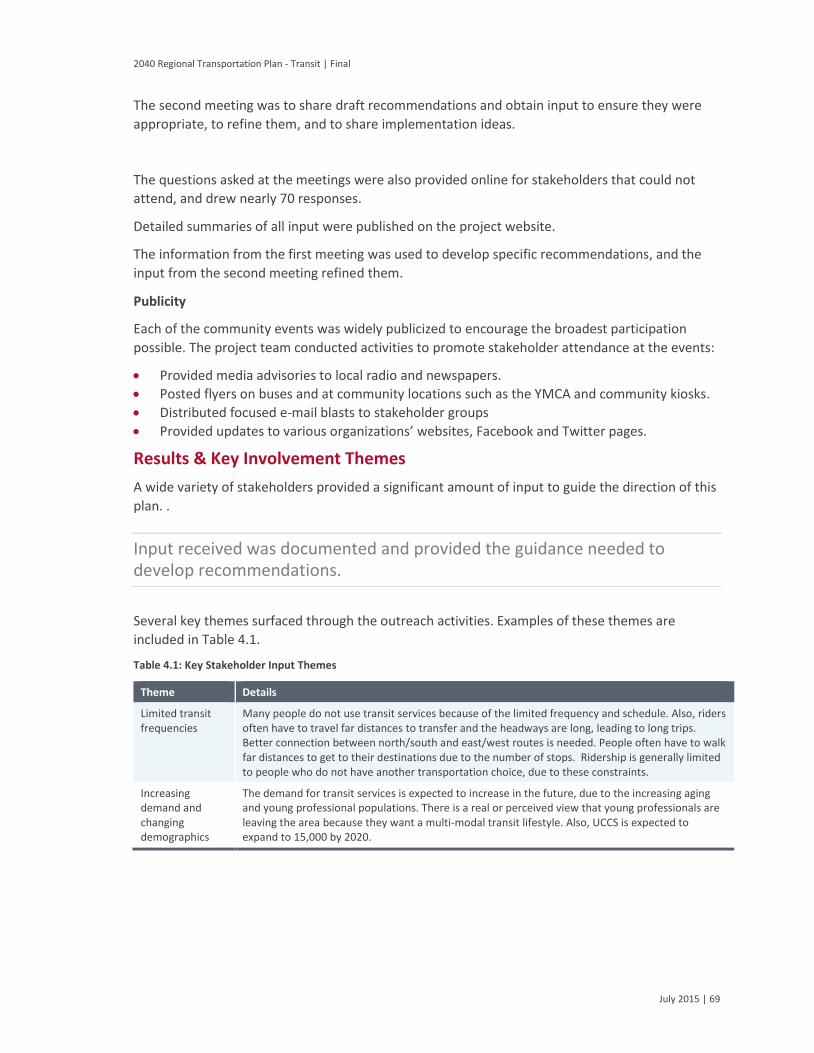
2040 Regional Transportation Plan - Transit | Final
July 2015 | 69
The second meeting was to share draft recommendations and obtain input to ensure they were
appropriate, to refine them, and to share implementation ideas.
The questions asked at the meetings were also provided online for stakeholders that could not
attend, and drew nearly 70 responses.
Detailed summaries of all input were published on the project website.
The information from the first meeting was used to develop specific recommendations, and the
input from the second meeting refined them.
Publicity
Each of the community events was widely publicized to encourage the broadest participation
possible. The project team conducted activities to promote stakeholder attendance at the events:
Provided media advisories to local radio and newspapers.
Posted flyers on buses and at community locations such as the YMCA and community kiosks.
Distributed focused e-mail blasts to stakeholder groups
Provided updates to various organizations’ websites, Facebook and Twitter pages.
Results & Key Involvement Themes
A wide variety of stakeholders provided a significant amount of input to guide the direction of this
plan. .
Input received was documented and provided the guidance needed to develop recommendations.
Several key themes surfaced through the outreach activities. Examples of these themes are
included in Table 4.1.
Table 4.1: Key Stakeholder Input Themes
Theme Details
Limited transit frequencies
Many people do not use transit services because of the limited frequency and schedule. Also, riders often have to travel far distances to transfer and the headways are long, leading to long trips. Better connection between north/south and east/west routes is needed. People often have to walk far distances to get to their destinations due to the number of stops. Ridership is generally limited to people who do not have another transportation choice, due to these constraints.
Increasing demand and changing demographics
The demand for transit services is expected to increase in the future, due to the increasing aging and young professional populations. There is a real or perceived view that young professionals are leaving the area because they want a multi-modal transit lifestyle. Also, UCCS is expected to expand to 15,000 by 2020.
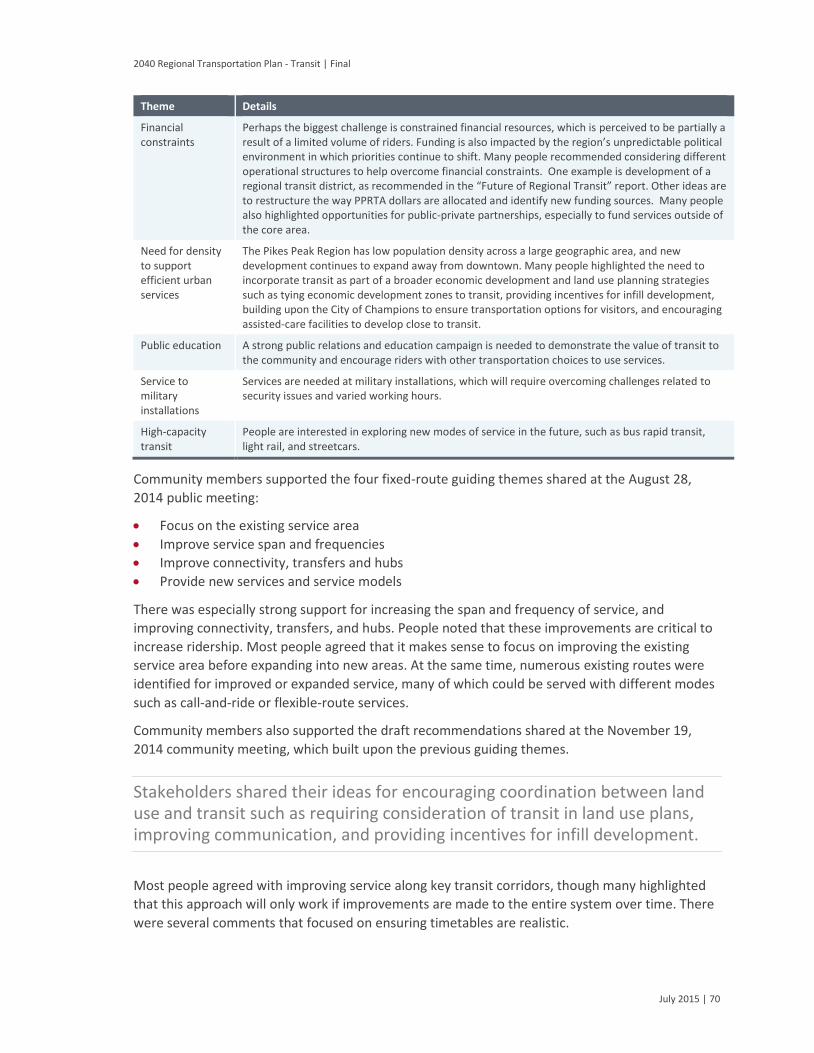
2040 Regional Transportation Plan - Transit | Final
July 2015 | 70
Theme Details
Financial constraints
Perhaps the biggest challenge is constrained financial resources, which is perceived to be partially a result of a limited volume of riders. Funding is also impacted by the region’s unpredictable political environment in which priorities continue to shift. Many people recommended considering different operational structures to help overcome financial constraints. One example is development of a regional transit district, as recommended in the “Future of Regional Transit” report. Other ideas are to restructure the way PPRTA dollars are allocated and identify new funding sources. Many people also highlighted opportunities for public-private partnerships, especially to fund services outside of the core area.
Need for density to support efficient urban services
The Pikes Peak Region has low population density across a large geographic area, and new development continues to expand away from downtown. Many people highlighted the need to incorporate transit as part of a broader economic development and land use planning strategies such as tying economic development zones to transit, providing incentives for infill development, building upon the City of Champions to ensure transportation options for visitors, and encouraging assisted-care facilities to develop close to transit.
Public education A strong public relations and education campaign is needed to demonstrate the value of transit to the community and encourage riders with other transportation choices to use services.
Service to military installations
Services are needed at military installations, which will require overcoming challenges related to security issues and varied working hours.
High-capacity transit
People are interested in exploring new modes of service in the future, such as bus rapid transit, light rail, and streetcars.
Community members supported the four fixed-route guiding themes shared at the August 28,
2014 public meeting:
Focus on the existing service area
Improve service span and frequencies
Improve connectivity, transfers and hubs
Provide new services and service models
There was especially strong support for increasing the span and frequency of service, and
improving connectivity, transfers, and hubs. People noted that these improvements are critical to
increase ridership. Most people agreed that it makes sense to focus on improving the existing
service area before expanding into new areas. At the same time, numerous existing routes were
identified for improved or expanded service, many of which could be served with different modes
such as call-and-ride or flexible-route services.
Community members also supported the draft recommendations shared at the November 19,
2014 community meeting, which built upon the previous guiding themes.
Stakeholders shared their ideas for encouraging coordination between land use and transit such as requiring consideration of transit in land use plans, improving communication, and providing incentives for infill development.
Most people agreed with improving service along key transit corridors, though many highlighted
that this approach will only work if improvements are made to the entire system over time. There
were several comments that focused on ensuring timetables are realistic.

2040 Regional Transportation Plan - Transit | Final
July 2015 | 71
There were few comments regarding specific new service areas, with the exception of supporting
growth on the east side of the region.
Participants expressed the need to provide accessibility for people with disabilities to use the
fixed-route system rather than need to rely on specialized transportation. This included ensuring
there is sufficient sidewalk infrastructure and bus stop amenities such as shelter from the
elements.
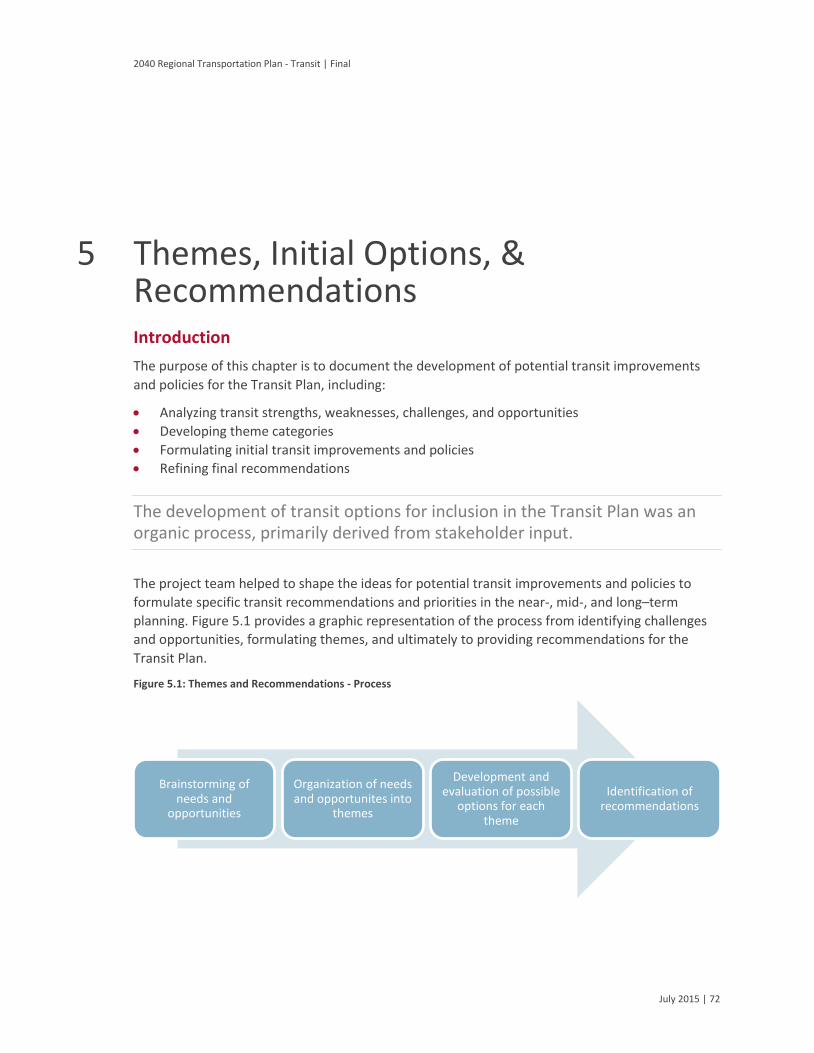
2040 Regional Transportation Plan - Transit | Final
July 2015 | 72
5 Themes, Initial Options, & Recommendations Introduction
The purpose of this chapter is to document the development of potential transit improvements
and policies for the Transit Plan, including:
Analyzing transit strengths, weaknesses, challenges, and opportunities
Developing theme categories
Formulating initial transit improvements and policies
Refining final recommendations
The development of transit options for inclusion in the Transit Plan was an organic process, primarily derived from stakeholder input.
The project team helped to shape the ideas for potential transit improvements and policies to
formulate specific transit recommendations and priorities in the near-, mid-, and long–term
planning. Figure 5.1 provides a graphic representation of the process from identifying challenges
and opportunities, formulating themes, and ultimately to providing recommendations for the
Transit Plan.
Figure 5.1: Themes and Recommendations - Process
Brainstorming of needs and
opportunities
Organization of needs and opportunites into
themes
Development and evaluation of possible
options for each theme
Identification of recommendations

2040 Regional Transportation Plan - Transit | Final
July 2015 | 73
The project team engaged with key stakeholders early in the process to understand the current
strengths, weaknesses, challenges, and opportunities associated with transit service within the
study area.
The scoping of ideas was documented through the initial meeting of the project’s Steering Committee and the first open-house public meeting.
Examples of the transit strengths, weaknesses, challenges, and opportunities identified by
stakeholders are included in Table 5.1.
Table 5.1: Example Stakeholder Brainstorming Results
Example Brainstorming Results
Strengths – Current positive points of the existing services
Transit is resilient and is managing limited resources as effectively as possible (especially given significantreductions)
Effective services are provided by Fountain Municipal Transit
The bus fleet is clean and well-maintained
Drivers are generally professional, courteous, and well trained
Weaknesses – Current negative points of the existing services
Transit is faced with significant financial constraints
Service frequencies and operating hours do not meet the needs of riders
The limited growth in ridership makes funding more challenging (and vice versa)
Multiple routes could be more strategically located to support better overall mobility and increase ridership
Improvements are needed to better time transfers between routes
Better connectivity to bus stops (pedestrian and cyclists) and better accommodation of cyclists is needed
Challenges – Potential barriers to improvement of services now and in the future
Public transportation services do not appear to be a high priority for the region
Funding challenges are one of the largest barriers A combination of political dynamics, funding instability,diminishing federal funding, and competing annually for local funding needs present a significant challenge
The current system is likely not capable of addressing future demand given future population increases
The region’s low density and continued trend toward suburban development is challenging (and expensive) toserve with transit
There is a real or perceived view that young professionals are leaving the area because they want a multi-modaltransit lifestyle
The region’s wide range of stakeholders creates difficulties building consensus on funding and operating transit
Opportunities – Potential ideas, project, or policies to improve the overall services now and in the longer term

2040 Regional Transportation Plan - Transit | Final
July 2015 | 74
Example Brainstorming Results
Increase collaboration among organizations to better understand riders’ needs (military, universities, etc.) and todevelop creative partnership opportunities
View transit as essential to economic development and encourage more strategic land-use planning (economicdevelopment zones with transit, infill incentives, City for Champions, etc.)
Consider different operational structures to develop a shared regional system
Develop a stronger community education campaign (education, military, etc.)
Consider new modes of transit such as bus rapid transit (BRT), light rail, etc. for high-capacity transit corridors
Prioritize connectivity for military and military employees (as some of the largest employment centers)
Consider incentives to military installations such as prioritizing dedicated carpool and transit gates and utilizing the military mass transit benefits, etc.
The strengths, weaknesses, challenges, and opportunities were analyzed and used to develop
themes for potential projects or policy improvements. These themes were used throughout the
planning process to categorize the ideas, policies, and potential projects considered for inclusion
in the Transit Plan. The themes formulated by the stakeholders included:
Theme 1: Focus on the Existing Service Area
This theme involves focusing resources on improving services within the current service area
before extending new services outside the boundaries.
Theme 2: Improve Service Hours and Frequencies.
The focus of this theme is to provide longer service hours and higher frequencies to better serve
existing and future riders.
Theme 3: Improve Connectivity, Transfers, and Hubs.
The goal of this theme is to create a more seamless journey for riders by improving timed
transfers and limiting the number of transfers and out-of-direction journey time needed to reach
key destinations.
Theme 4: New Service and New Service Models.
This theme examines the need to expand beyond the existing service area and focuses on new
service models and funding options to meet the needs of lower-density outlying areas.
Themes & Initial Options
The following sections provide additional background on each of the key themes generated
through engagement with stakeholders. Each theme formed the basis for development of the
initial options, which are presented as improvements to transit or potential new policies
supporting transit in the near-, mid-, and long-term future.
Theme 1: Focus on the Existing Service Area
The 2009 economic downturn dramatically impacted Transit. The resulting changes to Mountain
Metro service included reducing the geographic area of service, reducing the frequency of service,
and eliminating longer-distance services.

2040 Regional Transportation Plan - Transit | Final
July 2015 | 75
The service area has remained fairly static since the 2009 budget reductions. Service ranges from
the Briargate area in the north to the Security-Widefield and PPCC areas in the south; the eastern
limits are along the Powers Boulevard corridor and the Constitution Hills area, and the western
edge of the Mountain Metro service area extends into Manitou Springs.
The 2014 transit system provides a base level of service, with buses running at 30- to 60-minute
frequencies. Major priorities are to improve the span of service hours and bus frequencies, and to
improve connections to areas currently served by transit:
Build on the current ridership base
Encourage greater land use intensification
Promote more walkable communities
Capture more transit riders
Previous studies and public input recommended to expand the service area back to pre-2009
service levels and to expand to serve new-growth areas. However, the geographic expansion of
services would:
Continue to spread the system’s resources too thin
Create challenges to maintain base levels of service
Encourage auto-oriented development
Reduce the cost effectiveness of services
Focusing within the existing service area is therefore preferred; to concentrating services in
transit-supportive areas that are aligned with transit-oriented land-use policies will provide a
greater benefit to the community.
There are opportunities within the existing service area to encourage increased density that will support transit and improve service over time.
Encouraging higher-density development and mixed land uses along major transit corridors
provide opportunities for:
Improved walkability
Increased street animation and vibrancy
Rebalancing the needs of all transportation modes (i.e. improved cycling options)
Because of the symbiotic relationship between transit and land use, supporting mixed-use infill
development and dense residential neighborhoods will help improve transit ridership over time.
Increased transit ridership allows Transit to increase services, which improves the competitiveness
of public transit as a mode of travel. Improving transit services increases the accessibility of, and
therefore the desirability of, the areas it serves, leading to further redevelopment and
intensification. The two together create a positive feedback loop towards developing a more
transit-supportive community.
There are some policies already in place that support this positive feedback loop. For instance, the
2020 Colorado Springs Comprehensive Plan recognized the costs associated with improving the
transportation system and that the coordination of transportation and land use is key to reversing

2040 Regional Transportation Plan - Transit | Final
July 2015 | 76
the largely auto-dependent nature of the community. The plan identifies provisions for the
development of mixed-use activity centers that promote transit-oriented communities. However,
the details for supporting these activity centers have not been developed.
However, the plan does designate specific mature/redevelopment corridors—which are generally
existing retail corridors that offer opportunities to transform from exclusively auto-oriented places
to more mixed-use centers through infill and redevelopment. The specific corridors identified are
discussed in greater detail in Theme 2.
As part of the implementation of 2040 fixed-route transit planning recommendations, greater coordination between transportation and land use policies is fundamental to promoting the positive feedback loop.
Theme 2: Improve Service Hours and Frequencies
As discussed in Theme 1, coordination between transportation and land use policies is vital to
creating the desired symbiotic positive feedback loop that will encourage development of a more
transit-oriented community. Transit faced dramatic service reductions in response to fiscal
pressures. Given that the existing network operates at general basic levels of service (30 and 60-
minute frequencies during the weekday daytime), the preferred approach is to:
Strengthen the current system first
Build on the current ridership base and capture more riders
Promote a more human-scaled, denser and walkable urban form—the key conditions to initiate a
positive feedback cycle towards improved transit.
The land use map (updated January 2014) for the 2020 Colorado Springs Comprehensive Plan
identifies a number of mature/redevelopment corridors. These are older auto-oriented
commercial corridors that have greater potential for redevelopment to more mixed-use
developments. Examples of these corridors include Academy Boulevard, Nevada Avenue, and East
Platte Avenue.
Redevelopment, growth opportunities, and the needed transportation connections along these
corridors are also included in the 2035 Regional Transportation Plan Update (adopted, January
2012), which identifies these roadways as rapid transit corridors to provide improved frequency,
speed and service quality.
The future travel patterns assessment conducted for this plan further strengthened the need for
rapid transit along these same corridors including sections of:
Academy Boulevard
Nevada Avenue
Platte Avenue
US 24/Colorado Avenue
These corridors are within the traffic zones most traveled to in both the 2010 and 2040 time
frame. These routes are a focus for this plan and form ‘core corridors’ for future expansion. US 24
2040 Regional Transportation Plan - Transit | Final
July 2015 | 77
was one of the top ten most traveled zones in 2010. Other than Chapel Hills Mall area, the data
did not demonstrate high travel flows to traffic zones along the Woodmen Road corridor in 2.
Academy Boulevard, Nevada Avenue, Platte Avenue, and US 24/Colorado Avenue have been defined as core corridors, which are characterized as services with operating the high frequencies and wide service spans.
The Austin Bluffs Parkway/Garden of the Gods Road corridor is observed to provide important
east-west linkages to the Garden of the Gods commercial area, UCCS, and the Marketplace at
Austin Bluffs, while reinforcing core transit connections at North Nevada Avenue and North
Academy Boulevard.
Consistent with the direction of Transit’s recent Comprehensive Operational Analysis (2013), the
purpose of identifying these corridors is to develop a priority network of higher frequencies and a
wider service span as the system transitions to providing more “spontaneous use” services where
service frequencies (typically at four buses per hour or greater) allows for passengers to use
services without having to consult a schedule. Without a broader offering of services in off-peak
periods (e.g. weekday evenings, Saturdays, and Sundays), the system’s market will be largely
limited to users with “lifeline” needs.
A system like Mountain Metro requires a suite of services providing different roles. Core services,
while important in linking to major destinations in the service area, rely on a supporting network
that provides adequate service coverage within the existing service area—as a majority of
passengers do not begin or end their journey within walking distance to Core corridors. Thus, a
network of Intermediate corridors, have been identified to provide an improved level of service
coverage and frequency (at a lower priority than Core corridors) to provide the needed
connections to neighborhoods and destinations not close to Core Routes. Based on these route
classifications, a preferred route network concept was developed to provide direction on how the
proposed network would operate and guidance for improving service over time.
Theme 3: Improve Connectivity, Transfers and Hubs
Network Structure
To provide a service competitive to the automobile, it is important for agencies to create services
that minimize travel time for passengers. Aside from providing services that are quick and
frequent, it is also important to minimize the amount of transfers, because transfers affect the
total travel time of a passenger journey. Given the dispersed and low-density nature of the area’s
urban centers, passenger transfers are an inevitable part of many passenger trips. Thus it is
important to provide services that reduce overall passenger waiting time.
The current system operates based on a multi-hub route structure where services generally
converge around one primary hub (at the Downtown Terminal) as well as a series of transfer hubs,
including the Citadel Transfer Center, Voyager Parkway Transfer Center, PPCC, and Hancock Plaza.
The Downtown Terminal and the Citadel Transfer Center are the largest in the systems. Where
feasible, route schedules are coordinated to arrive at hub locations at specific clock face times to

2040 Regional Transportation Plan - Transit | Final
July 2015 | 78
reduce the amount of waiting time at transfers. Since current services operate every 30 to 60
minutes, this coordination is key to minimizing passenger travel times.
A number of stakeholder sessions discussed the feasibility of transitioning the system’s current
multi-hub route structure to a grid-based network. As discussed in the Comprehensive
Operational Analysis, the immediate opportunities for success of the system are primarily to
provide improved connections along Core and Intermediate corridors rather than widespread
areas. A transition to a grid-based system requires significant investment in service frequencies
across the entire service area for the system to operate effectively, given that the premise of a
grid-based system is that transfers would occur at all points where two or more routes intersect.
Thus, a grid-based system would need services (as discussed in Theme 2) that promote the
“spontaneous use” of services where services are frequent enough that allows passengers to not
have to organize trips around a transit schedule. While the ultimate goal is to shift to a modified
grid, Theme 2 identifies how priority corridors could improve services under the current structure
in the interim.
To continue to support increased ridership (in the interim) under a multi-hub route structure, it is important to continue to coordinate bus departure times that minimize passenger waiting times and to ensure that the transfer hubs are safe and comfortable for passengers.
This would ensure that the transfer hub facilities are well maintained, and include adequate
shelter from the elements, as well as seating and passenger information.
Connections with Intercity Services
Not only is it important to ensure that Mountain Metro services are well coordinated, it is equally
important to plan for a network that is well integrated with other services. The CDOT has made
progress on its Interregional Express Bus Plan, which proposes the operation of an intercity bus
service—branded as Bustang. Bustang service would board and alight passengers at strategic
points along I-25 in Colorado Springs including:
Tejon Park-and-Ride
Colorado Springs Downtown Transit Terminal (Kiowa St and Nevada Ave)
Woodmen Park-and-Ride
Monument Park-and-Ride
Service would be provided to and from these locations to various destinations in central Denver,
including Denver Union Station as the final stop. Services are geared more to a work commuting
market with five of seven trips operating during the weekday peak period towards Denver in the
morning and the reverse in the afternoon.
Given that the Downtown Transfer Station is the primary hub for transit services in Colorado
Springs, further consideration by CDOT should be made to provide improved connectivity to the
terminal and boost ridership opportunities for both services. Mountain Metro services should also
be coordinated where possible to accommodate convenient passenger transfers.
2040 Regional Transportation Plan - Transit | Final
July 2015 | 79
It is important to ensure that the Park-n-Ride facilities along I-25 are safe and well maintained to support the new Bustang service.
The new Bustang service was originally conceptualized in the CDOT’s Statewide Transit Plan. This
plan and others (Central Front Range Transit Plan and the Intercity and Regional Bus Network
Plan) provide a framework to support transit in the PPACG area, as well as enhance transit
services in the surrounding counties. While many of these areas are outside of the PPACG area
and not part of this plan directly, this plan does support the recommendations of these plans
aimed at enhancing mobility. Stronger transportation networks in surrounding counties, with links
to and from the PPACG area would only strengthen transit as a whole and contribute to the
success of this plan. Examples of some of the specific recommendations of CDOT’s plans that
contribute to the success of this plan include:
Providing regional service from Cripple Creek to Woodland Park to Colorado Springs; from
Canon City to Florence to Colorado Springs and between Colorado Springs and Summit
County
Implementing the Interregional Express (Bustang) service between Colorado Springs and
Pueblo
Providing essential services between Limon and Colorado Springs; Canon City and Colorado
Springs; and Alamosa and Colorado Springs
Implementing multiple strategies to provide general public transit services throughout Teller
County
Theme 4: New Service and New Service Models
As discussed in Theme 1, the preferred approach for improving transit service is to focus on the
existing service area before expanding the geographic area served by the fixed-route network. The
existing service area includes the densest corridors and developments within the metropolitan
area. The areas outside of the existing service area are generally low density. These low density
land uses do not provide the conditions necessary to generate ridership and deliver cost-effective
transit services with conventional scheduled fixed-route service models. For example, the indirect
and curvilinear road network in Northgate and the exurban development structure of Black Forest
poses significant operational and fiscal challenges. Additionally, stakeholder sessions noted the
desire to provide services to military installations, but the security measures required to enter the
premises and the time at which military personnel travel makes it challenging to operate within
the existing service network.
Thus, if communities and organizations located beyond the existing service boundaries wish to be
served with transit, a demonstrated ridership level or additional financial support should be
required to operate and justify the service.
There are a number of alternative service provisions that could provide a basic level of services for
passengers that scales down the costs associated with providing transit service in these lower-
demand and special destination areas. Three alternative service types that could be considered
are summarized in Table 5.2. It is recommended that Transit work closely with these stakeholders

2040 Regional Transportation Plan - Transit | Final
July 2015 | 80
to identify the appropriate service model, financial implications, ridership potential, and financial
contributions to bridge any funding gaps.
Table 5.2: Alternative Service Delivery Options
Delivery Options Description
Deviated fixed route service
Service operates generally along the community’s major arterial road, but makes diversions within a defined distance away from the corridor. Routes typically make connections to a major transit hub where a higher level of fixed route transit services is available. Passengers are required call to request a pick-up if not at the route’s major transit hub, while drop-offs can generally be requested to the bus operator upon boarding. Service generally still operates on a structured schedule. For instance the service departs from the main transit hub at a fixed schedule once an hour.
Area-based demand response service
Service operates within a defined service area but does not have a fixed route. Similar to deviated fixed route, routes typically make connections to a major transit hub where a higher level of fixed-route transit services are available. Passengers are generally required to call for both pick-ups and drop-offs, but services generally operate on a structured schedule.
Limited service operations
Services are provided on a fixed route and fixed schedule but only for select days of the week and at very specific time periods. For example in exurban or rural communities, transit agencies provide service on a rotating schedule once a week to serve trips marketed to seniors to accommodate shopping trips and scheduled medical visits.
Recommendations
Based on the considerations and assessments in support of the four themes, a recommended set
of directions has been identified to meet the plan’s objectives. The set of directions are geared to
face the challenges in the systems by expanding its current transit market to offer greater
transportation choice for passengers, while at the same time being effective and efficient with
scarce financial resources available. The plan proposes incremental increases in frequency, span of
service, and quality of services within the existing service area. These incremental increases are
intended to provide improved access to jobs, goods and services to both choice and transit-
dependent riders, relieve traffic congestion, improve environmental conditions, and help to
improve the coordination and delivery of other transportation services offered.
Focus on the Existing Service Area
Due to the fiscal challenges facing Transit in recent years, the limited span and frequencies for the
existing services have constrained the ability to expand ridership levels to capture more transit
riders. Thus, it is recommended that Transit focus first on improving services within the existing
service area, while at the same time, encouraging more transit-oriented development at strategic
activity centers and corridors. A coordinated and integrated approach in achieving these two
priorities will help to build ridership over time and develop a culture of transit use over time in a
cost-effective manner.
Improve Service Frequency and Span
The recommended direction is based upon a refined route network structure as identified in
Figure 5.2, which follows the continued operation of a multi-hub network structure, with the
Downtown Terminal being the primary transit hub, along with secondary transfer hubs at Citadel
Mall, Voyager (near Chapel Hills Mall), PPCC and the UCCS.
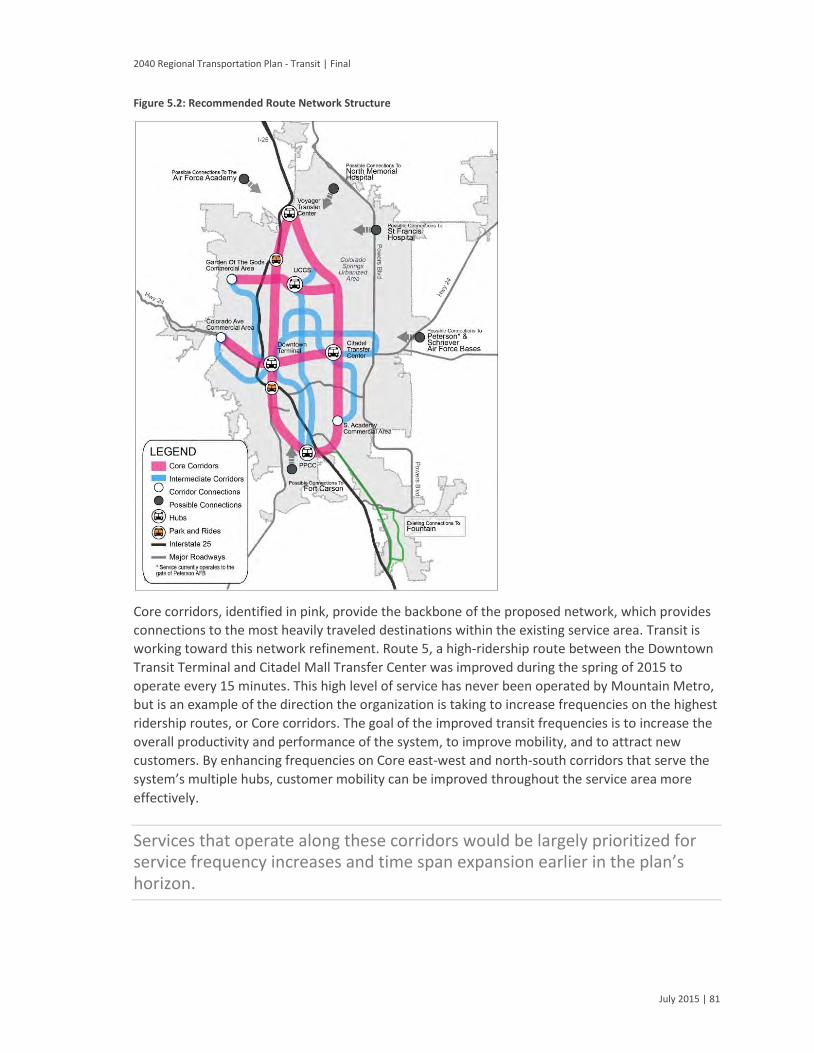
2040 Regional Transportation Plan - Transit | Final
July 2015 | 81
Figure 5.2: Recommended Route Network Structure
Core corridors, identified in pink, provide the backbone of the proposed network, which provides
connections to the most heavily traveled destinations within the existing service area. Transit is
working toward this network refinement. Route 5, a high-ridership route between the Downtown
Transit Terminal and Citadel Mall Transfer Center was improved during the spring of 2015 to
operate every 15 minutes. This high level of service has never been operated by Mountain Metro,
but is an example of the direction the organization is taking to increase frequencies on the highest
ridership routes, or Core corridors. The goal of the improved transit frequencies is to increase the
overall productivity and performance of the system, to improve mobility, and to attract new
customers. By enhancing frequencies on Core east-west and north-south corridors that serve the
system’s multiple hubs, customer mobility can be improved throughout the service area more
effectively.
Services that operate along these corridors would be largely prioritized for service frequency increases and time span expansion earlier in the plan’s horizon.

2040 Regional Transportation Plan - Transit | Final
July 2015 | 82
Intermediate corridors, identified in blue, serve to complement Core corridor services to support a
basic level of service coverage along other major corridors. The Intermediate corridors generally
link to fewer major destinations than Core corridors. Finally, local routes, which are not identified
in the route network concept, fill in the remaining missing service coverage gaps by providing
other neighborhood connections required as supported by ridership. Table 5.3 outlines the
proposed ultimate service frequencies and span by type of corridor and service period in 2040.
Even as service frequencies will be improved particularly to Core and Intermediate corridors,
schedules should be coordinated to arrive at hub locations, where feasible, at specific clock-face
times to reduce the amount of waiting time at transfers.
Table 5.3: Proposed Level of Service by Corridor Type by Service Period
Corridor Weekday Daytime
(6am-6pm)
Weekday Evening
(6pm-12am)
Weekend Daytime
(7am-6pm)
Weekend Evening
(6pm-11pm)
Core corridor 15 mins 30 mins 30 mins 60 mins
Intermediate corridor 30 mins 60 mins 60 mins As supported by
ridership
Local service 30 – 60 mins As supported by ridership
A high-level evaluation applied the criteria to gauge the potential performance of the
recommendation. In general, improvements in frequencies and service span (weekends, evenings)
could have the greatest positive impact on the system. Table 5.4 presents a summary of the
application of criteria supporting the advancement of this recommendation.
Table 5.4: Criteria – Improve Service Frequency and Span
Criteria Notes
Fiscal Service span and frequency increases have the potential for the greatest impact on ridership improvement and should be a key priority.
Mobility Enhances connectivity within the existing service area.
Community Benefits (mobility, efficient travel, cost, etc.) outweigh any negative aspects for the community.
Deliverability No technical constraints; service improvements could be made rapidly.
Positive impacts Moderate challenges Considerable challenges
Maintain and Improve Transit Infrastructure
While improving transit services is important to growing the network’s ridership base, it is also
important that consideration is given to improve the whole ridership experience. Enhancing the
ridership experience includes ensuring that bus stops, transfer hubs, and terminals are safe,
comfortable, and well maintained. Thus it is recommended that resources be allocated to ensure
the general upkeep of infrastructure and making improvements where required, including the
possible relocation of the existing transit terminal to improve capacity and safety for passengers
and bus operations.
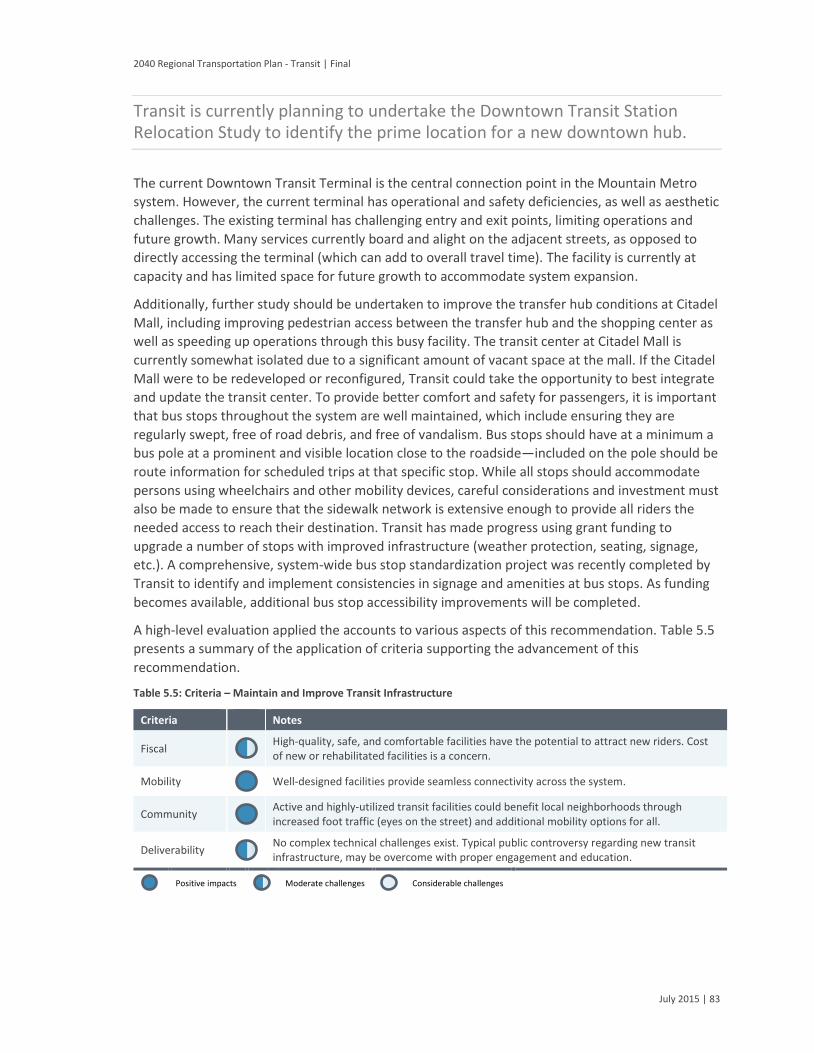
2040 Regional Transportation Plan - Transit | Final
July 2015 | 83
Transit is currently planning to undertake the Downtown Transit Station Relocation Study to identify the prime location for a new downtown hub.
The current Downtown Transit Terminal is the central connection point in the Mountain Metro
system. However, the current terminal has operational and safety deficiencies, as well as aesthetic
challenges. The existing terminal has challenging entry and exit points, limiting operations and
future growth. Many services currently board and alight on the adjacent streets, as opposed to
directly accessing the terminal (which can add to overall travel time). The facility is currently at
capacity and has limited space for future growth to accommodate system expansion.
Additionally, further study should be undertaken to improve the transfer hub conditions at Citadel
Mall, including improving pedestrian access between the transfer hub and the shopping center as
well as speeding up operations through this busy facility. The transit center at Citadel Mall is
currently somewhat isolated due to a significant amount of vacant space at the mall. If the Citadel
Mall were to be redeveloped or reconfigured, Transit could take the opportunity to best integrate
and update the transit center. To provide better comfort and safety for passengers, it is important
that bus stops throughout the system are well maintained, which include ensuring they are
regularly swept, free of road debris, and free of vandalism. Bus stops should have at a minimum a
bus pole at a prominent and visible location close to the roadside—included on the pole should be
route information for scheduled trips at that specific stop. While all stops should accommodate
persons using wheelchairs and other mobility devices, careful considerations and investment must
also be made to ensure that the sidewalk network is extensive enough to provide all riders the
needed access to reach their destination. Transit has made progress using grant funding to
upgrade a number of stops with improved infrastructure (weather protection, seating, signage,
etc.). A comprehensive, system-wide bus stop standardization project was recently completed by
Transit to identify and implement consistencies in signage and amenities at bus stops. As funding
becomes available, additional bus stop accessibility improvements will be completed.
A high-level evaluation applied the accounts to various aspects of this recommendation. Table 5.5
presents a summary of the application of criteria supporting the advancement of this
recommendation.
Table 5.5: Criteria – Maintain and Improve Transit Infrastructure
Criteria Notes
Fiscal High-quality, safe, and comfortable facilities have the potential to attract new riders. Cost of new or rehabilitated facilities is a concern.
Mobility Well-designed facilities provide seamless connectivity across the system.
Community Active and highly-utilized transit facilities could benefit local neighborhoods through increased foot traffic (eyes on the street) and additional mobility options for all.
Deliverability No complex technical challenges exist. Typical public controversy regarding new transit infrastructure, may be overcome with proper engagement and education.
Positive impacts Moderate challenges Considerable challenges

2040 Regional Transportation Plan - Transit | Final
July 2015 | 84
Consider New Services and Models
Stakeholders’ sessions conducted through the development of this plan revealed the need for
transit services to areas beyond the existing service area, particularly new transit connections to
suburban hospitals and military installations.
The key service standard metric would be for any proposed services to demonstrate an acceptable level of ridership and revenue return.
Where there are deficiencies in ridership, funding would be required from those agencies,
communities, or private entities requesting the expansion of service. The funding would support
the implementation, operations, and maintenance of the new services. Alternative service
models, such as operating deviated fixed route services, area-based demand response service, and
operating limited services on special days of the week, could be used to adapt services that best
meet the travel needs of the community. Table 5.6 summarizes the connections to new service
areas discussed during the study’s public outreach sessions. The proposed new connections (like
all other new services) would need to meet the service standards that will be established prior to
approval and implementation.
Table 5.6: Possible New Services
Potential new services/destinations
Description of services
Union Boulevard Provide new service north-south along Union Boulevard.
Memorial North Hospital Possible extension of Union Boulevard service or shuttle route to/from Chapel Hills Mall.
St. Francis Medical Center Extension of Powers Boulevard service (Route 23) northward to St Francis Medical Center.
Air Force Academy Potential for flexible/on demand service.
Peterson AFB and Schriever AFB Vanpool or peak hour service from popular park and rides.
Fort Carson Potential connection to PPCC or vanpool/peak hour service from Park-n-Rides.
Union Boulevard
In an effort to improve the overall efficiency and coverage of the Mountain Metro network, the
project team looked for gaps or potential areas of demand where limited (or no) service is
provided today. The lack of service along the full extent of Union Boulevard creates a significant
gap in the network. The closest major north-south services are currently provided by Route 25
(Academy Boulevard) on the east and either Route 6 (Wasatch Avenue) or Route 9A/9B (Cascade
Avenue) on the west. The distance between these existing north-south options is more than three
miles. Union Boulevard was identified as a potential north-south connection extending through
the center of the existing service area. The Union Boulevard corridor has been categorized as an
Intermediate corridor. The corridor has concentrations of multifamily residential and commercial
uses along the corridor that are important origins and destinations for transit. Table 5.7 provides
the application of criteria for this potential new service.
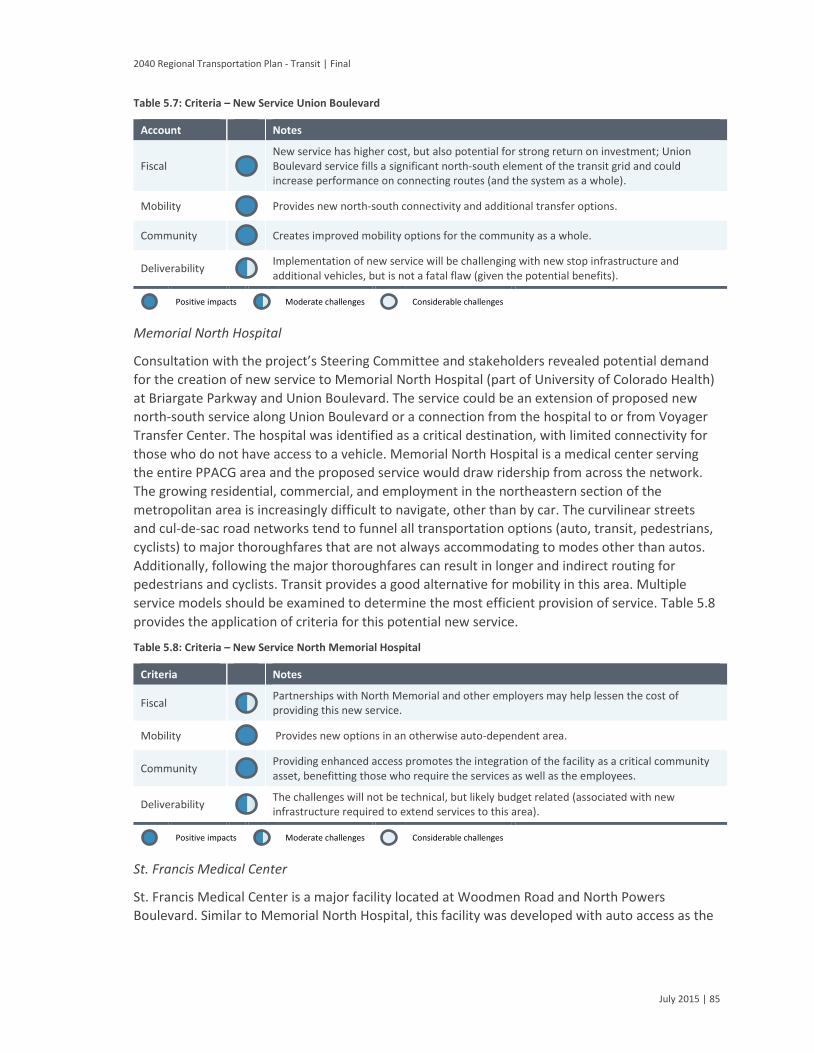
2040 Regional Transportation Plan - Transit | Final
July 2015 | 85
Table 5.7: Criteria – New Service Union Boulevard
Account Notes
Fiscal New service has higher cost, but also potential for strong return on investment; Union Boulevard service fills a significant north-south element of the transit grid and could increase performance on connecting routes (and the system as a whole).
Mobility Provides new north-south connectivity and additional transfer options.
Community Creates improved mobility options for the community as a whole.
Deliverability Implementation of new service will be challenging with new stop infrastructure and additional vehicles, but is not a fatal flaw (given the potential benefits).
Positive impacts Moderate challenges Considerable challenges
Memorial North Hospital
Consultation with the project’s Steering Committee and stakeholders revealed potential demand
for the creation of new service to Memorial North Hospital (part of University of Colorado Health)
at Briargate Parkway and Union Boulevard. The service could be an extension of proposed new
north-south service along Union Boulevard or a connection from the hospital to or from Voyager
Transfer Center. The hospital was identified as a critical destination, with limited connectivity for
those who do not have access to a vehicle. Memorial North Hospital is a medical center serving
the entire PPACG area and the proposed service would draw ridership from across the network.
The growing residential, commercial, and employment in the northeastern section of the
metropolitan area is increasingly difficult to navigate, other than by car. The curvilinear streets
and cul-de-sac road networks tend to funnel all transportation options (auto, transit, pedestrians,
cyclists) to major thoroughfares that are not always accommodating to modes other than autos.
Additionally, following the major thoroughfares can result in longer and indirect routing for
pedestrians and cyclists. Transit provides a good alternative for mobility in this area. Multiple
service models should be examined to determine the most efficient provision of service. Table 5.8
provides the application of criteria for this potential new service.
Table 5.8: Criteria – New Service North Memorial Hospital
Criteria Notes
Fiscal Partnerships with North Memorial and other employers may help lessen the cost of providing this new service.
Mobility Provides new options in an otherwise auto-dependent area.
Community Providing enhanced access promotes the integration of the facility as a critical community asset, benefitting those who require the services as well as the employees.
Deliverability The challenges will not be technical, but likely budget related (associated with new infrastructure required to extend services to this area).
Positive impacts Moderate challenges Considerable challenges
St. Francis Medical Center
St. Francis Medical Center is a major facility located at Woodmen Road and North Powers
Boulevard. Similar to Memorial North Hospital, this facility was developed with auto access as the

2040 Regional Transportation Plan - Transit | Final
July 2015 | 86
priority. St. Francis is located in a growing area of the community with the need for such medical
facilities. However, access is currently limited for most modes, other than auto.
Transit ridership would likely draw from across the region. To provide this service, the Route 23
(Powers Boulevard) or Route 34 (Austin Bluffs Parkway) could be extended. Alternatively, a new
route or extension could also be established. Route 23 is a relatively new route for Transit. The
ridership on this route is still building and yet to be fully established. Implementation of this
service would require a detailed review of potential models for provision of a connection to St.
Francis Medical Center. It is possible that a deviated fixed route service or other on demand style
of service may be appropriate in the early stages. Table 5.9 provides the application of criteria for
this potential new service.
Table 5.9: Criteria – New Service St. Francis Medical Center
Criteria Notes
Fiscal Partnerships with St. Francis and other employers may help lessen the cost of providing this new service.
Mobility Provides new options in an otherwise auto-dependent area.
Community Providing enhanced access promotes the integration of the facility as a critical community asset, benefitting those who require the services as well as the employees.
Deliverability The challenges will not be technical, but likely budget related (associated with new infrastructure required to extend services to this area).
Positive impacts Moderate challenges Considerable challenges
Military Installations
The Colorado Springs area is home to multiple, critical military installations. These installations
have a significant impact on the state and local economy, as well as travel patterns in the region.
A key opportunity for the growth of transit usage among military personnel and federal civilian
staff is through the Mass Transportation Benefit Program. This program provides federal workers
reimbursement for mass transit commuting costs “to reduce federal employees’ contribution to
traffic congestion and air pollution, and to expand their commuting alternatives” (Executive Order
13150, April 2000). There has been recent political controversy over the size of the benefit (to
match federal parking subsidies); however, the benefit is likely to continue in some form. The
maximum benefit is dependent on the cap set through federal legislation and local transit costs.
Education and marketing of this benefit, in tandem with new or enhanced transit options for the
military installations could be considered. The sections below provide additional details on the
various military installations and the plan’s transit recommendations.
Air Force Academy: The Air Force Academy is a major employment center and home to
approximately 4,000 undergraduate students and 5,700 active duty military and civilian
employees. Various discussions regarding transit services for employees and students have been
reviewed over the years. Transit services for employees and students present two different needs
and opportunities. Commuter service focused on Air Force Academy employees provides a good
opportunity for Transit to capture new long-term riders. Additional analysis would be required to
determine the best connections to and from the Air Force Academy, depending on where

2040 Regional Transportation Plan - Transit | Final
July 2015 | 87
employees reside. Depending on demand, vanpool or cadet bus services could be considered to
address demand for commuters and the transportation needs for cadets residing at the Academy.
Peterson Air Force Base and Schriever Air Force Base: Both Peterson Air Force Base (AFB) and
Schriever AFB are significant employment centers in the Colorado Springs area.
Peterson AFB currently employs more than 11,000 civilian and active duty staff and Schriever AFB employs approximately 8,000.
Route 24 provided service to Peterson AFB prior to April, 2015, and was eliminated due to low
ridership. Peterson AFB is a significant employment center and reconnecting transit opportunities
should be explored; however, these may include options outside of traditional fixed-route service
(such as vanpool, etc.). Future services to Schriever AFB would also need to be considered through
the process of providing services outside of the current service area. Similar to the Air Force
Academy, the project team discussed various options for transit service to these large
employment destinations. There are multiple challenges to successful transit connectivity for both
bases.
The service to Peterson AFB previously delivered passengers to the west gate on Stuart Avenue.
Between 2008 and 2012, the Orbiter shuttle provided shuttle service on Peterson AFB. However,
due to low ridership and high cost, this service no longer operates. Those accessing Peterson AFB
via Mountain Metro were presented with significant walking distances, depending on their
ultimate destination on base. This may account for the poor performance of the now discontinued
service. Better integration, frequencies, and delivery of passengers to their ultimate destinations
must be addressed for any future transit service that may be considered for all military
installations. Security restrictions prevent Mountain Metro from serving areas beyond the
Peterson AFB gate. Ongoing coordination with the Department of Defense to identify an
acceptable solution is encouraged for any future transit considerations. Options such as focused
van pools or private coach service could be considered by the base in cooperation with Transit.
Schriever AFB is approximately an 18-mile drive from central Colorado Springs. Given the distance
(outside the current service area) and isolation of the base, any new services would need to be
focused on specific market segments. Fixed route bus service would likely not be an efficient or
cost effective provision of transit to Schriever AFB. Options such as focused van pools or private
coach service could be considered by the base in cooperation with Mountain Metro.
Fort Carson – Fort Carson is the largest military post in the Colorado Springs area. The post has
approximately 28,000 active duty military and approximately 6,500 civilian employees.
Over 42,000 family members and a large number of military retirees also live on the post or otherwise require access to Fort Carson.
Fort Carson currently operates an internal shuttle service with three loop routes. The service is
flexible, but works to provide 10-minute frequencies along the loops. Fort Carson is not directly
served by Mountain Metro. The Route 11 stops approximately 0.5 miles north of Gate 4 (Magrath

2040 Regional Transportation Plan - Transit | Final
July 2015 | 88
Avenue) and approximately 0.6 miles from Gate 3 (Chiles Avenue). A transit center is located at
PPCC, approximately one mile walking distance from Gate 4. However, there are no consistent
sidewalk connections or shuttle services provided between the transit center (or other bus stops)
and Fort Carson Gates 3 or 4. The 2014 schedule included service to the transit center by Routes
10, 11, 15, and 25.
Recommendations for Military Installations - Transit is addressed differently for various military
installations around the country. One model that may be appropriate for all installations in the
Colorado Springs area is based on Hampton Roads Transit bus services in Virginia. Hampton Roads
Transit enters Naval Station Norfolk with multiple bus routes. These routes are all at the end of
each bus line and require an appropriate military or military contractor’s identification. Because
the route is terminating and turning back to start a new service on the Naval Station, only military
or authorized personnel would be on the bus before entering or leaving the installation. A security
check is completed at the gate entrance. Fort Carson and Peterson AFB would likely benefit from
this type of direct bus service that enters the installation and boards/alights passengers at a
central/convenient location. Fort Carson’s shuttle service would support local mobility, once
transit users were on the post (without a vehicle). Peterson AFB would require some other
measures to provide mobility once transit users were on base, such as shuttle, car share, cycle
share, stronger walk links, etc.
Another model that should be considered in the longer term (as demand grows) has been
implemented at Fort Meade in Maryland. This installation is a large civilian and military employer
in the Baltimore/Washington D.C. area. Their approach to providing transit in the heavily
congested metropolitan area is through a core, timetabled local bus service within the secured
area of the post. This service links to multiple connections (at security gates) to shuttle services
from area transit hubs (bus stops, light rail stations, etc.). Additionally, private commuter services
are provided to Fort Meade employees with coaches from key hubs in suburban residential areas
where concentrations of Fort Meade employees live. These commuter services enter the secured
areas of Fort Meade (making multiple stops on the post) and are only available to employees with
proper credentials. Security checks are completed prior to the private coaches entering Fort
Meade. This approach could be applied to any of the military installations in the Colorado Springs
area, but scaling the service based on demand (using vanpools or other smaller vehicles).
Additional options that could be considered to better support transit services to Fort Carson,
Peterson AFB, and the Air Force Academy could include:
Extending local bus service to provide stops on Fort Carson and Peterson AFB following the
Hampton Roads Transit model. Extension of these services would require addressing
additional mobility links across the post or base (continuous sidewalks, shuttle service, car
share, cycle share, etc.) to provide efficient connections to final destinations.
Vanpool or peak hour service from park and rides (Tejon, Woodmen, or others) to Fort
Carson, Peterson AFB, and potentially the Air Force Academy (depending on demand). These
services could be for authorized personnel only, simplifying the security procedures for
entering the post, base, or the Air Force Academy.
Shuttle connection between the PPCC transit center and Fort Carson. This service could be for
authorized personnel only, simplifying the security procedures for entering the post.

2040 Regional Transportation Plan - Transit | Final
July 2015 | 89
All installations could consider developing peak period entrance and exit gates where all lanes
reversed to serve one direction as an entrance into (morning peak) or out of (evening peak)
the installation. The lane that is typically used as an exit to the installation could be a peak
period express lane for transit vehicles or carpools (with three plus passengers). Using the
outbound lane as an express entrance allows uninterrupted (transit or carpool) access to the
gate security, without constructing new lanes. Some of the security measures at the gates
may not currently permit this type of reverse use; however, as the gates are updated
overtime, they could be retrofitted to function in either direction on demand.
Create better walking and cycle links could be created between adjacent bus stops or transit
centers and the security gates at Fort Carson and Peterson AFB.
A gate solely focused on pedestrians and cyclists could be considered to create a shorter walk
link between PPCC transit center on the eastern side of Fort Carson.
A timetabled, two-way service plan could be considered for the Fort Carson shuttle to create
more efficient and predictable provision of service (as opposed to the current loop
operations).
Table 5.10 provides the application of criteria for potential new services to the various military
installations in the region.
Table 5.10: Criteria – New Service Military Installations
Criteria Notes
Fiscal
Given that military installations are the largest employers in the region, there appears to be an untapped market to provide transit services that generate revenue or are cost neutral. The current (and long standing) challenge is to design services that meet the needs of military personnel and encourage mode shift.
Mobility New services have the chance to provide significant mobility benefits for area residents and employees of the military installations. New services will need to be targeted to meet the unique needs and schedules of military personnel and civilian employees.
Community Entry level military personnel and families require high quality and low cost mobility options.
Deliverability
The deliverability challenges of new transit services to the military installations are not technical, but likely coordination related. Working with the various branches of the DOD responsible for each installation will be essential to develop services that directly deliver riders to their ultimate destinations (without unnecessary transfers or long walk links).
Positive impacts Moderate challenges Considerable challenges
Develop Expansion Standards and Policies
During the course of the plan’s implementation, often challenging and complex service planning
decisions will need to be made, while maintaining consistency with the plans objectives and major
themes. To equip Transit with the tools to best support the objectives of this plan, it is
recommended that the current service standards be expanded. Service standards are
performance measures that help define the role of transit services.
The advantage of establishing standards is that they provide a fair, consistent process for determining what and when service changes should be made.
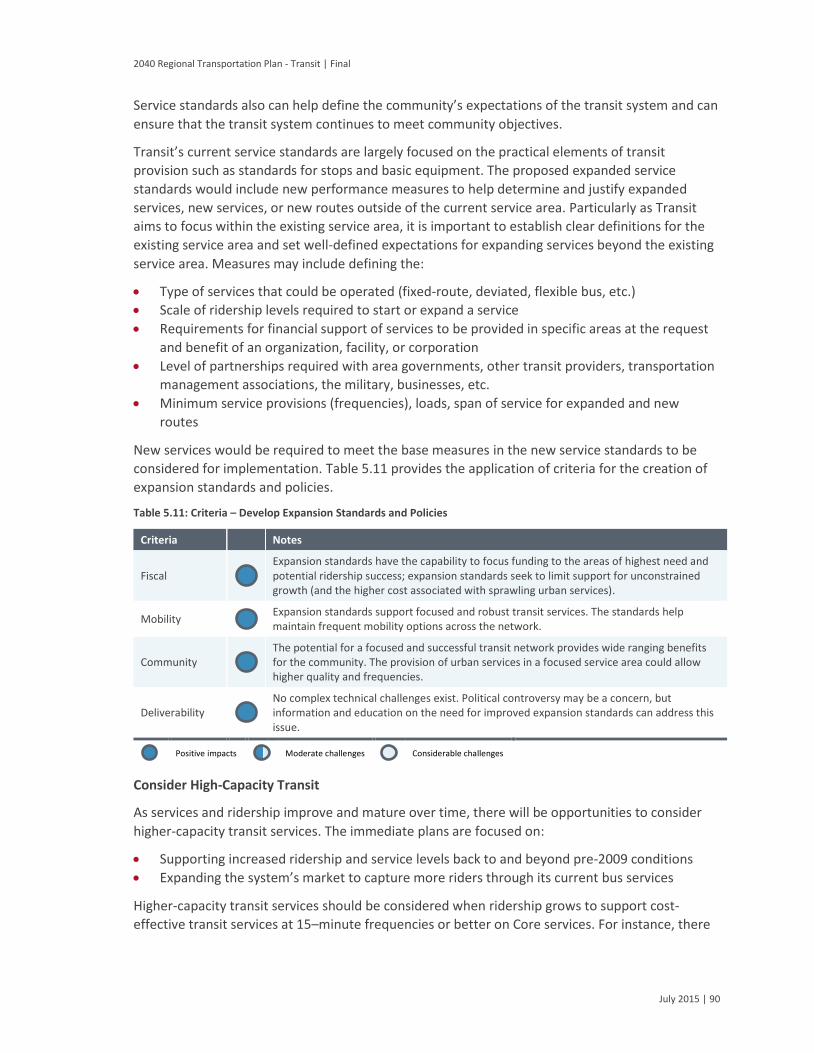
2040 Regional Transportation Plan - Transit | Final
July 2015 | 90
Service standards also can help define the community’s expectations of the transit system and can
ensure that the transit system continues to meet community objectives.
Transit’s current service standards are largely focused on the practical elements of transit
provision such as standards for stops and basic equipment. The proposed expanded service
standards would include new performance measures to help determine and justify expanded
services, new services, or new routes outside of the current service area. Particularly as Transit
aims to focus within the existing service area, it is important to establish clear definitions for the
existing service area and set well-defined expectations for expanding services beyond the existing
service area. Measures may include defining the:
Type of services that could be operated (fixed-route, deviated, flexible bus, etc.)
Scale of ridership levels required to start or expand a service
Requirements for financial support of services to be provided in specific areas at the request
and benefit of an organization, facility, or corporation
Level of partnerships required with area governments, other transit providers, transportation
management associations, the military, businesses, etc.
Minimum service provisions (frequencies), loads, span of service for expanded and new
routes
New services would be required to meet the base measures in the new service standards to be
considered for implementation. Table 5.11 provides the application of criteria for the creation of
expansion standards and policies.
Table 5.11: Criteria – Develop Expansion Standards and Policies
Criteria Notes
Fiscal Expansion standards have the capability to focus funding to the areas of highest need and potential ridership success; expansion standards seek to limit support for unconstrained growth (and the higher cost associated with sprawling urban services).
Mobility Expansion standards support focused and robust transit services. The standards help maintain frequent mobility options across the network.
Community The potential for a focused and successful transit network provides wide ranging benefits for the community. The provision of urban services in a focused service area could allow higher quality and frequencies.
Deliverability No complex technical challenges exist. Political controversy may be a concern, but information and education on the need for improved expansion standards can address this issue.
Positive impacts Moderate challenges Considerable challenges
Consider High-Capacity Transit
As services and ridership improve and mature over time, there will be opportunities to consider
higher-capacity transit services. The immediate plans are focused on:
Supporting increased ridership and service levels back to and beyond pre-2009 conditions
Expanding the system’s market to capture more riders through its current bus services
Higher-capacity transit services should be considered when ridership grows to support cost-
effective transit services at 15–minute frequencies or better on Core services. For instance, there
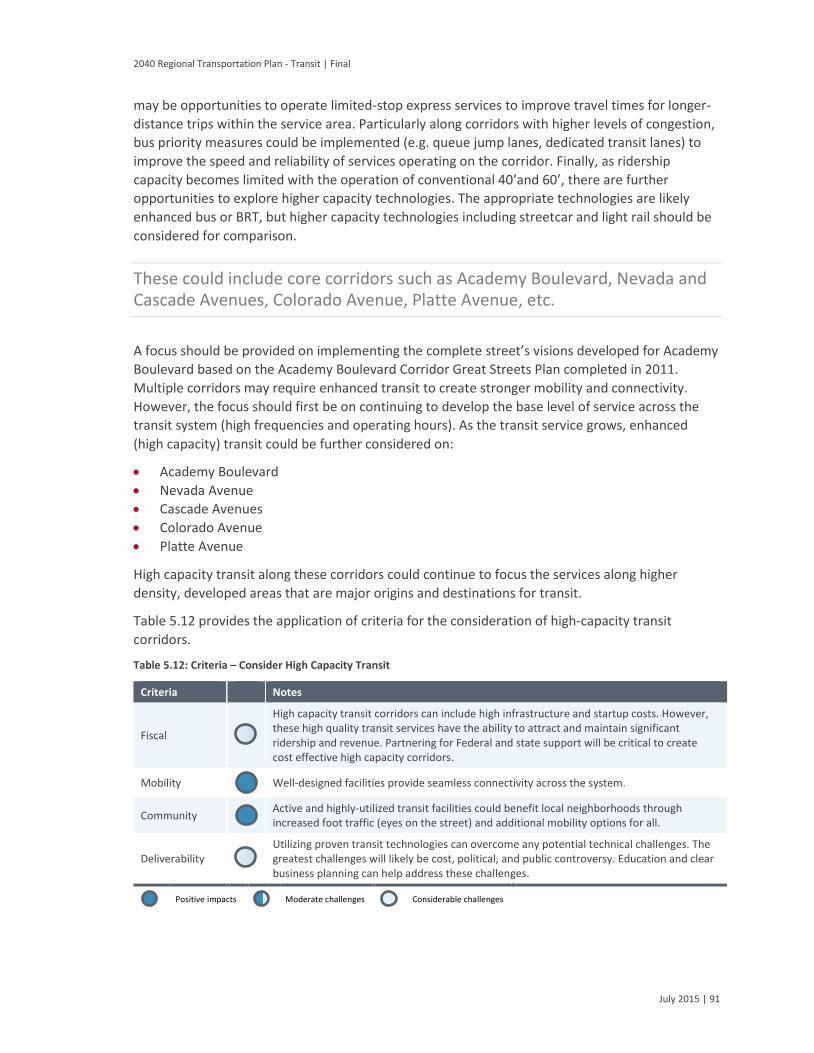
2040 Regional Transportation Plan - Transit | Final
July 2015 | 91
may be opportunities to operate limited-stop express services to improve travel times for longer-
distance trips within the service area. Particularly along corridors with higher levels of congestion,
bus priority measures could be implemented (e.g. queue jump lanes, dedicated transit lanes) to
improve the speed and reliability of services operating on the corridor. Finally, as ridership
capacity becomes limited with the operation of conventional 40’and 60’, there are further
opportunities to explore higher capacity technologies. The appropriate technologies are likely
enhanced bus or BRT, but higher capacity technologies including streetcar and light rail should be
considered for comparison.
These could include core corridors such as Academy Boulevard, Nevada and Cascade Avenues, Colorado Avenue, Platte Avenue, etc.
A focus should be provided on implementing the complete street’s visions developed for Academy
Boulevard based on the Academy Boulevard Corridor Great Streets Plan completed in 2011.
Multiple corridors may require enhanced transit to create stronger mobility and connectivity.
However, the focus should first be on continuing to develop the base level of service across the
transit system (high frequencies and operating hours). As the transit service grows, enhanced
(high capacity) transit could be further considered on:
Academy Boulevard
Nevada Avenue
Cascade Avenues
Colorado Avenue
Platte Avenue
High capacity transit along these corridors could continue to focus the services along higher
density, developed areas that are major origins and destinations for transit.
Table 5.12 provides the application of criteria for the consideration of high-capacity transit
corridors.
Table 5.12: Criteria – Consider High Capacity Transit
Criteria Notes
Fiscal
High capacity transit corridors can include high infrastructure and startup costs. However, these high quality transit services have the ability to attract and maintain significant ridership and revenue. Partnering for Federal and state support will be critical to create cost effective high capacity corridors.
Mobility Well-designed facilities provide seamless connectivity across the system.
Community Active and highly-utilized transit facilities could benefit local neighborhoods through increased foot traffic (eyes on the street) and additional mobility options for all.
Deliverability Utilizing proven transit technologies can overcome any potential technical challenges. The greatest challenges will likely be cost, political, and public controversy. Education and clear business planning can help address these challenges.
Positive impacts Moderate challenges Considerable challenges
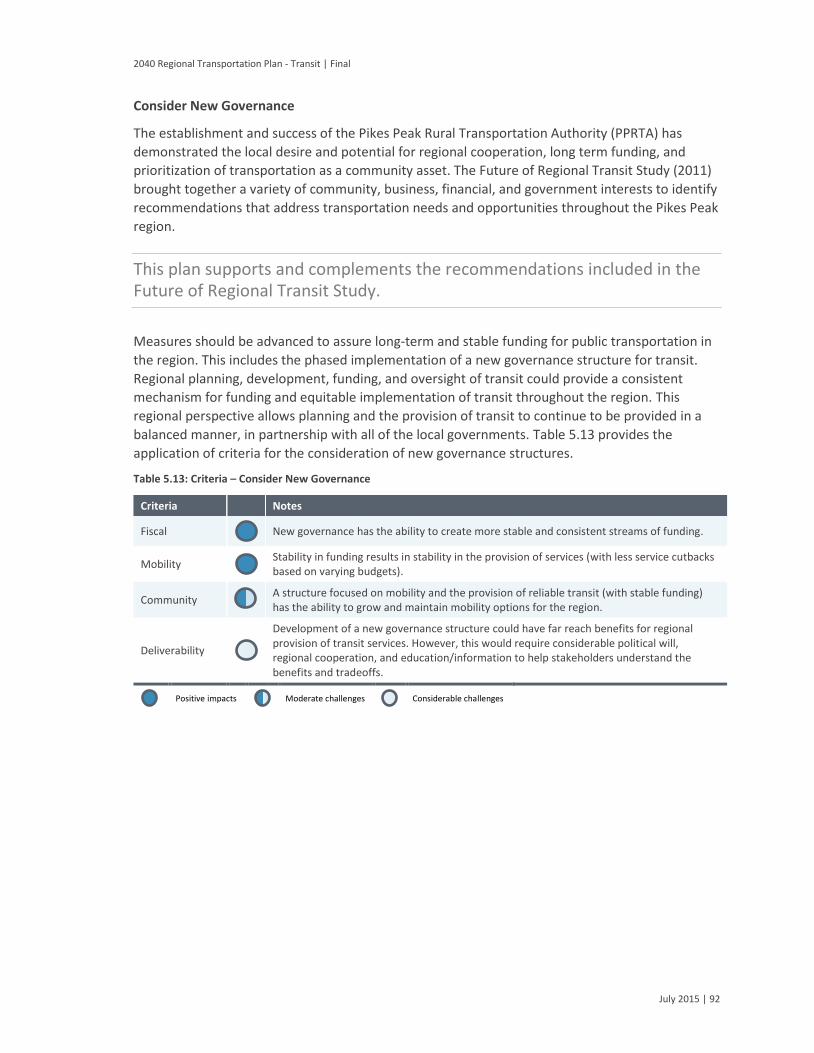
2040 Regional Transportation Plan - Transit | Final
July 2015 | 92
Consider New Governance
The establishment and success of the Pikes Peak Rural Transportation Authority (PPRTA) has
demonstrated the local desire and potential for regional cooperation, long term funding, and
prioritization of transportation as a community asset. The Future of Regional Transit Study (2011)
brought together a variety of community, business, financial, and government interests to identify
recommendations that address transportation needs and opportunities throughout the Pikes Peak
region.
This plan supports and complements the recommendations included in the Future of Regional Transit Study.
Measures should be advanced to assure long-term and stable funding for public transportation in
the region. This includes the phased implementation of a new governance structure for transit.
Regional planning, development, funding, and oversight of transit could provide a consistent
mechanism for funding and equitable implementation of transit throughout the region. This
regional perspective allows planning and the provision of transit to continue to be provided in a
balanced manner, in partnership with all of the local governments. Table 5.13 provides the
application of criteria for the consideration of new governance structures.
Table 5.13: Criteria – Consider New Governance
Criteria Notes
Fiscal New governance has the ability to create more stable and consistent streams of funding.
Mobility Stability in funding results in stability in the provision of services (with less service cutbacks based on varying budgets).
Community A structure focused on mobility and the provision of reliable transit (with stable funding) has the ability to grow and maintain mobility options for the region.
Deliverability
Development of a new governance structure could have far reach benefits for regional provision of transit services. However, this would require considerable political will, regional cooperation, and education/information to help stakeholders understand the benefits and tradeoffs.
Positive impacts Moderate challenges Considerable challenges

2040 Regional Transportation Plan - Transit | Final
July 2015 | 93
6 Funding Analysis & Implementation Strategies Introduction
This chapter presents the current funding and revenues available for transit, as well as funding
implications to maintain and improve the Mountain Metro system over the course of the plan (to
2040). The project team has researched information on the existing funding and revenue streams.
This chapter includes an expenditure plan (referred to as the fiscally-constrained plan) that identifies the priority projects that could be implemented within available funding estimates.
The overall funding estimates have been determined in consultation with Transit and PPACG.
Projected funds do not cover the full range of transit and transportation needs identified for the
PPACG area. A broader list and discussion of assumptions for transit projects (referred to as the
un-constrained plan or vision plan) is included in Appendix A.
The content of this plan was created between April and December of 2014. Therefore, the
substantive background, facts, statistics, and financial data are representative of the readily
available information in 2014. Transit is continuously working to refine transit services in the
PPACG area to improve frequencies, connectivity, routes, and overall mobility options for
residents. Ongoing adjustments to the services and network routing (presented in this plan) are
anticipated. Changes, such as spring 2015 service changes, begin progress towards achieving many
of the recommendations presented in this plan.
Funding Sources
Current Funding Revenue Sources
Federal, state, regional, and local funding support the operations, maintenance, and expansion of
transit services—including fixed-route bus services (Mountain Metro), specialized ADA services
(Metro Mobility), transportation demand management programs (Metro Rides), and specialized
transportation services provided by area non-profits. Table 6.1 summarizes the funding programs
that support these services.
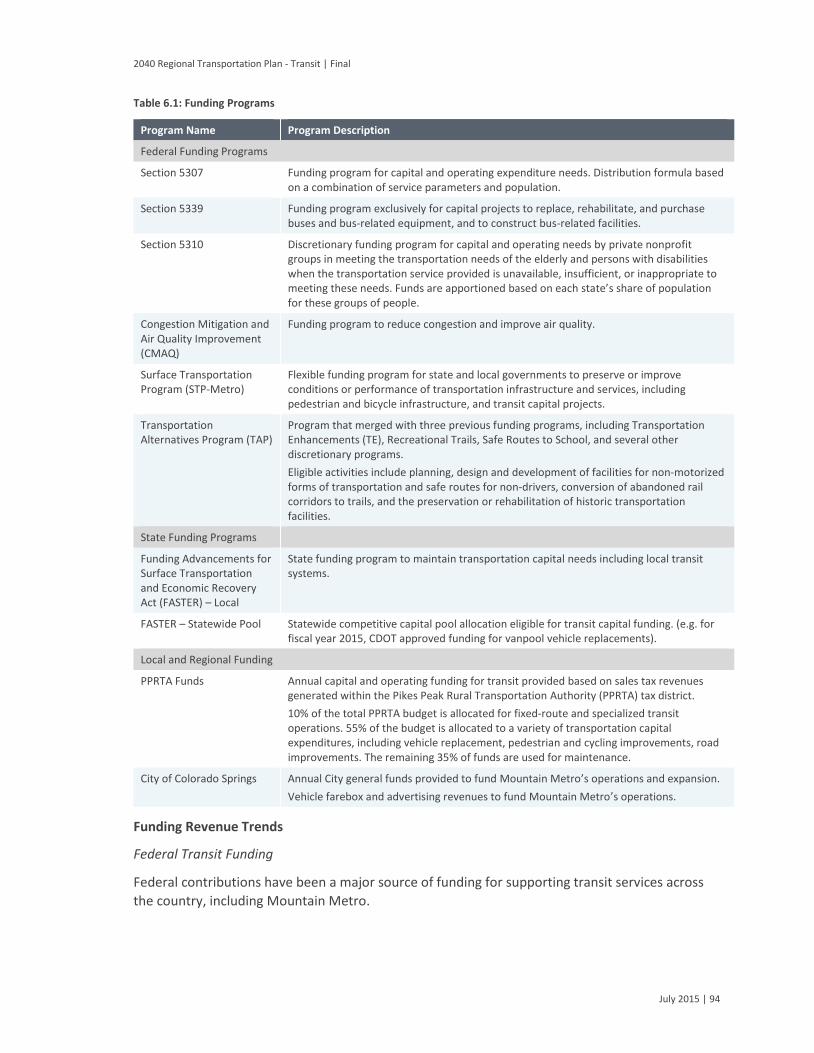
2040 Regional Transportation Plan - Transit | Final
July 2015 | 94
Table 6.1: Funding Programs
Program Name Program Description
Federal Funding Programs
Section 5307 Funding program for capital and operating expenditure needs. Distribution formula based on a combination of service parameters and population.
Section 5339 Funding program exclusively for capital projects to replace, rehabilitate, and purchase buses and bus-related equipment, and to construct bus-related facilities.
Section 5310 Discretionary funding program for capital and operating needs by private nonprofit groups in meeting the transportation needs of the elderly and persons with disabilities when the transportation service provided is unavailable, insufficient, or inappropriate to meeting these needs. Funds are apportioned based on each state’s share of population for these groups of people.
Congestion Mitigation and Air Quality Improvement (CMAQ)
Funding program to reduce congestion and improve air quality.
Surface Transportation Program (STP-Metro)
Flexible funding program for state and local governments to preserve or improve conditions or performance of transportation infrastructure and services, including pedestrian and bicycle infrastructure, and transit capital projects.
Transportation Alternatives Program (TAP)
Program that merged with three previous funding programs, including Transportation Enhancements (TE), Recreational Trails, Safe Routes to School, and several other discretionary programs.
Eligible activities include planning, design and development of facilities for non‐motorized forms of transportation and safe routes for non‐drivers, conversion of abandoned rail corridors to trails, and the preservation or rehabilitation of historic transportation facilities.
State Funding Programs
Funding Advancements for Surface Transportation and Economic Recovery Act (FASTER) – Local
State funding program to maintain transportation capital needs including local transit systems.
FASTER – Statewide Pool Statewide competitive capital pool allocation eligible for transit capital funding. (e.g. for fiscal year 2015, CDOT approved funding for vanpool vehicle replacements).
Local and Regional Funding
PPRTA Funds Annual capital and operating funding for transit provided based on sales tax revenues generated within the Pikes Peak Rural Transportation Authority (PPRTA) tax district.
10% of the total PPRTA budget is allocated for fixed-route and specialized transit operations. 55% of the budget is allocated to a variety of transportation capital expenditures, including vehicle replacement, pedestrian and cycling improvements, road improvements. The remaining 35% of funds are used for maintenance.
City of Colorado Springs Annual City general funds provided to fund Mountain Metro’s operations and expansion.
Vehicle farebox and advertising revenues to fund Mountain Metro’s operations.
Funding Revenue Trends
Federal Transit Funding
Federal contributions have been a major source of funding for supporting transit services across
the country, including Mountain Metro.
2040 Regional Transportation Plan - Transit | Final
July 2015 | 95
While federal funding for transit across the country has generally been increasing, the funds provided towards transit are only a fraction of the demand and need for transit and transportation agencies in the US.
Despite this steady increase in funding per capita, the future of federal transportation and transit
funding is increasingly uncertain without a significant infusion of resources such as an increase to
federal gas taxes and user fees, or reallocate general federal funds to cover the funding deficit.
Given these uncertainties, it is assumed that the federal transit apportionments that Mountain
Metro receives will only grow modestly with the anticipated increases in population growth in the
current service area, which equates to approximately one percent annually (excluding inflationary
increases).
State Transit Funding
Dedicated funding for transit from the State of Colorado has generally been inconsistent. Previous
transportation bills enacted in 2002 have called for an allocation of transit funding based on state
sales tax proceeds beyond a specific threshold from auto sales; however the policy generated
marginal funding for transit. In 2009, the State of Colorado enacted new policies that provide
dedicated funding for strategic transportation projects through the Funding Advancements for
Surface Transportation and Economic Recovery Act (FASTER). FASTER is funded through additional
surcharges, fines and late fees on motor vehicle registrations. The policy stipulates that the
additional surcharges will not increase over time. The PPACG area’s stipend from FASTER is
anticipated to remain constant.
Local Funding Sources
In 2014, nearly half of Transit’s capital and operating funding originated from the City of Colorado
Springs and from the PPRTA. These agencies will likely continue to play a key role in providing the
needed funds to maintain and grow the system throughout the plan’s horizon. An assessment of
general fund revenues in Colorado Springs have identified that nearly 60 percent of revenues
come from sales taxes and nearly ten percent from property taxes. PPRTA revenues come from
sales taxes. Smoothing out of cyclical changes to the regional economy throughout the study
horizon, it is assumed that sales tax revenues will increase at rates similar to the increase in
population growth in the service area. Given that a major theme to the fixed route transit plan is
to focus services within the existing service, a greater level of commercial land use intensification
may occur within the existing service area. Therefore, sales growth may increase at a rate greater
than population growth. Despite these possible sales growth increases, a one percent annual rate
of funding increase was applied to provide a more conservative estimate of revenues.
Farebox Revenues
Farebox revenues are directly associated with changes in passenger ridership levels. An
assessment of Transit’s annual ridership and service hours was completed to better understand
how ridership was influenced, based on changes to the network’s service levels. Table 6.1
summarizes the relative change in annual service hours and passengers before the service
reductions in 2007 and after the reductions in 2009 and 2010. The table shows that ridership

2040 Regional Transportation Plan - Transit | Final
July 2015 | 96
levels have not fallen at the same rate as the rate of service hour reductions—with 2010 figures
showing a 39 percent decrease in service hours, while ridership decreased only 24 percent.
Table 6.2: Annual Service Hours and Passengers
2007 2009 2010
Annual hours 194,000 151,000
(-22% from 2007)
118,000
(-39% from 2007)
Annual passengers 3,200,000 3,000,000
(-6% from 2007)
2,400,000
(-24% from 2007)
This smaller relative decrease in annual ridership is attributed partly to the types of services that
were cut back or eliminated—many of which were newer services connecting newer communities
and employment areas that do not or have not experienced higher levels of transit service. System
ridership may not have fallen as much as the decrease in service hours because a larger majority
of passengers may be using the service without alternative travel options. Nevertheless, because
the service plan will focus on improving service reliability and providing expanded frequency and
span within the existing service area, it is expected that ridership levels will generally increase
over time at a rate similar to increases to service hours, at a rate of two percent annually.
Estimated Operating and Capital Funding Revenues
Based on existing funding sources and the established percentage increases from 2015 to 2040,
Transit is expected to receive just more than $800 million (in constant 2014 dollars). Table
6.3shows the funding Transit is estimated to receive from 2015 to 2040 based on the assumptions
identified in the previous sections. A further breakdown of estimated funding for the near term is
shown in Table 6.4.
Table 6.3: Estimated Funding Revenues (constant 2014 dollars, thousands)
Funding Source 2015 2016-2020
2021-2025
2026-2030
2031-2035
2036-2040
Section 5307 7,152 36,845 38,725 40,700 42,776 44,958
Section 5339 789 4,066 4,273 4,491 4,720 4,961
Section 5310 416 2,143 2,252 2,367 2,488 2,615
Congestion Mitigation and Air Quality Improvement (CMAQ)
384 1,979 2,080 2,186 2,298 2,415
Surface Transportation Program (STP-Metro)
245 1,264 1,329 1,397 1,468 1,543
PPRTA funds 7,860 40,494 42,560 44,731 47,013 49,411
City of Colorado Springs 4,326 24,930 28,863 30,351 31,899 33,526
FASTER 769 3,960 4,162 4,374 4,597 4,832
FASTER State Pool 49 250 263 276 290 305
Farebox, Advertising 3,892 20,211 21,283 22,369 23,510 24,709
Transportation Alternatives Program (TAP)
245 1,265 1,329 1,397 1,468 1,543
PPRTA Reserve 6,200 0 0 0 0 0

2040 Regional Transportation Plan - Transit | Final
July 2015 | 97
Funding Source 2015 2016-2020
2021-2025
2026-2030
2031-2035
2036-2040
PPRTA II 887 4,571 4,804 5,049 5,306 5,577
TOTAL 33,214 141,978 151,922 159,688 167,834 176,395
GRAND TOTAL 831,031
Table 6.4: Estimated Funding Revenues in the Near Term, 2015-2020 (constant 2014 dollars, thousands)
Funding Source 2015 2016 2017 2018 2019 2020
Section 5307 7,152 7,223 7,295 7,368 7,442 7,516
Section 5339 789 797 805 813 821 829
Section 5310 416 420 424 429 433 437
Congestion Mitigation and Air Quality Improvement (CMAQ)
384 388 392 396 400 404
Surface Transportation Program (STP-Metro)
245 248 250 253 255 258
PPRTA funds 7,860 7,939 8,018 8,098 8,179 8,261
City of Colorado Springs 4,326 4,546 4,766 4,986 5,206 5,426
FASTER 769 776 784 792 800 808
FASTER state pool 49 49 49 50 50 51
Farebox, advertising 3,892 3,931 4,010 4,050 4,090 4,131
Transportation Alternatives Program (TAP)
245 248 250 253 255 258
PPRTA reserve* 6,200 0 0 0 0 0
PPRTA II 887 896 905 914 923 932
TOTAL 33,214 27,461 27,949 28,401 28,855 29,312
* assumes the additional funds allocated from the PPRTA is a discretionary expenditure and will not recur in subsequentyears.
Estimated Operating and Capital Expenditures
A prioritized project list was compiled to understand the capital and operating expenditures to
maintain and expand fixed route and specialized transit services to meet the growing needs in the
community. Projects identified in the list were refined from the 2035 Regional Transportation
Update based on the fixed route and specialized recommendations identified in this plan as well
as feedback from PPACG and Transit.
The projects were prioritized first by ensuring that existing services are maintained throughout the
plan’s horizon (2040). Prioritization beyond maintaining existing services were generally assessed
based on its ability to meet the plan’s objectives, including providing transportation choice,
improving access to local destinations, improving the cost-effectiveness of services, relieving
congestion, promoting environmental stewardship, promoting economic vitality, and ensuring
coordination between various transit services.
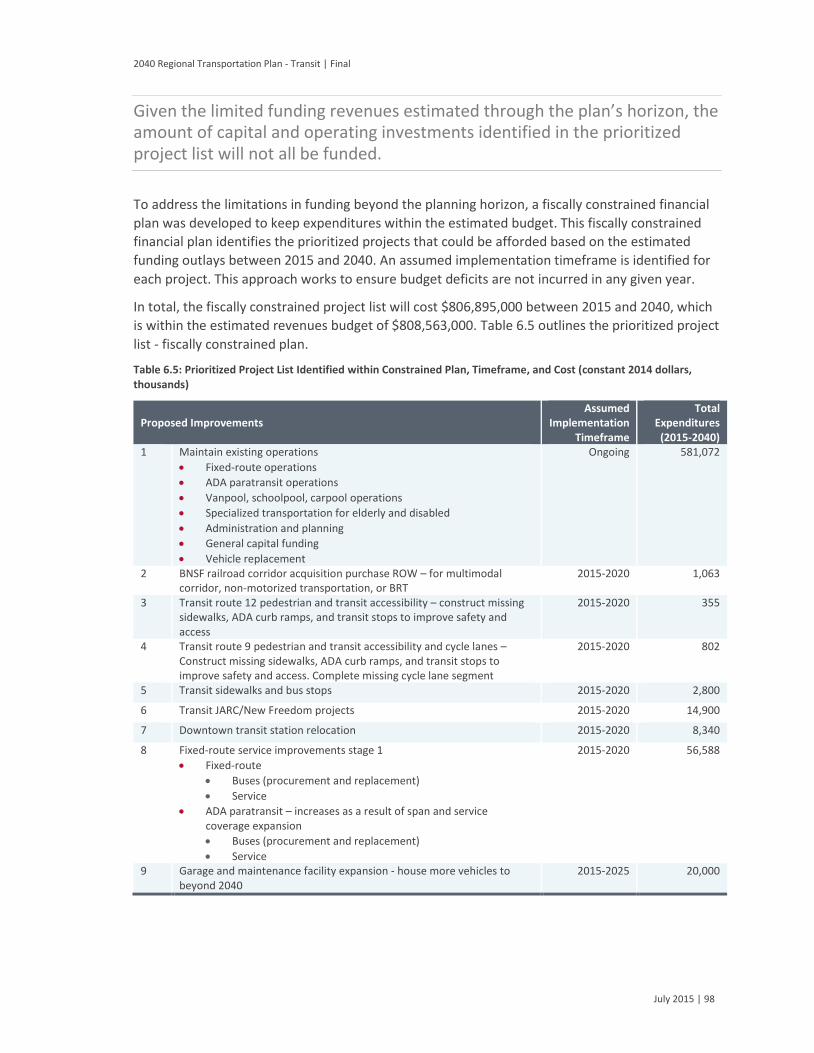
2040 Regional Transportation Plan - Transit | Final
July 2015 | 98
Given the limited funding revenues estimated through the plan’s horizon, the amount of capital and operating investments identified in the prioritized project list will not all be funded.
To address the limitations in funding beyond the planning horizon, a fiscally constrained financial
plan was developed to keep expenditures within the estimated budget. This fiscally constrained
financial plan identifies the prioritized projects that could be afforded based on the estimated
funding outlays between 2015 and 2040. An assumed implementation timeframe is identified for
each project. This approach works to ensure budget deficits are not incurred in any given year.
In total, the fiscally constrained project list will cost $806,895,000 between 2015 and 2040, which
is within the estimated revenues budget of $808,563,000. Table 6.5 outlines the prioritized project
list - fiscally constrained plan.
Table 6.5: Prioritized Project List Identified within Constrained Plan, Timeframe, and Cost (constant 2014 dollars, thousands)
Proposed Improvements Assumed
Implementation Timeframe
Total Expenditures
(2015-2040) 1 Maintain existing operations
Fixed-route operations
ADA paratransit operations
Vanpool, schoolpool, carpool operations
Specialized transportation for elderly and disabled
Administration and planning
General capital funding
Vehicle replacement
Ongoing 581,072
2 BNSF railroad corridor acquisition purchase ROW – for multimodalcorridor, non-motorized transportation, or BRT
2015-2020 1,063
3 Transit route 12 pedestrian and transit accessibility – construct missing sidewalks, ADA curb ramps, and transit stops to improve safety and access
2015-2020 355
4 Transit route 9 pedestrian and transit accessibility and cycle lanes – Construct missing sidewalks, ADA curb ramps, and transit stops toimprove safety and access. Complete missing cycle lane segment
2015-2020 802
5 Transit sidewalks and bus stops 2015-2020 2,800
6 Transit JARC/New Freedom projects 2015-2020 14,900
7 Downtown transit station relocation 2015-2020 8,340
8 Fixed-route service improvements stage 1
Fixed-route
Buses (procurement and replacement)
Service
ADA paratransit – increases as a result of span and service coverage expansion
Buses (procurement and replacement)
Service
2015-2020 56,588
9 Garage and maintenance facility expansion - house more vehicles to beyond 2040
2015-2025 20,000

2040 Regional Transportation Plan - Transit | Final
July 2015 | 99
Proposed Improvements Assumed
Implementation Timeframe
Total Expenditures
(2015-2040) 10 ADA paratransit service improvements stage 1
Buses (procurement and replacement)
Service
2021-2025 10,315
11 Transit variable message sign expansion, smartcard, IT, ITS, real time bus, etc.
2021-2025 10,000
12 Academy Blvd. corridor improvements (ABC Great Streets Study) – develop as a primary transit corridor
2021-2025 32,000
13 Fixed-route service improvements stage 2
Fixed-route
Buses (procurement and replacement)
Service
ADA paratransit – Increases as a result of span and service coverage expansion
Buses (procurement and replacement)
Service
2026-2030 30,529
14 ADA paratransit service improvements stage 2 2026-2030 7,015
15 Park-n-Ride access for cycles and pedestrians - improvements to park and ride lots 2026-2030
76
16 Transit bus transfer station reconstruction, Citadel Mall area 2026-2035 10,000
17 Transit bus stop amenity increase 2031-2035 100
18 Transit route 1 and 7 stage 2 enhancements 2031-2035 340
19 Transit route 6 stage 2 enhancements 2031-2035 275
20 Transit route 6 stage 3 enhancements 2031-2035 2,350
21 Transit route 6 stage 4 enhancements 2031-2035 3,790
22 Transit route 8 stage 2 enhancements 2031-2035 1,320
23 Transit route 9 stage 3 enhancements 2031-2035 1,185
24 Transit route 9 stage 4 enhancements 2031-2035 535
25 Transit route 12 stage 4 enhancements 2031-2035 320
26 Transit route 16 stage 2 enhancements 2031-2035 1,385
27 ADA paratransit service improvements stage 3
Buses (procurement and replacement)
Service.
2031-2035 3,665
28 Fixed-route service improvements stage 3
Fixed-route
Buses (procurement and replacement)
Service
ADA paratransit - increases as a result of span and service coverage expansion
Buses (procurement and replacement)
Service
2031-2035 15,241
29 Fixed-route service improvements stage 4 (only up to 80% of proposed changes)
Fixed-route
Buses (procurement and replacement).
Service
ADA paratransit – increases as a result of span and service coverage expansion
Buses (procurement and replacement)
Service
2036-2040 11,621
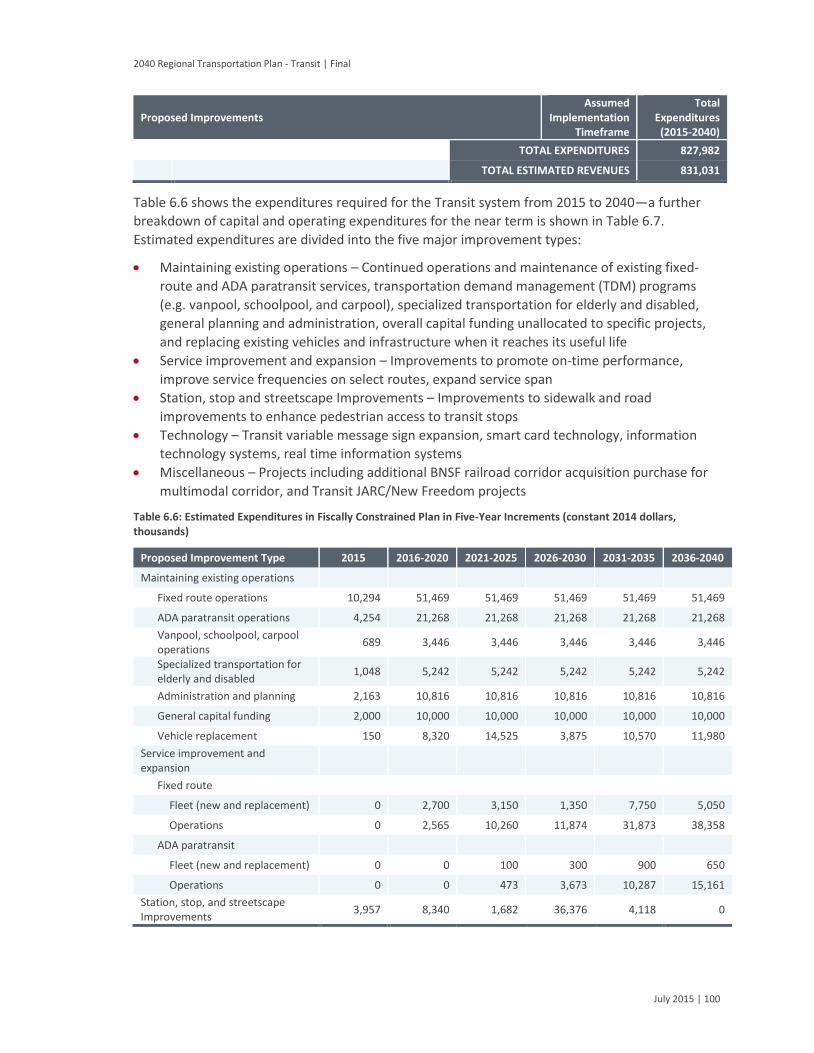
2040 Regional Transportation Plan - Transit | Final
July 2015 | 100
Proposed Improvements Assumed
Implementation Timeframe
Total Expenditures
(2015-2040)
TOTAL EXPENDITURES 827,982
TOTAL ESTIMATED REVENUES 831,031
Table 6.6 shows the expenditures required for the Transit system from 2015 to 2040—a further
breakdown of capital and operating expenditures for the near term is shown in Table 6.7.
Estimated expenditures are divided into the five major improvement types:
Maintaining existing operations – Continued operations and maintenance of existing fixed-
route and ADA paratransit services, transportation demand management (TDM) programs
(e.g. vanpool, schoolpool, and carpool), specialized transportation for elderly and disabled,
general planning and administration, overall capital funding unallocated to specific projects,
and replacing existing vehicles and infrastructure when it reaches its useful life
Service improvement and expansion – Improvements to promote on-time performance,
improve service frequencies on select routes, expand service span
Station, stop and streetscape Improvements – Improvements to sidewalk and road
improvements to enhance pedestrian access to transit stops
Technology – Transit variable message sign expansion, smart card technology, information
technology systems, real time information systems
Miscellaneous – Projects including additional BNSF railroad corridor acquisition purchase for
multimodal corridor, and Transit JARC/New Freedom projects
Table 6.6: Estimated Expenditures in Fiscally Constrained Plan in Five-Year Increments (constant 2014 dollars, thousands)
Proposed Improvement Type 2015 2016-2020 2021-2025 2026-2030 2031-2035 2036-2040
Maintaining existing operations
Fixed route operations 10,294 51,469 51,469 51,469 51,469 51,469
ADA paratransit operations 4,254 21,268 21,268 21,268 21,268 21,268
Vanpool, schoolpool, carpool operations
689 3,446 3,446 3,446 3,446 3,446
Specialized transportation for elderly and disabled
1,048 5,242 5,242 5,242 5,242 5,242
Administration and planning 2,163 10,816 10,816 10,816 10,816 10,816
General capital funding 2,000 10,000 10,000 10,000 10,000 10,000
Vehicle replacement 150 8,320 14,525 3,875 10,570 11,980
Service improvement and expansion
Fixed route
Fleet (new and replacement) 0 2,700 3,150 1,350 7,750 5,050
Operations 0 2,565 10,260 11,874 31,873 38,358
ADA paratransit
Fleet (new and replacement) 0 0 100 300 900 650
Operations 0 0 473 3,673 10,287 15,161
Station, stop, and streetscape Improvements
3,957 8,340 1,682 36,376 4,118 0
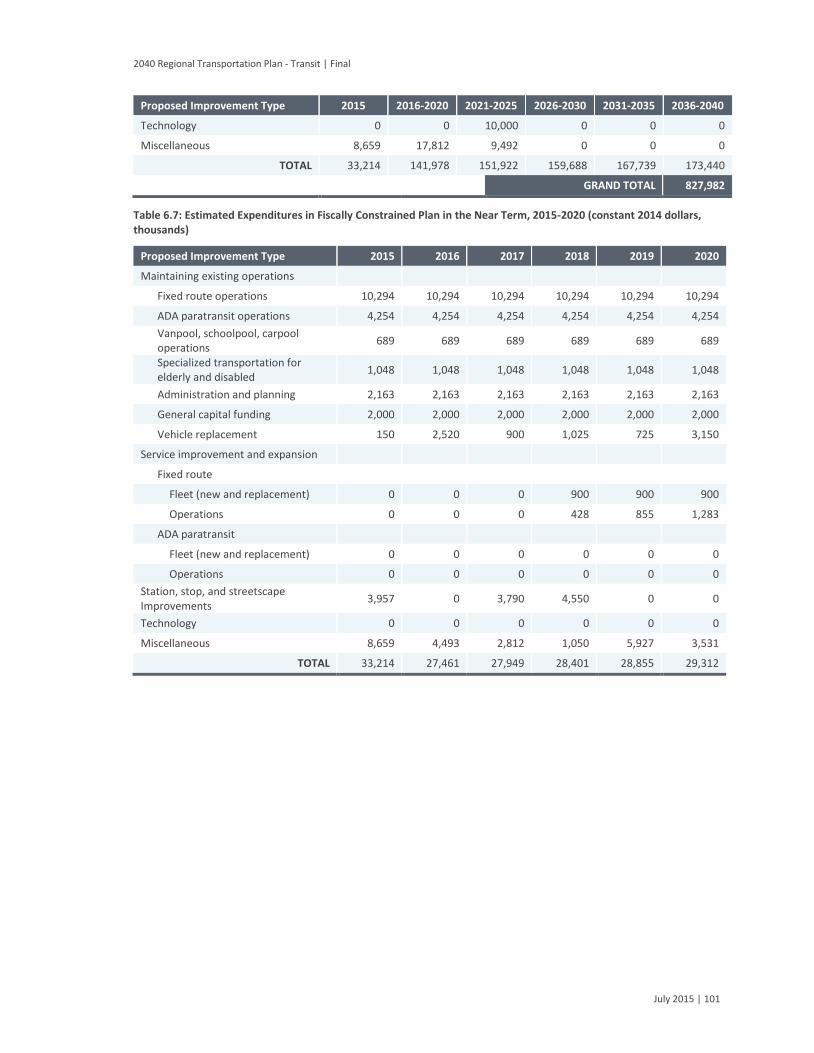
2040 Regional Transportation Plan - Transit | Final
July 2015 | 101
Proposed Improvement Type 2015 2016-2020 2021-2025 2026-2030 2031-2035 2036-2040
Technology 0 0 10,000 0 0 0
Miscellaneous 8,659 17,812 9,492 0 0 0
TOTAL 33,214 141,978 151,922 159,688 167,739 173,440
GRAND TOTAL 827,982
Table 6.7: Estimated Expenditures in Fiscally Constrained Plan in the Near Term, 2015-2020 (constant 2014 dollars, thousands)
Proposed Improvement Type 2015 2016 2017 2018 2019 2020
Maintaining existing operations
Fixed route operations 10,294 10,294 10,294 10,294 10,294 10,294
ADA paratransit operations 4,254 4,254 4,254 4,254 4,254 4,254
Vanpool, schoolpool, carpool operations
689 689 689 689 689 689
Specialized transportation for elderly and disabled
1,048 1,048 1,048 1,048 1,048 1,048
Administration and planning 2,163 2,163 2,163 2,163 2,163 2,163
General capital funding 2,000 2,000 2,000 2,000 2,000 2,000
Vehicle replacement 150 2,520 900 1,025 725 3,150
Service improvement and expansion
Fixed route
Fleet (new and replacement) 0 0 0 900 900 900
Operations 0 0 0 428 855 1,283
ADA paratransit
Fleet (new and replacement) 0 0 0 0 0 0
Operations 0 0 0 0 0 0
Station, stop, and streetscape Improvements
3,957 0 3,790 4,550 0 0
Technology 0 0 0 0 0 0
Miscellaneous 8,659 4,493 2,812 1,050 5,927 3,531
TOTAL 33,214 27,461 27,949 28,401 28,855 29,312