21300492 word file bakri chai
DESCRIPTION
wagh bakriTRANSCRIPT


Table of ContentsPage 11.0 Executive Summary1.1 Objectives 1.2 Mission 1.3 Keys to Success 2.0 Company Summary2.1 Company Ownership 2.2 Start-up Summary 2.3 Company Locations and Facilities 3.0 Products3.1 Product Description 3.2 Competitive Comparison3.3 Sourcing 3.4 Technology3.5 Future Products 4.0 Market Analysis Summary 4.1 Market Segmentation 4.2 Target Market Segment Strategy4.2.1 Market Trends 4.2.2 Market Growth 4.2.3 Market Needs 4.3 Industry Analysis4.3.1 Distribution Patterns 4.3.2 Competition and Buying Patterns 4.3.3 Main Competitors 4.3.4 Industry Participants5.0 Strategy and Implementation Summary 5.1 Strategy Pyramid 5.2 Value Proposition 5.3 Competitive Edge5.4 Marketing Strategy 5.4.1 Promotion Strategy 5.4.2 Distribution Strategy 5.4.3 Marketing Programs 5.4.4 Positioning Statement 5.4.5 Pricing Strategy5.5 Sales Strategy5.5.1 Sales Forecast 5.5.2 Sales Programs 5.6 Strategic Alliances

6.0Personnel Plan 7.0 Financial Plan7.1 Important Assumptions7.2 Key Financial Indicators 7.3 Break-even Analysis7.4 Projected Profit and Loss 7.5 Projected Cash Flow 7.6 Projected Balance Sheet 7.7 Business Ratios 7.8 Exit Strategy

Waghbakri Tea Brands delight millions of tea lovers all over the world
Waghbakri tea house is in existence since 1892 and is a family managed business with a professional approach. The tea house is highly experienced in production of the finest tea blends including antioxidant rich organic green tea. The art of blending has been handed over generations down, which is the secret behind the master blends that the company exports as branded tea products all over the world. The company has more then a hundred thousand retail outlets in India and is fast expanding its base in Indian and oversees markets.
The Waghbakri Tea company has exceeded over INR Rs. 350 crores( US$ 85 million) annualy and sells 20 million kilograms plus of certified, premium teas tea annually.
The tea house offers many popular brands in tea bags and excusitively designed, exotic carton packings. The blending and packaging is done in the companies state of art plant
in a 35000 sq.yard campus.
Waghbakri Group companies behold a highly futuristic outlook and constantly modernise their manufacturing bases that conform to International standards in packaging and production of finest certified teas.
The tea company employs professional managers, talented tea tasters and highly skilled staff that assures stringent quality controls and optimum production levels that are in tandem with the companies ever growing base of distribution network and brand loyals. The numbers grow by minutes.
GROUP FRONTLINE
Mr. Piyush Desai

Mr. Pankaj Desai, Managing Director, graduate and highly experienced in the art of tea tasting with 30 years of experience. He handles finance and taxation as well.
Mr. Rasesh Desai, Managing Director, a qualified engineer highly experienced in the marketing and production of tea, which he manages efficiently. He spearheads the Company's fast growing tea exports.
Mr. Parag Desai, Whole time Director, MBA, Long Island University, USA is an engergetic young man highly experienced in tea tasting and is in charge of sales and marketing division and exports.
Mr. Paras Desai, Whole time Director, Diploma in Management Studies, Ohio State University, is experienced and enterprising, he is in charge of tea purchase and tea tasting department.
Since the begining....
Year 1892, on call from Mahatma Gandhi, Sir Narandas Desai left India for South Africa. He procured a tea estate in the year 1915. But facing racial discrimination in South Africa he left that country and came back to India with a certificate of merit from The Mahatma Gandhi and few belongings, and years of experience as tea-estate owner to count on.
Year 1919, Sir Narandas established tea business in Ahmedabad. The firm was named The Gujarat Tea Depot Co. with first retail outlet for wholesale teas at Gandhi Road, Ahmedabad, India (erstwhile Richie Road).
Year 1925, Wagh Bakri brand was born now a favorite of millions of tea lovers.
Year 1944, the Good Morning brand of premium blended tea leaf was introduced for tea connoisseurs, a blend rich in full bodied taste and aroma. The tea cuppers discovered it to be the right brand to begin their mornings fresh with a cup that cheers.
Year 1976, encouraged by the success “Wagh Bakri” tea house enters into large scale distribution of Good Morning.
Year 1980, the first to recognize the need for packaged teas, the group established Gujarat Tea Processors & Packers Limited to meet a growing demand for quality blends of branded teas and with the aim of selling quality tea products to the tea lovers in India and globally.
Year 1986, the Standard Tea Processing Co. Limited was established with a view to avail the benefits of mechanized operations and meet with demands for bulk teas. The Company also started an office in Kolkata to oversee and check the purchase of tea at auction centres there.
Year 1989, D'ling Brand a pure certified premium Darjeeling Tea was launched especially for tea connoisseurs. Darjeeling tea is popular for its smooth mellow flavor and overpowering aroma.
Year 1991 the increased demand of packaged tea by professionals in the corporate segment initiated the launch of "Tea Quik" tea bags. The utility of tea bag is immense. It is travel, worthy, quick to make at home hygienically.
Year 1994, For the larger audience "MILI” tea" was launched. Being an affordable quality tea in carton and jar, it finds place in the hearts of tea lovers all over the world.
Year 1998, the Wagh Bakri brand launched in Rajasthan, India.

Wagh Bakri Ahmedabad Management Association’s [AMA] Centre for Governance established.
Year 1999, the Wagh Bakri brand enters the central Indian state of Madhya Pradesh, India.
Year 2003, Premium brand of the Company “Wagh Bakri” secured its place among top 100 popular brands in India as per survey undertaken by AC. Nielsen’s in Brand Equity’s survey of India’s biggest FMCG Brands – 2002.
Year 2004, Company received ISO : 9001 : 2000 and HACCP Certification.
Year 2006, With a view to synergize efforts and operations Standard Tea Processing Co. Ltd. merged into Gujarat Tea Processors & Packers Ltd.
Year 2007, Company started office at Mumbai (India) to expand its operations. Company also shifted its Kolkata office with upgraded infrastructure and facilities.
Company entered into Maharashtra (India) state by launching “Wagh Bakri” Perfect Tea packets under different pack sizes.
Year 2008, Company imported Double Chamber Tea Bag Machine viz. IMA C 27 from Italy having capacity of manufacturing 250 bags per minute.
Company received EN ISO 22000:2005 Certification for Company’s Food Safety Management System for Blending and Packaging of Tea.
Company acquired the land admeasuring 25,748 sq.meters adjoining to existing Dholka factory and also 12,595 sq. meters at village Tundel, Taluka Nadiad, Gujarat for the purpose of expansion / setting up of Tea Blending factory and storage facilities.
Opened a Wagh Bakri Tea Lounge at Ville Parle [East], Mumbai, which serves Ice Tea and all premium varieties of Tea manufactured / marketed by Wagh Bakri Tea Group along with snacks.
MILESTONES
From Sir Narandas to the present 4th generation of professional managers.From a one retail outlet to more than 1,00,000 retail outlets.From one brand to many brands, with each brand a landmark.As times change, Waghbakri group moves forth with values and ethics firmly entrenched. Commissioning another world class plant in Nadiad (Central Gujarat) - Land already acquired.
WAGHBAKRI HOUSE
Inaugurated in the year 2006, WaghBakri Corporate Office is dedicated to its founder and augurs new resolutions and futuristic vision.
In less than two decades, WaghBakri group has firmly grown by leaps and bounds the brands have firmly estabilished itself in the hearts of millions of tea drinkers in India and abroad. Waghbakri group shines forth as a top tea house in India despite the towering presence of

multinationals and Indian conglomerates.
WaghBakri group has crossed 100 years and is the fastest growing tea producers in India.
Times have changed, but values have been preciously preserved.

The Daily Perc
The Daily Perc
Executive Summary
The Daily Perc (TDP) is a specialty beverage retailer. TDP uses a system that is new to the beverage and food service industry to provide hot and cold beverages in a convenient and time-efficient way. TDP provides its customers the ability to drive up and order (from a trained Barista) their choice of a custom-blended espresso drink, freshly brewed coffee, or other beverage. TDP is offering a high-quality option to the fast-food, gas station, or institutional coffee.The Daily Perc offers its patrons the finest hot and cold beverages, specializing in specialty coffees, blended teas, and other custom drinks. In addition, TDP will offer soft drinks, fresh-baked pastries and other confections. Seasonally, TDP will add beverages such as hot apple cider, hot chocolate, frozen coffees, and more.
The Daily Perc will focus on two markets
The Daily Commuter- someone travelling to or from work, out shopping, delivering goodsor services, or just out for a drive.

The Captive Consumer- someone who is in a restricted environment that does notallow convenient departure and return while searching for refreshments, or whererefreshments stands are an integral part of the environment.The Daily Perc will penetrate the commuter and captive consumer markets by deploying Drive-thru facilities and Mobile Cafes in the most logical and accessible locations. The Drive-thru facilities are designed to handle two-sided traffic and dispense customer designed, specially ordered cups of premium coffees in less time than required for a visit to the locally owned cafe or one of the national chains.
In addition to providing a quality product and an extensive menu of delicious items, to ensure customer awareness and loyalty, as well as good publicity coverage and media support, we will be donating up to 7.5% of revenue to local charities based upon customer choices.The Daily Perc's financial picture is quite promising. Since TDP is operating a cash business, the initial cost is significantly less than many start-ups these days. The process is labor intensive and TDP recognizes that a higher level of talent is required. The financial investment in its employees will be one of the greatest differentiators between it and TDP's competition. For the purpose of this pro-forma plan, the capital expenditures of facilities and equipment are financed. There will be minimum inventory on hand so as to keep the product fresh and to take advantage of price drops, when and if they should occur.
The Daily Perc anticipates the initial combination of investments and long term financing of 1,04,25,000 to carry it without the need for any additional equity or debt investment, beyond the purchase of equipment or facilities. This will mean growing a bit more slowly than might be otherwise possible, but it will be a solid, financially-sound growth based on customer request and product demand.
The Daily Perc
The Daily Perc chooses to become the Drive-thru version of Starbucks between themountains, obtaining several lakh Rupees through an initial public or private offering that would allow the company to open twenty to thirty facilities per year in all metropolitan communities in the North, Midwest, and South of Mumbai with a population of over 1 crore. This is the preferred Exit Strategy of the Management Team. The danger in this is that competitors would rise up and establish a foothold on a community before--or in the midst of--the arrival of The Daily Perc, causing a potential for a drain on revenues and a dramatic increase in advertising expenditures to maintain market share. Knowing these risks--and planning for them--gives TDP the edge needed to make this scenario work.

LOCATION
We have decided to launch 4 beverage retailer in Mumbai :
WHY MUMBAI???????
Mumbai is the commercial and entertainment centre of India, generating 5% of India's GDP and accounting for
25% of industrial output, 40% of maritime trade, and 70% of capital transactions to India's economy.Mumbai is
one of the world's top ten centres of commerce by global financial flow, home to important financial
institutions such as the Reserve Bank of India, the Bombay Stock Exchange, the National Stock Exchange of
India and the corporate headquarters of many Indian companies and numerous multinational corporations. The
city also houses India's Hindi film and television industry, known as Bollywood. Mumbai's business
opportunities, as well as its potential to offer a better standard of living, attract migrants from all over India
and, in turn, make the city a potpourri of many communities and cultures.
Transport

The Chhatrapati Shivaji Terminus, formerly known as Victoria Terminus, headquarters of the Central Railway,
is a UNESCO World Heritage Site.
A Modern BEST bus (Starbus).
Chhatrapati Shivaji International Airport is South Asia's busiest airport

Sales Gross MarginNet Profit Rupees
1,000,0002,000,0003,000,0004,000,0005,000,0006,000,000
FY 2009-FY 2014
ObjectivesThe Daily Perc has established three firm objectives it wishes to achieve in the next three years:
1. Thirteen Drive-thru locations and four fully booked Mobile Cafes by the end of the third year.2. Gross Margin of 45% or more.3. Net After-tax Profit above 15% of Sales.
MissionThe Daily Perc Mission is three-fold, with each being as integral to our success as the next.
Product Mission - Provide customers the finest quality beverage in the mostefficient time.
Community Mission - Provide community support through customerinvolvement.
Economic Mission - Operate and grow at a profitable rate through soundeconomic decisions.

Keys to Success
There are four keys to success in this business, three of which are virtually the same as any food service business. It is our fourth key--the Community Mission--that will give us that extra measure of respect in the public eye.
1. The greatest locations - visibility, high traffic pattern, convenient access.2. The best products - freshest coffee beans, cleanest equipment, premium serving containers, consistent flavor.3. The friendliest servers - cheerful, skilled, professional, articulate.4. The finest reputation - word-of-mouth advertising, promotion of ourcommunity mission of charitable giving.
Company Summary
The Daily Perc is a specialty beverage retailer. TDP uses a system that is new to thebeverage and food service industry to provide hot and cold beverages in a convenient and time-efficient way. TDP provides its customers the ability to drive up and order from a trained Barista their choice of a custom blended espresso drink, freshly brewed coffee, or other beverage. TDP is offering a high quality option to the fast-food, gas station, and institutional coffee.
Company Ownership
The Daily Perc is a Limited Liability Corporation. All membership shares are currentlyowned by members, with the intent of using a portion of the shares to raisecapital. The plan calls for the sale of 4 membership units in the company friends,. Each membership unit in the company is priced at 2,20,00,000.
Start-up SummaryThe Daily Perc's start-up expenses and funding are shown in the tables and chart below.The majority of these funds will be used to build the first facility, pay deposits, andprovide capital for six months of operating expenses, initial inventory and other one-timeexpenses. The Daily Perc anticipates the need for operating capital for the first fewmonths of operation

Start-up Requirements
Start-up Expenses
Legal 3,500 Office Equipment 4,950 Drive-thru Labor (6 months) 65,00
0 Drive-thru Finance Payment (6 months)
12,300
Drive-thru expenses (6 months) 8,520 Land Lease (6 months) 7,200 Vehicle Finance (6 months) 3,700 Administration Labor (6 months) 54,000 Website Development & Hosting 5,600 Identity/Logos/Stationary 4,000 Other 5,000 Total Start-up Expenses 173,770
Start-up Assets Cash Required 25,500 Start-up Inventory 35,000 Other Current Assets 0 Long-term Assets 131,400 Total Assets 191,900
Total Requirements 365,670 SALES IN LAKHS

Start-up Funding
Start-up Funding Start-up Expenses to Fund 173,770 Start-up Assets to Fund 191,900 Total Funding Required 365,670
Assets Non-cash Assets from Start-up 166,400 Cash Requirements from Start-up
25,500
Additional Cash Raised 0 Cash Balance on Starting Date 25,500
Total Assets Liabilities and Capital
191,900
Liabilities Current Borrowing 9,000 Long-term Liabilities 131,400 Accounts Payable (Outstanding Bills)
0
Other Current Liabilities (interest-free)
0
Total Liabilities 140,400
Capital
Planned Investment Partner 1 10,000 Partner 2 10,000 Partner 3 10,000 Partner 4 10,000 Partner 5 11,500 Partner 6 10,000 Partner 7 11,500 Partner 8 10,000 Partner 9 11,500 Partner 10 10,000 Partner 11 11,500 Partner 12 11,500 Other 97,770 Additional Investment Requirement
0
Total Planned Investment Loss at Start-up (Start-up Expenses) Total Capital
225,270 (173,770)
51,500

Company Locations and Facilities
The Daily Perc will open its first drive-thru facility on Mumbai Shopping Centre(In orbit). Three more drive-thru facilities will be placed throughout the metropolitan area over the next few months The drive-thru in the Colonial Square Shopping Centre will serve as the commissary for the first mobile unit. The demographic and physical requirements for a Drive-thru location are:
Visible from roadway.IN shopping Mall.
Areas Under Colaba
• Cuffee Parade
Area :2050 sq feet
Rate per sq feet:30,000
Cost : 6 crores 10 lakhs
On rent:75,000 per month
Infra:10 lakhs
Total set up of outlet in colaba : 4crores and 20 lakhs

POWAI
The Powai area has grown tremendously in the past decade and it is presently a residential, commercial and retail hub for the eastern suburbs of Bombay - in news more for traffic snarls than anything else.
A local weekly newspaper Planet Powai regularly reports on the latest news and development of this area.
Stretch of Jogeshwari-Vikhroli Link (JVL) Road called 'Adi Shankaracharya Marg' (AS Marg) is passing through this suburb.
The suburb has grownup in recent past into a modern township with its grand Hiranandani Garden and other state-of-art structures and Residential complexes.
Its a truly cosmopolitan area with people of different ethnicity and nationalities making it their home.
Hiranandani Gardens is a township located in Powai, a northern suburb of Mumbai. The township is approachable by Adi Shankaracharya Marg (ADS Marg), a part of Jogeshwari Vikhroli Link Road (JVLR). The nearest Mumbai Suburban Railway station is Kanjurmarg and Vikhroli.
The township is dotted with skyscraper residential towers, many with very expensive apartments. Its skyline is immediately recognizable due to the heavy use of classic Greco-Roman architectural influences, especially at the topmost level. The residential towers often have a second underground parking level. Residents in one or more buildings form cooperative societies together to take care of issues related to utilities and aesthetics, resolve neighborly disputes and hold events on festivals or other occasions.

Hiranadini gardens (Powai)
Location :Hiranadini gardens
Area :2250 sq feet
Rate per sq feet:25,000
Cost :5 crores 50 lakhs
On rent:85,000 per month
Total set up of outlet in bandra : 3 crores and 65 lakhs

VASHI
Vashi is an upmarket residential as well as commercial township in the city of Navi Mumbai and is popularly called the 'king' of Navi Mumbai. It is one of the first "nodes" developed by CIDCO in the city.
Populace
Vashi's reputation for being organized, but not too large or crowded like "the big city", has led to the continued growth of its resident and commuter population. Vashi is among the top ten most developed zones in the Mumbai Metropolitan area.The estimate population of Vashi is around 400,000. Vashi is the second most populated node of Navi Mumbai after Nerul
Location :vashi station
Area :1950 sq feet
Rate per sq feet:15,000
Cost :2 crores 90 lakhs
O rent:85,000 per month
Infra:15 lakhs
Total set up of outlet in vashi : 1 crores and 5 lakhs

Products
The Daily Perc provides its patrons the finest hot and cold beverages, specializing inspecialty coffees and custom blended teas. In addition, TDP will offer select domestic soft drinks, Italian sodas, fresh-baked pastries, and other confections. Seasonally, TDP will add beverages such as hot apple cider, hot chocolate, frozen coffees, and more.
Product Description
TDP provides its customers, whether at a Drive-thru facility or one of the Mobile Cafes, the ability to custom order a coffee beverage that will be blended to their exact specifications. Each of TDP's sales person will be trained in the fine art of brewing, blending, and serving the highest quality hot and cold beverages, with exceptional attention to detail. Besides coffees, The Daily Perc will offer teas, domestic and frozen coffee beverages, seasonal specialty drinks, pastries, and other baked goods. Through the website and certain locations, TDP will market premium items such as coffee mugs, T-shirts and sweatshirts, ball caps, and more.

Competitive ComparisonThe Daily Perc considers itself to be a player in the retail coffee house industry. However, it knows that competition for its products range from soft drinks to milk shakes to adult beverages.
The Daily Perc's primary competition will come from three sources:
1. Café Coffe Day
2.Barista
3. Locally owned and operated cafes.4. Fast food chains and convenience stores.
Two things will make The Daily Perc stand out from all its competitors:The Daily Perc will be providing products in the most convenient and efficient wayavailable--either at one of the two-sided Drive-thru shops, or at one of the Mobile Cafes. This separates TDP from the competition in that its customers won't need to find a parking place, wait in a long line, jockey for a seat, and clean up the mess left by a previous patron. TDP customers can drive or walk up, order their beverage, receive and pay for the beverage, and drive off.
The second differentiator is The Daily Perc's focus on providing a significant benefit to the community through a possible 7.5% contribution to customer-identified charities, schools, or other institutions.
SourcingThe Daily Perc purchases its coffees from PJ's Coffee. TDP also has wholesale purchasing agreements for other products with Major Brands, Coca-Cola, Big Train, Lamp’s .
Products, and Royal Distribution.The Drive-thru facilities are manufactured by City Stations and the Mobile Cafes aremanufactured by India Tech Industries. Fulfilment equipment suppliers include PJ's Coffee, City Stations, Talbert Ford, and Retail Image Programs. The Daily Perc's computer equipment and Internet connectivity is provided by BSNL Communications.
TechnologyThe Daily Perc's delivery system is based on its technology. TDP is using state-of-the-art, two-sided, Drive-thru facilities to provide convenience and efficiency for its clientele. An architectural exterior diagram of the Drive Thru building can be found on the following page (removed from this sample plan).The Daily Perc has also designed state-of-the-art Mobile Cafes that will be deployed from time to time on high school and college campuses, corporate campuses, and at special events.
Future ProductsAs seasons change, The Daily Perc will be offering products that will enhance sales and satisfy its customers' desires. During summer months, TDP will subsidize lower hot beverage sales with frozen coffee drinks, as well as soft drinks, and other coldbeverages. TDP will also have special beverages during holiday seasons, such as Egg Nog during the Christmas season and Hot Apple Cider in the Fall.The Daily Perc's primary desire will be to listen to its customers to ascertain what they are looking for most, and provide it.

Market Analysis Summary.
The Daily Perc will focus on two markets:
1. The Daily Commuter - someone traveling to or from work, out shopping,delivering goods or services, or just out for a drive.
2. The Captive Consumer - someone who is in a restricted environment thatdoes not allow convenient departure and return while searching forrefreshments, or where refreshments stands are an integral part of the environment.
Market Segmentation
The Daily Perc will focus on two different market segments: Commuters and CaptiveConsumers. To access both of these markets, TDP has two different delivery systems. For the commuters, TDP has the Drive-thru coffee house. For the captive consumer, TDP has the Mobile Cafe. Commuters are defined as any one or more individuals in a motorized vehicle traveling from point "A" to point "B." The Daily Perc's greatest concentration will be on commuters heading to or from work, or those out on their lunch break. Captive Consumers would include those who are tethered to a campus environment, or in a restricted entry environment that does not allow free movement to and from. Examples would include high school and college campuses, where there is limited time between classes, and corporate campuses where the same time constraints are involved, but regarding meetings and project deadlines, and special events--such as carnivals, fairs or festivals--where there is an admission price to enter the gate, but exiting would mean another admission fee, or where refreshments are an integral part of the festivities.
The following chart and table reflect the potential numbers of venues available for the Mobile Cafes and what growth could be expected in those markets over the next five years. For a conservative estimate of the number of Captive Consumers this represents, multiply the total number of venues in the year by 1,000. As an example, in the first year, The Daily Perc is showing that there are a total of 2,582 venues at which we might position a Mobile Cafe. That would equate to a Captive Consumer potential of 2,582,000. Similarly, there are well over 2,500,000 commuters in the metropolitan area, as well as visitors, vacationers, and others. It can also be assumed that these commuters do not make only one purchase in a day, but in many cases, two and even three beverage purchases.The chart reflects college and high school campuses, special events, hospital campuses, and various charitable organizations. A segment that is not reflected in the chart (since it would skew the chart so greatly) is the number of corporate campuses in the metropolitan area. There are over 1,700 corporate facilities that house more than 500 employees, giving us an additional 1,700,000 prospective customers, or total of 25 locations at which we could place a Mobile Cafe.

Target Market Segment Strategy
TDP's target market is the mobile individual who has more money than time, and excellent taste in a choice of beverage, but no time to linger in a cafe. By locating the Drive-Thrus in high traffichigh visibility areas, this unique--and abundant--consumer will seek The Daily Perc out and become a regular guest.
To penetrate the target market for the Mobile Cafes, these units will do what they were designed to do. The Daily Perc will take the cafe to the customer! By using thecommunity support program TDP is instituting, arrangements will be made to visit a high school, college campus, or a corporate campus once or twice a month (Even visit these facilities for special games, tournaments, recruiting events, or corporate open houses). And, for every cup or baked good sold, a portion is returned to the high school or college. It becomes a tremendous, painless way for the institution to gain a financial reward while providing a pleasant and fulfilling benefit to their students or employees.
School/Colleges
Hospitals

Market Analysis 2009 2010 2011 2013 02014 Potential Customers Growth CAGR
Year
Public High School Campuses
Percentage13%
2009 2010 2011 2012 2013
Private High Schools 15% 88 88 88 88 88 College Campuses 33% 77 77 77 77 77 Golf Courses 5% 99 99 99 99 99 Special Events 12% 43 44 45 46 47 Non-Profits w/$500K+ Budgets
5% 362 369 376 384 392
Hospital Campuses 17% 100 100 100 100 100 Total 100% 849 858 867 877 887

Market Trends
Nearly twenty years ago, a trend towards more unique coffees began to develop in the India. There had always been specialty coffee stores, such as Gloria Jeans and others, but people began to buy espresso machines for their homes and offices, and people began to have coffee tastings. Then espresso bars began to appear and, inevitably, along came Starbucks the Barista the upwardly mobile professional who wanted to take control over how their beverage would taste and smell. However, we have also become more rushed for time during that same period. Those same consumers who helped push Starbucks to 10 Corer in local sales are now rushing kids to soccer and basketball games, running to the grocery and trying to get to work on time and back home in time for dinner or to get to the next soccer game. Yet, they still have the desire for that refreshing, specially blended coffee each morning. Lately, we've seen the introduction of beverage dispensers at convenience stores that spit out overly-sweet, poorly blended cappuccinos in flavors such as french vanilla or mocha, and consumers are paying as much as 35 Rs for these sub-standard beverages. The market is primed for the introduction of a company that offers a superior quality, specially blended product in a convenient, drive-thru environment at a price that is competitive to the national coffee house
Market Growth
According to industry statistics, the consumption of coffee and flavored coffee products is growing rapidly. The largest national brand for retail coffee outlets achieved 2.2 billion in sales in 2000 with 3,000 retail outlets. They are anticipating opening 7,000 more outlets in the next five years and increasing revenues to over 6 billion. That is the coffee consumer market. The segment of that market we are targeting is the commuter and that number is increasing. In the metropolitan area, as with many metropolitan areas in the country, there is a migration away from the cities. It is estimated that there are well over 2.5 million commuters driving to and from work each day in our market. Statistically, at least 50% of those are coffee drinkers. That gives The Daily Perc a significant daily target for its products. Those numbers are growing by 6% per year.
Market Needs
The United States is a very mobile society. With the introduction of the automobile, we became a nation that thrived on the further freedom of going where we wanted when we wanted. It has only gotten worse. There are over 250 million men, women and children in India, half of whom are too old, too young, or too poor to drive an automobile. Yet, there are more licensed vehicles in the country than people. And that mobility has created a unique need in our society.Our market is made up of consumers who have busy schedules, a desire for quality, and disposable income. As much as they would like the opportunity to sit in an upscale coffee house and sip a uniquely blended coffee beverage and read the morning paper, they don't have the time. However, they still have the desire for the uniquely blended beverage as they hurry through their busy lives.

Industry Analysis
The coffee industry has grown by tremendous amounts in India. over the past fiveyears. CCD the national leader, had revenues in fiscal 2009 of 2.2 billion. That is an increase of 32% over Fiscal 1999. Starbucks plans to increase revenues to over 6.6 billion from 10,000 retail outlets by 20012. Even general coffee sales have increased with international brands such as Folgers, Maxwell House, and Safari coffee reporting higher sales and greater profits.America is definitely a coffee drinking country and the coffee industry is reaping theRewards
Distribution Patterns
The cafe experience comes from the Italian origins of espresso. The customer comes in to a beautifully decorated facility, surrounded by wondrous aromas and finds himself involved in a sensory experience that, more often than not, masks an average product at a premium price. However, the proliferation of cafes in the United States proves the viability of the market. It is a duplication of the same delivery process as currently exists in Europe.
Competition and Buying Patterns
There are four general competitors in The Daily Perc's drive-thru market. They are the national specialty beverage chains, such as Starbucks and Panera, local coffee houses—or cafes--with an established clientele and a quality product, fast food restaurants, and convenience stores. There is a dramatic distinction among the patrons of each of these outlets. Patrons to a Starbucks, or to one of the local cafes, are looking for the "experience" of the coffee house. They want the ability to "design" their coffee, smell the fresh pastry, listen to the soothing Italian music, and read the local paper or visit with an acquaintance. It is a relaxing, slow paced environment. Patrons of the fast food restaurants or the convenience stores are just the opposite. They have no time for idle chatter and are willing to over-pay for whatever beverage the machine can spit out, as long as it's quick. They pay for their gas and they are back on the road to work. Although they have the desire and good taste to know good from bad, time is more valuable to them.
Competitors to the Mobile Cafes on campuses would include fast food restaurants--assuming they are close enough to the consumer that they can get there and back in the minimal allotted time, vending machines, and company or school cafeterias. The consumers in this environment are looking for a quick, convenient, fairly priced, quality refreshment that will allow them to purchase the product and return to work, class, or other activity. Competitors to the Mobile Cafes at events such as festivals and fairs would include all the other vendors who are licensed to sell refreshments. Attendees to such events expect to pay a premium price for a quality product.
Main Competitors
When measuring head-to-head, direct competitors, we have found that there are none in the metropolitan area. The Daily Perc will be the first double-sided, drive-thru coffee house in the metropolitan area. However, there is still significant competition from traditional coffee houses and other retailers.

National Chains
Starbucks, the national leader, had revenues in fiscal year 2000 of $2.2 billion. That is an increase of 32% over fiscal year 1999. Starbucks plans to increase revenues to over $6.6 billion from 10,000 retail outlets by 2005.Panera had revenues of $151 million from corporate owned stores and $350 million from franchised locations in fiscal year 2000. This fiscal year revenue was an increase in 28.9% on a per store basis versus fiscal year 1999.The Daily Perc believes it has a significant competitive advantage over these chains because of the following benefits: Drive-thru ServiceMore Substantial Customer Service Community Benefit Mobile Cafes SelectionHigher Product Quality
Local Cafes
The toughest competitor for The Daily Perc is the established locally owned cafe. TDP knows the quality and pride that the local cafe has in the product purchase by their customers. Any local cafe has a customer base that is dedicated and highly educated. The quality of beverages served at an established cafe will surpass any of the regional or national chains. The competitive edge The Daily Perc has on the local cafes is based on the attributes of:
Drive-thru ServiceSupply DiscountsMobile CafeConsistent MenuCommunity BenefitQuality Product
Drive-thru Coffee Houses
There is not a drive-thru specialty beverage retailer with significant market presence in the central United States. The only company with similar depth to that of The Daily Percn is Quikava, a wholly owned subsidiary of Chock Full 'o Nuts. However, Quikava has limited its corporate footprint to the East Coast and the Great Lakes Region. In the drive-thru specialty beverage market, The Daily Perc has a competitive edge over the smaller retailers, and even Quikava, due to:Mobile CafesConsistent MenuCommunity BenefitQuality ProductSupply DiscountsValued ImageGreater Product Selection

Fast Food and Convenience Stores
These are two industries where The Daily Perc will experience a certain level ofCompetition. The national fast food chains and national convenience store chains already serve coffee, soda, and some breakfast foods. The national fast food chains obviously know the benefits and value to customers of drive-thru. TDP knows that within the specialty coffee and tea market, the quality of the products sold will be much greater than what can currently be purchased at fast food and convenience stores. The addition of domestic soda sales for these stores is a large part of revenue. TDP knows the quality of our products, along with the addition of domestic soda and the ease of drive-thru, gives it a competitive edge over fast food and convenience stores.
Other competition
The Daily Perc knows that once it has entered the market and established a presence, others will try to follow. However, TDP believes that the corporate missions and even the organizational design will be imitated, but never duplicated. TDP will constantly evaluate its products, locations, service, and corporate missions to ensure that it remains a leader in the specialty beverage industry.
Industry Participants
There is only one national Drive-thru coffee franchise operation in the U.S. with any legs, and that is a subsidiary of Chock Full 'o Nuts called Quikava. Quikava operatespredominantly on the East Coast and in the Upper Great Lakes. The East and West coasts, and even some Mountain and Midwest states, have smaller local drive-thru chains such as Caffino, Java Espress, Crane Coffee, Java Drive, Sunrise Coffee, and Caffe Diva. However, other players in the premium coffee service industry would include Starbucks, Gloria Jean's, Caribou Coffee, Panera and locally owned and operated coffee shops or "cafes."
Strategy and Implementation Summary
The Daily Perc will penetrate the commuter and captive consumer markets by deploying Drive-thru facilities and Mobile Cafes in the most logical and accessible locations. The Drive-thrus are designed to handle two-sided traffic and dispense customer-designed, specially ordered cups of specialty beverages in less time than required for a visit to the locally owned cafe or one of the national chains.The Daily Perc has identified its market as busy, mobile people whose time is already at a premium, but desire a refreshing, high quality beverage or baked item while commuting to or from work or school. In addition to providing a quality product and an extensive menu of delicious items, to ensure customer awareness and loyalty, as well as positive public and media support, The Daily Perc could be donating up to 7.5% of revenue from each cup sold in individual Drive-thrus to the charities of the customers' choice.

Strategy Pyramid
The Daily Perc's strategy is to show people that TDP has an excellent product, convenient accessibility, and with a community benefit. To execute on this strategy, TDP is placingthe Drive-thrus and Mobile Cafes at easily accessible locations throughout themetropolitan area. TDP is pricing its product competitively and training the productionstaff to be among the best Baristas in the country. Then, through coupons and display adsat the locations, TDP will involve the customers in community support efforts byexplaining that a portion of their purchase price will be donated to a charity of theirchoosing.
In so doing, TDP has:1. Provided a customer with a quality product at a competitive price.2. Provided the customer with a more convenient method for obtaining theirdesired product.3. Demonstrated how TDP appreciates their loyalty and patronage by donatingmoney to their personal cause.
Value Proposition
The Drive-thru facilities provide a substantial value proposition in that the customer does not have to find a parking place, exit the vehicle, stand in line to order, wait for the beverages ahead of him to be produced, pay a premium price for average product, find a place to sit, clean up the previous patron's mess, then enjoy their coffee ... assuming they have sufficient time to linger over the cup.The Daily Perc concept is that the customer drives up, places the order, receives a high quality product at a competitive price, and drives away, having wasted little time in the process. The Daily Perc is also providing a significant community value to patronizing TDP. For every purchase a customer makes from us, TDP will donate up to 7.5% of the sale to the local charity selected by the customer.

Competitive Edge
The Daily Perc's competitive edge is simple. TDP provides a high quality product at acompetitive price in a Drive-thru environment that saves time.
Marketing Strategy
First and foremost, The Daily Perc will be placing its Drive-thru facilities in locations of very high visibility and great ease of access. They will be located on high traffic commuter routes and close to shopping facilities in order to catch customers going to or from work, or while they are out for lunch, or on a shopping expedition. The Drive-thrus are very unique and eye-catching, which will be a branding feature of its own. The Daily Perc will be implementing a low cost advertisingpromotion campaign which could involve drive-time radio, but not much more.The Daily Perc will rely on building relationships with schools, charities and corporations to provide significant free publicity because of its community support program. By giving charitable contributions to these institutions, they will get the word out to their studentsfacultyemployeespartners about TDP. Word of mouth has always proven to be the greatest advertising program a company can instill. In addition, the media will be more than willing to promote the charitable aspects of TDP and provide the opportunity for more exposure every time TDP writes a check to another organization.
Promotion Strategy
The long-range goal is to gain enough visibility to leverage the product line into other regions and generate inquiries from potential inventors. To do that, The Daily
Perc needs
Public relations services at $1,000 per month for the next year intended togenerate awareness of editors and product information insertions, reviews, etc.It is anticipated that the school fundraising program will generate a fair amountof publicity on its own and will, perhaps, minimize--or even eliminate--the need fora publicist. Advertising at 45,000 per month concentrating on drive time radio. The Daily Perc will experiment with different stations, keeping careful track of results. Aswith the school fundraising program, TDP expects the facilities and signage to be asubstantial portion of our advertising. However, in the start-up phase, TDPneeds to let people know where to look for the facilities.
Distribution StrategyThe Daily Perc will locate Drive-thru facilities in high traffic areas of the city where itknows working commuters will be passing. The Daily Perc will also make arrangements for the Mobile Cafes to be at as many schools, businesses, and events as possible every year, so that new customers, those who come in from areas where TDP may not have a Drive-thru facility, can be reached and those who didn't have the time to stop off that morning at their favorite Daily Perc.

Marketing ProgramsDistinctive Logo
"Papo" is a very happy and conspicuous sun. The sun is one of infinite mental pictures. The sun touches every human being every day. Obviously, TDP wants to touch every customer every day. That is why the use of the sun lends itself to being the corporate identifier. Papo is already an awarding winning logo. Papo won in the New Artist Category of the 2001 Not Just Another Art Director's Club (NJAADC).
Distinctive Buildings
TDP is using diner style buildings for its Drive-thru facilities. TDP has worked closely with the manufacturer to make the building distinctive, so that it is easy to recognize, and functional.
The Fund-raising and Catering Trailer
The Mobile Cafe will be a key marketing tool. The similarities between the Mobile Cafes and the Drive-thru facilities will be unmistakable. The exposure these units will provide cannot be measured in dollars. The Daily Perc will negotiate visits with the Mobile Units at schools, hospitals, corporations and other entities. In the case of schools and certain corporations, a portion of all sales made while on their campus could go to a program of their choice. The organization would promote its presence to their constituency and encourage them to frequent the Drive-thru establishments so that their charitable cause is nurtured. This will give those patrons an opportunity to taste the products and become a regular customer of the Drive-thru facilities. The Mobile Cafes will also be appearing at community events such as fairs, festivals, and other charitable events.
Advertising and Promotion
In the first year, The Daily Perc plans to spend moderately on advertising and promotion, with the program beginning in September, after the opening of the first Drive-thru. This would not be considered a serious advertising budget for any business, but TDP feels the exposure will come from publicity and promotion, so most of the funds will be spent on a good publicist who will get the word out about the charitable contribution program and how it works in conjunction with the website. TDP also believes that word-of-mouth advertising and free beverage coupons will be better ways to drive people to the first and second locations. In the second year, The Daily Perc is increasing the budget, since it will need to promoteseveral locations, with particular emphasis on announcing these openings and all the other locations. TDP will continue to use publicity as a key component of the marketing program, since TDP could be contributing over 7, 00,000 to local schools and charities. In the third year, The Daily Perc will double its advertising and promotion budget, with the majority of the advertising budget being spent on drive time radio. As in the previous years, TDP will get substantial publicity from the donation of nearly $200,000 to local.

Positioning Statement
For busy, mobile people whose time is already at a premium, but desire a refreshing, high quality beverage or baked item while commuting to or from work or school.
Pricing Strategy
The Daily Perc pricing will be comparable to the competition, but with the value-added feature of immediate, drive-thru service and convenience.
Sales Strategy
There will be several sales strategies put into place, including posting specials on high-profit items at the drive-up window. The Baristas will also hand out free drink coupons to those who have purchased a certain number of cups or something similar. TDP will also develop window sales techniques such as the Baristas asking if the customer would like a fresh-baked.
Sales Forecast
In the first year, The Daily Perc anticipates having two Drive-thru locations in operation. The first location will open in the third month of this plan and be fully operational beginning on the 1st day of September. The second Drive-thru will open six months later. TDP is building in a certain amount of ramp-up for each facility while commuters become familiar with its presence. The Drive-thrus will generate 288,000 tickets in the first year of operation. the second year, The Daily Perc will add two more Drive-thrus and, in the third year, TDP will add an additional nine Drive-thru facilities. The addition of these facilities will increase the revenue from Drive-thrus with a total of over 1,000,000 tickets in the second year and 2,675,000 tickets in the third.In addition to the Drive-thrus, The Daily Perc will deploy one mobile unit in the fourth quarter of the first fiscal year. TDP expects this mobile unit to generate 10,000 tickets each, at an average ticket price of 245. In the second quarter of the second fiscal year, The Daily Perc will deploy a second andthird mobile unit. TDP expects all three mobile units to generate 150,000 tickets in the second year. In the third fiscal year, with an additional fourth mobile unit deployed, TDP expects to see 264,000 mobile unit tickets. The Daily Perc is also showing revenue from the commerce portion of our website, where it will sell "The Daily Perc" t-shirts, sweatshirts, insulated coffee mugs, pre-packagedcoffee beans, and other premium items. TDP is not expecting this to be a significantprofit centre, but it is an integral part of the marketing plan -- as a function of developing our brand and building product awareness. TDP expects revenues from this portion, to begin in the second fiscal year, to reach as much as $3,000 per month in the third fiscal year. Total first year unit sales should reach 298,402. The second year will see unit sales increase to 1,177,400. The third year, with the addition of such a significant number of outlets, we will see unit sales increase to 2,992,000.


Sales Forecast
Drive-thru #1Drive-thru #2 Drive-thru #3Drive-thru #4Drive-thru #5Drive-thrus #6 & #7Drive-thrus #8, #9, & #10Drive-thrus #11, #12, & #13Mobile Cafe #1Mobile Cafe #2Mobile Cafe #3Mobile Cafe #4Website Sales/Premium Items
Total Unit Sales Unit Prices
FY 2009202,91385,48900000010,0000000
FY 2010
300,000 300,000 275,000 150,000 0 0 0 0 60,000 45,000 45,000 0 2,400 1,177,400
325,000 325,000 325,000 325,000 300,000 450,000 450,000 225,000 66,000 66,000 66,000 66,000 3,000 2,992,000
Drive-thru #1 Drive-thru #2 Drive-thru #3 Drive-thru #4 Drive-thru #5 Drive-thrus #6 & #7 Drive-thrus #8, #9, & #10 Drive-thrus #11, #12, & #13 Mobile Cafe #1 Mobile Cafe #2 Mobile Cafe #3 Mobile Cafe #4 Website Sales/Premium Items Sales
1.85 1.85 0.00 0.00 0.00 0.00 0.00 0.00 2.45 0.00 0.00 0.00 0.00
1.90 1.90 1.90 1.90 1.90 1.90 1.90 1.90 2.50 2.50 2.50 2.50
11.00
1.95 1.95 1.95 1.95 1.95 1.95 1.95 1.95 2.55 2.55 2.55 2.55 12.00

Drive-thru #1 Drive-thru #2 Drive-thru #3 Drive-thru #4 Drive-thru #5 Drive-thrus #6 & #7 Drive-thrus #8, #9, & #10 Drive-thrus #11, #12, & #13 Mobile Cafe #1 Mobile Cafe #2 Mobile Cafe #3 Mobile Cafe #4 Website Sales/Premium Items
375$389158154000000245000000
570,000 570,000522,500 285,000
0000
150,000 112,500 112,500
026,400
633,750 633,750 633,750 633,750 585,000 877,500 877,500 438,750 168,300 168,300 168,300 168,300 36,000
Total Sales Direct Unit Costs
558,043
FY 2009
2,348,900
FY 2010
6,022,950
FY 2011 Drive-thru #1 Drive-thru #2 Drive-thru #3 Drive-thru #4 Drive-thru #5 Drive-thrus #6 & #7
$0.64 $0.64 $0.00 $0.00 $0.00 $0.00
$0.61 $0.61 $0.61 $0.61 $0.61 $0.61
$0.59 $0.59 $0.59 $0.59 $0.59 $0.59
Drive-thrus #8, #9, & #10 Drive-thrus #11, #12, & #13 Mobile Cafe #1 Mobile Cafe #2 Mobile Cafe #3 Mobile Cafe #4 Website Sales/Premium Items
0.00$0.000.64 0.000.00 0.00 0.00
0.61 0.61 0.61 0.61 0.61 0.61 6.50
0.59 0.59 0.59 0.59 0.59 0.59 6.50

Sales Programs
Corporate Tasting Events
TDP plans to host tasting events for customers on aquarterly basis. Each quarter, at the introduction of each season, TDP will be adjusting its menu to reflect the changes in the flavors served.
Drink Coupons
At fundraising events for schools and corporate events, we will be giving away drink coupons as door prizes or awards. This encourages the person to come in for their free beverage and bring a friend or buy a baked item or a package of our premiumcoffee. The Drive Thru units will also be distributing coupons for special menu items ornew product introductions.
Chamber of Commerce and Professional Memberships
Because of the need to sellthe Mobile Cafe services, TDP will be an active participant in the Regional Chamber, localChambers of Commerce, Food Service Associations, and Specialty Beverage Associations.The exposure and education that these organizations provide is outstanding, but equallyimportant are the contacts and opportunities made available for deploying a Mobile Cafe--oreven two--at a special event.
Strategic Alliances
The Daily Perc has and will continue to depend heavily on our alliance with PJ's Coffees,as well as our alliances with the Mobile Cafe and Drive-thru facility manufacturers andconsumable products providers. However, we will always be looking for better qualityproducts, more favorable pricing, or more timely delivery from other potential alliances.We also consider the schools, non-profit organizations, and even corporations who hostone of our Mobile Cafes as a strategic alliances, since they are providing exposure to ourproducts and we are providing them a financial benefit.

Sales ForecastSales Forecast Unit Sales Drive-thru #1 Drive-thru #2 Drive-thru #3 Drive-thru #4 Drive-thru #5 Drive-thrus #6 & #7 Drive-thrus #8, #9, & #10 Drive-thrus #11, #12, & #13 Mobile Cafe #1 Mobile Cafe #2 Mobile Cafe #3 Mobile Cafe #4 Website Sales/Premium Items Total Unit Sales Unit Prices
FY 2002 202,913 85,489 0
0000
0 10,000 0000
298,402
FY 2002
FY 2003 300,000 300,000 275,000 150,000
0000
60,000 45,000 45,000
02,400
1,177,400
FY 2003
FY 2004325,000325,000325,000325,000300,000450,000450,000225,00066,00066,00066,00066,0003,0002,992,000
FY 2004Sales Forecast Unit Sales Drive-thru #1 Drive-thru #2 Drive-thru #3 Drive-thru #4 Drive-thru #5 Drive-thrus #6 & #7 Drive-thrus #8, #9, & #10 Drive-thrus #11, #12, & #13 Mobile Cafe #1 Mobile Cafe #2 Mobile Cafe #3 Mobile Cafe #4 Website Sales/Premium Items Total Unit Sales Unit Prices
$1.85 $1.85 $0.00 $0.00 $0.00 $0.00 $0.00 $0.00 $2.45 $0.00 $0.00 $0.00 $0.00
$1.90 $1.90 $1.90 $1.90 $1.90 $1.90 $1.90 $1.90 $2.50 $2.50 $2.50 $2.50 $11.00
$1.95$1.95$1.95$1.95$1.95$1.95$1.95$1.95$2.55$2.55$2.55$2.55$12.00

Sales Forecast Unit Sales Drive-thru #1 Drive-thru #2 Drive-thru #3 Drive-thru #4 Drive-thru #5 Drive-thrus #6 & #7 Drive-thrus #8, #9, & #10 Drive-thrus #11, #12, & #13 Mobile Cafe #1 Mobile Cafe #2 Mobile Cafe #3 Mobile Cafe #4 Website Sales/Premium Items Total Unit Sales Unit Prices
$375,389 $158,154 $0 $0 $0 $0 $0 $0 $24,500 $0 $0 $0 $0
$570,000 $570,000 $522,500 $285,000 $0 $0 $0
$0 $150,000 $112,500 $112,500
$0 $26,400
$633,750$633,750$633,750$633,750$585,000$877,500$877,500$438,750$168,300$168,300$168,300$168,300$36,000
Total Sales
Direct Unit Costs
$558,043
FY 2002
$2,348,900
FY 2003
$6,022,950
FY 2004
Drive-thru #1 Drive-thru #2 Drive-thru #3 Drive-thru #4 Drive-thru #5 Drive-thrus #6 & #7
$0.64 $0.64 $0.00 $0.00 $0.00 $0.00
$0.61 $0.61 $0.61 $0.61 $0.61 $0.61
$0.59$0.59$0.59$0.59$0.59$0.59
Management Team Gaps
The Daily Perc knows that it is going to require several quality management team members over the next few years, beginning with a district manager for every four Drive-thrus. This person will oversee the quality of product, the training of the Baristas,the inventory management, and customer satisfaction. Ideally, as The Daily Perc grows, it will be able to promote from within for this position. This individual will be responsible for the operation of up to four drive-thrus under hisher management. They will be required to visit between locations and possibly even join administrative personnel on training or marketing travel. Clearly, as the need arises, these individuals will ideally be selected from the Mobile Cafe or Drive-Thru team.
By the beginning of the third year, The Daily Perc will hire three key senior managers. They are: a chief financial officer, a chief information officer, and a director of marketing. The role of each of these individuals will be discussed in subsequent sections of this plan.

Organizational Structure
The organization will be a relatively flat one, since the majority of personnel are involved in production and there will be a relatively low headcount in management. There are three functioning groups within the company: Production, Sales and Marketing, and General and Administrative. For purposes of this plan--and to show the details of adding senior level management--The Daily Perc has broken management down as a separate segment, but it is an integral part of the General and Administrative function. Production involves the Baristas, or Customer Service Specialists, who will be manning the Drive-thrus and Mobile Cafes and blending the beverages for the customers. Sales and Marketing will handle the promotion and scheduling of the Mobile Cafes, as well as the promotion of the Drive-thrus and the Community Contribution program. General and Administrative manage the facilities, equipment, inventory, payroll, and other basic, operational processes.
Personnel Plan
The Daily Perc expects the first year to be rather lean, since there will only be twolocations and one mobile unit--none of which will be deployed for the entire year. The total headcount for the first year, including management, administrative support, and customer service (production), will be 15, with a payroll and payroll burden total expenditure as shown in the following table and in the monthly breakdowns appendices. The second year, with the addition of two Drive-thrus and two mobile units, The Daily Perc will add customer service personnel, as well as a district manager and some additional support staff at headquarters, including an Inventory Clerk, Equipment Technician, and administrative support. The headcount will increase by nearly 100% in the second year to 29, with a proportionable increase in payroll of and payroll burden. The third year will see the most dramatic growth in headcount, due to the addition of nine Drive-thrus and another mobile unit. In the third year, there will also be an increase of 180% over the previous year. Total payroll and payroll burden for the third year will reflect this, as well as the significant increase in the senior management team, with the addition of a chief financial officer, a chief information officer, and a director of marketing. There will also be a second and third district manager, and a corporate events sales executive. Total personnel will reach 81.The chief financial officer will be brought on to oversee the increase in numbers of retail outlets and to manage a dramatically more detailed P&L statement and to manage the Balance Sheet. The chief information officer will be brought in to help us with the deployment of a Point-of-Sale computerized cash register system that will make tracking and managing receipts and charitable contributions more robust. Ideally, this individual will have a large amount of point of sale and Internet experience. Specifically, how to tie in POS systems to the Internet and inventory controls. Also, knowledge in establishing technology guidelines for the company and franchisees in the future.
Personnel Plan FY 2002 Production Personnel
FY 2003 FY 2004
Drive-thru Team Mobile Cafe Team Equipment Care Specialist (Headquarters) Other
$135,474 $9,400 $0 $0
$439,250
$172,800
$22,000 $12,000
$1,098,650
$225,600 $77,000 $24,000
Subtotal Sales and Marketing Personnel
$144,874 $646,050
$1,425,250
District Manager (Four Drive-thrus) Corporate Events Sales Exec Director of Marketing Other
$0 $0 $0 $0 $22,000 $0 $0 $0
$77,000 $36,000 $72,000
$0

Financial PlanThe Daily Perc's financial picture is quite promising. Since TDP is operating a cashbusiness, the initial cost is significantly less than many start-ups these days. The process is labor intensive and TDP recognizes that a higher level of talent is required. The financial investment in its employees will be one of the greatest differentiators between it and TDP's competition. For the purpose of this pro-forma plan, the facilities and equipment are financed. These items are capital expenditures and will be available for financing. There will be a minimum of inventory on hand so as to keep the product fresh and to take advantage of price drops, when and if they should occur. The Daily Perc anticipates the initial combination of investments and long-term financing to carry it without the need for any additional equity or debt investment, beyond the purchase of equipment or facilities. This will mean growing a bit more slowly than might be otherwise possible, but it will be a solid, financially sound growth based on customer request and product demand.
Important Assumptions
The financial plan depends on important assumptions, most of which are shown in the following table. The key underlying assumptions are:The Daily Perc assumes a slow-growth economy, without major recession.The Daily Perc assumes of course that there are no unforeseen changes in publichealth perceptions of its general products. The Daily Perc assumes access to equity capital and financing sufficient to maintain its financial plan as shown in the tables.
General Assumptions FY 2002 FY 2003
FY 2004
Plan Month 1 2 3 Current Interest Rate
10.00% 10.00% 10.00
% Long-term Interest Rate Tax Rate
9.00% 0.00%
9.00% 0.00%
9.00% 0.00%
Other 0 0 0
Key Financial Indicators
The following chart shows changes in key financial indicators: sales, gross margin,operating expenses, collection days, and inventory turnover. The growth in sales exceeds 250% each year. TDP expects to keep gross margin above the 38% projected for the first year, but it doesn't anticipate anything higher than 46%, since our payroll expenses will increase substantially as it grows into new areas and faces new competition. The projections for inventory turnover show that TDP will maintain a relatively stable amount of inventory in its headquarters warehouse so that it has no less than two weeks of inventory on hand, but no more than three weeks, in order to keep products fresh. The only time it would consider holding larger stores of inventory is if there was some catastrophic event that could cause a dramatic rise in the price of its coffees or teas.

Break-even Analysis
To arrive at the average monthly fixed costs, The Daily Perc calculated the fixed costs for the Drive-thru. Using the average price per unit, less the average cost per unit, divided into the fixed costs of operation, TDP concludes that we will need to sell at least the number of units shown in the following table and chart to reach break-even each month.

Projected Profit and Loss
The Daily Perc is expecting some dramatic growth in the next three years, reachinghealthy sales and Gross Profit Margin by the end of the first year. Expenses during the firstyear will, however leave a Net After-tax loss. This loss will provide TDP with a tax loss carry-forward for the second year. Aside from production costs of 60%, which include actual production of product and commissions for sales efforts, the single largest expenditures in the first year are in the general and administrative (G&A) area, totaling 23% of sales. G&A includes expenses for rents, equipment leases, utilities, and the payroll burden for all employees. Sales increase by nearly 400% in the second year, due to the addition of two more Drivethrusand two more Mobile Cafes. Although operating expenses double in the secondyear, The Daily Perc will be able to realize a Net After-tax profit. In that same year, TDP will make substantial charitable contributions.The third year is when The Daily Perc has the opportunity to break into markets outside the metropolitan area. TDP will see nine additional Drive-thru facilities open in the third year, which will drive sales, increase in production costs, and help improve Gross Profit Margin. Several expenses take substantial jumps this year--advertising increases and donations increase as well--and TDP will be adding several key management team members. These increases, as well as those for increased equipment leases and rents, raise our operating expenses, leaving a respectable Net After-tax profit. The single largest expense sector in the third year, outside of production, is still G&A costs, but it is down from 23% in the first year and 18.5% in the second year to just 15.02%.

Profit and Loss AccountPro Forma Profit and Loss Sales Direct Cost of Sales Production Payroll Sales Commissions
FY 2002 $558,043 $190,977 $144,874
$1,416
FY 2003 $2,348,90
0 $732,350 $646,050 $35,234
FY 2004 $6,022,95
0 $1,783,01
0 $1,425,250 $90,344
Total Cost of Sales Gross Margin Gross Margin % Operating Expenses
$337,267 $220,776 39.56%
$1,413,634
$935,267 39.82%
$3,298,604
$2,724,346 45.23%

Sales and Marketing Expenses
Sales and Marketing Payroll Advertising/Promotion Website Travel Donations
$0 $18,000 $1,000 $4,000 $3,332
$22,000 $36,000 $15,000 $7,500
$70,467
$185,000 $72,000 $22,000 $15,000
$180,689
Total Sales and Marketing Expenses Sales and Marketing % General and Administrative Expenses
$26,332 4.72%
$150,967 6.43%
$474,689 7.88%
General and Administrative Payroll Sales and Marketing and Other Expenses Depreciation Leased Offices and Equipment Utilities Insurance Rent Payroll Taxes Other General and Administrative Expenses
$31,500 $0
$21,785 $0
$9,640 $12,570 $16,800 $36,356
$0
$106,000 $0
$92,910 $6,000
$19,800 $32,620 $50,400 $126,90
8 $0
$156,000 $0 $196,095 $18,000 $41,100 $63,910
$126,000 $303,638 $0
Total General and Administrative Expenses General and Administrative % Other Expenses:
$128,651 23.05%
$434,638
18.50%
$904,743 15.02%
Other Payroll Consultants Legal/Accounting/Consultants
$66,000 $0
$12,500
$72,000 $0
$24,000
$258,000 $0 $36,000
Total Other Expenses Other % Total Operating Expenses
$78,500 14.07%
$233,483
$96,000 4.09%
$681,605
$294,000 4.88% $1,673,431
Profit Before Interest and Taxes EBITDA Interest Expense Taxes Incurred Net Profit
($12,707) $9,078 $16,165
$0 ($28,872
)
$253,662
$346,572
$36,639 $0
$217,023
$1,050,915 $1,247,010$77,102$
0 $973,812 Net Profit/Sales -5.17% 9.24% 16.17%


Projected Cash Flow
Cash flow will have to be carefully monitored, as in any business, but The Daily Perc is also the beneficiary of operating a cash business. After the initial investment and start-up costs are covered, the business will become relatively self-sustaining. With the exception of seasonal dips, which TDP has attempted to account for, through changes in the menu items.
Assuming an initial investment and financing, which would include operating capital, The Daily Perc anticipates no cash flow shortfalls for the first year or beyond. March and May are the greatest cash drains, since TDP will be experiencing the cost of second drive thru and mobile unit start-up. Again, TDP sees heavier than normal drains of cash in December and January, as there will be certain accounts payable coming due.

Projected Balance Sheet

Balance Sheet
FY 2009 FY 2010 FY 2011 FY 2012 FY 2013
Assets
Current Assets Cash 29,622 91,674 91,674 528,315 $91,674 Inventory 35,159 134,826 134,826 328,252 $134,826 Other Current Assets $0 0 0 0 $0 Total Current Assets 64,781 226,499 226,499 856,567 $226,499
Long-term Assets Long-term Assets 323,250 752,950 752,950 2,109,943 $752,950 Accumulated Depreciation
21,785 114,695 114,695 310,790 $114,695
Total Long-term Assets 301,465 638,255 638,255 1,799,153 $638,255 Total Assets 366,246 864,754 864,754 2,655,720 $864,754
Liabilities and Capital FY 2009 FY 2010 FY 2011 FY 2012 FY 2013
Current Liabilities Accounts Payable 49,724 106,240 106,240 $248,402 $106,240 Current Borrowing 7,500 5,500 5,500 $500 $5,500 Other Current Liabilities 0 0 0 $0 $0 Subtotal Current Liabilities
57,224 111,740 111,740 $248,902 $111,740
Long-term Liabilities 286,394 513,364 513,364 $1,193,35
6 $513,364 Total Liabilities 343,618 625,104 625,104 $1,442,25
8 $625,104
Paid-in Capital 225,270 225,270 225,270 $225,270 $225,270 Retained Earnings (173,770) (202,642) (202,642) $14,381 ($202,642) Earnings (28,872) 217,023 217,023 $973,812 $217,023 Total Capital 22,628 239,651 239,651 $1,213,46
3 $239,651
Total Liabilities and Capital
366,246 864,754 864,754 $2,655,720
$864,754
Net Worth 22,628 239,651 239,651 $1,213,46
3 $239,651

Business Ratios
Standard business ratios are included in the following table. The ratios show a plan for balanced, healthy growth. The Daily Perc's position within the industry is typical for a heavy growth startup company. Industry profile ratios based on the Standard Industrial Classification (SIC) code 5812, Eating Places, are shown for comparison. Comparing the ratios in the third year with the industry, this pro-forma plan appears to be within an acceptable difference margin.
TDP's return on net worth and net worth number differ from the Industry Profile due to the lack of overhead when compared to a typical walk-in cafe. The Drive Thru and Mobile business model is lean thus allowing for increase return ratio and providing a lower Net Worth.


Sales Forecast
Drive-thru #1 $1.85 $1.85 $1.85 $1.85 $1.85 $1.85 $1.85 $1.85 $1.85 Drive-thru #2 $1.85 $1.85 $1.85 $1.85 $1.85 $1.85 $1.85 $1.85 $1.85 Drive-thru #3 $1.85 $1.85 $1.85 $1.85 $1.85 $1.85 $1.85 $1.85 $1.85 Drive-thru #4 $1.85 $1.85 $1.85 $1.85 $1.85 $1.85 $1.85 $1.85 $1.85 Drive-thru #5 $1.85 $1.85 $1.85 $1.85 $1.85 $1.85 $1.85 $1.85 $1.85 Drive-thrus #6 & #7 $1.85 $1.85 $1.85 $1.85 $1.85 $1.85 $1.85 $1.85 $1.85 Drive-thrus #8, #9, & #10
$1.85 $1.85 $1.85 $1.85 $1.85 $1.85 $1.85 $1.85 $1.85
Drive-thrus #11, #12, & #13
$1.85 $1.85 $1.85 $1.85 $1.85 $1.85 $1.85 $1.85 $1.85
Mobile Cafe #1 $2.45 $2.45 $2.45 $2.45 $2.45 $2.45 $2.45 $2.45 $2.45 Mobile Cafe #2 $2.45 $2.45 $2.45 $2.45 $2.45 $2.45 $2.45 $2.45 $2.45 Mobile Cafe #3 $2.45 $2.45 $2.45 $2.45 $2.45 $2.45 $2.45 $2.45 $2.45 Mobile Cafe #4 $2.45 $2.45 $2.45 $2.45 $2.45 $2.45 $2.45 $2.45 $2.45 Website Sales/Premium Items
$10.00 $10.00 $10.00
$10.00 $10.00 $10.00 $10.00 $10.00 $10.00 $10.00
Sales Drive-thru #1 $0 $0 $0 $32,37
5 $42,63
7 $44,76
9 $42,53
0 $42,63
7 $44,76
9
Drive-thru #2 $0 $0 $0 $0 $0 $0 $0 $0 $32,37
5 Drive-thru #3 $0 $0 $0 $0 $0 $0 $0 $0 $0 Drive-thru #4 $0 $0 $0 $0 $0 $0 $0 $0 $0 Drive-thru #5 $0 $0 $0 $0 $0 $0 $0 $0 $0 Drive-thrus #6 & #7 $0 $0 $0 $0 $0 $0 $0 $0 $0

Appendix
Drive-thrus #8, #9, & #10
$0 $0 $0 $0 $0 $0 $0 $0 $0
Drive-thrus #11, #12, & #13
$0 $0 $0 $0 $0 $0 $0 $0 $0
Mobile Cafe #1 $0 $0 $0 $0 $0 $0 $0 $0 $0
Mobile Cafe #2 $0 $0 $0 $0 $0 $0 $0 $0 $0 Mobile Cafe #3 $0 $0 $0 $0 $0 $0 $0 $0 $0 Mobile Cafe #4 $0 $0 $0 $0 $0 $0 $0 $0 $0 Website Sales/Premium Items
$0 $0 $0 $0 $0 $0 $0 $0 $0
Total Sales $0 $0 $0 $32,375
$42,637
$44,769
$42,530
$42,637
$77,144
Direct Unit Costs Jun Jul Aug Sep Oct Nov Dec Jan Feb
Drive-thru #1 0.00% $0.64 $0.64 $0.64 $0.64 $0.64 $0.64 $0.64 $0.64 $0.64
Drive-thru #2 0.00% $0.64 $0.64 $0.64 $0.64 $0.64 $0.64 $0.64 $0.64 $0.64
Drive-thru #3 0.00% $0.64 $0.64 $0.64 $0.64 $0.64 $0.64 $0.64 $0.64 $0.64
Drive-thru #4 0.00% $0.64 $0.64 $0.64 $0.64 $0.64 $0.64 $0.64 $0.64 $0.64
Drive-thru #5 0.00% $0.64 $0.64 $0.64 $0.64 $0.64 $0.64 $0.64 $0.64 $0.64
Drive-thrus #6 & #7 0.00% $0.64 $0.64 $0.64 $0.64 $0.64 $0.64 $0.64 $0.64 $0.64
Drive-thrus #8, #9, & #10
0.00% $0.64 $0.64 $0.64 $0.64 $0.64 $0.64 $0.64 $0.64 $0.64
Drive-thrus #11, #12, & #13
0.00% $0.64 $0.64 $0.64 $0.64 $0.64 $0.64 $0.64 $0.64 $0.64
Mobile Cafe #1 0.00% $0.64 $0.64 $0.64 $0.64 $0.64 $0.64 $0.64 $0.64 $0.64
Mobile Cafe #2 0.00% $0.64 $0.64 $0.64 $0.64 $0.64 $0.64 $0.64 $0.64 $0.64
Mobile Cafe #3 0.00% $0.64 $0.64 $0.64 $0.64 $0.64 $0.64 $0.64 $0.64 $0.64
Mobile Cafe #4 0.00% $0.64 $0.64 $0.64 $0.64 $0.64 $0.64 $0.64 $0.64 $0.64
Website Sales/Premium Items
0.00% $6.50 $6.50 $6.50 $6.50 $6.50 $6.50 $6.50 $6.50 $6.50
Direct Cost of Sales
Drive-thru #1 $0 $0 $0 $11,200
$14,750
$15,488
$14,713
$14,750
$15,488
Drive-thru #2 $0 $0 $0 $0 $0 $0 $0 $0 $11,200

Drive-thru #3 $0 $0 $0 $0 $0 $0 $0 $0 $0 Drive-thru #4 $0 $0 $0 $0 $0 $0 $0 $0 $0 Drive-thru #5 $0 $0 $0 $0 $0 $0 $0 $0 $0 Drive-thrus #6 & #7 $0 $0 $0 $0 $0 $0 $0 $0 $0 Drive-thrus #8, #9, & #10
$0 $0 $0 $0 $0 $0 $0 $0 $0
Drive-thrus #11, #12, & #13
$0 $0 $0 $0 $0 $0 $0 $0 $0
Mobile Cafe #1 $0 $0 $0 $0 $0 $0 $0 $0 $0 Mobile Cafe #2 $0 $0 $0 $0 $0 $0 $0 $0 $0 Mobile Cafe #3 $0 $0 $0 $0 $0 $0 $0 $0 $0 Mobile Cafe #4 $0 $0 $0 $0 $0 $0 $0 $0 $0 Website Sales/Premium Items
$0 $0 $0 $0 $0 $0 $0 $0 $0
Subtotal Direct Cost of Sales
$0 $0 $0 $11,20
0 $14,75
0 $15,48
8 $14,71
3 $14,75
0 $26,68
8
Personnel
Personnel Plan Jun Jul Aug Sep Oct Nov Dec Jan Feb Production Personnel Drive-thru Team $0 $0 $0 $10,50
0 $10,85
0 $9,800 $9,800 $10,50
0 $19,62
4 Mobile Cafe Team $0 $0 $0 $0 $0 $0 $0 $0 $0 Equipment Care Specialist (Headquarters)
$0 $0 $0 $0 $0 $0 $0 $0 $0
Other $0 $0 $0 $0 $0 $0 $0 $0 $0 Subtotal $0 $0 $0 $10,50
0 $10,85
0 $9,800 $9,800 $10,50
0 $19,62
4 Sales and Marketing Personnel District Manager (Four Drive-thrus)
$0 $0 $0 $0 $0 $0 $0 $0 $0
Corporate Events Sales Exec
$0 $0 $0 $0 $0 $0 $0 $0 $0
Director of Marketing $0 $0 $0 $0 $0 $0 $0 $0 $0 Other $0 $0 $0 $0 $0 $0 $0 $0 $0 Subtotal $0 $0 $0 $0 $0 $0 $0 $0 $0 General and Administrative Personnel Bookkeeper/Office Administrator
$0 $0 $0 $0 $1,750 $1,750 $3,500 $3,500 $3,500

Warehouse/Site Manager
$0 $0 $0 $0 $0 $0 $0 $0 $0
Inventory Clerk $0 $0 $0 $0 $0 $0 $0 $0 $0 Other $0 $0 $0 $0 $0 $0 $0 $0 $0 Subtotal $0 $0 $0 $0 $1,750 $1,750 $3,500 $3,500 $3,500
Other Personnel Chief Operating Officer
$5,500 $5,500 $5,500
$5,500 $5,500 $5,500 $5,500 $5,500 $5,500
Chief Financial Officer $0 $0 $0 $0 $0 $0 $0 $0 $0 Chief Information Officer
$0 $0 $0 $0 $0 $0 $0 $0 $0
Other $0 $0 $0 $0 $0 $0 $0 $0 $0 Subtotal $5,500 $5,500 $5,50
0 $5,500 $5,500 $5,500 $5,500 $5,500 $5,500
Total People 1 1 1 5 6 6 6 6 11
Total Payroll $5,500 $5,500 $5,50
0 $16,00
0 $18,10
0 $17,05
0 $18,80
0 $19,50
0 $28,62
4
Appendix
Table: General Assumptions
General Assumptions Jun Jul Aug Sep Oct Nov Dec Jan Feb Plan Month 1 2 3 4 5 6 7 8 9 10 Current Interest Rate
10.00% 10.00% 10.00% 10.00% 10.00% 10.00% 10.00% 10.00% 10.00%
Long-term Interest Rate
9.00% 9.00% 9.00% 9.00% 9.00% 9.00% 9.00% 9.00% 9.00%
Tax Rate 0.00% 0.00% 0.00% 0.00% 0.00% 0.00% 0.00% 0.00% 0.00% Other 0 0 0 0 0 0 0 0 0
Appendix
Table: Profit and Loss
Pro Forma Profit and Loss Jun Jul Aug Sep Oct Nov Dec Jan Feb Sales $0 $0 $0 $32,37
5 $42,63
7 $44,76
9 $42,53
0 $42,63
7 $77,14
4
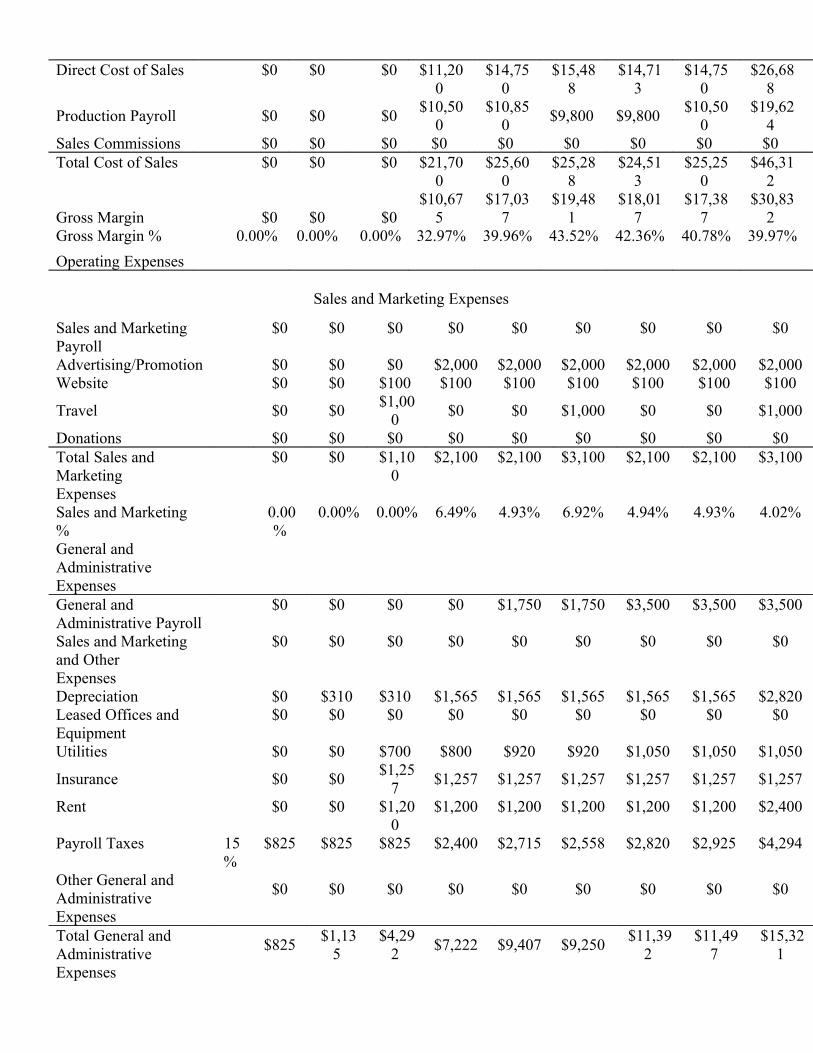
Direct Cost of Sales $0 $0 $0 $11,200
$14,750
$15,488
$14,713
$14,750
$26,688
Production Payroll $0 $0 $0 $10,50
0 $10,85
0 $9,800 $9,800
$10,500
$19,624
Sales Commissions $0 $0 $0 $0 $0 $0 $0 $0 $0 Total Cost of Sales $0 $0 $0 $21,70
0 $25,60
0 $25,28
8 $24,51
3 $25,25
0 $46,31
2
Gross Margin $0 $0 $0 $10,67
5 $17,03
7 $19,48
1 $18,01
7 $17,38
7 $30,83
2 Gross Margin % 0.00% 0.00% 0.00% 32.97% 39.96% 43.52% 42.36% 40.78% 39.97%
Operating Expenses
Sales and Marketing Expenses
Sales and Marketing Payroll
$0 $0 $0 $0 $0 $0 $0 $0 $0
Advertising/Promotion $0 $0 $0 $2,000 $2,000 $2,000 $2,000 $2,000 $2,000 Website $0 $0 $100 $100 $100 $100 $100 $100 $100
Travel $0 $0 $1,00
0 $0 $0 $1,000 $0 $0 $1,000
Donations $0 $0 $0 $0 $0 $0 $0 $0 $0 Total Sales and Marketing
$0 $0 $1,100
$2,100 $2,100 $3,100 $2,100 $2,100 $3,100
Expenses Sales and Marketing %
0.00%
0.00% 0.00% 6.49% 4.93% 6.92% 4.94% 4.93% 4.02%
General and Administrative Expenses General and Administrative Payroll
$0 $0 $0 $0 $1,750 $1,750 $3,500 $3,500 $3,500
Sales and Marketing and Other
$0 $0 $0 $0 $0 $0 $0 $0 $0
Expenses Depreciation $0 $310 $310 $1,565 $1,565 $1,565 $1,565 $1,565 $2,820 Leased Offices and Equipment
$0 $0 $0 $0 $0 $0 $0 $0 $0
Utilities $0 $0 $700 $800 $920 $920 $1,050 $1,050 $1,050
Insurance $0 $0 $1,25
7 $1,257 $1,257 $1,257 $1,257 $1,257 $1,257
Rent $0 $0 $1,200
$1,200 $1,200 $1,200 $1,200 $1,200 $2,400
Payroll Taxes 15%
$825 $825 $825 $2,400 $2,715 $2,558 $2,820 $2,925 $4,294
Other General and Administrative
$0 $0 $0 $0 $0 $0 $0 $0 $0
Expenses Total General and Administrative
$825 $1,13
5 $4,29
2 $7,222 $9,407 $9,250
$11,392
$11,497
$15,321
Expenses

General and Administrative %
0.00%
0.00% 0.00% 22.31%
22.06%
20.66%
26.79% 26.96% 19.86%
Other Expenses:
Appendix
Other Payroll $5,500 $5,500 $5,500 $5,500 $5,500 $5,500 $5,500 $5,500 Consultants $0 $0 $0 $0 $0 $0 $0 $0 Legal/Accounting/Consultants $1,500 $1,000 $1,000 $1,000 $1,000 $1,000 $1,000 $1,000 Total Other Expenses $7,000 $6,500 $6,500 $6,500 $6,500 $6,500 $6,500 $6,500 Other % 0.00% 0.00% 0.00% 20.08% 15.24% 14.52% 15.28% 15.24% Total Operating Expenses $7,825 $7,635 $11,892 $15,822 $18,007 $18,85
0 $19,992 $20,097
Profit Before Interest and Taxes
($7,825)
($7,635)
($11,892)
($5,147)
($970) $632 ($1,975)
($2,710)
EBITDA ($7,825)
($7,325)
($11,582)
($3,582)
$595 $2,197 ($410) ($1,145)
Interest Expense $1,042 $1,018 $1,058 $1,019 $1,019 $1,019 $1,019 $1,019 Taxes Incurred $0 $0 $0 $0 $0 $0 $0 $0 Net Profit ($8,867
) ($8,653
) ($12,950
) ($6,166
) ($1,990
) ($388) ($2,994
) ($3,730
) Net Profit/Sales 0.00% 0.00% 0.00% - -4.67% -0.87% -7.04% -8.75%

19.05%
Appendix
Table: Cash Flow
Pro Forma Cash Flow Cash Received
Jun Jul Aug Sep Oct Nov Dec Jan Feb
Cash from Operations Cash Sales Subtotal Cash from Operations $0 $0 $0 $0 $0 $0
$32,375
$32,375
$42,637
$42,637
$44,769
$44,769
$42,530 $42,530
$42,637 $42,637
$77,144 $77,144
Additional Cash Received Sales Tax, VAT, HST/GST Received New Current Borrowing New Other Liabilities (interest-free) New Long-term Liabilities Sales of Other Current Assets Sales of Long-term Assets New Investment Received Subtotal Cash Received
0.00%
$0 $0 $0 $0 $0 $0 $0 $0
$0 $0 $0 $0 $0 $0 $0 $0
$0 $0 $0
$5,300 $0 $0
$0 $5,300
$0 $0 $0 $0 $0 $0
$0 $32,37
5
$0 $0 $0 $0 $0 $0
$0 $42,63
7
$0 $0 $0 $0 $0 $0
$0 $44,76
9
$0 $0 $0 $0 $0 $0
$0 $42,530
$0 $0 $0 $0 $0 $0
$0 $42,637
$0 $0 $0 $98,184 $0 $0 $0 $175,32
8
Expenditures Jun Jul Aug Sep Oct Nov Dec Jan Feb

Expenditures from Operations Cash Spending Bill Payments Subtotal Spent on Operations
$5,500 $112 $5,612
$5,500 $3,349 $8,849
$5,500 $2,987 $8,487
$16,000
$7,228 $23,22
8
$18,100
$10,030
$28,130
$17,050
$17,719
$34,769
$18,800 $27,251 $46,051
$19,500 $24,342 $43,842
$28,624 $26,320 $54,944
Additional Cash Spent Sales Tax, VAT, HST/GST Paid Out Principal Repayment of Current Borrowing Other Liabilities Principal Repayment Long-term Liabilities Principal Repayment Purchase Other Current Assets Purchase Long-termAssets Dividends Subtotal Cash Spent
$0 $0 $0 $2,500 $0 $0 $0 $8,112
$0 $0 $0 $3,116 $0 $0 $0 $11,965
$0 $0 $0 $0 $0 $0
$0 $8,487
$0 $0 $0
$5,166 $0 $0
$0 $28,39
4
$0 $0 $0 $0 $0 $0
$0 $28,13
0
$0 $0 $0 $0 $0 $0
$0 $34,76
9
$0 $0 $0 $0 $0 $0
$0 $46,051
$0 $0 $0 $0 $0 $0
$0 $43,842
$0 $0 $0 $0 $0
$105,400 $0
$160,344
Net Cash Flow Cash Balance
($8,112) $17,388
($11,965) $5,422
($3,187) $2,236
$3,981 $6,217
$14,507
$20,724
$10,000
$30,724
($3,521)
$27,203
($1,205)
$25,998 $14,984 $40,982

Appendix
Table: Balance Sheet
Pro Forma Balance Sheet Assets
Starting Balances
Jun Jul Aug Sep Oct Nov
Current Assets Cash Inventory Other Current Assets Total Current Assets
$25,500 $35,000
$0 $60,500
$17,388 $35,000
$0 $52,388
$5,422 $35,000
$0 $40,422
$2,236 $35,000
$0 $37,236
$6,217 $23,800
$0 $30,017
$20,724 $16,225
$0 $36,949
$30,724 $17,036
$0 $47,760
Long-term Assets Long-term Assets Accumulated Depreciation Total Long-term Assets Total Assets
$131,400 $0
$131,400 $191,900
$131,400 $0
$131,400 $183,788
$131,400 $310
$131,090 $171,512
$131,400 $620
$130,780 $168,016
$131,400 $2,185
$129,215 $159,232
$131,400 $3,750
$127,650 $164,599
$131,400 $5,315
$126,085 $173,845
Liabilities and Capital Jun Jul Aug Sep Oct Nov Current Liabilities Accounts Payable Current Borrowing Other Current Liabilities Subtotal Current Liabilities
$0 $9,000 $0 $9,000
$3,255 $9,000 $0 $12,255
$2,749 $9,000 $0 $11,749
$6,902 $9,000 $0 $15,902
$9,451 $9,000 $0 $18,451
$16,807 $9,000 $0 $25,807
$26,441 $9,000 $0 $35,441
Long-term Liabilities Total Liabilities
$131,400 $140,400
$128,900 $141,155
$125,784 $137,533
$131,084 $146,986
$125,918 $144,369
$125,918 $151,725
$125,918 $161,359
Paid-in Capital Retained Earnings Earnings Total Capital Total
$225,270 ($173,770
) $0 $51,500
$191,900
$225,270 ($173,770) ($8,867)
$42,633 $183,788
$225,270 ($173,770
) ($17,520)
$33,980 $171,512
$225,270 ($173,770
) ($30,470)
$21,030 $168,016
$225,270 ($173,770
) ($36,637)
$14,863 $159,232
$225,270 ($173,770
) ($38,626)
$12,874 $164,599
$225,270 ($173,770
) ($39,014)
$12,486 $173,845

Liabilities and Capital
Net Worth $51,500 $42,633 $33,980 $21,030 $14,863 $12,874 $12,486