216028 from awareness to funding awareness to funding 2018: summary report 1 from awareness to...
TRANSCRIPT
From Awareness to Funding Voter Perceptions and Support of Public Libraries in 2018
From Awareness to Funding 2018: Summary Report 1
From Awareness to Funding
Summary Report
Voter Perceptions and Support of Public Libraries in 2018
Data from a survey panel of 2,000 US voters ages 18 to 69 living in areas with populations of fewer than 300,000, administered by Leo Burnett USA between September 29 and October 4, 2017. This research and report is a project led by OCLC, the Office for Library Advocacy of the American Library Association, and its Public Library Association division.
This work is licensed under an Attribution-NonCommercial-ShareAlike 2.0 Generic (CC BY-NC-SA 2.0) License.

2 From Awareness to Funding 2018: Summary Report
© 2018 OCLC.
This work is licensed under an Attribution-NonCommercial-ShareAlike 2.0 Generic (CC BY-NC-SA 2.0) License.
March 2018
OCLC Dublin, Ohio 43017 USA www.oclc.org
ISBN: 978-1-55653-057-9 DOI: 10.25333/C3M92X OCLC Control Number: 1028992695
Please direct correspondence to: OCLC Research [email protected]
Suggested citation: OCLC and American Library Association. 2018. From Awareness to Funding: Voter Perceptions and Support of Public Libraries in 2018. Dublin, OH: OCLC. https://doi.org/10.25333/C3M92X.
From Awareness to Funding 2018: Summary Report 3
Table of ContentsIntroduction 5
Voter Perceptions and Support for Library Funding Today: Key Overall Results 6
Comparison of 2008 and 2018 Overall Findings 8
2018 Library Support Segments: Key Findings and Comparisons to 2008 12
Cultural Context: What Has Changed in Ten Years? 26
Next Steps 28
Methodology 30
Notes 32
4 From Awareness to Funding 2018: Summary Report
Tables and FiguresTABLES
Table 1. Voter Perceptions of the Value of Core Aspects of the Library 9
Table 2. Voter Enthusiasm about Library Staff 10
Table 3. Snapshot of Library Support Segments 14
Table 4. Library as Office Voter Perceptions of the Value of Core Aspects of the Library 19
FIGURES
Figure 1. Voters Frequently Visit Libraries in Person and Online 6
Figure 2. Voter Confusion about Public Library Funding 7
Figure 3. Voters Support Federal Funding for Libraries 7
Figure 4. Survey Results for Support of Library Funding 11
Figure 5. Library Support Segmentation Pyramid 13
Figure 6. Library Support Segment Comparison 2008 and 2018 13
Figure 7. Comparing 2008 to 2018 – Super Supporters 15
Figure 8. % of Super Supporters Who Would Vote Favorably for Library Referendum 15
Figure 9. Comparing 2008 to 2018 – Probable 16
Figure 10. Comparing 2008 to 2018 – Greater Good 17
Figure 11. Comparing 2008 to 2018 – Look to Librarian 18
Figure 12. Comparing 2008 to 2018 – Library as Office 19
Figure 13. Comparing 2008 to 2018 – Kid Driven 20
Figure 14. Comparing 2008 to 2018 – Just for Fun 21
Figure 15. Comparing 2008 to 2018 – The Web Wins 22
Figure 16. Detached Voters Demographics 23
Figure 17. Comparing 2008 to 2018 – Financially Strapped 24
Figure 18. Financially Strapped Voters’ Willingness to Pay More in Local Taxes 24
Figure 19. Percentage Total Revenue from Local Sources 27

From Awareness to Funding 2018: Summary Report 5
IntroductionIn 2008, OCLC published From Awareness to Funding: A Study of Library Support in America,1 a national study of the awareness, attitudes, and underlying motivations among US voters for supporting library funding. The research, which was led by OCLC with funding by the Bill & Melinda Gates Foundation and conducted by Leo Burnett USA, dispelled long-held assumptions and provided eye-opening insights about who supports public library funding and for what reasons.
A decade later, OCLC has partnered with the American Library Association (ALA) and its Public Library Association (PLA) division to investigate current perceptions and support among US voters and how they may have shifted in the intervening years. The partners re-engaged Leo Burnett USA and revisited the survey instrument used in the original research.
To allow for comparisons across segments and time, the new study is based largely on the original survey instrument and population (voters age 18 to 69 living in populations of 300,000 or less), yet expands queries into new types of library services, community impact, perceptions of funding sources other than taxes, and attitudes toward federal funding. Two population segments that were not part of the original research panel—people age 70 or older and people who live in large cities (populations greater than 300,000)—have been added and analyzed separately. The Methodology section (p. 30) details the methods and research questions used for this study in comparison to the original research and provides definitions of some of the terms used in this report.
This summary includes key findings from the 2018 research and highlights notable comparisons to 2008 results. The analysis shows that libraries remain valued institutions that most voters have a positive association with and find useful. There continues to be stalwart support for library funding in many communities as evidenced by the fact that the majority of local library ballot measures in recent years have passed. This new national voter data, however, indicates a softening in committed support for libraries over the past decade. Libraries and library advocates should take action to address this downward trend.
Readers can visit oc.lc/awareness2018 to access 2018 survey questions, data set and data tables, and summary analyses of the two additional population samples. Case studies, commentary, resources, and programming related to this research will be added to the website as they are made available.
PUBLIC LIBRARY
6 From Awareness to Funding 2018: Summary Report
Voter Perceptions and Support for Public Libraries Today: Key Overall ResultsA majority of US voters value public libraries.
Analysis shows that 55% of voters2 view the public library as an essential local institution, and 53% as a source of community pride. Fifty-eight percent (58%) feel that public libraries advance education, and 51% believe libraries enhance the quality of life of any community.
About half (49%) of voters agree that the public library remains an invaluable community resource, even in the Internet age. Over a quarter (27%) see the Internet as a suitable equivalent to libraries as an information source, and only 19% agree that bookstores or online retailers are an easier source for books. Just 13% question the necessity of libraries at all in the Internet age.
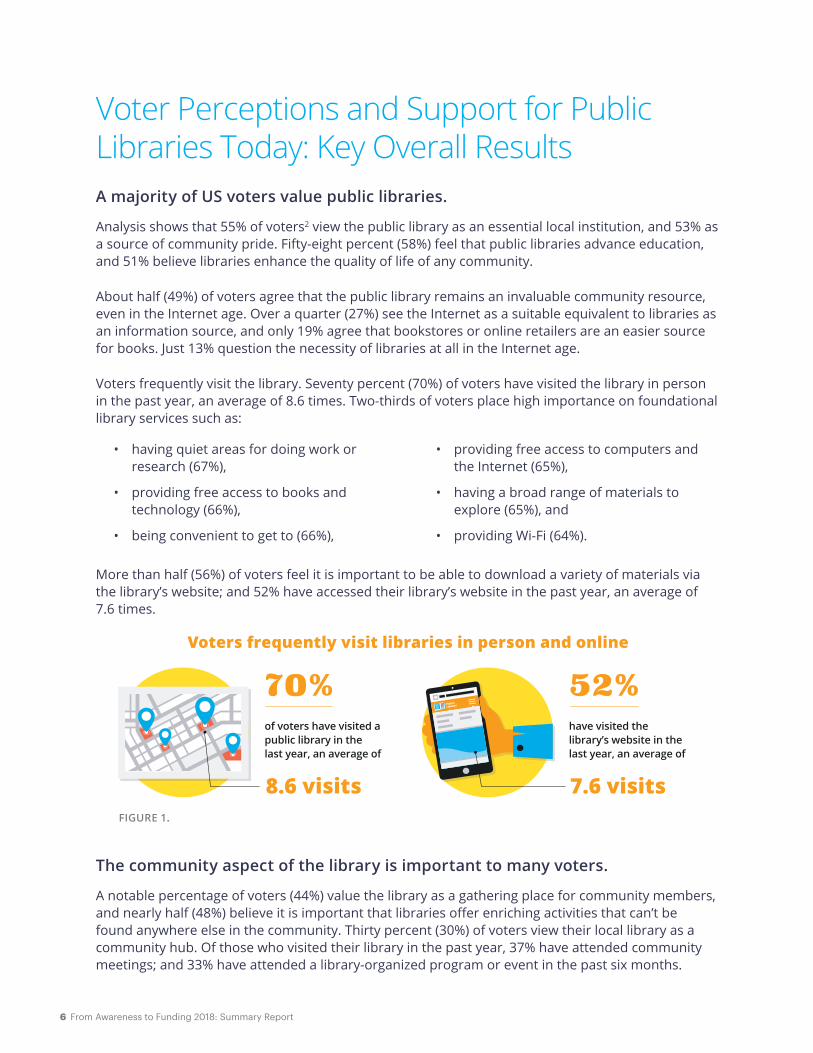
Voters frequently visit the library. Seventy percent (70%) of voters have visited the library in person in the past year, an average of 8.6 times. Two-thirds of voters place high importance on foundational library services such as:
More than half (56%) of voters feel it is important to be able to download a variety of materials via the library’s website; and 52% have accessed their library’s website in the past year, an average of 7.6 times.
The community aspect of the library is important to many voters.
A notable percentage of voters (44%) value the library as a gathering place for community members, and nearly half (48%) believe it is important that libraries off er enriching activities that can’t be found anywhere else in the community. Thirty percent (30%) of voters view their local library as a community hub. Of those who visited their library in the past year, 37% have attended community meetings; and 33% have attended a library-organized program or event in the past six months.
• having quiet areas for doing work or research (67%),
• providing free access to books and technology (66%),
• being convenient to get to (66%),
• providing free access to computers and the Internet (65%),
• having a broad range of materials to explore (65%), and
• providing Wi-Fi (64%).
FIGURE 1.
Voters frequently visit libraries in person and online
52% have visited the library’s website in the last year, an average of
7.6 visits
70%of voters have visited a public library in the last year, an average of
8.6 visits

From Awareness to Funding 2018: Summary Report 7
Commitment to library-funding support does not align with voter attitudes and use of the library.
While a majority of voters value and use the library, just over a quarter (27%) indicate they would defi nitely vote in favor of a referendum, ballot, or bond measure in support of the local library; another third (31%) say they probably would vote in favor. And, 35% agree they would be willing to pay more in local taxes to better fund the public library; only 19% would not agree to pay more in taxes.
Voters are confused about the sources of public library funding.
Institute for Museum and Libraries Services (IMLS) data shows that 86% of public library funding comes from local government sources;3 yet, 59% of voters think most library funding comes from non-local sources.
Voters support federal funding for libraries.
Thirty-seven percent (37%) believe that federal funding for libraries is too little, 29% think it is just right, and another 29% aren’t sure (only 5% think it’s too much). Regarding future federal library funding, three-quarters of voters say the federal government should either increase (38%) funding for public libraries or keep it the same (38%). Only 8% would recommend that federal funds are decreased or eliminated; and 17% are not sure.
Voters are receptive to library fundraising eff orts.
The majority (61%) of voters have either contributed (28%) or are willing to contribute (33%) to fundraising eff orts in support of their local library.
76% say the federal government should either...
38%increase funding for public libraries
38%or keep it the same
FIGURE 2.
FIGURE 3.
of voters think most library funding comes from non-local sources(e.g., state, federal, donations, fines, and fees)
of funding comes from local sources (IMLS, 2015)
59%
86%In reality,
8 From Awareness to Funding 2018: Summary Report
Comparison of 2008 and 2018 Overall FindingsA side-by-side assessment of the 2008 and 2018 research indicates that more voters today view libraries as hubs for connecting, learning, and skill building. Findings also indicate some decline among voters’ use and perception of libraries, and that voters’ commitment to support for tax-based library funding has softened.
Libraries are increasingly seen as a community hub for human connection and lifelong learning.
Significantly more voters today (43%) describe the library as a place that “offers activities and entertainment you can’t find anywhere else in the community,” than did in 2008 (34%) and more believe this is an important role for a library (48% in 2018 vs. 38% in 2008). Similarly, 44% now view their local library as “a place for people in the community to gather and socialize,” compared to 35% in 2008; and more believe this is an important role for a library (45% in 2018 vs. 36% in 2008). Also, 41% of voters in 2018 see the library as a place to turn to for help in disaster situations, a small increase from 37% in 2008.4
More voters recognize libraries as a resource for job training and language building.
In 2018, 42% of voters feel that the library “helps provide people with skills for the workplace,” compared to 35% in 2008; and 35% acknowledge that the library “provides classes, programs, and materials for immigrants and non-English speakers,” an increase from 25% in 2008.
Voters report visiting the library and its website less frequently.
The 70% in-person library visitation rate in 2018 is a decline from 79% in 2008; and the average number of visits per year dropped from 13.2 in 2008 to 8.6. Use of the library website declined from 77% in 2008 to 52% today.
Some traditional library services are used less often.
While still popular, some common services have seen declines, including use of nonfiction (53% in 2018 vs. 67% in 2008), fiction, or bestseller (54% vs. 63% in 2008) books for adults; DVDs (45% vs. 51% in 2008); print reference material (34% vs. 51% in 2008); computer searching (40% vs. 47% in 2008); photocopying (39% vs. 48% in 2008); and English as a second language classes (27% vs. 42% in 2008).
From Awareness to Funding 2018: Summary Report 9
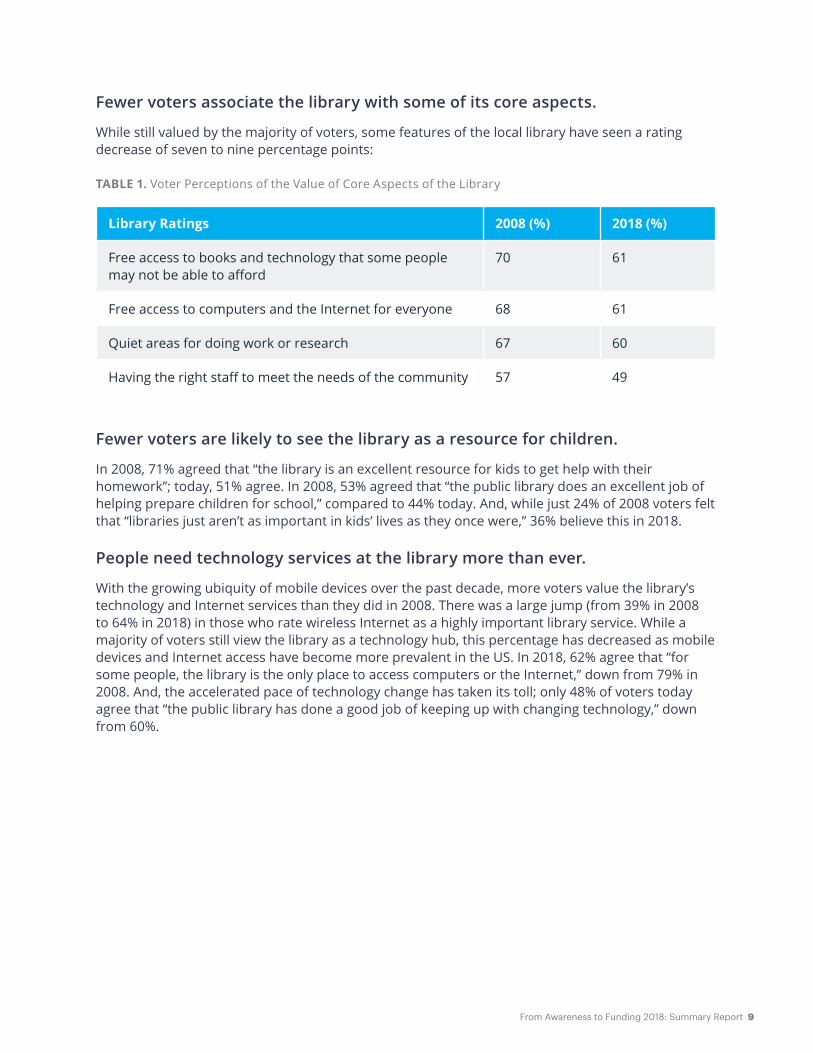
Fewer voters associate the library with some of its core aspects.
While still valued by the majority of voters, some features of the local library have seen a rating decrease of seven to nine percentage points:
TABLE 1. Voter Perceptions of the Value of Core Aspects of the Library
Library Ratings 2008 (%) 2018 (%)
Free access to books and technology that some people may not be able to afford
70 61
Free access to computers and the Internet for everyone 68 61
Quiet areas for doing work or research 67 60
Having the right staff to meet the needs of the community 57 49
Fewer voters are likely to see the library as a resource for children.
In 2008, 71% agreed that “the library is an excellent resource for kids to get help with their homework”; today, 51% agree. In 2008, 53% agreed that “the public library does an excellent job of helping prepare children for school,” compared to 44% today. And, while just 24% of 2008 voters felt that “libraries just aren’t as important in kids’ lives as they once were,” 36% believe this in 2018.
People need technology services at the library more than ever.
With the growing ubiquity of mobile devices over the past decade, more voters value the library’s technology and Internet services than they did in 2008. There was a large jump (from 39% in 2008 to 64% in 2018) in those who rate wireless Internet as a highly important library service. While a majority of voters still view the library as a technology hub, this percentage has decreased as mobile devices and Internet access have become more prevalent in the US. In 2018, 62% agree that “for some people, the library is the only place to access computers or the Internet,” down from 79% in 2008. And, the accelerated pace of technology change has taken its toll; only 48% of voters today agree that “the public library has done a good job of keeping up with changing technology,” down from 60%.
10 From Awareness to Funding 2018: Summary Report
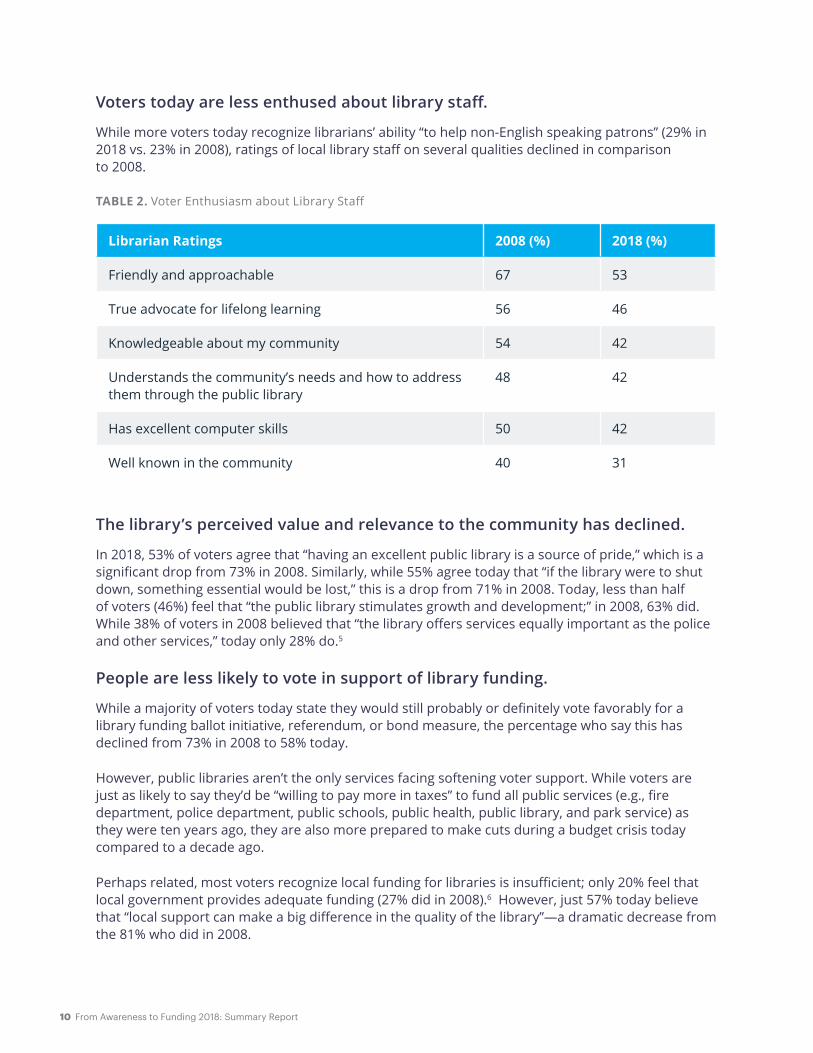
Voters today are less enthused about library staff.
While more voters today recognize librarians’ ability “to help non-English speaking patrons” (29% in 2018 vs. 23% in 2008), ratings of local library staff on several qualities declined in comparison to 2008.
TABLE 2. Voter Enthusiasm about Library Staff
Librarian Ratings 2008 (%) 2018 (%)
Friendly and approachable 67 53
True advocate for lifelong learning 56 46
Knowledgeable about my community 54 42
Understands the community’s needs and how to address them through the public library
48 42
Has excellent computer skills 50 42
Well known in the community 40 31
The library’s perceived value and relevance to the community has declined.
In 2018, 53% of voters agree that “having an excellent public library is a source of pride,” which is a significant drop from 73% in 2008. Similarly, while 55% agree today that “if the library were to shut down, something essential would be lost,” this is a drop from 71% in 2008. Today, less than half of voters (46%) feel that “the public library stimulates growth and development;” in 2008, 63% did. While 38% of voters in 2008 believed that “the library offers services equally important as the police and other services,” today only 28% do.5
People are less likely to vote in support of library funding.
While a majority of voters today state they would still probably or definitely vote favorably for a library funding ballot initiative, referendum, or bond measure, the percentage who say this has declined from 73% in 2008 to 58% today.
However, public libraries aren’t the only services facing softening voter support. While voters are just as likely to say they’d be “willing to pay more in taxes” to fund all public services (e.g., fire department, police department, public schools, public health, public library, and park service) as they were ten years ago, they are also more prepared to make cuts during a budget crisis today compared to a decade ago.
Perhaps related, most voters recognize local funding for libraries is insufficient; only 20% feel that local government provides adequate funding (27% did in 2008).6 However, just 57% today believe that “local support can make a big difference in the quality of the library”—a dramatic decrease from the 81% who did in 2008.

From Awareness to Funding 2018: Summary Report 11
Survey Results for Support of Library Funding
I’d be willing to pay more in local taxes to better fund this (% Top 3 Box Agreement: 8, 9, or 10 on a 10 pt. scale)
Fire Dept. Police Dept. Public Schools Public Health Public Library Park Service
53% 52% 51%42% 35% 30%
54% 50% 47% 42% 37%27%
2008 2018
Should be one of the first things cut in a budget crisis (% Top 3 Box Agreement: 8, 9, or 10 on a 10 pt. scale)
Fire Dept. Police Dept. Public Schools Public Health Public Library Park Service
15% 16% 16% 19%26%
32%
8% 10% 9% 11%18%
29%
2008 2018
Should be a top priority when allocating tax dollars (% Top 3 Box Agreement: 8, 9, or 10 on a 10 pt. scale)
Fire Dept. Police Dept. Public Schools Public Health Public Library Park Service
70% 70% 67%58%
39% 35%
74% 73% 71%
56%44%
25%
2008 2018
FIGURE 4.
12 From Awareness to Funding 2018: Summary Report
2018 Library Support Segments: Key Findings and Comparisons to 2008The 2008 research uncovered that voters’ support for library funding is not driven by demographics (e.g., income, age, gender, race, political affiliation), but rather their attitudes, perceptions, and behaviors. The study identified six key drivers among voters:
1. likelihood of voting favorably on a library referendum
2. general voting behavior
3. barriers to using/supporting the library
4. library services used
5. attitudes toward the library
6. perceptions of library staff
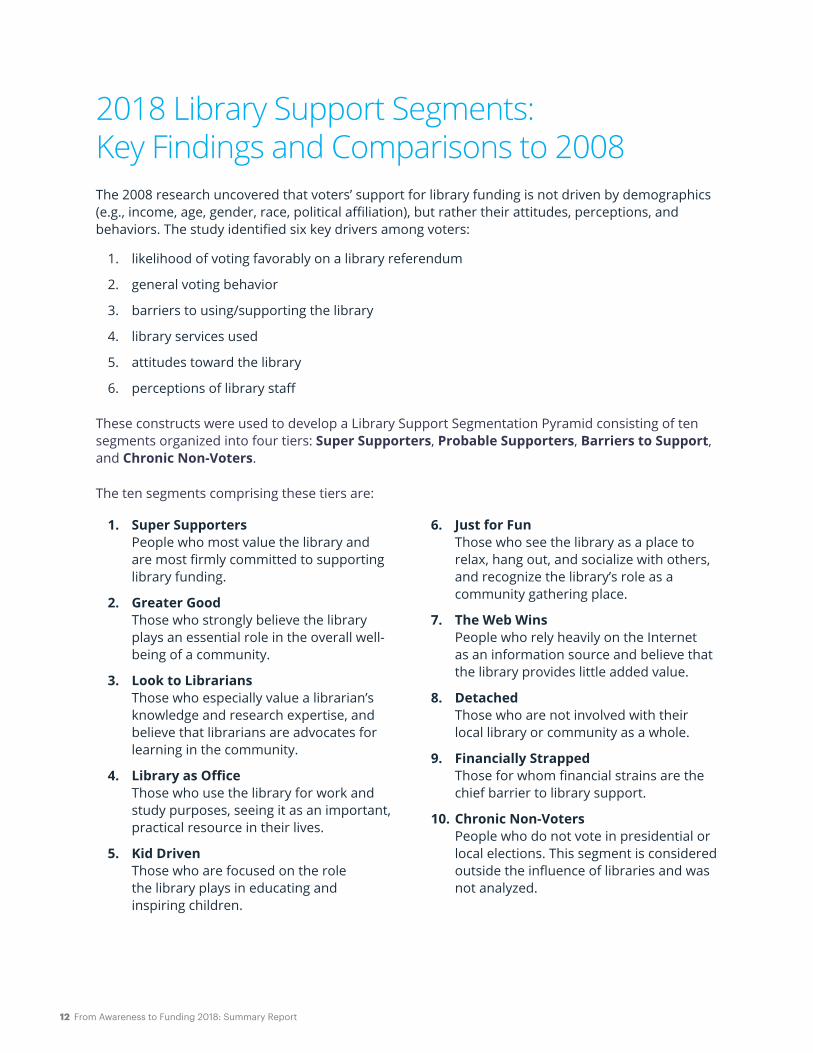
These constructs were used to develop a Library Support Segmentation Pyramid consisting of ten segments organized into four tiers: Super Supporters, Probable Supporters, Barriers to Support, and Chronic Non-Voters.
The ten segments comprising these tiers are:
1. Super Supporters People who most value the library and are most firmly committed to supporting library funding.
2. Greater Good Those who strongly believe the library plays an essential role in the overall well-being of a community.
3. Look to Librarians Those who especially value a librarian’s knowledge and research expertise, and believe that librarians are advocates for learning in the community.
4. Library as Office Those who use the library for work and study purposes, seeing it as an important, practical resource in their lives.
5. Kid Driven Those who are focused on the role the library plays in educating and inspiring children.
6. Just for Fun Those who see the library as a place to relax, hang out, and socialize with others, and recognize the library’s role as a community gathering place.
7. The Web Wins People who rely heavily on the Internet as an information source and believe that the library provides little added value.
8. Detached Those who are not involved with their local library or community as a whole.
9. Financially Strapped Those for whom financial strains are the chief barrier to library support.
10. Chronic Non-Voters People who do not vote in presidential or local elections. This segment is considered outside the influence of libraries and was not analyzed.
From Awareness to Funding 2018: Summary Report 13
1
2
3
4
SUPER SUPPORTERS
PROBABLE SUPPORTERS• Just For Fun• Kid Driven• Library As Office• Look to Librarians• Greater Good
BARRIERS TO SUPPORT• Financially Strapped• Detached• The Web Wins
CHRONIC NON-VOTERS
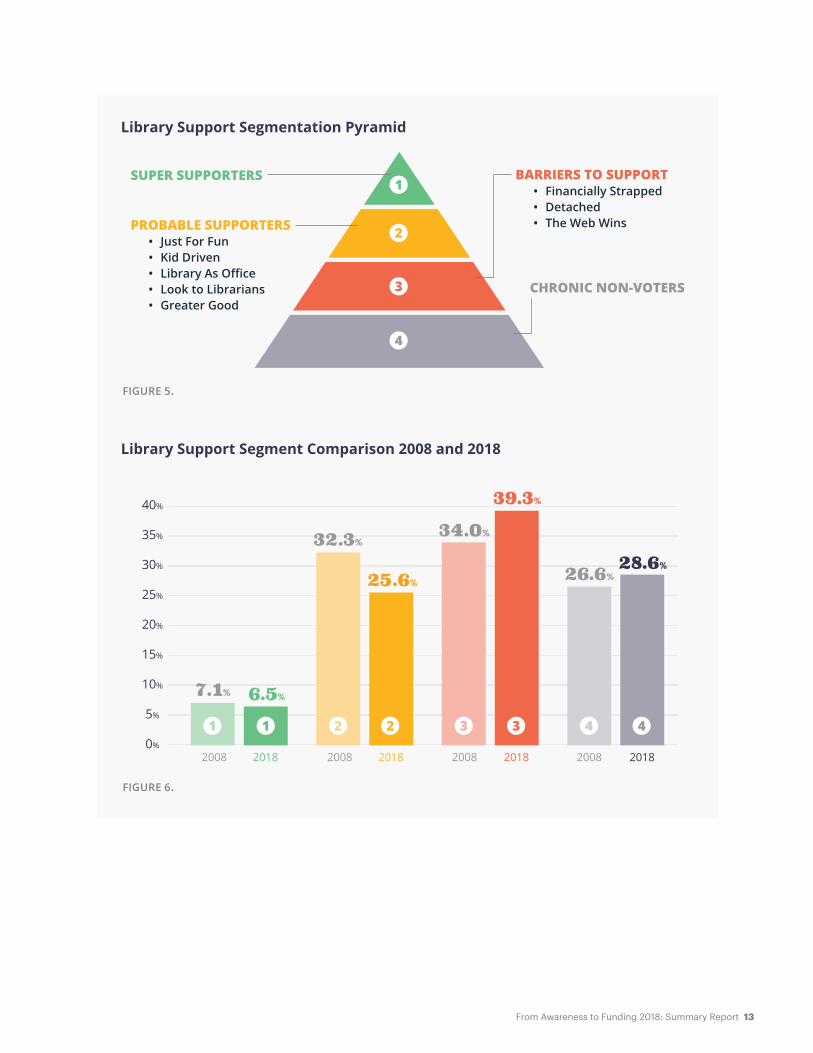
Library Support Segmentation Pyramid
Library Support Segment Comparison 2008 and 2018
2008 2008 2008 20082018 2018 2018 2018
40%
35%
30%
25%
20%
15%
10%
5%
0%
7.1% 6.5%
32.3%
25.6%
34.0%
39.3%
26.6%28.6%
1 1 2 2 3 3 4 4
FIGURE 5.
FIGURE 6.

14 From Awareness to Funding 2018: Summary Report
This section includes a snapshot view of the drivers for each of the nine analyzed segments and callout boxes to highlight significant changes to segment demographics since 2008.
TABLE 3. Snapshot of Library Support Segments
Tier/Segment
% of total population
% of segment that would
vote “yes” for libraries
Number of annual library
visits
% who rate libraries
positively
% who rate librarians positively
2008 2018 2008 2018 2008 2018 2008 2018 2008 2018
Super Supporters 7.1% 6.5% 80% 64% 15.9 15.9 71% 80% 72% 73%
Probable Supporters 32.3% 25.6% 47% 36% 19.9 13.6 73% 73% 72% 65%
Greater Good 8.7% 6.7% 50% 44% 4.5 6.0 61% 68% 63% 56%
Look to Librarians 6.5% 5.9% 50% 26% 24.5 13.8 80% 79% 83% 76%
Library as Office 3.4% 3.4% 49% 45% 18.0 26.4 59% 73% 57% 59%
Kid Driven 6.6% 5.2% 48% 30% 18.0 14.0 79% 70% 75% 62%
Just for Fun 7.1% 4.5% 37% 36% 36.3 14.6 80% 74% 73% 73%
Barriers to Support 34.0% 39.3% 19% 15% 6.4 4.1 49% 49% 46% 45%
The Web Wins 7.4% 12.1% 24% 20% 6.2 6.6 51% 50% 51% 47%
Detached 16.0% 17.7% 21% 10% 3.7 1.9 39% 44% 37% 39%
Financially Strapped 10.6% 9.5% 11% 18% 10.6 5.2 62% 54% 57% 53%
Chronic Non-Voters 26.6% 28.6% Excluded from questions

From Awareness to Funding 2018: Summary Report 15
SUPER SUPPORTERS
Representing 6.5% of the total population, the Super Supporters tier is the pinnacle of the pyramid; it offers the largest proportion of definite library support of any segment. This group has had more formal education than the average voter, but is otherwise demographically average in terms of age, gender, race, and income. Super Supporters are committed to a strong library: in 2018, 87% are willing to pay more in local taxes to better fund the library. People in this segment are avid readers and learners, and they visit the library an average of 15.9 times per year—the same as a decade ago.
Super Supporters have a deep emotional connection to the library and recognize its role in a thriving community. Today, 88% view the library as a source of community pride; 77% believe it stimulates community growth and development. Over the past decade, Super Supporters have grown in their conviction that a strong library raises property values: 80% believe this in 2018, a jump from 65% in 2008. And, nearly half (46%) see their library as a community hub today, compared to 34% in 2008.
Comparing 2008 to 2018, Super Supporters are:
45%2008
61%2018
65%2008
74%2018
42%2008
30%2018
More likely tobe homeowners
Less likely tohave children
at homeMore likely to
be married
FIGURE 7.
% of Super Supporters who would vote favorably for library referendum
80% 14%
64% 28%
Would definitely vote in favor Would probably vote in favor
2008
2018
FIGURE 8.
16 From Awareness to Funding 2018: Summary Report
Super Supporters believe the library is a better information source than the Internet. Today, 83% believe that the library helps people find trustworthy information, and 68% understand that the library offers access to resources not freely available elsewhere. Only 8% believe today that the Internet provides all the information that one could find in the library (down from 16% in 2008); and just 10% think that search engines produce information as good as a library search does—a notable decrease from 22% in 2008.
While Super Supporters’ likelihood to vote favorably remains consistent (92% in 2018 vs. 94% in 2008), the percentage of those who say they will definitely vote for library funding has declined from 80% in 2008 to 64% today. These results correspond to the downward trend in definite support across voters in general.
PROBABLE SUPPORTERS
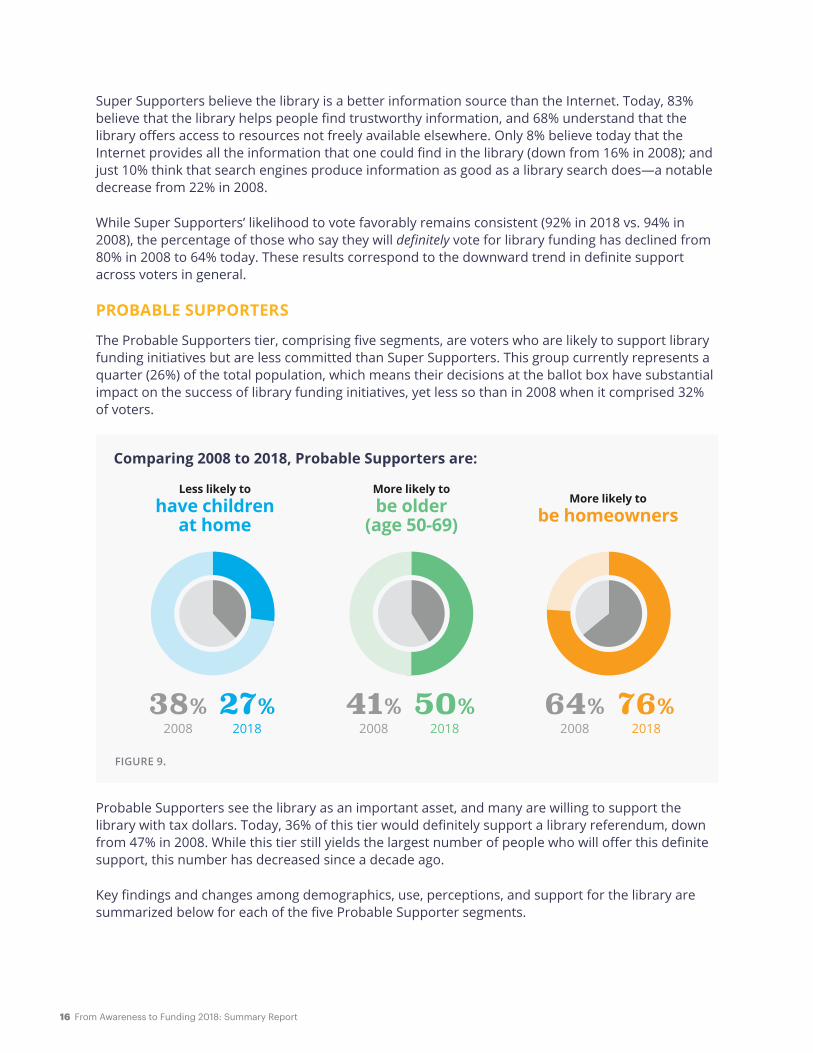
The Probable Supporters tier, comprising five segments, are voters who are likely to support library funding initiatives but are less committed than Super Supporters. This group currently represents a quarter (26%) of the total population, which means their decisions at the ballot box have substantial impact on the success of library funding initiatives, yet less so than in 2008 when it comprised 32% of voters.
Probable Supporters see the library as an important asset, and many are willing to support the library with tax dollars. Today, 36% of this tier would definitely support a library referendum, down from 47% in 2008. While this tier still yields the largest number of people who will offer this definite support, this number has decreased since a decade ago.
Key findings and changes among demographics, use, perceptions, and support for the library are summarized below for each of the five Probable Supporter segments.
Comparing 2008 to 2018, Probable Supporters are:
38%2008
27%2018
41%2008
50%2018
64%2008
76%2018
More likely tobe older
(age 50-69)More likely to
be homeownersLess likely to
have children at home
FIGURE 9.

From Awareness to Funding 2018: Summary Report 17
PROBABLE SUPPORTERS: GREATER GOOD
The Greater Good segment, representing 6.7% of the total population today, uses the library less frequently (6.0 average visits in-person over the past year) than other segments in this tier, but this has remained steady since 2008. Three-quarters feel it is important for the library to provide free access to a broad range of knowledge resources and technology, offer quiet work areas, and be an excellent educational resource for students. Two-thirds (67%) agree that the library is an invaluable resource even in the Internet age; and 60% believe that the public library “is a resource we cannot live without.” Half (50%) of the voters in this segment place importance on the library as a gathering place for community members, 53% as a resource for small businesses, and 56% as a place to gain workforce skills.
With only slight erosion since 2008, Greater Good voters are more likely than average to support funding for the library: 44% would definitely vote for a library referendum on the ballot, and 38% would agree to pay more in local taxes toward library funding. Forty percent (40%) have donated to library fundraising groups in the past (2018 data only).
Comparing 2008 to 2018, Greater Good supporters are:
45%2008
61%2018
19%2008
7%2018
20%2008
28%2018
Less likely tobe under the
age of 29
More likely tohave children
at home
More likely tobe older
(age 50-69)
FIGURE 10.

18 From Awareness to Funding 2018: Summary Report
PROBABLE SUPPORTERS: LOOK TO LIBRARIANS
The 5.9% of 2018 total population in the Look to Librarians segment rate the library highly and have an especially strong appreciation for its staff. They value librarians’ knowledge and research expertise, and believe that they are true advocates for learning in the community. In fact, this segment’s 76% who give librarians a positive overall rating makes it the strongest of any segment in 2018; and their 79% who rate public libraries positively in general is second only to Super Supporters. Yet, their consistently positive attitude is coupled with a decline in usage: they visited the library 13.8 times in the past year, compared to 24.5 visits a decade ago; and fewer use library services when they do visit. This group is no more likely than other voters to be aware of newer library services.
Although this segment still treasures the library as a place of learning, fewer of them agree that something essential would be lost if the library were to shut down (92% in 2008 vs. 73% today). Consequently, compared to ten years ago, this segment has become far less interested in funding or supporting the library. In 2008, 50% would definitely vote for library funding, but only 26% would today. The percentage who would probably vote for library support has remained roughly the same (43% in 2008 vs. 45% today).
Comparing 2008 to 2018, Look to Librarian supporters are:
20%2008
30%2018
36%2008
51%2018
45%2008
18%2018
More likely tobe older
(age 50-69)
Less likely tohave children
at homeMore likely to
be married
FIGURE 11.
From Awareness to Funding 2018: Summary Report 19
PROBABLE SUPPORTERS: LIBRARY AS OFFICE
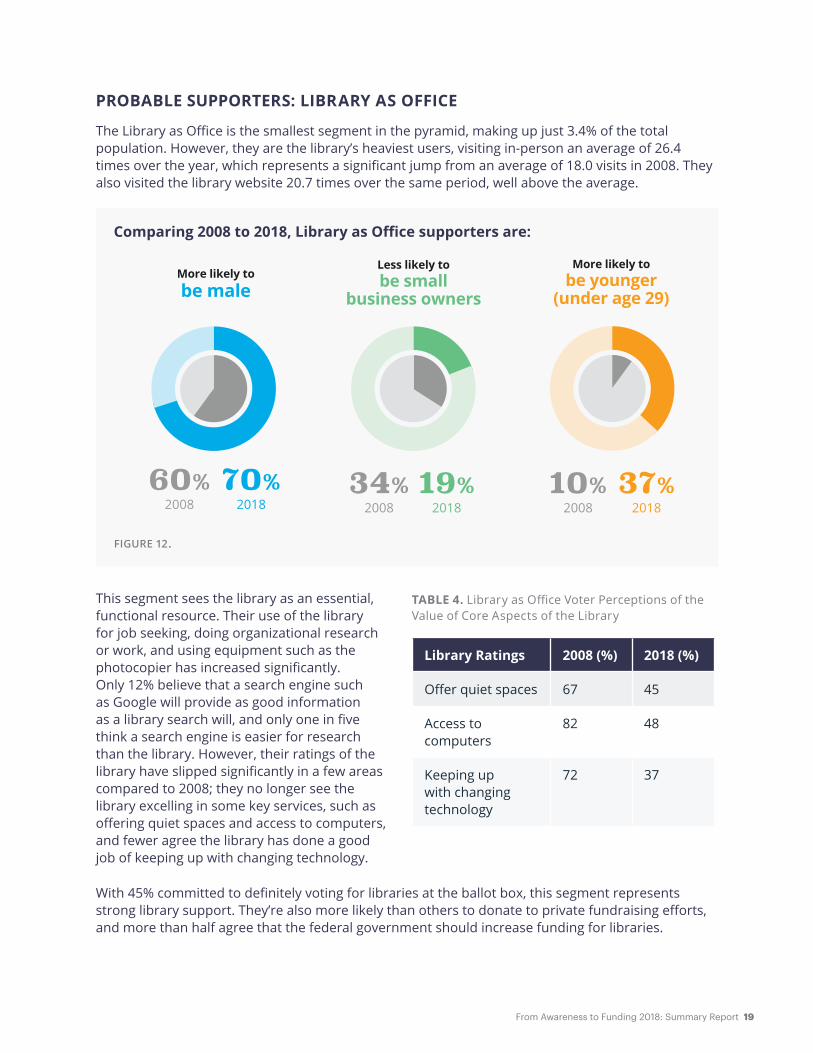
The Library as Office is the smallest segment in the pyramid, making up just 3.4% of the total population. However, they are the library’s heaviest users, visiting in-person an average of 26.4 times over the year, which represents a significant jump from an average of 18.0 visits in 2008. They also visited the library website 20.7 times over the same period, well above the average.
This segment sees the library as an essential, functional resource. Their use of the library for job seeking, doing organizational research or work, and using equipment such as the photocopier has increased significantly. Only 12% believe that a search engine such as Google will provide as good information as a library search will, and only one in five think a search engine is easier for research than the library. However, their ratings of the library have slipped significantly in a few areas compared to 2008; they no longer see the library excelling in some key services, such as offering quiet spaces and access to computers, and fewer agree the library has done a good job of keeping up with changing technology.
With 45% committed to definitely voting for libraries at the ballot box, this segment represents strong library support. They’re also more likely than others to donate to private fundraising efforts, and more than half agree that the federal government should increase funding for libraries.
TABLE 4. Library as Office Voter Perceptions of the Value of Core Aspects of the Library
Library Ratings 2008 (%) 2018 (%)
Offer quiet spaces 67 45
Access to computers
82 48
Keeping up with changing technology
72 37
Comparing 2008 to 2018, Library as Office supporters are:
Less likely tobe small
business owners
More likely tobe younger
(under age 29)More likely tobe male
60%2008
70%2018
34%2008
19%2018
10%2008
37%2018
FIGURE 12.

20 From Awareness to Funding 2018: Summary Report
PROBABLE SUPPORTERS: KID DRIVEN
The Kid Driven segment represents 5.2% of the total population. The biggest users of children’s books and entertainment, these voters value the library as a resource for childhood learning. However, this perception has weakened: In 2008, two-thirds viewed the library as an excellent resource to prepare children for school; now only half do. And, whereas 80% of 2008 Kid Driven voters agreed libraries are an excellent resource for homework help for kids, this has declined to 63% today. Today, 29% of these voters believe that libraries just aren’t as important in children’s lives, double that of 2008 (14%). This segment uses the library less frequently now, dropping from 18 in-person trips per year in 2008 to 14 per year in 2018.
This segment places a great emphasis on the library being a community, technology, and entertainment hub, even more so than they did ten years ago. For example, in 2008, 47% agreed that the library should be “a place for communities to gather together,” and, in 2018, 58% agree — which is well above the 44% across the total voter sample. Nearly three-quarters (73%) give high marks to the library for providing wireless access (vs. 39% in 2008), and 53% rate the library highly for “offering activities and entertainment you can’t find anywhere else in the community” (vs. 47% in 2008). Yet, this segment has become less confident that library staff are in close enough touch with community leaders and community needs. For example, 48% now agree that library staff are “knowledgeable about my community,” which is down from 69%. And, only 33% believe that librarians work “closely with local politicians and community leaders to get public library funding and support,” a drop from 50% in 2008.
The Kid Driven segment is less firmly committed to library funding than they were a decade ago. In 2008, 48% would definitely vote in favor of library funding; this has declined to 30% in 2018; meanwhile, 43% would probably vote in favor in 2018, a slight increase from 39% in 2008.
Comparing 2008 to 2018, Kid Driven supporters are:
73%2008
60%2018
64%2008
51%2018
Less likely tohave childrenunder age 18
Less likely tobe female
FIGURE 13.
From Awareness to Funding 2018: Summary Report 21
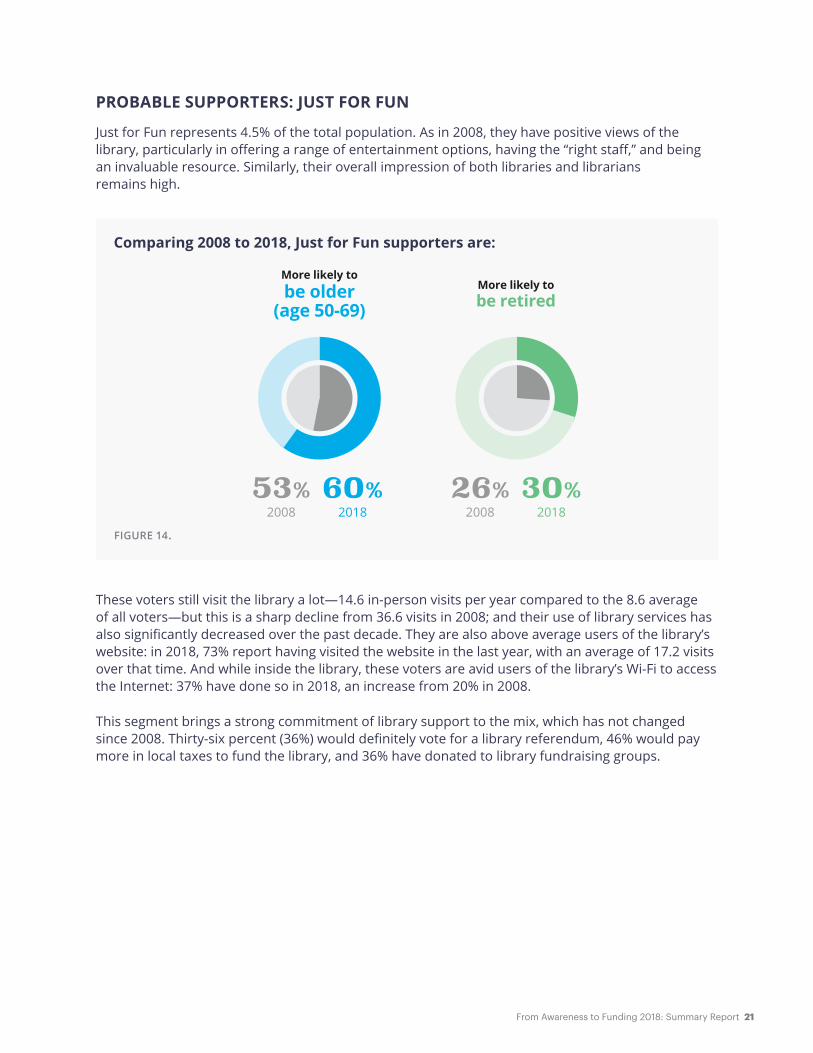
PROBABLE SUPPORTERS: JUST FOR FUN
Just for Fun represents 4.5% of the total population. As in 2008, they have positive views of the library, particularly in offering a range of entertainment options, having the “right staff,” and being an invaluable resource. Similarly, their overall impression of both libraries and librarians remains high.
These voters still visit the library a lot—14.6 in-person visits per year compared to the 8.6 average of all voters—but this is a sharp decline from 36.6 visits in 2008; and their use of library services has also significantly decreased over the past decade. They are also above average users of the library’s website: in 2018, 73% report having visited the website in the last year, with an average of 17.2 visits over that time. And while inside the library, these voters are avid users of the library’s Wi-Fi to access the Internet: 37% have done so in 2018, an increase from 20% in 2008.
This segment brings a strong commitment of library support to the mix, which has not changed since 2008. Thirty-six percent (36%) would definitely vote for a library referendum, 46% would pay more in local taxes to fund the library, and 36% have donated to library fundraising groups.
Comparing 2008 to 2018, Just for Fun supporters are:
More likely tobe retired
More likely tobe older
(age 50-69)
53%2008
60%2018
26%2008
30%2018
FIGURE 14.

22 From Awareness to Funding 2018: Summary Report
BARRIERS TO SUPPORT
The Barriers to Support tier is the most challenging group (beyond the Chronic Non-Voters) to convince of library funding support. The tier has increased slightly since 2008, from 34% to 39% of the general public. It still represents a proportionally small number of definite supporters of library funding; the percentage of voters in this tier who would definitely support library funding has slipped somewhat, from 19% to 15%. Key results from each of the three segments in this tier are summarized below.
BARRIER TO SUPPORT: THE WEB WINS
The Web Wins represents 12.1% of the total population, a significant increase from 7.5% in 2008. This group is more likely than most to believe that the information found on the Internet is equally as good as what can be obtained at the library, although this viewpoint has softened: today, 50% agree with that statement, compared to 63% in 2008. However, they do use several library services more today, including non-English books (42% in 2018 vs. 34% in 2008) and job-seeking support (35% in 2018 vs. 23% in 2008).
Just 28% of the Web Wins segment believe that the library remains an invaluable resource to the community in the Internet age, significantly fewer than the 49% of total voters who do.
Consistent with 2008, most of the voters in this segment are not likely to vote for library funding. Only one in five say they would definitely vote for a library referendum; and 22% indicate they would be willing to pay more in local taxes to better fund the library.
Comparing 2008 to 2018, The Web Wins voters are:
20%2008
38%2018
44%2008
34%2018
35%2008
43%2018
Less likely tobe older
(age 50-69)
More likely tohave children
at homeMore likely to
be non-white
FIGURE 15.
From Awareness to Funding 2018: Summary Report 23
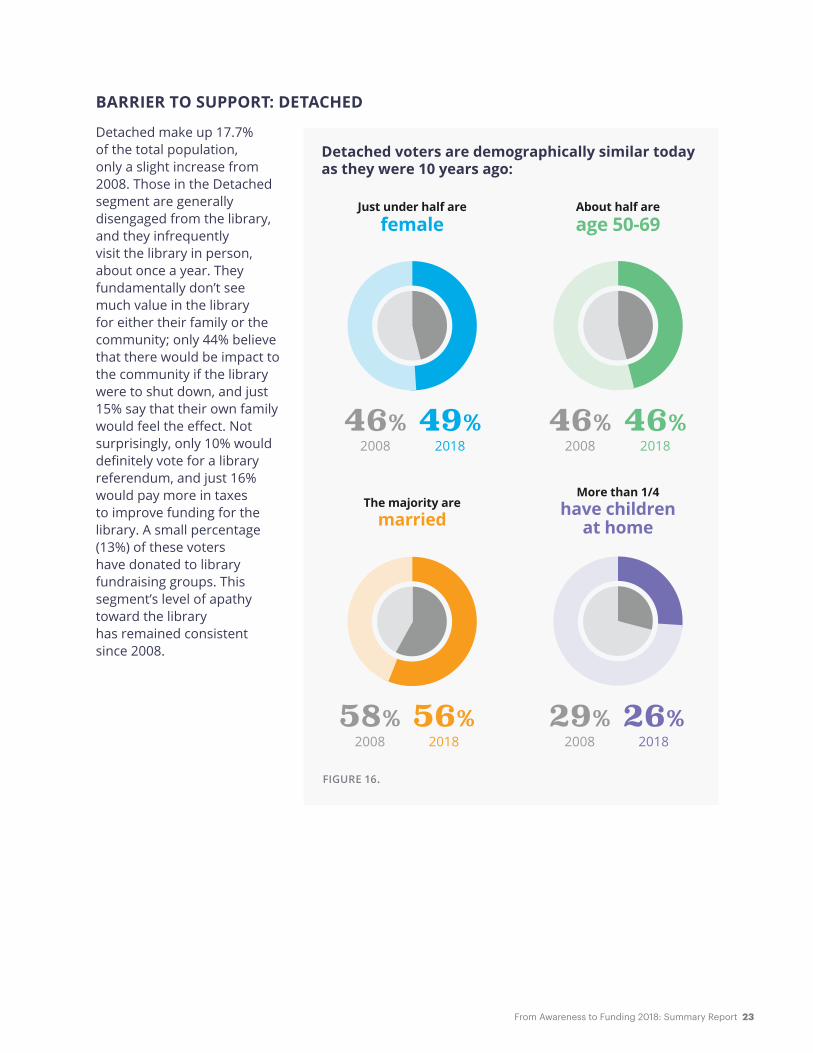
BARRIER TO SUPPORT: DETACHED
Detached make up 17.7% of the total population, only a slight increase from 2008. Those in the Detached segment are generally disengaged from the library, and they infrequently visit the library in person, about once a year. They fundamentally don’t see much value in the library for either their family or the community; only 44% believe that there would be impact to the community if the library were to shut down, and just 15% say that their own family would feel the effect. Not surprisingly, only 10% would definitely vote for a library referendum, and just 16% would pay more in taxes to improve funding for the library. A small percentage (13%) of these voters have donated to library fundraising groups. This segment’s level of apathy toward the library has remained consistent since 2008.
Detached voters are demographically similar today as they were 10 years ago:
About half areage 50-69
58%2008
56%2018
The majority aremarried
46%2008
49%2018
Just under half arefemale
29%2008
26%2018
More than 1/4have children
at home
46%2018
46%2008
FIGURE 16.
24 From Awareness to Funding 2018: Summary Report
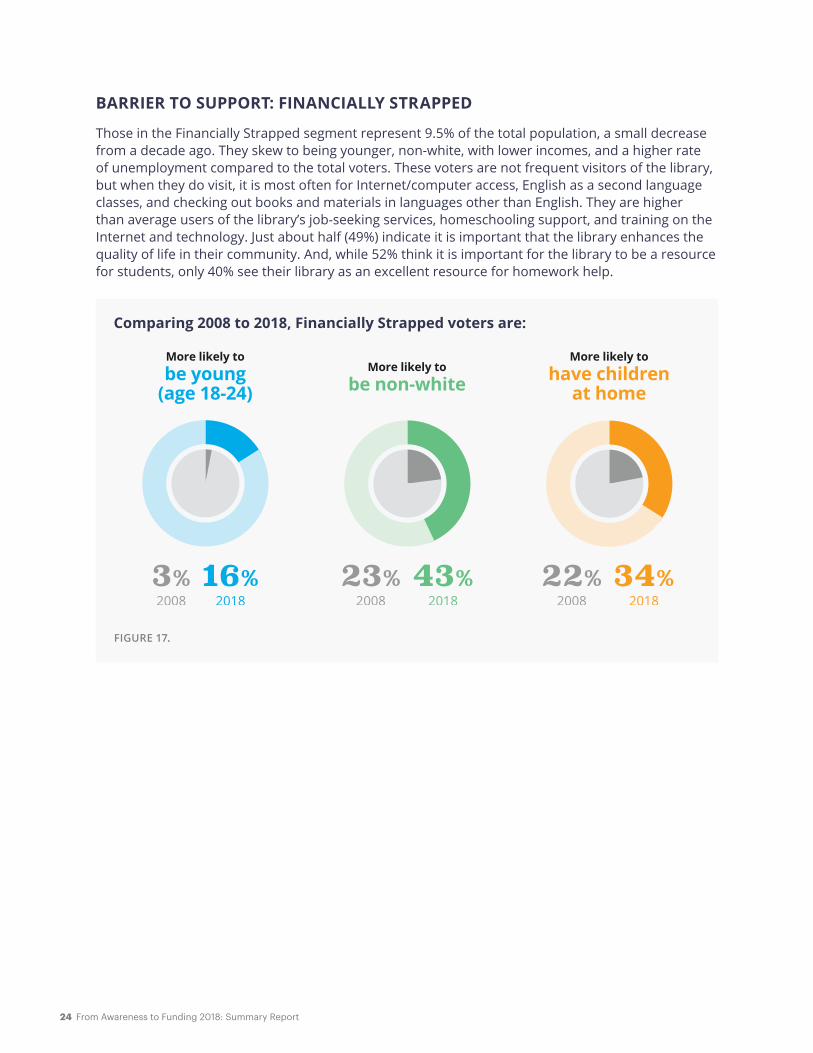
BARRIER TO SUPPORT: FINANCIALLY STRAPPED
Those in the Financially Strapped segment represent 9.5% of the total population, a small decrease from a decade ago. They skew to being younger, non-white, with lower incomes, and a higher rate of unemployment compared to the total voters. These voters are not frequent visitors of the library, but when they do visit, it is most often for Internet/computer access, English as a second language classes, and checking out books and materials in languages other than English. They are higher than average users of the library’s job-seeking services, homeschooling support, and training on the Internet and technology. Just about half (49%) indicate it is important that the library enhances the quality of life in their community. And, while 52% think it is important for the library to be a resource for students, only 40% see their library as an excellent resource for homework help.
Comparing 2008 to 2018, Financially Strapped voters are:
3%2008
16%2018
23%2008
43%2018
22%2008
34%2018
More likely tobe non-white
More likely tohave children
at home
More likely tobe young
(age 18-24)
FIGURE 17.
From Awareness to Funding 2018: Summary Report 25
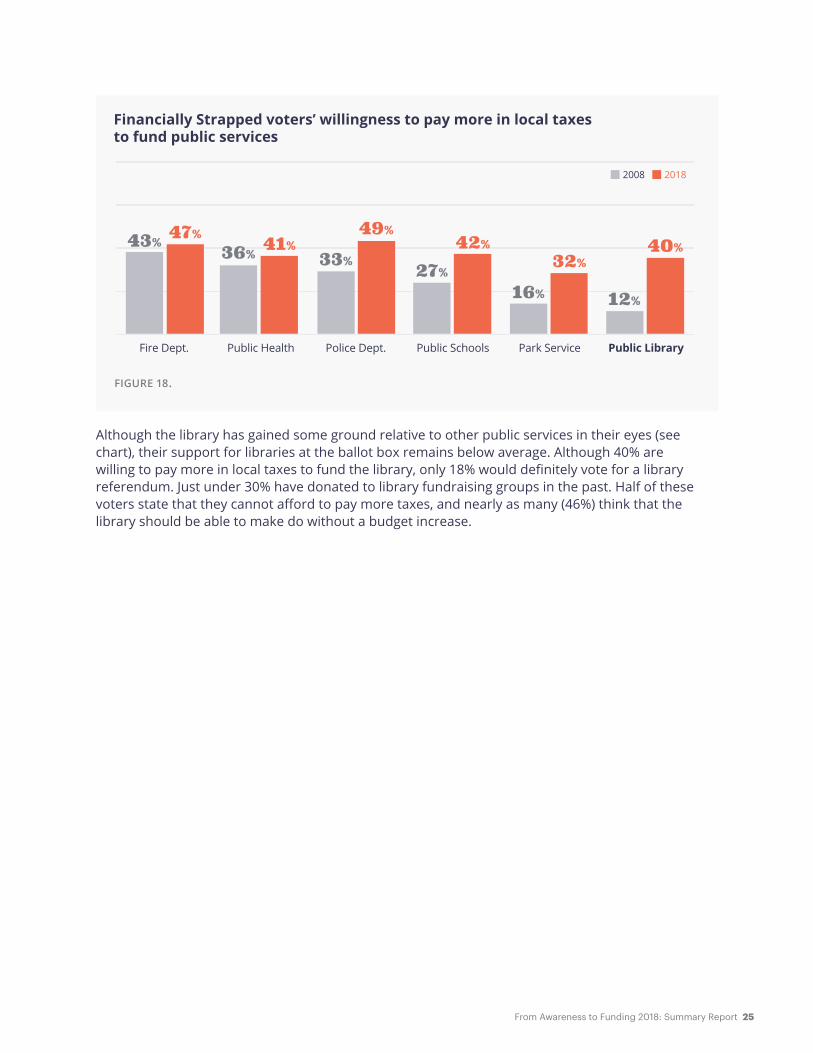
Although the library has gained some ground relative to other public services in their eyes (see chart), their support for libraries at the ballot box remains below average. Although 40% are willing to pay more in local taxes to fund the library, only 18% would definitely vote for a library referendum. Just under 30% have donated to library fundraising groups in the past. Half of these voters state that they cannot afford to pay more taxes, and nearly as many (46%) think that the library should be able to make do without a budget increase.
Financially Strapped voters’ willingness to pay more in local taxes to fund public services
Fire Dept. Police Dept. Public SchoolsPublic Health Public LibraryPark Service
47% 41%49%
42%32%
40%43% 36% 33% 27%16% 12%
2008 2018
FIGURE 18.

26 From Awareness to Funding 2018: Summary Report
Cultural Context: What Has Changed in Ten Years?In the decade since the first From Awareness to Funding study, there have been significant economic, technological, demographic, and political shifts in the US, including three presidential elections, a global economic crisis, and the sharp rise in social media–driven information flow.
Facebook, Twitter, and YouTube had opened to the public just a year before the original research was conducted; the introduction of the first iPhone soon followed. Today, smartphones and social media are used by millions around the world. They have amassed vast shares of the attention economy and created tidal shifts in how people communicate and access information.
The Great Recession7 also had widespread impact, including on public libraries. Library use climbed in the wake of economic duress, and libraries gathered resources and developed programs and services to support job seekers, the unemployed, and business owners striving to rebuild local economies. Over the past decade, the library industry has explored how libraries can and should become more deeply engaged with their communities in terms of programs, services, and outreach. Libraries are reorienting toward measuring success based on patron and community outcomes, rather than library outputs. And library digital content and services are exploding.
It is possible that the Great Recession and other shifts in the external landscape have had a chilling effect on public service, overall. Evidence suggests a deprioritization of public support not just for libraries, but also for fire, police, public schools, public health, and park services. And recent studies, such as ones conducted by Gallup Organization,8 show a decline in the public’s trust in every major institution—government, education, business, labor unions, media, religion, banks—starting in 2007.
Today, public libraries are even more reliant on local funding sources for operating revenue. In 1998, local government was the source of 78% of public library funding. By 2008 this percentage had risen to 82%. As of 2015, the percentage had increased further, to 86%.9 In recognition of this trend, bolstering local support for library funding is one of the most pressing needs faced by public libraries today.

From Awareness to Funding 2018: Summary Report 27
In the last few election cycles, many libraries were rewarded for their local advocacy eff orts with successful ballot initiatives, affi rming voter investment in bond measures and increased millages for the library. For example, voters across 22 states passed more than 81% of 150 library funding measures in 2016; and in 2017, 95% of all 133 library ballots tracked passed.10,11 While these outcomes are heartening, this research study confi rms trend data about public library use from the Public Libraries Survey12 and fi nds that, overall, public library support has softened. Demographic shifts (Baby Boomer supporters are aging, and the percentage is shrinking as a proportion of the population, while the percentage of skeptics is increasing in size) and cultural trends suggest these losses could accelerate and undermine library funding in the future, if concerted action is not taken.
Percentage total revenue from local sources
1998 1999 2000 2001 2002 2003 2004 2005 2006 2007 2008 20102009 2011 2012 2013 2014 2015
85.5%
77.6%
FIGURE 19.
28 From Awareness to Funding 2018: Summary Report
Next StepsChicago Mayor Rahm Emanuel once said, “You never want a serious crisis to go to waste. It’s an opportunity to do things you thought you couldn’t do before.” In terms of strengthening awareness and support for our public libraries, we as a library community should not wait for a crisis to take action we might believe is not possible.
With this current view of US voters’ perceptions, use, and support of libraries, and an understanding of how it compares to a decade ago, we can initiate and coordinate action at local, state, and national levels. Some areas for exploration could include the following:
Target public awareness efforts
Awareness of library offerings and value continues to be a challenge—perhaps one that is only growing as people are more distracted and diverted into a fragmented communications environment. The Pew Research Center has consistently found in their household surveys that many Americans, including library users, are still unaware of the breadth of resources offered by the public library.13 The market segments and their characteristics outlined in the original research and updated here can better enable library professionals to target communications and customize messaging via traditional and social media channels to more effectively reach people. For instance, libraries may connect announcements of new programs or services to larger stories about how the library supports school-age children, workforce readiness, or small business development.
Leverage areas of positive public perception
Consider the balance between traditional and emerging services and how they are communicated to the public. Several service areas that people feel are among the most important for libraries saw a decline in their perception among voters over the past decade, including providing free access to books and technology, helping students with homework, and having the right staff to meet the needs of the community. Yet, these services remain common to all public libraries. While still strong overall, public perception of our work in these areas has fallen. The library “book” brand persists in people’s minds to our benefit and detriment. At the same time, we can maximize and leverage areas where we see improving public perception, including helping provide people with skills for the workforce and providing an inviting gathering place for community members to connect and learn together.
Amplify library resources and impacts for school-age children
The decreased perception of library value in this area and the decrease in funding support among the Kid Driven segment are particularly alarming: all public libraries dedicate significant resources to this population, and engaging families is essential to developing future library users and supporters. In 2013, the Pew Research Center found that parents were among the most active library users surveyed; and 94% said the library was important for their children.14 While Pew Research surveyed a different population segment than the one used for this study, these new findings indicate that more work is needed to raise awareness of the vital roles that libraries play for children and families. Children also may have less free time to spend at the library than they once did; a better understanding of the trends in out-of-school time and the competition for children’s (and their busy parents’) attention is also warranted.

From Awareness to Funding 2018: Summary Report 29
Cultivate and empower Super Supporters
A significant bright spot in the research is that support among library Super Supporters—a small but mighty group—is largely unchanged. This segment’s loyalty should not be taken for granted, but rather nurtured and protected. In addition, library leaders can consider how to engage and leverage this group as library ambassadors to advocate with decisionmakers and influence other segments of the population that might be more disconnected or skeptical.
Engage the Library as Office segment
The Library as Office segment includes the most frequent users of the library, offers a much higher than average percentage of definite library supporters, and skews younger than Super Supporters. This makes them a valuable segment to nurture. Their connection to and investment in the future of our institutions might be increased by focusing on the library traits that mean most to them: convenience, comfortable work spaces, and ample access to computers and technology. As the gig economy continues to attract more and younger professionals, this small segment may continue to grow.
Recognize local libraries as community hubs
As the need for traditional services continues to evolve, the spotlight can be shined on assets that are often overlooked: the library as a safe and welcoming place, a hub that connects people and gives them opportunities to learn together, and the positive impact of library staff engaged with the community around local priorities. For some libraries, the shift could include new programming that emphasizes community issues or cultural intersections; while in others, an assessment of community needs and evaluation of services could be incorporated. In either case, it is important to continually communicate the value of the library as a vital and noncommercial third space that is positioned to bring together diverse communities with equally diverse and enriching programs.
Address those in the Barriers to Support tier
Consider how to make inroads among the nearly 40% of voters who do not currently support the library. What do they value, and how does this influence service delivery and communications about library programs? The Web Wins segment has seen the largest growth in size. Speak early and often to the role of the library in a digital world—both in enabling access for all and in being an essential physical place for community connection.
Clarify misconceptions about funding sources
Build a clearer “line of sight” as to how funding leads to improvement. Government at all levels struggles to make visible the impact of public investments in infrastructure such as roads and public buildings. How can libraries better show the return on local investment? It is alarming that we have seen a more than 20-point drop in the belief that “local support can make a big difference in the quality of the library.” The data clearly shows that this issue is not limited to libraries, as willingness to fund public services and growing privatization efforts affect all sectors. But it is one we must confront.
These summary results and initial reflections are offered as a catalyst to conversation and collaboration among library leaders and library support organizations across the country. We encourage you to explore the full report and additional resources online at oc.lc/awareness2018. Together we can identify our next best steps forward, knowing that our essentially local institutions will continue to develop local solutions.

30 From Awareness to Funding 2018: Summary Report
MethodologyFor the original 2008 study, OCLC partnered with Leo Burnett USA to create a segmentation analysis and targeting framework. The goal was to identify segments of the public that were more or less interested in supporting their local libraries, and to uncover the motivations and barriers driving this support.
For this updated study, OCLC partnered with ALA, PLA, and Leo Burnett to update the segmentation and assess what, if anything, had changed—both among the general public as well as among specific library segments. While this new study dropped the qualitative research (focus groups) and the survey of city officials, it expanded the analysis in a few areas. It includes a sample of those living in larger metropolitan areas to gauge differences between smaller and bigger populations. While the previous study focused just on population areas with fewer than 300,000 residents, this study included another dataset from voters in regions with more than 300,000 residents. The results do not show significant variation from the results of the voters in the smaller geographic regions. In addition, some new questions were added to assess awareness and usage of newer library offerings, and to probe more in-depth into opinions about library funding.
Between September 29 and October 4, 2017, a 25-minute survey was administered by Leo Burnett via an online panel. The data was weighted to be nationally representative on age, gender, income, and education. Data was collected for three samples:
1. A sample of 2,000 people age 18 to 69 in areas with a population of less than 300,000 (used for direct comparison to the 2008 study). Results for this sample have a statistical margin of error of +/- 2.3 percentage points at the 95th confidence level.
2. A sample of 1,000 people age 18 to 69 who live in population centers of more than 300,000. As noted above, results for this group were not significantly different from the smaller geographic regions; a summary of those results can be found at oc.lc/awareness2018.
3. A sample of 200 respondents age 70+. While this group is similar with respect to funding support to the general sample, they have an overall higher impression of librarians, the library, and its impact on the community. A summary analysis of the 70+ can be found on the website at oc.lc/awareness2018.
An algorithm was used to screen for all ten segments that were identified in the original study. Like last time, the survey screened out the Chronic Non-Voters segment, because those not registered to vote or who do not vote are deemed outside of libraries’ scope of influence.
To allow for comparison from 2008 to 2018, a significant number of the questions had to be retained in their original form around the following topics:
• demographics
• voting behavior
• library voting support
• library usage, overall and for specific services
• library attitudes
• funding attitudes
• importance of library vs other public services
• library and librarian ratings
• anticipated impact of library closings

From Awareness to Funding 2018: Summary Report 31
New to 2018 were questions related to:
The survey instruments used are included as a downloadable file on the report website here: oc.lc/awareness2018.
Various question constructs were used in the survey instrument that relate to how the results are described in this summary report:
Importance Scale. The report uses words such as “important” or “importance” in reference to questions where respondents were shown phrases and words and asked to rate how important they were for public libraries (e.g., offers quiet areas for doing work or research) and librarians (e.g., knowledgeable about my community). The scale ranged from 10 (“extremely important”) to 1 (“not at all important”). The percentage of those who found the statement “important” was calculated from those respondents who rated each phrase with an 8, 9, or 10.
Description Scale. The report uses words such as “describe,” “view,” “believe,” “acknowledge,” “feel,” and “recognize” in reference to questions where respondents were shown the same phrases and words used in the importance scale and asked to rate how well each described their local library and its staff. The scale ranged from 10 (“describes it extremely well”) to 1 (“doesn’t describe it at all”). The percentage of those who found the statement as “describing” their library or its staff was calculated from those respondents who rated each phrase with an 8, 9, or 10.
Agreement Scale. The report uses words such as “agree,” “feel,” “view,” or “believe” in reference to questions where respondents were asked to rate to what extent they agree with a given statement, e.g., I would be willing to pay more in taxes that would fund operating costs of the local public library. The scale ranged from 10 (“agree strongly”) to 1 (“disagree strongly”). The percentage of those who “agree” with the statement was calculated from those respondents who rated each phrase with an 8, 9, or 10.
Library visitors and services used. The report references services used at the public library. The base for those who have used a service is made up of those who indicate they have visited their public library in the last year (“library visitors”); the % indicated as using a service is library visitors that have used the service in the past six months.
Overall positive ratings of libraries and librarians. The report references those who give libraries and librarians an overall positive rating. This is based on the question, “Please rate your overall impression of your local public library/librarians at your public library on a 10-point scale, where a 10 means it’s “An Excellent Library” and 1 means it’s “Unsatisfactory.” The percentage who rate libraries/librarians “positively” was calculated from those respondents who gave a rating of 8, 9 or 10.
• awareness and usage of new library offerings
• library website visitation frequency
• library’s impact on community advancement (education, employment, etc.)
• additional library and librarian ratings
• perceptions of funding
• contributions to private fundraising efforts
• additional probes on impact of library closings
• anticipated impact of library closings

32 From Awareness to Funding 2018: Summary Report
Notes1. De Rosa, Cathy, and Jenny Johnson. 2008. From Awareness to Funding: A Study of Library Support in America: A
Report to the OCLC Membership. Dublin, OH: OCLC. https://www.oclc.org/en/reports/funding.html.
2. The research panel is composed of a sample of 2,000 US voters between the age of 18 and 69 who live in population areas of fewer than 300,000 residents.
3. See IMLS, “Public Libraries Survey (PLS) Data and Reports,” FY 2015. https://www.imls.gov/research-evaluation/data-collection/public-libraries-survey/explore-pls-data/pls-data.
4. The Pew Research Center report, Libraries 2016,4a found that 69% of the general US public (age 16 and older) say the library contributes “a lot” to providing a safe place for people to spend time; 38% say they contribute “a lot” to promoting a sense of community among different groups within their local areas; and 29% believe they contribute “a lot” to serving as a gathering place for addressing challenges in their communities. Also, the FY2014 Public Library Survey Annual Report compiled by IMLS4b notes a 68% increase over ten years in the number of community programs offered at public libraries, stating that, “Although print and physical audio materials have been decreasing, the number of programs has consistently increased, indicating a demand for in-person opportunities that differ from the traditional library services.”
—4a. Horrigan, John B. Libraries 2016. Pew Research Center: Internet & Technology, Posted 9 September 2016. https://www.pewinternet.org/2016/09/09/2016/Libraries-2016/.
—4b. The Institute of Museum and Library Services. 2017. Public Libraries in the United States Fiscal Year 2014. Washington, DC: The Institute. https://www.imls.gov/sites/default/files/publications/documents/plsfy2014.pdf.
5. The Pew Research Center asked similar questions of the general US public in 2016. (See note 4a, Libraries 2016.)
6. The International City/County Management Association (ICMA) survey, Local Libraries Advancing Community Goals, 2016, reveals that 45% of local government officials agree or strongly agree that libraries need more funding to support the library’s role in their community. https://www.icma.org/2016librariessurveyreport.
7. Wikipedia, s.v. “Great Recession.” Last modified 7 March 2018, at 03:23. https://en.wikipedia.org/wiki/Great_Recession.
8. Gallup Survey results referenced in Bill Bishop’s “Americans Have Lost Faith in Institutions. That’s Not Because of Trump or ‘Fake News.’” Washington Post (PostEverything, Perspective), 3 March 2017. https://www.washingtonpost.com/posteverything/wp/2017/03/03/americans-have-lost-faith-in-institutions-thats-not-because-of-trump-or-fake-news.
9. Extracted from IMLS’s “Public Libraries Survey (PLS) Data and Reports,” FY 1998 through FY 2015. https://www.imls.gov/research-evaluation/data-collection/public-libraries-survey/explore-pls-data/pls-data.
10. Rosa, Kathy, and Kelsey Henke. 2017. “Referenda Roundup 2016: How States Performed on Library Measures.” American Libraries, 3 January 2017. https://www.americanlibrariesmagazine.org/2017/01/03/referenda-roundup-2016/.
11. Chrastka, John, and Erica Findley. “Breaking Records at the Polls: Budgets and Funding.” Library Journal, 20 February 2018. https://lj.libraryjournal.com/2018/02/budgets-funding/breaking-records-polls-budgets-funding/.
12. IMLS Public Library Survey. https://www.imls.gov/research-evaluation/data-collection/public-libraries-survey/explore-pls-data/pls-data.
13. See Pew Research Center’s Library research and reports: http://www.pewinternet.org/topics/libraries/.
14. Miller, Carolyn, Kathryn Zickuhr, Lee Rainie and Kristen Purcell. 2013. Parents, Children, Libraries, and Reading. http://libraries.pewinternet.org/2013/05/01/parents-children-libraries-and-reading/.

RM-SP-216028 1803RM-SP-216028 1803
Visit oc.lc/awareness2018 to view the infographic, download the full data set and fi nd additional resources.