21st august 20031. 2 outline scope walk-through and billing audit detailed audit results ...
TRANSCRIPT

21st August 2003 1
Energy Efficiency in CMC Energy Efficiency in CMC Water Supply/Distribution Water Supply/Distribution
SystemSystemEM Piyasena
RA Attalage
(Sri Lanka Energy Managers Association)

21st August 2003 2
OUTLINE
ScopeWalk-through and Billing AuditDetailed AuditResultsRecommendations
21st August 2003 3
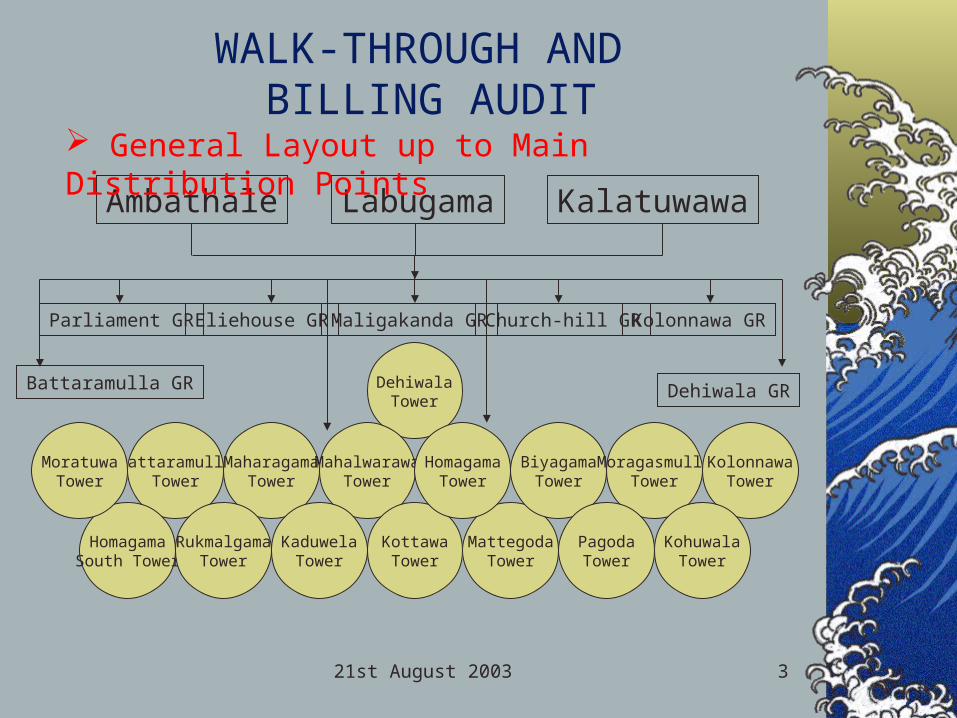
WALK-THROUGH AND BILLING AUDIT
KalatuwawaLabugamaAmbathale
Parliament GR Eliehouse GR Church-hill GRMaligakanda GR Kolonnawa GR
Battaramulla GR Dehiwala GR
BattaramullaTower
DehiwalaTower
MaharagamaTower
MahalwarawaTower
MattegodaTower
KottawaTower
KaduwelaTower
HomagamaTower
HomagamaSouth Tower
BiyagamaTower
MoragasmullaTower
KolonnawaTower
PagodaTower
MoratuwaTower
KohuwalaTower
RukmalgamaTower
General Layout up to Main Distribution Points
21st August 2003 4
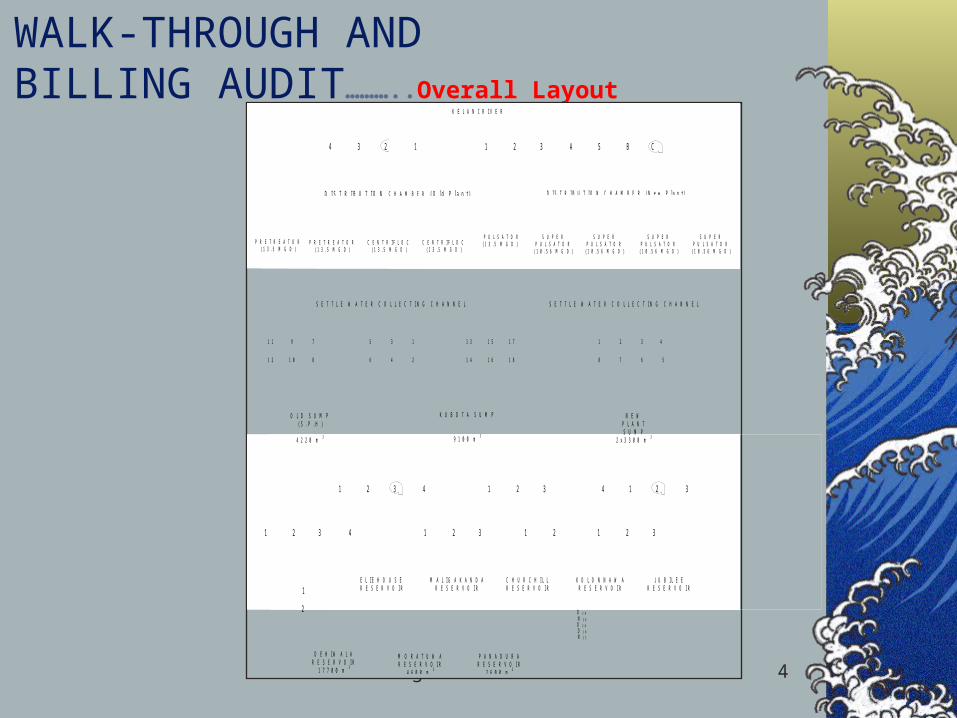
WALK-THROUGH AND BILLING AUDIT………..Overall Layout
D I S T R I B U T I O N C H A M B E R ( O l d P l a n t ) D I S T R I B U T I O N C H A M B E R ( N e w P l a n t )
P R E T R E A T O R ( 1 3 . 5 M G D )
P R E T R E A T O R ( 1 3 . 5 M G D )
C E N T R I F L O C ( 1 3 . 5 M G D )
C E N T R I F L O C ( 1 3 . 5 M G D )
P U L S A T O R ( 1 3 . 5 M G D )
S U P E R P U L S A T O R
( 1 0 . 5 6 M G D )
S U P E R P U L S A T O R
( 1 0 . 5 6 M G D )
S U P E R P U L S A T O R
( 1 0 . 5 6 M G D )
S U P E R P U L S A T O R
( 1 0 . 5 6 M G D )
S E T T L E W A T E R C O L L E C T I N G C H A N N E L S E T T L E W A T E R C O L L E C T I N G C H A N N E L
1 1 9
1 2 1 0
7
8
4
5
1 2
8 7
3
6
5 3
6 4
1
2
1 3 1 5
1 4 1 6
1 7
1 8
O L D S U M P ( S . P . H )
4 2 2 0 m 3
K U B O T A S U M P
9 1 0 0 m 3
N E W P L A N T S U M P
2 x 3 3 0 0 m 3
4 2 2 0 m 3
K E L A N I R I V E R
E L I E H O U S E R E S E R V O I R
M A L I G A K A N D A
R E S E R V O I R
C H U R C H I L L R E S E R V O I R
K O L O N N A W A
R E S E R V O I R
J U B I L E E
R E S E R V O I R
M O R A T U W A R E S E R V O I R
4 6 0 0 m 3
P A N A D U R A R E S E R V O I R
2 6 0 0 m 3
D E H I W A L A R E S E R V O I R
1 7 7 0 0 m 3
2 3 4 1 2 3 A 5 B C 1
2
2 1 3 1 4 3 2 4 1
1 2 3 4 1 3 2
3 2
1 2 1
1
2
3
O 2 0
N 3 0 O 2 0
D 2 0 N 3 5

21st August 2003 5
CMC Distribution System
Dehiwala
Maligakanda
Jubilee
Eliehouse
Total = 62.5 MGD
LABUGAMA
KALATUWAWA
AMBATELE
Greater Colombo others
Total = 67.5 MGD
15 MGD
8 MGD
107 MGD
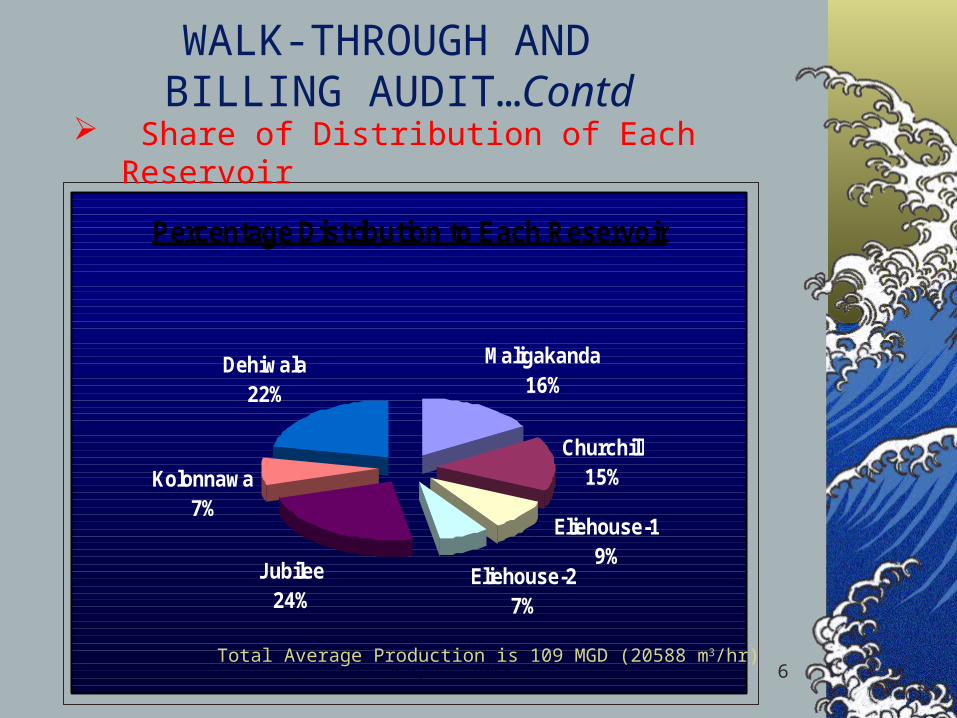
WALK-THROUGH AND BILLING AUDIT…contd
21st August 2003 6
Percentage Distribution to Each Reservoir
Jubilee24%
Kolonnawa7%
Dehiwala22%
Maligakanda16%
Churchill15%
Eliehouse-27%
Eliehouse-19%
Total Average Production is 109 MGD (20588 m3/hr)
WALK-THROUGH AND BILLING AUDIT…Contd
Share of Distribution of Each Reservoir

21st August 2003 7
Composition of Monthly Production Cost – Ambathale Treatment Plant
6%
84%
7% 2%
1%
Personal
Electricity
Chemical
Repair
Admin&Security
WALK-THROUGH AND BILLING AUDIT…Contd

21st August 2003 8
Electricity Consumption Variation
Monthly Production Vs Elec. Consumption
13.0
13.5
14.0
14.5
15.0
15.5
16.0
4.0 4.5 5.0 5.5 6.0
Elec. Consumption (GWh)
Pro
du
ctio
n (
Mill
ion
m3)
WALK-THROUGH AND BILLING AUDIT…contd

21st August 2003 9
Monthly Electricity Consumption
6.0
4.95.2
4.34.8
5.24.8
5.5
4.6 4.7 4.8
5.7
0.41 0.33 0.38 0.31 0.34 0.35 0.32 0.42 0.31 0.32 0.31 0.390.0
1.0
2.0
3.0
4.0
5.0
6.0
7.0
Jul-01 Aug-01
Sep-01
Oct-01
Nov-01
Dec-01
Jan-02
Feb-02
Mar-02
Apr-02
May-02
Jun-02
Month
Con
sum
ptio
n
(MWh) (kWh/m^3)
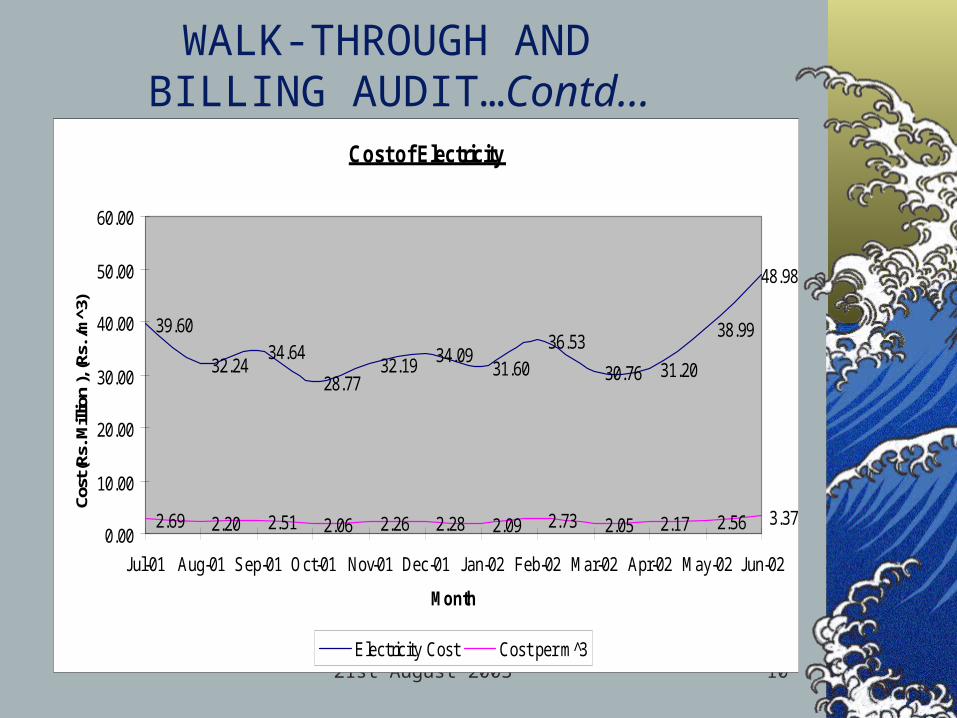
WALK-THROUGH AND BILLING AUDIT…Contd…
21st August 2003 10
Cost of Electricity
39.60
32.2434.64
28.7732.19 34.09
31.6036.53
30.76 31.20
38.99
48.98
2.69 2.20 2.51 2.06 2.26 2.28 2.09 2.73 2.05 2.17 2.56 3.370.00
10.00
20.00
30.00
40.00
50.00
60.00
Jul-01 Aug-01 Sep-01 Oct-01 Nov-01 Dec-01 Jan-02 Feb-02 Mar-02 Apr-02 May-02 Jun-02
Month
Cost
(Rs.
Mill
ion
), (R
s. /m
^3)
Electricity Cost Cost per m 3̂
WALK-THROUGH AND BILLING AUDIT…Contd…
21st August 2003 11
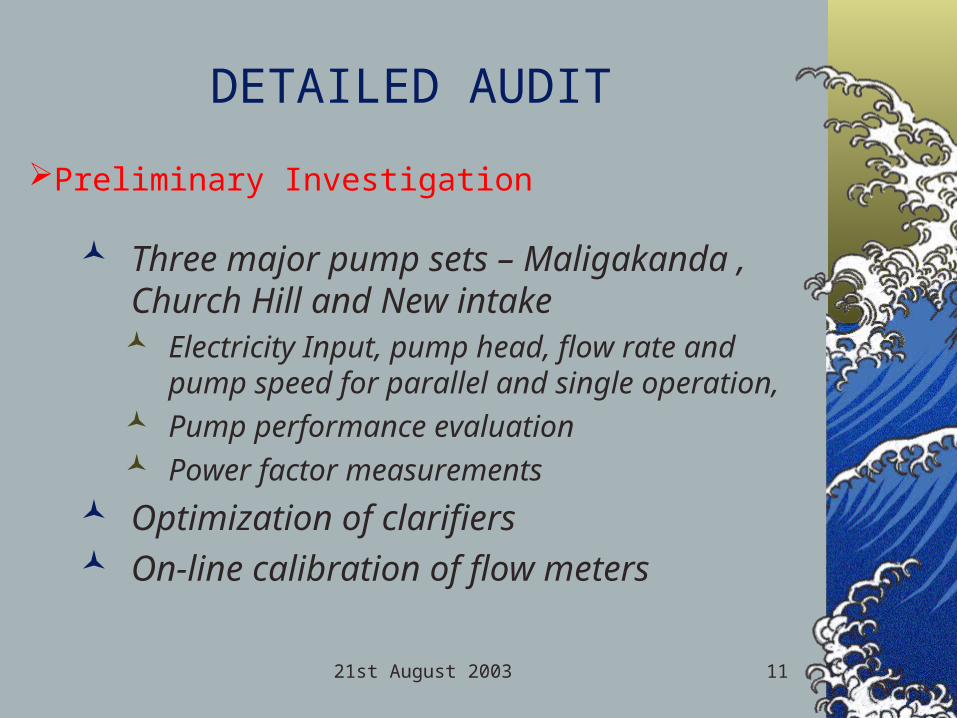
DETAILED AUDIT
Three major pump sets – Maligakanda , Church Hill and New intake Electricity Input, pump head, flow rate and
pump speed for parallel and single operation, Pump performance evaluation Power factor measurements
Optimization of clarifiers On-line calibration of flow meters
Preliminary Investigation

21st August 2003 12
Expected and Measured EfficienciesPumps which are Efficiency Expected Efficiency Measuredrunning together Acording to the Curve
New Intake to New PlantA, C, 5 Effi > 80% A = 46%
C = 39% 5 = 68%
A, 5 Effi > 85% A = 55% 5 = 63%
A, C Effi > 85% A = 57% C = 43%
New Intake to Old Plant1,3 -- 1 = 70%
3 = 68% 3 Effi > 90% 3 = 69%
Maligakanda pumps Ambathale Treatement PlantM-1, M-2 Effi > 80% M-1 = 69%
M-2 = 68% M-1 Effi > 70% M-1 = 57% M-2 Effi > 70% M-2 = 59%
Churchill pumps Ambathale Treatement PlantC-1, C-2, C-3 Effi > 75% C-1 = 69%
C-2 = 67% C-3 = 69%
C-1 Effi > 80% C-1 = 73% C-2 Effi > 80% C-2 = 75% C-3 Effi > 80% C-3 = 69%
DETAILED AUDIT…contd

21st August 2003 13
Power Factor Measurementex:New Intake to Ambathale Treatment Plant
Pump ID Voltage (V) Current (A) Power (kW) Power factor
Pump A 385.9 635.4 351.6 0.82
Pump C 385.6 672.3 371.1 0.82
Pump 1 402.0 278.9 156.0 0.80
Pump 2 406.5 334.5 187.0 0.79
Pump 3 404.2 339.8 189.6 0.79
Pump 5 401.9 274.7 158.8 0.83
DETAILED AUDIT…contd

21st August 2003 14
Low power factors at loadsOverall operating efficiencies are lower than
the expected.Large variation in energy intensities of
pumping.Water loss due to back wash, sludge drainage
& lab testing is around 7 MGD.NRW is around 50% in Colombo city
distribution system
PRELIMINARY RESULTS
RESULTS
21st August 2003 15
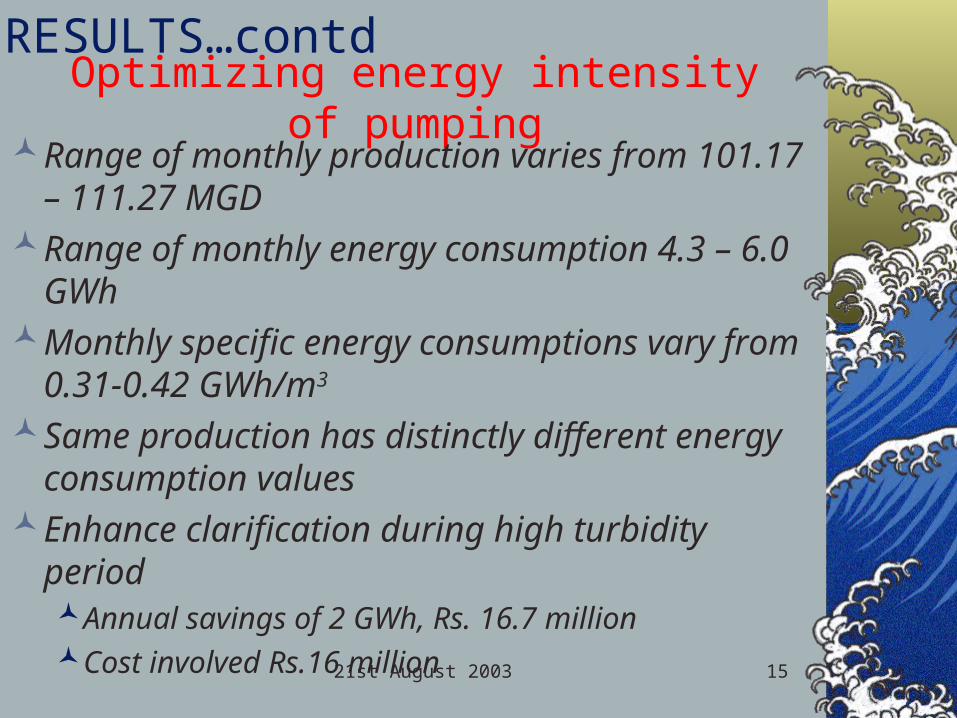
Optimizing energy intensity of pumpingRange of monthly production varies from 101.17 –
111.27 MGDRange of monthly energy consumption 4.3 – 6.0
GWhMonthly specific energy consumptions vary from
0.31-0.42 GWh/m3
Same production has distinctly different energy consumption values
Enhance clarification during high turbidity periodAnnual savings of 2 GWh, Rs. 16.7 millionCost involved Rs.16 million
RESULTS…contd

21st August 2003 16
Power Factor improvement
Low Power Factors (0.79 – 0.83) were found in the new intake
Potential monthly max. demand reduction by improving power factor to 0.95 is 1.52 MVA
Total monthly savings is Rs.0.6 millionSimple payback is 2.4 months
RESULTS…contd

21st August 2003 17
Improving overall efficiency of pumping units.
Measured operating overall efficiencies of all the pumps (ranging 40% to 75%)
Improving overall efficienciesChurch-hill
Annual savings of 0.94GWh, Rs.7.5 million Simple payback for impeller sizing, 08 monthsSimple payback for pump replacement, 07years
RESULTS…contd

21st August 2003 18
Improving overall efficiency of pumping units.
Improving overall efficienciesMaligakanda
Annual savings of 0.90 GWh, Rs.7.2 million Simple payback for impeller sizing, 06 monthsSimple payback for pump replacement, 5.5years
Extrapolation…..Ambatale PlantAnnual savings of 6.3 GWh
(Comparison monthly mean consumption of 5 GWh)
RESULTS…contd

21st August 2003 19
On-site calibration flow meters.
Verification by on-line calibrationFirst results show that flow meter
readings overestimate by 15%Study to be continued for
confirmation.If so, estimated saving potentials will
be much higher with low NRW losses.
RESULTS…contd
21st August 2003 20
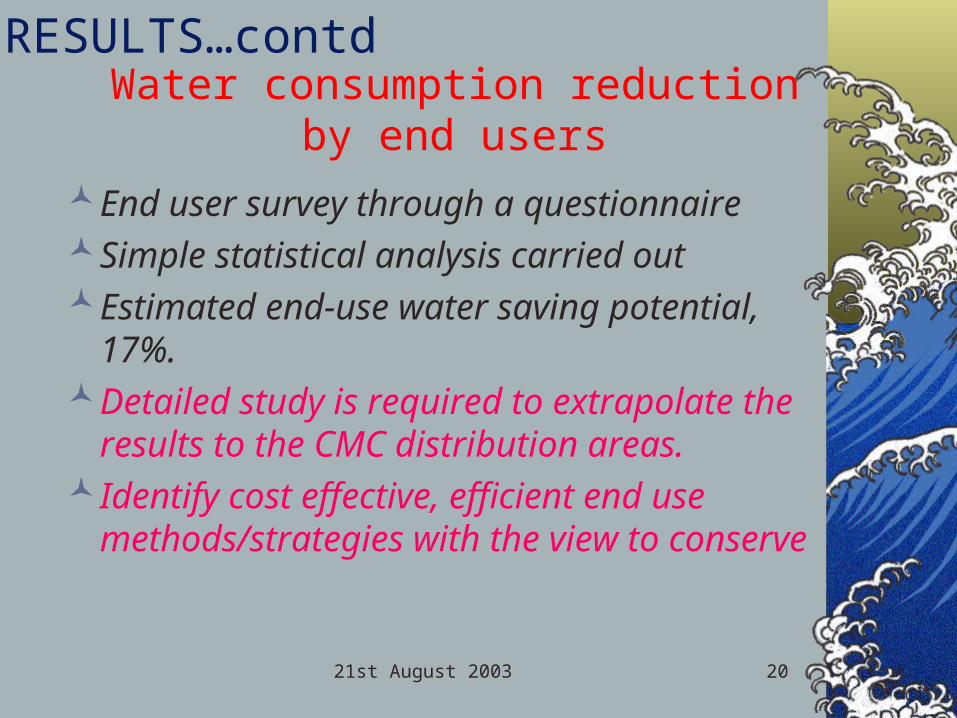
Water consumption reduction by end users
End user survey through a questionnaire Simple statistical analysis carried outEstimated end-use water saving potential,
17%.Detailed study is required to extrapolate the
results to the CMC distribution areas.Identify cost effective, efficient end use
methods/strategies with the view to conserve
RESULTS…contd

21st August 2003 21
RECOMMENDATIONS Low cost no cost options
Enhance clarification. Further investigation of the fluctuation of energy per unit product is necessary.
Continue the calibration work to confirm results.Water consumption reduction by end users.
Medium cost optionsPower factor improvementFurther investigation of NRW
High cost optionsReplacement of low efficient pumps with new pumpsIn-situ electricity generation? (study)Diesel Engine driven pumps? (study)

21st August 2003 22
Thank You
Co-operation and assistance extended by the National Water Supply and Drainage Board is
greatly acknowledged.