(21st cclc) overview of the 21st cclc annual performance
TRANSCRIPT

21st Century Community Learning Centers (21st CCLC)
Overview of the 21st CCLC Annual Performance Data:
2017-2018
U.S. Department of Education Office of Elementary and Secondary Education
21st Century Community Learning Centers

This report was prepared for the U.S. Department of Education under contract number ED-ESE-14-C-0120. The contracting officer representative is Daryn Hedlund of the Office of Elementary and Secondary Education. This report is in the public domain. Authorization to reproduce it in whole or in part is granted. While permission to reprint this publication is not necessary, the suggested citation is as follows:
U.S. Department of Education. (2019). 21st Century Community Learning Centers (21st CCLC) analytic support for evaluation and program monitoring: An overview of the 21st CCLC performance data: 2017-2018 (14th report). Washington, DC.

CONTENT
EXECUTIVE SUMMARY 1
INTRODUCTION 2
SECTION 1: GPRA RESULTS 3
A. GPRA Measures #1-3: Percentage of Participants Improving their Mathematics Grade 3
B. GPRA Measures #4-6: Percentage of Participants Improving their English Grade 4 Table 2. Regular Attendees Who Improved their English Grade 4
C. GPRA Measures #7-8: Percentage of Participants Improving on Reading and Mathematics State Assessments 5 Table 3. Regular Attendees Improving their Performance on Reading or Mathematics State Assessments 5
D. GPRA Measures #9-11: Percentage of Participants Improving on Homework Completion and Class Participation 6
Table 4. Percentage of Regular Attendees Who Improved their Homework Completion and Class Participation 7
E. GPRA Measures #12-14: Percentage of Participants Demonstrating Improvement in Student Behavior 8 Table 5. Percentage of Regular Attendees Who Improved Student Behavior 8
SECTION 2: GRANTEE AND CENTER CHARACTERISTICS 9
A. Center Type 9 Table 6. Grantees’ Centers Broken Down by Organization Type 9
B. People Served 10 Table 7. Attendees Served based on Type 10 Table 8. Total Attendees by Center Type 10 Table 9. Regular Attendees by Center Type 10
C. Activity Participation 11 Table 10. Times per Week/Month of Each Activity Offered 11 Table 11. Frequency of Each Activity Offered 11 Table 12. Times per Week/Month of Each Academic Activity Offered 12 Table 13. Frequency of Each Academic Activity Offered 12
D. Staffing Type 12 Table 14. Staffing Type per Paid and Volunteer Staff 13
E. Attendees Served per Demographic 13 Table 15. Participant Demographics 13 Table 16. Number of Participants per Grade Level 14
CONCLUSION 14

1
EXECUTIVE SUMMARY
The 21st Century Community Learning Centers (CCLC) program provides students in high-need communities with access to high-quality afterschool programming in the 50 States, the District of Columbia, Puerto Rico, Virgin Islands and the Bureau of Indian Education. All 21st CCLC centers provide programing with academic enrichment and youth development that are designed to support participants’ academic success. For the 2017-2018 school year, the U.S. Department of Education (Department) awarded grants to State educational agencies, which in turn provided subgrants to 10,249 centers under the 21st CCLC program. In this annual performance report (APR), data from the 21APR Data Collection System were analyzed to report on the Government Performance and Results Act (GPRA) performance indicators associated with the 21st CCLC program. These metrics assist the Department in evaluating the progress of the 21st CCLC program. The APR is completed annually by grantees to summarize the operational elements of their program, the student population served, and the extent to which students improved in specific areas. 2017-2018 APR highlights:
• In 2017-2018, 2 million people were served by this program: o School year total student attendees (1,382,570), including regular1 student attendees
(752,195) o Summer attendees (293,232) o Adults and family members (348,565)
• Overall, there was a fairly even split between males (48.7 percent, or 673,007) and females (48.8 percent, or 674,805).
• The majority of the attendees were identified as Hispanic (34.2 percent or 472,773), followed by White (29.5 percent, or 407,937) and Black (21.0 percent, or 290,195).
• 49.7 percent improved their mathematics grade. • 48.8 percent improved their English grade. • 25.5 percent improved scores on the State assessments in elementary reading and 18.6 percent
reported improved scores in middle or high school mathematics. • 69.3 percent of teachers reported improved rates of homework completion and class
participation among participating students. • 62.4 percent of teachers reported improved student behavior among participating students.
The performance data indicate that this broad-ranging program touches students’ lives in ways that will have far-reaching, positive impact.
1 Regular is defined as attendance for more than 30 days during the academic year. See Table 8 for more information.

2
INTRODUCTION Originally created in 1994 through the reauthorization of the Elementary and Secondary Education Act (ESEA) and expanded through Congress’s approval of No Child Left Behind (NCLB) in 2001, the 21st Century Community Learning Centers (CCLC) program was reauthorized in 2015 as part of the Every Student Succeeds Act (ESSA). It provides students in high-need, high-poverty communities the opportunity to participate in afterschool programming. Present in all 50 States, the District of Columbia, Puerto Rico, Virgin Islands and the Bureau of Indian Education programming, academic enrichment and youth development programs are designed to enhance participants’ well-being and academic success. For the 2017-2018 academic school year, the U.S. Department of Education (Department) awarded grants to State educational agencies, which in turn provided subgrants to10,249 centers. In this annual performance report (APR), data from the 21APR Data Collection System were analyzed to report on the Government Performance and Results Act (GPRA) indicators associated with the 21st CCLC program. These metrics, which are described in section 1, are an important way that the Department evaluates the success and progress of the 21st CCLC program. The APR is completed annually by grantees to summarize the operational elements of their programs, the student population served, and the extent to which students improved in academic-related behaviors and achievement. This year, the data show that most funded centers were classified as school districts, followed by community-based organizations. In the past year, the 21st CCLC program served more than 2 million people and employed 108,509 paid staff and 33,622 volunteer staff. Most of the paid staff were school day teachers and most of the volunteers were community members and college students. In the following report, the methodological approach taken to data analysis is highlighted before turning to the results of the data. The report concludes with a demographic analysis of students and staff to provide context and a holistic picture of the 21st CCLC program. Methodology Data were entered at the State level into the 21APR Data Collection system during a collection period throughout the year. State definitions of elementary and middle may differ slightly. 21APR collects the number of participants by grade level, then aggregates the demographic and performance data into two categories as listed in the GPRA: elementary and middle/high. In 21APR, elementary includes PreK – 5th grades and middle/high includes 6th through 12th grades. States report the total number days attended by participants per grade level. Attendance is differentiate between “regular” and “non-regular”. For the purposes of reporting on the GPRA, “regular” is define as attending 30 days or more throughout the academic year. Performance on the GPRA are not collected for non-regular, or those who attend less than 30 days during the academic year. Some data definitions are determined by the States themselves. For instance, on GPRA indicators where “needs to improve” is measured, States define and communicate to their Grantees what “needs to improve” means An aggregate statistic for each of the items analyzed is provided. States were not required to submit on every indicator (State assessment, teacher-reported or grades) and they had discretion to select from among the indicators. As a result, descriptive statistics throughout the report are calculated on the States that provided data on the given measure. For example, if only 46 States out of the total 50 provided data on student grades, then the percentages are only based on the data obtained from those 46. Incorporating missing data from the other four would skew the findings and thus cause them to be inaccurate. This method of only using reported data preserves the statistical integrity of the reported results. This is a change from previous reporting of the 21st CCLC APR, but it provides a more accurate representation of

3
performance against the GPRA measure on a national level. Finally, it is important to note that each States, territory or the Bureau of Indian Education is the authoritative source of their data; the APR reports on the data provided. The data were certified by the State educational agency (SEA) for the 21st CCLC program in each State.
SECTION 1: GPRA RESULTS The GPRA indicators are a key method by which the Department measures the effectiveness and efficiency of the program based on the following two overall goals:
1. Participants in the 21st CCLC programs will demonstrate educational and social benefits and exhibit positive behavioral changes.
2. 21st CCLC will develop afterschool activities and educational opportunities that consider the best practices identified through research findings and other data that lead to high-quality enrichment opportunities that positively affect student outcomes.
To support these overall goals, a series of measures have been established for the 21st CCLC program. It is important to note that not all States report data for each GPRA. States are afforded the choice to report performance culled from grades, State assessments, and/or teacher-reported student behavior. Each State had to report on at least one of the sets of measures – grades, State assessments, or teacher-reported student behavior. Some States chose to report on more than one of the sets of measures. For each measure, the analysis below is based only on the States who elected to provide data for that measure; if a States does not report on a particular GPRA measure, they are not listed in association with that measure. In addition, the GPRA measures ask States to report only on regular participants (30 days or more of participation). This provides a narrower slice of 21st CCLC participants for the GPRA analysis than if all participating students’ data were used in the calculations. Data for each GPRA are provided at the end of the academic school year and presented in tabular and summary form below (Section A-E). Any methodological considerations are noted following each GPRA table. A summary of the findings for each GPRA is presented in Table 6. A. GPRA Measures #1-3: Percentage of Participants Improving their Mathematics Grade
• States are asked to report on participants who needed to improve; some students may have participated but were not in need of grade improvement. Each state may set the scale or definition for improvement.
• 22 out of 54 States reported on these measures. • Overall, States reported 51.3 percent improved mathematics grades in elementary grades, 46.5
percent in middle and high school, and 49.7 percent for all students.
Table 1. Regular Attendees Who Improved their Mathematics Grade
State/Territory Mathematics Elementary
Mathematics Middle/High School
Mathematics All Students
1. Arizona 65.6 55.9 62.5 2. Delaware 78.8 60.7 71.9 3. District of Columbia 57.2 49.4 56.4

4
State/Territory Mathematics Elementary
Mathematics Middle/High School
Mathematics All Students
4. Florida 61.2 55.4 59.2 5. Georgia 43.4 43.7 43.5 6. Iowa 44.9 45.7 45.1 7. Kansas 51.4 59.8 53.3 8. Kentucky 56.2 51.6 54.6 9. Louisiana 80.9 88.0 82.8 10. Maryland 66.1 53.3 62.0 11. Michigan 60.4 43.2 53.4 12. Mississippi 74.8 70.2 72.9 13. Missouri 34.7 52.8 38.3 14. Nevada 29.1 29.5 29.2 15. Pennsylvania 45.9 42.0 44.1 16. Puerto Rico 69.8 64.4 67.8 17. South Carolina 80.5 83.2 81.4 18. Tennessee 56.0 57.0 56.3 19. Texas 27.0 26.9 27.0 20. Virgin Islands 84.3 60.8 71.3 21. Virginia 64.4 54.2 59.7 22. Wyoming 86.9 79.6 86.1 Overall 51.3 46.5 49.7
Note: States elect to report on one, two, or three of the GPRA measures. Raw scores were used to calculate overall percentage improvement. When calculating the percentage improvement “overall,” the total amount of regular attendees with reported APR results were used in the calculations across all States/territories who reported on this measure.
B. GPRA Measures #4-6: Percentage of Participants Improving their English Grade
• States are asked to report on participants who needed to improve; some students may have participated but were not in need of grade improvement.
• 22 States reported on these measures. • Overall, States reported 50.1 percent of students improved English grades in elementary, 46.2
percent in middle or high school, and 48.8 percent for all students.
Table 2. Regular Attendees Who Improved their English Grade
State/Territory English Elementary
English Middle/High School
English All Students
1. Arizona 65.5 55.9 62.6 2. Delaware 80.4 70.0 76.9 3. District of Columbia 59.8 52.6 58.9 4. Florida 57.7 57.5 57.7 5. Georgia 42.3 44.0 42.9 6. Iowa 51.7 59.6 53.4 7. Kansas 57.2 43.5 53.9

5
State/Territory English Elementary
English Middle/High School
English All Students
8. Kentucky 55.5 50.5 53.9 9. Louisiana 82.9 88.8 84.4 10. Maryland 60.6 55.9 59.2 11. Michigan 56.7 45.8 52.5 12. Mississippi 70.5 67.9 69.5 13. Missouri 33.0 55.2 37.4 14. Nevada 27.9 29.3 28.1 15. Pennsylvania 45.2 41.1 43.3 16. Puerto Rico 68.5 66.1 67.8 17. South Carolina 75.0 83.8 78.2 18. Tennessee 53.9 54.1 54.0 19. Texas 25.2 25.8 25.5 20. Virgin Islands 78.6 60.3 67.0 21. Virginia 64.5 54.7 60.2 22. Wyoming 88.0 81.2 87.2 Overall 50.1 46.2 48.8
Note: States elect to report on one, two, or three of the GPRA measures. Raw scores were used to calculate overall percentage improvement. When calculating the percentage improvement “overall,” the total amount of regular attendees with reported APR results were used in the calculations across all States/territories.
C. GPRA Measures #7-8: Percentage of Participants Improving on Reading and Mathematics State
Assessments
• States are asked to report on participants who needed to improve their State assessment scores; some students may have participated but who were not identified as in need of improving their State assessment score.
• 25 States reported on this measure – improving from not proficient to proficient or above on the reading/language arts State assessment.
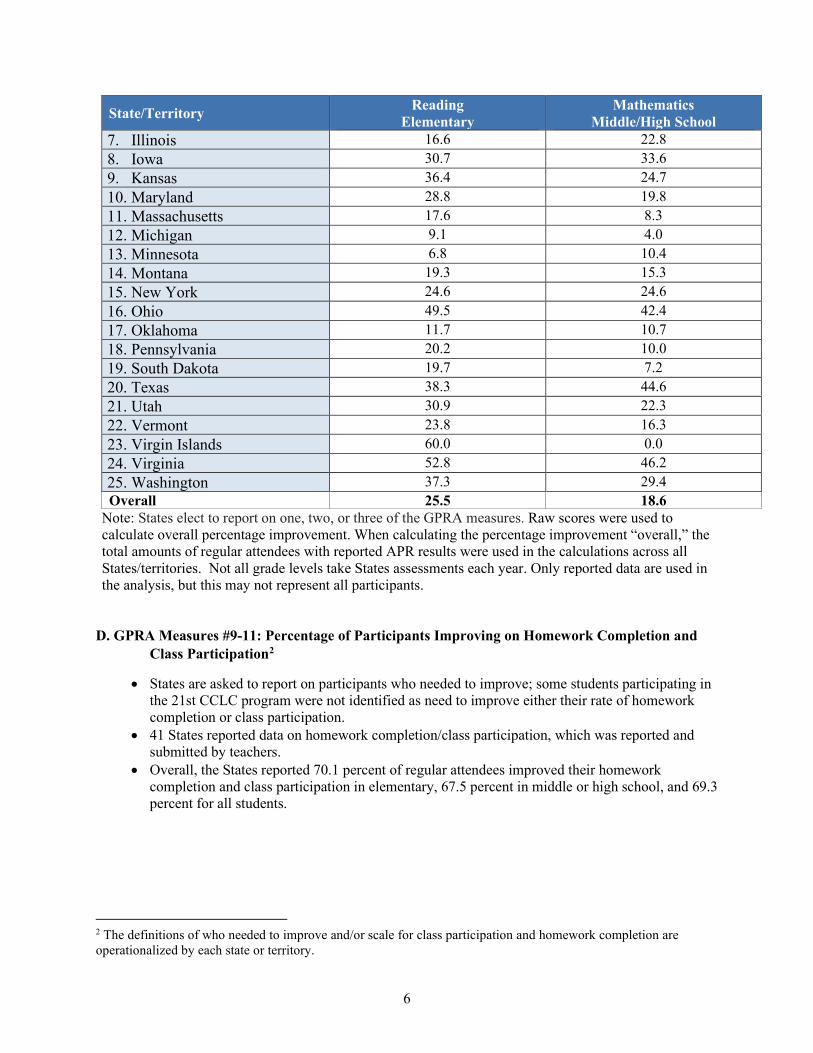
• Overall, the States reported that 25.5 percent of students improved their reading/language arts State assessment score in elementary and 18.6 percent on middle or high school mathematics assessment.
Table 3. Regular Attendees Improving their Performance on Reading or Mathematics State Assessments
State/Territory Reading Elementary
Mathematics Middle/High School
1. Arkansas 12.9 11.9 2. Alaska 6.7 3.9 3. California 9.3 10.2 4. District of Columbia 17.2 20.0 5. Georgia 27.7 27.3 6. Idaho 33.6 11.4
6
State/Territory Reading Elementary
Mathematics Middle/High School
7. Illinois 16.6 22.8 8. Iowa 30.7 33.6 9. Kansas 36.4 24.7 10. Maryland 28.8 19.8 11. Massachusetts 17.6 8.3 12. Michigan 9.1 4.0 13. Minnesota 6.8 10.4 14. Montana 19.3 15.3 15. New York 24.6 24.6 16. Ohio 49.5 42.4 17. Oklahoma 11.7 10.7 18. Pennsylvania 20.2 10.0 19. South Dakota 19.7 7.2 20. Texas 38.3 44.6 21. Utah 30.9 22.3 22. Vermont 23.8 16.3 23. Virgin Islands 60.0 0.0 24. Virginia 52.8 46.2 25. Washington 37.3 29.4 Overall 25.5 18.6
Note: States elect to report on one, two, or three of the GPRA measures. Raw scores were used to calculate overall percentage improvement. When calculating the percentage improvement “overall,” the total amounts of regular attendees with reported APR results were used in the calculations across all States/territories. Not all grade levels take States assessments each year. Only reported data are used in the analysis, but this may not represent all participants.
D. GPRA Measures #9-11: Percentage of Participants Improving on Homework Completion and
Class Participation2
• States are asked to report on participants who needed to improve; some students participating in the 21st CCLC program were not identified as need to improve either their rate of homework completion or class participation.
• 41 States reported data on homework completion/class participation, which was reported and submitted by teachers.
• Overall, the States reported 70.1 percent of regular attendees improved their homework completion and class participation in elementary, 67.5 percent in middle or high school, and 69.3 percent for all students.
2 The definitions of who needed to improve and/or scale for class participation and homework completion are operationalized by each state or territory.

7
Table 4. Percentage of Regular Attendees Who Improved their Homework Completion and Class Participation
State/Territory HW/CP Elementary
HW/CP Middle/High School
HW/CP All Students
1. Alabama 93.2 86.3 91.7 2. Alaska 54.8 56.1 55.1 3. Arizona 76.3 70.4 74.4 4. Bureau of Indian Affairs 63.1 78.6 70.0 5. Colorado 69.2 53.0 62.7 6. Connecticut 41.0 43.5 41.9 7. Delaware 72.2 69.4 71.2 8. District of Columbia 47.9 45.9 47.5 9. Florida 84.7 82.7 84.0 10. Georgia 75.5 76.6 75.9 11. Hawaii 84.3 82.3 83.3 12. Illinois 68.2 70.2 69.1 13. Indiana 82.5 79.7 81.8 14. Iowa 75.1 56.8 70.7 15. Kansas 63.4 70.6 64.6 16. Kentucky 62.6 62.5 62.6 17. Louisiana 80.5 86.6 82.0 18. Maine 33.4 39.5 35.3 19. Maryland 73.8 92.3 77.5 20. Michigan 59.5 54.7 57.9 21. Mississippi 80.3 73.1 78.0 22. Montana 63.7 70.9 64.6 23. Nebraska 64.5 67.1 65.1 24. Nevada 72.3 66.5 71.4 25. New Hampshire 29.2 29.9 29.3 26. New Jersey 57.0 59.1 58.0 27. New Mexico 86.1 91.1 87.1 28. North Carolina 84.2 86.1 84.7 29. North Dakota 87.3 88.0 87.4 30. Oregon 74.4 72.1 73.3 31. Pennsylvania 51.4 50.2 50.9 32. Puerto Rico 87.8 77.2 84.6 33. Rhode Island 30.9 37.0 33.0 34. South Carolina 62.9 65.0 63.3 35. Tennessee 66.5 64.6 65.9 36. Utah 78.1 76.5 77.7 37. Virgin Islands 78.8 98.1 90.7 38. Virginia 79.1 71.4 75.9 39. West Virginia 92.2 95.2 92.9 40. Wisconsin 60.3 54.4 58.9 41. Wyoming 57.2 61.1 57.7

8
State/Territory HW/CP Elementary
HW/CP Middle/High School
HW/CP All Students
Overall 70.1 67.5 69.3 Note: States elect to report on one, two, or three of the GPRA measures. Raw scores were used to calculate overall percentage improvement. When calculating the percentage improvement “overall,” the total amounts of regular attendees with reported APR results were used in the calculations across all States/territories/bureau.
E. GPRA Measures #12-14: Percentage of Participants Demonstrating Improvement in Student
Behavior
• States are asked to report on participants who needed to improve3; some students participating in the 21st CCLC program were not identified as needing to improve their behavior.
• 41 States reported data on student behavior, as reported by a survey administered to teachers. • Overall, the States reported that 63.1 percent of regular attendees demonstrated improved
student behavior in elementary, 60.7 percent in middle or high school, and 62.4 percent for all students.
Table 5. Percentage of Regular Attendees Who Improved Student Behavior
State/Territory Student Behavior Elementary
Student Behavior Middle/High School
Student Behavior All Students
1. Alabama 94.5 89.9 93.5 2. Alaska 55.4 55.0 55.3 3. Arizona 72.6 67.9 71.1 4. Bureau of Indian Affairs 58.8 69.6 63.6 5. Colorado 44.9 37.1 41.7 6. Connecticut 43.6 41.5 42.9 7. Delaware 67.8 64.2 66.5 8. District of Columbia 35.1 40.6 36.2 9. Florida 75.9 77.7 76.5 10. Georgia 47.5 49.8 48.2 11. Hawaii 81.5 78.4 80.1 12. Illinois 57.7 62.5 59.8 13. Indiana 85.0 83.9 84.7 14. Iowa 71.6 54.2 67.4 15. Kansas 51.7 53.8 52.0 16. Kentucky 42.1 38.5 40.8 17. Louisiana 82.3 84.6 82.9 18. Maine 40.4 40.4 40.4 19. Maryland 60.7 86.9 65.9 20. Michigan 57.3 52.0 55.5 21. Mississippi 63.1 55.4 60.7 22. Montana 62.7 68.9 63.4
3 The definitions of who needed to improve is operationalized by each state or territory.

9
State/Territory Student Behavior Elementary
Student Behavior Middle/High School
Student Behavior All Students
23. Nebraska 64.5 58.0 59.7 24. Nevada 40.9 34.7 40.0 25. New Hampshire 31.5 23.4 29.4 26. New Jersey 50.3 51.0 50.6 27. New Mexico 90.3 92.9 90.8 28. North Carolina 67.6 74.9 69.4 29. North Dakota 73.4 81.8 74.2 30. Oregon 69.8 62.8 66.9 31. Pennsylvania 41.5 40.0 40.8 32. Puerto Rico 84.4 75.2 81.6 33. Rhode Island 30.3 34.9 31.9 34. South Carolina 79.9 80.9 80.1 35. Tennessee 61.2 60.1 60.8 36. Utah 67.1 64.1 66.4 37. Virgin Islands 72.7 0.0 27.9 38. Virginia 67.3 68.6 67.8 39. West Virginia 91.3 95.3 92.3 40. Wisconsin 62.4 61.1 62.1 41. Wyoming 53.5 52.1 53.4 Overall 63.1 60.7 62.4
Note: States elect to report on one, two, or three of the GPRA measures. Raw scores were used to calculate overall percentage improvement. When calculating the percentage improvement “overall,” the total amounts of regular attendees with reported APR results were used in the calculations across all States/territories/bureau.
SECTION 2: GRANTEE AND CENTER CHARACTERISTICS
A. Center Type
Table 6 displays the results of the types of centers for all 54 States/territories/bureaus. Of the 10,249 centers, 82.1 percent were classified as school districts (8,417) and 9.9 percent as community-based organizations (1,012).
Table 6. Grantees’ Centers Broken Down by Organization Type
Center Type Number Percentage Charter School 462 4.5 College/University 31 0.3 Community Based Organization 1,012 9.9 Faith Based Organization 122 1.2 Public School Districts 8,417 82.1 Other 205 2.0 Total 10,249 100.0
10
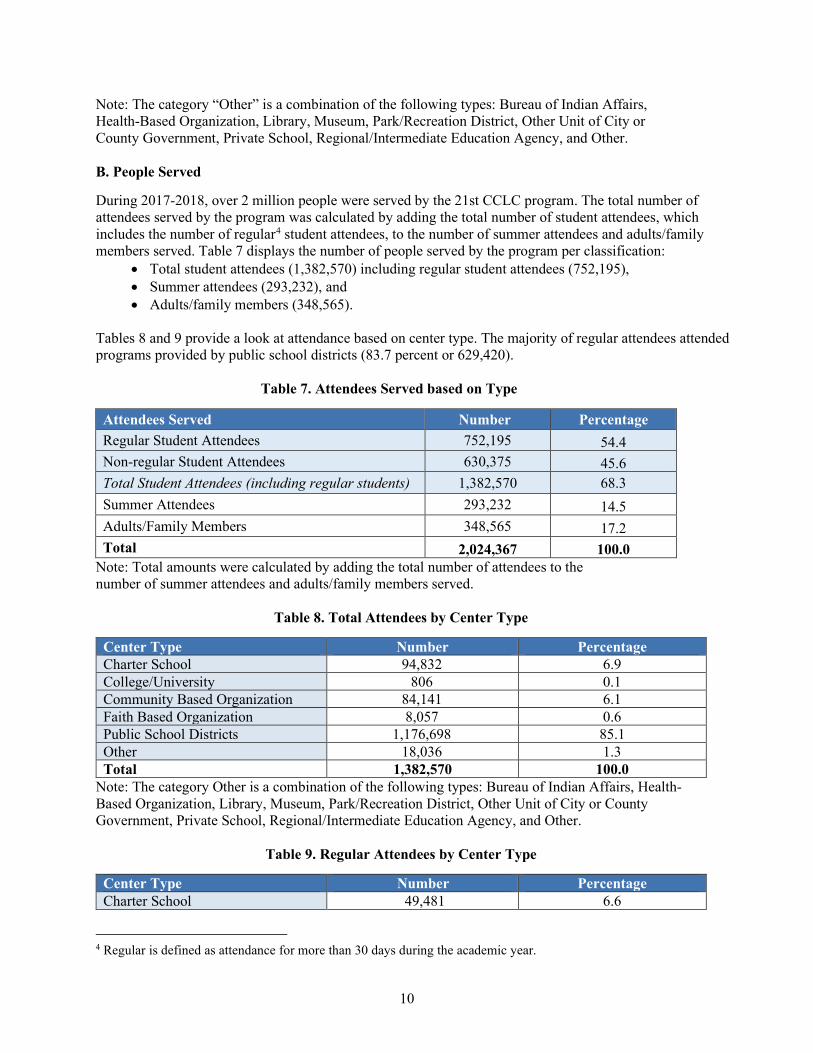
Note: The category “Other” is a combination of the following types: Bureau of Indian Affairs, Health-Based Organization, Library, Museum, Park/Recreation District, Other Unit of City or County Government, Private School, Regional/Intermediate Education Agency, and Other. B. People Served
During 2017-2018, over 2 million people were served by the 21st CCLC program. The total number of attendees served by the program was calculated by adding the total number of student attendees, which includes the number of regular4 student attendees, to the number of summer attendees and adults/family members served. Table 7 displays the number of people served by the program per classification:
• Total student attendees (1,382,570) including regular student attendees (752,195), • Summer attendees (293,232), and • Adults/family members (348,565).
Tables 8 and 9 provide a look at attendance based on center type. The majority of regular attendees attended programs provided by public school districts (83.7 percent or 629,420).
Table 7. Attendees Served based on Type
Attendees Served Number Percentage Regular Student Attendees 752,195 54.4 Non-regular Student Attendees 630,375 45.6 Total Student Attendees (including regular students) 1,382,570 68.3 Summer Attendees 293,232 14.5 Adults/Family Members 348,565 17.2 Total 2,024,367 100.0
Note: Total amounts were calculated by adding the total number of attendees to the number of summer attendees and adults/family members served.
Table 8. Total Attendees by Center Type
Center Type Number Percentage Charter School 94,832 6.9 College/University 806 0.1 Community Based Organization 84,141 6.1 Faith Based Organization 8,057 0.6 Public School Districts 1,176,698 85.1 Other 18,036 1.3 Total 1,382,570 100.0
Note: The category Other is a combination of the following types: Bureau of Indian Affairs, Health-Based Organization, Library, Museum, Park/Recreation District, Other Unit of City or County Government, Private School, Regional/Intermediate Education Agency, and Other.
Table 9. Regular Attendees by Center Type
Center Type Number Percentage Charter School 49,481 6.6
4 Regular is defined as attendance for more than 30 days during the academic year.

11
Center Type Number Percentage College/University 420 0.1 Community Based Organization 54,584 7.3 Faith Based Organization 6,644 0.9 Public School Districts 629,420 83.7 Other 11,646 1.5 Total 752,195 100.0
Note: The category Other is a combination of the following types: Bureau of Indian Affairs, Health-Based Organization, Library, Museum, Park/Recreation District, Other Unit of City or County Government, Private School, Regional/Intermediate Education Agency, and Other. C. Activity Participation
Program sites offer various types of activities throughout the academic school year. The activities held most frequently were focused on homework assistance (43,253 times/week), physical activity (41,565 times/week), literacy (32,562 times/week), and STEM (34,102 times/week). The majority of activities were offered from less than 1-hour to 1-2 hours per week with the exception of arts and music, community/service learning, physical activity, literacy, college and career readiness, homework help, and STEM activities, which were offered anywhere from less than 1-hour to 2-4 hours per week. Tables 10-13, below, provide the participation frequency and amount for the most common activities identified by grantees, within the categories provided in the 21APR system. It does not include all possible activities that may be offered by a center.
Table 10. Times per Week/Month of Each Activity Offered5
Activity
Times per Week
Times per Month
Community/Service Learning 5,807 5,544 Counseling Programs 3,828 3,221 Drug Prevention 1,785 2,400 College and Career Readiness 8,023 3,668 Homework Help 43,253 1,127 Mentoring 8,244 4,368 Physical Activity 41,565 4,394 Tutoring 25,192 2,218 Youth Leadership 10,918 6,737
Table 11. Frequency of Each Activity Offered
Activity
Less than
1 Hour
1-2 Hours
2-4 Hours
More than
4 Hours
Community/Service Learning 1,052 3,585 1,317 236 Counseling Programs 1,135 1,528 240 33 Drug Prevention 930 1,759 243 61
5 Previously, activities were reported in hours. This aligns with the data collection in the new system but may make comparisons with older reports more challenging.

12
Activity
Less than
1 Hour
1-2 Hours
2-4 Hours
More than
4 Hours
College and Career Readiness 679 2,636 859 175 Homework Help 4,617 4,968 962 117 Mentoring 1,212 2,362 604 92 Physical Activity 4,193 6,018 1,344 190 Tutoring 2,246 4,039 891 103 Youth Leadership 1,744 3,681 884 127
Table 12. Times per Week/Month of Each Academic Activity Offered
Academic Activity
Times per Week
Times per Month
Arts and Music 25,658 8,826 Entrepreneurship 2,903 2,601 Literacy 32,562 3,880 English Language Learners’ Support 7,252 1,550 STEM 34,102 6,133 Truancy Prevention 1,882 1,127 Violence Prevention 2,362 2,455
Table 13. Frequency of Each Academic Activity Offered
Academic Activity
Less than
1 Hour
1-2 Hours
2-4 Hours
More than 4
Hours
Arts and Music 2,618 6,636 1,249 183 Entrepreneurship 454 1,745 442 59 Literacy 2,636 6,175 1,159 167 English Language Learners’ Support 771 1,437 421 45
STEM 2,343 7,635 1,516 306 Truancy Prevention 656 680 171 37 Violence Prevention 918 1,630 212 51
D. Staffing Type
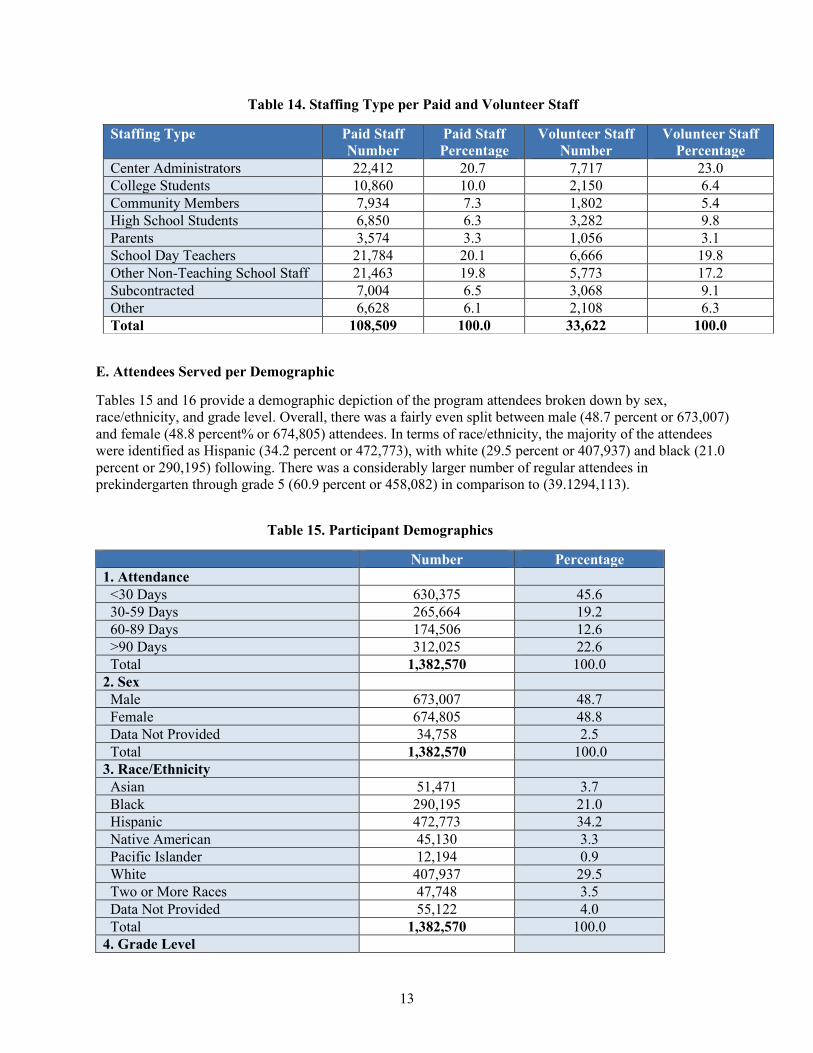
Participating centers employed paid and volunteer staff to assist with programming. There were a reported 108,509 paid staff and 33,622 volunteer staff. Table 14 provides the amount of paid and volunteer staff broken down by type for all 54 States/territories. Among the paid staff, the majority were center administrators (20.7%, n = 22,412) followed by school day teachers (20.1%, n = 21,784). Center administrators also served as the majority of volunteers (23.0%, n = 7,717) used by the centers followed by school day teachers (19.8%, n = 6,666).
13
Table 14. Staffing Type per Paid and Volunteer Staff
Staffing Type Paid Staff Number
Paid Staff Percentage
Volunteer Staff Number
Volunteer Staff Percentage
Center Administrators 22,412 20.7 7,717 23.0 College Students 10,860 10.0 2,150 6.4 Community Members 7,934 7.3 1,802 5.4 High School Students 6,850 6.3 3,282 9.8 Parents 3,574 3.3 1,056 3.1 School Day Teachers 21,784 20.1 6,666 19.8 Other Non-Teaching School Staff 21,463 19.8 5,773 17.2 Subcontracted 7,004 6.5 3,068 9.1 Other 6,628 6.1 2,108 6.3 Total 108,509 100.0 33,622 100.0
E. Attendees Served per Demographic
Tables 15 and 16 provide a demographic depiction of the program attendees broken down by sex, race/ethnicity, and grade level. Overall, there was a fairly even split between male (48.7 percent or 673,007) and female (48.8 percent% or 674,805) attendees. In terms of race/ethnicity, the majority of the attendees were identified as Hispanic (34.2 percent or 472,773), with white (29.5 percent or 407,937) and black (21.0 percent or 290,195) following. There was a considerably larger number of regular attendees in prekindergarten through grade 5 (60.9 percent or 458,082) in comparison to (39.1294,113).
Table 15. Participant Demographics
Number Percentage 1. Attendance <30 Days 630,375 45.6 30-59 Days 265,664 19.2 60-89 Days 174,506 12.6 >90 Days 312,025 22.6 Total 1,382,570 100.0 2. Sex Male 673,007 48.7 Female 674,805 48.8 Data Not Provided 34,758 2.5 Total 1,382,570 100.0 3. Race/Ethnicity Asian 51,471 3.7 Black 290,195 21.0 Hispanic 472,773 34.2 Native American 45,130 3.3 Pacific Islander 12,194 0.9 White 407,937 29.5 Two or More Races 47,748 3.5 Data Not Provided 55,122 4.0 Total 1,382,570 100.0 4. Grade Level

14
Number Percentage Pre-K – 5th 632,999 45.8 6th – 12th 749,571 54.2 Total 1,382,570 100.0 5. English Language Learners* 195,742 14.2 6. Free and Reduced Lunch* 966,482 69.9 7. Special Needs*6 146,930 10.6
*Percentages were calculated using the total number of attendees.
Table 16. Number of Participants per Grade Level
Grade Level Total Student Attendees
Number
Total Student Attendees
Percentage
Total Regular Student Attendees
Number
Total Regular Student Attendees
Percentage Pre-K – 5th 632,999 45.8 458,082 60.9 6th – 12th 749,571 54.2 294,113 39.1 Total 1,382,570 100.0 752,195 100.0
CONCLUSION
For the 2017-2018 academic school year, 10,249 centers received Federal funding to implement the 21st CCLC program. The majority of these were classified as school districts followed by community-based organizations. During 2017-2018, this program served over 2 million student and family member participants and employed 108,509 paid staff and 33,622 volunteer staff. The majority of the paid staff was school day teachers and most of the volunteers were reported to be community members and college students. The purpose of the 21st CCLC program is to: 1) provide opportunities for academic enrichment; 2) offer students a broad array of additional services, programs, and activities; and 3) offer families of students served by community learning centers opportunities for active and meaningful engagement in their child’s education. Over the past year this program has resulted in over 2 million low-income students and family members having a safe place to receive academic enrichment. The students who participate in the 21st CCLC program are among the most at risk. The performance on the GPRA measures indicate that many participants are showing improved behavior and homework completion, student grades, and mathematics or reading/language arts assessment results.
6 Special Needs is defined as a participant who has a current IEP (Individualized Education Program) or 504 Plan (Section 504 of the Rehabilitation Act of 1973).