2/21/2008 the effects of e20 on plastic automotive fuel...
TRANSCRIPT
2/21/2008
1
The Effects of E20 on Plastic Automotive Fuel System Components
Bruce Jones, Gary Mead and Paul Steevens Minnesota Center for Automotive Research
at Minnesota State University, Mankato
ABSTRACT
The focus of this study was to compare the effects of E20 versus E10 and gasoline on plastic materials found in automotive and small engine fuel system components. Plastic samples were prepared using SAE and ASTM standards and exposed to blends of ASTM Fuel C; 90% Fuel C and 10% aggressive ethanol (E10); and 80% Fuel C with 20% aggressive ethanol (E20) at an elevated temperature of 55 °C for 3024 hours. The fuel was changed in weekly intervals for the 18-week study.
INTRODUCTION
Minnesota Governor Tim Pawlenty signed a bill on May 10, 2005 that requires by volume 20% of the fuel sold in Minnesota to be ethanol. Currently, gasoline sold in Minnesota contains 10% ethanol (E10) by volume. Ethanol, C2H5OH, is an alcohol that can be derived from starches such as corn or materials containing sugars such as sugar cane. Ethanol can also be made from cellulosic materials such as grasses by converting them into sugars. However, this process is much more cost intensive and has not yet reached commercial production levels. Ethanol is considered a renewable fuel and is also classified as an alternative fuel since it can be used as a substitute for gasoline.
The passage of the law is only the first step. The fuel may not be used on public roadways until a federal section 211f waiver is obtained from the United States Environmental Protection Agency (EPA). Extensive testing in five areas: vehicle driveability, vehicle emission control system effectiveness and durability, vehicle tailpipe and evaporative emissions, fuel system material compatibility, and public health must be conducted in order to obtain the waiver (C. Jewitt, personal communication, July 6, 2005). This will be a costly and timely process requiring many different studies.
This paper represents one in a series of four papers that focus on the effects of 20% ethanol-blended fuel (E20) on fuel system components. This paper provides some of the background information on E20 and the various laws that affect its use as an on-road fuel. Next, it contains a brief review of literature on E20 with a particular focus on material compatibility issues. Finally,
it investigates the issues of designing the material compatibility study in terms of standards, procedures, and equipment needed to carry out the testing.
MINNESOTA ETHANOL LEGISLATION
On May 10, 2005, Minnesota Governor Tim Pawlenty signed into law a bill requiring ethanol to constitute 20% of the gasoline sold in the State of Minnesota. The bill allows for two methods of achieving this. First, if by December 31, 2010 the volume of ethanol sold in the State through the combination of E10 and E85 reaches 20% of the total gasoline sold in the State, then the goal will be met and there will not be any changes in the fuel sold. If the combination of the two fuels’ ethanol content does not reach at least 20% of the total fuel sold, then by August 30, 2013 the ethanol content of gasoline will be increased from 10% to 20% by volume (Eisenthal, 2005).
The second method, 20% ethanol in all gasoline, requires the EPA to approve a waiver for the use of E20. EPA waivers can be granted in one of two ways. The EPA can review the application and supporting data and grant the waiver. Or, if the EPA fails to provide a decision on the waiver within 180 days, the waiver is automatically granted. This clause is of particular concern because the original fuel waiver for E10 was granted because the EPA failed to make a decision in 180 days. The Minnesota law explicitly states that the failure of the EPA to act shall not be deemed an approval.
LITERATURE REVIEW
The passage of the Minnesota E20 legislation raised many questions about the effects of E20 on non-flex fuel vehicles. All vehicles sold in the United States since the early 1980s are compatible with E10, but whether or not they are compatible with E20 is not known. Before E20 can be sold in Minnesota, a section 211f waiver needs to be obtained from the United States Environmental Protection Agency (EPA). In order to obtain a waiver, extensive research and testing will need to be conducted in five areas: drivability, fuel system material compatibility, tailpipe and evaporative emissions, emission control system effectiveness and durability,

2/21/2008
2
and health effects. This research and testing will be conducted to ensure that the fuel does not cause any more problems than gasoline in the five categories.
The fuel systems on vehicles produced today are seeing an ever-increasing amount of ethanol-blended fuels and are expected to have a usable lifespan of 15 to 20 years. Currently, all fuel systems are compatible with E10, but as increased ethanol blends become more prevalent, the need to quantify the effects of higher blends on materials is necessary. Unfortunately, there is little information on the non-linear effects of increased ethanol blends on fuel system materials. This means that as the concentration of ethanol increases from 0 to 100% there is no model that accurately predicts the effects on materials. In fact, neat ethanol and neat gasoline often have a smaller negative impact on materials than gasoline-ethanol blends. To compound this problem, mid-range blends of 15 to 50%, often have the largest negative impact on materials.
The MSU material compatibility study started out like most research with a comprehensive review of the literature. To guide this review, a few questions were asked: (a) What literature exists on E20 and materials? (b) What materials are in a fuel system? (c) What standard test procedures are used to validate a material for compatibility with a fuel? (d) By what criteria is a material deemed compatible or incompatible with a fuel? With these questions in mind, a thorough review of the Society of Automotive Engineers’ (SAE) technical paper library was conducted along with an extensive internet search. Also, Original Equipment Manufacturers (OEMs), Tier I and II suppliers (supply parts to the OEMs), and material testing laboratories were contacted for information.
Throughout the search for information on E20, it became apparent that there was very little information publicly available. Most OEMs have tested with a fuel close to E20, such as E25 because of its extensive use in Brazil, but retain this information as proprietary. Several small material studies mentioned E20 or tested a blend close to E20 such as E25, but these studies offered only a small portion of the information that would be necessary for a waiver. In fact, only one major study on E20 was found, the Orbital Engine Company’s study for the Commonwealth Government of Australia conducted from October 2002 through March 2003 (Orbital, March 2003, and May 2003).
The Orbital study was extremely comprehensive, covering both automobiles and small engines in areas of emissions, drivability, material compatibility, durability, and a well-to-wheel study. With regards to material compatibility, the Orbital study tested actual components from vehicles. The study found that E20 caused significant problems with many metal, plastic, and rubber
components that gasoline did not. The Orbital study was carefully reviewed at MSU. The study identified significantly higher levels of discoloration and tarnishing on components exposed to the E20 than the gasoline reference fuels in the study. However, it should be noted that E10 was not included in this study and other research studies have noted similar discoloration and tarnishing associated with the use of E10. Also, it is believed that corrosive water was added to the E20 blends at levels high enough to cause phase separation but was not added to the gasoline reference fuels. According to SAE recommended practice J1681 Gasoline, alcohol and diesel fuel surrogates for materials testing, corrosive water is only added to gasoline or ASTM Fuel C, not ethanol (SAE, 2000). This test method could be a reason for the extreme negative results that the Orbital study reported.
FORMULATING EXPERMIENTS
With a lack of available literature on E20 using testing procedures outlined by the Society of Automotive Engineers (SAE) or the American Society for Testing and Materials (ASTM), it became apparent that actual material compatibility experiments would be necessary to answer some of the questions about the effects of 20% ethanol blends. It was also determined that E10 should be included in any material compatibility tests as a reference to the changes caused by ethanol. Ethanol does cause different changes to materials than gasoline. But, if E20 did not cause a larger negative impact on materials than E10, an accepted motor fuel, then E20 would be acceptable. The inclusion of E10 in the testing for the purpose of differentiating acceptable changes caused by ethanol is a significant component of the MSU material studies.
PROCESS OVERVIEW
The procedures for the plastics testing were developed from six main standards: SAE J1748 Methods for determining physical properties of polymeric materials exposed to gasoline/oxygenate fuel mixtures; SAE J1681 Gasoline, alcohol, and diesel fuel surrogates for material testing; ASTM D618-00 Standard practice for conditioning plastics for testing; ASTM D543-95 Standard practice for evaluating the resistance of plastics to chemical reagents; ASTM D638-03 Standard test method for tensile properties of plastics; and ASTM D256 Standard Test methods for determining the Izod pendulum impact resistance of plastics (SAE, 1998, 2000; ASTM, 2000, 1995, 2003, 2006). SAE J1748 was the overarching standard that provided modifications to ASTM D543 to tailor the procedures for ethanol-blended fuels testing. After formulating the test procedures to reflect specific equipment and resources, the procedures
2/21/2008
3
were forwarded for peer review and altered according to expert suggestions. All testing and data collection took place in a room equipped with a ventilation system designed to handle hazardous fumes. All samples were prepared as specified by ASTM D618-00, Standard practice for conditioning plastics for testing. After the samples were prepared, the weights and dimensions were measured to provide a baseline for comparison. Photographs of the color and surface texture were also taken.
As per SAE J1748 and ASTM D543, specimens were completely immersed for 3,024 hours at 55 ± 2 °C before testing. The following properties were measured before and after immersion: volume, weight, appearance, impact resistance, tensile strength, and ultimate elongation. The plastics testing required three different shaped test specimens. The first was a 2 in. diameter by 0.125 in. thick disk. This specimen shape was used for volume, weight, and appearance change measurements. It will be referred to as the appearance specimen. Five appearance specimens of each material were immersed in each fuel. The second specimen shape prepared and immersed was a Type 1 tensile dumbbell as specified by ASTM D638 (2003). These samples were used for tensile strength and elongation measurements. They will be referred to as the tensile specimens. Five tensile specimens of each material were prepared and immersed in each test fuel. In addition, five specimens of each plastic were prepared but not exposed to the test fuels. These pieces served as control samples to identify any physical changes that occurred over the testing period that were not caused by any of the test fuels. The third specimens used were Izod-type specimens as specified by ASTM D256. They were used for impact testing (2006). A total of forty Izod specimens were prepared from each material. Ten samples were placed in each of the test fuels and ten pieces were used as control samples. All of the specimens were conditioned in accordance with ASTM D618 Procedure A (2000). This is very important because temperature and humidity can affect some plastics. After conditioning, the specimens were weighed to ± 0.0001 g and measured to ± 0.001 in. as specified by ASTM D543 (1995). Photographs were also taken at this time to show color and surface texture of the specimens. Once the physical data was recorded, the specimens were suspended in sealed glass jars containing the appropriate test fluids: C, C(E10)A, and C(E20)A. The samples were completely submerged in the test fluids during the immersion process. The jars were then placed in an oven at an elevated temperature of 55 ± 2 °C. The test fluid was changed weekly and any changes in color were noted.
After the 3,024 hour immersion time, the jars were removed and allowed to cool for 24 hours. Each specimen was dimensionally measured, weighed, and photographed for appearance. The immersed and non-immersed tensile specimens were tested in accordance with ASTM D618 to measure tensile strength and elongation (2000). Finally, impact testing following ASTM D256 was conducted on all test samples to determine impact resistance (2006). See Appendix A for the complete test procedure.
MATERIALS
Raw materials used in the construction of fuel system components were tested instead of actual components. Testing raw materials allows for much broader coverage than testing individual components. For instance, the results from a test on selected plastic could provide information regarding the material’s performance in a variety of components manufactured by any manufacturer using that material. This was determined to be more practical than testing individual components. In addition, many of the industry-accepted standard test procedures require specimens of specific dimensions that would be difficult to obtain from actual components.
The list of materials used in the fuel systems of automobiles from the 1970’s forward, marine engines, non-road engines, and fuel dispensing equipment is immense. It would be virtually impossible for one study to test every material and combination of materials used. The materials list for this study was created from various sources such as literature reviews, manuals, and recommendations from fuel system and engine manufacturers. After the list of plastics was assembled, it was forwarded to a list of fuel-system engineers from several OEMs and Tier I and II suppliers for peer review. Finally, materials that are commonly used in flex-fuel vehicle fuel systems were removed from the list because they have already been proven compatible with any blend of ethanol from 0 to 85%. The eight materials included in the study are listed below.
• acrylonitrile butadiene styrene (ABS)
• polyamide 6 (PA 6) [Nylon 6]
• polyamide 66 (PA 66) [Nylon 66]
• polybutylene terephthalate (PBT)
• polyethylene terephthalate (PET)
• polyetherimide 1010 moldable (PEI)
• polyurethane 55D-90Adurameter hardness (PUR)
• polyvinyl chloride flexible version (PVC)

2/21/2008
4
These eight plastics will be referred to using their three letter abbreviation from here forward. One material, ABS Plastic, deteriorated in under one week in all three test fuels and could not be used any further.
Several plastics including: ethylene vinyl alcohol (EVOH), polyamide 12 conductive version (PA 12) [Nylon 12], polyamide 46 (PA 46) [Nylon 46], polyphtalamide (PPA), high density polyethylene (HDPE), low density polyethylene (LDPE), polypropylene (PP), polyphenylene sulfide (PPS), polyoxymethylene (POM), Zytel® (HTN), and polyteraflouroethylene (PTFE) were not physically tested because they have been commonly used in the fuel system of flex-fuel vehicles and therefore have already been qualified for ethanol use.
TEST FUEL
The test fuel selection for this research was a major focus in the test plan development. In the review of the literature, several studies were identified where it was difficult to determine the specific composition of the base gasoline or ethanol components. The test fuels used in this study were based on the test-fuel standard specified in SAE J1681, Gasoline alcohol and diesel fuel surrogates for materials testing. This paper was the result of a task force formed in the early 1990’s for testing materials with methanol. Since then, the standard has been altered to include many fuels. The task force adopted ASTM Fuel C to use as a reference for gasoline in material compatibility testing. ASTM Fuel C represents a worst-case-scenario gasoline due to its composition of 50% iso-octane and 50% toluene. The iso-octane represents the alkane group that makes up 40 to 70% of gasoline (Harrigan, Banda, Bonazza, Graham, Slimp, 2000, p. 2). It is important that the alkane group is represented for two reasons. First, they make up a large percentage of gasoline and second, they can cause swelling in polymers (plastics and elastomers). The toluene represents the aromatic group that makes up 20 to 50% of gasoline (p.2). Aromatics can cause swelling in polymers, but they also help suspend alcohols within the fuel mixture.
Synthetic ethanol, not fuel-grade ethanol, should be used for materials testing because its known composition “will help to minimize some of the variables in the use of ethanol as a fuel test component” (Harrigan et al., p. 5). Many impurities can be found in fuel-grade ethanol including sulfuric acid, acetic acid, water, and sodium chloride. “The acid is formed either in the alcohol production process or due to oxidation of the alcohol during handling, transfer or storage” (p. 3). Water also is a by-product of production and can cause metal corrosion, especially when combined with sodium chloride. It is important that these are represented in the test fuel because they can cause material compatibility
issues. As per SAE J1681, these impurities were added to the synthetic ethanol to form aggressive ethanol. Aggressive ethanol is a worst-case-scenario fuel that would still be acceptable under ASTM D4806, Standard specification for denatured fuel ethanol for blending with gasoline for use as automotive spark-ignition engine fuel (ASTM, 2006).
All fuels used in this study met SAE Standard J1681’s criteria. The three test fuels used included
Surrogate gasoline [C] - ASTM Fuel C, 50/50 toluene iso-octane mixture (500 ml toluene and 500 ml iso-octane)
E10 fuel [C(E10)A] - 90% Fuel C + 10% aggressive ethanol (450 ml toluene, 450 ml iso-octane, 100 ml aggressive ethanol)
E20 fuel [C(E20)A] - 80% Fuel C + 20% aggressive ethanol (400 ml toluene, 400 ml iso-octane, 200 ml aggressive ethanol)
Aggressive ethanol consists of: synthetic ethanol 816.00 g, de-ionized water 8.103 g, sodium chloride 0.004 g, sulfuric acid 0.021 g, and glacial acetic acid 0.061 g (SAE J1681 Appendix E.1.2).
APPARATUS
The test samples were placed in 2-L glass jars with Teflon® lids. Stainless safety wire was used to suspend the samples in the test fluid and glass beads were used to keep the samples separated during the soaking period. The appropriate test solution was added to each of the jars and the test specimens were hung from the inner liner of the cap by stainless wire. The soaking apparatus is shown in Figure 1 below. The jars were placed in the oven at the elevated temperature for 18 weeks.
Figure 1. Test container

2/21/2008
5
An explosion-proof friction air oven was used to maintain the samples at 55 ± 2 °C. It uses the heat generated by circulating air to maintain the temperature instead of an element or a flame. This is very important when heating combustible liquids in the presence of oxygen due to the potential for an explosion if the vapors were to come into contact with an ignition source.
MEASURING EQUIPMENT
Five primary pieces of measuring equipment were used to collect the physical property data for this study. A micrometer (0.001 in. precision) was used to measure the dimensions of each test sample. In addition, a micrometer with an anvil machined with the profile of the Izod notch was used to measure each notch depth.
A Radwag WAX 220 analytical balance was used to measure the mass of the test samples. The balance has a linearity of ∀0.0002 g and a repeatability of 0.00015 g as outlined in the user’s manual. Based on the resolution and linearity of the scale, a weight change in a specimen less than 0.0008 g could be due to scale error and was not considered a measurable change.
Figure 2. Satec pendulum impact tester
A 16 ft-lb Satec, Model BLI universal pendulum impact tester (Figure 2) with a precision of 0.1 ft-lb was used to determine the impact resistance of each material. This machine was leveled and calibrated before testing and a correction table for windage and friction was developed.
Figure 3. MTS 810 tensile testing system
Finally, a MTS 810 material testing system with a 2,000-lbf load cell was used to obtain tensile strength properties. A photo of the machine with one of the samples is shown in Figure 3.
DATA COLLECTION
Individual sample mass and dimensions were recorded before exposure to the test fluids. In addition to physical measurements, photos were taken of each sample to provide a reference of the original color and surface texture to be used at the conclusion of the study for comparison. The color of the solution was noted before each weekly fuel change.
DATA ANALYSIS
The data collected at the end of the study was compared to baseline values. All samples were measured before immersion and compared to the values recorded after the soak process along with the samples that were never exposed to any fuel.
Appearance specimens were measured for volume change and mass gain or loss. Samples were compared from start to finish.
Tensile testing results were compared to the results of test pieces that were never exposed to fuel. Tensile strength was calculated by the maximum load in
2/21/2008
6
pounds-force by the average original (pre immersion) cross-sectional area in square inches. In addition, the percent elongation was determined by measuring the change in gage length from the original specimen to the fuel affected specimen.
The immersed Izod impact test pieces were evaluated against the results of specimens which were not immersed. Impact resistance test results were measured in ft-lbf/in. Average impact resistances, along with the standard deviation to determine test variance and significance levels, were calculated from the physical data. Finally, the failure of each sample was visually analyzed to note the type of failure along with any air bubbles trapped in the specimen at the failure point.
RESULTS
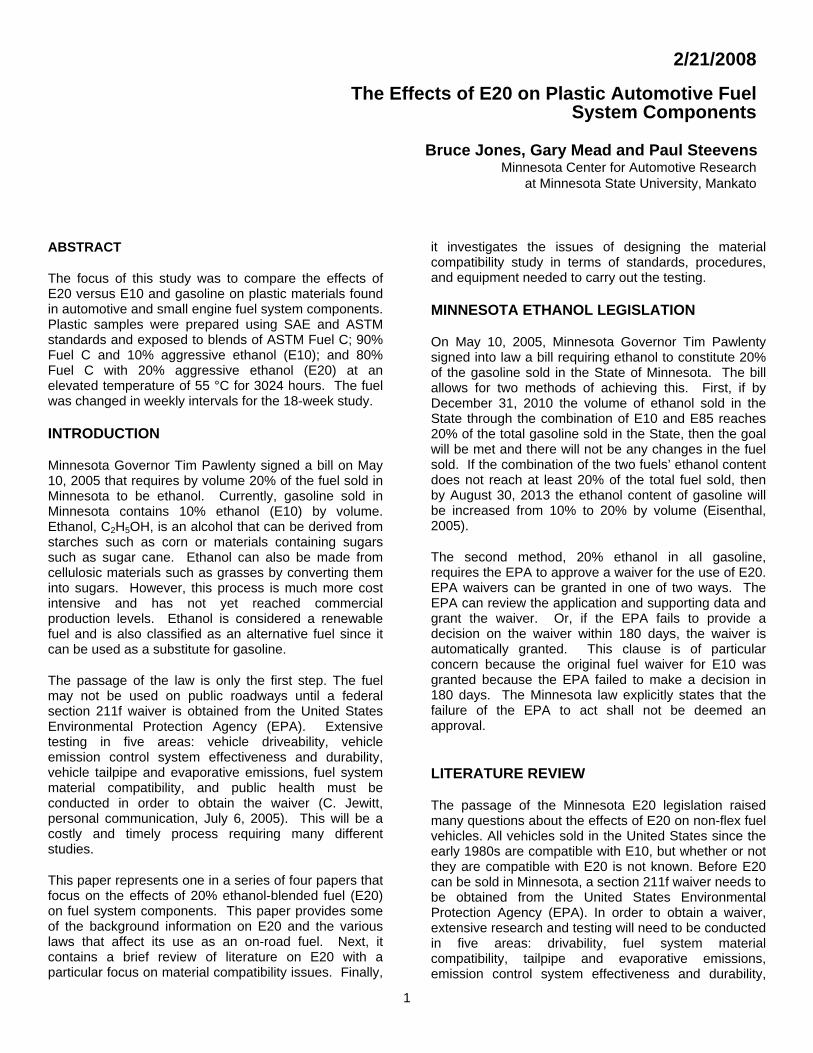
An example photo of the various materials included in the study is displayed in Figure 4. The results of the study focused on comparison of the physical property changes of the materials after being immersed in each test fluid. Many of the materials demonstrated more discoloration when exposed to higher concentrations of ethanol-based fuels. However, it should be noted that discoloration does not necessarily indicate potential fuel system reliability problems. This study attempted to quantify the differences based on the tested physical properties.
In many instances, samples immersed in both E10 and E20 demonstrated significant changes when compared to Fuel C. In those cases, the focus was placed on the differences between samples exposed to E10 and E20.
Figure 4. Samples included in study
VISUAL APPEARANCE CHANGE
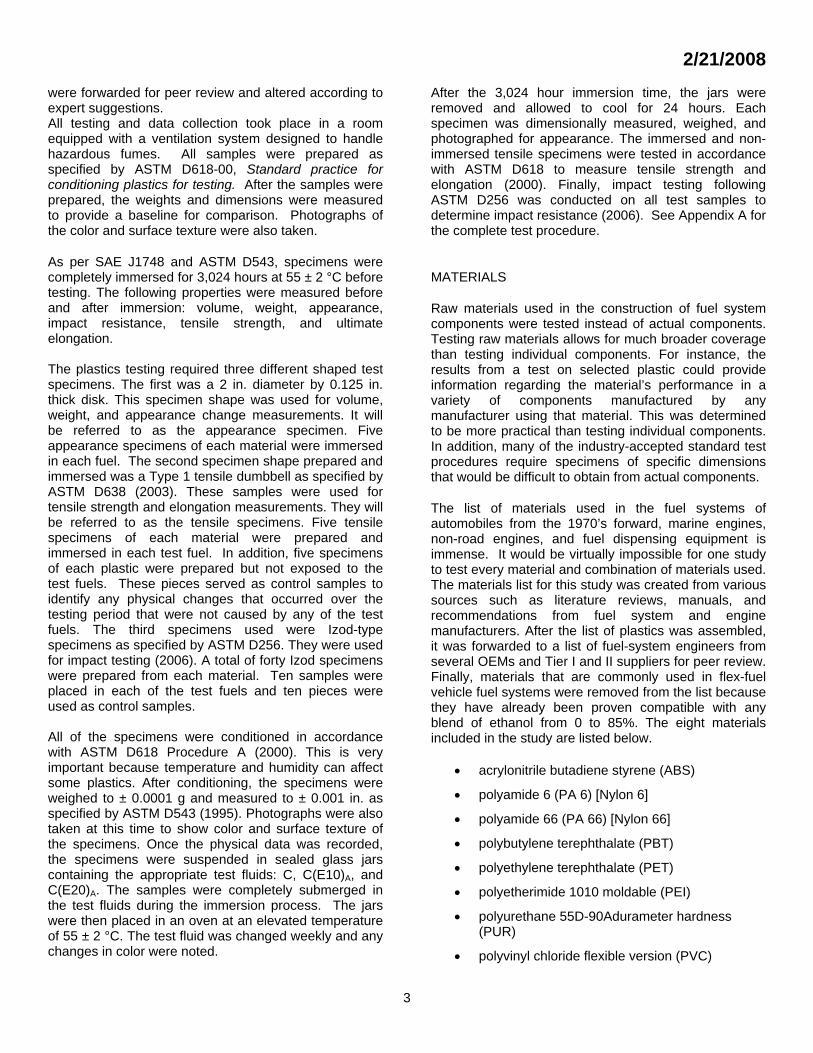
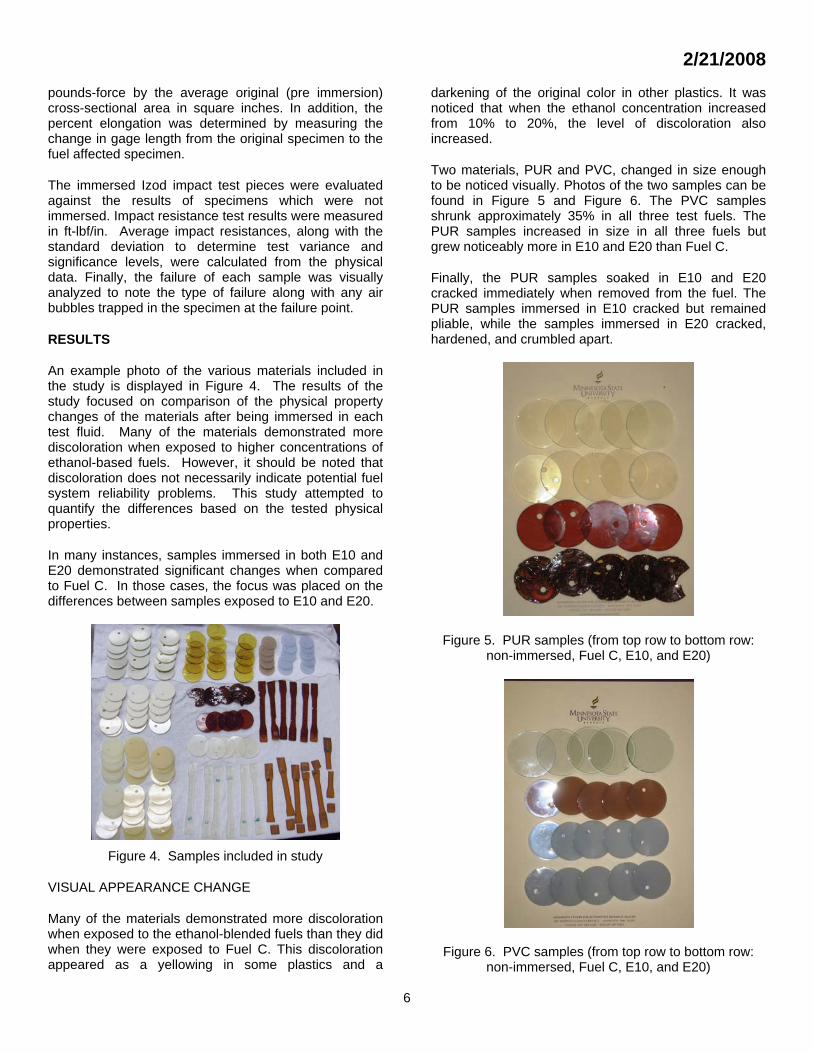
Many of the materials demonstrated more discoloration when exposed to the ethanol-blended fuels than they did when they were exposed to Fuel C. This discoloration appeared as a yellowing in some plastics and a
darkening of the original color in other plastics. It was noticed that when the ethanol concentration increased from 10% to 20%, the level of discoloration also increased.
Two materials, PUR and PVC, changed in size enough to be noticed visually. Photos of the two samples can be found in Figure 5 and Figure 6. The PVC samples shrunk approximately 35% in all three test fuels. The PUR samples increased in size in all three fuels but grew noticeably more in E10 and E20 than Fuel C.
Finally, the PUR samples soaked in E10 and E20 cracked immediately when removed from the fuel. The PUR samples immersed in E10 cracked but remained pliable, while the samples immersed in E20 cracked, hardened, and crumbled apart.
Figure 5. PUR samples (from top row to bottom row: non-immersed, Fuel C, E10, and E20)
Figure 6. PVC samples (from top row to bottom row: non-immersed, Fuel C, E10, and E20)

2/21/2008
7
MASS LOSS/GAIN ANALYSIS
The mass of each material sample was measured prior to and after the 3024-hour immersion period. Refer to Appendix B for a graph comparing the pre-immersion and post-immersion mass and Appendix C for the data. The post-immersion mass of PA 6, PA 66, PBT, PET, and PEI increased approximately 10% when exposed to both E10 and E20. No significant difference in mass change was noted between the above mentioned E10 and E20 samples.
PUR was the only sample that exhibited a mass change greater than 10% in the ethanol fuels while remaining constant in Fuel C. The greatest mass change of PUR occurred in E10. Finally, the PVC exhibited a mass loss of approximately 31% in all three fuels after being immersed. This indicates that the fuels extracted materials from PVC samples.
VOLUME CHANGE ANALYSIS
The measured volume change had a positive correlation to the mass change results. Refer to Appendix D for a graph comparing the pre-immersion and post-immersion volumes and Appendix E for the data. Samples of PA 6, PA 66, PBT, PET, and PEI immersed in E10 and E20 yielded approximately a 10% increase in volume change when compared to Fuel C. The difference in volume change between samples immersed in E10 and E20 varied less than 2%.
The volume of PUR increased significantly between the pre-immersion and post-immersion measurements. The volume change in the samples immersed in E10 increased 54.7%, while the samples immersed in E20 increased 60.3%. Finally, the PVC samples’ volume decreased approximately 35% when immersed in any of the three fuels.
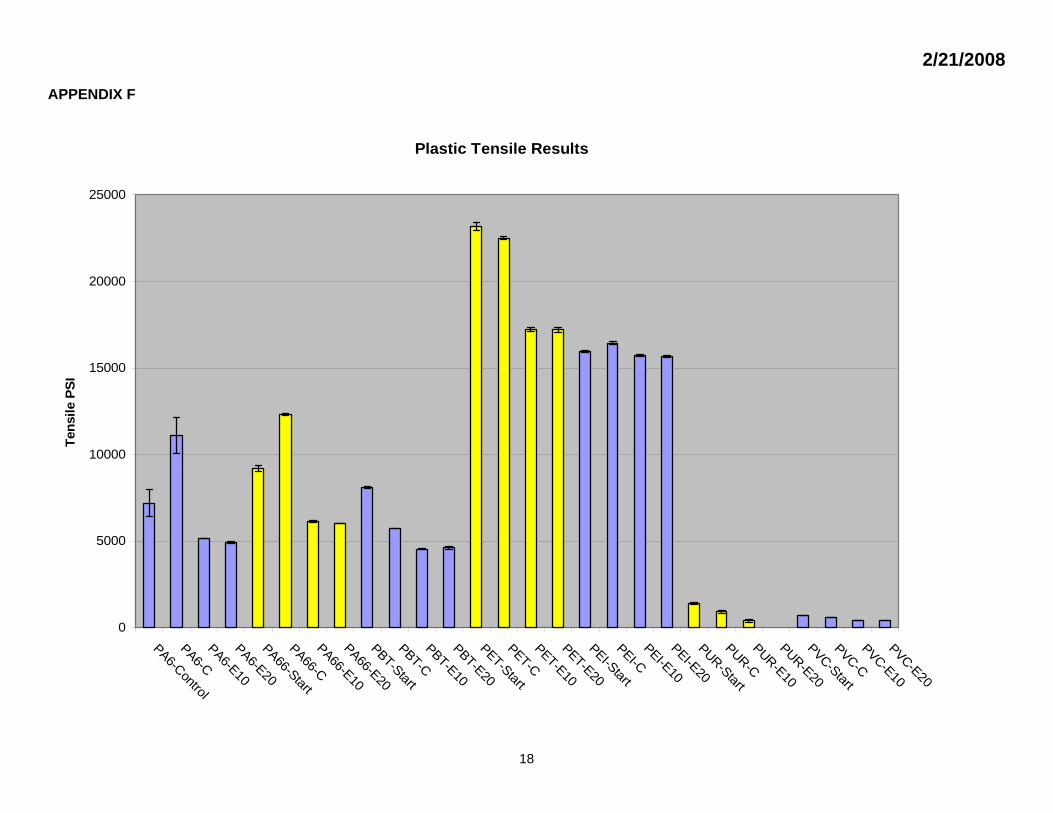
TENSILE STRENGTH ANALYSIS
The tensile strength characteristics of all samples were affected by immersion in the test fuels. Refer to Appendix F for a graph comparing the non-immersion and post-immersion tensile strengths and Appendix H for the data. Fuel C had a smaller effect than either the E10 or E20 test fuels. The tensile strength of the PA 6, PA 66, PBT, PET, and PEI materials all decreased after immersion. However, there was no significant difference between the change in tensile strength of samples immersed in E10 and E20. The PUR samples immersed in E10 lost 73% of their tensile strength, but the samples immersed in E20 cracked and broke before they could even be tested.
TENSILE ELONGATION ANALYSIS
While measuring the tensile characteristics of the samples, the percent of elongation data was collected. Refer to Appendix G for a graph comparing the non-immersion and immersion elongations and Appendix H for the data. No significant differences were measured in the PET and PUR samples. As the ethanol concentration increased, the percent of elongation increased on the PA 6, PA 66, and PBT samples and decreased in the PUR samples. However, there was not a significant difference between the samples immersed in E10 and E20. The PVC samples demonstrated a significantly smaller percent of elongation when immersed in E20 compared to both Fuel C and E10.
IMPACT RESISTANCE ANALYSIS
Izod impact test results show no significant difference between the E10 and E20 test fuels. Refer to Appendix I for a graph comparing the non-immersion and immersion impact results and Appendix J for the data. Impact resistance increased on the PA 6, PA 66, PBT, and the PEI when compared to Fuel C. The PET impact resistance decreased for the E10 and E20 blends when compared to Fuel C. The impact resistance for the PBT samples soaked in Fuel C increased 72% while the impact resistance of the specimens soaked in E10 and E20 increased 300% and 384%, respectively.
There were no differences in the type of fracture that occurred during the testing and there were no air bubbles present in the area of the break on any of the samples. The PVC samples immersed in all test fluids shrank to the point they could not be held in the Izod impact tester mounting fixture and, therefore, were not measured. Conversely, the PUR samples grew too large and could not be held in the test apparatus.
CONCLUSIONS
Using industry-recognized standards, this study tested eight different plastics found in automotive and small engine fuel systems to determine if they performed significantly different when immersed in Fuel C, E10, or E20. The study found that four of the materials, PA 6, PA 66, PET, and PEI, were compatible with the three fuels. The other four materials, ABS, PUR, PVC, and PBT, were affected by all three fuels to varying degrees.
The ABS specimens failed after less than one week of immersion in all three fuels. The specimens turned to a jelly-like mass in the bottom of the jars. This material was not compatible with any of the fuels. Finally, no automotive or small engine fuel system applications of ABS could be located, quite possibly due to its incompatibility with fuel.

2/21/2008
8
PVC (flexible version) demonstrated significant changes in mass and volume in all three fuels but to a higher degree in ethanol fuels. The PBT data also showed significant changes in impact resistance in all three fuels but to a greater extent in the ethanol blends. PUR (55D-90A durometer hardness) was deemed incompatible with both E10 and E20 due to cracking and changes in mass, volume, tensile strength, and elongation. In each case with PVC, PUR, and PBT both E10 and E20 caused large enough changes to raise a concern. Because of this, these materials would be a poor choice for use with either E10 or E20. Finally, no fuel system components made of either PUR or PVC could be located.
Different degrees of discoloration were observed in many of the other test samples, slight yellowing of plastics occurred on a few samples with E20 causing more yellowing. Samples were marked with an engraver for identification purposes. All can still be easily read with the exception of the PUR sample immersed in E20. Discoloration does not mean a failure in an automotive fuel system component.
ACKNOWLEDGEMENTS
This study would not have been possible without the support and recommendations from a number of individuals, organizations, and companies including
Briggs & Stratton Delphi Ford Motor Company General Motors Intertek Automotive Jewitt and Associates Kohler Minnesota Corn Research and Promotion Council Minnesota Department of Agriculture Renewable Fuels Association S&S Cycle TI Automotive Toro Toyota Zen Fuel LLC / Michael Harrigan
REFERENCES
ASTM Recommended Practice, (2006). Standard specification for denatured fuel ethanol for blending with gasoline for use as automotive spark-ignition engine fuel. ASTM D4806.
ASTM Recommended Practice, (2006). Standard test methods for determining the Izod pendulum impact resistance of plastic. ASTM D256.
ASTM Recommended Practice, (2004). Standard specification for automotive spark-ignition engine fuel. ASTM D4814.
ASTM Recommended Practice, (2003). Standard test method for tensile properties of plastics. ASTM D638.
ASTM Recommended Practice, (2000). Standard practice for conditioning plastics for testing. ASTM D618.
ASTM Recommended Practice, (1995). Standard practice for evaluating the resistance of plastics to chemical reagents. ASTM D543.
Clean Air Act, 42 U.S.C. § 7547 (1977).
Eisenthal, J. (2005, May). E20 Bill finally reaches Gov. Pawlenty’s desk. Minnesota Ag Connection. Retrieved October 22, 2005, from http://www.minnesotaagconnection.com/story-state.cfm?Id=405&yr=2005
Environmental Protection Agency. (1995, August 22). Waiver Requests under section 211 (f) of the clean air act. Retrieved October 28, 2005, from http://www.epa.gov/docs/OMSWWW/regs/fuels/additive/waiver.pdf
Environmental Protection Agency. (1991, January 24). Regulation of fuels and fuel additives; Definition of substantially similar. Retrieved October 28, 2005, from http://www.epa.gov/otaq/regs/fuels/additive/jan91.pdf
Orbital Engine Company. (2003, May). Market barriers to the uptake of biofuels study: A testing based assessment to determine impacts of a 10% and 20% ethanol gasoline fuel blend on non-automotive engines - 2000hrs material compatibility testing. Report to Environment Australia.
Orbital Engine Company. (2003, May). Market barriers to the uptake of biofuels study: A testing based assessment to determine impacts of a 20% ethanol gasoline fuel blend on the Australian passenger vehicle fleet - 2000hrs material compatibility testing. Report to Environment Australia.
Orbital Engine Company. (2003, March). Market barriers to the uptake of biofuels study: A testing based assessment to determine impacts of a 20% ethanol gasoline fuel blend on the Australian passenger vehicle fleet. Report to Environment Australia.
SAE Recommended Practice, (2000, January). Gasoline, alcohol and diesel fuel surrogates for materials testing. SAE J1681.
2/21/2008
9
SAE Recommended Practice, (1998, January). Methods for determining physical properties of polymeric materials exposed to gasoline/oxygenate fuel mixtures. SAE J1748.
Society of Automotive Engineers. (2000). A rational approach to qualifying materials for use in fuel systems. Warrendale, PA: Harrigan, M., Banda, A., Bonazza, B., Graham, P., & Slimp, B.
Sun Refining and Marketing Company. (1988, April). Waiver application for 15% MTBE (EPA Publication No. EN-88-02, III-A-1). Washington, DC: U.S. Environmental Protection Agency.
United States Department of Energy: Energy Efficiency and Renewable Energy. (2005, September 9). Minnesota passes E20 law. Retrieved October 22, 2005, from http://www.eere.energy.gov/afdc/progs/ddown.cgi?/WHATS_NEW/480/1/0
TERMINOLOGY
E10 - Fuel consisting of 90% gasoline and 10% ethanol
E20 - Fuel consisting of 80% gasoline and 20% ethanol
ASTM Test Fuel C - Test Fuel C is composed of 50% toluene and 50% iso-octane
Aggressive ethanol - Synthetic ethanol 816.00 g, de-ionized water 8.103 g, sodium chloride 0.004 g, sulfuric acid 0.021 g, and glacial acetic acid 0.061 g (SAE J1681 appendix E.1.2)
C(E10)A - Fuel consisting of 90% ASTM test Fuel C and 10% aggressive ethanol
C(E20)A - Fuel consisting of 80% ASTM test Fuel C and 20% aggressive ethanol
CONTACT
Department of Automotive Engineering Technology Minnesota State University, Mankato 205 Trafton Science Center East, Mankato MN 56001 507-389-6383
2/21/2008
10
APPENDIX A
MnCAR Minnesota Center for Automotive Research FROM Bruce Jones, Gary Mead, & Paul Steevens Minnesota Center for Automotive Research Minnesota State University, Mankato Trafton Science Center 205E Mankato, MN 56001 (507) 389-6383 (507) 389-5002 (fax) RE E20 Material Compatibility Testing Procedures - Plastics Introduction This document is intended to outline the testing procedures used by the Minnesota Center for Automotive Research (MnCAR) for the purpose of measuring the material compatibility characteristics of plastics commonly found in automotive fuel systems. The purpose of this testing is to determine if Fuel C(E20)A will have a larger negative impact on fuel system plastics than Fuel C or Fuel C(E10)A. The following properties and changes were measured before and after immersion: volume/swell, weight, appearance, tensile strength, elongation, and impact resistance. Standards Used Proposed testing will follow the procedures outlined in
SAE J1748-98 Methods for determining physical properties of polymeric materials exposed to gasoline/oxygenate fuel mixtures
SAE J1681-00 Gasoline, alcohol, and diesel fuel surrogates for material testing ASTM D618-00 Standard practice for conditioning plastics for testing ASTM D543-95 Standard practice for evaluating the resistance of plastics to chemical reagents ASTM D638-03 Standard test method for tensile properties of plastics ASTM D256-06 Standard test methods for determining the Izod pendulum impact resistance of plastics
Properties Examined volume/swell weight appearance tensile strength elongation impact resistance
2/21/2008
11
Plastics to Test ABS Acrylonitrile Butadiene Styrene PA 6 Polyamide - Nylon 6 PA 66 Polyamide - Nylon 66 PBT Polybutylene Terephthalate PET Polyethylene Terephthalate (Mylar) PUR Polyurethane PVC Polyvinyl Chloride PEI Polyetherimide (GE Ultem)
Test Fuels Three test fuels will be used consisting of
C Surrogate gasoline- "base” ASTM Fuel C 50/50 toluene iso-octane mixture (500 ml toluene and 500 ml iso-octane)
C(E10)A E10 fuel- 90% Fuel C + 10% aggressive ethanol (450 ml toluene, 450 ml iso-octane, 100 ml aggressive ethanol)
C(E20)A E20 fuel- 80% Fuel C + 20% aggressive ethanol (400 ml toluene, 400 ml iso-octane, 200 ml aggressive ethanol)
Aggressive ethanol consists of: synthetic ethanol 816.00 g, de-ionized water 8.103 g, sodium chloride 0.004 g, sulfuric acid 0.021 g, and glacial acetic acid 0.061 g (SAE J1681 Appendix E.1.2) Specimen Preparation and Condition 1. Prepare five appearance change disks and tensile specimens for each material being tested and for each test fuel being used.
Note: An extra set of five tensile specimens of each material will be needed to determine non-immersion properties. Prepare ten Izod specimens for each material being tested and for each test fuel being used. An extra set of ten Izod specimens of each material will be needed to determine non-immersion properties (SAE J1748 5.1.2, ASTM D543 12.2).
2. Specimen Sizes (SAE J1748 6.1.1, 6.1.2) Specimens for Weight, Dimension, and Appearance Change: Disks 50.8 mm (2 in.) x 3.175 mm (0.125 in.)
Specimens for tensile strength: Type 1 dumbbell tensile specimens 165 mm (6.5 in.) x 19 mm (0.75 in.) x 1.6 mm ± 0.25 mm (0.065 in. ± 0.010 in.) that neck down to 13 mm + 0.00 mm – 0.10 mm (0.500 in. + 0.000 in. -0.004 in.)
Specimens for Izod impact test: 12.7 mm (0.5 in.) X 12.7 mm (0.5 in.) x 63.5mm (2.5 in.) X 2.54 mm (0.100 in.) Izod notch on center.
3. All test and surrogate specimens will be conditioned in accordance with ASTM D618 Procedure A.
ASTM D 618 Procedure A Condition specimens under 7 mm (0.25 in.) thick for a minimum of 40 hours at 23 °C ± 2 °C at 50% ± 5% humidity. For specimens over 7 mm (0.25 in.) thick, condition for 88 hours at 23 °C ± 2 °C at 50% ± 5% humidity. Allow adequate air circulation to all specimens by either hanging from metal clips, or placing them on a wire screen with at least 25 mm (1 in.) of room between them and the bench (ASTM D618 8.1).
Immersion 1. Prepare and condition specimens in the manner described above. 2. Photograph all specimens to show color and surface texture. 3. After conditioning, weigh each specimen on an analytical balance in grams to four decimal places (SAE 1748 4.1.3).

2/21/2008
12
4. Measure the dimensions of each specimen, subtracting any holes, using a micrometer accurate to 0.0001 in. to calculate surface area (ASTM D543 5.1, 5.2).
Weight/dimension change specimens: Measure two diameters at right angles to each other and the thickness in the center (ASTM D543 11.1). Tensile specimens: Measure the width and thickness of the specimens at the center and within 5 mm of each end of the gage length (ASTM D638 10.1.1). Izod specimens: Measure the width, thickness, and notch depth (ASTM D256-06 7.2).
5. Fill the glass containers with the appropriate test fluid to at least 1 cm above the specimen, while maintaining a test fuel volume to specimen surface area ratio of 10 mL/in2 for nonextractable plastics and 40 mL/in2 for specimens which have extractable plasticizers. Use the larger ratio if unsure (SAE J1748 4.1.2, ASTM D543 11.2). 6. Place the container in the oven and allow the test fuel to reach 55 °C ± 2 °C (SAE J1748 5.1.2). 7. Once the test fuel temperature has stabilized, place the test specimens of the same material in each of the test fuels. Seal the containers to avoid evaporative losses. Suspend the specimens to avoid contact with the walls or bottom of the container using stainless steel wire and glass beads to separate each specimen. It may be necessary to attach small weights, such as nichrome, to prevent floating (ASTM D543 11.2). 8. Replace the fuel weekly (SAE J1748 5.1.2). 9. Continue exposure for 3000 hours (SAE J1748 5.1.3). Change in Weight, Dimension, and Appearance (ASTM D543) 1. After equilibrium or a predetermined time is reached, remove the containers from the oven and allow them to cool 24 hours before measurements are taken (SAE J1748 5.1.2). 2. Remove the specimens from the test fuel and place in the measurement fixture. Measure two diameters at right angles to each other and the thickness in the center. All dimensional measurements are taken while the specimen is wet and within 30 seconds of removing it from the fuel (SAE J1748 6.1.1, ASTM D543 11.1). 3. Blot dry the specimen being careful not to disturb the surface and place in a tarred weighing bottle within 10 seconds to minimize evaporative weight loss. Weigh each specimen to the same level of precision as the initial weighing (SAE J1748 6.1.1, ASTM D543 11.4). 4. Examine the appearance of each specimen noting any loss of gloss, developed texture, decomposition, discoloration, swelling, clouding, tackiness, rubberiness, crazing, bubbling, cracking, solubility, etc… (ASTM D543 11.5). 5. Photograph all specimens to show color and surface texture. Tensile Strength (ASTM D638) 1. After equilibrium or a predetermined time is reached, remove the containers from the oven and allow them to cool for 24 hours before measurements are taken (SAE J1748 5.1.2). 2. Testing is to take place within 5 minutes of removing the specimen from the fuel to minimize the effects of dryout (SAE J1748 6.1.2). 3. Tensile testing shall be performed on a machine meeting all requirements of Section 5 of ASTM D638. 4. Test at least five specimens for each material in the case of isotropic materials and ten specimens in the case of anisotropic materials (ASTM D638 7.1). 5. Test all specimens at a rate of 5 mm/min ± 25% (ASTM D638 8.2).
2/21/2008
13
6. Determine mechanical properties of non-immersed specimens prepared from the same material lot, conditioned in the same manner, and tested under the same conditions (ASTM D543 12.2). 7. Base all calculations on the original measurements taken before immersion (SAE J1748 6.1.2). Izod Impact (ASTM D256-06) 1. After equilibrium or a predetermined time is reached, remove the containers from the oven and allow them to cool for 24 hours before measurements are taken (SAE J1748 5.1.2). 2. Testing is to take place within 5 minutes of removing the specimen from the fuel to minimize the effects of dry-out (SAE J1748 6.1.2). 3. Impact testing shall be performed on a machine meeting all requirements of section 6 of ASTM D256. 4. Test at least five and preferably ten or more individual determinations of impact resistance (ASTM D256 10.1). 5. Measure windage and friction of the machine to calculate out of the sample test (ASTM D256 10.3). 6. Measure and record the width of each specimen after notching to the nearest 0.025 mm (.0001 in.) (ASTM D256 10.5). 7. Position the specimen rigidly and securely in the vice. Release the pendulum and record the indicated breaking energy (ASTM D256 10.7). 8. Record the type of break from failure category: complete, hinge, partial, or non-break (ASTM D256 5.8). 9. Calculate the average Izod impact resistance of the group of specimens (ASTM D256 10.10).

2/21/2008
14
APPENDIX B
Plastic Apperance Disk Mass
0.0
2.0
4.0
6.0
8.0
10.0
12.0
14.0
PA6-CPA6-E10PA6-E20PA66-CPA66-E10PA66-E20PBT-CPBT-E10PBT-E20PET-CPET-E10PET-E20PEI-CPEI-E10PEI-E20PUR-CPUR-E10PUR-E20PVC-CPVC-E10PVC-E20
Mas
s in
Gra
ms
Pre Imersion
Post Imersion

2/21/2008
15
APPENDIX C
Minnesota State University, MankatoE20 Plastics Study Apperance Disk Mass Results
Average of All Tests
Fuel C E10 E20 Fuel C E10 E20ABS Pre-Immersion 6.663 6.584 6.578 PET Pre-Immersion 9.594 9.606 9.573
Post Immersion Failed in all three test Fuels Post Immersion 9.764 9.965 9.931% Change % Change 1.8 3.7 3.7
Pre-Immersion Std Dev 0.03 0.13 0.10 Pre-Immersion Std Dev 0.03 0.04 0.04Post Immersion Std Dev Post Immersion Std Dev 0.04 0.04 0.04
Fuel C E10 E20 Fuel C E10 E20PA6 Pre-Immersion 7.255 7.236 7.236 PEI Pre-Immersion 8.011 7.978 7.990
Post Immersion 7.210 7.868 7.916 Post Immersion 8.045 8.156 8.158% Change -0.6 8.7 9.4 % Change 0.4 2.2 2.1
Pre-Immersion Std Dev 0.03 0.03 0.03 Pre-Immersion Std Dev 0.02 0.02 0.02Post Immersion Std Dev 0.03 0.03 0.02 Post Immersion Std Dev 0.03 0.02 0.03
Fuel C E10 E20 Fuel C E10 E20PA66 Pre-Immersion 7.095 7.129 7.126 PUR Pre-Immersion 7.746 7.757 7.760
Post Immersion 7.074 7.691 7.767 Post Immersion 9.147 11.823 10.919% Change -0.3 7.9 9.0 % Change 18.1 52.4 40.7
Pre-Immersion Std Dev 0.03 0.02 0.02 Pre-Immersion Std Dev 0.03 0.04 0.03Post Immersion Std Dev 0.03 0.03 0.02 Post Immersion Std Dev 0.03 0.47 0.39
Fuel C E10 E20 Fuel C E10 E20PBT Pre-Immersion 8.154 8.143 8.140 PVC Pre-Immersion 7.574 7.598 7.613
Post Immersion 8.426 8.642 8.637 Post Immersion 5.164 5.266 5.104% Change 3.3 6.1 6.1 % Change -31.8 -30.7 -33.0
Pre-Immersion Std Dev 0.04 0.03 0.04 Pre-Immersion Std Dev 0.03 0.04 0.04Post Immersion Std Dev 0.04 0.03 0.04 Post Immersion Std Dev 0.03 0.03 0.03
Weight in Grams Weight in Grams
Weight in Grams Weight in Grams
Weight in Grams Weight in Grams
Weight in GramsWeight in Grams

2/21/2008
16
APPENDIX D
Plastic Apperance Disk Volume
0.00
0.10
0.20
0.30
0.40
0.50
0.60
0.70
PA6-CPA6-E10PA6-E20PA66-CPA66-E10PA66-E20PBT-CPBT-E10PBT-E20PET-CPET-E10PET-E20PEI-CPEI-E10PEI-E20PUR-CPUR-E10PUR-E20PVC-CPVC-E10PVC-E20
Volu
me
in C
ubic
Inch
es Pre Imersion
Post Imersion

2/21/2008
17
APPENDIX E
Minnesota State University, MankatoE20 Plastics Study Apperance Disk Volume Results
Average of All Tests
Fuel C E10 E20 Fuel C E10 E20ABS Pre-Immersion 0.399 0.399 0.399 PET Pre-Immersion 0.384 0.383 0.381
Post Immersion Failed in all three test Fuels Post Immersion 0.395 0.409 0.407% Change % Change 2.8 6.7 6.8
Pre-Immersion Std Dev 0.00 0.00 0.00 Pre-Immersion Std Dev 0.00 0.00 0.00Post Immersion Std Dev Post Immersion Std Dev 0.00 0.00 0.00
Fuel C E10 E20 Fuel C E10 E20PA6 Pre-Immersion 0.404 0.399 0.400 PEI Pre-Immersion 0.392 0.389 0.391
Post Immersion 0.402 0.442 0.447 Post Immersion 0.394 0.398 0.400% Change -0.5 10.7 11.7 % Change 0.5 2.3 2.4
Pre-Immersion Std Dev 0.00 0.00 0.00 Pre-Immersion Std Dev 0.00 0.00 0.00Post Immersion Std Dev 0.00 0.00 0.00 Post Immersion Std Dev 0.00 0.00 0.00
Fuel C E10 E20 Fuel C E10 E20PA66 Pre-Immersion 0.391 0.392 0.392 PUR Pre-Immersion 0.408 0.405 0.405
Post Immersion 0.389 0.428 0.432 Post Immersion 0.502 0.627 0.649% Change -0.3 9.2 10.4 % Change 22.8 54.7 60.3
Pre-Immersion Std Dev 0.00 0.00 0.00 Pre-Immersion Std Dev 0.00 0.00 0.00Post Immersion Std Dev 0.00 0.00 0.00 Post Immersion Std Dev 0.00 0.01 0.01
Fuel C E10 E20 Fuel C E10 E20PBT Pre-Immersion 0.390 0.390 0.389 PVC Pre-Immersion 0.399 0.396 0.396
Post Immersion 0.405 0.424 0.420 Post Immersion 0.256 0.260 0.251% Change 3.8 8.8 7.8 % Change -35.9 -34.4 -36.5
Pre-Immersion Std Dev 0.00 0.00 0.00 Pre-Immersion Std Dev 0.01 0.01 0.00Post Immersion Std Dev 0.00 0.01 0.00 Post Immersion Std Dev 0.00 0.00 0.00
Volume in Cubic Inches Volume in Cubic Inches
Volume in Cubic Inches Volume in Cubic Inches
Volume in Cubic Inches Volume in Cubic Inches
Volume in Cubic Inches Volume in Cubic Inches
2/21/2008
18
APPENDIX F
Plastic Tensile Results
0
5000
10000
15000
20000
25000
PA6-Control
PA6-CPA6-E10PA6-E20PA66-StartPA66-CPA66-E10PA66-E20PBT-StartPBT-CPBT-E10PBT-E20PET-StartPET-CPET-E10PET-E20PEI-StartPEI-CPEI-E10PEI-E20PUR-StartPUR-CPUR-E10PUR-E20PVC-StartPVC-CPVC-E10PVC-E20
Tens
ile P
SI

2/21/2008
19
APPENDIX G
Plastic Tensile Elongation
0
1
1
2
2
3
3
4
4
PA6-ControlPA6-CPA6-E10PA6-E20PA66-StartPA66-CPA66-E10PA66-E20PBT-StartPBT-CPBT-E10PBT-E20PET-StartPET-CPET-E10PET-E20PEI-StartPEI-CPEI-E10PEI-E20PUR-StartPUR-CPUR-E10PUR-E20PVC-StartPVC-CPVC-E10PVC-E20
Elon
gatio
n (in
ches
)

2/21/2008
20
APPENDIX H
Minnesota State University, MankatoE20 Plastics Study Tensile Results
Average of All Tests
ABSTensile (PSI) Std Dev % Change
PETTensile (PSI) Std Dev % Change
Pre-Soak 6858 121 Pre-Soak 23191 247Fuel C Samples failed in under one week C 22507 113 -2.9% 14.5%E10 Samples failed in under one week E10 17239 126 -25.7% 19.2%E20 Samples failed in under one week E20 17224 153 -25.7% 17.6%
PA6Tensile (PSI) Std Dev % Change
PEITensile (PSI) Std Dev % Change
Pre-Soak 7203 758 Pre-Soak 15957 73C 11103 1042 54.1% -60.6% C 16449 78 3.1% -6.3%E10 5147 2 -28.5% 162.3% E10 15725 80 -1.5% -9.2%E20 4912 72 -31.8% 192.1% E20 15681 62 -1.7% -9.6%
PA66Tensile (PSI) Std Dev % Change
PURTensile (PSI) Std Dev % Change
Pre-Soak 9200 181 Pre-Soak 1414 50C 12324 62 34.0% -54.7% C 914 75 -35.4% -14.1%E10 6162 61 -33.0% 187.1% E10 386 73 -72.7% -34.5%E20 6029 2 -34.5% 206.3% E20 All Samples Cracked
PBTTensile (PSI) Std Dev % Change
PVCTensile (PSI) Std Dev % Change
at start 8101 48 Pre-Soak 714 2C 5735 1 -29.2% 325.7% C 571 2 -20.0% 2.5%E10 4544 60 -43.9% 413.1% E10 435 1 -39.1% 3.2%E20 4618 76 -43.0% 455.9% E20 429 3 -40.0% -10.3%
% Change in Elongation
% Change in Elongation
% Change in Elongation
% Change in Elongation
% Change in Elongation
% Change in Elongation
% Change in Elongation
% Change in Elongation

2/21/2008
21
APPENDIX I
Plastics Izod Impact
0
2
4
6
8
10
12
PA6-ControlPA6-CPA6-E10PA6-E20PA66-StartPA66-CPA66-E10PA66-E20PBT-StartPBT-CPBT-E10PBT-E20PET-StartPET-CPET-E10PET-E20PEI-StartPEI-CPEI-E10PEI-E20PUR-StartPUR-CPUR-E10PUR-E20PVC-StartPVC-CPVC-E10PVC-E20
Ave
rage
Ft-l
bs/In

2/21/2008
22
APPENDIX J
Izod ResultsAverage All Izod impact Tests
Average Ft-Lbs/In Average Ft-Lbs/In
ABS Control C E10 E20 PET Control C E10 E20Average 1.76 Failed in all three test fuels Average 3.64 4.03 3.40 3.60stand div 0.28 stand div 0.38 0.24 0.76 0.31Percent change from Percent change from 10.60 -6.73 -1.11test fuel to Control test fuel to Control
PA6 Control C E10 E20 PEI Control C E10 E20Average 4.58 3.36 3.98 3.79 Average 2.70 2.56 3.28 3.23stand div 0.23 0.14 0.21 0.77 stand div 0.29 0.04 0.14 0.21Percent change from -26.60 -13.18 -17.13 Percent change from -5.30 21.31 19.36test fuel to Control test fuel to Control
grew crackedPA66 Control C E10 E20 PUR Control C E10 E20Average 2.22 3.37 4.26 4.29 Average 4.03 Could not be tested in any fuelstand div 0.55 0.42 0.32 0.52 stand div 0.15Percent change from 51.81 92.07 93.26 Percent change fromtest fuel to Control test fuel to Control
shrankPBT Control C E10 E20 PVC Control C E10 E20Average 1.82 3.14 7.27 8.81 Average 0.92 Could not be tested in any fuel stand div 0.17 0.42 0.89 0.73 stand div 0.05Percent change from 72.73 299.51 384.18 Percent change fromtest fuel to Control test fuel to Control
Minnesota State University, MankatoE20 Plastics Study