22p. - ericrecently, lexington herald-leader columnist bill bishop pointed to persistent regional...
TRANSCRIPT
DOCUMENT RESUME
ED 424 252 TM 029 124
AUTHOR Reeves, Edward B.; Harty, HaroldTITLE Regional Disparities in Kentucky Academic Index Scores.
Occasional Research Paper No. 2.INSTITUTION Morehead State Univ., KY. R & D Center for Students,
Schools, and Communities.PUB DATE 1998-05-00NOTE 22p.
PUB TYPE Reports Research (143)EDRS PRICE MF01/PC01 Plus Postage.DESCRIPTORS *Academic Achievement; *Context Effect; Data Collection;
Educational Change; Elementary Secondary Education; *EqualEducation; *Geographic Regions; Rural Schools; *Scores;Socioeconomic Status; Test Results; Urban Schools
IDENTIFIERS Kentucky; *Kentucky Education Reform Act 1990
ABSTRACTIn spite of a mandate to create educational equality, the
Kentucky Education Reform Act (KERA) has not eliminated inequalities inschool performance scores, and the problem may even be getting worse. Theobjective of this study is to determine the disparities that exist amongKentucky's eight Service Center regions. The analysis uses school AcademicIndex scores from 1992-93 to 1996-97, averaged by region. The regionalaverages (or means) are compared descriptively along with the statisticalapplication of pairwise multiple comparisons. The study's findings show thatregional disparities in Academic Index scores clearly exist. Thesedisparities are probably the result, at least in part, of contextual effectssuch as rural-metropolitan differences and socioeconomic influences. A goalof the KERA should be to narrow the gap between the schools in differentregions. To assess progress toward this goal, it will be useful to monitordisparities in the gains that regions achieve in their scores over time. Thisanalysis indicates that, after 5 years of KERA performance records, schoolsin the eight Service Regions have generally kept pace with one another.Although greater equality is still an unrealized ideal under KERA,improvement has taken place, and there is little evidence of a widening gapbetween higher- and lower-scoring regions. Another 5 years of data shouldtell if a widening gap between regions has become a problem. (Contains 2figures, 4 tables, and 11 references.) (SLD)
********************************************************************************
Reproductions supplied by EDRS are the best that can be madefrom the original document.
********************************************************************************

Regional Disparities inKentucky Academic Index Scores
Occasional Research Paper, No. 2
May 1998
Edward B. Reeves, Director
R&D Center for Students, Schools, and Communities
Harold Harty, DeanCollege of Education and Behavioral Sciences
U.S. DEPARTMENT OF EDUCATIONOffice of Educational Research and Improvement
EDUCATIONAL RESOURCES INFORMATIONCENTER (ERIC)
1"his document has been reproduced asreceived from the person or organizationoriginating it.
0 Minor changes have been made toimprove reproduction quality.
Points of view or opinions stated in thisdocument do not necessarily representofficial OERI position or policy.
1
PERMISSION TO REPRODUCE ANDDISSEMINATE THIS MATERIAL HAS
BEEN GRANTED BY
filtuaxot ge-/-es
TO THE EDUCATIONAL RESOURCESINFORMATION CENTER (ERIC)
R&D Center for Students, Schools, and Communities
Morehead State University.
REGIONAL DISPARITIES IN KENTUCKY ACADEMIC INDEX SCORES
Occasional Research Paper, no. 2May 1998
Edward B. Reeves, DirectorR & D Center for Students, Schools, and Communities
Morehead State UniversityMorehead, Kentucky
and
Harold Harty, DeanCollege of Education and Behavioral Sciences
Morehead State UniversityMorehead, Kentucky
R & D Center for Students, Schools,and Communities
UPO Box 785Morehead State UniversityMorehead, KY 40351
Edward B. Reeves, DirectorPhone: 606/783-2546E-mail: [email protected]: 606/783-5070

Executive Summary
REGIONAL DISPARITIES IN KENTUCKY ACADEMIC INDEX SCORES
Recent newspaper articles by columnist Bill Bishop in the Lexington Herald-Leader point
to persistent regional disparities in achievement in Kentucky public schools. In spite of a mandate
to create educational equality, the Kentucky Education Reform Act (KERA) has not eliminated
inequalities in school performance scores and the problem may even be getting worse according
to Mr. Bishop. The objective of the present study is to determine what disparities exist among
Kentucky's eight Service Center Regions. The analysis uses school Academic Index scores, from
1992-93 to 1996-97, averaged by region. The regional averages (or means) are compared
descriptively along with the statistical application of pairwise multiple comparisons.
The study's findings show that regional disparities in Academic Index scores clearly exist.
These disparities are probably owing, at least in part, to contextual effects such as rural-
metropolitan differences and socioeconomic influences. A goal of KERA should be to narrow the
gap between the schools in different regions. To assess the accomplishment of this goal, it will be
useful to regularly monitor disparities in the gains that regions achieve in their scores over time.
The present analysis concludes that after five years, schools in the eight Service Regions have
generally kept pace with one another. Thus, although greater equality is still an unrealized ideal
under KERA, improvement has taken place with little evidence thus far of a "widening gap"
between the higher- and lower-scoring regions.' Another five years of data should tell if a
widening gap between the regions has become a persistent problem.
4

Introduction
Recently, Lexington Herald-Leader columnist Bill Bishop pointed to persistent regional
disparities in Kentucky schools, despite the State's comprehensive program of educational reform.
In a February 15, 1998 column entitled "Equality Was Heart of Reform," Bishop (1998a)
reported that the schools in Service Region 8 (Pikeville/Hamrd/Prestonsburg, etc.) score lower
than do schools in the other regions. Furthermore, Bishop noted that Region 8 schools are
"falling behind the rest of the state." A March 1, 1998 colunm by Mr. Bishop (1998b) charges
that due to 60 years of neglect "Eastern Kentucky has an accumulated education deficit."' It is
this deficit that accounts for the area's lack of economic and social development today.'
Mr. Bishop has put his finger on an important issue. The Kentucky Education Reform Act
of 1990 (KERA) was founded on the ideal that all children of the Commonwealth should have
equal educational opportunities. KERA is now in its seventh year, and five years of school
performance data have been accumulated. It is not too early to begin assessing if the ideal of
equality is being realized.
The present study examines regional achievement in school Academic Index scores for the
five-year period, from 1992-93 to 1996-97. The analysis makes a distinction between: (1)
differences in scores that show which regions on average have scored higher and which have
'Bishop (1998c) has repeated these views in an April 26, 1998 column.
'The area referred to in this article includes Service Region 7 (Ashland/Maysville/Morehead, etc.), Region 8 (Pikeville/Hamrd/Prestonsburg, etc.), and part of Region 6(Richmond/London/Williamsburg, etc.).
'Greenberg and Teixeira (1995), Brint (1998), and others have disputed the claim thatthere is a simple, direct relationship between the educational status of the population andeconomic development.
1
5
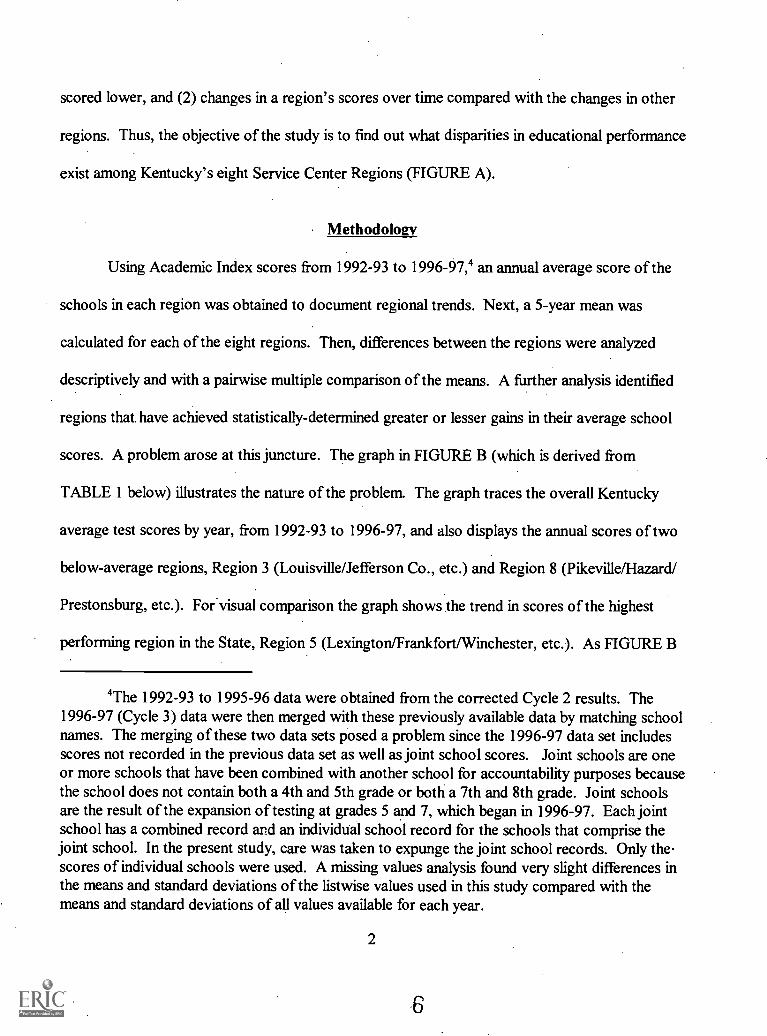
scored lower, and (2) changes in a region's scores over time compared with the changes in other
regions. Thus, the objective of the study is to find out what disparities in educational performance
exist among Kentucky's eight Service Center Regions (FIGURE A).
Methodology
Using Academic Index scores from 1992-93 to 1996-97,4 an annual average score of the
schools in each region was obtained to document regional trends. Next, a 5-year mean was
calculated for each of the eight regions. Then, differences between the regions were analyzed
descriptively and with a pairwise multiple comparison of the means. A further analysis identified
regions that, have achieved statistically-determined greater or lesser gains in their average school
scores. A problem arose at this juncture. The graph in FIGURE B (which is derived from
TABLE 1 below) illustrates the nature of the problem. The graph traces the overall Kentucky
average test scores by year, from 1992-93 to 1996-97, and also displays the annual scores of two
below-average regions, Region 3 (Louisville/Jefferson Co., etc.) and Region 8 (Pikeville/Hazard/
Prestonsburg, etc.). For visual comparison the graph shows the trend in scores of the highest
performing region in the State, Region 5 (Lexington/Frankfort/Winchester, etc.). As FIGURE B
4The 1992-93 to 1995-96 data were obtained from the corrected Cycle 2 results. The1996-97 (Cycle 3) data were then merged with these previously available data by matching schoolnames. The merging of these two data sets posed a problem since the 1996-97 data set includesscores not recorded in the previous data set as well as joint school scores. Joint schools are oneor more schools that have been combined with another school for accountability purposes becausethe school does not contain both a 4th and 5th grade or both a 7th and 8th grade. Joint schoolsare the result of the expansion of testing at grades 5 and 7, which began in 1996-97. Each jointschool has a combined record and an individual school record for the schools that comprise thejoint school. In the present study, care was taken to expunge the joint school records. Only thernscores of individual schools were used. A missing values analysis found very slight differences inthe means and standard deviations of the listwise values used in this study compared with themeans and standard deviations of all values available for each year.
2


0
69661
S.
04tas
Oe-

illustrates, the statewide average score increased during the first three years, declined in the fourth
year, and increased again in the fifth year. The present study will not attempt to explain why this
kink in the trend occurred.
The trend of Region 5 (Lexington/Frankfort/Winchester, etc.) has a shape similar to the
Kentucky trend, although the Region 5 mean score is 2-3 points higher than the State average in
each year. In contrast with this, the trend of Region 8 (Pikeville/Hazard/Prestonsburg, etc.) lies
beneath the Kentucky trend. Region 8 mean scores are 2-3 points less than the State averages
until the final year, 1996-97, when the trend flattens and the mean score of this region drops to 5
points below the State average. Region 3 is near the State average for the first three years then
drops below Region 8 in 1995-96 before recovering in the fifth year. How should changes in the
scores be interpreted given these trends? The simple approach would be to compare the
difference in school scores between 1992-93 and 1996-97, averaged for each of the eight
regions.' But, when this procedure is used, Region 8 registers a negligible increase from 1995-96
to 1996-97. As a result it has a significantly lower 5-year gain when compared with most of the
other regions (see below, TABLE 4, upper figures). This result, however, is due entirely to the
comparatively slight gain in 1996-97. If the difference were calculated between 1992-93 and
1995-96, for example, Region 8 would have registered greater improvement than Region 3, and
the gain in Region 8 would not deviate significantly from the gains achieved by the other regions.6
The lesson here is that the comparison of region-to-region gains in scores when based on
'This is the procedure that Bishop (1998c) follows in his April 26, 1998 column. Hisanalysis focuses on mathematics scores, whereas the analysis in the present study uses the totalAcademic Index score.
6This analysis is not presented here but will be provided on request.
5
11

the differences between single-year scores can produce misleading results. To demonstrate this
more comprehensively, two approaches to analyzing changes in the scores were used in this study.
First, the simple approach just described which compares the difference between the first- and
fifth-year scores was used. Since this approach does not control the volatility of single-year
scores, it can exaggerate disparities (and similarities) between the regions. The second approach
was to subtract the average of the first two years from the average of the fourth and the fifth years
to obtain a measure of change. In other words, for each region, the 1992-93 and 1993-94 scores
were averaged and subtracted from the average of the 1995-96 and 1996-97 scores. Compared
to the first approach, this yields less volatile estimates of regional gains by smoothing out
fluctuations in the differences between the first- and the last-year scores.
Findings
TABLE 1 displays the 5-year trends in the average Academic Index scores for the eight
Service Center Regions. The trend for the entire State went as follows: In 1992-93, the score
was 24.3. By 1994-95, it had increased to 36.2. Then in the following year, 1995-96, the score
declined to 34.7, before increasing to 39.0 in 1996-97. Across the 5-year period, the scores for
the entire State gained 14.7 points. The trends in TABLE 1 also reveal that Region 5 (Lexington/
Frankfort/Winchester, etc.) is consistently the highest:scoring region and Region 8 (Pikeville/
Hazard/Prestonsburg, etc.) is consistently the lowest-scoring region. Region 7 (Ashland/
Maysville/Morehead, etc.) registered scores that most closely approximate the entire State
averages. A clearer picture of the differences between the regions emerges by averaging these
trends.
6
12
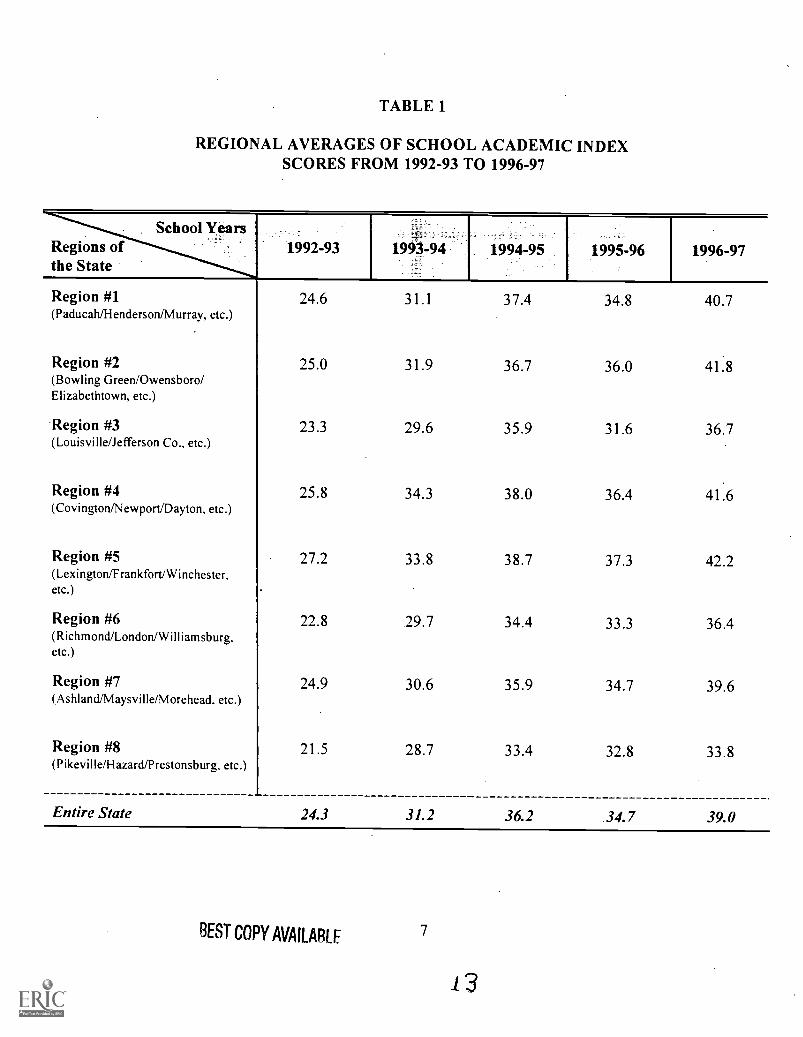
TABLE 1
REGIONAL AVERAGES OF SCHOOL ACADEMIC INDEXSCORES FROM 1992-93 TO 1996-97
, School YearsRegions ofthe State
1992-93 1993-94 1994-95 1995-96 1996-97
Region #1 24.6 31.1 37.4 34.8 40.7(Paducah/Henderson/Murray, etc.)
Region #2 25.0 31.9 36.7 36.0 41.8(Bowling Green/Owensboro/Elizabethtown, etc.)
Region #3 23.3 29.6 35.9 31.6 36.7(Louisville/Jefferson Co., etc.)
Region #4 25.8 34.3 38.0 36.4 41.6(Covington/Newport/Dayton, etc.)
Region #5 27.2 33.8 38.7 37.3 42.2(Lexington/Frankfort/Winchester,etc.)
Region #6 22.8 29.7 34.4 33.3 36.4(Richmond/London/Williamsburg,etc.)
Region #7 24.9 30.6 35.9 34.7 39.6(Ashland/Maysville/Morehead. etc.)
Region #8 21.5 28.7 33.4 32.8 33.8(Pikeville/Hazard/Prestonsburg, etc.)
Entire State 24.3 31.2 36.2 34.7 39.0
BEST COPY AVAILABLE 7
/3

TABLE 2 displays the means and standard deviations of the school scores after they were
averaged for the 5-year period and broken down by Service Region. The data also reflect the
lowest and highest scores posted for schools in each region. Region 5 (Lexington/Frankfort/
Winchester, etc.) has the highest mean score (M = 35.9), while Region 8 (Pikeville/Hazard/
Prestonsburg, etc.) has the lowest mean score (M = 30.0). Region 1 (Paducah/Henderson/
Murray, etc.), Region 2 (Bowling Green/Owensboro/Elizabethtown, etc.), Region 4 (Covington,
Newport, Dayton, etc.), Region 5 (Lexington/Frankfort/ Winchester, etc.), and Region 7
(Ashland/Maysville/Morehead, etc.) have mean scores that equal or exceed the State average.
Region 3 (Louisville/Jefferson Co., etc.), Region 6 (Richmond/London/Williamsburg, etc.), and
Region 8 (Pikeville/Ha7Ard/Prestonsburg, etc.) fall below the State average. The school with the
lowest average level of performance for the 5-year period (M = 15.8) was in Region 3 (Louisville/
Jefferson Co., etc.). Region 5 had the school with the highest average level of performance
(M = 70.5) during the same span of years.
The descriptive data in TABLE 2 clearly suggest regional disparities, but they do not tell
which regions had significantly lower or higher levels of school performance than another. A
pairwise multiple comparison of the regional means is needed to find this out.' Looking at the
negative differences (TABLE 3), Region 3 scores significantly lower than either Region 4 or
Region 5 (the mean differences are -3.8 and -4.4 respectively). Region 6 scores lower thanfour
other regions--Regions 1, 2, 4, and 5, while Region 8 scores lower than these same four regions
and also lower than Region 7. Clearly, by this analysis, Region 6 and Region 8 on average have
'Since the variances were unequal, this analysis employed the statistical application ofTamhane's T2 method of testing the pairwise multiple comparison of the group means.
8
1 4

TABLE 2
SCHOOL ACADEMIC INDEX SCORES AVERAGED BY REGIONFROM 1992-93 TO 1996-97
DescriptiveMeasures
Regions ofthe State
Numberof
Schools.
(N)
RegionalMeanScore(M)
StandardDeviation
(SD)
Within-Region RangeHighestSchoolScore
LowestSchoolScore
Region #1 135 33.7 5.6 20.1 47.2(Paducah/Henderson/Murray, etc.)
Region #2 154 34.3 5.8 18.2 52.7(Bowling Green/Owensboro/Elizabethtown. etc.)
Region #3 108 31.4 8.4 15.8 54.8(Louisville/Jefferson Co., etc.)
Region #4 137 35.2 7.3 16.0 60.4(Covington/Newport/Dayton, etc.)
Region #5 154 35.9 7.9 18.1 70.5(Lexinoon/Frankfort/Winchester. etc.)
Region #6 179 31.3 6.4 19.9 52.8(Richmond/London/Williamsburg, etc.)
Region #7 100 33.1 6.7 20.6 58.2(Ashland/Maysville/Morehead. etc.)
Region #8 163 30.0 5.7 19.0 53.0(Pikeville/Hazard/Prestonsburg. etc.)
(ENTIRE STATE) 1,130 33.1 7.0 15.8 70.5
9
BEST COPY AVAILABLE 1 5
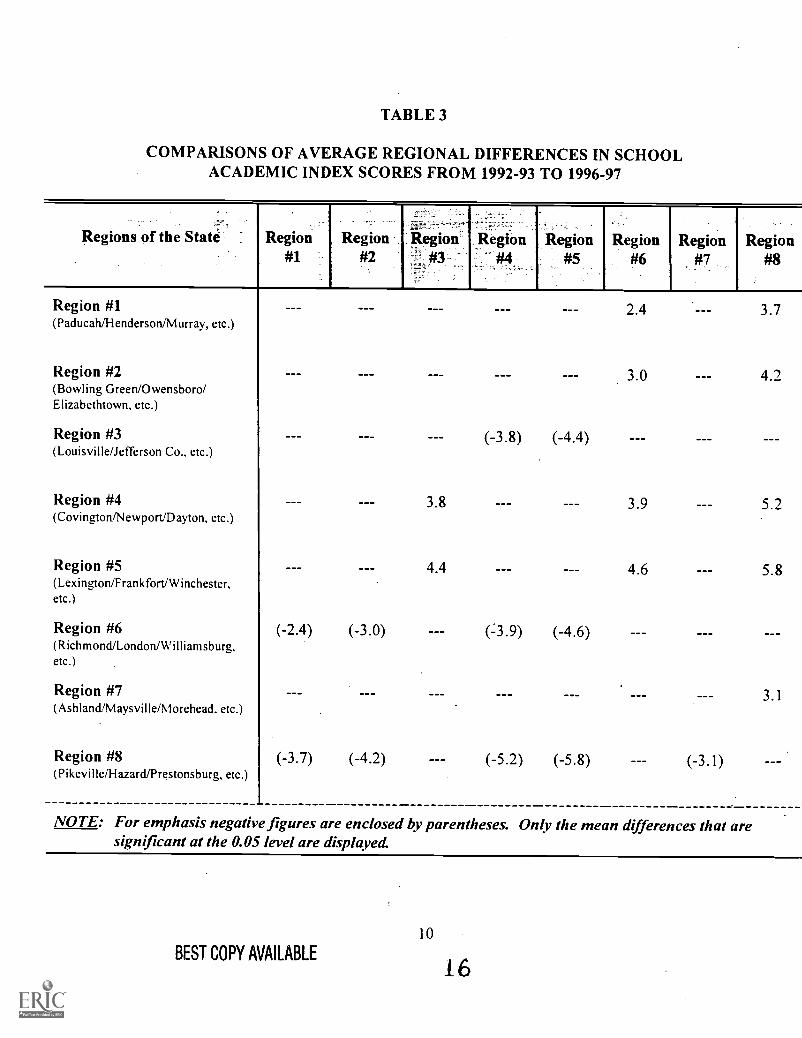
TABLE 3
COMPARISONS OF AVERAGE REGIONAL DIFFERENCES IN SCHOOLACADEMIC INDEX SCORES FROM 1992-93 TO 1996-97
Regions of the State Region#1
Region#2
kegion#3
Region #1(Paducah/Henderson/Murray, etc.)
Region #2(Bowling Green/Owensboro/Elizabethtown, etc.)
Region #3(Louisville/Jefferson Co., etc.)
Region #4(Covington/Newport/Dayton, etc.)
Region #5( Lex ington/F rankfort/Winchester,etc.)
Region #6(Richmond/London/Williamsburg,etc.)
Region #7(Ashland/Maysville/Morehead. etc.)
(-2.4) (-3.0)
Region #8 (-3.7)
(Pikeville/Hazard/Prestonsburg, etc.)(-4.2)
3.8
4.4
Region#4
Region#5
Region#6
Region#7
Region#8
(-3.8) (-4.4)
(=3.9) (-4.6)
(-5.2) (-5.8)
2.4
3.0
3.9
4.6
(-3.1)
3.7
4./
5.2
5.8
3.1
NOTE: For emphasis negative figures are enclosed by parentheses. Only themean differences that aresignificant at the 0.05 level are displayed
10
BEST COPY AVAILABLE16

lower scores than a majority of the other regions. According to the multiple comparison analysis,
the mean scores of Regions 1, 2, 4, 5, and 7 are not surpassed by any other region; and the
differences between these regions are not significant.
This study will not attempt to investigate why these regional disparities exist, but a partial
explanation can be suggested for future research. The relative advantage of Region 4 (Covington/
Newport/Dayton, etc.) and Region 5 (Lexington/Frankfort/Winchester, etc.) could be owing to
the high proportion of metropolitan (especially suburban) schools. Region 3 (Louisville/Jefferson
Co., etc.) is totally metropolitan but many of its schools are also inner-city. This difference may
be sufficient to account for the lower average score in Region 3 compared with Region 4 and
Region 5. The lower performance of schools in Region 6 (Richmond/London/Williamsburg, etc.)
and Region 8 (Pikeville/Ha7ard/Prestonsburg, etc.) require an alternative explanation. These
regions have the highest proportion of rural schools in the State. These are also the regions with
the lowest high school graduation rates and the lowest median household incomes (Reeves,
1998).
The above comparisons used the school Academic Index scores averaged by region, from
1992-93 to 1996-97. A different way to compare the regions over the same years is to look at
changes in scores that indicate differences in the mean or average amount of gain. This is
especially pertinent for determining if a "widening gap" between the regions is actually coming
about. As stated previously, two approaches were used to address this issue. The first approach
was to calculate the simple mean difference in scores between the first and the fifth year. The
second approach calculated the difference between the average score of the first two years and the
average score of the last two years. Using these two approaches and the multiple comparison
11
analysis produced strikingly different results.'
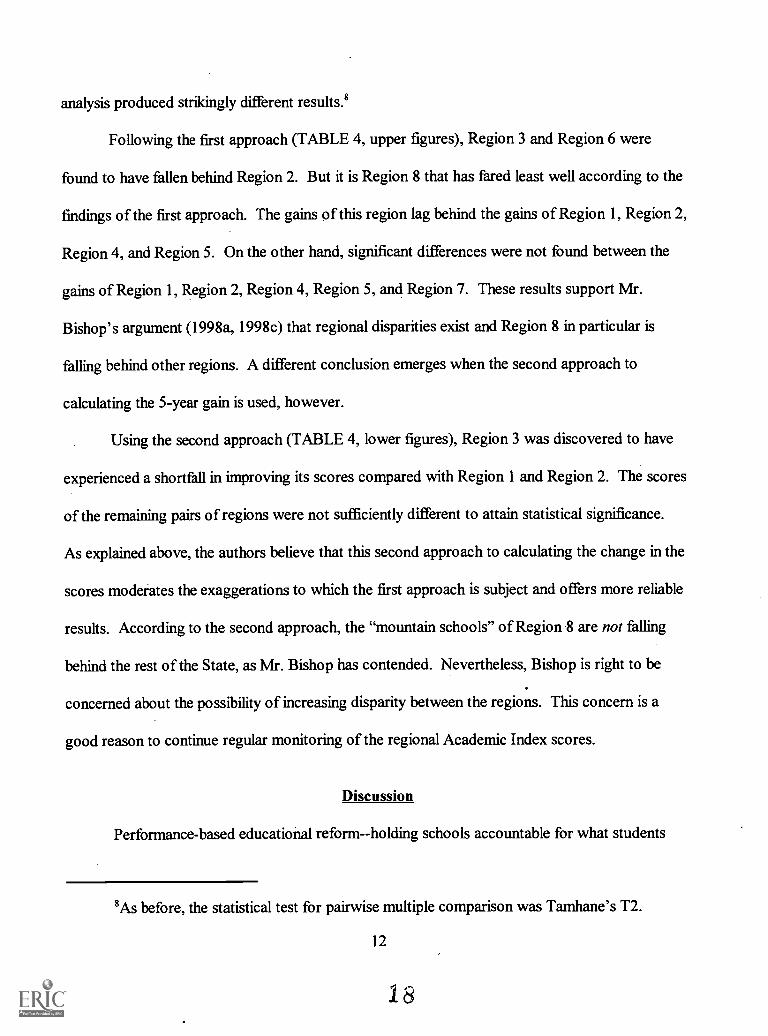
Following the first approach (TABLE 4, upper figures), Region 3 and Region 6 were
found to have fallen behind Region 2. But it is Region 8 that has fared least well according to the
findings of the first approach. The gains of this region lag behind the gains of Region 1, Region 2,
Region 4, and Region 5. On the other hand, significant differences were not found between the
gains of Region 1, Region 2, Region 4, Region 5, and Region 7. These results support Mr.
Bishop's argument (1998a, 1998c) that regional disparities exist and Region 8 in particular is
falling behind other regions. A different conclusion emerges when the second approach to
calculating the 5-year gain is used, however.
Using the second approach (TABLE 4, lower figures), Region 3 was discovered to have
experienced a shortfall in improving its scores compared with Region 1 and Region 2. The scores
of the remaining pairs of regions were not sufficiently different to attain statistical significance.
As explained above, the authors believe that this second approach to calculating the change in the
scores moderates the exaggerations to which the first approach is subject and offers more reliable
results. According to the second approach, the "mountain schools" of Region 8 are not falling
behind the rest of the State, as Mr. Bishop has contended. Nevertheless, Bishop is right to be
concerned about the possibility of increasing disparity between the regions. This concern is a
good reason to continue regular monitoring of the regional Academic Index scores.
Discussion
Performance-based educational reform--holding schools accountable for what students
'As before, the statistical test for pairwise multiple comparison was Tamhane's T2.
12
18

TABLE 4
COMPARISONS OF AVERAGE REGIONAL DIFFERENCES IN THE CHANGE INSCHOOL ACADEMIC INDEX SCORES FROM 1992-93 TO 1996-97
Regions of the State Region#1
Region#2
Region#3
Region#4
Region#5
Region#6
Region#7.
Region#8
Region #1(Paducah/Henderson/Murray, etc.)
Region #2(Bowling Green/Owensboro/Elizabethtown, etc.)
Region #3(Louisville/Jefferson Co., etc.)
Region #4(Covington/Newport/Dayton, etc.)
Region #5(Lexington/Frankfort/Winchester,etc.)
Region #6(Richmond/London/Williamsburg,etc.)
Region #7(Ashland/Maysville/Morehead, etc.)
(-3.4)
(-2.2) (-2.8)
(-3.2)
2.2
3.4
2.8
Region #8 (-3.7) (-4.5) (-3.5) (-2.7)(Pikeville/Hazard/Prestonsburg, etc.)
3.7
3.2 4.5
3.5
NOTE: For each comparison above, the upper figure is the simple mean difference in scores, from 1992-93 to1996-97. The lower figure is a mean difference obtained by subtracting the average of the first twoyears from the average of the last two years. For emphasis negative figures are enclosed byparentheses. Only the mean differences that are significant at the 0.05 level are displayed
BEST COPY AVAILABLE

learn--is a nationwide issue (Ladd, 1996; Nelson, 1998). Kentucky has achieved national
prominence because of its highly innovative and comprehensive reform program (Elmore,
Abelmann, & Fuhrman, 1996; Guskey, 1994). The Kentucky Supreme Court decision issued in
June of 1989, which led to the Kentucky Educational Reform Act of 1990, called for "an efficient
system of common schools" (Miller, Noland, & Schaaf, 1990: ix, 2). Among other things, the
characteristics of such an educational system would include: schools that are "substantially
uniform throughout the State" and the provision of "equal educational opportunities to all
Kentucky children." Monitoring regional differences in the performance of schools is a useful
way to assess if these goals are being met. It can help point out if the schools are providing an
education that is "substantially uniform throughout the State." Moreover, it shows indirectly the
degree to which "equal educational opportunity" is being realized across the several regions.
A consequence of this inquiry into regional disparities is that it forces one to be more
precise about what uniformity and equal educational opportunity really mean. If these terms mean
that test scores should be substantially uniform across the State and between the regions, then
according to the results of the present study KERA has not succeeded. The comparisons of
regional mean scores (TABLE 2 and TABLE 3) clearly show that significant differences between
the regions exist. It is quite likely that these differences reflect contextual influences on
education, including the historical circumstances to which Mr. Bishop refers (Bishop, 1998a;
Bishop, 1998b; also Reeves, 1998).
But if by "substantial uniformity" and .'equal opportunity" one implies instead that
constraints on the ability of schools to improve children's performance should be kept to a
minimum, the results obtained above (especially in TABLE 4, lower figures) are less pessimistic.
14
20
The evidence is that all regions are improving and most are keeping pace with one another. It
would be preferable if lower scoring regions, such as Region 6 (Richmond/London/Williamsburg,
etc.) and Region 8 (Pikeville/Hazard/Prestonsburg, etc.), could eventually gain on higher scoring
regions, such as Region 4 (Covington/Newport/Dayton, etc.) and Region 5 (Lexington/Frankfort/
Winchester, etc.). This is a goal that should be pursued diligently by the State. -
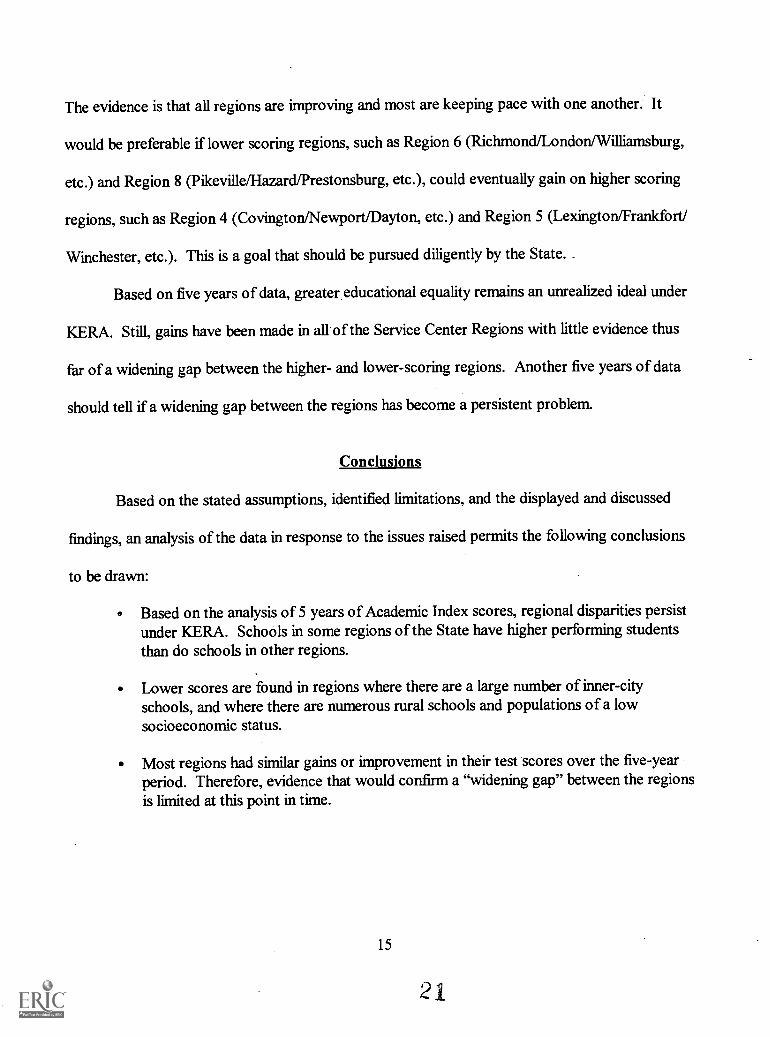
Based on five years of data, greater educational equality remains an unrealized ideal under
KERA. Still, gains have been made in all ofthe Service Center Regions with little evidence thus
far of a widening gap between the higher- and lower-scoring regions. Another five years of data
should tell if a widening gap between the regions has become a persistent problem.
Conclusions
Based on the stated assumptions, identified limitations, and the displayed and discussed
findings, an analysis of the data in response to the issues raised permits the following conclusions
to be drawn:
Based on the analysis of 5 years of Academic Index scores, regional disparities persistunder KERA. Schools in some regions of the State have higher performing studentsthan do schools in other regions.
Lower scores are found in regions where there are a large number of inner-cityschools, and where there are numerous rural schools and populations of a lowsocioeconomic status.
Most regions had similar gains or improvement in their test scores over the five-yearperiod. Therefore, evidence that would confirm a "widening gap" between the regionsis limited at this point in time.
15

References
Bishop, B. (February 15, 1998a). "Equality Was Heart of Reform." Lexington Herald-Leader,Lexington, KY: 16 (44), Fl.
Bishop, B. (March 1, 1998b). "Education Deficit Stymies Region." Lexington Herald-Leader,Lexington, KY: 16 (58), Fl.
Bishop, B. (April 26, 1998c). "Money Has Not Filled the Gap for E. Kentucky Schools."Lexington Herald-Leader, Lexington, KY: 16(114), Fl.
Brint, S. (1998). Schools and Societies. Thousand Oaks, CA: Pine Forge Press.
Elmore, R.F., Abelmann, C.H., & Fuhrman, S.H. (1996). "The New Accountability in StateEducation Reform: From Process to Performance." Pp. 65-98 in Holding SchoolsAccountable: Performance-Based Reform in Education, edited by H.F. Ladd. Washington,DC: The Brookings Institution.
Greenberg, E. J., & Teixeira R.A. (1995). "Nonmetro Student Achievement on Par with Metro."Rural Development Perspectives. 10(3), 17-23.
Guskey, T.R., ed. (1994). High Stakes Performance Assessment: Perspectives on Kentucky'sEducational Reform. Thousand Oaks, CA: Corwin Press.
Ladd, H.F., ed. (1996). Holding Schools Accountable: Performance-Based Reform in Education.Washington, DC: The Brookings Institution.
Miller, M.H., Noland, K., & Schaaf, J. (1990). A Guide to the Kentucky Education Reform Actof 1990. Frankfort, KY: Legislative Research Commission.
Nelson, W.W. (1998). "The Naked Truth about School Reform in Minnesota." Phi Delta Kappan.79(9), 679-684.
Reeves, E.B. (1998). Do Contextual Effects Bias Kentiicky School District Accountability IndexScores? Occasional Research Paper, no. 1 (April, 1998). Morehead, KY: R & D Centerfor Students, Schools, and Communities, Morehead' State University.
Acknowledgments
The authors would like to thank Karen Hamilton, Peggy Reeves, and Phil Shay for reading anearlier draft of this paper and making helpful comments. Kevin Calhoun created the map of theRegional Service Regions shown in FIGURE A.
16
2 2
Reproduction Release
U.S. Department of EducationOffice of Educational Research and Improvement
(OERI)National Library of Education (NLE)
Educational Resources Information Center (ERIC)
Reproduction Release(Specific Document)
I. DOCUMENT IDENTIFICATION:
http://ericfac.piccard.csc.com/reprod.html
TM029124
ERIC
Title: Regional Disparities in Kentucky Academic Index Scores
Author(s): Edward B. Reeves and Harold Harty
Corporate Source:Morehead State University
Publication Date:
May 1998
II. REPRODUCTION RELEASE:
In order to disseminate as widely as possible timely and significant materials of interest to the educational community, documentsannounced in the monthly abstract journal of the ERIC system, Resources in Education (RIE), are usually made available to usersin microfiche, reproduced paper copy, and electronic media, and sold through the ERIC Document Reproduction Service(EDRS). Credit is given to the source of each document, and, if reproduction release is granted, one of the following notices is
affixed to the document.
If permission is granted to reproduce and disseminate the identified document, please CHECK ONE of the following three options
and sign in the indicated space following.
1 of 3 6/12/98 10:54 AM
2eproduction Release http://ericfac.piccard.csc.com/reprod.html
The sample sticker shown below will beaffixed to all Level 1 documents
The sample sticker shown below will be affixed to allLevel 2A documents
The sample sticker shown below will be affixed to alLevel 2B documents
z
PERMISSION 'TO REPRODU('E ANDoissININATETITI3 MATERIAL HAS
BEEN GRAN t
'TOM EDMVIIONAL REA:WM:ENINFORWTION CENTER WRIC)
PER1441SSION TO REPRODUCE ANDDISSEMINATE THIS MATERIAL IN
MICROFICHE, AND IN ELECTRONIC MUM.-FoR ERIC COLLE(MON SUBS,WEIERS ONLY,
HAS BEEN GIt NfliD 1W
TOM: EDUCATIONAL KESOURCESINFORMATION CENTER. H.T.I0
PERMISSION TO R.EisRODUCE ANDD/SSEMINATE THIS MATERIAL IN
MICROFICHE ONLY MS "N CipANTED 111
TO THE EDUCATIONAL RESOURCESINFORMATION CENTER (ERIC)
Level 1 Level 2A Level 2B
Check here for Level I release, permittingreproduction and dissemination in microficheor other ERIC archival media (e.g. electronic)
and paper copy.
Check here for Level 2A release, permitting reproductionand dissemination in microfiche and in electronic media
for ERIC archival collection subscribers only
Check here for Level 28 release, permittingreproduction and dissemination in microfiche only
Documents will be processed as indicated provided reproduction quality permits.If permission to reproduce is granted, but no box is checked, documents will be processed at Level 1.
I hereby grant to the Educational Resources Information Center RIC) nonexclusive permission to reproduce anddisseminate this document as indicated above. Reproduction from the ERIC microfiche, or electronic media by persons otherthan ERIC employees and its system contractors requires permission from the copyright holder. Exception is made fornon-profit reproduction by libraries and other service agencies to satisfr information needs of educators in response todiscrete inquiries.
Signahire
Z:62LI.o/Printed Name/Position/Title:
Edward B. Reeves, Director
Organization/Address:
&D Center for Students, Schools,and Communities
orehead State Universityorehead, Ky 40351
Telephone:
606/783-2546Fax:
606/783-5070
E-mail Address:
6-12-98
III. DOCUMENT AVAILABILITY INFORMATION (FROM NON-ERIC SOURCE):
If permission to reproduce is not granted to ERIC, or, if you wish ERIC to cite the availability of the document from anothersource, please provide the following information regarding the availability of the document. (ERIC will not announce a documentunless it is publicly available, and a dependable source can be specified. Contributors should also be aware that ERIC selectioncriteria are significantly more stringent for documents that cannot be made available through EDRS.)
Publisher/Distributor:
Address:
Price:
2 of 3 6/12/98 10:54 AM