23. data report: a test temperature, pressure and c t …
TRANSCRIPT

Tréhu, A.M., Bohrmann, G., Torres, M.E., and Colwell, F.S. (Eds.)Proceedings of the Ocean Drilling Program, Scientific Results Volume 204
23. DATA REPORT: A TEST OF THE TEMPERATURE, PRESSURE, AND CONDUCTIVITY TOOL PROTOTYPE AT HYDRATE RIDGE1
William Ussler III,2 Charles K. Paull,2 Paul McGill,2 Derryl Schroeder,3 and Dean Ferrell3
ABSTRACT
A prototype tool to continuously monitor temperature, pressure, andconductivity (TPC) changes during Ocean Drilling Program (ODP) cor-ing was used successfully 107 times at Hydrate Ridge during Leg 204.
TPC sensors are located on the face of the standard ODP advancedpiston corer piston, and the data logging electronics and batteries areembedded within the piston. This tool operates autonomously and re-quires little shipboard attention. The objective is to measure the tem-perature and pressure changes that occur in gas-rich and gas hydrate–bearing cores during collection and ascent to the surface and to usethese data to learn about the processes that occur inside a core duringrecovery. Gas exsolution and expansion during core recovery alter boththe temperature and pressure conditions within the core barrel, and theamount of gas in the core affects where these changes occur. The corecollection process dramatically affects pressure inside the core barrel,which reduces core temperature and changes gas saturation conditions.Families of temperature-time curves generated from TPC data show dis-tinct cooling anomalies associated with core pullout and with move-ment of the core through the shallow water column and on the deck ofthe drillship.
Here the performance of the TPC tool and the response of the tool atsites with significant quantities of sediment gas and gas hydrate nearthe seafloor are described.
1Ussler, W., III, Paull, C.K., McGill, P., Schroeder, D., and Ferrell, D., 2006. A test of the temperature, pressure, and conductivity tool prototype at Hydrate Ridge. In Tréhu, A.M., Bohrmann, G., Torres, M.E., and Colwell, F.S. (Eds.), Proc. ODP, Sci. Results, 204: College Station TX (Ocean Drilling Program), 1–41. doi:10.2973/odp.proc.sr.204.112.20062Monterey Bay Aquarium Research Institute, 7700 Sandholdt Road, Moss Landing CA 95039-9964, USA. Correspondence author: [email protected] Ocean Drilling Program, Texas A&M University, 1000 Discovery Drive, College Station TX 77845-9547, USA.
Initial receipt: 28 January 2005Acceptance: 6 February 2006Web publication: 4 September 2006Ms 204SR-112

W. USSLER ET AL.A TEST OF THE TPC TOOL PROTOTYPE 2
INTRODUCTION
In this paper we describe the design and discuss tests conducted dur-ing Ocean Drilling Program (ODP) Leg 204 of the temperature, pressure,conductivity (TPC) downhole tool that has been developed to measurethe effects of expanding gas within the ODP advanced piston corer(APC) assembly during core recovery and that may be used extensivelyduring the Integrated Ocean Drilling Program.
Catwalk Core Temperatures
During more than a quarter-century of Deep Sea Drilling Project(DSDP) and ODP drilling, vigorous gas expansion and anomalouslycold temperatures in cores from continental margins have been com-monly observed. Compositional data clearly indicate that the expand-ing gas is usually dominated by methane; however, very little is knownabout how much methane was actually in these sediments before re-covery (e.g., Paull and Ussler, 2001). Thermal observations have in-cluded cores feeling cold (e.g., Leg 146 Site 889 [Westbrook, Carson,Musgrave, et al., 1994]) and the occurrence of frozen pore waters alongthe interior wall of the core liner (e.g., Leg 164 [Paull, Matsumoto, Wal-lace, et al., 1996]). A few investigations have quantified these observedthermal anomalies by inserting thermistors into the core after it hasbeen removed from the core barrel and delivered to the catwalk (Leg164 Site 994 [Paull, Matsumoto, Wallace, et al., 1996]) or to the corelaboratory immediately after core splitting (temperatures as low as –2°Chave been recorded; e.g., Leg 66 Site 490 [Watkins, Moore, et al., 1982]and Leg 146 Site 889 [Westbrook, Carson, Musgrave, et al., 1994]) andby scanning core liner on the catwalk with infrared (IR) imaging cam-eras (e.g., Leg 201 [D’Hondt, Jørgensen, Miller, et al., 2003] and Leg 204[Tréhu, Bohrmann, Rack, Torres, et al., 2003]). These “catwalk core tem-perature” measurements show that some core sections arrived on deckat distinctly lower temperatures (5°–10°C cooler) than other cores re-covered from the same drill site. Moreover, when in the core recoveryprocess these cooler temperatures are generated is largely unknown.
Three processes can cause a temperature decrease in sediment coresduring their ascent to the sea surface: (1) gas expansion, (2) gas exsolu-tion, and (3) gas hydrate decomposition. Predictions about the temper-ature changes that will occur in gassy sediments (with or without gashydrates) during core recovery based on simple thermodynamic calcu-lations (Ussler et al., 2002) indicate that these changes are of the rightorder of magnitude and direction.
Thermal modeling has shown that cores which exsolve gas duringtheir ascent to the surface have distinct ascent temperature profiles (Fig.F1) (Ussler et al., 2002). Ascent temperature profiles track profiles forgas-free cores until gas saturation occurs and exsolution commences.Free gas coming out of solution along the length of the core buoyantlyrises within the core barrel (Fig. F2). As soon as free gas is trapped at thetop of the core barrel, temperatures should drop as a result of gas exso-lution and gas expansion (Fig. F1B). Most of the gas exsolution and ex-pansion, and thus the largest temperature changes occur in the upperwater column. In situ gas concentration can be calculated using thepressure and temperature of the inflection in ascent temperature pro-files and the methane gas solubility model of Duan et al. (1992), assum-ing that no gas was introduced during the coring process.
-10 0 10 20 30 40 500 10 20 30 40 50 Low High
CBA Core temperature (°C) Relative conductivityCore temperature (°C)
0
1000
2000
3000
4000
Dep
th (
mbs
l)
Seafloor
175 mM
139 mM
88 mM
a
b
c
Seafloor Seafloor
Hydrographic profile
Geothermal gradient
F1. Radial heat transfer models, p. 15.
Headspaceaccumulationof gas
Buoyantrise of gas
TP
APC piston
CS
F2. APC core barrel, p. 16.

W. USSLER ET AL.A TEST OF THE TPC TOOL PROTOTYPE 3
Previous TPC Tool Deployments
The TPC tool was used previously during Leg 201 at Site 1226 (Ussleret al., 2006). Because no observations of core degassing or anomalouslylow core temperatures were made at this site, the cores contain sulfatethroughout, and the measured methane gas concentrations were low,the in situ gas concentrations at this site are believed to be considerablyless than those needed to achieve gas saturation of the pore water dur-ing core recovery (D’Hondt, Jørgensen, Miller, et al., 2003). Thus, nogas exsolution from the sediments should have occurred during core as-cent to the surface at Site 1226. Measurements at Site 1226 were ex-pected to provide background data suitable for determining theresponse of the TPC tool in gas-poor sediments without the additionalcomplexity of thermal and pressure effects associated with the presenceof gas. Surprisingly, some ascent curves showed thermal phenomenathat would have been anticipated for gas-bearing cores. Understandingthe source of this gas is critical for interpreting TPC data. A geologicalsource for the observed gas has been excluded because sediment gasdata for Site 1226 show no indication of significant quantities of meth-ane gas in these sediments (D’Hondt, Jørgensen, Miller, et al., 2003).
Conductivity measurements at Site 1226 (Ussler et al., 2006) indicatethat in every case gas was trapped in headspace at the face of the TPCtool during the initial deployment of the tool downhole. In many cases,the conductivity sensor indicated that this gas headspace disappearedduring descent and reappeared during ascent, albeit at a slightly shal-lower depth. This suggests that gas completely dissolved during thelong descent to the seafloor (~3350 meters below sea level) and then ex-solved during ascent. There are no cases where the initial headspacedoes not return during ascent, whereas in some cases the gas headspacenever completed disappeared. Thus, the size of the initial trapped gasheadspace was quite variable, but it was always present during the APCcoring runs at Site 1226.
Trapping a gas headspace at the face of the TPC tool when the tool isfirst deployed is probably an inevitable consequence of the coring pro-cedure (Ussler et al., 2006). When the top of the drill string is openedfor insertion of the APC corer, the level of seawater in the pipe drainsdown from the rig floor to sea level, a distance of ~11.2 m. When thedrill pipe is reassembled and connected to the mud pumps, as much as~100 L of atmospheric gas could become trapped within the drill pipe.This trapped gas is circulated down the hole by the mud pumps andeventually should exit at the seafloor. However, the conductivity datasuggest that sufficient amounts of gas remain trapped and/or dissolvedin the seawater adjacent to the TPC tool to affect the conductivity sen-sor. This gas may also have contributed to the thermal signal measuredby the TPC thermistor. Entrainment of atmospheric gases into the cor-ing system is also a likely explanation for some runs of the pressure coresampler (PCS) during Leg 201 coming up with pressurized air (J. Dick-ens, pers. comm., 2003).
In the Leg 201 Initial Reports volume (D’Hondt, Jørgensen, Miller, etal., 2003) the TPC tool was renamed the APC-Methane (APC-M) tool,and this naming was also used in the Leg 204 Initial Reports volume(Tréhu, Bohrmann, Rack, Torres, et al., 2003). Although this fits betterwith the naming convention used by ODP, this is an unfortunate mis-nomer because the tool does not detect methane or measure its concen-tration. Because the original National Science Foundation proposal andprevious publications (Ussler et al., 2000, 2001, 2002, 2003) described

W. USSLER ET AL.A TEST OF THE TPC TOOL PROTOTYPE 4
the tool as the TPC, we will continue using this name because of itsmore accurate description of what is measured.
METHODS
Temperature, Pressure, and Conductivity Tool
The TPC tool is designed to continuously record temperature, pres-sure, and conductivity at the face of a modified ODP APC piston assem-bly (Figs. F2, F3, F4) during deployment, core collection, and recovery.The APC piston was modified to contain the TPC tool components (Fig.F3). The tool has a maximum design pressure of 10,000 psi, which cor-responds to ~6.9 km total hydrostatic depth.
Making measurements at the piston face allows for standardizationof the effects of cooling during core ascent. This location was chosenfor practical reasons: (1) the APC piston could be easily modified to in-corporate TPC sensors; (2) the data logging electronics and batterycould be housed in the existing piston corer subassembly, making thisan autonomous downhole tool; (3) no special downhole tool runswould be necessary to collect TPC data, causing little disruption to thetempo of coring operations; and (4) gas can collect in a recess on thepiston face, making electrical conductivity measurements possible.
The conductivity sensor is designed to detect the formation of gasheadspace by taking advantage of the large contrast in electrical proper-ties between a gas phase and wet sediment (Fig. F2). This informationaids in analyzing the temperature and internal pressure data obtainedduring core ascent by providing an independent confirmation of head-space formation.
Sensors
The temperature and conductivity sensors are recessed in shallowwells on the piston face for mechanical protection and for the accumu-lation of headspace gas (Figs. F2, F3, F4). The pressure port opens di-rectly onto the face of the APC piston. The sensors are threaded into thesensor head for ease of replacement.
Temperature is measured using a YSI 55036 thermistor encapsulatedwithin a thin-walled stainless steel probe (3/16 in diameter × 1/4 inlong) with a pressure rating of 10,000 psi (Logan Enterprises, West Lib-erty, Ohio). The time constant for this thermistor probe is 1.5 s, and theaccuracy is ±0.05°C. Pressure is measured using a transducer designed foruse in corrosive downhole environments and for temperature stability(model 211-37-520; Paine Corporation, Seattle, Washington). Measure-ment error is ±0.15% of the full-scale reading of 10,000 psi. The conduc-tivity probe is a miniature bulkhead connector with an inconel bodyand three gold-plated 0.040-in diameter Kovar pins (PMS-series; KemlonProducts and Development, Pearland, Texas). Pin spacing is 3.2 mm.
Electronics
Design objectives for the electronics included minimal power con-sumption, low component count, 12-bit or better analog to digital (A/D) resolution, low long-term sensor drift, vibration tolerance, largeamounts of onboard nonvolatile data storage, and ease of programmingand component replacement. Three elements comprise the electronics
Lithium thionyl chloride batteriesPersistor
CF1Signal
conditioningPower
management
25"
End view
2.375"
TP
CS
DP
PP
F3. APC piston and TPC tool, p. 17.
Thermistor probe
Conductivity probesPressuresensor port
RS-232 data port
F4. APC piston, p. 18.

W. USSLER ET AL.A TEST OF THE TPC TOOL PROTOTYPE 5
package: (1) the sensor conditioning electronics, (2) an off-the-shelf mi-croprocessor unit, and (3) the batteries. Low-power 3.3-V CMOS semi-conductor components were selected to minimize current drain. Thediscrete components are surface-mounted on a narrow multilayerprinted circuit board that supports the detachable microprocessor unit.To prevent polarization of the conductivity electrodes, the conductivitysensor is excited using an alternating-current signal generated by a sim-ple oscillator circuit. After signal conditioning, the analog signals fromthe sensors are fed into either a Maxim MAX147 12-bit A/D converter(thermistor and conductivity) or a Cirrus CS5509 16-bit A/D converter(pressure). These A/D converters are connected to a Persistor CF1 micro-processor unit via the queued serial peripheral interface implementedby the onboard Motorola 68338 central processing unit. Data are storedin an onboard 48-MB CompactFlash card hardwired to the CF1 micro-processor unit. Communications with the CF1 occur on the deck of theship through an RS-232 interface. The CF1 is programmed in C lan-guage, using the Metrowerks CodeWarrior programming environment.Temperature, pressure, and conductivity data were collected at 1-s inter-vals throughout tool deployment.
Power is supplied by two double-C lithium thionyl chloride batterieswithin a 1 in diameter × 9 in long battery pack that provides 7.3 V, witha 100-mA rating. The electronics/battery assembly was designed for noless than 100 hr of continuous operation.
Data transfer can be accomplished on deck while the TPC tool is in-stalled in the APC drill string through an RS-232 communications porton the face of the piston. This data port is a three-pin keyed bulkheadconnector (PMJ-series; Kemlon Products and Development, Pearland,Texas). During coring operations this port is O-ring sealed with a face-plate that is easily removed for access (Fig. F4).
Data Reduction
Temperature
Raw TPC temperature data were converted to thermistor resistance(R, ohms) using either fifth- or sixth-order polynomial equations fitwith empirically derived calibration coefficients, which are summarizedin Table T1. Temperature in K was calculated from these thermistor re-sistance values using the Steinhart and Hart relationship (Anonymous,1980):
1/T = A + [B × (ln R)] + [C × (ln R)3] (1)
The manufacturer-supplied Steinhart-Hart coefficients for the ther-mistors used during Leg 204 are summarized in Table T2.
Pressure
One of two pressure transducers was used for each particular site.Both transducers had nearly identical electrical response; thus, the sameempirically derived constant of 0.1812 psi/bit was used to convert rawbit count data to pressure (psig). During some tool runs an offset fromzero was obtained, which was subtracted during data analysis. Spuriouspressure data were rare, but obvious single-point anomalies and noisethat occurred when the tool was on the deck of the ship were elimi-nated from the data sets analyzed.
T1. Polynomial coefficients, p. 31.
T2. Steinhart-Hart equation coeffi-cients, p. 32.

W. USSLER ET AL.A TEST OF THE TPC TOOL PROTOTYPE 6
Because local hydrographic profiles were not obtained during Leg204, an average seawater density (1031 kg/m3) appropriate for the lati-tude and water depth of Leg 204 drilling was computed from an esti-mate of seafloor pressure computed using a MATLAB m-file (see the“Appendix,” p. 14) based on the UNESCO 1980 equation of state forseawater (Saunders, 1981). Pressure measurements from the TPC tool(in psig) were converted to depth using this value of average seawaterdensity.
Conductivity
Because the conductivity circuit was designed to avoid polarizationand electrode corrosion in seawater, measured values oscillate rapidlybetween two extreme values. A change in the difference between theminimum and maximum values indicates a change in the conductivityof the medium contacting the electrodes. Conductivity data for eachsensor were normalized by subtracting the mean value from each datapoint and then taking the absolute value. Visual calibration of the con-ductivity signal was accomplished during Monterey Bay Aquarium Re-search Institute (MBARI) remotely operated vehicle (ROV) dive T-2075in October 2001, using an actual TPC tool assembly. Large values ofnormalized conductivity correspond to gas headspace, and small valuescorrespond with the presence of seawater at the sensor electrodes.
Coreline Measurements
At four of the six coring sites where the TPC tool was used, measure-ments of the length of wireline deployed as a function of time, referredto as coreline (Cline) data by the drilling engineers on the JOIDES Reso-lution, were obtained from the drill rig instrumentation system. Theseindependent measurements of wireline length proved invaluable dur-ing analysis of TPC pressure data because in contrast with the TPC de-ployment during Leg 201 (Ussler et al., 2006), large pressure excursionsoccurred during APC core insertion and removal, making pressure anunsuitable proxy for depth during these time periods.
RESULTS
The TPC tool was deployed in six holes during Leg 204 (Fig. F5)(Holes 1244E, 1245C, 1247B, 1250D, 1251D, and 1252A). Summaries ofdrilling data for each hole in which the TPC was deployed are listed inTables T3, T4, T5, T6, T7, and T8. APC cores that have TPC data arehighlighted in yellow in these tables. In four holes (Holes 1244E,1245C, 1247B, and 1250D) TPC tool deployment was interleaved withother tool runs (e.g., the PCS and Fugro pressure corer), whereas deploy-ments in Holes 1251D and 1252A were continuous. Raw and derivedtemperature, pressure, and conductivity data and Cline measurementsare compiled in data sets (see “Supplementary Material”).
Temperature Time Series
Temperature data for each hole are plotted vs. time in Figure F6A–F6F. Comparison with mudline temperatures obtained from APC tem-perature (APCT) and Davis-Villinger Temperature-Pressure Probe(DVTPP) tool measurements (Tréhu, Bohrmann, Rack, Torres, et al.,
1200
1100
1000
900
800
Site 1244
Site 1251
Site 1245
Site 1246
Site 1250
Site 1249
Site 1247
44°36'N
44° 33'
Site1248
Site 1252
Ant
iclin
e A
Ant
iclin
e B
SHR
0 1 2
Pinnacle
125°09'W 125° 06' 125° 03'
km
F5. Leg 204 location map, p. 19.
T3. Drilling data, Hole 1244E, p. 33.
T4. Drilling data, Hole 1245C, p. 35.
T5. Drilling data, Hole 1247B, p. 37.
T6. Drilling data, Hole 1250D, p. 38.
T7. Drilling data, Hole 1251D, p. 39.
T8. Drilling data, Hole 1252A, p. 41.
0
5
10
15
20
0
4H
5H
7H 9H10H
12H13H
14H 16H
17H
18H
19H
A
1H 2H
4H
5H 6H7H 9H
10H
11H12H
13H
14H
B
0
5
10
15
20
1H
2H 3H
5H
6H 7H
8H9H
10H
11H12H
13H14H
C
1H
2H
3H
4H
6H
7H
8H
9H
10H11H
12H14H
D
0
5
10
15
20
11H 13H
14H
15H
16H 17H
18H
19H
20H
12H
Hole 1251D
Hole 1247B
Hole 1244E
Hole 1250D
Hole 1245C
Tem
pera
ture
(°C
)T
empe
ratu
re (
°C)
Tem
pera
ture
(°C
)
Hole 1252A
1H 2H3H
4H
5H
6H
7H 8H
9H
10H
11H
12H
13H
14H
Elapsed time (s) Elapsed time (s)
E F
2 × 10⁴ 4 × 10⁴ 6 × 10⁴ 0 2 × 10⁴ 4 × 10⁴ 6 × 10⁴
0 2 × 10⁴ 4 × 10⁴ 6 × 10⁴ 0 2 × 10⁴ 4 × 10⁴ 6 × 10⁴
0 2 × 10⁴ 4 × 10⁴ 6 × 10⁴ 0 2 × 10⁴ 4 × 10⁴ 6 × 10⁴
F6. Temperature-time data, p. 20.

W. USSLER ET AL.A TEST OF THE TPC TOOL PROTOTYPE 7
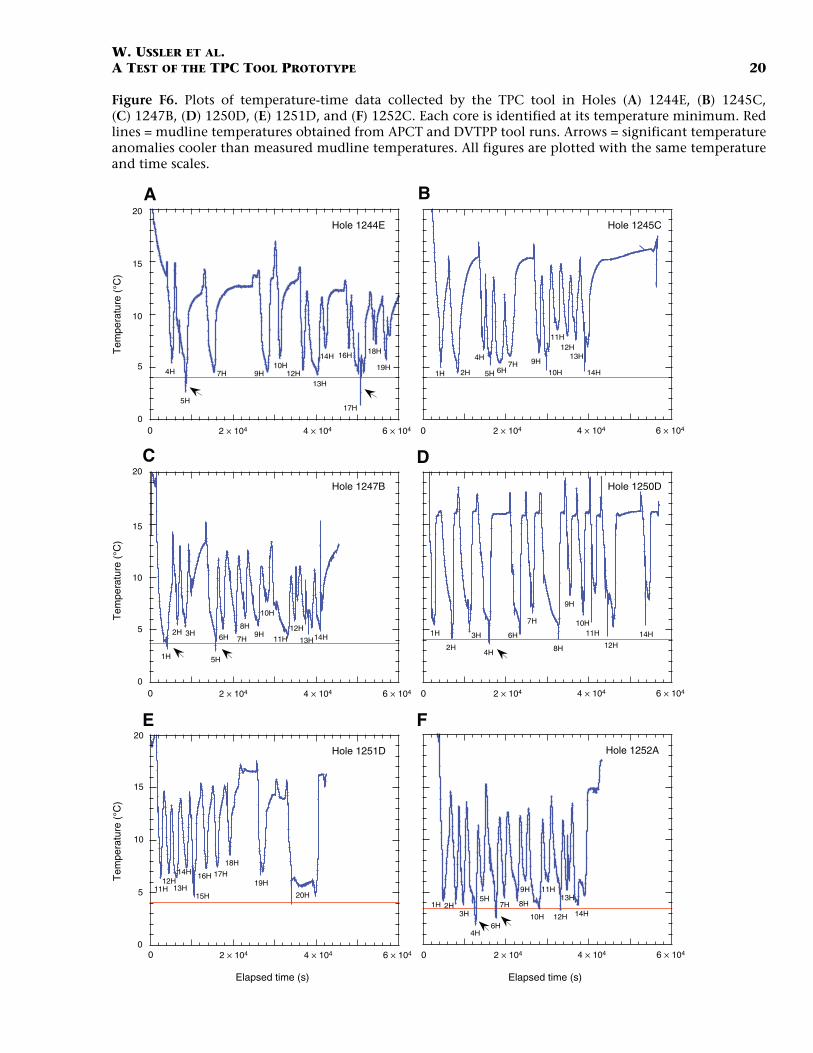
2003) show that in seven runs temperatures inside the APC core barrelat the face of the TPC piston are significantly cooler (up to 2.6°C lower).These cooler temperatures (e.g., Cores 204-1244E-5H and 17H, 204-1247B-1H and 5H, 204-1250D-4H, and 204-1252A-4H and 6H) cannotbe explained by thermal equilibration with the coldest bottom water ineach respective hole (3.5°–4.0°C), indicating the possibility that thiscooling is a consequence of gas expansion within the APC core.
Temperature-Depth History
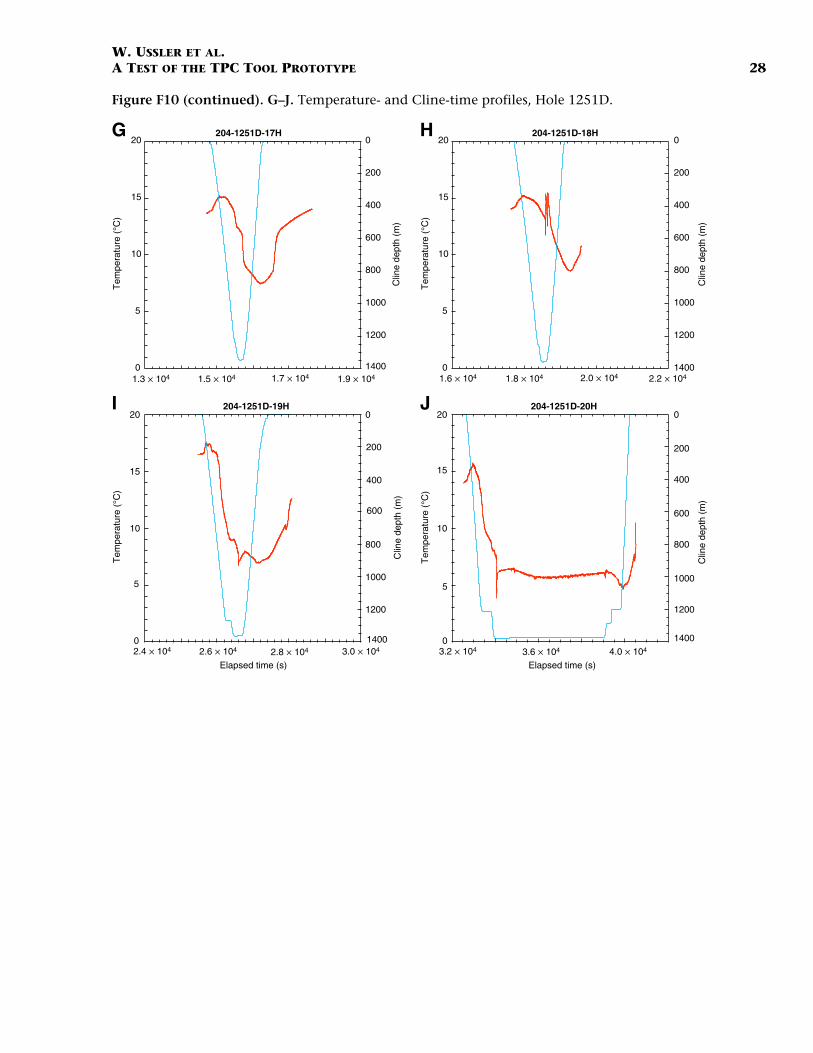
Figures F7, F8, F9, and F10 illustrate the temperature-depth historyfor cores from sites where Cline data provide an independent measureof depth (Holes 1244E, 1245C, 1250D, and 1251D). Huge pressureanomalies (up to ~90 bar) in some cores (e.g., Core 204-1247B-14H)(Fig. F11) make the use of pressure measured within the APC core bythe TPC as a proxy for depth unsuitable (Holes 1247B and 1252A). Thesame range of temperature (20°C) and elapsed time (6000 s) is used forall the core plots in Figures F7, F8, F9, and F10, except where noted.This permits direct visual comparison of cooling rates and magnitude oftemperature anomalies between cores.
Examination of individual temperature-depth plots (Figs. F7, F8, F9,F10) shows that there are two types of cold temperature anomalies: (1)a sharply-defined cooling (ΔT up to ~4°C) that closely follows pullout ofthe core from the sediment (“pullout” anomaly) and (2) a broadly de-fined cooling anomaly (ΔT up to ~2°C) that typically occurs in the shal-low water column (<100 m) or on the deck of the ship (SWC/Danomaly). A pullout anomaly is considered real if two or more datapoints define the peak of the anomaly; single data-point anomalies at-tributed to sensor noise were disregarded. The pullout anomaly gener-ally lasts from 2 to ~10 s, whereas the SWC/D anomaly lasts anywherefrom 10 to 180 s. The initiation of a SWC/D anomaly is defined by achange in the slope of the temperature-time curve toward cooler tem-peratures. Typically, SWC/D anomalies show the coldest temperaturesobtained during the entire temperature history of the core. They occurnear the sea surface and not when the core is passing through the cold-est part of the water column. As indicated in Figure F6, some of theseanomalies are cooler than the coldest part of the water column.
Rates of Core Descent and Ascent
For most of the descent and ascent profiles, rates of wireline move-ment as shown by plots of Cline depth vs. time, are steady (Figs. F7, F8,F9, F10) and similar between successive cores. The generally steadyrates of wireline movement indicate that the thermal signals measuredduring core descent and ascent are the result of the temperature struc-ture of the ocean and thermal changes in the headspace inside the APCand not the consequence of erratic core movement through the watercolumn. This relatively smooth wireline movement simplifies the inter-pretation of temperature and pressure anomalies measured inside thecore barrel by the TPC tool. However, a large source of temperature vari-ation between successive cores results from how long the APC coringtool is kept near the bottom.
0
5
10
15
20 0
200
400
600
800
1000
Clin
e de
pth
(m)
0
5
10
15
20 0
200
400
600
800
1000
Clin
e de
pth
(m)
0
5
10
15
20 0
200
400
600
800
1000
Clin
e de
pth
(m)
Elapsed time (s)
0
5
10
15
20 0
200
400
600
800
1000
Clin
e de
pth
(m)
Elapsed time (s)
0
5
10
15
20 0
200
400
600
800
10001000 3000 5000 7000
Clin
e de
pth
(m)
0
5
10
15
20 0
200
400
600
800
10005000 7000 9000
Clin
e de
pth
(m)
Tem
pera
ture
(°C
)T
empe
ratu
re (
°C)
Tem
pera
ture
(°C
)
Tem
pera
ture
(°C
)T
empe
ratu
re (
°C)
Tem
pera
ture
(°C
)
204-1244E-4H 204-1244E-5HA B
204-1244E-7H 204-1244E-9HC D
204-1244E-10H 204-1244E-12HE F1.2 × 104 1.4 × 10⁴ 1.6 × 10⁴ 1.8 × 10⁴ 2.4 × 10⁴ 2.6 × 10⁴ 2.8 × 10⁴ 3.0 × 10⁴
2.7 × 10⁴ 2.9 × 10⁴ 3.1 × 10⁴ 3.3 × 10⁴ 3.4 × 10⁴ 3.6 × 10⁴ 3.8 × 10⁴ 4.0 × 10⁴
F7. Temperature- and Cline-time profiles, Hole 1244E, p. 21.
0
5
10
15
20 0
200
400
600
800
1000
204-1245C-4H
Tem
pera
ture
(°C
)
Clin
e de
pth
(m)
C
0
5
10
15
20 0
200
400
600
800
1000
204-1245C-5H
Tem
pera
ture
(°C
)
Clin
e de
pth
(m)
D
0
5
10
15
20 0
200
400
600
800
1000
204-1245C-6H
Tem
pera
ture
(°C
)
Clin
e de
pth
(m)
Elapsed time (s)
E
0
5
10
15
20 0
200
400
600
800
1000
204-1245C-7H
Tem
pera
ture
(°C
)
Clin
e de
pth
(m)
Elapsed time (s)
F
5
10
15
20
25 0
200
400
600
800
10001000 2000 3000 4000 5000 6000
204-1245C-1H
Tem
pera
ture
(°C
)
Clin
e de
pth
(m)
A
0
5
10
15
20 0
200
400
600
800
10005000 6000 7000 8000 9000
204-1245C-2H
Tem
pera
ture
(°C
)
Clin
e de
pth
(m)
B
1.1 × 10⁴
1 × 10⁴
1.3 × 10⁴ 1.5 × 10⁴ 1.3 × 10⁴ 1.5 × 10⁴ 1.7 × 10⁴
1.6 × 10⁴ 1.8 × 10⁴ 2.0 × 10⁴ 1.9 × 10⁴ 2.1 × 10⁴ 2.3 × 10⁴
F8. Temperature- and Cline-time profiles, Hole 1245C, p. 23.
0
5
10
15
20 0
200
400
600
800
1000
204-1250D-4H
0
5
10
15
20 0
200
400
600
800
1000
204-1250D-6H
0
5
10
15
20 0
200
400
600
800
1000
204-1250D-7H
0
5
10
15
20 0
200
400
600
800
1000
204-1250D-8H
0
5
10
15
20 0
200
400
600
800
10003000 5000 7000 9000
204-1250D-2H
0
5
10
15
20 0
200
400
600
800
10007000 9000
204-1250D-3H
Clin
e de
pth
(m)
Clin
e de
pth
(m)
Clin
e de
pth
(m)
Elapsed time (s) Elapsed time (s)
Tem
pera
ture
(°C
)
D
Tem
pera
ture
(°C
)
F
Tem
pera
ture
(°C
)
B
Clin
e de
pth
(m)
Clin
e de
pth
(m)
Clin
e de
pth
(m)
Tem
pera
ture
(°C
)
C
Tem
pera
ture
(°C
)
E
Tem
pera
ture
(°C
)
A
1.1 × 10⁴ 1.3 × 10⁴
1.2 × 10⁴ 1.4 × 10⁴ 1.6 × 10⁴ 1.8 × 10⁴ 2.0 × 10⁴ 2.2 × 10⁴ 2.4 × 10⁴ 2.6 × 10⁴
2.2 × 10⁴ 2.4 × 10⁴ 2.6 × 10⁴ 2.8 × 10⁴ 2.8 × 10⁴ 3.0 × 10⁴ 3.2 × 10⁴
F9. Temperature- and Cline-time profiles, Hole 1250D, p. 25.
0
5
10
15
20 0
200
400
600
800
1000
1200
14004000 6000 8000
204-1251D-13H
0
5
10
15
20 0
200
400
600
800
1000
1200
14005000 7000 9000
204-1251D-14H
0
5
10
15
20 0
200
400
600
800
1000
1200
14008000
204-1251D-15H
0
5
10
15
20 0
200
400
600
800
1000
1200
1400
204-1251D-16H
5
10
15
20
25 0
200
400
600
800
1000
1200
14000 2000 4000 6000
204-1251D-11H
0
5
10
15
20 0
200
400
600
800
1000
1200
14002000 4000 6000 8000
204-1251D-12H
Clin
e de
pth
(m)
Clin
e de
pth
(m)
Clin
e de
pth
(m)
Clin
e de
pth
(m)
Clin
e de
pth
(m)
Clin
e de
pth
(m)
Elapsed time (s) Elapsed time (s)
Tem
pera
ture
(°C
)
D
Tem
pera
utre
(°C
)
F
Tem
pera
ture
(°C
)
B
Tem
pera
ture
(°C
)
C
Tem
pera
ture
(°C
)
E
Tem
pera
ture
(°C
)
A
1 × 10⁴ 1.1 × 10⁴
1.0 × 10⁴ 1.2 × 10⁴ 1.1 × 10⁴ 1.3 × 10⁴ 1.5 × 10⁴
F10. Temperature- and Cline-time profiles, Hole 1251D, p. 27.

W. USSLER ET AL.A TEST OF THE TPC TOOL PROTOTYPE 8
Conductivity Measurements
Results from Leg 201 (Ussler et al., 2006) show that normalized con-ductivity values indicate the presence of gas headspace in many toolruns. These data suggest that atmospheric gas was entrained into thecoring string during APC core exchange on deck and was initially car-ried down into the borehole with the tool. In some cases this headspacegas disappeared near the seafloor and then reappeared during ascent,and in many cases the tool never lost this gas headspace during the en-tire run.
In contrast with Leg 201, the conductivity data from Leg 204 do notprovide easily interpretable results. Leg 204 normalized conductivitymeasurements show a variety of patterns. Data from many runs suggestthat a high-conductivity medium persisted between the electrodes atthe face of the APC piston during descent and ascent of the APC core(referred to as “wet”). These data are consistent with the continuouspresence of water or another conductive medium (e.g., sediment) at theheadspace during the entire coring process. Conductivity measure-ments indicating continuous presence of a low-conductivity medium(e.g., gas) in the headspace occurred in a few cores (previous referred toas “dry”) (Ussler et al., 2006). The conductivity in the headspace of theremaining cores fluctuated between what can be inferred to be wet anddry conditions in no systematic or predictable manner. Because the TPCconductivity data collected during Leg 204 were dominated by artifactsthat appear to be associated with clogging of the sensor path with mud,they are not be presented here.
DISCUSSION
Headspace temperature and pressure curves obtained using the TPCtool during Leg 204 are the first systematic attempt to record the tem-perature and pressure inside a coring system during recovery of gas-richand gas hydrate–bearing sediment. Some core ascent curves show thatdistinct temperature and pressure anomalies occur during both pulloutand retrieval of an APC core through the water column.
Cold Temperature Anomalies during Core Ascent
Two types of cold temperature anomalies were identified in the TPCdata: (1) a broad cooling anomaly in the shallow water column and ondeck (SWC/D) and (2) a sharply defined cooling anomaly associatedwith core pullout. The SWC/D anomalies are influenced by thermal lagassociated with equilibration of the coring string with cold bottom wa-ter temperatures. However, there are seven clear examples where theseSWC/D temperature anomalies are significantly colder than any watertemperature along the ascent path (Fig. F6). These colder temperatureanomalies occur as or soon after the core passes through the warmestpart of the water column or during exposure on deck (air temperatures≥ 12°C). In addition, these temperature anomalies are associated withan increase in the rate of cooling (a change in slope of the temperature-time curve toward cooler temperature in the shallow water column oron deck; e.g., Core 204-1244E-4H) (Fig. F7A). Although some of thecooling may be attributed to thermal lag, another source of cooling,such as gas expansion, must contribute in a significant way to the over-all thermal signature.
0
20
40
60
80
100
204-1247B-14H
Pre
ssur
e (b
ar)
Elapsed time (s)
Withdrawal ofcore fromsediment
3.9 × 10⁴ 3.95 × 10⁴ 4.0 × 10⁴ 4.05 × 10⁴ 4.10 × 10⁴ 4.15 × 10⁴ 4.20 × 10⁴
F11. Pressure vs. time data, p. 29.

W. USSLER ET AL.A TEST OF THE TPC TOOL PROTOTYPE 9
Temperature spikes associated with pullout of the APC from sedi-ment show a trend toward cooler temperatures, and the magnitude ofthese anomalies also often increases in successive runs (i.e., with in-creasing depth below the seafloor) at the same site. In cores taken nearthe seafloor, minimum temperatures for these pullout anomalies aretypically higher than minimum temperatures associated with the SWC/D anomalies (e.g., Fig. F8C, Core 204-1245C-4H). However, as coredepth increases, there are cores where the pullout temperature anoma-lies become progressively cooler than the SWC/D anomaly tempera-tures (e.g., Fig. F8H, Core 204-1245C-10H, and F8L, Core 204-1245C-14H). This may reflect depth-related changes in sediment physicalproperties. The decrease in pullout temperature with increasing depthoccurs despite the warming associated with the geothermal gradient(~53°–60°C/km) (Tréhu, Bohrmann, Rack, Torres, et al., 2003).
Sediment gas data from PCS measurements for all the sites where theTPC was deployed indicate that pore water methane gas concentrationsare substantially elevated and often close to in situ saturation concen-trations, with either a free-methane gas phase or with methane gas hy-drates (e.g., Tréhu, Bohrmann, Rack, Torres, et al., 2003). Massive gashydrate was found in some portions of the sedimentary column sam-pled by APC/TPC coring. Although the TPC measurements are believedto be influenced by escaping gas, the strength of the thermal anomalyis overpowered by the length of time the APC corer is kept in the holeand near the seafloor. In addition, no systematic variations in the areaunder the temperature-time curves for the pullout and SWC/D anoma-lies were observed that could be readily used to quantitatively estimategas amounts.
Pressure and Temperature Variations during Core Pullout and Recovery
An example of the pressure and temperature variations that occur in-side an APC core during collection is illustrated in Figure F12. Sharpnegative pressure anomalies (Fig. F12A, 3 and 5) and a positive pressureanomaly (Fig. F12A, 4) show that internal conditions in the APC corebarrel change dramatically over a few seconds when core insertion andpullout occurs. Rapid increases and decreases in temperature are associ-ated with these pressure anomalies (Fig. F12B, 4 and 5). Cooling spike 5is a sharply defined anomaly associated with core pullout, and the cool-ing trend in the upper water column (7) corresponds to a SWC/D tem-perature anomaly. The pullout temperature (1.4°C) for this core is thelowest recorded by the TPC during Leg 204. This core was collected justabove the seismic depth for the bottom-simulating reflector (127 mbsf)(fig. F11 in Shipboard Scientific Party, 2003).
Implications of Pressure and Temperature Variations
Pressure anomalies formed during core pullout may provide insightinto APC core expansion. Excess core recovery (>100% length; e.g., Leg204 [Tréhu, Bohrmann, Rack, Torres, et al., 2003]) by APC cores is com-mon and may be the result of the negative pressure anomalies gener-ated during core pullout that irreversibly expand the length of the core.
Pressure changes of the magnitude seen in Figure F12A (ΔP = approxi-mately –100 bar) and rapid temperature changes over a range of ~7°C(Fig. F12B) will change the phase relationships and saturation states for
0
200
400
600
800
1000
12000 2 4 6 8 10 12
Temperature-Depth history - Core 204-1244E-17H
Temperature (°C)
Descentprofile
Held aboveseafloor
At seafloorentering hole
Heating causedby APC shoot
Cooling caused byAPC pullout
Ascentprofile
Cooling causedby gas exsolution
35
2
1
4
6 Seafloor
Geothermal gradient
Hydrographicprofile
Pure methanehydrate stability
7
0
20
40
60
80
100
120
0
200
400
600
800
1000
120048,000 50,000 52,000
Pressure-Depth-Time history - Core 204-1244E-17H
Cor
e lin
e de
pth
(m)
Elapsed Time (s)
Seafloor1
2
3
4
Gasunderpressure
Gasoverpressure
Core line depth
16 min
5
6
B
Wat
er d
epth
(m
)
Pre
ssur
e (b
ar)
A
F12. Pressure and temperature changes, p. 30.

W. USSLER ET AL.A TEST OF THE TPC TOOL PROTOTYPE 10
gas hydrate and dissolved gases (e.g., CH4, CO2, and H2S) inside the corebarrel. The severity of these pressure and temperature fluctuations maymove gas hydrates contained in the sediment into and out of stability,transporting gas initially dissolved in sediment pore water as a gas phaseto other parts of the core and/or core barrel. In addition, if gases rapidlycome out of solution they may not redissolve before core recovery.
The large pressure reductions during core pullout and recovery thatcause pore water degassing and gas redistribution within the core barrelcontribute to the historically low values measured for pore water meth-ane concentrations in cores obtained during DSDP and ODP drilling(Paull and Ussler, 2001). PCS data have shown clearly that large discrep-ancies in methane concentrations exist in gas-rich cores (e.g., Leg 164[Dickens et al., 1997]; Leg 204 [Tréhu, Bohrmann, Rack, Torres, et al.,2003]), and TPC data suggest that large negative pressure anomaliesmay initiate core degassing.
The large temperature changes that occur during core pullout and as-cent to the surface affect interpretation of IR-camera image data (e.g.,Tréhu, Bohrmann, Rack, Torres, et al., 2003). When these temperaturechanges occur, why they occur when they do, and what they representare not easily resolved with the type of temperature data that have beencollected. The redistribution of gas from its precoring position follow-ing large pressure anomalies confounds interpretation of IR thermal im-ages. Whether this is a subtle or large effect is largely unknown.
CONCLUSIONS
TPC data collected during Leg 204 demonstrate how the tool performsat gas-rich and gas hydrate–bearing sites in a relatively shallow water set-ting. Profound changes in pressure and temperature occur within thecore barrel during core pullout and recovery. Temperature-time curvesdocument thermal changes consistent with the occurrence of gas at theface of the TPC tool. The occurrence of a cooling anomaly late in thecore retrieval process indicates that thermal changes within the sedi-ment are still ongoing while the core is on the deck of the drillship.
The TPC tool has recorded thermal signatures of gas expansion thathave occurred during core pullout and movement of the core throughthe shallow water column. These thermal anomalies are consistent withmodels of what gas evolution would look like in gas-rich sedimentcores. Although much has been learned about gas dynamics using theTPC tool, inconsistencies in coring operations and inherent artifacts(large pressure and temperature anomalies) of the coring process makeit difficult to quantify the amount of gas that is present. In the future, itwould be beneficial to have a series of TPC tool runs in gas-rich sedi-ments in greater water depths than at Hydrate Ridge. In addition, a rou-tine method to clean the conductivity sensor after every APC/TPC corerun will be necessary to obtain reliable conductivity measurements.
ACKNOWLEDGMENTS
This research used samples and/or data provided by the Ocean Drill-ing Program (ODP). ODP is sponsored by the U.S. National ScienceFoundation (NSF) and participating countries under management ofJoint Oceanographic Institutions (JOI), Inc. Funding for this researchwas provided by NSF (OCE-9910418) and the David and Lucile Packard

W. USSLER ET AL.A TEST OF THE TPC TOOL PROTOTYPE 11
Foundation. We thank Thomas Sullivan, Persistor Corporation, for as-sistance with implementation of the QSPI interface on the CF1.

W. USSLER ET AL.A TEST OF THE TPC TOOL PROTOTYPE 12
REFERENCES
Anonymous, 1980. Practical Temperature Measurements, Application Note 290: SantaClara, CA (Hewlett-Packard Corp.). <http://cp.literature.agilent.com/litweb/pdf/5965-7822E.pdf>.
Clague, D., Maher, N., and Paull, C.K., 2001. High-resolution multibeam survey ofHydrate Ridge, offshore Oregon. In Paull, C.K., and Dillon, W.P. (Eds.), Natural GasHydrates: Occurrence, Distribution, and Detection. Am. Geophys. Union, Geophys.Monogr. Ser., 124:297–306.
D’Hondt, S.L., Jørgensen, B.B., Miller, D.J., et al., 2003. Proc. ODP, Init. Repts., 201[CD-ROM]. Available from: Ocean Drilling Program, Texas A&M University, Col-lege Station TX 77845-9547, USA. [HTML]
Dickens, G.R., Paull, C.K., and Wallace, P., 1997. Direct measurement of in situ meth-ane quantities in a large gas-hydrate reservoir. Nature (London, U. K.), 385:426–428.doi:10.1038/385426a0
Duan, Z., Møller, N., Greenberg, J., and Weare, J.H., 1992. The prediction of methanesolubility in natural waters to high ionic strengths from 0° to 250°C and from 0 to1600 bar. Geochim. Cosmochim. Acta, 56:1451–1460. doi:10.1016/0016-7037(92)90215-5
Paull, C.K., Matsumoto, R., Wallace, P.J., et al., 1996. Proc. ODP, Init. Repts., 164: Col-lege Station, TX (Ocean Drilling Program).
Paull, C.K., and Ussler, W., III, 2001. History and significance of gas sampling duringDSDP and ODP drilling associated with gas hydrates. In Paull, C.K., and Dillon,W.P. (Eds.), Natural Gas Hydrates: Occurrence, Distribution, and Detection. Geo-phys. Monogr., 124:53–65.
Peltzer, E.T., and Brewer, P.G., 2000. Practical physical chemistry and empirical pre-dictions of methane hydrate stability. In Max, M.D., (Ed.), Natural Gas Hydrate inOceanic and Permafrost Environments: Dordrecht (Kluwer), 17–28.
Saunders, P.M., 1981. Practical conversion of pressure to depth. J. Phys. Oceanogr.,11:573–574. doi:10.1175/1520-0485(1981)011<0573:PCOPTD>2.0.CO;2
Shipboard Scientific Party, 2003. Leg 204 summary. In Tréhu, A.M, Bohrmann, G.,Rack, F.R., Torres, M.E., et al., Proc. ODP, Init. Repts., 204, 1–75 [CD-ROM]. Availablefrom: Ocean Drilling Program, Texas A&M University, College Station TX 77845-9547, USA. [HTML]
Tréhu, A.M., Bohrmann, G., Rack, F.R., Torres, M.E., et al., 2003. Proc. ODP, Init. Repts.,204 [CD-ROM]. Available from: Ocean Drilling Program, Texas A&M University,College Station TX 77845-9547, USA. [HTML]
Ussler, W., III, Paull, C.K., McGill, P., Schroeder, D., and Ferrell, D., 2001. Estimatingin situ sediment gas concentrations in ODP boreholes by continuously monitoringtemperatures during core recovery. Eos, Trans. Am. Geophys. Union, 82:S445–S446.
Ussler, W., III, Paull, C.K., McGill, P., Schroeder, D., and Ferrell, D., 2002. Estimatingin situ sediment gas concentrations in ODP boreholes by continuously monitoringtemperature during core recovery. Proc. 4th Int. Conf. Gas Hydrate, 1:210–215.
Ussler, W., III., Paull, C.K., McGill, P., Schroeder, D., and Ferrell, D., 2006. A test of thetemperature, pressure, and conductivity tool at a gas-poor background site. In Jør-gensen, B.B., D’Hondt, S.L., and Miller, D.J. (Eds.), Proc. ODP, Sci. Results, 201[Online]. Available from World Wide Web: <http://www-odp.tamu.edu/publica-tions/201_SR/114/114.htm>. [Cited 2006-01-18]
Ussler, W., III, Paull, C.K., McGill, P., Schroeder, D., Ferrell, D., and Leg 201 and 204Scientific Parties, 2003. Estimates of in situ sediment gas concentrations in ODPboreholes from records of core temperature obtained during core recovery. Geo-phys. Res. Bull., 5:02964. (Abstract)
Ussler, W., III, Paull, C.K., McGill, P., Schroeder, D., and Friederichs, M., 2000. A newapproach for estimating in situ sediment gas concentrations in ODP boreholeswhile coring. GSA Bull., 32:A102. (Abstract)

W. USSLER ET AL.A TEST OF THE TPC TOOL PROTOTYPE 13
Watkins, J.S., Moore, J.C., et al., 1982. Init. Repts. DSDP, 66: Washington (U.S. Govt.Printing Office).
Westbrook, G.K., Carson, B., Musgrave, R.J., et al., 1994. Proc. ODP, Init. Repts., 146(Pt. 1): College Station, TX (Ocean Drilling Program).

W. USSLER ET AL.A TEST OF THE TPC TOOL PROTOTYPE 14
APPENDIX
MATLAB m-file for Computing Seafloor Pressure ata Specified Latitude and Water Depth
function P80=pressure(DPTH,XLAT);% PRESSURE Computes pressure given the depth at some latitude% P=PRESSURE(D,LAT) gives the pressure P (dbars) at a depth D (m)% at some latitude LAT (degrees).%% Ref: Saunders, “Practical Conversion of Pressure to Depth,”% Journal of Physical Oceanography, April 1981.%% CHECK VALUE: P80=7500.004 DBARS;FOR LAT=30 DEG., DEPTH=7321.45 % % METERS
PLAT=abs(XLAT*pi/180.);D=sin(PLAT);C1=5.92E-3+(D.*D)*5.25E-3;P80=((1-C1)-sqrt(((1-C1).^2)-(8.84E-6*DPTH)))/4.42E-6;

W. USSLER ET AL.A TEST OF THE TPC TOOL PROTOTYPE 15
Figure F1. Results of radial heat transfer models of ascent temperature paths that would be followed duringcore recovery. The most important control on heat transfer is the plastic core liner, which has very low rel-ative thermal conductivity (11.3 J/min·m·°C). Broadly spaced dashed line = combined hydrographic geo-thermal temperature profile. A. Three profiles from nongassy cores that differ by their initial temperatures.Solid line = mudline core (2700 mbsl), dotted lines = 3000 and 3500 mbsl cores. Thus, all gas-free cores froma drill site should have the same thermal overprinting and their recovery temperatures indistinguishable.B. Thermal signatures generated by cores with varying amounts of initial interstitial methane gas concen-trations. These curves converge with and follow the mudline core temperature path (solid line) until gasbubbles are generated. When gas bubbles form, the temperature profiles show distinct cooling. C. Corre-sponding records of conductivity predicted for the thermal paths indicated in B. a = 175 mM, b = 139 mM,c = 88 mM. Low conductivity indicates the presence of gas headspace; high conductivity indicates the con-ductivity electrodes are bathed in seawater or mud. A sudden offset in conductivity is expected to occur assoon as a headspace gas volume has been generated.
-10 0 10 20 30 40 500 10 20 30 40 50 Low High
CBA Core temperature (°C) Relative conductivityCore temperature (°C)
0
1000
2000
3000
4000
Dep
th (
mbs
l)
Seafloor
175 mM
139 mM
88 mM
a
b
c
Seafloor Seafloor
Hydrographic profile
Geothermal gradient

W. USSLER ET AL.A TEST OF THE TPC TOOL PROTOTYPE 16
Figure F2. Schematic cross section of the upper portion of an advanced piston corer (APC) core barrel filledwith a sediment core illustrates how gas bubbles migrate out of the sediment and move upward along theside of the core liner to accumulate at the top of the core barrel under the face of the APC piston. TP = ther-mistor probe, CS = conductivity sensor.
Headspaceaccumulationof gas
Buoyantrise of gas
TP
APC piston
CS

W. USSLER ET AL.A TEST OF THE TPC TOOL PROTOTYPE 17
Figure F3. Schematic cross section and end view of the APC piston containing the TPC tool. The end viewof the APC piston face shows the arrangement of the TPC sensors. TP = thermistor probe, CS = conductivitysensor, PP = pressure port, DP = data dump port, which is sealed during deployment but available for datadownloads on the drillship catwalk.
Lithium thionyl chloride batteriesPersistor
CF1Signal
conditioningPower
management
25"
End view
2.375"
TP
CS
DP
PP

W. USSLER ET AL.A TEST OF THE TPC TOOL PROTOTYPE 18
Figure F4. End view of the APC piston (Fig. F3, p. 17) shows placement of sensors and ports.
Thermistor probe
Conductivity probesPressuresensor port
RS-232 data port

W. USSLER ET AL.A TEST OF THE TPC TOOL PROTOTYPE 19
Figure F5. Location map for sites cored during Leg 204. Solid red circles = sites where the TPC tool was de-ployed. Detailed bathymetric map is from Clague et al. (2001); water depth is in meters. SHR = southernHydrate Ridge. Modified from Tréhu, Bohrmann, Rack, Torres, et al. (2003).
1200
1100
1000
900
800
Site 1244
Site 1251
Site 1245
Site 1246
Site 1250
Site 1249
Site 1247
44°36'N
44° 33'
Site1248
Site 1252
Ant
iclin
e A
Ant
iclin
e B
SHR
0 1 2
Pinnacle
125°09'W 125° 06' 125° 03'
km
W. USSLER ET AL.A TEST OF THE TPC TOOL PROTOTYPE 20
Figure F6. Plots of temperature-time data collected by the TPC tool in Holes (A) 1244E, (B) 1245C,(C) 1247B, (D) 1250D, (E) 1251D, and (F) 1252C. Each core is identified at its temperature minimum. Redlines = mudline temperatures obtained from APCT and DVTPP tool runs. Arrows = significant temperatureanomalies cooler than measured mudline temperatures. All figures are plotted with the same temperatureand time scales.
0
5
10
15
20
0
4H
5H
7H 9H10H
12H13H
14H 16H
17H
18H
19H
A
1H 2H
4H
5H 6H7H 9H
10H
11H12H
13H
14H
B
0
5
10
15
20
1H
2H 3H
5H
6H 7H
8H9H
10H
11H12H
13H14H
C
1H
2H
3H
4H
6H
7H
8H
9H
10H11H
12H14H
D
0
5
10
15
20
11H 13H
14H
15H
16H 17H
18H
19H
20H
12H
Hole 1251D
Hole 1247B
Hole 1244E
Hole 1250D
Hole 1245C
Tem
pera
ture
(°C
)T
empe
ratu
re (
°C)
Tem
pera
ture
(°C
)
Hole 1252A
1H 2H3H
4H
5H
6H
7H 8H
9H
10H
11H
12H
13H
14H
Elapsed time (s) Elapsed time (s)
E F
2 × 10⁴ 4 × 10⁴ 6 × 10⁴ 0 2 × 10⁴ 4 × 10⁴ 6 × 10⁴
0 2 × 10⁴ 4 × 10⁴ 6 × 10⁴ 0 2 × 10⁴ 4 × 10⁴ 6 × 10⁴
0 2 × 10⁴ 4 × 10⁴ 6 × 10⁴ 0 2 × 10⁴ 4 × 10⁴ 6 × 10⁴

W. USSLER ET AL.A TEST OF THE TPC TOOL PROTOTYPE 21
Figure F7. A–F. Temperature-time (red) and Cline-time (blue) profiles for successive APC cores collected inHole 1244E. (Continued on next page.)
0
5
10
15
20 0
200
400
600
800
1000
Clin
e de
pth
(m)
0
5
10
15
20 0
200
400
600
800
1000
Clin
e de
pth
(m)
0
5
10
15
20 0
200
400
600
800
1000
Clin
e de
pth
(m)
Elapsed time (s)
0
5
10
15
20 0
200
400
600
800
1000
Clin
e de
pth
(m)
Elapsed time (s)
0
5
10
15
20 0
200
400
600
800
10001000 3000 5000 7000
Clin
e de
pth
(m)
0
5
10
15
20 0
200
400
600
800
10005000 7000 9000
Clin
e de
pth
(m)
Tem
pera
ture
(°C
)T
empe
ratu
re (
°C)
Tem
pera
ture
(°C
)
Tem
pera
ture
(°C
)T
empe
ratu
re (
°C)
Tem
pera
ture
(°C
)
204-1244E-4H 204-1244E-5HA B
204-1244E-7H 204-1244E-9HC D
204-1244E-10H 204-1244E-12HE F1.2 × 104 1.4 × 10⁴ 1.6 × 10⁴ 1.8 × 10⁴ 2.4 × 10⁴ 2.6 × 10⁴ 2.8 × 10⁴ 3.0 × 10⁴
2.7 × 10⁴ 2.9 × 10⁴ 3.1 × 10⁴ 3.3 × 10⁴ 3.4 × 10⁴ 3.6 × 10⁴ 3.8 × 10⁴ 4.0 × 10⁴

W. USSLER ET AL.A TEST OF THE TPC TOOL PROTOTYPE 22
Figure F7 (continued). G–L. Temperature- and Cline-time profiles, Hole 1244E.
0
5
10
15
20 0
200
400
600
800
1000
204-1244E-16HC
line
dept
h (m
)
0
5
10
15
20 0
200
400
600
800
1000
1200
204-1244E-17H
Clin
e de
pth
(m)
0
5
10
15
20 0
200
400
600
800
1000
1200
204-1244E-18H
Clin
e de
pth
(m)
Elapsed time (s)
0
5
10
15
20 0
200
400
600
800
1000
1200
204-1244E-19H
Clin
e de
pth
(m)
Elapsed time (s)
0
5
10
15
20 0
200
400
600
800
1000
204-1244E-13H
Clin
e de
pth
(m)
0
5
10
15
20 0
200
400
600
800
1000
204-1244E-14H
Clin
e de
pth
(m)
Tem
pera
ture
(°C
)
JT
empe
ratu
re (
°C)
L
Tem
pera
ture
(°C
)
HT
empe
ratu
re (
°C)
I
Tem
pera
ture
(°C
)
K
Tem
pera
ture
(°C
)
G
3.6 × 10⁴ 3.8 × 10⁴ 4.0 × 10⁴ 4.2 × 10⁴ 3.8 × 10⁴ 4.0 × 10⁴ 4.2 × 10⁴ 4.4 × 10⁴
4.5 × 10⁴ 4.7 × 10⁴ 4.9 × 10⁴ 5.1 × 10⁴ 4.7 × 10⁴ 4.9 × 10⁴ 5.1 × 10⁴ 5.3 × 10⁴
5.0 × 10⁴ 5.2 × 10⁴ 5.4 × 10⁴ 5.6 × 10⁴ 5.3 × 10⁴ 5.5 × 10⁴ 5.7 × 10⁴ 5.9 × 10⁴

W. USSLER ET AL.A TEST OF THE TPC TOOL PROTOTYPE 23
Figure F8. A–F. Temperature-time (red) and Cline-time (blue) profiles for successive APC cores collected inHole 1245C. (Continued on next page.)
0
5
10
15
20 0
200
400
600
800
1000
204-1245C-4H
Tem
pera
ture
(°C
)
Clin
e de
pth
(m)
C
0
5
10
15
20 0
200
400
600
800
1000
204-1245C-5HT
empe
ratu
re (
°C)
Clin
e de
pth
(m)
D
0
5
10
15
20 0
200
400
600
800
1000
204-1245C-6H
Tem
pera
ture
(°C
)
Clin
e de
pth
(m)
Elapsed time (s)
E
0
5
10
15
20 0
200
400
600
800
1000
204-1245C-7H
Tem
pera
ture
(°C
)
Clin
e de
pth
(m)
Elapsed time (s)
F
5
10
15
20
25 0
200
400
600
800
10001000 2000 3000 4000 5000 6000
204-1245C-1H
Tem
pera
ture
(°C
)
Clin
e de
pth
(m)
A
0
5
10
15
20 0
200
400
600
800
10005000 6000 7000 8000 9000
204-1245C-2H
Tem
pera
ture
(°C
)
Clin
e de
pth
(m)
B
1.1 × 10⁴
1 × 10⁴
1.3 × 10⁴ 1.5 × 10⁴ 1.3 × 10⁴ 1.5 × 10⁴ 1.7 × 10⁴
1.6 × 10⁴ 1.8 × 10⁴ 2.0 × 10⁴ 1.9 × 10⁴ 2.1 × 10⁴ 2.3 × 10⁴

W. USSLER ET AL.A TEST OF THE TPC TOOL PROTOTYPE 24
Figure F8 (continued). G–L. Temperature- and Cline-time profiles, Hole 1245C.
0
5
10
15
20 0
200
400
600
800
10003 104 3.1 104 3.2 104 3.3 104 3.4 104
204-1245C-11HC
line
Dep
th (
m)
0
5
10
15
20 0
200
400
600
800
10003.1 104 3.2 104 3.3 104 3.4 104 3.5 104 3.6 104
204-1245C-12H
Clin
e D
epth
(m
)
0
5
10
15
20 0
200
400
600
800
10003.4 104 3.5 104 3.6 104 3.7 104 3.8 104 3.9 104
204-1245C-13H
Clin
e D
epth
(m
)
Elapsed time (s)
0
5
10
15
20 0
200
400
600
800
10003.6 104 3.7 104 3.8 104 3.9 104 4 104 4.1 104
204-1245C-14H
Clin
e D
epth
(m
)
Elapsed time (s)
0
5
10
15
20 0
200
400
600
800
10002.5 104 2.6 104 2.7 104 2.8 104 2.9 104 3 104
204-1245C-9H
Clin
e D
epth
(m
)
0
5
10
15
20 0
200
400
600
800
10002.7 104 2.8 104 2.9 104 3 104 3.1 104 3.2 104
204-1245C-10H
Clin
e D
epth
(m
)
Tem
pera
ture
(°C
)
JT
empe
ratu
re (
°C)
L
Tem
pera
ture
(°C
)
HT
empe
ratu
re (
°C)
I
Tem
pera
ture
(°C
)
K
Tem
pera
ture
(°C
)
G

W. USSLER ET AL.A TEST OF THE TPC TOOL PROTOTYPE 25
Figure F9. A–F. Temperature-time (red) and Cline-time (blue) profiles for successive APC cores collected inHole 1250D. (Continued on next page.)
0
5
10
15
20 0
200
400
600
800
1000
204-1250D-4H
0
5
10
15
20 0
200
400
600
800
1000
204-1250D-6H
0
5
10
15
20 0
200
400
600
800
1000
204-1250D-7H
0
5
10
15
20 0
200
400
600
800
1000
204-1250D-8H
0
5
10
15
20 0
200
400
600
800
10003000 5000 7000 9000
204-1250D-2H
0
5
10
15
20 0
200
400
600
800
10007000 9000
204-1250D-3H
Clin
e de
pth
(m)
Clin
e de
pth
(m)
Clin
e de
pth
(m)
Elapsed time (s) Elapsed time (s)
Tem
pera
ture
(°C
)D
Tem
pera
ture
(°C
)
F
Tem
pera
ture
(°C
)
B
Clin
e de
pth
(m)
Clin
e de
pth
(m)
Clin
e de
pth
(m)
Tem
pera
ture
(°C
)
C
Tem
pera
ture
(°C
)
E
Tem
pera
ture
(°C
)
A
1.1 × 10⁴ 1.3 × 10⁴
1.2 × 10⁴ 1.4 × 10⁴ 1.6 × 10⁴ 1.8 × 10⁴ 2.0 × 10⁴ 2.2 × 10⁴ 2.4 × 10⁴ 2.6 × 10⁴
2.2 × 10⁴ 2.4 × 10⁴ 2.6 × 10⁴ 2.8 × 10⁴ 2.8 × 10⁴ 3.0 × 10⁴ 3.2 × 10⁴

W. USSLER ET AL.A TEST OF THE TPC TOOL PROTOTYPE 26
Figure F9 (continued). G–K. Temperature- and Cline-time profiles, Hole 1250D.
5
10
15
20 0
200
400
600
800
1000
204-1250D-11H
0
5
10
15
20 0
200
400
600
800
1000
204-1250D-12H
Elapsed time (s)
0
5
10
15
20 0
200
400
600
800
1000
204-1250D-14H
Elapsed time (s)
0
5
10
15
20 0
200
400
600
800
1000
204-1250D-9H
0
5
10
15
20 0
200
400
600
800
1000
204-1250D-10H
Tem
pera
ture
(°C
)
JT
empe
ratu
re (
°C)
HT
empe
ratu
re (
°C)
I
Tem
pera
ture
(°C
)
K
Tem
pera
ture
(°C
)
G
Clin
e de
pth
(m)
Clin
e de
pth
(m)
Clin
e de
pth
(m)
Clin
e de
pth
(m)
Clin
e de
pth
(m)
3.2 × 10⁴
5.1 × 10⁴ 5.3 × 10⁴ 5.5 × 10⁴ 5.7 × 10⁴
3.8 × 10⁴ 4.0 × 10⁴ 4.2 × 10⁴ 4.4 × 10⁴
3.4 × 10⁴ 3.6 × 10⁴ 3.8 × 10⁴ 3.5 × 10⁴ 3.7 × 10⁴ 3.9 × 10⁴ 4.1 × 10⁴
4.1 × 10⁴ 4.3 × 10⁴ 4.5 × 10⁴ 4.7 × 10⁴

W. USSLER ET AL.A TEST OF THE TPC TOOL PROTOTYPE 27
Figure F10. A–F. Temperature-time (red) and Cline-time (blue) profiles for successive APC cores collectedin Hole 1251D. Note the x-axis in J has a range of 10,000 rather than 6,000 s. (Continued on next page.)
0
5
10
15
20 0
200
400
600
800
1000
1200
14004000 6000 8000
204-1251D-13H
0
5
10
15
20 0
200
400
600
800
1000
1200
14005000 7000 9000
204-1251D-14H
0
5
10
15
20 0
200
400
600
800
1000
1200
14008000
204-1251D-15H
0
5
10
15
20 0
200
400
600
800
1000
1200
1400
204-1251D-16H
5
10
15
20
25 0
200
400
600
800
1000
1200
14000 2000 4000 6000
204-1251D-11H
0
5
10
15
20 0
200
400
600
800
1000
1200
14002000 4000 6000 8000
204-1251D-12H
Clin
e de
pth
(m)
Clin
e de
pth
(m)
Clin
e de
pth
(m)
Clin
e de
pth
(m)
Clin
e de
pth
(m)
Clin
e de
pth
(m)
Elapsed time (s) Elapsed time (s)
Tem
pera
ture
(°C
)D
Tem
pera
utre
(°C
)
F
Tem
pera
ture
(°C
)
B
Tem
pera
ture
(°C
)
C
Tem
pera
ture
(°C
)
E
Tem
pera
ture
(°C
)
A
1 × 10⁴ 1.1 × 10⁴
1.0 × 10⁴ 1.2 × 10⁴ 1.1 × 10⁴ 1.3 × 10⁴ 1.5 × 10⁴
W. USSLER ET AL.A TEST OF THE TPC TOOL PROTOTYPE 28
Figure F10 (continued). G–J. Temperature- and Cline-time profiles, Hole 1251D.
0
5
10
15
20 0
200
400
600
800
1000
1200
1400
204-1251D-19H
0
5
10
15
20 0
200
400
600
800
1000
1200
1400
204-1251D-20H
0
5
10
15
20 0
200
400
600
800
1000
1200
1400
204-1251D-17H
0
5
10
15
20 0
200
400
600
800
1000
1200
1400
204-1251D-18H
Clin
e de
pth
(m)
Clin
e de
pth
(m)
Clin
e de
pth
(m)
Clin
e de
pth
(m)
Tem
pera
ture
(°C
)
JT
empe
ratu
re (
°C)
HT
empe
ratu
re (
°C)
I
Tem
pera
ture
(°C
)
G
Elapsed time (s) Elapsed time (s)
1.3 × 10⁴ 1.5 × 10⁴ 1.7 × 10⁴ 1.9 × 10⁴ 1.6 × 10⁴ 1.8 × 10⁴ 2.0 × 10⁴ 2.2 × 10⁴
2.4 × 10⁴ 2.6 × 10⁴ 2.8 × 10⁴ 3.0 × 10⁴ 3.2 × 10⁴ 3.6 × 10⁴ 4.0 × 10⁴

W. USSLER ET AL.A TEST OF THE TPC TOOL PROTOTYPE 29
Figure F11. TPC-collected pressure vs. time data from Core 204-1247B-14H are an example of the large pres-sure anomalies that occur during APC core pullout. Pressure measured within the APC is not a good proxyfor core depth; thus, wireline distance data are essential for interpretation of TPC data.
0
20
40
60
80
100
204-1247B-14H
Pre
ssur
e (b
ar)
Elapsed time (s)
Withdrawal ofcore fromsediment
3.9 × 10⁴ 3.95 × 10⁴ 4.0 × 10⁴ 4.05 × 10⁴ 4.10 × 10⁴ 4.15 × 10⁴ 4.20 × 10⁴

W. U
SSLE
R E
T AL.
A T
EST O
F TH
E TP
C T
OO
L PR
OT
OT
YP
E3
0
Figure ed using Core 204-1244E-17H data.Line c phenomena shown in parts A andB. Cor stabilize; 2 = corer is held at seafloorfor sta scillations above and below in situpressu ns; 5 = ~4°C cooling occurs duringcore p pressure has not returned to in situpressu water column temperature anom-aly (SW om MBARI ROV Tiburon dive T195condu fall after crossover with the hydro-graph rmal response of the core/TPC toolassem ethane hydrate curve is computedusing 60°C/km (Tréhu, Bohrmann, Rack,Torres
8 10 12
re 204-1244E-17H
°C)
Descentprofile
boveor
Heating causedby APC shoot
ausedxsolution
1
4
Seafloor
Geothermal gradient
0
20
40
60
80
100
1204
Pre
ssur
e (b
ar)
A
F12. Examples of the (A) pressure and (B) temperature changes that occur during core collection illustratolors distinguish parts of the coring operation into temperature-pressure-time space and help correlateeline data = light blue line in A. Events during coring: 1 = corer is held above seafloor to allow wireline to bilization before entry into the hole; 3 = APC core is fired by breaking a shear pin, causing pressure ore; 4 = 4°C temperature increase caused by insertion heating, pressure increases above in situ conditioullout, pressure nearly reaches sea-surface pressure; 6 = core cools slightly upon reaching the mudline, re, gas is underpressured inside APC core barrel until ~100 m above the seafloor during ascent; 7 = shallow
C/D). Overpressure conditions occur near the surface, ~150 m water depth. Hydrographic profile is frcted over southern Hydrate Ridge on 13 July 2000. Note in panel B that core temperatures continue toic temperature profile and the pure methane hydrate stability curve. This may be due to lag in the thebly to bottom water temperatures and to cooling caused by gas expansion inside the core barrel. Pure mequation 7 in Peltzer and Brewer (2000). Bottom water temperature was ~4°C; geothermal gradient was, et al., 2003).
0
200
400
600
800
1000
12000 2 4 6
Temperature-Depth history - Co
Temperature (
Held aseaflo
At seafloorentering hole
Cooling caused byAPC pullout
Ascentprofile
Cooling cby gas e
35
2 6
Hydrographicprofile
Pure methanehydrate stability
7
0
200
400
600
800
1000
12008,000 50,000 52,000
Pressure-Depth-Time history - Core 204-1244E-17H
Cor
e lin
e de
pth
(m)
Elapsed Time (s)
Seafloor1
2
3
4
Gasunderpressure
Gasoverpressure
Core line depth
16 min
5
6
B
Wat
er d
epth
(m
)

W. USSLER ET AL.A TEST OF THE TPC TOOL PROTOTYPE 31
Table T1. Polynomial coefficients for conversion ofraw temperature data to resistance.
Order of polynomial coefficient
Holes 1244E, 1247B, and
1252A
Holes 1245C, 1250D, and
1251D
6 +3.3808E–165 –5.7748E–12 –3.1384E–124 +4.1015E–08 +3.5348E–083 –1.5676E–04 –1.5919E–042 +3.4774E–01 +3.6475E–011 –4.4716E+02 –4.4556E+020 +2.9834E+05 +2.6349E+05

W. USSLER ET AL.A TEST OF THE TPC TOOL PROTOTYPE 32
Table T2. Steinhart-Hart equation coefficients fromthe manufacturer’s thermistor calibration for con-version of resistance to temperature.
Steinhart-Hart coefficient
Holes 1244E,1247B, and 1252A
Holes 1245C,1250D, and 1251D
A 1.134754819E–03 1.13442892E–03B 2.333425717E–04 2.33373683E–04C 9.032046858E–08 8.99784317E–08

W. USSLER ET AL.A TEST OF THE TPC TOOL PROTOTYPE 33
Table T3. Drilling data, Hole 1244E. (See table notes. Continued on next page.)
Core
Time on
deck
Depth (m)
Advanced (m)
Recovery (%)
Shear pins
Shear pressure
(psi)Speed holes
Pull (kips) Stroke
Core catcher
used (rpm)Top Bottom
Below seafloor
Length (m) Wireline
Cored Recovered (F/A) Runs
204-1244E-1H 0640 904.8 913.5 8.7 8.7 8.7 8.76 101 2H 2700 0 0 Y FP F 12H 0745 913.5 923.0 18.2 9.5 9.5 9.94 105 2H 2700 0 0 Y FP F 13P 0840 923.0 924.0 19.2 1.0 1.0 0.00 0 0 SPM 0 — — 4 K 45 F 1DI 0845 924.0 925.0 20.2 1.0 — — — 50 SPM 125 — — 4 K 45 — —4H 0910 925.0 934.5 29.7 9.5 9.5 10.24 108 2H 2700 0 0 Y FP F 15H 1000 934.5 944.0 39.2 9.5 9.5 10.11 106 2H 2700 0 30 Y FP F 16P 1105 944.0 945.0 40.2 1.0 1.0 1.00 100 20 SPM 125 — — 4 K 60 F 1DI 1110 945.0 946.0 41.2 1.0 — — — 50 SPM 125 — — 4 K 60 — —7H 1155 946.0 955.5 50.7 9.5 9.5 10.59 111 2H 2700 0 30 Y FP F 18Y 1310 955.5 956.5 51.7 1.0 1.0 0.92 92 40 SPM 700 — — 12 K 0 F 1DI 1315 956.5 957.4 52.6 0.9 — — — 50 SPM 150 — — 6 K 50 F 19H 1530 957.4 966.9 62.1 9.5 9.5 9.91 104 2H 2700 2 40 Y FP F 110H 1625 966.9 976.4 71.6 9.5 9.5 9.78 103 2H 2700 4 40 Y FP F 111P 1725 976.4 977.4 72.6 1.0 1.0 1.00 100 20 SPM 200 — — 5 K 50 F 1DI 1730 977.4 978.4 73.6 1.0 — — — 60 SPM 150 — — 6 K 60 — —12H 1750 978.4 987.9 83.1 9.5 9.5 10.11 106 2H 2700 4 40 Y FP F 113H 1855 987.9 997.4 92.6 9.5 9.5 8.69 91 2H 2700 4 60 Y FP F 114H 1925 997.4 1006.9 102.1 9.5 9.5 9.40 99 2H 2700 4 45 Y FP F 115P 2040 1006.9 1007.9 103.1 1.0 1.0 1.00 100 20 SPM 125 — — 5 K 100 F 1DI 2045 1007.9 1008.9 104.1 1.0 — — — 60 SPM 150 — — 6 K 60 — —16H 2100 1008.9 1018.4 113.6 9.5 9.5 8.94 94 2H 2700 4 45 Y FP F 117H 2200 1018.4 1027.9 123.1 9.5 9.5 9.66 102 2H 2700 4 60 N FP F 118H 2300 1027.9 1037.0 132.2 9.1 9.1 9.09 100 2H 2700 4 60 N FP F 119H 2340 1037.0 1045.5 140.7 8.5 8.5 8.59 101 2H 2700 4 60 N FP F 2DI 0945 1045.5 1154.8 250.0 109.3 — — — 70 SPM 1000 — — 14 K 70 F 1
Core
Time on
deck
Depth (m)
Shoe (type)
Orientation (type) Min AHC
Drill over RemarksTop Bottom
Below seafloor
204-1244E-1H 0640 904.8 913.5 8.7 APCT None 0 N N Bottom water sampler/Fluorescent microspheres and tracers2H 0745 913.5 923.0 18.2 Standard None 5 N N Fluorescent microspheres and tracers3P 0840 923.0 924.0 19.2 10 Y N PCS with Methane Tool with RBI PDCDI 0845 924.0 925.0 20.2 5 Y N4H 0910 925.0 934.5 29.7 Standard None 5 Y N APCM in/Fluorescent microspheres and tracers5H 1000 934.5 944.0 39.2 APCT None 5 Y N Fluorescent microspheres and tracers6P 1105 944.0 945.0 40.2 5 Y N PCS with Methane Tool with RBI PDCDI 1110 945.0 946.0 41.2 3 Y N7H 1155 946.0 955.5 50.7 APCT None 5 Y N Fluorescent microspheres and tracers8Y 1310 955.5 956.5 51.7 10 Y N Fugro Pressure Corer/DSADI 1315 956.5 957.4 52.6 5 Y N DVTPP at 957.4 m (52.6 mbsf)9H 1530 957.4 966.9 62.1 APCT None 5 N N Fluorescent microspheres and tracers10H 1625 966.9 976.4 71.6 Standard None 5 Y N Fluorescent microspheres and tracers11P 1725 976.4 977.4 72.6 7 Y N PCS with Methane Tool with RBI PDCDI 1730 977.4 978.4 73.6 5 N N12H 1750 978.4 987.9 83.1 Standard None 5 N N Fluorescent microspheres and tracers13H 1855 987.9 997.4 92.6 APCT None 5 N N Fluorescent microspheres and tracers14H 1925 997.4 1006.9 102.1 Standard None 5 N N Fluorescent microspheres and tracers15P 2040 1006.9 1007.9 103.1 12 Y N PCS with Methane Tool with RBI PDCDI 2045 1007.9 1008.9 104.1 3 Y N16H 2100 1008.9 1018.4 113.6 Standard None 5 N N Fluorescent microspheres and tracers17H 2200 1018.4 1027.9 123.1 APCT None 13 N N Fluorescent microspheres and tracers18H 2300 1027.9 1037.0 132.2 Standard None 10 N N Fluorescent microspheres and tracers19H 2340 1037.0 1045.5 140.7 Standard None 10 N N Fluorescent microspheres and tracers DVTPPDI 0945 1045.5 1154.8 250.0 Center bit 338 Y N Drill with XCB center bit

W. USSLER ET AL.A TEST OF THE TPC TOOL PROTOTYPE 34
Table T3 (continued).
Notes: Spud date = 20 August 2002, rig time = 0614, GMT = rig time + 7 hr. Bottom-hole assembly length = 126.85 m. Seafloor = 904.8mbsl, precision depth recorder = 913.4 mbsl. An 11-7/16-inch RBI C-3 bit with 4 jets was used (serial number CD980). All measurementsare from pump 1. Rerun hours on used bit = 117.90. Stroke: Y = core barrel had full stroke, N = core barrel did not have full stroke. F =fore core liner winch was used, A = aft core liner winch was used. Min = minutes required to advance bit. AHC: Y = active heave compen-sator (AHC) on and operating, N = AHC off and not operating. Drill over: Y = drill over used to recover core barrel, N = drill over notrequired to recover core barrel. APCT = advanced piston corer temperature tool, PCS = pressure core sampler, RBI = Rock Bit Interna-tional auger bit (www-odp.tamu.edu/publications/tnotes/tn31/pcs/fig_02.htm), PDC = RBI polycrystalline diamond compact drillbit (www-odp.tamu.edu/publications/tnotes/tn31/pcs/fig_02.htm), APCM = advanced piston corer methane tool (same as TPCtool), DSA = drill string accelerator tool, DVTPP = Davis-Villinger Temperature-Pressure Probe, XCB = extended core barrel, FPC = Fugropressure corer, APC = advanced piston corer. APC cores with TPC data are highlighted in yellow.
Measurement FPC PCS APCHole
1244E
Number of cores 1 4 14 19Total drilled (m) 0.9 4.0 109.3 114.2Total cored (m) 1.0 4.0 130.8 135.8Total recovered (m) 0.92 3.00 133.81 137.73Recovery (%) 92.0 75.0 102.3 101.4Total wireline runs 1 4 17 22Total bit F/hole (hr) 0.25 0.83 7.02 8.10Total F/bit CD980 (hr) 126.00Total active heave (hr) 0.25 0.75 7.63 8.63Total penetration (m) 250

W. USSLER ET AL.A TEST OF THE TPC TOOL PROTOTYPE 35
Table T4. Drilling data, Hole 1245C. (See table notes. Continued on next page.)
Core
Time on deck
Advanced (m)
Recovery (%)
Shear pins
Shear pressure
(psi)Speed holes
Pull (kips) Stroke
Core catcher
used (rpm)Time
Date (Aug 2002)
Depth (m)
Top BottomBelow
seafloor
Length (m)
Cored Recovered
204-1245C-1H 1740 10 880.0 887.5 7.5 7.5 7.5 7.84 105 2H 2700 0 0 Y FP
2H 1850 10 887.5 897.0 17.0 9.5 9.5 9.78 103 2H 2700 0 0 Y FP3P 2005 10 897.0 898.0 18.0 1.0 1.0 1.00 100 0 SPM 0 — — 3 K 45 RPMDI 2010 10 898.0 899.0 19.0 1.0 — — — 30 SPM 75 — — 3 K 45 RPM4H 2030 10 899.0 908.5 28.5 9.5 9.5 9.74 103 2H 2700 0 10 Y FP5H 2100 10 908.5 918.0 38.0 9.5 9.5 10.12 107 2H 2700 0 10 Y FP6H 2145 10 918.0 927.5 47.5 9.5 9.5 6.23 66 2H 2700 2 25 Y FP-10F7H 2230 10 927.5 937.0 57.0 9.5 9.5 9.27 98 2H 2700 2 25 Y FP8P 2350 10 937.0 938.0 58.0 1.0 1.0 1.00 100 20 SPM 75 — — 4 K 65 RPMDI 2355 10 938.0 939.0 59.0 1.0 — — — 20 SPM 75 — — 4 K 65 RPM9H 0020 11 939.0 948.5 68.5 9.5 9.5 9.47 100 2H 2700 2 25 Y FP-10F10H 0055 11 948.5 958.0 78.0 9.5 9.5 9.40 99 2H 2700 2 25 Y FP11H 0130 11 958.0 967.5 87.5 9.5 9.5 8.92 94 2H 2700 4 40 Y FP-10F12H 0210 11 967.5 977.0 97.0 9.5 9.5 5.04 53 2H 2700 4 40 Y FP13H 0250 11 977.0 986.5 106.5 9.5 9.5 9.75 103 2H 2700 4 40 Y FP-10F14H 0410 11 986.5 996.0 116.0 9.5 9.5 10.09 106 2H 2700 4 50 Y FP-10F24H 1450 11 1057.1 1066.6 186.6 9.5 9.5 8.70 92 2H 2700 4 60 N FP25H 1640 11 1066.6 1071.1 191.1 4.5 4.5 4.56 101 2H 2700 4 60 N FP26H 1750 11 1071.1 1075.9 195.9 4.8 4.8 4.83 101 2H 2700 4 60 N FP28H 2030 11 1076.9 1080.7 200.7 3.8 3.8 3.80 100 2H 2700 4 60 N FP
Core
Time on deck
Shoe (type)
Orientation (type) Min AHC
Drill over RemarksTime
Date (Aug 2002)
Depth (m)
Top BottomBelow
seafloor
Wireline
(F/A) Runs
204-1245C-1H 1740 10 880.0 887.5 7.5 F 1 APCT None 0 N N APC Methane Tool In, BWS, Fluorescent
microspheres and tracer2H 1850 10 887.5 897.0 17.0 F 1 Standard None 15 N N Fluorescent microspheres and tracer3P 2005 10 897.0 898.0 18.0 F 1 — — 0 Y N PCS with RBI PDC BitDI 2010 10 898.0 899.0 19.0 — — — — 5 N N4H 2030 10 899.0 908.5 28.5 F 1 Standard None 5 N N Fluorescent microspheres and tracer5H 2100 10 908.5 918.0 38.0 F 1 Standard None 5 N N Fluorescent microspheres and tracer6H 2145 10 918.0 927.5 47.5 F 1 Standard None 20 N N Liner exploded7H 2230 10 927.5 937.0 57.0 F 1 Standard None 5 N N Fluorescent microspheres and tracer8P 2350 10 937.0 938.0 58.0 F 1 — — 16 Y N PCS with RBI PDC BitDI 2355 10 938.0 939.0 59.0 — — — — 2 N N9H 0020 11 939.0 948.5 68.5 F 1 Standard None 5 N N10H 0055 11 948.5 958.0 78.0 F 1 Standard None 5 N N Fluorescent microspheres and tracer11H 0130 11 958.0 967.5 87.5 F 1 Standard None 5 Y N12H 0210 11 967.5 977.0 97.0 F 1 Standard None 10 Y N Fluorescent microspheres and tracer13H 0250 11 977.0 986.5 106.5 F 1 Standard None 10 Y N14H 0410 11 986.5 996.0 116.0 F 1 Standard None 20 Y N APC Methane Tool out24H 1450 11 1057.1 1066.6 186.6 F 1 APCT None 5 N N Fluorescent microspheres and tracer25H 1640 11 1066.6 1071.1 191.1 F 1 APCT None 45 N N Fluorescent microspheres and tracer26H 1750 11 1071.1 1075.9 195.9 F 1 APCT None 20 N N Fluorescent microspheres and tracer28H 2030 11 1076.9 1080.7 200.7 F 1 APCT None 5 N N Fluorescent microspheres and tracer

W. USSLER ET AL.A TEST OF THE TPC TOOL PROTOTYPE 36
Table T4 (continued).
Notes: Spud date = 10 August 2002, rig time = 1730, GMT = rig time + 7 hr. Bottom-hole assembly length = 136.14 m. Seafloor = 880.0mbsl, precision depth recorder = 886.4 mbsl. An 11-7/16-inch RBI C-3 bit with 4 jets was used (serial number CD980). All measurementsare from pump 1. Rerun hours on used bit = 107.23. Stroke: Y = core barrel had full stroke, N = core barrel did not have full stroke. F =fore core liner winch was used, A = aft core liner winch was used. Min = minutes required to advance bit. AHC: Y = active heave compen-sator (AHC) on and operating, N = AHC off and not operating. Drill over: Y = drill over used to recover core barrel, N = drill over notrequired to recover core barrel. APCT = advanced piston corer temperature tool, PCS = pressure core sampler, RBI = Rock Bit Interna-tional auger bit (www-odp.tamu.edu/publications/tnotes/tn31/pcs/fig_02.htm), PDC = RBI polycrystalline diamond compact drillbit (www-odp.tamu.edu/publications/tnotes/tn31/pcs/fig_02.htm), APCM = advanced piston corer methane tool (same as TPCtool), DSA = drill string accelerator tool, DVTPP = Davis-Villinger Temperature-Pressure Probe, XCB = extended core barrel, FPC = Fugropressure corer, APC = advanced piston corer. APC cores with TPC data are highlighted in yellow.
Measurement PCS APC
Number of cores 3 16Total drilled (m) 3782.0Total cored (m) 337.0 134.6Total recovered (m) 337.00 127.54Recovery (%) 100 94.8Total wireline runs 2 16Total bit F/hole (hr) 0.38 3.00Total active heave (hr) 0.3 0.8

W. USSLER ET AL.A TEST OF THE TPC TOOL PROTOTYPE 37
Table T5. Drilling data, Hole 1247B.
Notes: Spud date: 23 August 2002, rig time = 1016, GMT = rig time + 7 hr. Bottom-hole assemble length = 126.85 m. Seafloor = 845.9mbsl, precision depth recorder = 844.4 mbsl. An 11-7/16-inch RBI C-3 bit with 4 jets was used (serial number CD980). All measurementsare from pump 1. Rerun hours on used bit = 126.25. Stroke: Y = core barrel had full stroke, N = core barrel did not have full stroke. F =fore core liner winch was used, A = aft core liner winch was used. Min = minutes required to advance bit. AHC: Y = active heave compen-sator (AHC) on and operating, N = AHC off and not operating. Drill over: Y = drill over used to recover core barrel, N = drill over notrequired to recover core barrel. APCT = advanced piston corer temperature tool, PCS = pressure core sampler, RBI = Rock Bit Interna-tional auger bit (www-odp.tamu.edu/publications/tnotes/tn31/pcs/fig_02.htm), PDC = RBI polycrystalline diamond compact drillbit (www-odp.tamu.edu/publications/tnotes/tn31/pcs/fig_02.htm), APCM = advanced piston corer methane tool (same as TPCtool), DSA = drill string accelerator tool, DVTPP = Davis-Villinger Temperature-Pressure Probe, XCB = extended core barrel, FPC = Fugropressure corer, APC = advanced piston corer. APC cores with TPC data are highlighted in yellow.
Core
Time on
deck
Depth (m)
Advanced (m)
Recovery (%)
Shear pins
Shear pressure
(psi)Speed holes
Pull (kips) Stroke
Core catcher
used (rpm)Top Bottom
Below seafloor
Length (m) Wireline
Cored Recovered (F/A) Runs
204-1247B-1H 1035 845.9 849.5 3.6 3.6 3.6 3.60 100 2H 2700 0 0 Y FP-10F F 12H 1115 849.5 859.0 13.1 9.5 9.5 10.16 107 2H 2700 0 0 Y FP-10F F 13H 1150 859.0 868.5 22.6 9.5 9.5 9.88 104 2H 2700 0 0 Y FP-10F F 14P 1305 868.5 869.5 23.6 1.0 1.0 1.00 100 0 SPM 0 — — 5 K 50 F 1DI 1310 869.5 870.5 24.6 1.0 — — — 40 SPM 125 — — 5 K 40 — —5H 1350 870.5 880.0 34.1 9.5 9.5 10.47 110 2H 2700 0 30 Y FP-10F F 16H 1420 880.0 889.5 43.6 9.5 9.5 10.32 109 2H 2700 0 15 Y FP-10F F 17H 1505 889.5 899.0 53.1 9.5 9.5 9.53 100 2H 2700 0 40 Y FP-10F F 18H 1550 899.0 908.5 62.6 9.5 9.5 10.03 106 2H 2700 0 35 N FP-10F F 19H 1645 908.5 918.0 72.1 9.5 9.5 9.71 102 2H 2700 0 45 N FP-10F F 110H 1715 918.0 927.5 81.6 9.5 9.5 9.85 104 2H 2700 4 45 N FP-10F F 111H 1845 927.5 937.0 91.1 9.5 9.5 8.94 94 2H 2700 4 60 N FP-10F F 112H 1915 937.0 946.5 100.6 9.5 9.5 9.40 99 2H 2700 4 50 N FP-10F F 113H 2015 946.5 952.6 106.7 6.1 6.1 6.17 101 2H 2700 4 60 N FP-10F F 114H 2055 952.6 959.5 113.6 6.9 6.9 6.93 100 2H 2700 4 60 N FP-10F F 1
Core
Time on
deck
Depth (m)
Shoe (type)
Orientation (type) Min AHC
Drill over RemarksTop Bottom
Below seafloor
204-1247B-1H 1035 845.9 849.5 3.6 APCT None 0 N N BWS, APC Methane Tool in2H 1115 849.5 859.0 13.1 Standard None 5 N N3H 1150 859.0 868.5 22.6 Standard None 5 Y N4P 1305 868.5 869.5 23.6 — — 15 Y N PCS with Methane Tool with RBI PDC BitDI 1310 869.5 870.5 24.6 — — 10 N N5H 1350 870.5 880.0 34.1 APCT None 5 N N6H 1420 880.0 889.5 43.6 Standard None 5 N N7H 1505 889.5 899.0 53.1 APCT None 5 N N8H 1550 899.0 908.5 62.6 Standard None 15 N N9H 1645 908.5 918.0 72.1 APCT None 10 N N10H 1715 918.0 927.5 81.6 Standard None 10 N N11H 1845 927.5 937.0 91.1 APCT None 10 N Y12H 1915 937.0 946.5 100.6 Standard None 30 N N13H 2015 946.5 952.6 106.7 APCT None 15 N N14H 2055 952.6 959.5 113.6 Standard None 10 N N
Measurement PCS APC
Number of cores 1 13Total drilled (m) 1.0Total cored (m) 1.0 111.6Total recovered (m) 1.00 114.99Recovery (%) 100 103Total wireline runs 1 13Total bit F/hole (hr) 0.42 2.08Total active heave (hr) 0.25 0.08

W. USSLER ET AL.A TEST OF THE TPC TOOL PROTOTYPE 38
Table T6. Drilling data, Hole 1250D.
Notes: Spud date = 3 August 2002, rig time = 1745, GMT = rig time + 7 hr. Bottom-hole assembly length = 136.14 m. Seafloor = 807.0mbsl, precision depth recorder = 809.4 mbsl. An 11-7/16-inch RBI C-3 bit with 4 jets was used (serial number CD980). All measurementsare from pump 1. Rerun hours on used bit = 62.80. Stroke: Y = core barrel had full stroke, N = core barrel did not have full stroke. F =fore core liner winch was used, A = aft core liner winch was used. Min = minutes required to advance bit. AHC: Y = active heave compen-sator (AHC) on and operating, N = AHC off and not operating. Drill over: Y = drill over used to recover core barrel, N = drill over notrequired to recover core barrel. APCT = advanced piston corer temperature tool, PCS = pressure core sampler, RBI = Rock Bit Interna-tional auger bit (www-odp.tamu.edu/publications/tnotes/tn31/pcs/fig_02.htm), PDC = RBI polycrystalline diamond compact drillbit (www-odp.tamu.edu/publications/tnotes/tn31/pcs/fig_02.htm), APCM = advanced piston corer methane tool (same as TPCtool), DSA = drill string accelerator tool, DVTPP = Davis-Villinger Temperature-Pressure Probe, XCB = extended core barrel, FPC = Fugropressure corer, APC = advanced piston corer. APC cores with TPC data are highlighted in yellow.
Core
Depth (m)
Advanced (m)
Recovery (%)
Shear pins
Shear pressure
(psi)Speed holes
Pull (kips) Stroke
Core catcher
used (rpm)
Time on deck
Top BottomBelow
seafloor
Length (m)
Rig GMT Cored Recovered
204-1250D-1H 1755 0055 807.0 813.5 6.5 6.5 6.5 2.76 42 2H 2700 0 0 Y FP-10F2H 1910 0210 813.5 823.0 16.0 9.5 9.5 7.57 80 2H 2700 0 0 Y FP-10F3H 2020 0320 823.0 832.5 25.5 9.5 9.5 10.15 107 2H 2700 0 20 Y FP4H 2140 0440 832.5 842.0 35.0 9.5 9.5 9.89 104 2H 2700 0 40 Y FP5P 2255 0555 842.0 843.0 36.0 1.0 1.0 1.00 100 20 SPM 75 — — 5 K 80DI 2300 0600 843.0 844.0 37.0 1.0 — — — 40 SPM 125 — — 5 K 806H 2345 0645 844.0 853.5 46.5 9.5 9.5 10.01 105 2H 2700 0 45 Y FP7H 0045 0745 853.5 863.0 56.0 9.5 9.5 9.92 104 2H 2700 0 45 Y FP-10F8H 0220 0920 863.0 872.5 65.5 9.5 9.5 9.80 103 2H 2700 0 45 Y FP9H 0310 1010 872.5 882.0 75.0 9.5 9.5 10.17 107 2H 2700 2 40 Y FP-10F10H 0400 1100 882.0 891.5 84.5 9.5 9.5 9.55 101 2H 2700 2 40 Y FP11H 0450 1150 891.5 901.0 94.0 9.5 9.5 9.85 104 2H 2700 2 40 Y FP-10F12H 0610 1310 901.0 910.5 103.5 9.5 9.5 7.82 82 2H 2700 2 50 Y FP13P 0745 1445 910.5 911.5 104.5 1.0 1.0 1.00 100 20 SPM 125 — — 5 K 80DI 0748 1448 911.5 912.5 105.5 1.0 — — — 20 SPM 125 — — 5 K 8014H 0825 1525 912.5 922.0 115.0 9.5 9.5 6.21 65 2H 2700 4 40 Y FP
Core
Depth (m)
Shoe (type)
Orientation (type) Remarks
Time on deck
Top BottomBelow
seafloor
Wireline
Rig GMT (F/A) Runs
204-1250D-1H 1755 0055 807.0 813.5 6.5 F 1 Standard None APC Corer Methane Tool in2H 1910 0210 813.5 823.0 16.0 F 1 Standard None3H 2020 0320 823.0 832.5 25.5 F 1 Standard None Fluorescent microspheres and tracers4H 2140 0440 832.5 842.0 35.0 F 1 APCT None Fluorescent microspheres and tracers5P 2255 0555 842.0 843.0 36.0 F 1 — — PCS with Methane Tool and RBI PDC BitDI 2300 0600 843.0 844.0 37.0 — — — —6H 2345 0645 844.0 853.5 46.5 F 1 APCT None Fluorescent microspheres and tracers7H 0045 0745 853.5 863.0 56.0 F 1 Standard None8H 0220 0920 863.0 872.5 65.5 F 1 APCT None Fluorescent microspheres and tracers, drillover9H 0310 1010 872.5 882.0 75.0 F 1 Standard None10H 0400 1100 882.0 891.5 84.5 F 1 Standard None Fluorescent microspheres and tracers11H 0450 1150 891.5 901.0 94.0 F 1 Standard None12H 0610 1310 901.0 910.5 103.5 F 1 APCT None Fluorescent microspheres and tracers13P 0745 1445 910.5 911.5 104.5 F 1 — — PCS with Methane Tool and RBI PDC BitDI 0748 1448 911.5 912.5 105.5 — — — —14H 0825 1525 912.5 922.0 115.0 F 2 Standard None WP and tracers/ DVTPP at 922.0 m APC Methane Tool out
Measurement PCS APC
Number of cores 2 12Total drilled (m) 2.0Total cored (m) 2.0 111.0Total recovered (m) 2.00 103.70Recovery (%) 100 93.4Total wireline runs 2 13Total bit F/hole (hr) 0.65 2.95Total active heave (hr) 0.65 2.03

W. USSLER ET AL.A TEST OF THE TPC TOOL PROTOTYPE 39
Table T7. Drilling data, Hole 1251D. (See table notes. Continued on next page.)
Core
Depth (m)
Advanced (m)
Recovery (%)
Shear pins
Speed pressure
(psi)Speed holes
Pulls (kips) Stroke
Core catcher
used (rpm)
Time on deck
Top BottomBelow
seafloor
Length (m)
Rig GMT Cored Recovered
204-1251D-4H 0905 1605 1248.3 1257.8 36.4 9.5 9.5 7.77 82 2H 1500 0 0 Y FP
5H 0945 1645 1257.8 1267.3 45.9 9.5 9.5 9.67 102 2H 2700 0 0 Y FP6P 1055 1755 1267.3 1268.3 46.9 1.0 1.0 1.00 100 20 SPM 115 5 K 50DI 1100 1800 1268.3 1269.3 47.9 1.0 20 SPM 115 5 K 507H 1135 1835 1269.3 1278.8 57.4 9.5 9.5 8.27 87 2H 2700 0 0 Y FP-10F8H 1205 1905 1278.8 1288.3 66.9 9.5 9.5 8.90 94 2H 2700 0 10 Y FP9H 1240 1940 1288.3 1297.8 76.4 9.5 9.5 8.86 93 2H 2700 2 10 Y FP-10F10P 1405 2105 1297.8 1298.8 77.4 1.0 1.0 1.00 100 20 SPM 115 5 K 80DI 1410 2110 1298.8 1299.8 78.4 1.0 40 SPM 125 5 K 4011H 1450 2150 1299.8 1309.3 87.9 9.5 9.5 9.18 97 2H 2700 2 15 Y FP
12H 1520 2220 1309.3 1318.8 97.4 9.5 9.5 9.13 96 2H 2700 2 15 Y FP-10F13H 1555 2255 1318.8 1328.3 106.9 9.5 9.5 9.36 99 2H 2700 4 15 Y FP14H 1640 2340 1328.3 1337.8 116.4 9.5 9.5 9.68 102 2H 2700 4 35 Y FP-10F15H 1705 0005 1337.8 1347.3 125.9 9.5 9.5 9.21 97 2H 2700 4 35 Y FP16H 1800 0100 1347.3 1356.8 135.4 9.5 9.5 10.04 106 2H 2700 4 35 Y FP-10F17H 1840 0140 1356.8 1366.3 144.9 9.5 9.5 9.90 104 2H 2700 4 40 Y FP18H 1925 0225 1366.3 1375.8 154.4 9.5 9.5 3.26 34 2H 2700 4 45 Y FP-10F19H 2145 0445 1375.8 1385.3 163.9 9.5 9.5 9.59 101 2H 2700 4 45 Y FP-10F20H 0125 0825 1385.3 1394.8 173.4 9.5 9.5 9.67 102 2H 2700 4 45 Y FP21P 0335 1035 1394.8 1395.8 174.4 1.0 1.0 1.00 100 26 SPM 100 5 K 70DI 0340 1040 1395.8 1396.8 175.4 1.0 55 SPM 125 5 K 60
Core
Depth (m)
Shoe (type)
Orientation (type) Remarks
Time on deck
Top BottomBelow
seafloor
Wireline
Rig GMT (F/A) Runs
204-1251D-4H 0905 1605 1248.3 1257.8 36.4 F 1 Standard None Fluorescent microspheres and PFT tracers, mechanical
shear5H 0945 1645 1257.8 1267.3 45.9 F 1 Standard None Fluorescent microspheres and PFT tracers6P 1055 1755 1267.3 1268.3 46.9 F 1 Standard None PCS with Methane Tool-RBI2 Pdc BitDI 1100 1800 1268.3 1269.3 47.97H 1135 1835 1269.3 1278.8 57.4 F 1 Standard None8H 1205 1905 1278.8 1288.3 66.9 F 1 Standard None Fluorescent microspheres and PFT tracers9H 1240 1940 1288.3 1297.8 76.4 F 1 Standard None10P 1405 2105 1297.8 1298.8 77.4 F 1 PCS with Methane Tool-RBI2 Pdc BitDI 1410 2110 1298.8 1299.8 78.411H 1450 2150 1299.8 1309.3 87.9 F 1 Standard None APC Methane in/with Fluorescent microspheres and PFT
tracers12H 1520 2220 1309.3 1318.8 97.4 F 1 Standard None13H 1555 2255 1318.8 1328.3 106.9 F 1 Standard None Fluorescent microspheres and tracers14H 1640 2340 1328.3 1337.8 116.4 F 1 Standard None15H 1705 0005 1337.8 1347.3 125.9 F 1 Standard None Fluorescent microspheres and tracers16H 1800 0100 1347.3 1356.8 135.4 F 1 Standard None17H 1840 0140 1356.8 1366.3 144.9 F 1 Standard None Fluorescent microspheres and tracers18H 1925 0225 1366.3 1375.8 154.4 F 1 Standard None19H 2145 0445 1375.8 1385.3 163.9 F 1 Standard None20H 0125 0825 1385.3 1394.8 173.4 F 1 APCT None Fluorescent microspheres and tracers/Drillover21P 0335 1035 1394.8 1395.8 174.4 F 2 Sheared overshot PCS with Methane Tool-RBI2 Pdc BitDI 0340 1040 1395.8 1396.8 175.4 F 1 0 DVTPP at 1396.8 m (175.4 mbsf)

W. USSLER ET AL.A TEST OF THE TPC TOOL PROTOTYPE 40
Table T7 (continued).
Notes: Spud date = 31 July 2002, rig time = 0710, GMT = rig time + 7 hr. Bottom-hole assembly length = 136.14 m. Seafloor = 1221.4mbsl, precision depth recorder = 1222.4 mbsl. An 11-7/16-inch RBI C-3 bit with 4 jets was used (serial number CD980). All measure-ments are from pump 1. Rerun hours on used bit = 43.92. Stroke: Y = core barrel had full stroke, N = core barrel did not have full stroke.F = fore core liner winch was used, A = aft core liner winch was used. Min = minutes required to advance bit. AHC: Y = active heave com-pensator (AHC) on and operating, N = AHC off and not operating. Drill over: Y = drill over used to recover core barrel, N = drill over notrequired to recover core barrel. APCT = advanced piston corer temperature tool, PCS = pressure core sampler, RBI = Rock Bit Interna-tional auger bit (www-odp.tamu.edu/publications/tnotes/tn31/pcs/fig_02.htm), PDC = RBI polycrystalline diamond compact drillbit (www-odp.tamu.edu/publications/tnotes/tn31/pcs/fig_02.htm), APCM = advanced piston corer methane tool (same as TPCtool), DSA = drill string accelerator tool, DVTPP = Davis-Villinger Temperature-Pressure Probe, XCB = extended core barrel, FPC = Fugropressure corer, APC = advanced piston corer. APC cores with TPC data are highlighted in yellow.
Measurement PCS APC
Number of cores 3 15Total cored (m) 3.0 142.5Total recovered (m) 3.00 132.49Recovery (%) 100 93Total wireline runs 4 16Total bit F/hole (hr) 0.52 2.42Total active heave (hr) 0.52 1.58

W. USSLER ET AL.A TEST OF THE TPC TOOL PROTOTYPE 41
Table T8. Drilling data, Hole 1252A.
Notes: Spud date = 31 August 2002, rig time = 0325, GMT = rig time + 7 hr. Bottom-hole assembly length = 126.85 m. Seafloor = 1051mbsl, precision depth recorder = 1051.4 mbsl. An 11-7/16-inch RBI C-3 bit with 4 jets was used (serial number CD980). All measure-ments are from pump 1. Rerun hours on used bit = 152.19. Stroke: Y = core barrel had full stroke, N = core barrel did not have full stroke.F = fore core liner winch was used, A = aft core liner winch was used. Min = minutes required to advance bit. AHC: Y = active heave com-pensator (AHC) on and operating, N = AHC off and not operating. Drill over: Y = drill over used to recover core barrel, N = drill over notrequired to recover core barrel. APCT = advanced piston corer temperature tool, PCS = pressure core sampler, RBI = Rock Bit Interna-tional auger bit (www-odp.tamu.edu/publications/tnotes/tn31/pcs/fig_02.htm), PDC = RBI polycrystalline diamond compact drillbit (www-odp.tamu.edu/publications/tnotes/tn31/pcs/fig_02.htm), APCM = advanced piston corer methane tool (same as TPCtool), DSA = drill string accelerator tool, DVTPP = Davis-Villinger Temperature-Pressure Probe, XCB = extended core barrel, FPC = Fugropressure corer, APC = advanced piston corer. APC cores with TPC data are highlighted in yellow.
Core
Time on
deck
Depth (m)
Advanced (m)
Recovery (%)
Shear pins
Shear pressure
(psi)Speed holes
Pull (kips) Stroke
Core catcher
used (rpm)Top Bottom
Below seafloor
Length (m) Wireline
Cored Recovered (F/A) Runs
204-1252A-1H 0340 1051.0 1055.9 4.9 4.9 4.9 4.94 101 2H 2700 0 0 Y FP-10F F 12H 0420 1055.9 1065.4 14.4 9.5 9.5 10.03 106 2H 2700 0 0 Y FP-10F F 13H 0455 1065.4 1074.9 23.9 9.5 9.5 9.50 100 2H 2700 0 0 Y FP-10F F 14H 0545 1074.9 1084.4 33.4 9.5 9.5 9.92 104 2H 2700 0 20 Y FP-10F F 15H 0610 1084.4 1093.9 42.9 9.5 9.5 10.10 106 2H 2700 0 0 Y FP-10F F 16H 0710 1093.9 1103.4 52.4 9.5 9.5 10.15 107 2H 2700 2 30 Y FP-10F F 17H 0745 1103.4 1112.9 61.9 9.5 9.5 9.38 99 2H 2700 2 30 Y FP-10F F 18H 0835 1112.9 1122.4 71.4 9.5 9.5 9.57 101 2H 2700 2 40 Y FP-10F F 19H 0905 1122.4 1131.9 80.9 9.5 9.5 9.93 105 2H 2700 2 20 Y FP-10F F 110H 1000 1131.9 1141.4 90.4 9.5 9.5 9.95 105 2H 2700 4 45 Y FP-10F F 111H 1035 1141.4 1150.9 99.9 9.5 9.5 10.24 108 2H 2700 4 30 Y FP-10F F 112H 1125 1150.9 1160.4 109.4 9.5 9.5 10.31 109 2H 2700 4 45 Y FP-10F F 113H 1200 1160.4 1169.9 118.9 9.5 9.5 10.21 107 2H 2700 4 45 N FP-10F F 114H 1300 1169.9 1176.0 125.0 6.1 6.1 9.87 162 2H 2700 4 50 N FP-10F F 1
Core
Time on
deck
Depth (m)
Shoe (type)
Orientation (type) MIN AHC
Drill over
RemarksTop Bottom
Below seafloor
204-1252A-1H 0340 1051.0 1055.9 4.9 Standard None 0 N N APC Methane Tool on2H 0420 1055.9 1065.4 14.4 Standard None 5 N N3H 0455 1065.4 1074.9 23.9 Standard None 5 N N4H 0545 1074.9 1084.4 33.4 APCT None 5 N N5H 0610 1084.4 1093.9 42.9 Standard None 5 N N6H 0710 1093.9 1103.4 52.4 APCT None 5 N N7H 0745 1103.4 1112.9 61.9 Standard None 5 N N8H 0835 1112.9 1122.4 71.4 APCT None 5 N N9H 0905 1122.4 1131.9 80.9 Standard None 5 Y N10H 1000 1131.9 1141.4 90.4 APCT None 5 Y N11H 1035 1141.4 1150.9 99.9 Standard None 5 Y N12H 1125 1150.9 1160.4 109.4 APCT None 5 Y N13H 1200 1160.4 1169.9 118.9 Standard None 10 Y N14H 1300 1169.9 1176.0 125.0 APCT None 5 Y N APC Methane Tool off
Measurement APC
Number of cores 14Total cored (m) 125.0Total recovered (m) 134.10 Recovery (%) 107.3Total wireline runs 14Total bit F/hole (hr) 1.17Total active heave (hr) 0.6