24-1 the use of budgets in controlling operations is known as budgetary control. takes place by...
TRANSCRIPT
24-1
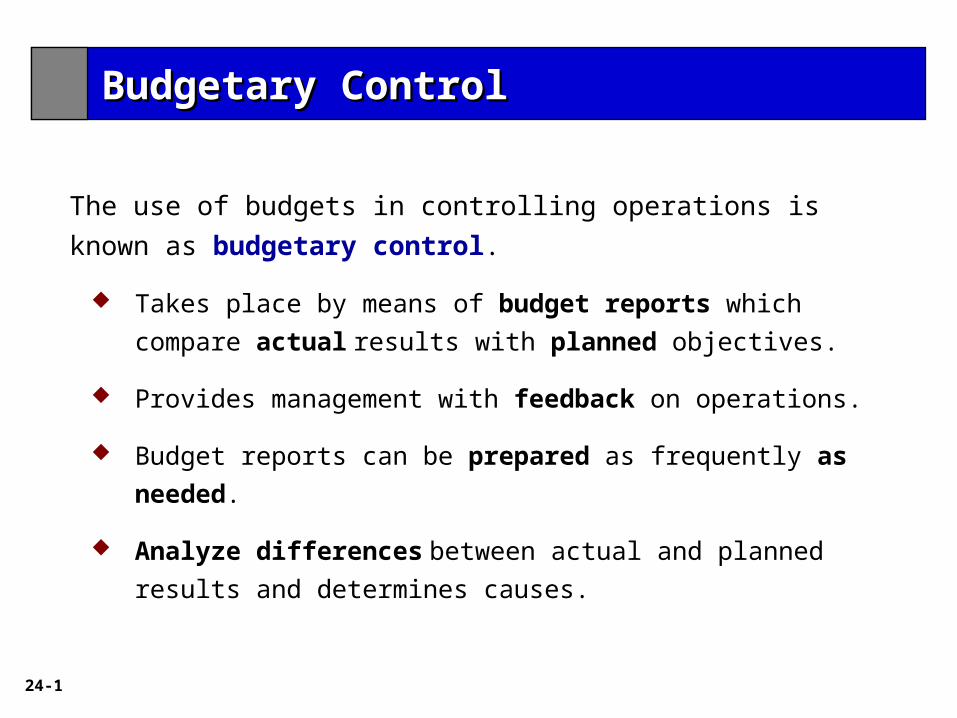
The use of budgets in controlling operations is known as
budgetary control.
Takes place by means of budget reports which compare
actual results with planned objectives.
Provides management with feedback on operations.
Budget reports can be prepared as frequently as needed.
Analyze differences between actual and planned results
and determines causes.
Budgetary ControlBudgetary Control

24-2
Budgetary control involves the following activities.
Illustration 24-1
Budgetary ControlBudgetary Control
24-3
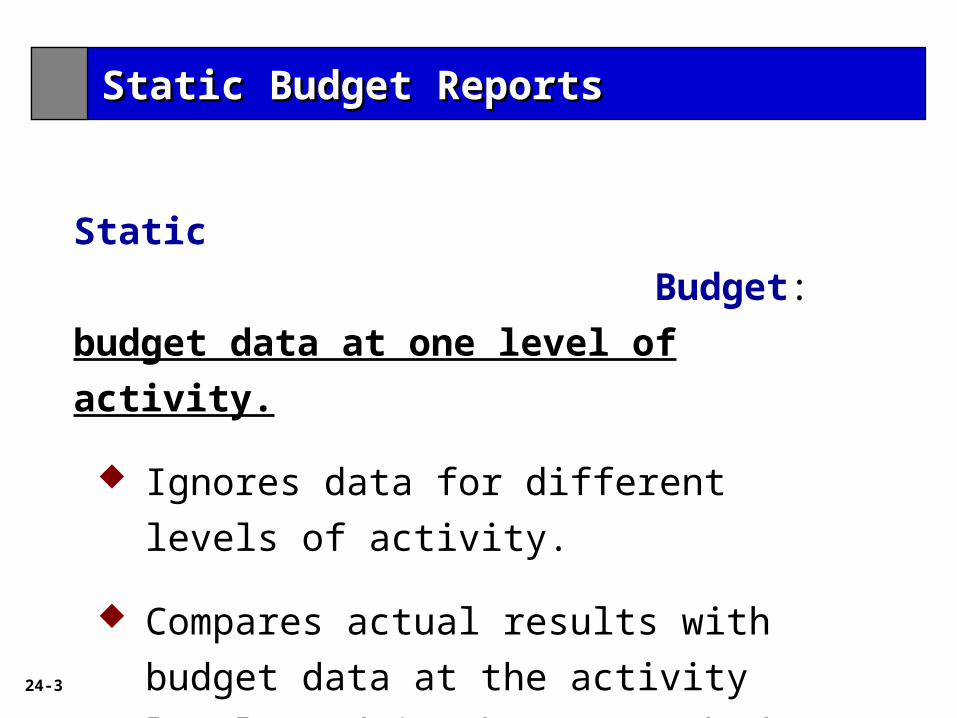
Static
Budget: budget data at one level of activity.
Ignores data for different levels of activity.
Compares actual results with budget data at
the activity level used in the master budget.
Static Budget ReportsStatic Budget Reports

24-4
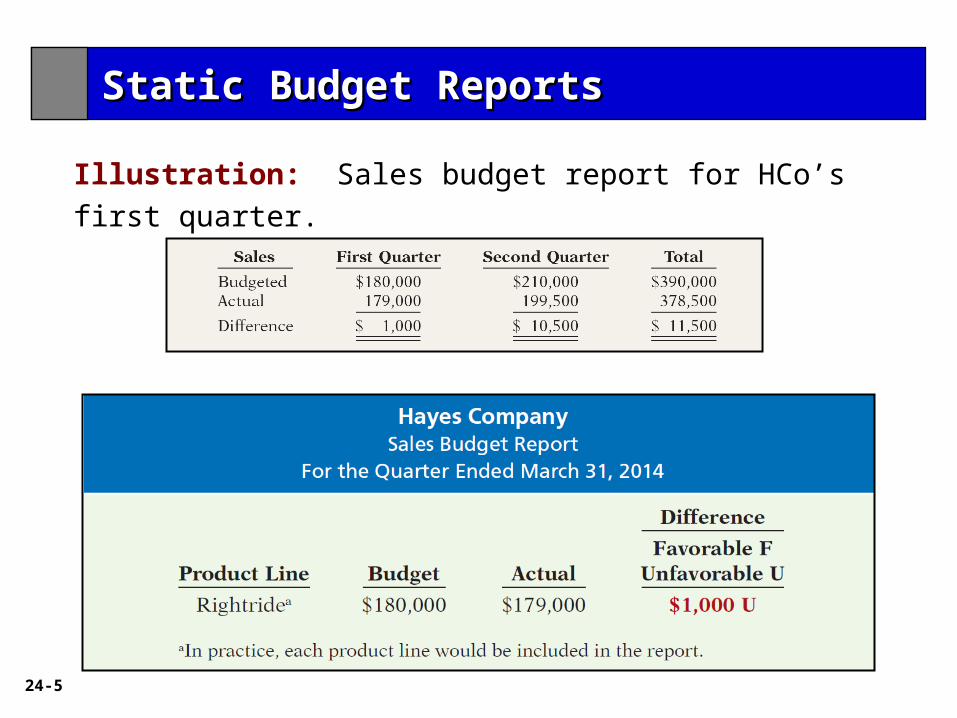
Illustration: Budget and actual sales data in the first and
second quarters of 2014 are:
Static Budget ReportsStatic Budget Reports
24-5
Illustration: Sales budget report for HCo’s first quarter.
Static Budget ReportsStatic Budget Reports

24-6
Illustration: Budget report for the second quarter contains one
new feature: cumulative year-to-date (YTD) information.
Static Budget ReportsStatic Budget Reports
24-7
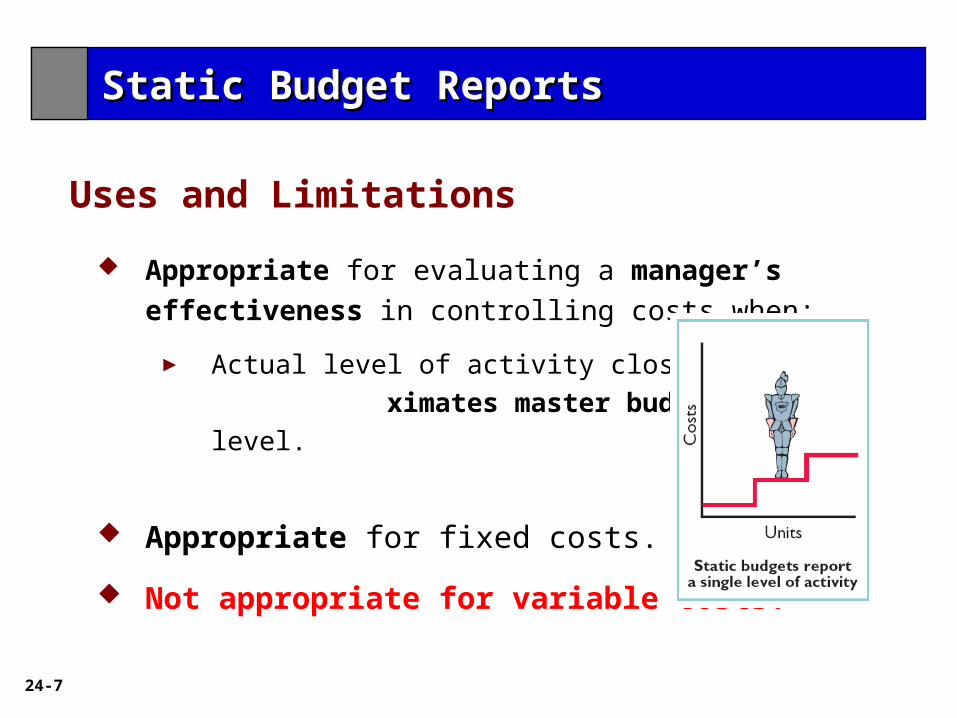
Appropriate for evaluating a manager’s effectiveness in
controlling costs when:
► Actual level of activity close to ximates
master budget activity level.
Appropriate for fixed costs.
Not appropriate for variable costs.
Uses and Limitations
Static Budget ReportsStatic Budget Reports
24-8
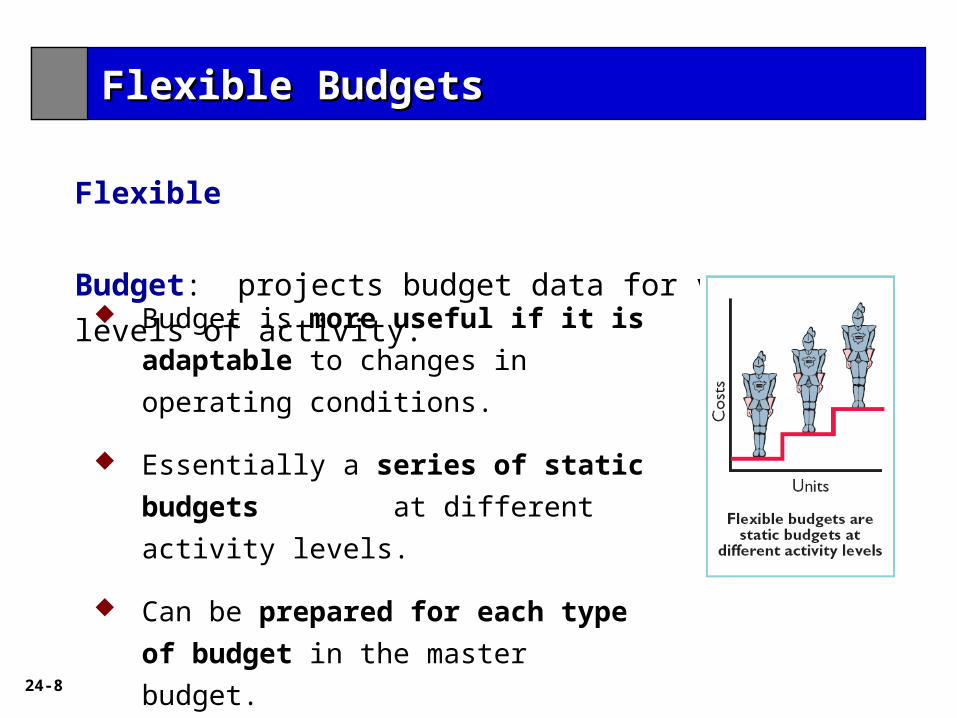
Flexible
Budget: projects budget data for various levels of activity.
Budget is more useful if it is adaptable
to changes in operating conditions.
Essentially a series of static budgets
at different activity levels.
Can be prepared for each type of
budget in the master budget.
Flexible BudgetsFlexible Budgets

24-9
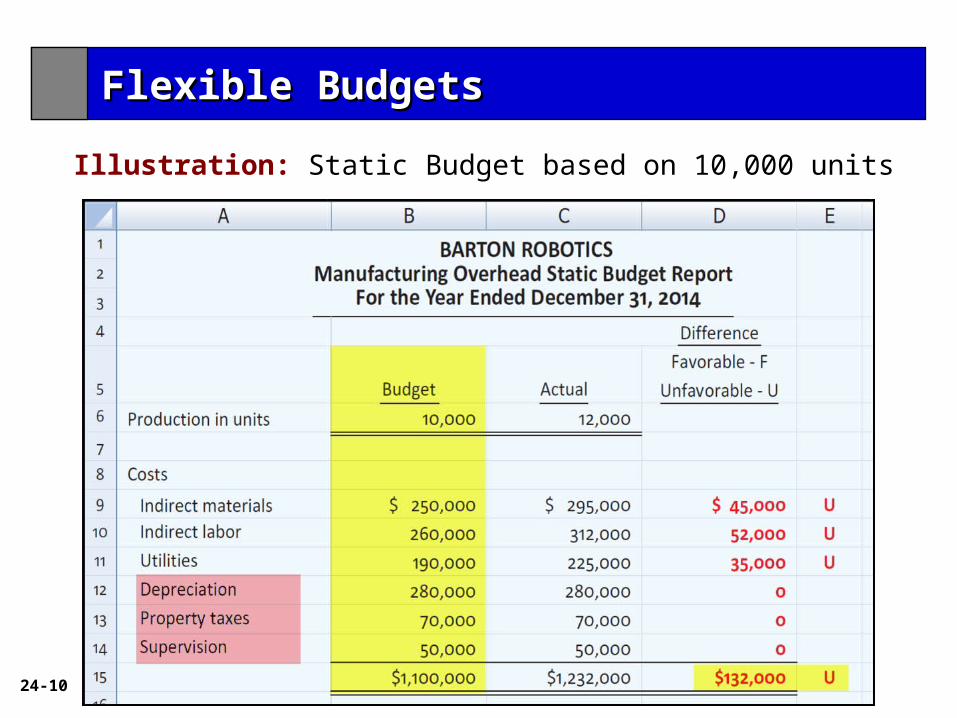
Illustration: Barton Robotics, static budget based on a production
volume of 10,000 units of robotic controls.
Why Flexible Budgets?
Flexible BudgetsFlexible Budgets
Illustration 24-6
24-10
Illustration: Static Budget based on 10,000 units
Flexible BudgetsFlexible Budgets
24-11
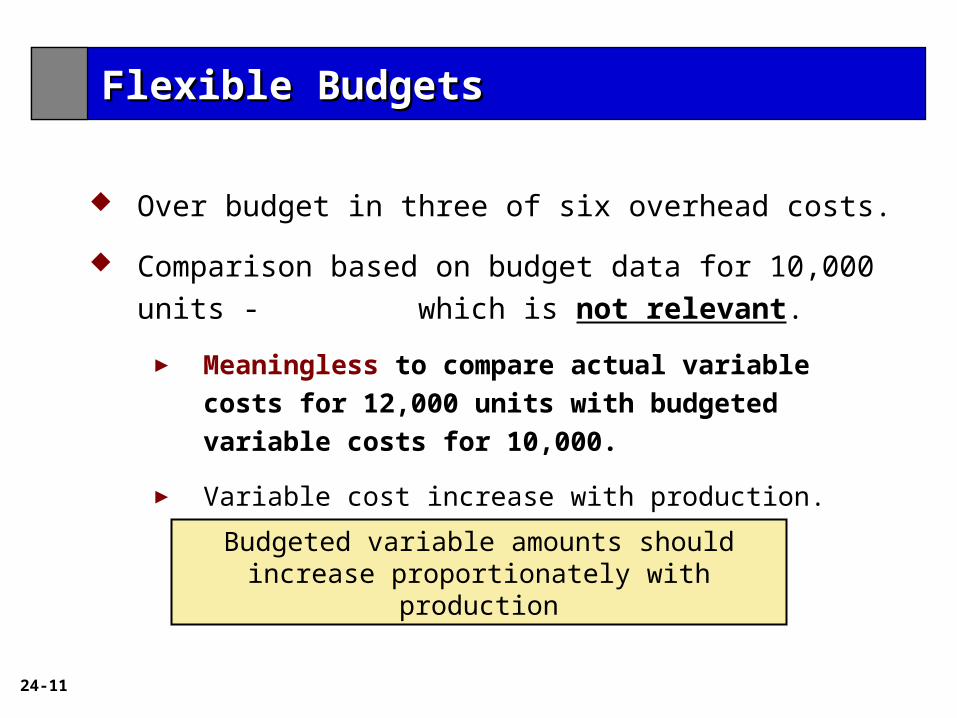
Over budget in three of six overhead costs.
Comparison based on budget data for 10,000 units -
which is not relevant.
► Meaningless to compare actual variable costs for
12,000 units with budgeted variable costs for 10,000.
► Variable cost increase with production.
Budgeted variable amounts should increase proportionately with production
Flexible BudgetsFlexible Budgets
24-12
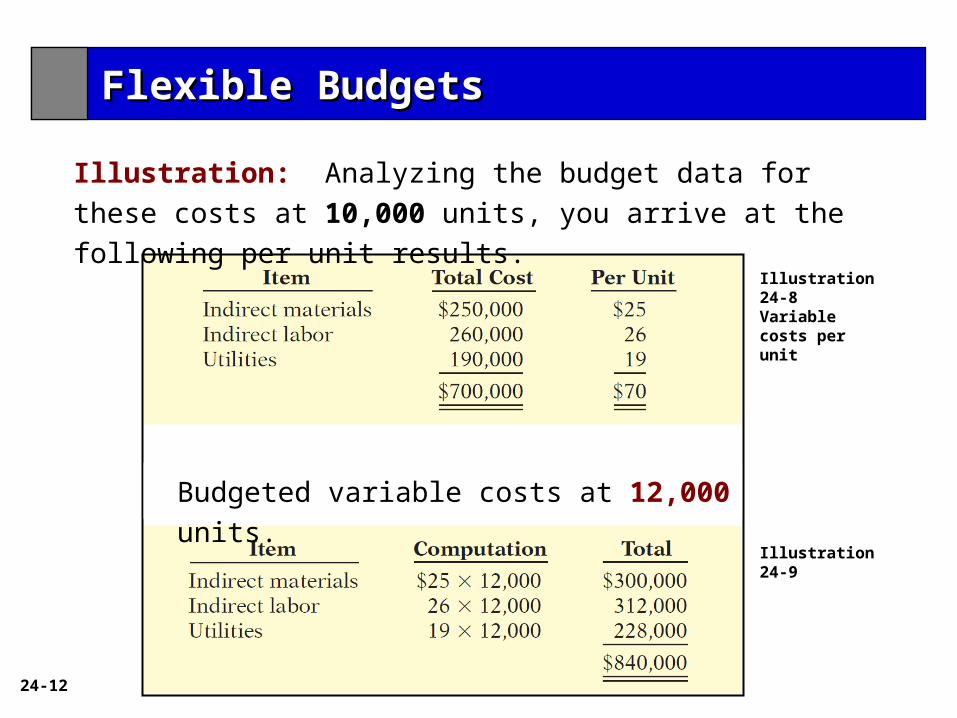
Illustration: Analyzing the budget data for these costs at 10,000
units, you arrive at the following per unit results.
Illustration 24-8 Variable costs per unit
Illustration 24-9
Budgeted variable costs at 12,000 units.
Flexible BudgetsFlexible Budgets

24-13
Illustration: flexible budget for 12,000 units of production.
Flexible BudgetsFlexible Budgets

24-14
Illustration: Fox Company’s management uses a flexible budget for
monthly comparisons of actual and budgeted manufacturing overhead
costs of the Finishing department. The master budget for the year
ending December 31, 2014, shows expected annual operating capacity
of 120,000 direct labor hours and the following overhead costs.
Flexible Budget – A Case Study
Illustration 24-11
Flexible BudgetsFlexible Budgets

24-15
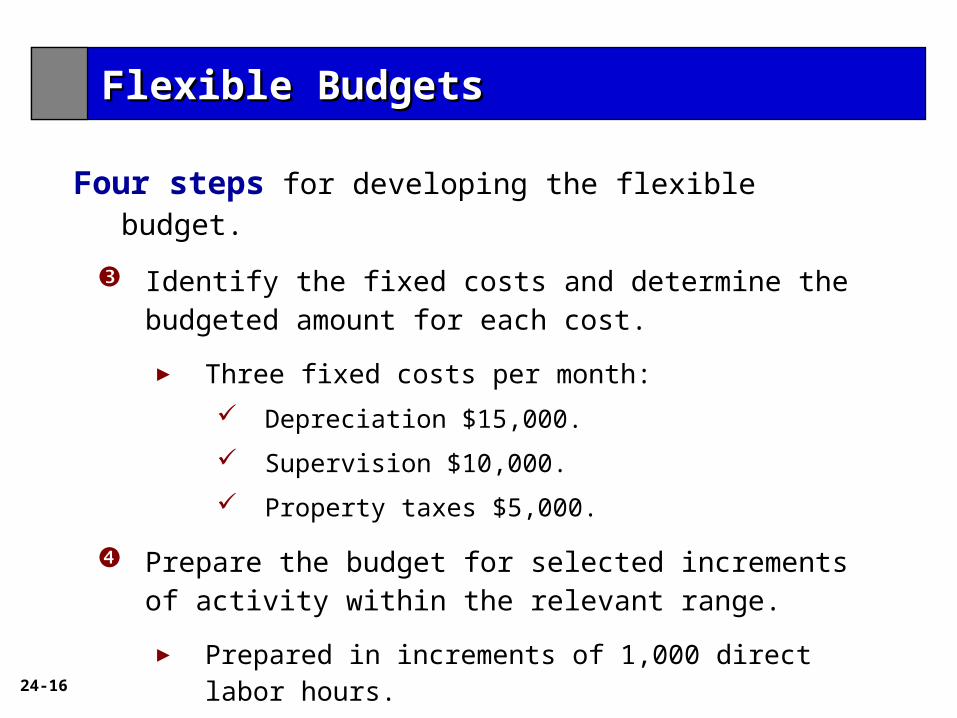
Four steps for developing the flexible budget.
Identify the activity index and the relevant range.
► Activity index: direct labor hours.
► Relevant range: 8,000 – 12,000 direct labor hours per month.
Identify variable costs and determine the budgeted variable cost per unit of activity for each cost.
Illustration 24-12
Flexible BudgetsFlexible Budgets
24-16
Four steps for developing the flexible budget.
Identify the fixed costs and determine the budgeted amount for each cost.
► Three fixed costs per month:
Depreciation $15,000.
Supervision $10,000.
Property taxes $5,000.
Prepare the budget for selected increments of activity within the relevant range.
► Prepared in increments of 1,000 direct labor hours.
Flexible BudgetsFlexible Budgets

24-17
Monthly overhead flexible budget
Flexible BudgetsFlexible Budgets

24-18
Lawler Company expects to produce 40,000 units of product
CV93 during the current year.
Budgeted variable manufacturing costs per unit are direct
materials $6, direct labor $15, and overhead $24.
Annual budgeted fixed manufacturing overhead costs are
$120,000 for depreciation and $60,000 for supervision.
In the current month, Lawler produced 5,000 units and incurred
the following costs:
Were costs controlled?

24-19
Prepare a flexible budget report. Were costs controlled?
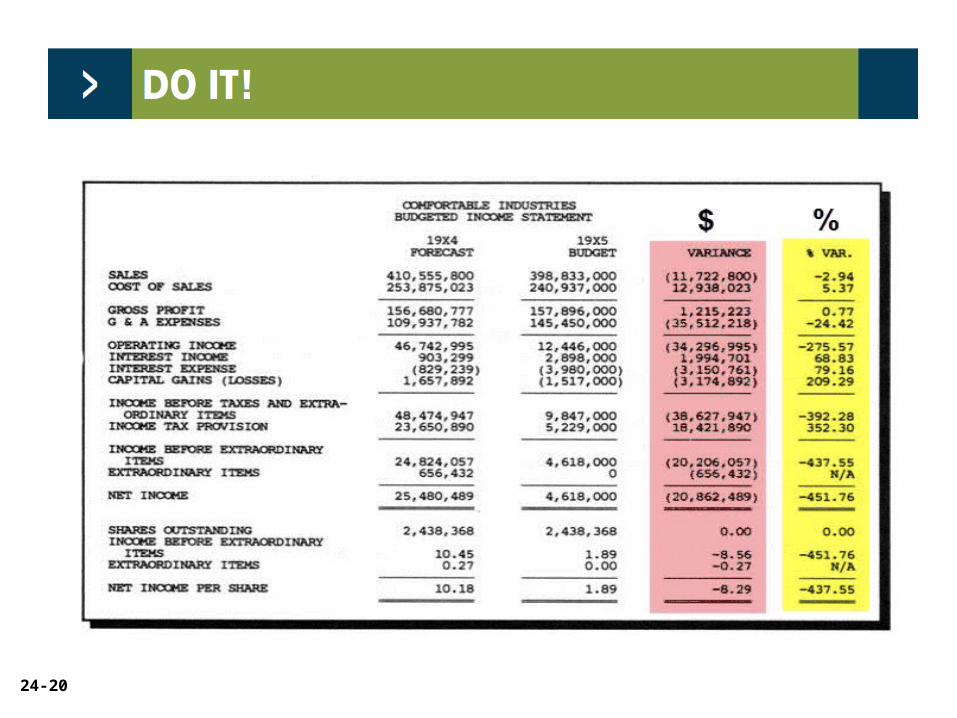
24-20

24-21

24-22
Accumulating and reporting costs (and revenues, where
relevant) on the basis of the manager who has the authority to
make the day-to-day decisions about the items.
Conditions:
1. Costs and revenues can be directly associated with the
specific level of management responsibility.
2. Costs and revenues can be controlled by employees at the
level of responsibility with which they are associated.
3. Budget data can be developed for evaluating the manager’s
effectiveness in controlling the costs and revenues.
Responsibility AccountingResponsibility Accounting

24-23
Levels of responsibility for controlling costs.Illustration 24-17
Responsibility AccountingResponsibility Accounting

24-24
Different from budgeting:
1. Distinguishes between controllable versus
noncontrollable costs.
2. Emphasizes only items controllable by the
individual manager in performance reports.
Responsibility AccountingResponsibility Accounting

24-25
Critical issue is whether the cost or revenue is controllable at
the level of responsibility with which it is associated. A cost over
which a manager has control is called a controllable cost.
1. All costs are controllable by top management.
2. Fewer costs are controllable as one moves down to each
lower level of managerial responsibility.
Costs incurred indirectly and allocated to a responsibility level are
noncontrollable costs.
Controllable Versus Noncontrollable Revenues and Costs
Responsibility AccountingResponsibility Accounting

24-26
Management by exception means that top management’s
review of a budget report is focused primarily on differences
between actual results and planned objectives.
Materiality - Without quantitative guidelines, management
would have to investigate every budget difference
regardless of the amount.
Controllability of the item - Exception guidelines are
more restrictive for controllable items than for items the
manager cannot control.
Management by Exception
Principles of Performance EvaluationPrinciples of Performance Evaluation
24-27
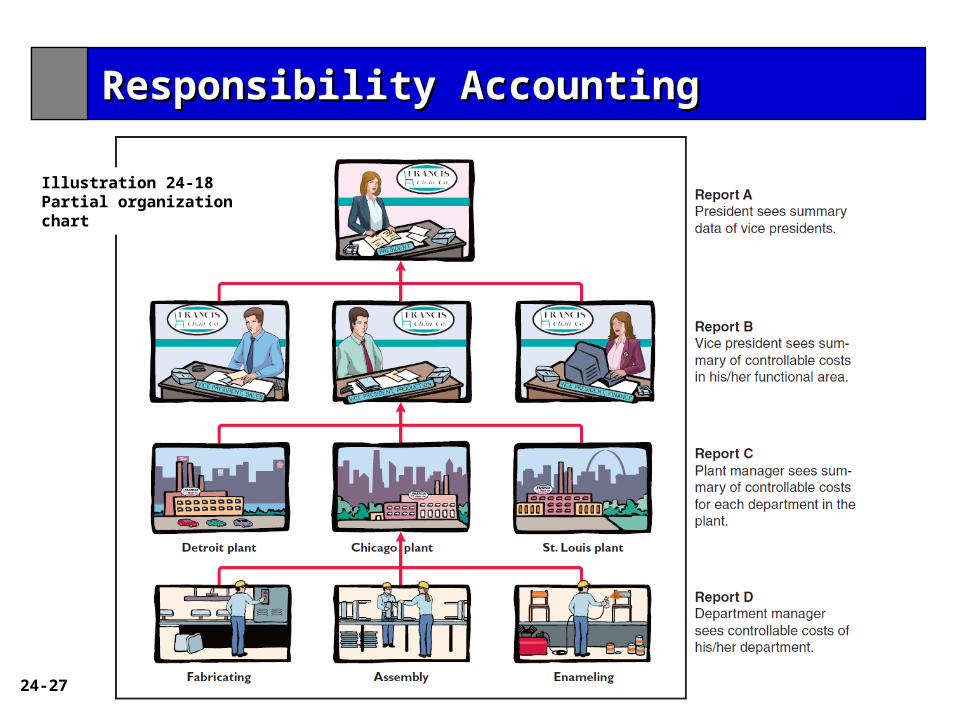
Responsibility AccountingResponsibility Accounting
Illustration 24-18Partial organization chart

24-28
Report APresident sees summarydata of vice presidents.
Report BVice president sees summary of controllable costs in his/her functional area.
Report CPlant manager sees summary of controllable costs for each department in the plant.
Responsibility Responsibility
AccountingAccounting
Report DDepartment manager seescontrollable costs of his/her department.
Illustration 24-19Responsibility reporting system
Permits comparative
evaluations.
Plant manager can rank
each department
manager’s effectiveness
in controlling
manufacturing costs.
Comparative rankings
provide incentive for a
manager to control costs.
24-29
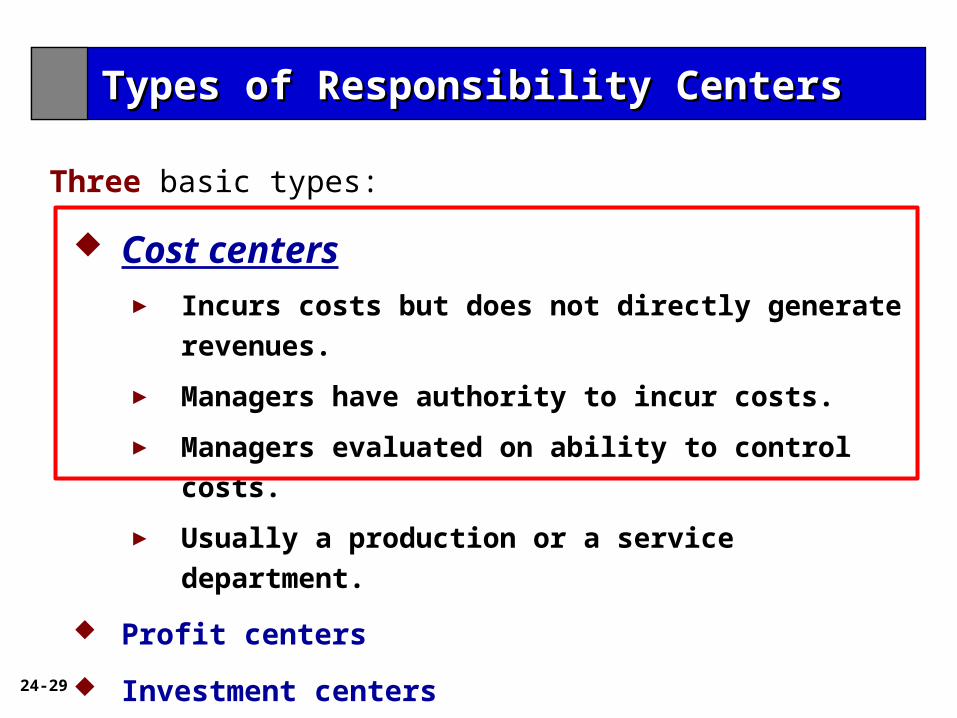
Three basic types:
Cost centers► Incurs costs but does not directly generate revenues.
► Managers have authority to incur costs.
► Managers evaluated on ability to control costs.
► Usually a production or a service department.
Profit centers
Investment centers
Types of Responsibility CentersTypes of Responsibility Centers

24-30
Illustration: The following report is adapted from the flexible
budget report for Fox Manufacturing Company in Illustration 24-16.
Illustration 24-21
Types of Responsibility CentersTypes of Responsibility Centers
24-31
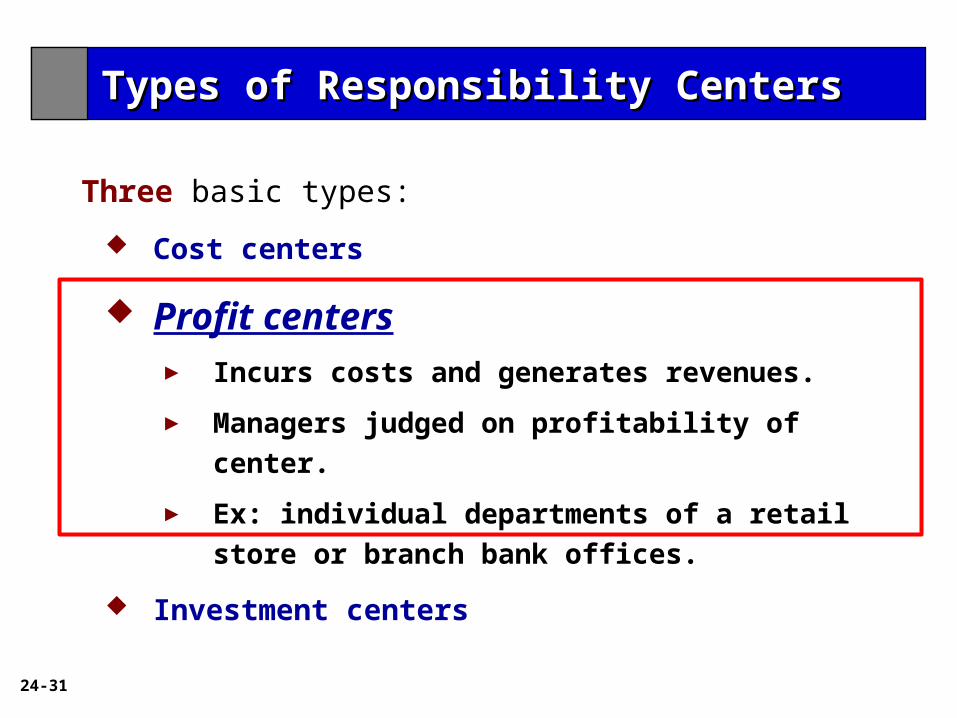
Three basic types:
Cost centers
Profit centers► Incurs costs and generates revenues.
► Managers judged on profitability of center.
► Ex: individual departments of a retail store or
branch bank offices.
Investment centers
Types of Responsibility CentersTypes of Responsibility Centers
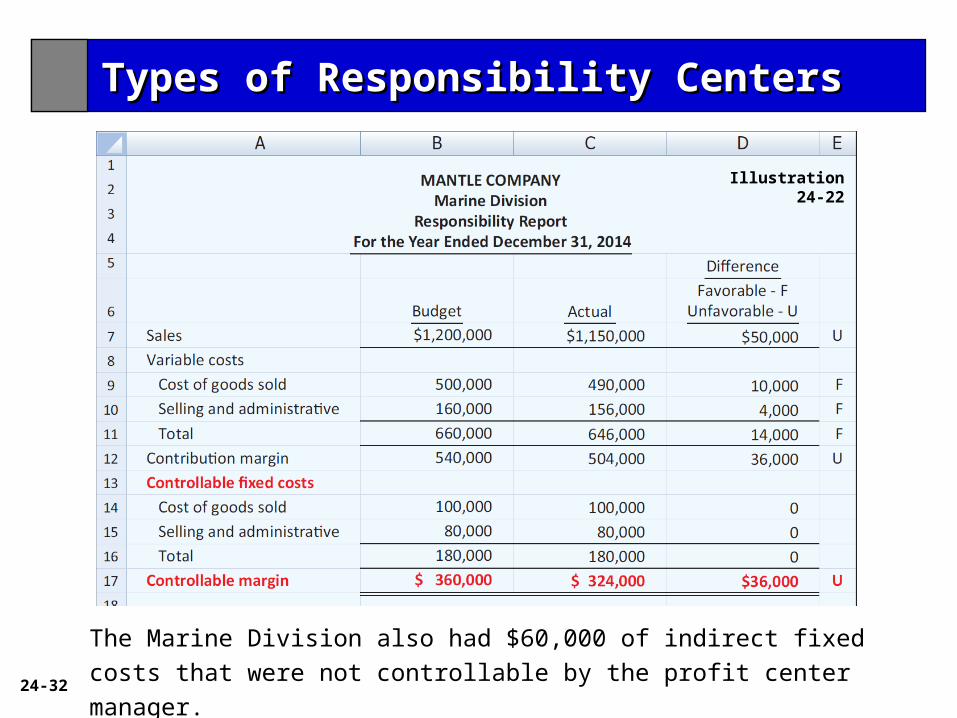
24-32
The Marine Division also had $60,000 of indirect fixed costs that were not
controllable by the profit center manager.
Illustration 24-22
Types of Responsibility CentersTypes of Responsibility Centers
24-33
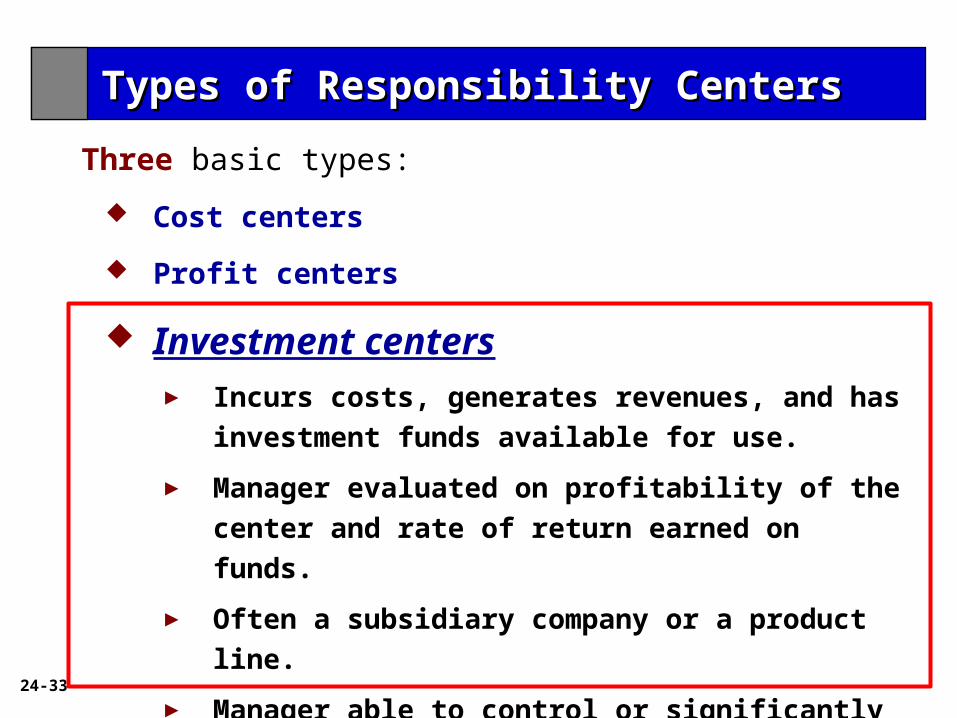
Three basic types:
Cost centers
Profit centers
Investment centers► Incurs costs, generates revenues, and has
investment funds available for use.
► Manager evaluated on profitability of the center and
rate of return earned on funds.
► Often a subsidiary company or a product line.
► Manager able to control or significantly influence
investment decisions such as plant expansion.
Types of Responsibility CentersTypes of Responsibility Centers

24-34
Illustration: The
Marine Division is an
investment center.
It has operating
assets of $2,000,000.
The manager can
control $60,000 of fixed
costs.
Types of Responsibility CentersTypes of Responsibility Centers

24-35
Return on investment (ROI) is the primary basis for evaluating
the performance of a manager of an investment center.
Shows the effectiveness of the manager in using the assets
at his/her disposal.
Useful performance measure.
Factors in ROI formula are controllable by manager.
Responsibility Accounting for Investment Centers
Types of Responsibility CentersTypes of Responsibility Centers
24-36