24 february 2017 - home - regis...
TRANSCRIPT

24 February 2017
Regis
East
Malvern
VIC
• 1 •
CONTENTS 01 Business and financial highlights 1HFY17 • 2 •
02 Portfolio overview and growth strategy • 9 •
03 Summary and outlook • 18 •
04 Appendices • 21 •
24 FEBRUARY 2017
Regis
North Fremantle
WA

Business and financial highlights 1H FY17
• 2 •
01 Artists
Impression
Regis
Lutwyche
QLD

◼ Revenue and EBITDA increases resulting from
● growth initiatives including improved earnings from the Masonic Care acquisition
● an increased contribution from the Higher Accommodation Supplement at facilities approved as Significantly Refurbished
◼ EBITDA run rate for the Masonic Care business is now being achieved
◼ NPAT 8% higher than Normalised 1H FY161
◼ Net RAD cashflow of $46.8m2
◼ Capital expenditure3 of $62.1m
◼ Average occupancy of 95.3%, in line with expectations
◼ Fully franked interim dividend of 10.3 cents per share declared, 100% of NPAT
• 3 •
FINANCIAL HIGHLIGHTS 1H FY17
1. 1H FY17 results are on the basis of Reported IFRS financial information. During the 1HFY17 reporting period, there were no activities requiring Normalisation adjustments. Normalised earnings are categorised as non-IFRS financial information prepared in accordance with ASIC Regulatory Guide 230 – Disclosing non-IFRS financial information. In FY16 Normalisation adjustments were made to the Reported information to assist readers to better understand the financial performance of the underlying business and these Normalised results have been used as the basis for comparison, ie Revenue, EBITDA and NPAT comparisons are to Normalised 1HFY16 results – refer to the Glossary in Appendix A for definitions and Appendix E and F for the reconciliation of Reported to Normalised results. Details of the adjustments are also included in the Directors Report of the Annual Financial Report for the year ended 30 June 2016
2. Includes contributions from Independent Living Units (ILUs)
3. Capital expenditure on developments, significant refurbishment and other projects
4. Normalised net cashflow before investment and financing activities, refer Appendix C
Continued growth, in line with expectations
Revenue of
$284.7m EBITDA of
$61.8m NPAT of
$30.9m 20% higher than
1HFY161
20% higher than
Normalised 1HFY161
8% higher than
Normalised 1HFY161
Normalised
Net operating
cashflow4
$85.9m
Regis
East
Malvern
VIC
• 4 •
KEY OPERATIONAL STATISTICS
1. As per Glossary definitions unless otherwise noted
2. As per definition Glossary (Appendix A) – refer Appendix E and F for reconciliation between Reported and Normalised results
3. Average across the reporting period (12 months or 6 months)
4. Includes all RADs held – partial and full at their weighted value
5. Now excludes ILU resident entry contributions – note in previous presentations these were included in this number but following the Masonic acquisition they are more substantial and hence have been now excluded from the definition
6. Includes partial RADs at full notional value and excludes lump sums received from partially supported residents
7. Includes full and partial DAPs at actual value and excludes daily accommodation contributions received from partially supported residents
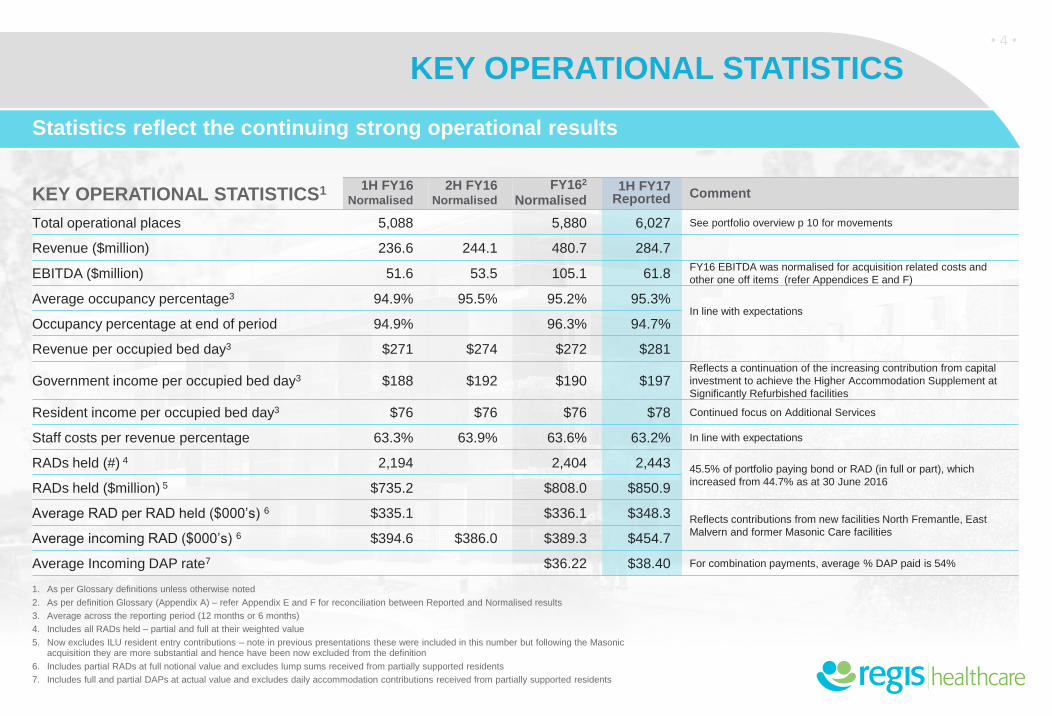
Statistics reflect the continuing strong operational results
KEY OPERATIONAL STATISTICS1 1H FY16 Normalised
2H FY16 Normalised
FY162 Normalised
1H FY17 Reported Comment
Total operational places 5,088 5,880 6,027 See portfolio overview p 10 for movements
Revenue ($million) 236.6 244.1 480.7 284.7
EBITDA ($million) 51.6 53.5 105.1 61.8 FY16 EBITDA was normalised for acquisition related costs and
other one off items (refer Appendices E and F)
Average occupancy percentage3 94.9% 95.5% 95.2% 95.3% In line with expectations
Occupancy percentage at end of period 94.9% 96.3% 94.7%
Revenue per occupied bed day3 $271 $274 $272 $281
Government income per occupied bed day3 $188 $192 $190 $197 Reflects a continuation of the increasing contribution from capital
investment to achieve the Higher Accommodation Supplement at
Significantly Refurbished facilities
Resident income per occupied bed day3 $76 $76 $76 $78 Continued focus on Additional Services
Staff costs per revenue percentage 63.3% 63.9% 63.6% 63.2% In line with expectations
RADs held (#) 4 2,194 2,404 2,443 45.5% of portfolio paying bond or RAD (in full or part), which
increased from 44.7% as at 30 June 2016 RADs held ($million) 5 $735.2 $808.0 $850.9
Average RAD per RAD held ($000’s) 6 $335.1 $336.1 $348.3 Reflects contributions from new facilities North Fremantle, East
Malvern and former Masonic Care facilities Average incoming RAD ($000’s) 6 $394.6 $386.0 $389.3 $454.7
Average Incoming DAP rate7 $36.22 $38.40 For combination payments, average % DAP paid is 54%

EARNINGS HIGHLIGHTS
◼ Improvement in 1H FY17 EBITDA performance compared to 1H FY16 was driven principally by:
● A further increase in the contribution from the higher accommodation supplement at facilities approved as Significantly Refurbished
● Growth initiatives, including an improved contribution from the former Masonic Care sites, for which the EBITDA run rate is now being achieved
● This has been partially offset by the impact on earnings during the period from the closure of Regis Park, WA facility for redevelopment and the cost of ramping up the two new developments in North Fremantle, WA and East Malvern, VIC
Increased income the key contributor to EBITDA results
• 5 •
61.8 51.6
2.8 7.1
0.6
0
15
30
45
60
75
1H FY16 EBITDA Normalised Increased Higher AccommodationSupplement at Significantly
Refurbished facilities
EBITDA from growth opportunities EBITDA from Steady State sites Other 1H FY17 EBITDA
EB
ITD
A $
Millio
ns
SIGNIFICANT 1H FY17 EBITDA MOVEMENTS COMPARED TO 1H FY161
1. Note – all 1HFY16 figures are based on Normalised results. Refer Appendix A for glossary and Appendix E for reconciliation between Reported and Normalised results
◼ New developments are performing in line with expectations
◼ Occupancy in line with expectations
◼ Staffing expenses were flat compared to 1H FY16 as a % of revenue. The actual increase from 1H FY16 to 1H FY17 was $30.3m in total. This comprised $5.3m for the “steady state” Facilities and $23.5m for ramping up, ramping down and acquired Facilities, with the balance relating to increases in the non residential aged care businesses and administration
(0.3)

EARNINGS HIGHLIGHTS
◼ Improvement in NPAT performance driven by 20% growth in EBITDA compared to prior comparable period. As per the Company’s previous FY17 outlook, this was partially offset by:
● Increased depreciation expense, which was $3.7m higher than in 1H FY16 and which will continue to increase as development projects are completed
● Increase in net interest expense in 1H FY17 of $3.3m
◼ Effective tax rate of 30%
Solid NPAT growth underpinned by EBITDA growth
• 6 •
28.7
10.2 (3.7) (3.3)
(1.0)
30.9
0.0
10.0
20.0
30.0
40.0
50.0
Normalised NPAT 1H FY16 Increased operational earnings Depreciation expense Net interest Tax expense 1H FY17 Reported NPAT
NP
AT
$ M
illio
ns
SIGNIFICANT NPAT MOVEMENTS COMPARED TO 1H FY161
1. As per definition glossary (Appendix A) – refer Appendix E for reconciliation between 1HFY16 Reported and 1HFY16 Normalised results
Regis
Camberwell
VIC

CASHFLOW HIGHLIGHTS
◼ Net RAD cashflow of $46.8m1 underpinned by:
● Incoming RADs from the new facilities in North Fremantle, WA and East Malvern, VIC and an uplift in RADs at the former Masonic Care sites
● Increased level of average incoming RADs, which was $454.7k compared to an average of $389.3k in FY16
Net RAD cashflow in line with expectations
• 7 •
61.8
0.9 (3.0)
46.8
(5.3) (15.3)
85.9
(62.1)
(10.0) (17.8)
(4.1) -15
0
15
30
45
60
75
90
105
1H FY17 EBITDA Change in workingcapital
Non cash items inEBITDA
Net receipts fromRADs
Net interest paid Tax paid Normalised netoperating cashflow
Capital Expenditure Debt paydown Dividends paid Normalised net cashflow
KEY CASHFLOW MOVEMENTS
2 2
◼ Key investment activities included:
● Total capex on development, significant refurbishment, land and other projects of $62.1m
● $10m debt repayment
1. Includes contributions from Independent Living Units (ILUs)
2. $32.4m of Government Funding was received in advance in December that relates to January. This has been excluded from the normalised net cashflow for the period. Refer Appendix C for FY16 Normalisation adjustments
$M
illio
ns

51%
8%
41%
1H FY16 451 Residents
47%
6%
47%
1H FY17 438 Residents
RAD Only DAP Only Combination RAD / DAP
RESIDENT PROFILE
◼ 47% of non supported residents1 chose to pay a full RAD in 1H FY17
◼ During this period there was a minor movement from full RADs and full DAPs to “Combination RAD/DAP” payments during 1H FY17 compared to both 1H and 2H of FY16. Combination residents now comprise circa 9.6% of the overall portfolio
◼ 45.5% of the portfolio are paying a RAD (in part or in full), having increased from 44.7% at the end of 2H FY16
◼ The Significant Refurbishment program now has circa 1,700 eligible residents living in an enhanced environment and receiving the higher supplement2
Combination payments have increased in popularity
• 8 •
31 December
2015
31 December
2016
Resident tenure3 2.4 years 2.4 years
Average duration of stay4 2.8 years 2.8 years
0%
10%
20%
30%
40%
50%
Supported (fully orpartially)
RAD Paying Combination RAD/ DAP
DAP Paying Other
31-Dec-15 30-Jun-16 31-Dec-16
1. Permanent, non supported residents based on the Aged Care Act for those entering care after 1 July 2014
2. As at 31 January 2017
3. Average length of stay of permanent residents who departed during that 12 month period
4. Average length of stay of all permanent residents as at that date
5. Permanent, non supported residents who are contracted under LLLB legislation - total for 6 month period
6. All residents, as at end of period. Note DAP paying group includes pre 1 July 2014 Accommodation Charge paying residents
51%
10%
39%
2H FY16 434 Residents
PROFILE OF ACCOMMODATION PAYMENT TYPES
FOR INCOMING RESIDENTS5
CHANGE IN RESIDENT PROFILE6 RESIDENT TENURE STATISTICS
◼ Tenure statistics have not materially moved

Portfolio Overview and Growth Strategy
• 9 •
02

As at 31 December 2016 Total
Number of Facilities 54
Total places1 7,619
Total operational places 6,027
Total rooms 5,263
Total single bed rooms 4,824
% operational places in single bed room 80%
% single bed rooms 92%
Average Facility size (number of operational places) 112
Facilities approved as significantly refurbished2 29
Club Services Facilities 14
PORTFOLIO OVERVIEW
Regis continues to execute its growth strategy
• 10 •
◼ The Regis East Malvern, Vic development site opened on 1 September 2016 adding 148 operational places to the portfolio
◼ The Significant Refurbishment program has been completed at 29 facilities. It is anticipated a further 4 facilities (including 3 former Masonic Care facilities) will be refurbished by the end of FY17
REGIS FACILITY NETWORK
1. Includes 1,592 Provisionally allocated places and offline places
2. Qualifying Supported residents receive a Higher Accommodation Supplement under the Aged Care Legislation. Note this does not include any qualifying Club Services facilities
WA
NT
SA
QLD
NSW
VIC
TAS
Adelaide (3)
Melbourne (16)
Sydney (4)
Coastal NSW (2)
Brisbane (12) Sunshine Coast (5)
Mildura (2)
Bunbury (1)
Perth (5)
Darwin (1)
Cairns (2)
Total operational
places
6,027 54 facilities
Townsville (1)
Regis
Rose Bay
NSW

• 11 •
CONSISTENT GROWTH STRATEGY
GROWTH STRATEGY – FOUR LEVERS
1. Projected as at 1 September 2016, starting from 4,719 as at 29 August 2014
Taking advantage of industry growth and consolidation to leverage existing portfolio
• Regis has acquired 3 single Facilities since November 2014, adding 444 places to the portfolio
• We continually review opportunities and assess against our criteria
• Criteria include: location, competitive position, bed configuration, scale, operational efficiency, future capex required
Acquisition of single facilities
• We continue to assess at opportunities that meet our criteria (as above)
• Masonic Care portfolio of 711 operational places completed on 1 June 2016
Acquisition of portfolios
• The company has a program in place to undertake expansion and redevelopment of its assets, including Significant Refurbishment
• 172 places have been taken offline since listing in advance of redevelopment to improve the portfolio quality
Brownfield Redevelopment
• Regis continues to be active in positioning itself for substantial growth from greenfield developments
• Through development of new places we meet our key criteria (as above) and achieve superior cashflow returns from RADs through well located facilities in major metropolitan locations
• 844 provisional allocations from the 2015 ACAR further supports this strategy, bringing the total number of provisional allocations and offline places available for future development to 1,592
Development of Greenfield facilities
1,592 places
available for future development
1,308 additional
operational places since
listing1

• 12 •
STRATEGY FOCUS
THE COMPANY MAINTAINS ITS FOCUS ON THE EXECUTION OF ITS GROWTH STRATEGY THROUGH:
◼ Optimising the location of its new developments – continuing to focus principally on urban locations
◼ Ensuring efficient Facility size – the development and asset renewal programs are
based on a model of circa 120 places – this enables the optimal workforce model
to efficiently deliver quality services
◼ Continued investment in the portfolio to ensure Facilities are modern,
high quality and support contemporary care delivery
◼ Continued focus on maintaining the scalability of systems,
processes and human resources strategies
◼ A continuing focus on revenue growth through
● The expansion of Club Services through the greenfield program
● The expansion of Additional Services across the portfolio
◼ RAD cash inflows from developments facilitate
the repayment of acquisition and development related debt
Execution of growth strategy
Regis
East
Malvern
VIC

• 13 •
EXPANSION PIPELINE – GREENFIELD DEVELOPMENTS
Development
Total new
places
Net additional
places Club
Services Land held
Development approval
Provisional Allocations
/Licences in hand
Expected construction
start
First resident expected
Milestone update
Regis Kingswood1 redevelopment, SA
100 100 Underway 2H FY17
Certificate of Occupancy obtained, mobilising
Regis Chelmer, QLD 120 120
Partially Underway 1H FY18 Construction > 50%
Regis Linden Park, SA, Stage 1 117 8 Underway FY18
Construction > 50%. Delayed but immaterial impact on net additional places
Regis Nedlands, WA2 135 135 Underway FY18 Construction commenced
Regis Elermore Vale, Newcastle, NSW
120 120 Underway FY19 Construction commenced
Regis Woodlands, WA 120 120 Underway FY19 Construction > 25%
Regis Port Coogee, WA 120 120 Underway FY19 Construction commenced
1. Formerly known as Regis Sunset prior to closure for redevelopment
2. Formerly known as Regis Park prior to closure for redevelopment
Status of current and planned developments
(continues following page)
8 Developments
under construction
• 14 •
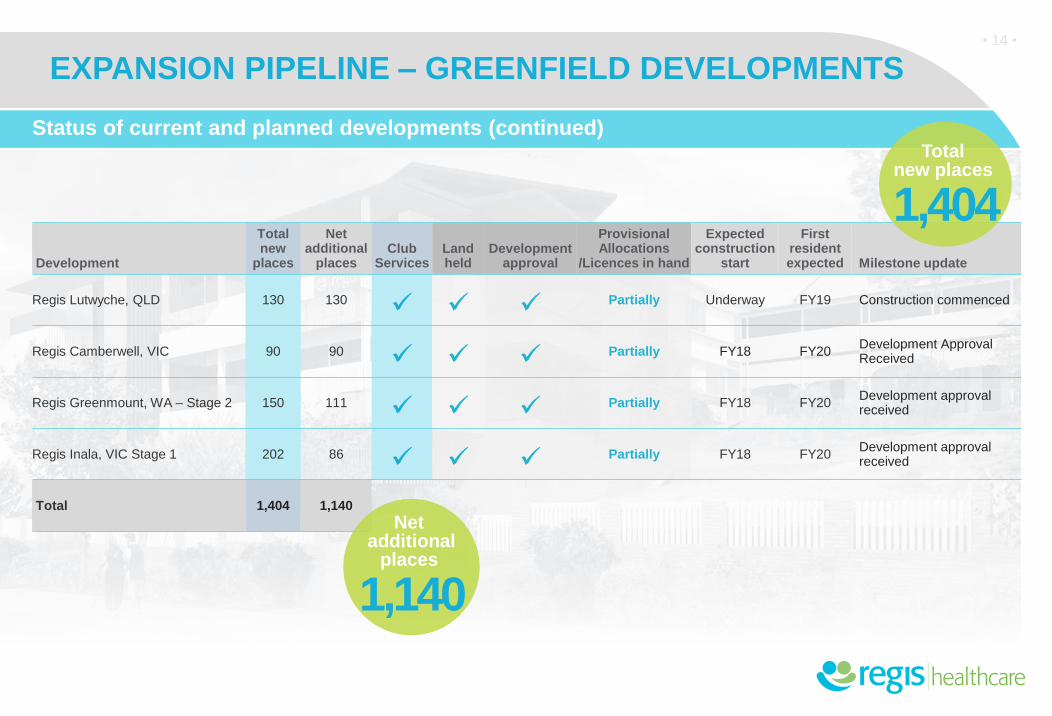
EXPANSION PIPELINE – GREENFIELD DEVELOPMENTS
Status of current and planned developments (continued)
Development
Total new
places
Net additional
places Club
Services Land held
Development approval
Provisional Allocations
/Licences in hand
Expected construction
start
First resident expected Milestone update
Regis Lutwyche, QLD 130 130
Partially Underway FY19 Construction commenced
Regis Camberwell, VIC 90 90 Partially FY18 FY20
Development Approval Received
Regis Greenmount, WA – Stage 2 150 111 Partially FY18 FY20
Development approval received
Regis Inala, VIC Stage 1 202 86 Partially FY18 FY20
Development approval received
Total 1,404 1,140
Net additional
places
1,140
Total new places
1,404

Regis
Sandgate
QLD
• 15 •
RETIREMENT LIVING OVERVIEW - BACKGROUND
◼ Regis has owned and operated co-located
retirement villages (RV) and aged care
facilities (ACF) in Melbourne and Perth since
2007
◼ The recent acquisition of the Masonic Care
business has introduced another three co-
located RV and ACF sites in Queensland
◼ The Company now has 550 Independent
Living Units across 5 RVs, each of which is
co-located with ACFs
◼ Regis’ experience shows that co-located
RVs and ACFs can be complementary in
certain locations
◼ The Company is currently finalising
development plans in relation to the
Burwood East (Inala Village) site in
Melbourne
Regis has owned and operated co-located Retirement Villages since 2007
• 16 •
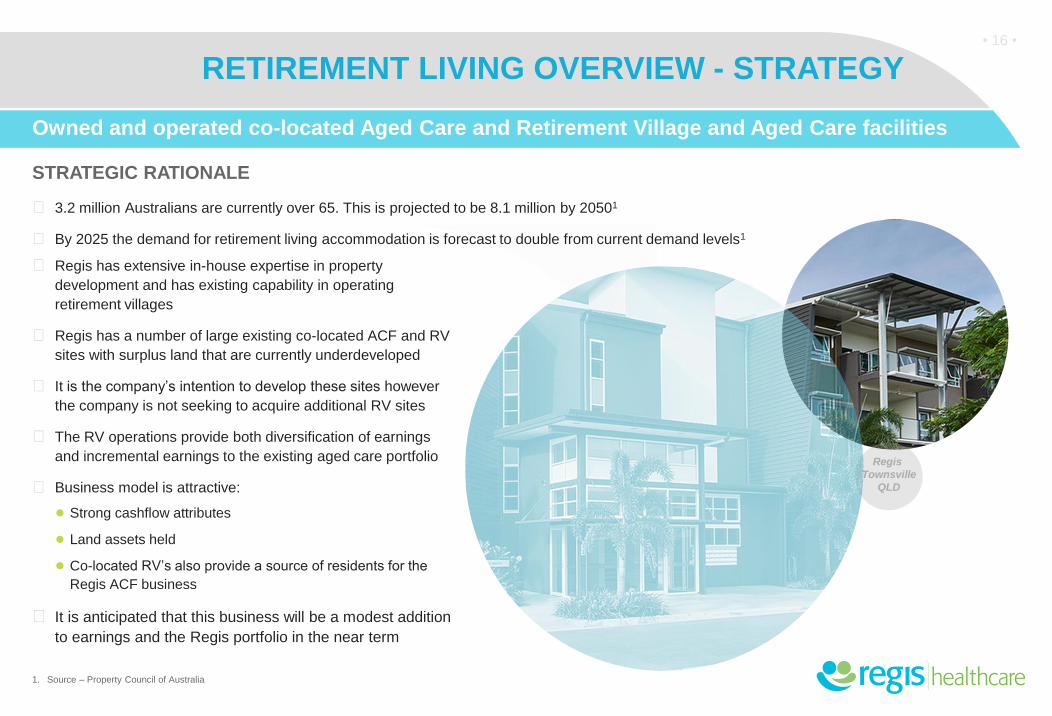
RETIREMENT LIVING OVERVIEW - STRATEGY
STRATEGIC RATIONALE
◼ 3.2 million Australians are currently over 65. This is projected to be 8.1 million by 20501
◼ By 2025 the demand for retirement living accommodation is forecast to double from current demand levels1
1. Source – Property Council of Australia
Owned and operated co-located Aged Care and Retirement Village and Aged Care facilities
Regis
Townsville
QLD
◼ Regis has extensive in-house expertise in property
development and has existing capability in operating
retirement villages
◼ Regis has a number of large existing co-located ACF and RV
sites with surplus land that are currently underdeveloped
◼ It is the company’s intention to develop these sites however
the company is not seeking to acquire additional RV sites
◼ The RV operations provide both diversification of earnings
and incremental earnings to the existing aged care portfolio
◼ Business model is attractive:
● Strong cashflow attributes
● Land assets held
● Co-located RV’s also provide a source of residents for the
Regis ACF business
◼ It is anticipated that this business will be a modest addition
to earnings and the Regis portfolio in the near term
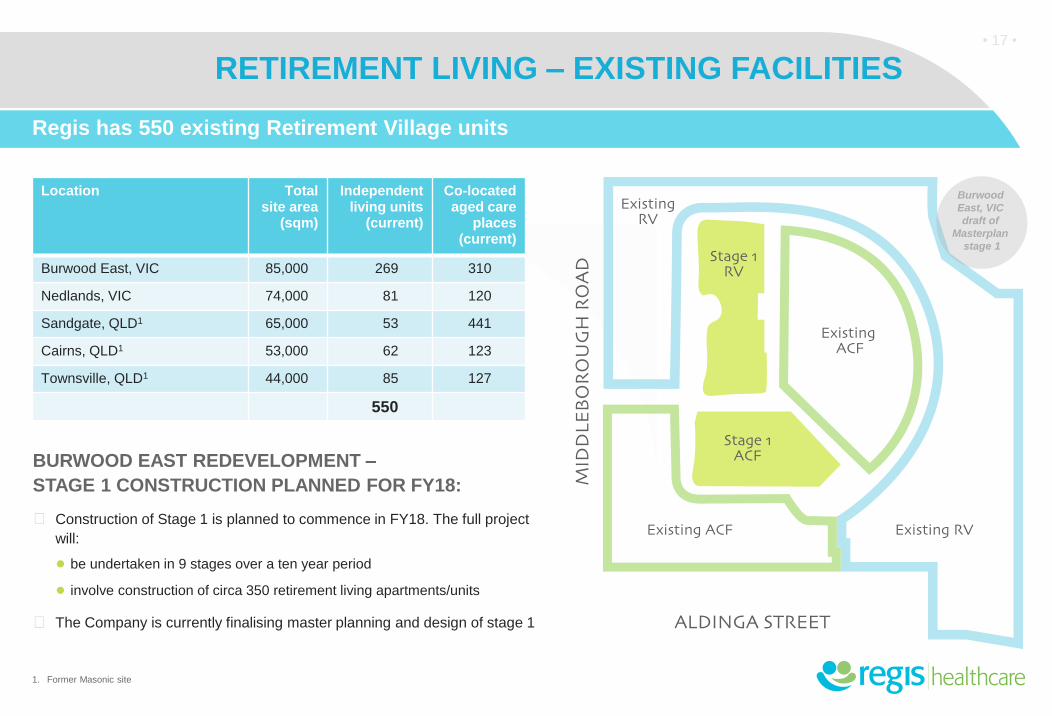
RETIREMENT LIVING – EXISTING FACILITIES
Location Total site area
(sqm)
Independent living units
(current)
Co-located aged care
places (current)
Burwood East, VIC 85,000 269 310
Nedlands, VIC 74,000 81 120
Sandgate, QLD1 65,000 53 441
Cairns, QLD1 53,000 62 123
Townsville, QLD1 44,000 85 127
550
Regis has 550 existing Retirement Village units
• 17 •
BURWOOD EAST REDEVELOPMENT –
STAGE 1 CONSTRUCTION PLANNED FOR FY18:
◼ Construction of Stage 1 is planned to commence in FY18. The full project
will:
● be undertaken in 9 stages over a ten year period
● involve construction of circa 350 retirement living apartments/units
◼ The Company is currently finalising master planning and design of stage 1
1. Former Masonic site
Burwood
East, VIC
draft of
Masterplan
stage 1

Summary and Outlook
• 18 •
03 Artists
Impression
Regis
Lutwyche
QLD

• 19 •
1H FY17 SUMMARY
1H FY17 PERFORMANCE
◼ EBITDA of $61.8m and NPAT of $30.9m due to continued
business growth and operational performance:
● Average revenue per resident per day was $281 in 1HFY17
compared to $274 in 2HFY16
● Occupancy and labour costs in line with expectations
◼ Normalised net operating cashflow of $85.9m, driven by
EBITDA result and by net RAD receipts of $46.8m
◼ Development activities continue as per the Company’s
growth strategy:
● 148 new places were delivered with the opening of the
East Malvern Facility, VIC
● Expansion pipeline includes 1,404 net additional places
◼ Fully franked dividend declared of 10.3 cents per share,
100% of NPAT
Solid financial performance continued in 1H FY17
Regis
East
Malvern
VIC

• 20 •
FY17 OUTLOOK
2H FY17 OUTLOOK
◼ 2H FY17 EBITDA is anticipated to be in line with 1H FY17
◼ The company reaffirms its previously stated position on the following items for FY17:
● debt will remain at approximately 2x EBITDA
● interest expense is anticipated to be circa $8m for the full year
● the depreciation expense range will be $28m - $31m
● net RAD inflows are anticipated to be circa $100m
● total capex spend1 in FY17 is anticipated to be in the order of $160m
◼ The federal government announced changes to its residential aged care funding in the MYEFO in November 2015 and Federal Budget 2016 which commenced in FY17
● the changes were amended in a publication on 2 December 2016
● for the Company, there will be minimal impact resulting from these changes in 2H FY17. The changes will be more significant in FY18 and FY19
◼ A range of strategies have been and continue to be implemented to mitigate the impact of the changes to funding, both from a care and revenue perspective. These are tracking in line with both the Company’s plan and forecast and include:
● review of room pricing
● expanded additional services offerings and other fees and charges
1. Includes development, significant refurbishments and other business capex
Positive FY17 Outlook for EBITDA and NPAT
Regis
Rose Bay
NSW

Appendices
• 21 •
04

APPENDIX A
Glossary
• 22 •
Agrees to the Reported result as at and for the half year ended 31 December 2015. Normalisations include:
1. one off acquisition costs related to acquisition of the Regis Marleston
2. gain/(loss) on disposal of property, plant and equipment
Refer to Appendix E for a reconciliation of Reported 1H FY16 results to normalised 1H FY16 results for Revenue, EBITDA, NPBT and NPAT
Agrees to the Reported result as at and for the year ended 30 June 2016. Normalisations include:
1. one off acquisition costs related to acquisition of the Regis Marleston and Masonic care businesses.
2. gain from bargain purchase related to acquisition of Regis Redlynch business
3. gain/(loss) on disposal of property, plant and equipment
Refer to Appendix F for a reconciliation of Reported FY16 results to normalised FY16 results for Revenue, EBITDA, NPBT and NPAT
COPE Commonw ealth Ow n Purpose Expenses Indexation
DAP A Daily Accommodation Payment
RADA “Refundable Accommodation Deposit”, being an amount of money that does not accrue daily and is paid or payable to an Approved Provider by a resident for the resident’s accommodation in an aged
care facility. A RAD is payable w hen the care recipient dies; the care recipient ceases to be provided w ith care by the Approved Provider, or the service ceases to be certif ied.
Reported Agrees to or is derived from the results contained in the statutory f inancial report.
1H FY16
Normalised
FY16
Normalised

APPENDIX B
Income
Statement
• 23 •
1. As per definition, Glossary (Appendix A) - refer to Appendix E for reconciliation between 1H FY16 reported and 1H FY16 normalised results
2. As per definition, Glossary (Appendix A) - refer to Appendix F for reconciliation between FY16 reported and FY16 normalised results
3. As per definition, Glossary (Appendix A)
4. Net interest includes interest expense less interest income. For financial reporting purposes, revenue includes interest income. In the table above this interest income has been included in the “Net interest expense” line in order to be able to correctly show EBITDA and EBIT excluding net interest.
($ millions)
1H FY2016
Normalised1
2H FY2016
Normalised
FY2016
Normalised2
1H FY2017
Reported 3
Variance
1H FY2016
Normalised to
1H FY2017
Revenue
Government revenue 164.6 170.8 335.4 199.9 21%
Resident revenue 66.2 68.1 134.3 79.5 20%
Other revenue 5.8 5.2 11.0 5.3 (9%)
Revenue 236.6 244.1 480.7 284.7 20%
Less interest income4 (0.5) (0.3) (0.8) (0.3) (40%)
Total Income excluding interest 236.1 243.8 479.9 284.4 20%
Operating Expenses
Staff expenses (149.7) (156.1) (305.8) (180.0) 20%
Resident care expenses (17.1) (17.7) (34.8) (21.0) 23%
Administration & fixed facility expenses (11.6) (9.8) (21.4) (13.6) 17%
Occupancy expenses (6.1) (6.7) (12.8) (8.0) 31%
Total operating expenses (184.5) (190.3) (374.8) (222.6) 21%
EBITDA 51.6 53.5 105.1 61.8 20%
Depreciation and amortisation (10.5) (12.0) (22.5) (14.2) 35%
EBIT 41.1 41.5 82.6 47.6 16%
Net interest 4 (0.1) (0.9) (1.0) (3.4) 3,300%
Net profit before tax 41.0 40.6 81.5 44.2 8%
Income tax expense (12.3) (12.4) (24.7) (13.3) 8%
Net profit after tax (NPAT) 28.7 28.2 56.8 30.9 8%

APPENDIX C
Cash Flow
Statement
• 24 •
1. For definitions and explanation of adjustments refer to Glossary (Appendix A)
2. As per definition, Glossary (Appendix A)
3. Government Funding received in Advance (prepaid in December for January income)
4. FY16 Working capital movement includes State Revenue Office refund received of $18.2m in FY16 and prepayment for the Marleston acquisition of $15.7m made in FY15.
5. FY16 Purchase consideration represents Masonic purchase cost of $153.2m less cash acquired of $1.3m
($ millions)
EBITDA Normalised 51.6 53.5 105.1 61.8 61.8
Less: Normalised adjustments1 (0.6) (11.5) (12.1) 0.0 0.0
EBITDA Reported 51.0 42.0 93.0 61.8 61.8
Change in net working capital4 (3.1) 30.6 27.5 0.9 0.9
Government funding received in advance3 0.0 0.0 0.0 32.4 (32.4) 0.0
Non–cash items in EBITDA (3.4) (6.2) (9.6) (3.0) (3.0)
Net receipts from RADs and ILU entry contribution 25.1 19.8 44.9 46.8 46.8
Net interest paid (1.1) (2.1) (3.2) (5.3) (5.3)
Income tax paid (11.4) (7.6) (19.0) (15.3) (15.3)
Net operating cashflow before investment and financing activities 57.1 76.5 133.6 118.3 (32.4) 85.9
Purchase of property, plant and equipment & other non-current assets (74.7) (71.5) (146.2) (62.1) (62.1)
Purchase of businesses net of cash acquired5 0.0 (151.9) (151.9) 0.0 0.0
SRO Stamp duty refund 16.2 (16.2) 0.0 - 0.0
Cash used in investing activities (58.5) (239.6) (298.1) (62.1) 0.0 (62.1)
Net cashflow before financing activities (1.4) (163.1) (164.5) 56.2 (32.4) 23.8
Debt drawdown/(repayment) 5.0 205.0 210.0 (10.0) (10.0)
Dividends paid (52.9) (28.2) (81.1) (17.8) (17.8)
Net cashflow reported (49.3) 13.7 (35.7) 28.4 (32.4) (4.1)
1H FY2017
Normalised
1H FY2017
Reported 2
1H FY2016
Normalised1
2H FY2016
Normalised
FY2016
Normalised1
Normalisation
adjustment3
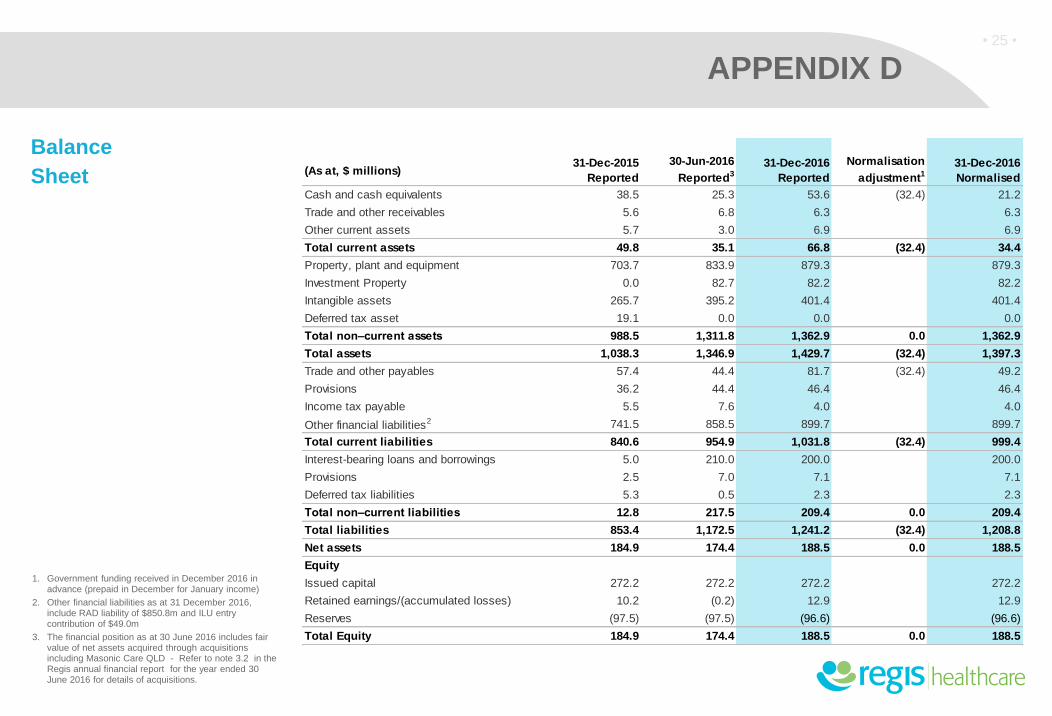
APPENDIX D
Balance
Sheet
• 25 •
1. Government funding received in December 2016 in advance (prepaid in December for January income)
2. Other financial liabilities as at 31 December 2016, include RAD liability of $850.8m and ILU entry contribution of $49.0m
3. The financial position as at 30 June 2016 includes fair value of net assets acquired through acquisitions including Masonic Care QLD - Refer to note 3.2 in the Regis annual financial report for the year ended 30 June 2016 for details of acquisitions.
(As at, $ millions)
Cash and cash equivalents 38.5 25.3 53.6 (32.4) 21.2
Trade and other receivables 5.6 6.8 6.3 6.3
Other current assets 5.7 3.0 6.9 6.9
Total current assets 49.8 35.1 66.8 (32.4) 34.4
Property, plant and equipment 703.7 833.9 879.3 879.3
Investment Property 0.0 82.7 82.2 82.2
Intangible assets 265.7 395.2 401.4 401.4
Deferred tax asset 19.1 0.0 0.0 0.0
Total non–current assets 988.5 1,311.8 1,362.9 0.0 1,362.9
Total assets 1,038.3 1,346.9 1,429.7 (32.4) 1,397.3
Trade and other payables 57.4 44.4 81.7 (32.4) 49.2
Provisions 36.2 44.4 46.4 46.4
Income tax payable 5.5 7.6 4.0 4.0
Other financial liabilities2 741.5 858.5 899.7 899.7
Total current liabilities 840.6 954.9 1,031.8 (32.4) 999.4
Interest-bearing loans and borrowings 5.0 210.0 200.0 200.0
Provisions 2.5 7.0 7.1 7.1
Deferred tax liabilities 5.3 0.5 2.3 2.3
Total non–current liabilities 12.8 217.5 209.4 0.0 209.4
Total liabilities 853.4 1,172.5 1,241.2 (32.4) 1,208.8
Net assets 184.9 174.4 188.5 0.0 188.5
Equity
Issued capital 272.2 272.2 272.2 272.2
Retained earnings/(accumulated losses) 10.2 (0.2) 12.9 12.9
Reserves (97.5) (97.5) (96.6) (96.6)
Total Equity 184.9 174.4 188.5 0.0 188.5
31-Dec-2016
Reported
Normalisation
adjustment1
31-Dec-2015
Reported
30-Jun-2016
Reported3
31-Dec-2016
Normalised

APPENDIX E
Reported to Normalised Reconciliation
– Half Year ended 31 December 2015
• 26 •
1. For definitions and explanation of adjustments refer to Glossary (Appendix A)
Half year ended 31 December 2015 ($ millions) Revenue EBITDA NPBT NPAT
1H FY2016 Reported results 236.6 51.0 40.4 28.3
Acquisition related expenses 0.0 0.3 0.3 0.2
Loss on disposal of property, plant and equipment 0.0 0.3 0.3 0.2
1H FY2016 Normalised1 results 236.6 51.6 41.0 28.7
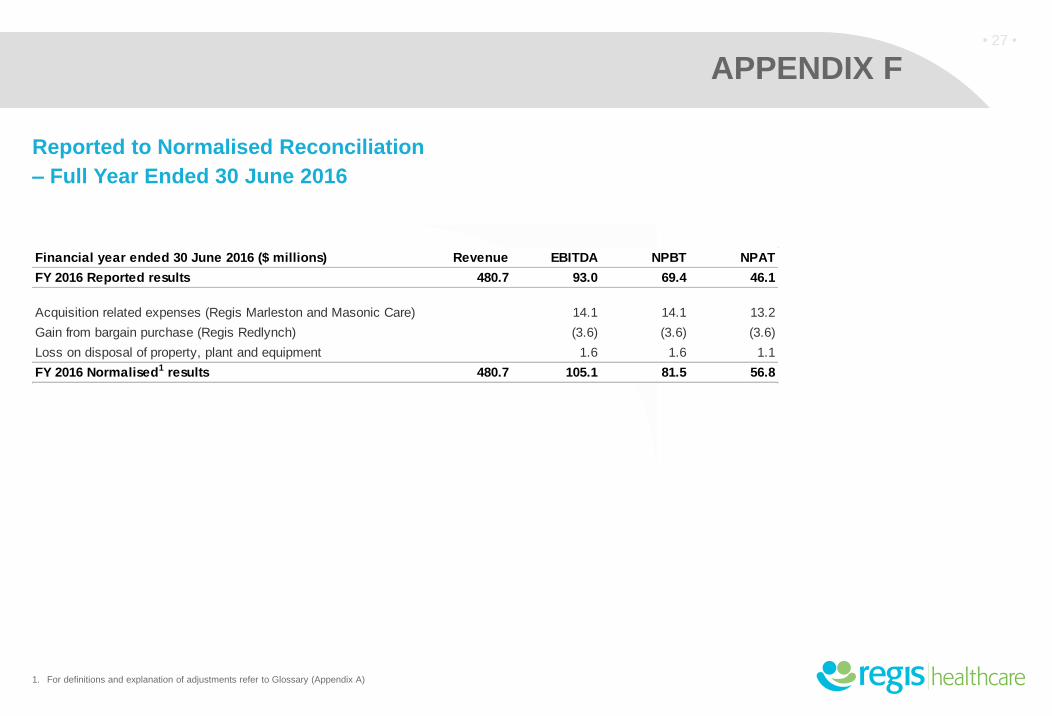
APPENDIX F
Reported to Normalised Reconciliation
– Full Year Ended 30 June 2016
• 27 •
1. For definitions and explanation of adjustments refer to Glossary (Appendix A)
Financial year ended 30 June 2016 ($ millions) Revenue EBITDA NPBT NPAT
FY 2016 Reported results 480.7 93.0 69.4 46.1
Acquisition related expenses (Regis Marleston and Masonic Care) 14.1 14.1 13.2
Gain from bargain purchase (Regis Redlynch) (3.6) (3.6) (3.6)
Loss on disposal of property, plant and equipment 1.6 1.6 1.1
FY 2016 Normalised1 results 480.7 105.1 81.5 56.8

Payback Mature facility – growth from increase
in incoming RADs and EBITDA improvement
APPENDIX G
EXAMPLE PROJECT ASSUMPTION:
◼ RAD receipts exceed the project’s capital expenditure requirements when at full occupancy
Greenfield developments generate positive cashflow returns:
Example for a 120 place Club Services Facility
• 28 •
Positive
Time
2-3 years - land acquisition, design,
construction and commissioning
◼ Land and Construction, circa $35m capex
◼ 1st Resident
18-24 months - ramp up to mature occupancy
Negative
0

IMPORTANT NOTICE
This presentation contains general information about the activities of Regis Healthcare Limited (Regis) which is current as at 24 February 2017. It is in summary form and does not purport to be complete. It presents financial information on both a statutory basis (prepared in accordance with Australian accounting standards which comply with International Financial Reporting Standards (IFRS) as well as information provided on a non–IFRS basis.
This presentation is not a recommendation or advice in relation to Regis or any of Regis’ subsidiaries. It is not intended to be relied upon as advice to investors or potential investors, and does not contain all information relevant or necessary for an investment decision. It should be read in conjunction with the other periodic and continuous disclosure announcements filed with the Australian Securities Exchange by Regis, and in particular the Results for the half year ended 31 December 2016. These are also available at www.regis.com.au.
No representation or warranty, express or implied, is made as to the accuracy, adequacy or reliability of any statements, estimates or opinions or other information contained in this presentation.
To the maximum extent permitted by law, Regis, its subsidiaries and their respective directors, officers, employees and agents disclaim all liability and responsibility for any direct or indirect loss or damage which may be suffered by any recipient through use of or reliance on anything contained in or omitted from this presentation.
No recommendation is made as to how investors should make an investment decision. Investors must rely on their own examination of Regis, including the merits and risks involved. Investors should consult with their own professional advisors in connection with any acquisition of securities. The information in this presentation is for general information only.
To the extent that certain statements contained in this presentation may constitute 'forward–looking statements' or statements about 'future matters', the information reflects Regis’s intent, belief or expectations at the date of this presentation.
Any forward–looking statements, including projections, guidance on future revenues, earnings and estimates, are provided as a general guide only and should not be relied upon as an indication or guarantee of future performance. Forward–looking statements involve known and unknown risks, uncertainties and other factors that may cause Regis’ actual results, performance or achievements to differ materially from any future results, performance or achievements expressed or implied by these forward–looking statements.
Any forward–looking statements, opinions and estimates in this presentation are based on assumptions and contingencies which are subject to change without notice, as are statements about market and industry trends, which are based on interpretations of current market conditions. For example, the factors that are likely to affect the results of Regis include, but are not limited to, Government legislation as it relates to Aged Care (in particular the Aged Care Act 1997 and Aged Care Principles), economic conditions in Australia, competition in the Aged Care market and the inherent regulatory risks in the businesses of Regis.
Neither Regis, nor any other person, gives any representation, assurance or guarantee that the occurrence of the events expressed or implied in any forward–looking statements in this presentation will actually occur. In addition, please note that past performance is no guarantee or indication of future performance.
This presentation does not constitute an offer to issue or sell, or solicitation of an offer to buy, any securities or other financial products in any jurisdiction. The distribution of this presentation outside Australia may be restricted by law. Any recipient of this presentation outside Australia must seek advice on and observe any such restrictions. This presentation may not be reproduced or published, in whole or in part, for any purpose without the prior written permission of Regis.
All amounts are in Australian dollars. All references starting with 'FY' refer to the financial year ended 30 June. For example, 'FY16' refers to the year ended 30 June 2016.
• 29 •