2.4 lithium-ion battery
TRANSCRIPT
Authors:
Heza Taha Mahmoud
Lishan Xu
Department of Energy and Environment
Division of Electric Power Engineering and
Department of Materials and Manufacturing Technology
Department of Applied Physics
CHALMERS UNIVERSITY OF TECHNOLOGY
Göteborg, Sweden, Jun 2011
A combined Li-ion & lead-acid battery
system for start-stop application:
potential & realization

1. Examiner: Torbjörn Thiringer
Department of Energy and Environment
Chalmers University of Technology, 41296 Göteborg, Sweden
2. Examiner: Patrik Johansson
Department of Applied Physics
Chalmers University of Technology, 41296 Göteborg, Sweden

Acknowledgements
This thesis work has been performed at Volvo Cars Corporation in Gothenburg, Sweden.
We would like to express our gratitude to people who has been involved to sponsor and
help us to complete our work.
We would like to thank our supervisors Daniel Midholm and Torbjörn Larsson for all
their help and contributions, which made our work possible to perform.
We would like to thanks our examiners Torbjörn Thiringer and Patrik Johansson, for
improving and inspecting the written report.
Moreover, our gratitude goes to people from all the department of power electronic at
Volvo, for helping us with the work in the workshop, especially Patrik Larsson, Erik
Astlund and Göran Martinsson
We would like to thank Arash Idelchi, who has helped us with the reading of the report
and giving us feedback to improve the language of the report.
Finally we would like to thank our families for supporting us with help and
understanding.
Abstract The aim of this master thesis is to investigate the possibility of using lithium-ion
batteries as a second battery instead of lead-acid batteries for the start-stop application
in vehicles. To achieve the specified target, the following steps are explored:
investigation of the technology market, choice of relevant sizing of the battery,
development of charge algorithms for the battery system, creation of an electric
simulation model with Simulink, development of a prototype for installation in car and
finally verification of the new battery model in a vehicle.
The battery which is chosen is a Li-ion battery with a voltage of 16.6V and a capacity of
30Ah due to the test-rig requirements and availability. Before implementation in the
vehicle, tests are performed on the battery pack and the combined system. The
controller system for charging and discharging is created in Simulink.
Through several experiments, the working voltage range of the Li-ion battery pack was
defined from 14.8V to 14.2V. In addition, a verification of this solution has been done
in a real vehicle.
Moreover, comparing the experimental results with our literature study, a new type of
lithium-ion battery chemistry, which matches the characteristics required in this work is
investigated: a LiFePO4 cathode based battery.
Key words: lithium-ion battery, parallel, Simulink. start-stop

Abbreviation List
A Geometrical area
A Ampere
ACEA Association des Constructeurs Européens d'Automobiles
Ah Ampere hour
Ain Interfacial area
BMS Battery Management System
C Capacity of the battery in Ah
CC Constant Current
C-C bond Carbon-Carbon bond
Co Cobalt
CO2 Carbon Dioxide
Cr Chromium
Cusable Usable capacity of the battery pack
CV Constant Voltage
EFA Fermi Energy of the anode
EFC Fermi Energy of the cathode
FePO4 Iron phosphate
HEV Hybrid Electric Vehicle
HOMO Highest Occupied Molecular Orbital
H2SO4 Sulfuric acid
I Current
Icharge Charge Current
Idischarge Discharge current
Ilimit Current-limit
ICE Internal Combustion Engine
J Joule
L Effective thickness
LiCoO2 Lithium Cobalt Oxide
LiFePO4 Lithium Iron Phosphate
Li-ion Lithium-ion
LiPF6 Lithium hexafluorophosphate
LUMO Lowest Unoccupied Molecular Orbital
MABX MicroAutoBox
Mn Manganese
Ni Nickel
Ni-Cd Nickel Cadmium
NiMH Nickel Metal Hydride
OCV Open Circuit Voltage
P Power
Pb Metallic lead
PbO2 Lead dioxide
PbSO4 Lead sulfate
PME Power Mode Extension
Qtot Total capacity of the battery pack
R Resistance
Rc (A) Internal resistance of the current collector at the anode
Rcable Cable Resistance
Rc (C) Internal resistance of the current collector at the cathode
Rcell Cell Resistance
Rel Electrolyte resistance
Rin Resistance of the electrolyte-electrode interface
Rin (A) Internal resistance of the anode
Rinbatt Internal resistance of the cell
Rin (C) Internal resistance of the cathode
rpm Revolutions per minute
s Second
SEI Solid Electrolyte Interphase
Si Silicon
Sn Tin
SOC State Of Charge
SOCusable State Of Charge usable of the battery pack
SOCOCV State Of Charge depending on OCV
tavg Average Time
T Temperature
Tcell Cell Temperature
U Voltage
V Volt
Vcell Cell Voltage
W Watt
Vregulator Regulator Voltage
Wavailable Energy Available
Wlosses Energy Losses
Wout Energy Output
∆SOC Delta State Of Charge
∆V Delta Voltage
∆I Delta Current
Ω Ohm
°C Celsius

Contents 1. Introduction .............................................................................................................. 1
1.1 Problem background ........................................................................................ 1
1.2 Previous work on start-stop application ........................................................... 1
1.3 The scope of the thesis ..................................................................................... 3
2. Energy storage .......................................................................................................... 5
2.1Batteries ........................................................................................................... 5
2.1.1 Principle of operation ............................................................................ 5
2.2 Different types of rechargeable batteries .......................................................... 6
2.2.1 Lead-acid batteries ................................................................................ 6
2.2.2 Nickel-Cadmium batteries ..................................................................... 8
2.2.3 Nickel metal hydride batteries ............................................................... 9
2.2.4 Lithium-ion batteries ............................................................................. 9
2.3 Comparison of different types of batteries and measures ................................ 14
2.3.1 Energy density .................................................................................... 14
2.3.2 Open circuit voltage ............................................................................ 14
2.3.3 Internal resistance ............................................................................... 15
2.3.4 Memory effect .................................................................................... 16
2.3.5 Cycle life ............................................................................................ 17
2.3.6 Temperature effects ............................................................................ 17
2.3.7 Cost .................................................................................................... 18
2.4 Lithium-ion battery ........................................................................................ 18
2.4.1 Cathode materials ............................................................................... 19
2.4.2 Anode materials .................................................................................. 21
2.4.3 Electrolyte materials ........................................................................... 21
2.5 Battery management system (BMS) for Li-ion batteries ................................. 22
2.5.1 Definition of significant parameters in the BMS .................................. 22
2.5.2 Task of the BMS ................................................................................. 23
2.5.3 Design of the BMS ............................................................................. 24
2.6 The final scope of the thesis ........................................................................... 25
3. Charge algorithms ................................................................................................... 26
3.1 Charge methods for the Li-ion battery ........................................................... 26
3.2 Charge methods used in the lab ..................................................................... 28
4 Tests ........................................................................................................................ 29
4.1 Test setup for lithium ion battery ................................................................... 29
4.1.1 Charge and discharge tests .................................................................. 30
4.1.2 Open circuit voltage test...................................................................... 31
4.2 Proposals of system solutions ........................................................................ 31
4.2.1 System solution A ............................................................................... 32
4.2.2 System solution B ............................................................................... 33
4.2.3 System solution C ............................................................................... 34
4.3 Test performed in vehicles ............................................................................. 34
4.3.1 Electrical management system in the vehicle ....................................... 35
4.3.2 Simulink model for calculating SOC and switching relay .................... 35
5. Results and discussion ............................................................................................. 38
5.1 Lithium ion battery ........................................................................................ 38
5.2 Combined system .......................................................................................... 44
5.3 Verification in vehicle ................................................................................... 54
6. Conclusions ............................................................................................................ 58

7. Outlook ................................................................................................................... 59
8. References .............................................................................................................. 60
1
1. Introduction
1.1 Problem background
Due to the regulations established by many legal organizations, the requirement of CO2
emissions is becoming stricter than before. The ACEA agreement is a voluntary
agreement between the European Automobile Manufacturers Association and the
European Commission, and it limits the amount of CO2 emitted by passenger cars,
targeting 130g/km by 2015. Therefore, the idea of developing electric vehicles instead
of conventional vehicles has become important for the vehicle manufacturers. Due to
the feasibility and high cost of electric vehicles, electric vehicles are limited in mass-
production market, while hybrid electric vehicles (HEVs) are more popular and
commercial.
A HEV combines a conventional internal combustion engine (ICE) propulsion system
with an electric propulsion system, and can achieve better fuel economy and lower CO2
emissions. Some HEVs reduce CO2 emission at idle state by shutting down the ICE and
restarting it when needed. This is considered as a start-stop application, which is
investigated in this thesis, with emphasis on the battery providing electrical energy to
support the vehicle at idling.
The manufacturers require that the batteries in HEVs provide more energy to decrease
fuel consumption of the ICE and that the lifetime of the batteries to be increased.
However, the present lead-acid batteries used in the HEVs cannot achieve this goal. To
achieve this goal, many investigations about the batteries have been performed all over
the world. According to the findings by many research groups, a Li-ion battery is a very
promising choice because of its higher energy density, higher OCV (open circuit
voltage), lighter weight and other advantages. However, by considering the cost and
safety, using lead-acid battery in vehicle applications is still needed to be considered.
The main task of this thesis is to investigate how to use a Li-ion battery into the start-
stop application in mass production of vehicles.
1.2 Previous work on start-stop application
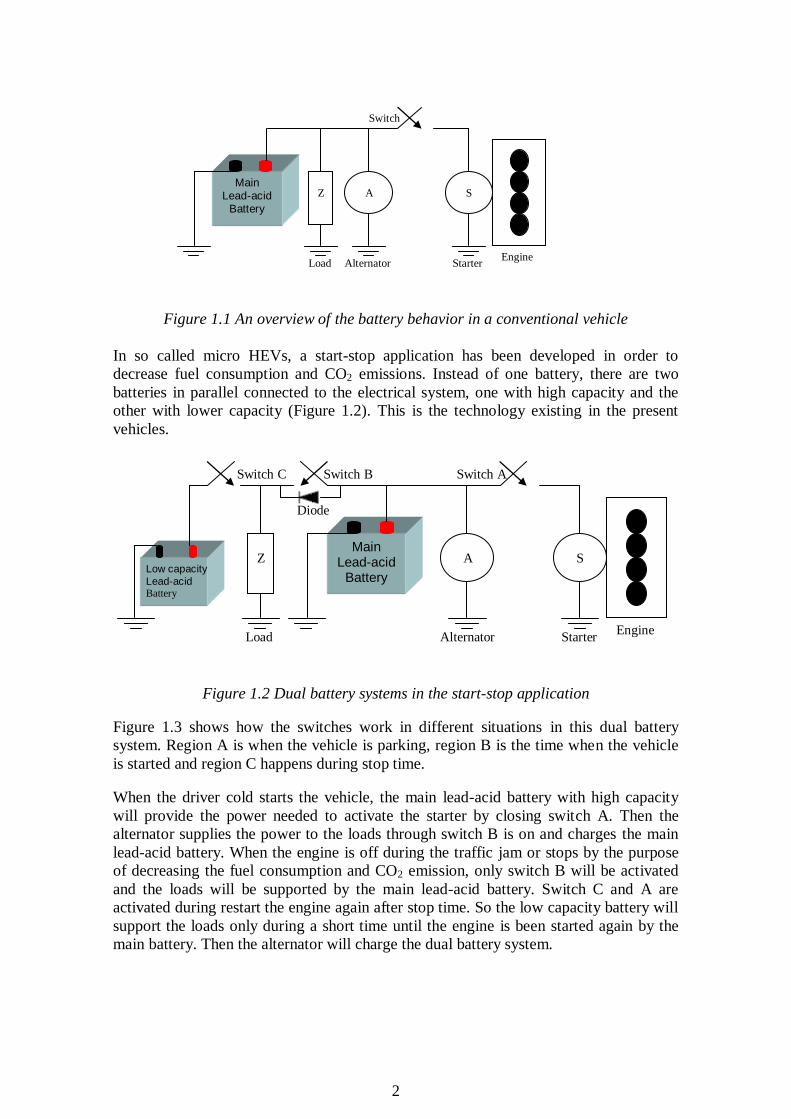
Figure 1.1 shows the general concept of the battery system in a conventional vehicle.
The battery is used to start the engine through a starter. When the engine is running, the
alternator is producing power and feeding the loads (the electronic equipment in the
vehicle) and charging the battery.
2
Figure 1.1 An overview of the battery behavior in a conventional vehicle
In so called micro HEVs, a start-stop application has been developed in order to
decrease fuel consumption and CO2 emissions. Instead of one battery, there are two
batteries in parallel connected to the electrical system, one with high capacity and the
other with lower capacity (Figure 1.2). This is the technology existing in the present
vehicles.
Figure 1.2 Dual battery systems in the start-stop application
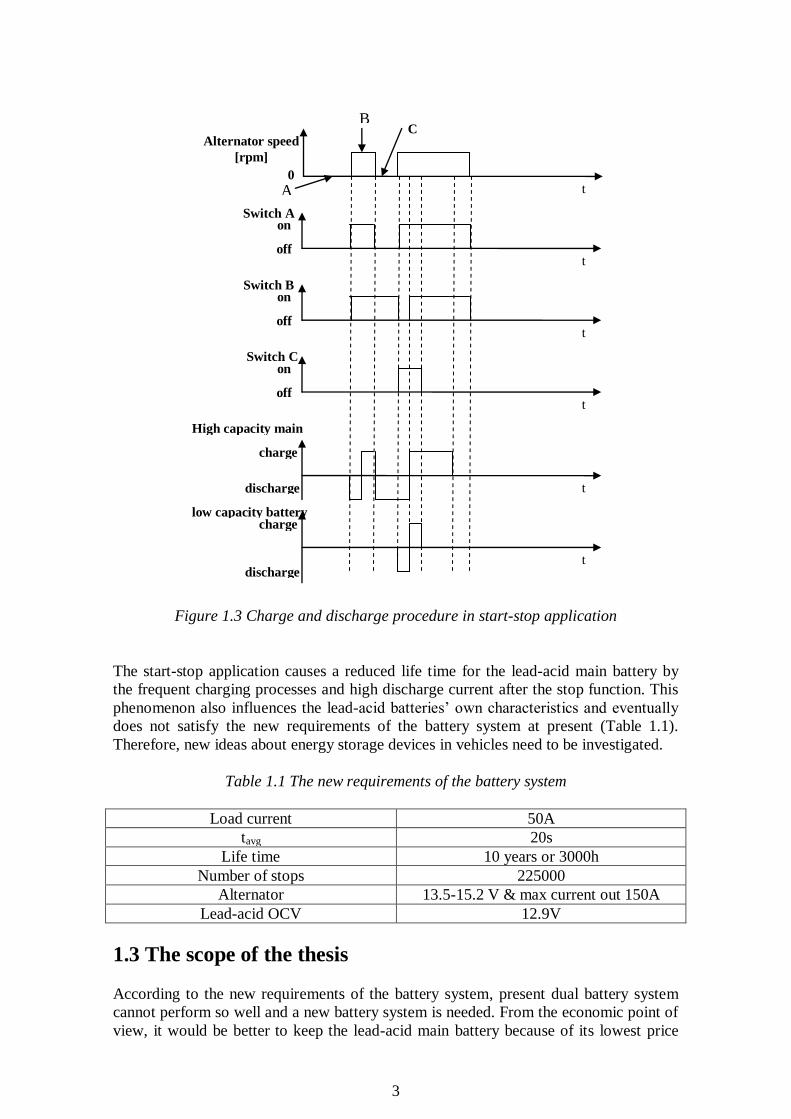
Figure 1.3 shows how the switches work in different situations in this dual battery
system. Region A is when the vehicle is parking, region B is the time when the vehicle
is started and region C happens during stop time.
When the driver cold starts the vehicle, the main lead-acid battery with high capacity
will provide the power needed to activate the starter by closing switch A. Then the
alternator supplies the power to the loads through switch B is on and charges the main
lead-acid battery. When the engine is off during the traffic jam or stops by the purpose
of decreasing the fuel consumption and CO2 emission, only switch B will be activated
and the loads will be supported by the main lead-acid battery. Switch C and A are
activated during restart the engine again after stop time. So the low capacity battery will
support the loads only during a short time until the engine is been started again by the
main battery. Then the alternator will charge the dual battery system.
Main Lead-acid
Battery
S A
Starter Alternator Load
Z
Switch
Engine
Main Lead-acid
Battery
S A
Starter Alternator Load
Z Low capacity
Lead-acid Battery
Switch A Switch B Switch C
Diode
Engine
3
Figure 1.3 Charge and discharge procedure in start-stop application
The start-stop application causes a reduced life time for the lead-acid main battery by
the frequent charging processes and high discharge current after the stop function. This
phenomenon also influences the lead-acid batteries’ own characteristics and eventually
does not satisfy the new requirements of the battery system at present (Table 1.1).
Therefore, new ideas about energy storage devices in vehicles need to be investigated.
Table 1.1 The new requirements of the battery system
Load current 50A
tavg 20s
Life time 10 years or 3000h
Number of stops 225000
Alternator 13.5-15.2 V & max current out 150A
Lead-acid OCV 12.9V
1.3 The scope of the thesis
According to the new requirements of the battery system, present dual battery system
cannot perform so well and a new battery system is needed. From the economic point of
view, it would be better to keep the lead-acid main battery because of its lowest price
A
B C
t
Alternator speed
[rpm]
0
t
t
t
Switch A
Switch B
Switch C
on
off
on
off
on
off
t
t
charge
discharge
High capacity main
battery charge
low capacity battery
discharge
4
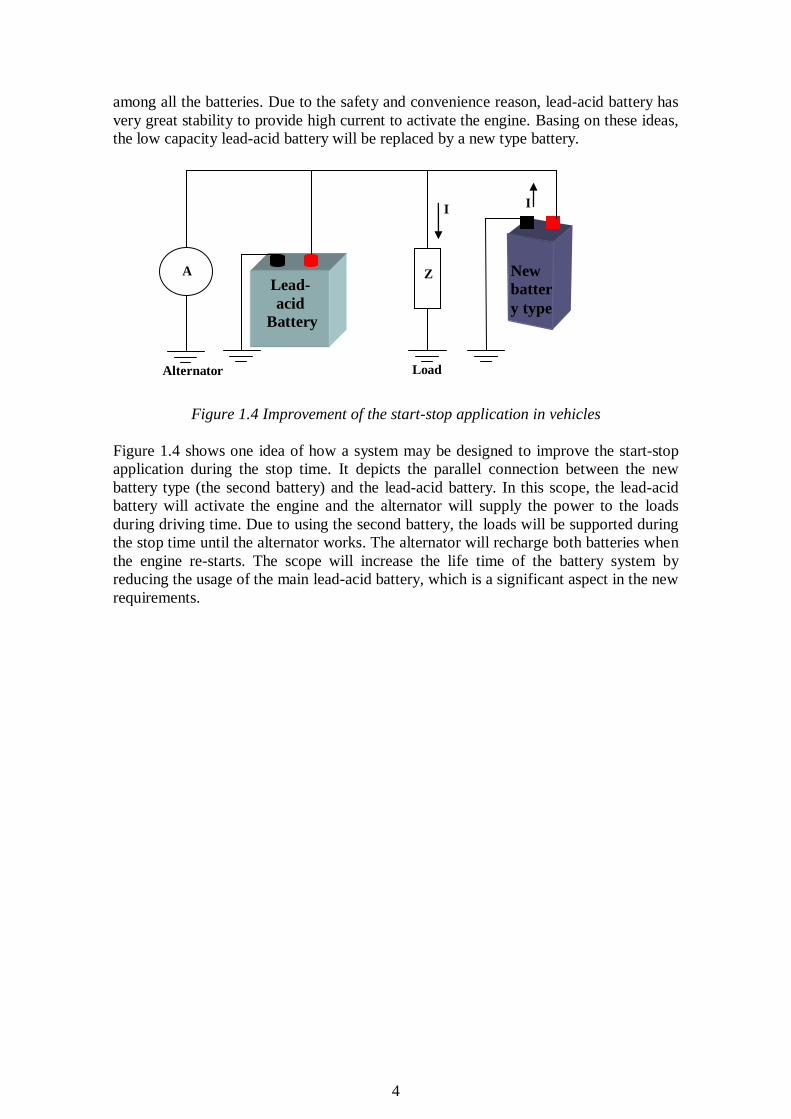
among all the batteries. Due to the safety and convenience reason, lead-acid battery has
very great stability to provide high current to activate the engine. Basing on these ideas,
the low capacity lead-acid battery will be replaced by a new type battery.
Figure 1.4 Improvement of the start-stop application in vehicles
Figure 1.4 shows one idea of how a system may be designed to improve the start-stop
application during the stop time. It depicts the parallel connection between the new
battery type (the second battery) and the lead-acid battery. In this scope, the lead-acid
battery will activate the engine and the alternator will supply the power to the loads
during driving time. Due to using the second battery, the loads will be supported during
the stop time until the alternator works. The alternator will recharge both batteries when
the engine re-starts. The scope will increase the life time of the battery system by
reducing the usage of the main lead-acid battery, which is a significant aspect in the new
requirements.
Lead-
acid
Battery
New
batter
y type
A Z
Load Alternator
I I
5
2. Energy storage
In order to investigate a new battery type, a detailed understanding of battery knowledge
is required.
2.1Batteries
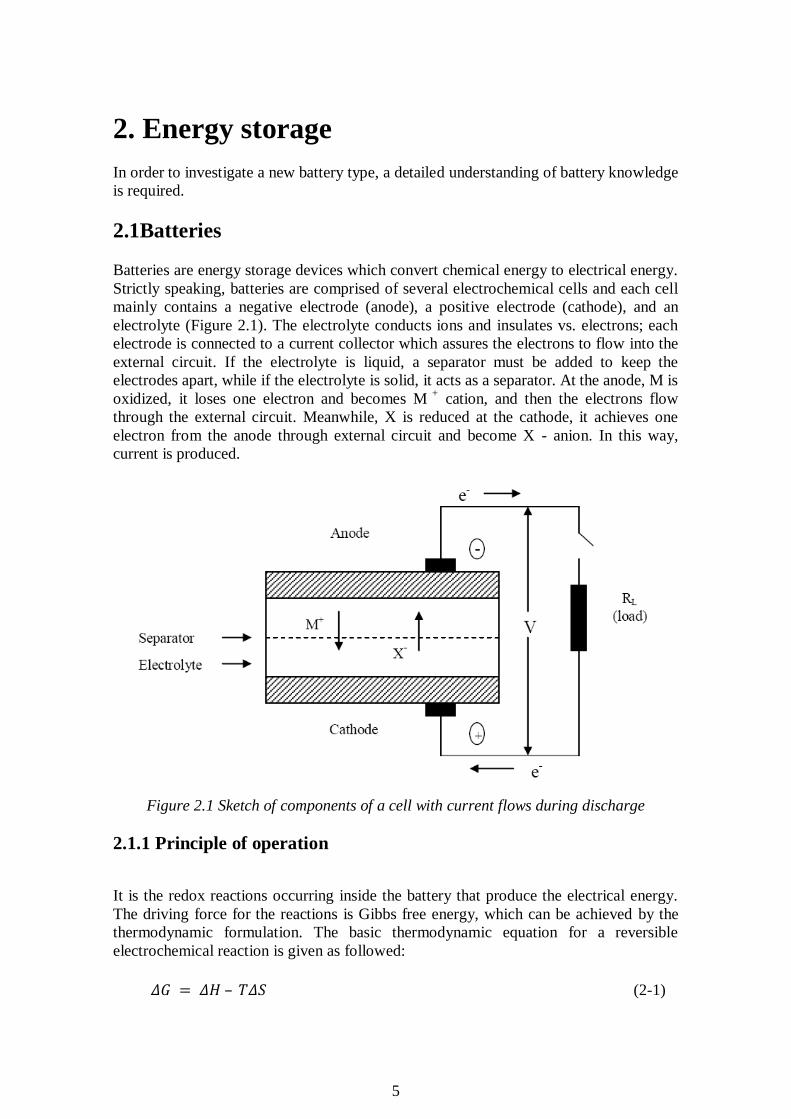
Batteries are energy storage devices which convert chemical energy to electrical energy.
Strictly speaking, batteries are comprised of several electrochemical cells and each cell
mainly contains a negative electrode (anode), a positive electrode (cathode), and an
electrolyte (Figure 2.1). The electrolyte conducts ions and insulates vs. electrons; each
electrode is connected to a current collector which assures the electrons to flow into the
external circuit. If the electrolyte is liquid, a separator must be added to keep the
electrodes apart, while if the electrolyte is solid, it acts as a separator. At the anode, M is
oxidized, it loses one electron and becomes M +
cation, and then the electrons flow
through the external circuit. Meanwhile, X is reduced at the cathode, it achieves one
electron from the anode through external circuit and become X - anion. In this way,
current is produced.
Figure 2.1 Sketch of components of a cell with current flows during discharge
2.1.1 Principle of operation
It is the redox reactions occurring inside the battery that produce the electrical energy.
The driving force for the reactions is Gibbs free energy, which can be achieved by the
thermodynamic formulation. The basic thermodynamic equation for a reversible
electrochemical reaction is given as followed:
𝛥𝐺 = 𝛥𝐻 – 𝑇𝛥𝑆 (2-1)
6
ΔG is the Gibbs free energy or the energy that can be provided for useful work. ΔH is
the enthalpy, which is the entire energy released by the reactions. ΔS is the entropy, and
T is the absolute temperature, while TΔS represents the heat dissipation with random
movement of materials.
Since ΔG represents the net useful work energy available from the reactions, the net
available electrical energy from the reactions can be given by the following formula:
𝐸 = −𝛥𝐺 /𝑛𝐹 (2-2)
Where E is the cell voltage, n is the number of electrons transferred per mole of reactant,
and F is the Faraday constant (96486 Coulombs/mole) [2].
2.2 Different types of rechargeable batteries
Several types of rechargeable batteries are utilized in the vehicle market. They can be
categorized based on the type of electrolyte they use: aqueous, organic solvent, polymer,
ceramic etc. By considering the popularity and significance of the batteries used in the
vehicle mass-production, four types of batteries are described here: lead-acid batteries,
Nickel-Cadmium batteries, nickel metal hydride batteries and Li-ion batteries.
2.2.1 Lead-acid batteries
The lead-acid battery was the first rechargeable battery developed, and has been used
for nearly 140 years. Lead dioxide (PbO2) is the positive electrode, metallic lead (Pb) is
the negative electrode, and the electrolyte is sulfuric acid (H2SO4). Two common types
of lead-acid batteries are utilized in the market: one is flooded lead-acid battery and
another is valve-regulated lead-acid battery. Due to the need of low cost batteries in the
industry, flooded lead-acid battery is the preferred one between these two, which is also
used in the experiments in this thesis.
During the discharge process, the following half equation takes place at the negative
electrode (anode):
Pb + HSO4- → PbSO4 + H + + 2e- (2-3)
Metallic lead reacts with H2SO4 to form a non-conductive solid product of lead sulfate,
PbSO4. Metallic lead loses electrons and becomes lead cations in the above reaction and
in the charge process, the reaction is reversible.
Meanwhile, the other half reaction happens at the positive electrode, the reaction is as
follows:
PbO2 + 3H + + HSO4- + 2e- → PbSO4 + 2H2O (2-4)
This reaction is also reversible.
According to the two half reactions above, the total reaction equation is:
7
discharge
Pb + PbO2 + 2H2SO4 2PbSO4 + 2H2O (2-5) charge
In the ideal case, the discharge capacity should stay constant after cycling of the cell.
However, during the cycling process, a number of processes degrade the battery and
limit the performance. Flooded lead-acid batteries suffer from one or more of the
following mechanisms [3]:
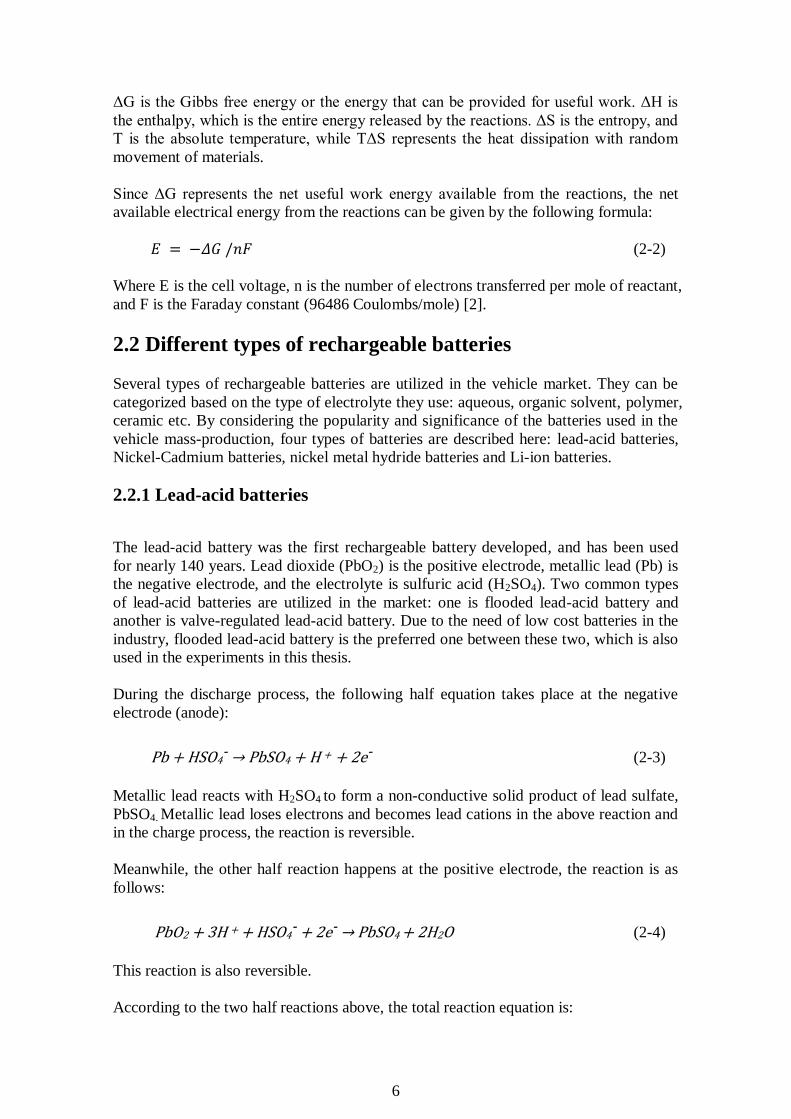
A Positive-plane expansion
PbSO4 has a totally different morphology and crystal structure compared to PbO2. As
shown in Figure 2.2, PbSO4 occupies larger volume than PbO2. In repetitive charge
processes, PbO2 can be re-deposited, but not within original volume. With continuous
cycling, this may cause expansion of positive active mass. The expansion of negative
plate does not show the same tendency, because Pb is softer than PbO2 and therefore the
active mass is easier to compress to tolerate the expanded volume. Progressive
expansion of the positive active mass leads to loss of coherence to the grid, which is a
dominant factor related to cycling life.
Figure 2.2 Volumes of PbSO4 and PbO2, each has the same amount of lead atoms
B Water loss
Electrolysis of water evolves oxygen at the positive plate and hydrogen at the negative
plate. It does not only occur during charge and overcharge processes, but also during the
open circuit conditions at low rate like self-discharge. Production of hydrogen and
oxygen reduce the volume of the electrolyte so that some of the active mass loses
contact with the liquid electrolyte. This process can increase the internal resistance,
which, in turn, can cause excessive heat during recharging and consequently fast water
loss.
C Acid stratification
8
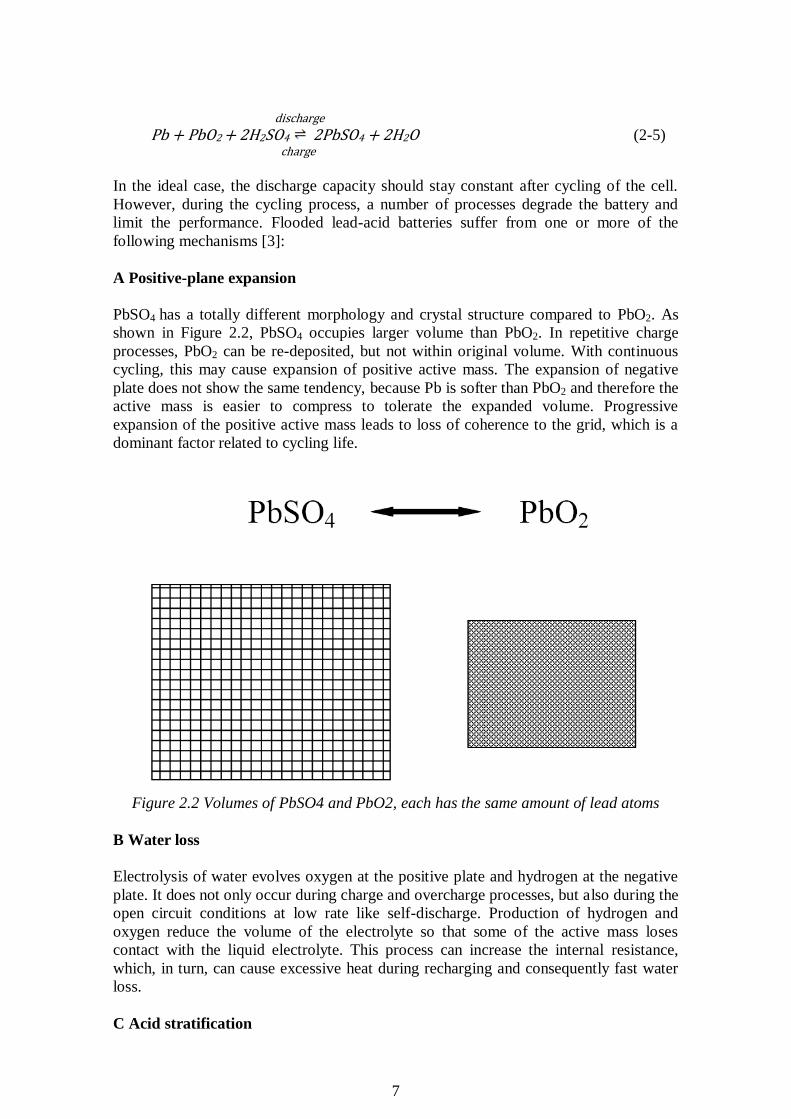
While recharging occurs, H2SO4 is formed in the porous structure of the active mass.
The density of this new formed H2SO4 is higher than that of the electrolyte [4]. Hence,
the high-density H2SO4 would sink down to the bottom of the cell due to the gravity,
which can be depicted in Figure 2.3. The acid density is not homogeneous anymore.
There is a gradient of acid density- high density at the bottom of the cell while low
density at the top of the cell. This effect is called acid stratification. This effect can give
rise to the non-uniform utilization of the active mass and, consequently, shorten the
service life of the battery.
Figure 2.3 Distributions of acid densities in lead-acid battery
D Sulfation
The phenomenon called sulfation is a major aging factor. The active mass reacts with
H2SO4 to form PbSO4, PbSO4 firstly forms in a finely amorphous state and easily to
convert to the active mass reversibly. After repetitive charge and discharge processes,
PbSO4 slowly converts to a stable crystalline form that no longer dissolves. Highly
crystalline PbSO4 forms at the plates and cannot convert to the active form irreversibly,
resulting in a corresponding loss of capacity.
E Corrosion
Positive grid corrosion is still the most frequent cause of lead-acid battery failure.
Metallic lead in the positive plate is unstable and the corrosion is unavoidable.
Fortunately, the formed corrosion film can protect the metallic substrate, so the
corrosion process becomes slow. In some cases, PbSO4 would be formed in the
corrosion layer and lead to the mechanical stress, causing the formation of cracks.
2.2.2 Nickel-Cadmium batteries
Alkaline electrolyte batteries have the energy density which is double than that of lead-
acid batteries. Perhaps the most common alkaline electrolyte battery in the market is
nickel cadmium batteries.
In Ni-Cd batteries, nickel hydroxide Ni(OH)2 is used as the positive electrode, cadmium
as the negative electrode and potassium hydroxide KOH as the electrolyte.
At the positive electrode, the reaction equilibrium equation can be exhibited as follows
[5]: discharge
2NiOOH + 2H2O + 2e- 2Ni(OH)2 + 2OH- (2-6)
charge
9
The half-cell reaction occurring at the negative electrode:
discharge
Cd + 2OH- Cd(OH)2 + 2e- (2-7)
charge
The total reaction can be described in the following formula:
discharge
2NiOOH + Cd + 2H2O Ni(OH)2 + Cd(OH)2 (2-8)
charge
2.2.3 Nickel metal hydride batteries
Nickel metal hydride batteries are related to nickel cadmium batteries and only use
hydrogen-absorbing negative electrode instead of cadmium negative electrode.
Therefore, the reaction at the positive electrode is the same as in (2-6).
The half-cell reaction at the negative electrode is as follows [5]:
discharge
H2 + 2OH- 2H2O + 2e- (2-9)
charge
Therefore, the total reaction is:
discharge
2NiOOH + H2 2Ni(OH)2 (2-10)
charge
2.2.4 Lithium-ion batteries
Lithium is the lightest metal and has a high electrochemical potential. These properties
enable lithium metal to achieve high energy and power density and become a promising
material in the battery production market.
Rather than only using the redox reaction as in the above three types of batteries, Li-ion
batteries also depend on intercalation. Lithium ions are inserted into the lattice of the
host electrode without changing the crystal structure. The principle of Li-ion batteries is
shown in Figure 2.4.
10
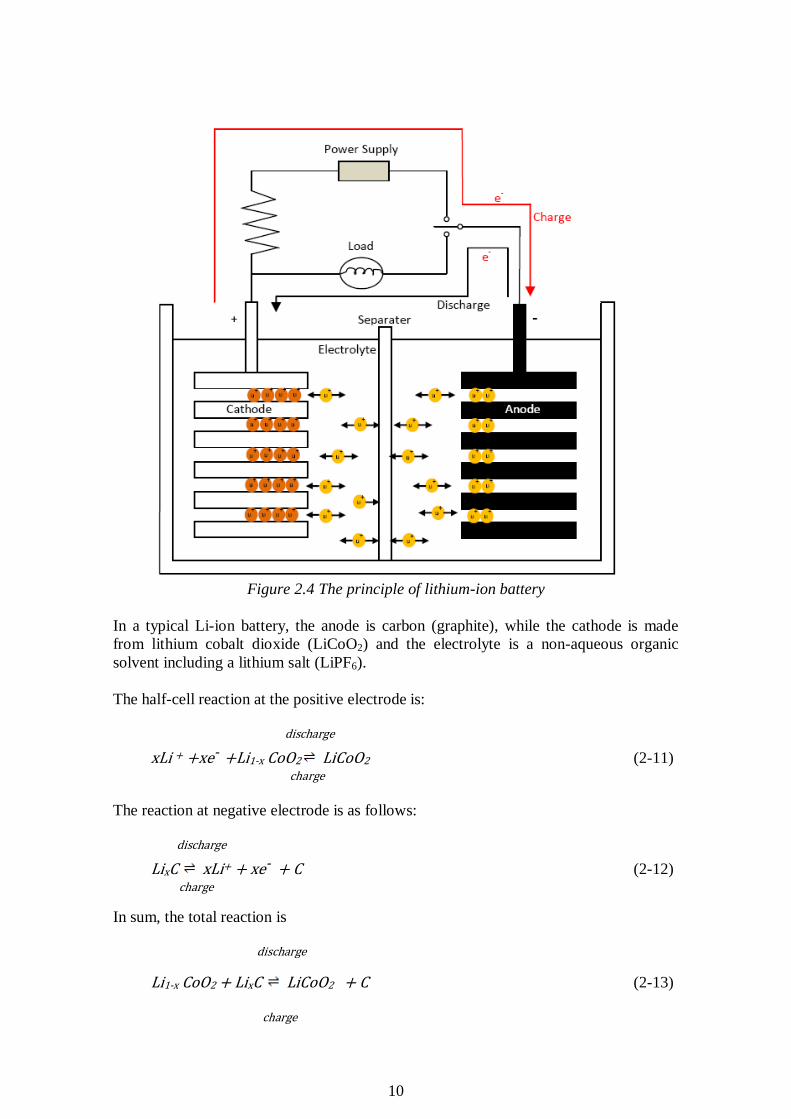
Figure 2.4 The principle of lithium-ion battery
In a typical Li-ion battery, the anode is carbon (graphite), while the cathode is made
from lithium cobalt dioxide (LiCoO2) and the electrolyte is a non-aqueous organic
solvent including a lithium salt (LiPF6).
The half-cell reaction at the positive electrode is:
discharge
xLi + +xe- +Li1-x CoO2 LiCoO2 (2-11)
charge
The reaction at negative electrode is as follows:
discharge
LixC xLi+ + xe- + C (2-12) charge
In sum, the total reaction is
discharge
Li1-x CoO2 + LixC LiCoO2 + C (2-13)
charge
11
During discharge, lithium ions are dissociated, migrate across the electrolyte and are
inserted into the carbon structure. At the same time the compensating electrons flow in
the external circuit. Because this reaction is reversible, the lithium ions pass back and
forth between the electrodes during charging and discharging.
Li-ion batteries also suffer from aging mechanisms, which increase the internal
resistance, induce the capacity loss and shorten the cycle life. Unfortunately, Li-ion
batteries are a complex system to understand and the aging mechanisms inside this type
are more complicated to describe. Therefore, in this paper, an attempt is made to try to
identify and explain the mechanisms of aging in Li-ion batteries from many literature
papers.
Aging mechanisms occurring at the different components inside Li-ion batteries (e.g.
the anode, and the cathode) have different principles, so they will be discussed
separately [6].
A. Aging at the anode
Carbon, especially graphite, is the most popular anode material in Li-ion batteries, and
is also the anode material of Li-ion batteries used in this case. Aging mechanisms
occurring at the anode are caused by three different changes (1) changes at the
anode/electrolyte interface, (2) changes of the active material, and (3) changes of the
composite electrode. Many research groups consider that changes at the
anode/electrolyte interface is the dominating aging mechanism at the anode, and the
other two changes are seldom discussed; however, they really influence the aging
mechanisms, which will be described shortly later.
1. Changes at the anode/electrolyte interface
The electrolyte decomposes and reacts with the carbon anode during the initial charge,
thus forming protective layers covering the surface. At some graphite sites, Li-ions
migrate into/out of the host’s crystal structure. Therefore, the thin passivating layers
formed here are called SEI layers (solid electrolyte interphase). These SEI layers protect
(1) the electrolyte from further reduction, and (2) the charged electrode from corrosion.
Usually, SEI formation is accompanied by the emission of gas electrolyte
decomposition products in the first few cycles. The irreversible capacity loss happens
during SEI formation. In the later cycling, due to self-discharge, the corrosion of the
anode and the electrolyte decomposition are ongoing; however, compared to the first
cycle, the rate is lower. During a long time, SEI penetrates into the pores of the
electrodes and results in a decrease of accessible active surface area of the anode, which
increase the internal resistance. Some studies reveal that exothermic side reactions of
lithiated carbon can cause self-heating. Elevated temperature cause a dramatic influence
on SEI degradation. The SEI layers start to dissolve and a re-precipitation of dissolve
SEI may take place. In this way, meta-stable organic SEI layers will convert into stable
inorganic products, which results in a lower ionic conductivity of the SEI layers for
lithium.
Low temperature also causes many problems. Due to low temperature, the kinetics of
lithium insertion and extraction are very slow, and these effects are very pronounced at
low temperature. Metallic lithium plating and lithium dendrite formation are considered
12
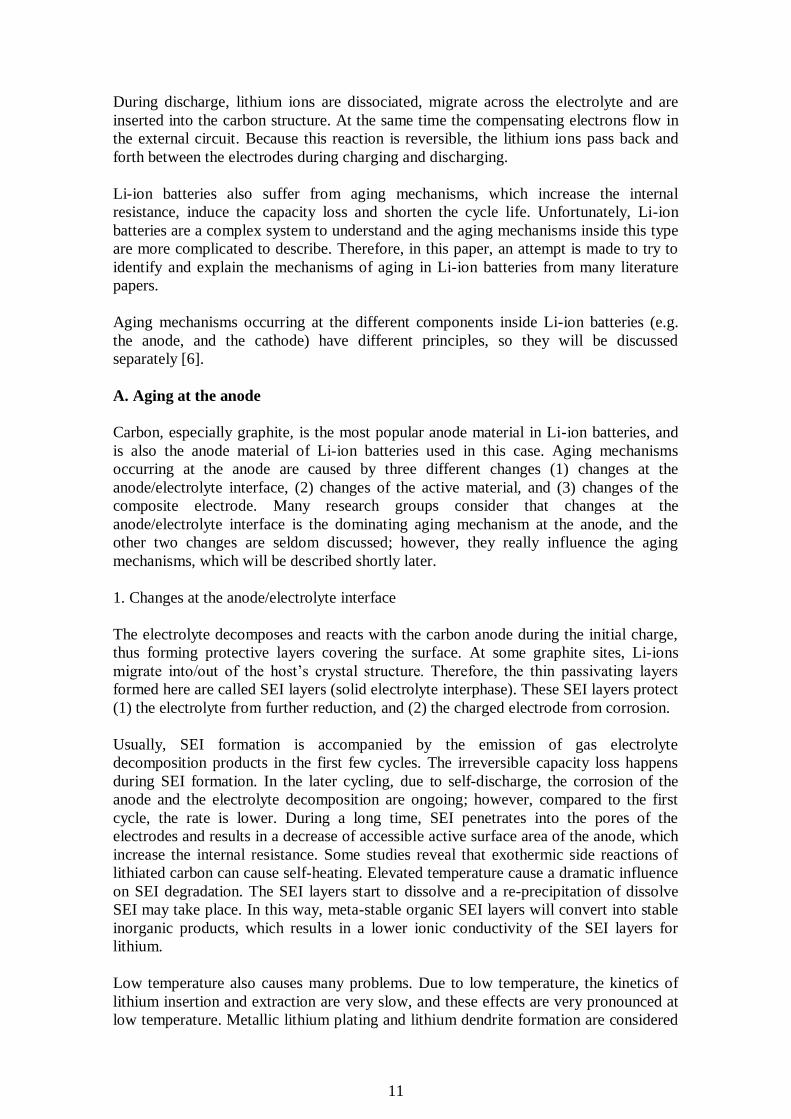
as parasitic side reactions during the charge process. These phenomena induce aging.
All the aging mechanisms described here can be seen in Figure 2.5.
Figure 2.5 Change at the anode/electrolyte interface
2. Changes of the active material
Within the active material, only minor aging effects have been explored. The volume
changes of graphite during the insertion and extraction of lithium ions can cause
mechanical stress on defects and C-C bonds, which may lead to crack or structural
damage. The degradations of the electrodes discussed before have a strong impact on
the changes of active material.
3. Changes of the composite electrodes
Generally, the contact-loss within the electrodes results in the increasing internal
resistance and is considered as the reason for aging. One resource of contact-loss is the
volume change discussed before.
In sum, changes at the anode/electrolyte are the main aging mechanism occurring at the
anode. SEI formation and conversion cause the increased internal resistance and
capacity-loss in the battery. The volume changes of the active material lead to crack and
13
structural damage and also induce the contact loss within the anode, which increases the
internal resistance in the anode.
B. Changes at the cathode
The aging at the cathode material also affects the performance, as well as the cycling
life and capacity loss. In this part, some basic aging mechanisms will be summarized.
The mechanisms of capacity-loss are not completely understood at the moment. The
changes occurring at the cathode having an influence on the cycling life of Li-ion
batteries are categorized as followed.
Changes of the active material
Degradation of the electrode components including the binder, the current collector
Decomposition of the electrolyte and surface film formation
Insertion of aging products into the anode
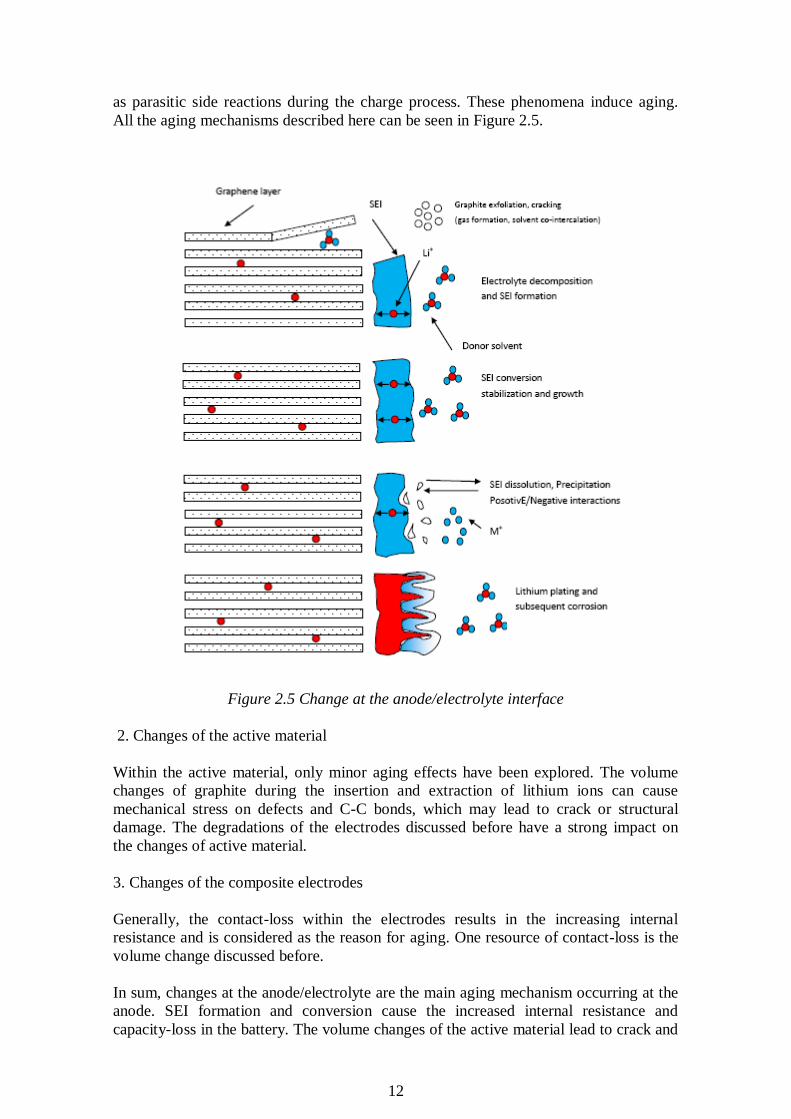
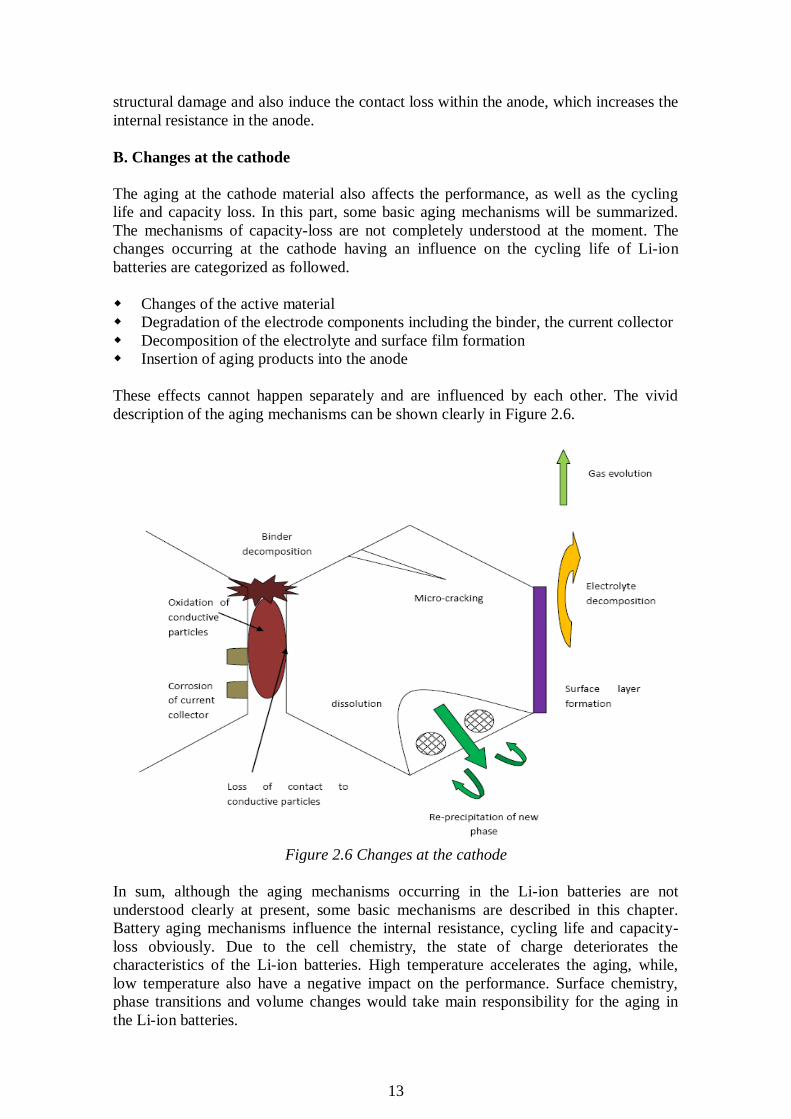
These effects cannot happen separately and are influenced by each other. The vivid
description of the aging mechanisms can be shown clearly in Figure 2.6.
Figure 2.6 Changes at the cathode
In sum, although the aging mechanisms occurring in the Li-ion batteries are not
understood clearly at present, some basic mechanisms are described in this chapter.
Battery aging mechanisms influence the internal resistance, cycling life and capacity-
loss obviously. Due to the cell chemistry, the state of charge deteriorates the
characteristics of the Li-ion batteries. High temperature accelerates the aging, while,
low temperature also have a negative impact on the performance. Surface chemistry,
phase transitions and volume changes would take main responsibility for the aging in
the Li-ion batteries.
14
2.3 Comparison of different types of batteries and measures
2.3.1 Energy density
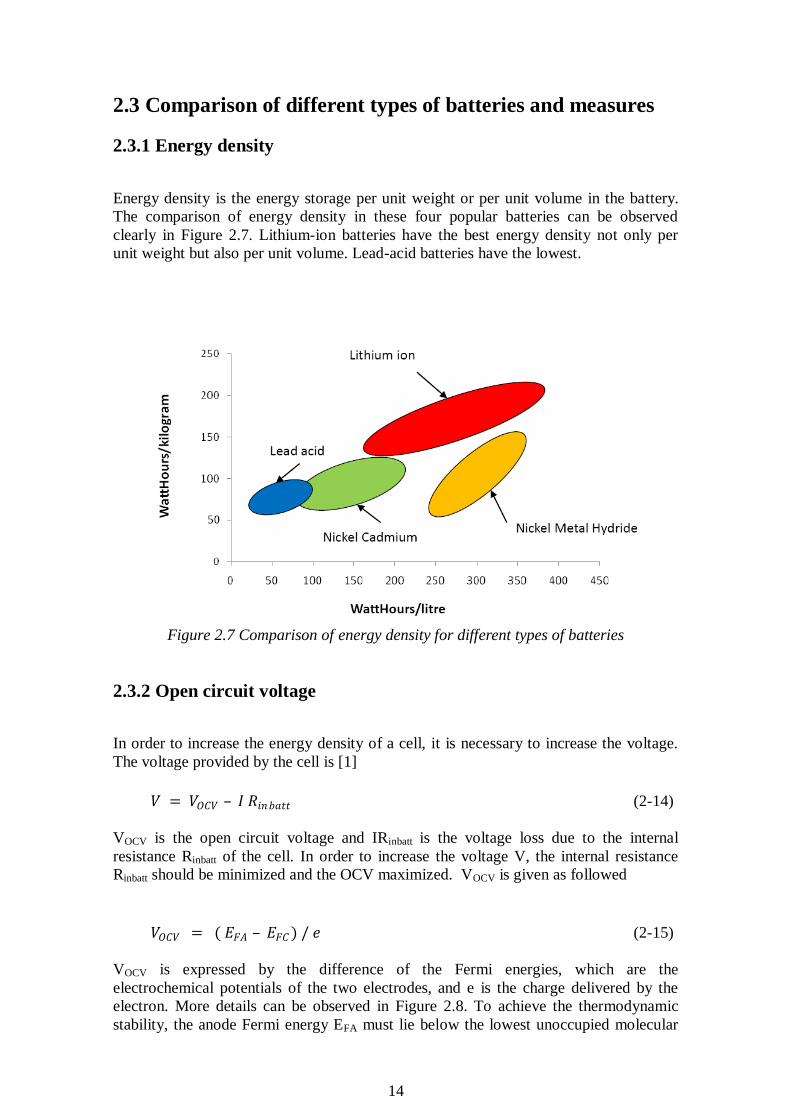
Energy density is the energy storage per unit weight or per unit volume in the battery.
The comparison of energy density in these four popular batteries can be observed
clearly in Figure 2.7. Lithium-ion batteries have the best energy density not only per
unit weight but also per unit volume. Lead-acid batteries have the lowest.
Figure 2.7 Comparison of energy density for different types of batteries
2.3.2 Open circuit voltage
In order to increase the energy density of a cell, it is necessary to increase the voltage.
The voltage provided by the cell is [1]
𝑉 = 𝑉𝑂𝐶𝑉 – 𝐼 𝑅𝑖𝑛𝑏𝑎𝑡𝑡 (2-14)
VOCV is the open circuit voltage and IRinbatt is the voltage loss due to the internal
resistance Rinbatt of the cell. In order to increase the voltage V, the internal resistance
Rinbatt should be minimized and the OCV maximized. VOCV is given as followed
𝑉𝑂𝐶𝑉 = ( 𝐸𝐹𝐴 – 𝐸𝐹𝐶 ) / 𝑒 (2-15)
VOCV is expressed by the difference of the Fermi energies, which are the
electrochemical potentials of the two electrodes, and e is the charge delivered by the
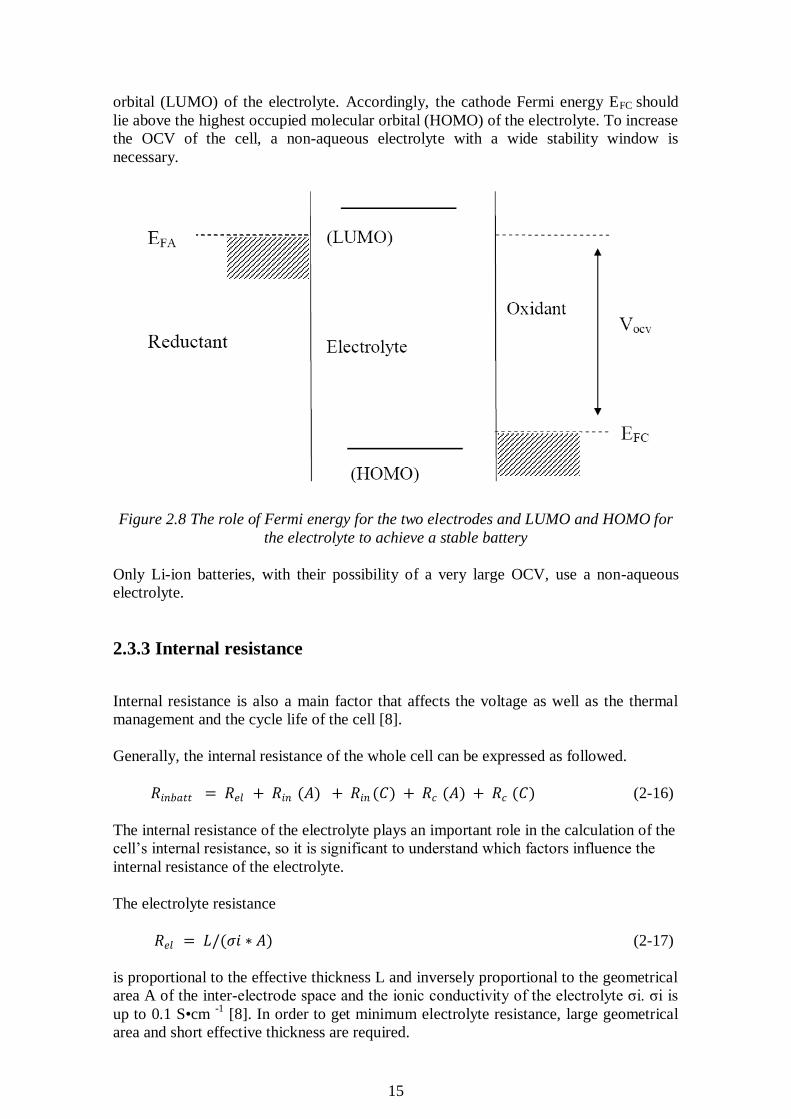
electron. More details can be observed in Figure 2.8. To achieve the thermodynamic
stability, the anode Fermi energy EFA must lie below the lowest unoccupied molecular
15
orbital (LUMO) of the electrolyte. Accordingly, the cathode Fermi energy EFC should
lie above the highest occupied molecular orbital (HOMO) of the electrolyte. To increase
the OCV of the cell, a non-aqueous electrolyte with a wide stability window is
necessary.
Figure 2.8 The role of Fermi energy for the two electrodes and LUMO and HOMO for
the electrolyte to achieve a stable battery
Only Li-ion batteries, with their possibility of a very large OCV, use a non-aqueous
electrolyte.
2.3.3 Internal resistance
Internal resistance is also a main factor that affects the voltage as well as the thermal
management and the cycle life of the cell [8].
Generally, the internal resistance of the whole cell can be expressed as followed.
𝑅𝑖𝑛𝑏𝑎𝑡𝑡 = 𝑅𝑒𝑙 + 𝑅𝑖𝑛 (𝐴) + 𝑅𝑖𝑛 (𝐶) + 𝑅𝑐 (𝐴) + 𝑅𝑐 (𝐶) (2-16)
The internal resistance of the electrolyte plays an important role in the calculation of the
cell’s internal resistance, so it is significant to understand which factors influence the
internal resistance of the electrolyte.
The electrolyte resistance
𝑅𝑒𝑙 = 𝐿/(𝜎𝑖 ∗ 𝐴) (2-17)
is proportional to the effective thickness L and inversely proportional to the geometrical
area A of the inter-electrode space and the ionic conductivity of the electrolyte σi. σi is
up to 0.1 S•cm -1
[8]. In order to get minimum electrolyte resistance, large geometrical
area and short effective thickness are required.
16
The resistance of the electrolyte-electrode interface is proportional to the ratio of the
geometrical area A and the interfacial area Ain at each electrode.
𝑅𝑖𝑛 ~𝐴/𝐴𝑖𝑛 (2-18)
The areas are relevant to the structure inside the cell and the aging mechanisms occuring
inside; that is, they would change frequently, especially at the initial cycling.
The current collector resistance Rc of each electrode is related as follows:
𝑅𝑐 = (𝑙/(𝐴 ∗ 𝜎𝑒)) + (1/(𝑑 ∗ 𝜎𝑚) (2-19)
In equation 2-19, l is the mean distance an electron travels through the thickness of the
electrode and σe is the electronic conductivity, while σm is the conductivity of the
current collector and d is a geometrical parameter having units of length.
Actually, according to the reactions and aging mechanisms inside the cell, and are
difficult to identify theoretically. However, some values from the experiments from the
other research groups can show that the internal resistance of lead-acid batteries would
be the lowest by comparing with the others [9].
2.3.4 Memory effect
Memory effect describes the situation in which the batteries gradually lose their
capacity after repeated recharge after being partially discharged. The batteries appear to
remember the smaller capacity. Actually, this effect only occurs inside the nickel-based
batteries due to the specific phase occurring in this type battery and it is the major
reason why the nickel based batteries are rarely used in the market [10].
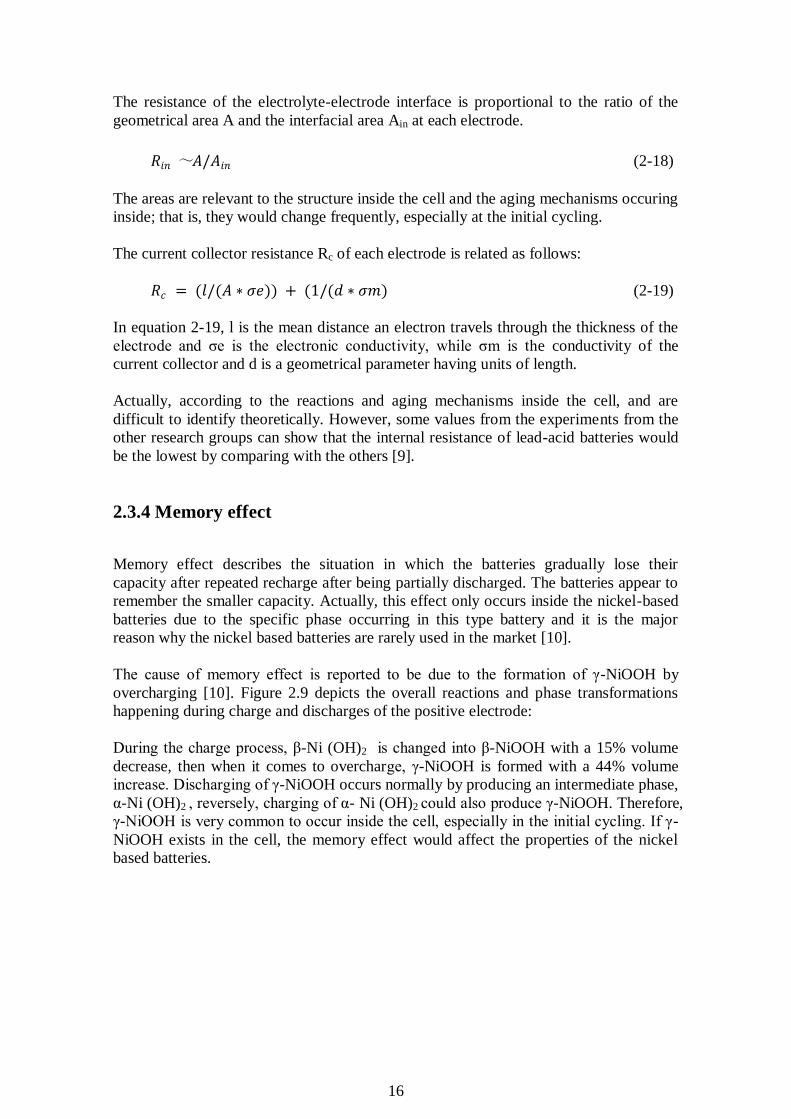
The cause of memory effect is reported to be due to the formation of γ-NiOOH by
overcharging [10]. Figure 2.9 depicts the overall reactions and phase transformations
happening during charge and discharges of the positive electrode:
During the charge process, β-Ni (OH)2 is changed into β-NiOOH with a 15% volume
decrease, then when it comes to overcharge, γ-NiOOH is formed with a 44% volume
increase. Discharging of γ-NiOOH occurs normally by producing an intermediate phase,
α-Ni (OH)2 , reversely, charging of α- Ni (OH)2 could also produce γ-NiOOH. Therefore,
γ-NiOOH is very common to occur inside the cell, especially in the initial cycling. If γ-
NiOOH exists in the cell, the memory effect would affect the properties of the nickel
based batteries.
17
Figure 2.9 Phase transformation inside nickel-based batteries
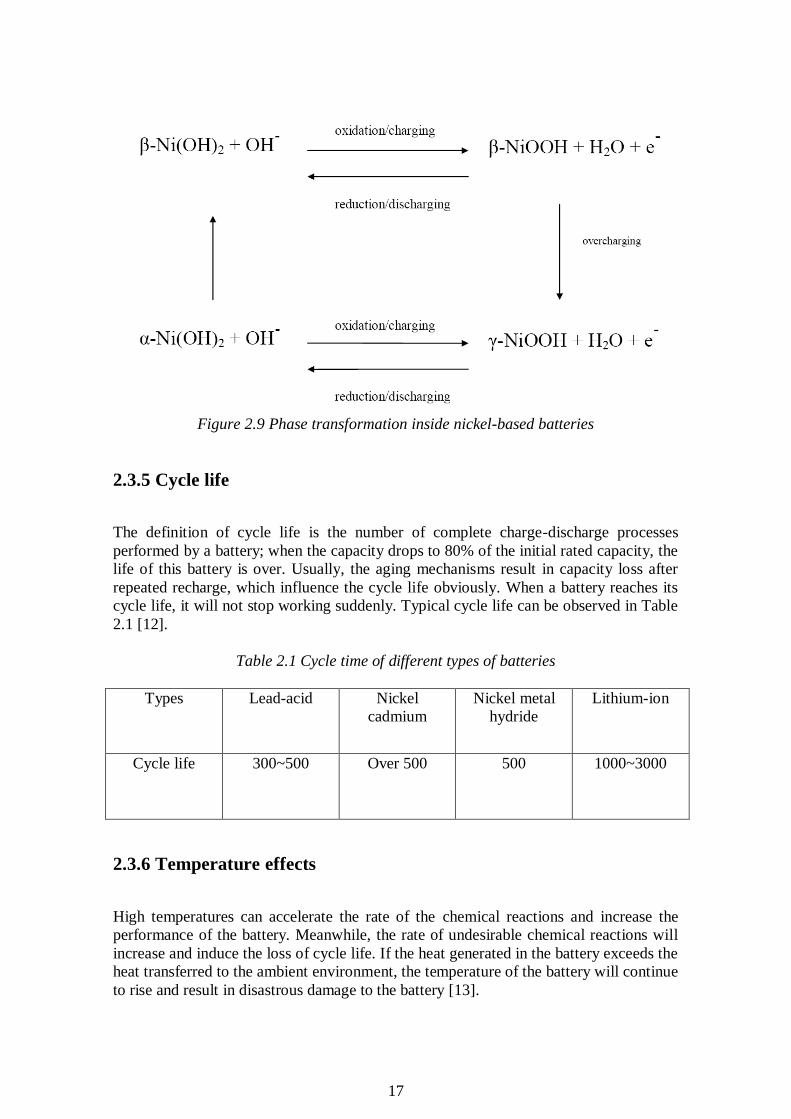
2.3.5 Cycle life
The definition of cycle life is the number of complete charge-discharge processes
performed by a battery; when the capacity drops to 80% of the initial rated capacity, the
life of this battery is over. Usually, the aging mechanisms result in capacity loss after
repeated recharge, which influence the cycle life obviously. When a battery reaches its
cycle life, it will not stop working suddenly. Typical cycle life can be observed in Table
2.1 [12].
Table 2.1 Cycle time of different types of batteries
Types Lead-acid Nickel
cadmium
Nickel metal
hydride
Lithium-ion
Cycle life 300~500 Over 500 500 1000~3000
2.3.6 Temperature effects
High temperatures can accelerate the rate of the chemical reactions and increase the
performance of the battery. Meanwhile, the rate of undesirable chemical reactions will
increase and induce the loss of cycle life. If the heat generated in the battery exceeds the
heat transferred to the ambient environment, the temperature of the battery will continue
to rise and result in disastrous damage to the battery [13].
18
In the low temperature situation, when the temperature reaches the freezing point of the
electrolyte inside the battery, the battery is nearly out of work. When below the freezing
point of the electrolyte, the battery performance deteriorates as the rates of the chemical
reactions are reduced.
Among these four types of batteries, from theoretical data, they nearly have the similar
temperature range; relatively the performance of lead-acid batteries owns the priority in
reality. At the high temperature, for the sake of achieving the same capacity, generally
the volume and size of lead-acid battery is much larger than the other three batteries, so
the lead-acid battery has larger surface area to release the heat trapped inside the battery.
In this way, the temperature would not increase so quickly to damage the battery.
At the low temperature, comparing lead-acid battery with Li-ion battery, the freezing
point of the lead-acid battery is lower than that of the Li-ion battery, so when decreasing
the temperature, the Li-ion battery is easier to transfer into the solid and impede the ion
diffusion mechanism. If the judgment of temperature can be defined in the research lab,
it does not work in application, especially the vehicle industry which requires
knowledge of long-term effects. Therefore, BMS (battery management system) which
will protect the battery to be damaged by the temperature is required (more details will
be explained in the following part).
2.3.7 Cost
According to Table 2.2, the cost of flooded lead-acid battery is the lowest, which is also
the sample used in the lab. From this point, it is not economical to utilize any other
battery to replace the flooded lead-acid battery in the vehicles, especially in the mass-
production vehicles. This aspect is a subtle advantage for lead-acid batteries. However,
the capacity of Li-ion batteries required in this thesis is around 30Ah, so the cost of Li-
ion batteries is about 100 dollars. This can be accepted if the Li-ion batteries can
increase the life time of the battery system as expected.
Table 2.2 Cost for different types of batteries
Flooded lead aicd Ni-MH Lithium-ion
Energy requirement (Wh) 800 800 800
Specific energy (Wh kg-1
) 30 55 90
Mass (kg) 26.7 14.5 8.9
Mass reduction (kg) basis -12.1 -17.8
Example cost (US$) 25 500 300
Cost increase (US$) basis 475 275
2.4 Lithium-ion battery
The cathode, the anode and the electrolyte are the main important components inside the
Li-ion battery. Their specifics will be explained briefly below.
19
2.4.1 Cathode materials
The lithium-ion battery is the most promising rechargeable battery at present. It has
higher energy density, higher OCV, and lighter weight. This part will mainly discuss
three common types of lithium-ion batteries based on the cathode materials: LiMO2 (M
= Cr, Co, Ni, Mn etc), LixMnyO1-x-y and LiFePO4 [1].
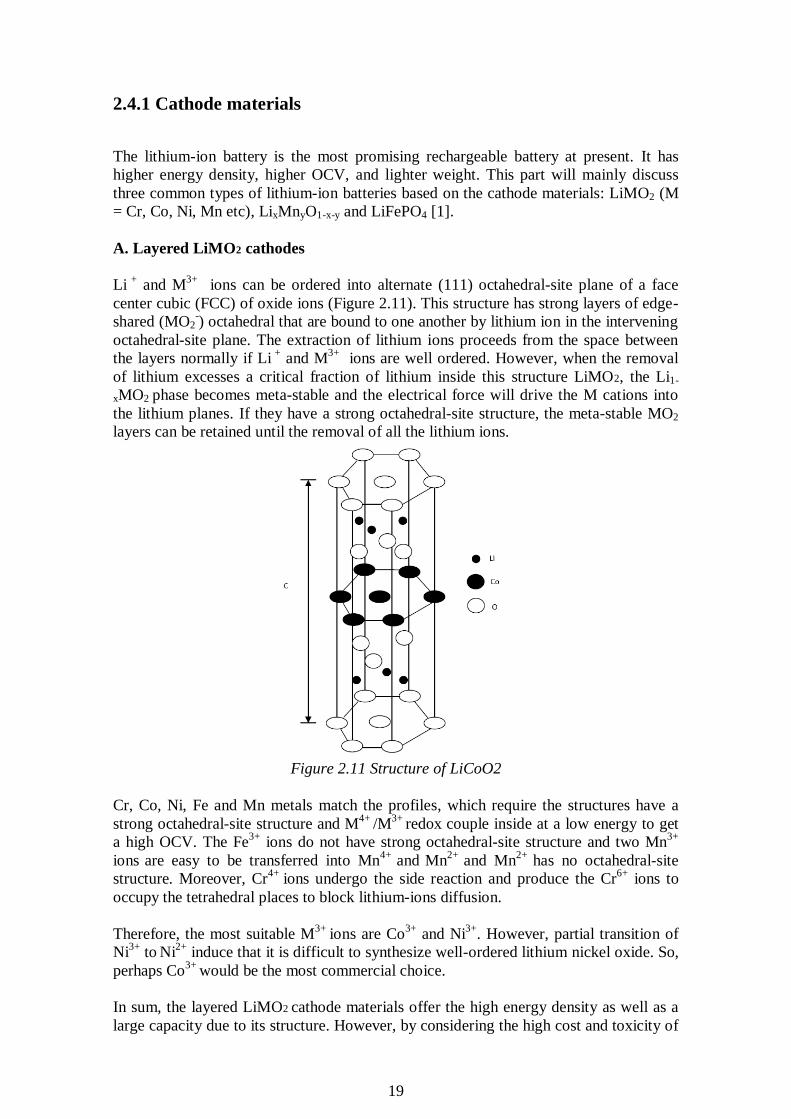
A. Layered LiMO2 cathodes
Li +
and M3+
ions can be ordered into alternate (111) octahedral-site plane of a face
center cubic (FCC) of oxide ions (Figure 2.11). This structure has strong layers of edge-
shared (MO2-) octahedral that are bound to one another by lithium ion in the intervening
octahedral-site plane. The extraction of lithium ions proceeds from the space between
the layers normally if Li +
and M3+
ions are well ordered. However, when the removal
of lithium excesses a critical fraction of lithium inside this structure LiMO2, the Li1-
xMO2 phase becomes meta-stable and the electrical force will drive the M cations into
the lithium planes. If they have a strong octahedral-site structure, the meta-stable MO2
layers can be retained until the removal of all the lithium ions.
Figure 2.11 Structure of LiCoO2
Cr, Co, Ni, Fe and Mn metals match the profiles, which require the structures have a
strong octahedral-site structure and M4+
/M3+
redox couple inside at a low energy to get
a high OCV. The Fe3+
ions do not have strong octahedral-site structure and two Mn3+
ions are easy to be transferred into Mn
4+ and
Mn
2+ and Mn
2+ has no octahedral-site
structure. Moreover, Cr4+
ions undergo the side reaction and produce the Cr6+
ions to
occupy the tetrahedral places to block lithium-ions diffusion.
Therefore, the most suitable M3+
ions are Co3+
and Ni3+
. However, partial transition of
Ni3+
to Ni
2+ induce that it is difficult to synthesize well-ordered lithium nickel oxide. So,
perhaps Co3+
would be the most commercial choice.
In sum, the layered LiMO2 cathode materials offer the high energy density as well as a
large capacity due to its structure. However, by considering the high cost and toxicity of
20
cobalt, they are of good use in low power applications. When it comes to the high power
applications, the layered LiMO2 cathode materials are limited by the high internal
temperature produced, in addition to the high expense. Because the metastable hosts
inside the layered LiMO2 cathode materials can be disordered by the high temperature.
The 3D framework oxides discussed below are more competitive for power applications
in the vehicles where multiple cells are required and high internal temperature can be
avoided.
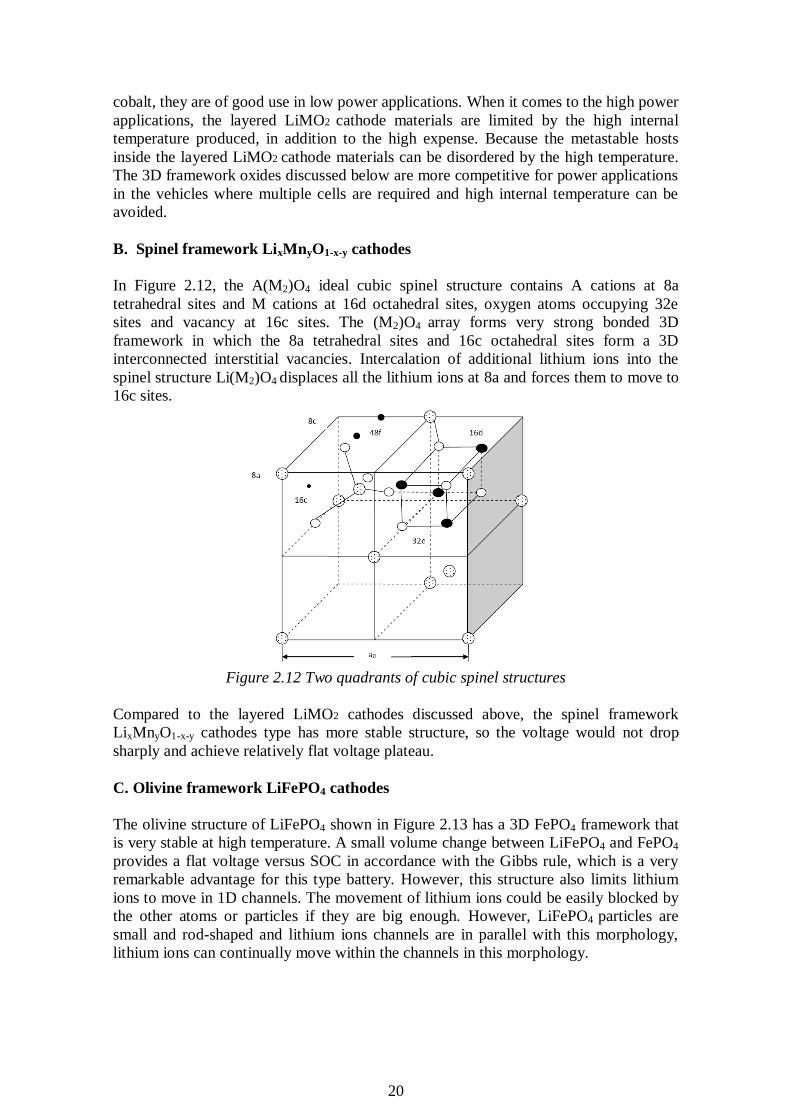
B. Spinel framework LixMnyO1-x-y cathodes
In Figure 2.12, the A(M2)O4 ideal cubic spinel structure contains A cations at 8a
tetrahedral sites and M cations at 16d octahedral sites, oxygen atoms occupying 32e
sites and vacancy at 16c sites. The (M2)O4 array forms very strong bonded 3D
framework in which the 8a tetrahedral sites and 16c octahedral sites form a 3D
interconnected interstitial vacancies. Intercalation of additional lithium ions into the
spinel structure Li(M2)O4 displaces all the lithium ions at 8a and forces them to move to
16c sites.
Figure 2.12 Two quadrants of cubic spinel structures
Compared to the layered LiMO2 cathodes discussed above, the spinel framework
LixMnyO1-x-y cathodes type has more stable structure, so the voltage would not drop
sharply and achieve relatively flat voltage plateau.
C. Olivine framework LiFePO4 cathodes
The olivine structure of LiFePO4 shown in Figure 2.13 has a 3D FePO4 framework that
is very stable at high temperature. A small volume change between LiFePO4 and FePO4
provides a flat voltage versus SOC in accordance with the Gibbs rule, which is a very
remarkable advantage for this type battery. However, this structure also limits lithium
ions to move in 1D channels. The movement of lithium ions could be easily blocked by
the other atoms or particles if they are big enough. However, LiFePO4 particles are
small and rod-shaped and lithium ions channels are in parallel with this morphology,
lithium ions can continually move within the channels in this morphology.
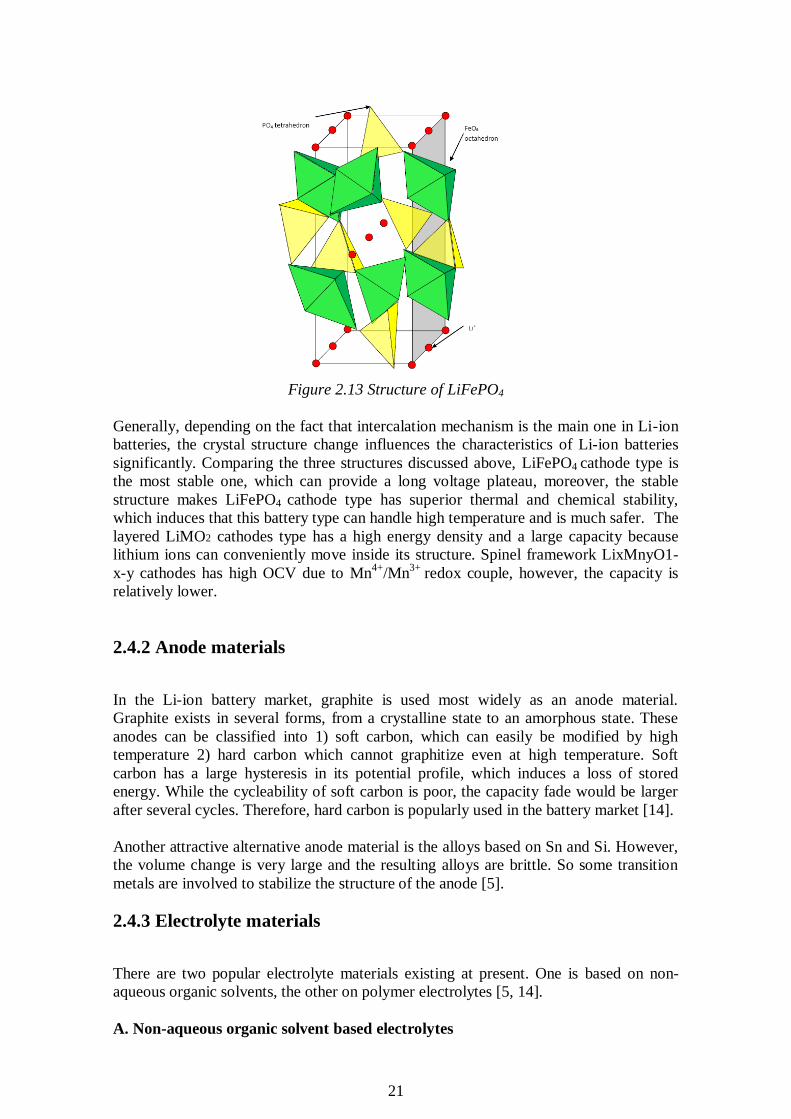
21
Figure 2.13 Structure of LiFePO4
Generally, depending on the fact that intercalation mechanism is the main one in Li-ion
batteries, the crystal structure change influences the characteristics of Li-ion batteries
significantly. Comparing the three structures discussed above, LiFePO4 cathode type is
the most stable one, which can provide a long voltage plateau, moreover, the stable
structure makes LiFePO4 cathode type has superior thermal and chemical stability,
which induces that this battery type can handle high temperature and is much safer. The
layered LiMO2 cathodes type has a high energy density and a large capacity because
lithium ions can conveniently move inside its structure. Spinel framework LixMnyO1-
x-y cathodes has high OCV due to Mn4+
/Mn3+
redox couple, however, the capacity is
relatively lower.
2.4.2 Anode materials
In the Li-ion battery market, graphite is used most widely as an anode material.
Graphite exists in several forms, from a crystalline state to an amorphous state. These
anodes can be classified into 1) soft carbon, which can easily be modified by high
temperature 2) hard carbon which cannot graphitize even at high temperature. Soft
carbon has a large hysteresis in its potential profile, which induces a loss of stored
energy. While the cycleability of soft carbon is poor, the capacity fade would be larger
after several cycles. Therefore, hard carbon is popularly used in the battery market [14].
Another attractive alternative anode material is the alloys based on Sn and Si. However,
the volume change is very large and the resulting alloys are brittle. So some transition
metals are involved to stabilize the structure of the anode [5].
2.4.3 Electrolyte materials
There are two popular electrolyte materials existing at present. One is based on non-
aqueous organic solvents, the other on polymer electrolytes [5, 14].
A. Non-aqueous organic solvent based electrolytes
22
As discussed above, an aqueous electrolyte cannot be used in the Li-ion battery, so
inorganic salts dissolved in organic solvents are used as electrolytes. A perfect
electrolyte material should have high ionic conductivity, good stability and excellent
safety. LiPF6-doped organic solvents are the most common electrolyte in the market
today.
B. Polymer electrolytes
There are two types of polymer electrolytes, one is gel electrolyte and the other is dry
polymer electrolyte. These polymer electrolytes have low cost and can be easily
compacted in the manufacturing process.
Gel electrolytes are consisting of an inactive polymer matrix and a lithium salt solution.
These electrolytes flow like liquid at high temperature and behave as a rubber below a
glass transition temperature.
Dry polymer electrolytes contain a polymer and a lithium salt. At room temperature, the
ionic conductivity of these electrolytes is low. Due to the segmental motions of the
polymer chains, the ionic conductivity will increase with temperature.
2.5 Battery management system (BMS) for Li-ion batteries
BMS is the battery pack’s brain, which consists of the electronic circuits to provide
Controlling
Monitoring
Error
Calculating
Cell balancing
on the operational parameters during charging and discharging of the Li-ion battery
such as currents, voltages, and the internal and ambient temperature. The monitoring
should protect the circuits by disconnect the battery from the loads or generate alarms
when parameters grow out of limit [15, 16].
High current flow through the battery cells or pack can lead to high internal
temperatures [17]. To avoid high current flow it is good to know how much maximal
current could be drawn to charge or discharge the battery for various SOC level. The
BMS should be able to prevent high current flow through the battery if it happens.
The main objective of all BMS is to protect the battery pack or cells from harm,
increase the life time of the battery and to maintain the battery voltage in the required
region. To achieve these objectives some of the following functions need to be
implemented [15].
2.5.1 Definition of significant parameters in the BMS
The most important parameters to monitor in the Li-ion battery are the current, voltage,
temperature and to use these to calculate the SOC. SOC of the battery is the level or
amount of energy which could be produced or left in the battery pack.
23
𝑆𝑂𝐶 = 𝑆𝑂𝐶𝑂𝐶𝑉 + 𝛥𝑆𝑂𝐶 = 𝑆𝑂𝐶𝑂𝐶𝑉 + 𝐼𝑑𝑡𝑡
0
𝑄𝑡𝑜𝑡 (2-20)
There are several methods to estimate SOC, some depend on the battery chemistry but
most depend on the measure of some parameter which is varied with the SOC e.g. by
knowing the current flow through the battery then ∆SOC could be calculated. It’s a rate
of how much of the battery capacity C is used or how much it is charged in a percentage
ratio and then from the fingerprint of the battery, which is the presented in figure 5-10,
the OCV will be found which is the actual voltage level of the battery pack (when the
battery is disconnected from the circuit, the voltage over it corresponds to OCV). This
will yield the corresponding SOCOCV and by adding this to ∆SOC the actual SOC is
obtained [18]. A more detailed explanation will be provided further on in Appendix A.
2.5.2 Task of the BMS
A. Monitoring
The role of monitoring is to check the levels of the battery pack, monitor cell
characteristics or to manage the system. Monitoring will only indicate that the levels
have not exceeded the limitation values. To prevent false alarms or noise signals, the
monitoring has a time delay before notifying that the level has been exceeded. The
levels of interest are parameters such as pressure, temperature, voltage and current [16].
B. Measuring
Measurements in BMS are usually including for each cells voltage and temperature, and
current is typically measures for the battery pack. It will supply the size information in
addition to what is visible from monitoring [16].
C. Calculating
Calculating is the action of using measurement data of accurate battery cell
characteristics to calculate the desired parameters [16].
D. Error
In order to provide data or information from monitoring, measuring and calculating to
another unit or subsystem, communication is needed. It can be as simple as just using
some flashing lamp or light emitting diode (LED) to convey that the level of some
parameter has been exceeded. Depending on the inclusion of more refined protocols
such as data set and bus structure, the communicating can be more advanced [16].
E. Control
Control means that the BMS has control over the battery cells and pack, such as
connecting and disconnecting the battery during charging and discharging periods,
when the current, voltage and temperature exceed the minimum or maximum limitation
level of the battery pack or cells [16].
24
D. Cell balancing
The balancing system is not a necessary function for all battery types, depending on the
chemistry of the cell. Due to small differences of internal impedances or other factors of
the cell, unbalances may occur [16]. Different ageing characteristics in series connected
cells as well as different temperatures can cause unbalance at the battery pack. During
charging of a battery pack which consists of multiple chain connected cells, if one of the
cells is charged before the other, it leads to damages to the cell due to building high
temperature and pressure. This is due to the fully charged cell becoming overcharged
while the other cells will continue their charging. For every charge and discharge period
the weak cell will become weaker and it damages the battery pack. During discharge,
the weakest cell will be discharged much quicker than other cells. This will lead to
excessive discharge, ageing and damage of the cell [15].
2.5.3 Design of the BMS
The model of the battery control system will be used to monitor one of the system
solutions in section 4, and by testing and investigation improve the controller. The
controller should be adapted to the behavior and working area of the Li-ion battery as
presented in Figure 5.11. The controller will take care of taking the Li-ion battery to the
target level after every discharge. When the alternator is on it will charge the battery
pack back to the original level of the battery SOC, since charging and discharging the
Li-ion battery in some intervals many times affect the aging but not as much as
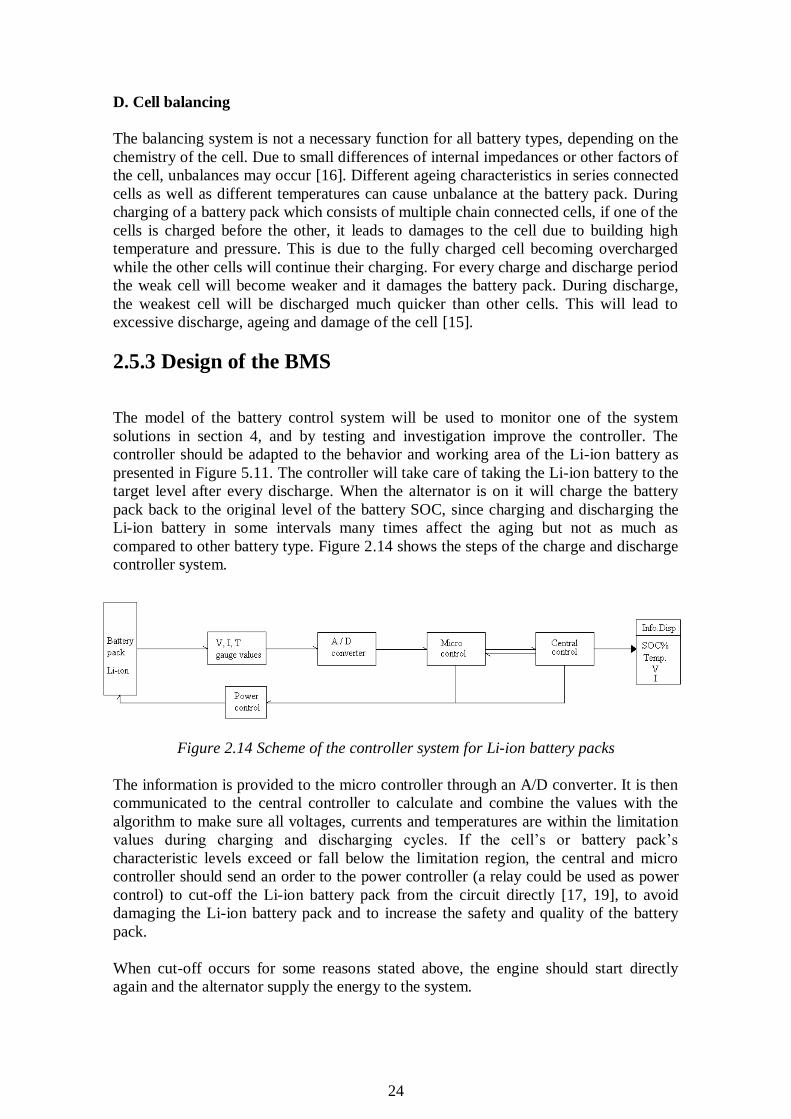
compared to other battery type. Figure 2.14 shows the steps of the charge and discharge
controller system.
Figure 2.14 Scheme of the controller system for Li-ion battery packs
The information is provided to the micro controller through an A/D converter. It is then
communicated to the central controller to calculate and combine the values with the
algorithm to make sure all voltages, currents and temperatures are within the limitation
values during charging and discharging cycles. If the cell’s or battery pack’s
characteristic levels exceed or fall below the limitation region, the central and micro
controller should send an order to the power controller (a relay could be used as power
control) to cut-off the Li-ion battery pack from the circuit directly [17, 19], to avoid
damaging the Li-ion battery pack and to increase the safety and quality of the battery
pack.
When cut-off occurs for some reasons stated above, the engine should start directly
again and the alternator supply the energy to the system.
25
2.6 The final scope of the thesis
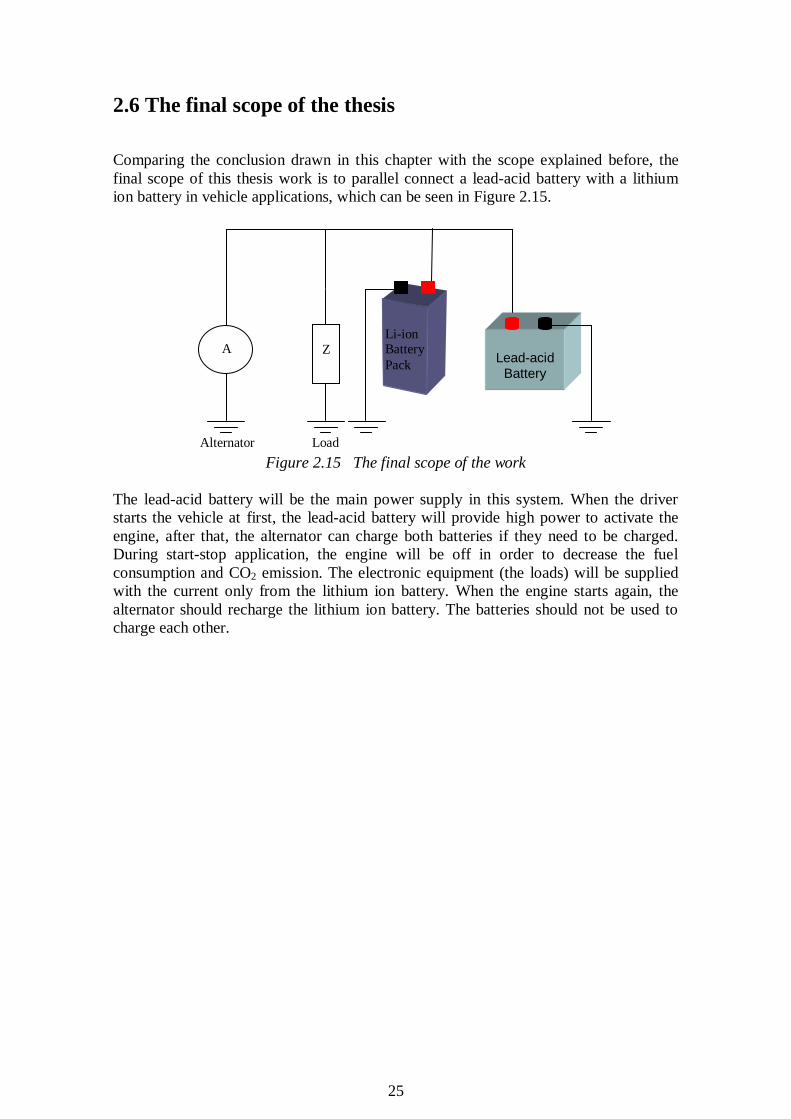
Comparing the conclusion drawn in this chapter with the scope explained before, the
final scope of this thesis work is to parallel connect a lead-acid battery with a lithium
ion battery in vehicle applications, which can be seen in Figure 2.15.
Figure 2.15 The final scope of the work
The lead-acid battery will be the main power supply in this system. When the driver
starts the vehicle at first, the lead-acid battery will provide high power to activate the
engine, after that, the alternator can charge both batteries if they need to be charged.
During start-stop application, the engine will be off in order to decrease the fuel
consumption and CO2 emission. The electronic equipment (the loads) will be supplied
with the current only from the lithium ion battery. When the engine starts again, the
alternator should recharge the lithium ion battery. The batteries should not be used to
charge each other.
Lead-acid
Battery
Li-ion Battery
Pack
Z A
Alternator Load
26
3. Charge algorithms
3.1 Charge methods for the Li-ion battery
Charging and discharging Li-ion batteries demand observing some precautions if the
CC-CV method is used, this is more important when multiple cells are involved. In this
section different types of Li-ion battery charging methods will be presented. The
charging of Li-ion batteries is more complicated compared to that of other batteries like
NiMH and Ni-Cd batteries. The normal method which is used for charging Li-ion cell is
the Constant Current – Constant Voltage (CC-CV) method. This charging strategy is of
low cost compared with other charging methods, because less electronic components are
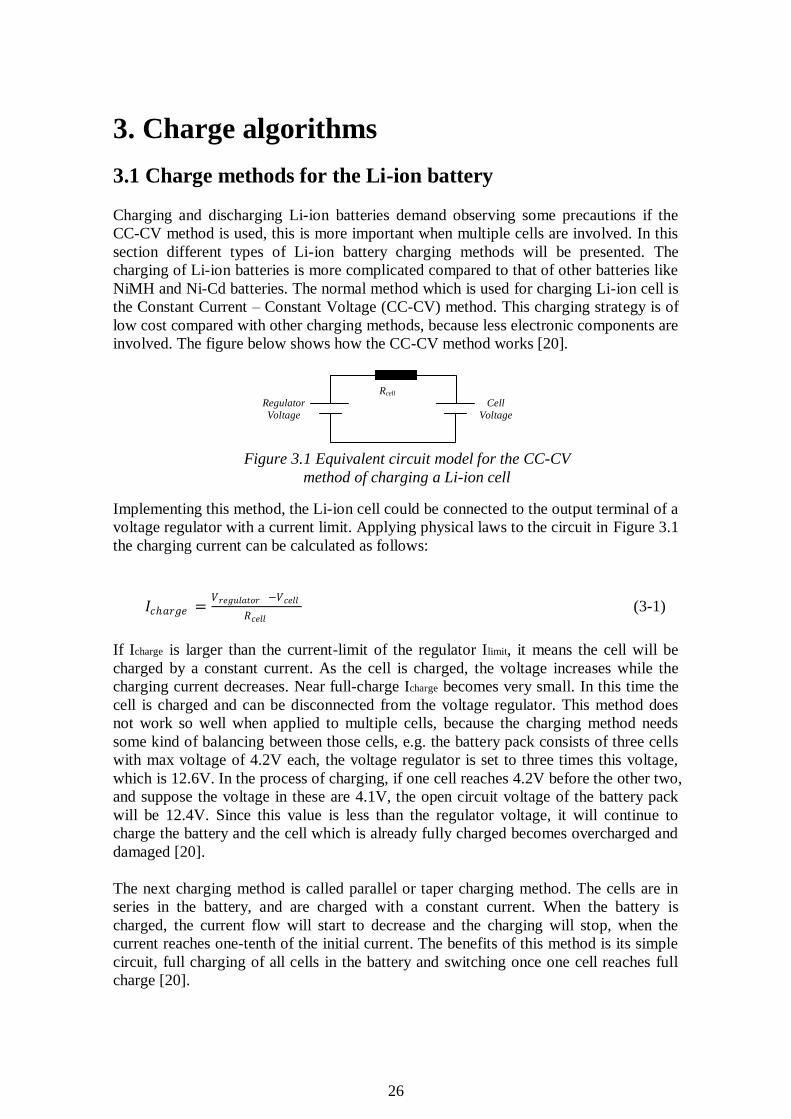
involved. The figure below shows how the CC-CV method works [20].
Implementing this method, the Li-ion cell could be connected to the output terminal of a
voltage regulator with a current limit. Applying physical laws to the circuit in Figure 3.1
the charging current can be calculated as follows:
𝐼𝑐𝑎𝑟𝑔𝑒 =𝑉𝑟𝑒𝑔𝑢𝑙𝑎𝑡𝑜𝑟 −𝑉𝑐𝑒𝑙𝑙
𝑅𝑐𝑒𝑙𝑙 (3-1)
If Icharge is larger than the current-limit of the regulator Ilimit, it means the cell will be
charged by a constant current. As the cell is charged, the voltage increases while the
charging current decreases. Near full-charge Icharge becomes very small. In this time the
cell is charged and can be disconnected from the voltage regulator. This method does
not work so well when applied to multiple cells, because the charging method needs
some kind of balancing between those cells, e.g. the battery pack consists of three cells
with max voltage of 4.2V each, the voltage regulator is set to three times this voltage,
which is 12.6V. In the process of charging, if one cell reaches 4.2V before the other two,
and suppose the voltage in these are 4.1V, the open circuit voltage of the battery pack
will be 12.4V. Since this value is less than the regulator voltage, it will continue to
charge the battery and the cell which is already fully charged becomes overcharged and
damaged [20].
The next charging method is called parallel or taper charging method. The cells are in
series in the battery, and are charged with a constant current. When the battery is
charged, the current flow will start to decrease and the charging will stop, when the
current reaches one-tenth of the initial current. The benefits of this method is its simple
circuit, full charging of all cells in the battery and switching once one cell reaches full
charge [20].
Figure 3.1 Equivalent circuit model for the CC-CV
method of charging a Li-ion cell
Rcell
Regulator
Voltage
Cell
Voltage
27
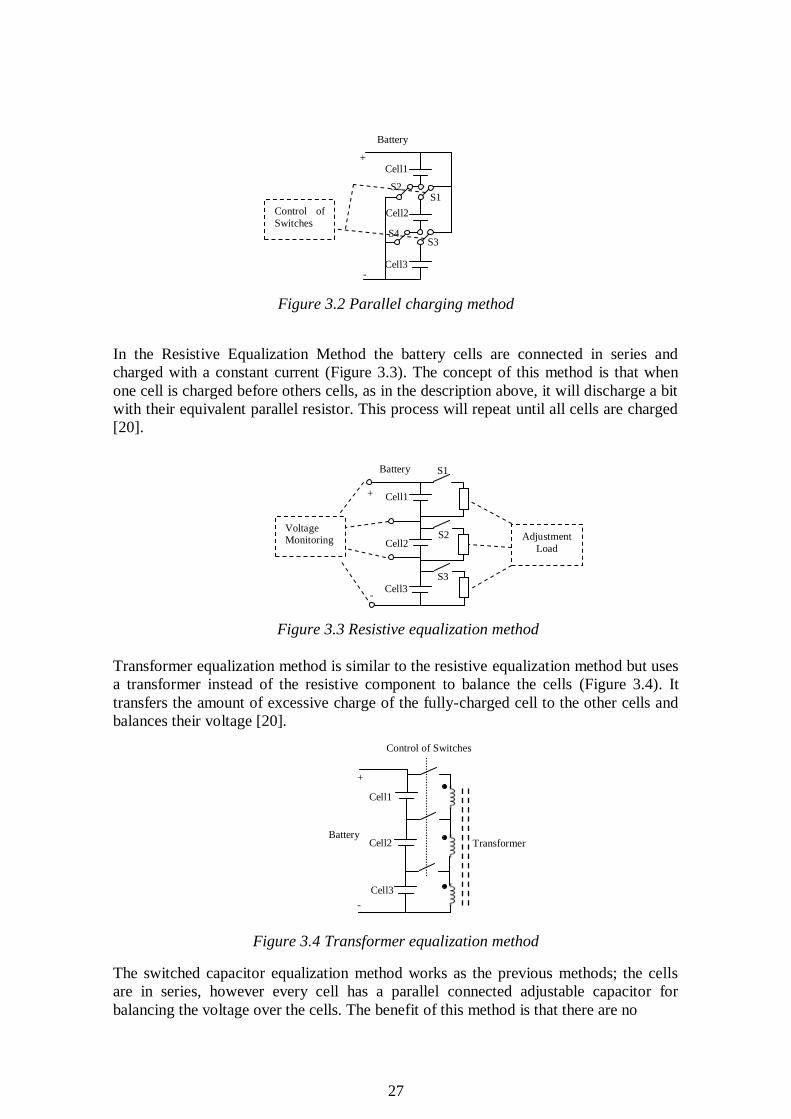
Figure 3.2 Parallel charging method
In the Resistive Equalization Method the battery cells are connected in series and
charged with a constant current (Figure 3.3). The concept of this method is that when
one cell is charged before others cells, as in the description above, it will discharge a bit
with their equivalent parallel resistor. This process will repeat until all cells are charged
[20].
Figure 3.3 Resistive equalization method
Transformer equalization method is similar to the resistive equalization method but uses
a transformer instead of the resistive component to balance the cells (Figure 3.4). It
transfers the amount of excessive charge of the fully-charged cell to the other cells and
balances their voltage [20].
Figure 3.4 Transformer equalization method
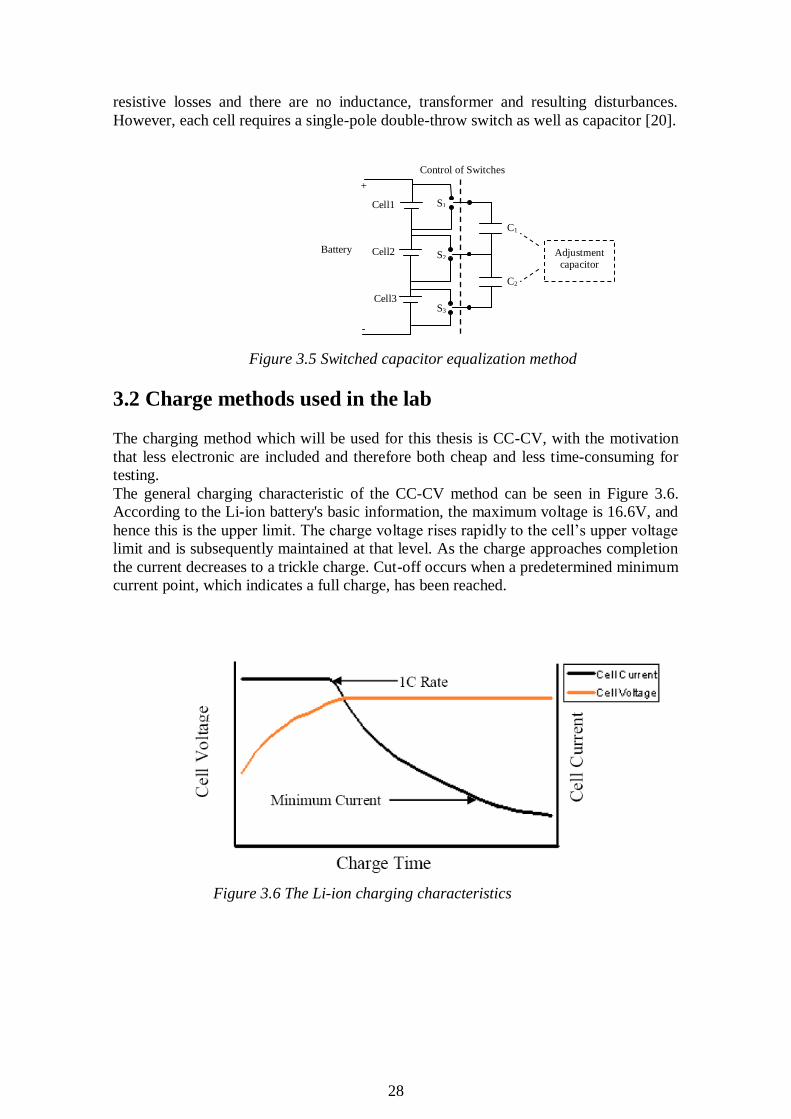
The switched capacitor equalization method works as the previous methods; the cells
are in series, however every cell has a parallel connected adjustable capacitor for
balancing the voltage over the cells. The benefit of this method is that there are no
Battery
+
-
Cell1
Cell2
Cell3
S1 S2
S3 S4
Control of
Switches
Cell1
Cell2
Cell3
S1
S2
S3
Voltage Monitoring Adjustment
Load
Cell1
Cell2
Cell3
Control of Switches
Transformer
Battery
+
-
Battery
-
+
28
resistive losses and there are no inductance, transformer and resulting disturbances.
However, each cell requires a single-pole double-throw switch as well as capacitor [20].
Figure 3.5 Switched capacitor equalization method
3.2 Charge methods used in the lab
The charging method which will be used for this thesis is CC-CV, with the motivation
that less electronic are included and therefore both cheap and less time-consuming for
testing.
The general charging characteristic of the CC-CV method can be seen in Figure 3.6.
According to the Li-ion battery's basic information, the maximum voltage is 16.6V, and
hence this is the upper limit. The charge voltage rises rapidly to the cell’s upper voltage
limit and is subsequently maintained at that level. As the charge approaches completion
the current decreases to a trickle charge. Cut-off occurs when a predetermined minimum
current point, which indicates a full charge, has been reached.
Figure 3.6 The Li-ion charging characteristics
Battery
+
-
Cell1
Cell2
Cell3
Control of Switches
C1
C2
S1
S2
S3
Adjustment capacitor
29
4 Tests
In section 4.1 and 4.2 the experimental tests performed at the lab bench are explained to
get more familiar with the system, prior to be implemented in the vehicle.
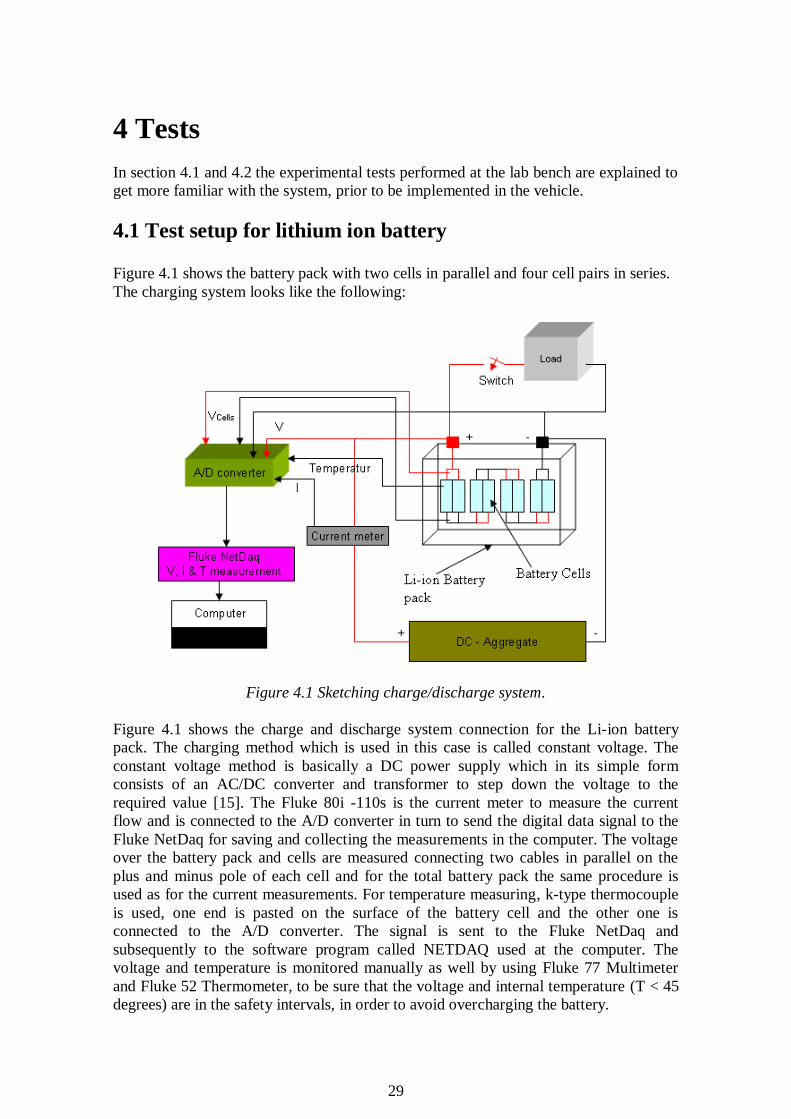
4.1 Test setup for lithium ion battery Figure 4.1 shows the battery pack with two cells in parallel and four cell pairs in series.
The charging system looks like the following:
Figure 4.1 Sketching charge/discharge system.
Figure 4.1 shows the charge and discharge system connection for the Li-ion battery
pack. The charging method which is used in this case is called constant voltage. The
constant voltage method is basically a DC power supply which in its simple form
consists of an AC/DC converter and transformer to step down the voltage to the
required value [15]. The Fluke 80i -110s is the current meter to measure the current
flow and is connected to the A/D converter in turn to send the digital data signal to the
Fluke NetDaq for saving and collecting the measurements in the computer. The voltage
over the battery pack and cells are measured connecting two cables in parallel on the
plus and minus pole of each cell and for the total battery pack the same procedure is
used as for the current measurements. For temperature measuring, k-type thermocouple
is used, one end is pasted on the surface of the battery cell and the other one is
connected to the A/D converter. The signal is sent to the Fluke NetDaq and
subsequently to the software program called NETDAQ used at the computer. The
voltage and temperature is monitored manually as well by using Fluke 77 Multimeter
and Fluke 52 Thermometer, to be sure that the voltage and internal temperature (T < 45
degrees) are in the safety intervals, in order to avoid overcharging the battery.
30
To discharge the battery pack, a variable load is used, which can control the output
current from the battery pack. The maximum charge and discharge current for the
battery; during the lab 50A is assumed for user-safety reason.
4.1.1 Charge and discharge tests
The following steps explain the stages of the battery tests.
1. When the battery pack reaches its fully charged level, the voltmeter is used to
measure every battery respectively and yield every battery's voltage. This step will be
done every time when charging or discharging the battery system in order to monitor
self-balancing, which will beneficial in avoiding damage to the system.
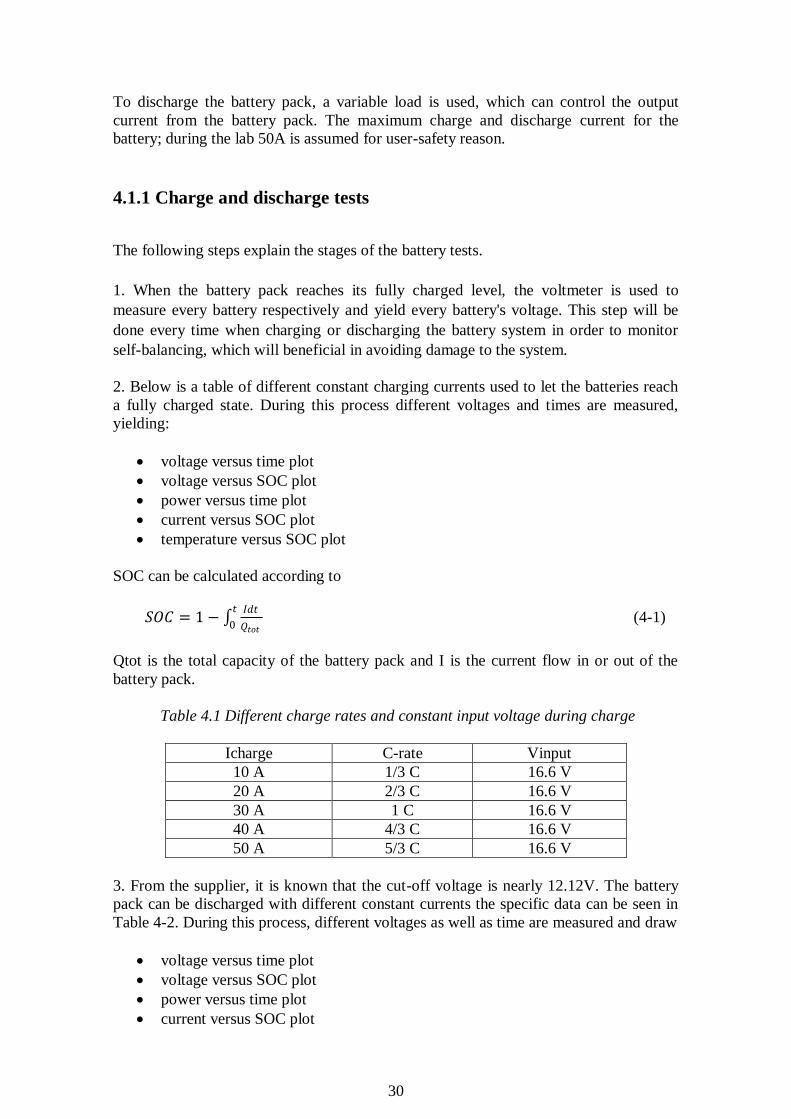
2. Below is a table of different constant charging currents used to let the batteries reach
a fully charged state. During this process different voltages and times are measured,
yielding:
voltage versus time plot
voltage versus SOC plot
power versus time plot
current versus SOC plot
temperature versus SOC plot
SOC can be calculated according to
𝑆𝑂𝐶 = 1 − 𝐼𝑑𝑡
𝑄𝑡𝑜𝑡
𝑡
0 (4-1)
Qtot is the total capacity of the battery pack and I is the current flow in or out of the
battery pack.
Table 4.1 Different charge rates and constant input voltage during charge
Icharge C-rate Vinput
10 A 1/3 C 16.6 V
20 A 2/3 C 16.6 V
30 A 1 C 16.6 V
40 A 4/3 C 16.6 V
50 A 5/3 C 16.6 V
3. From the supplier, it is known that the cut-off voltage is nearly 12.12V. The battery
pack can be discharged with different constant currents the specific data can be seen in
Table 4-2. During this process, different voltages as well as time are measured and draw
voltage versus time plot
voltage versus SOC plot
power versus time plot
current versus SOC plot
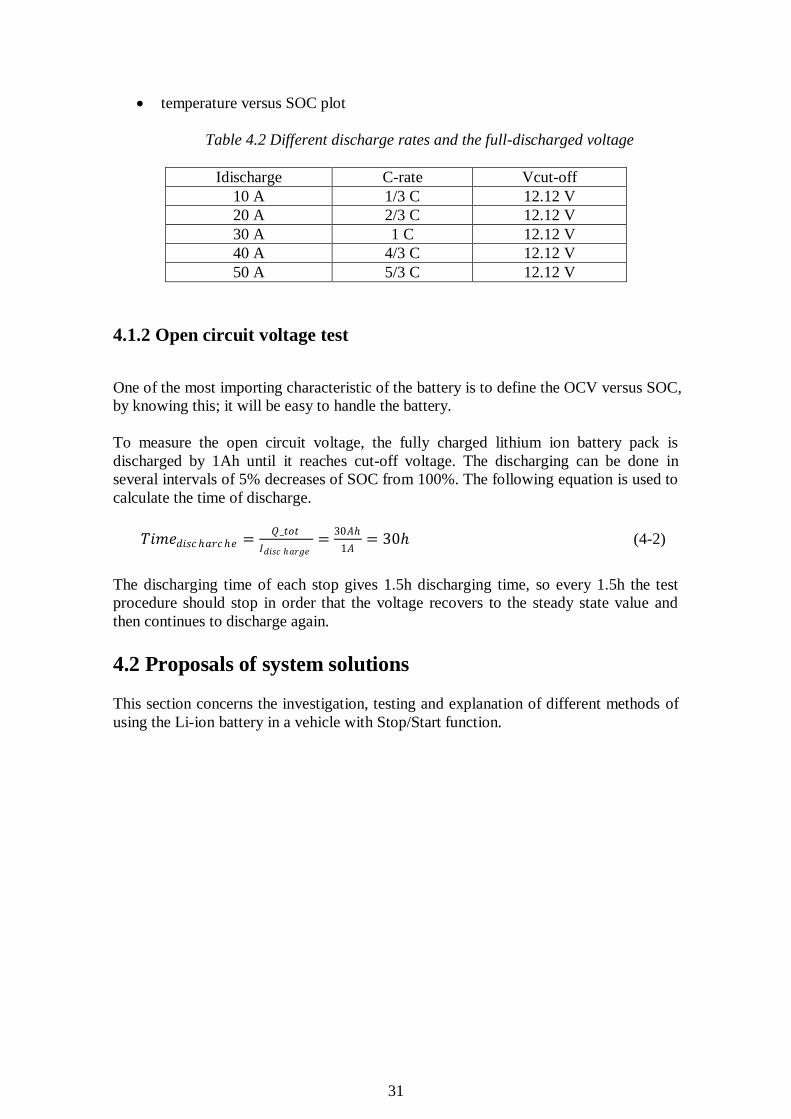
31
temperature versus SOC plot
Table 4.2 Different discharge rates and the full-discharged voltage
Idischarge C-rate Vcut-off
10 A 1/3 C 12.12 V
20 A 2/3 C 12.12 V
30 A 1 C 12.12 V
40 A 4/3 C 12.12 V
50 A 5/3 C 12.12 V
4.1.2 Open circuit voltage test
One of the most importing characteristic of the battery is to define the OCV versus SOC,
by knowing this; it will be easy to handle the battery.
To measure the open circuit voltage, the fully charged lithium ion battery pack is
discharged by 1Ah until it reaches cut-off voltage. The discharging can be done in
several intervals of 5% decreases of SOC from 100%. The following equation is used to
calculate the time of discharge.
𝑇𝑖𝑚𝑒𝑑𝑖𝑠𝑐 𝑎𝑟𝑐 𝑒 =𝑄_𝑡𝑜𝑡
𝐼𝑑𝑖𝑠𝑐 𝑎𝑟𝑔𝑒=
30𝐴
1𝐴= 30 (4-2)
The discharging time of each stop gives 1.5h discharging time, so every 1.5h the test
procedure should stop in order that the voltage recovers to the steady state value and
then continues to discharge again.
4.2 Proposals of system solutions
This section concerns the investigation, testing and explanation of different methods of
using the Li-ion battery in a vehicle with Stop/Start function.
32
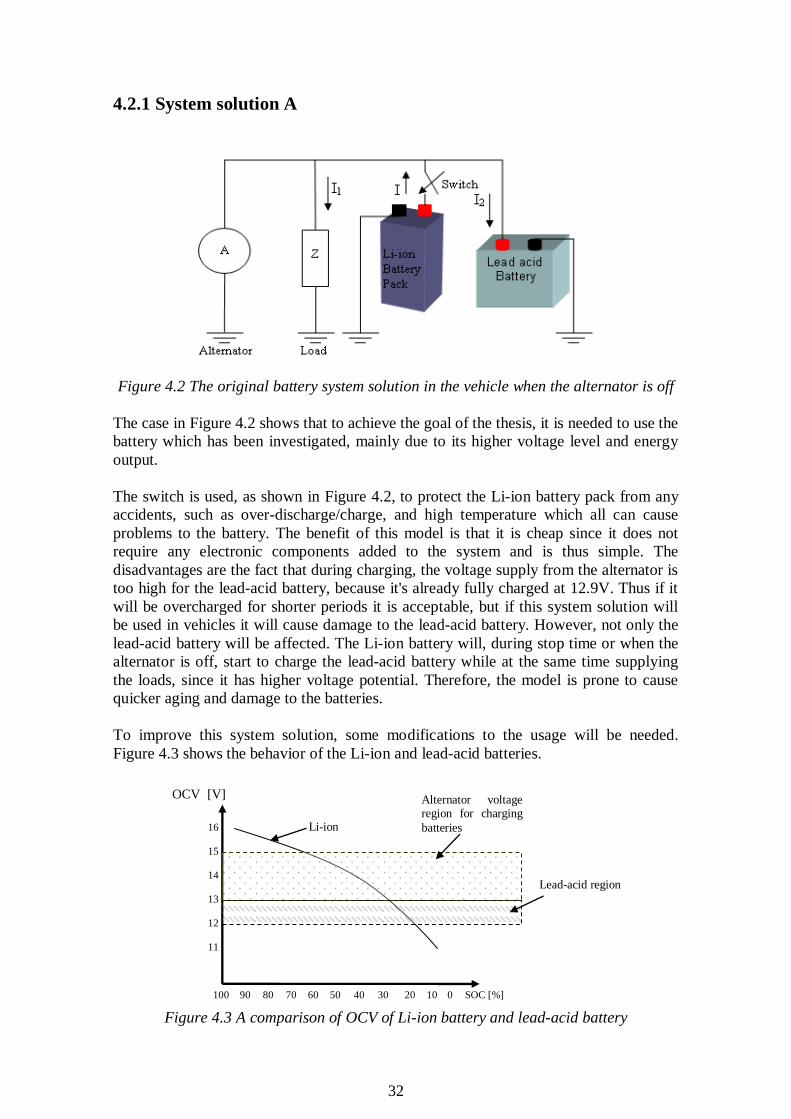
4.2.1 System solution A
Figure 4.2 The original battery system solution in the vehicle when the alternator is off
The case in Figure 4.2 shows that to achieve the goal of the thesis, it is needed to use the
battery which has been investigated, mainly due to its higher voltage level and energy
output.
The switch is used, as shown in Figure 4.2, to protect the Li-ion battery pack from any
accidents, such as over-discharge/charge, and high temperature which all can cause
problems to the battery. The benefit of this model is that it is cheap since it does not
require any electronic components added to the system and is thus simple. The
disadvantages are the fact that during charging, the voltage supply from the alternator is
too high for the lead-acid battery, because it's already fully charged at 12.9V. Thus if it
will be overcharged for shorter periods it is acceptable, but if this system solution will
be used in vehicles it will cause damage to the lead-acid battery. However, not only the
lead-acid battery will be affected. The Li-ion battery will, during stop time or when the
alternator is off, start to charge the lead-acid battery while at the same time supplying
the loads, since it has higher voltage potential. Therefore, the model is prone to cause
quicker aging and damage to the batteries.
To improve this system solution, some modifications to the usage will be needed.
Figure 4.3 shows the behavior of the Li-ion and lead-acid batteries.
Figure 4.3 A comparison of OCV of Li-ion battery and lead-acid battery
16
15
14
13
12
11
Li-ion
OCV [V]
Lead-acid region
Alternator voltage region for charging
batteries
100 90 80 70 60 50 40 30 20 10 SOC [%] 0
33
The OCV versus SOC for Li-ion and Lead-acid batteries are compared in general above.
When the working region is between 70%-55% SOC, the Li-ion battery pack will
charge the lead-acid battery as well as support the loads, since the voltage of the Li-ion
batteries is higher in that area than that of the lead-acid batteries. One solution is,
although complicated, that if the internal resistance of the lead-acid battery is increased,
less current will flow through it and it does not matter if the voltage is high. Therefore,
it could be assumed that the Li-ion battery only supplies the loads during stop time.
Another method would be to move the working region from 15.2V to 13V of the Li-ion
battery. However, it does not give any benefits because it is a region that causes a
decrease in the life time of the battery pack. As shown in Figure 5.10, it is not good to
process the Li-ion battery in that region due to the slope being very steep down. It leads
to fast discharge and decrease in the life time. Other different system solutions to deal
with this problem will be presented below.
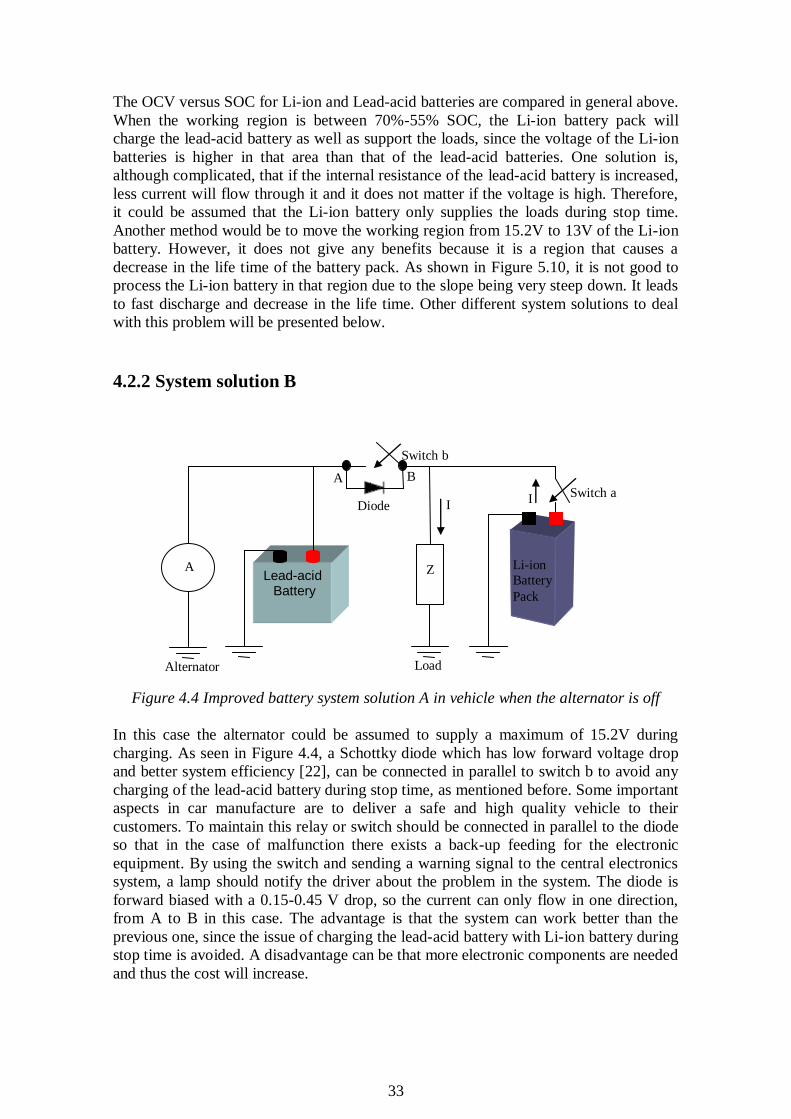
4.2.2 System solution B
Figure 4.4 Improved battery system solution A in vehicle when the alternator is off
In this case the alternator could be assumed to supply a maximum of 15.2V during
charging. As seen in Figure 4.4, a Schottky diode which has low forward voltage drop
and better system efficiency [22], can be connected in parallel to switch b to avoid any
charging of the lead-acid battery during stop time, as mentioned before. Some important
aspects in car manufacture are to deliver a safe and high quality vehicle to their
customers. To maintain this relay or switch should be connected in parallel to the diode
so that in the case of malfunction there exists a back-up feeding for the electronic
equipment. By using the switch and sending a warning signal to the central electronics
system, a lamp should notify the driver about the problem in the system. The diode is
forward biased with a 0.15-0.45 V drop, so the current can only flow in one direction,
from A to B in this case. The advantage is that the system can work better than the
previous one, since the issue of charging the lead-acid battery with Li-ion battery during
stop time is avoided. A disadvantage can be that more electronic components are needed
and thus the cost will increase.
Lead-acid Battery
Li-ion
Battery
Pack
A Z
Load Alternator
Switch a Diode
I I
A B
Switch b
34
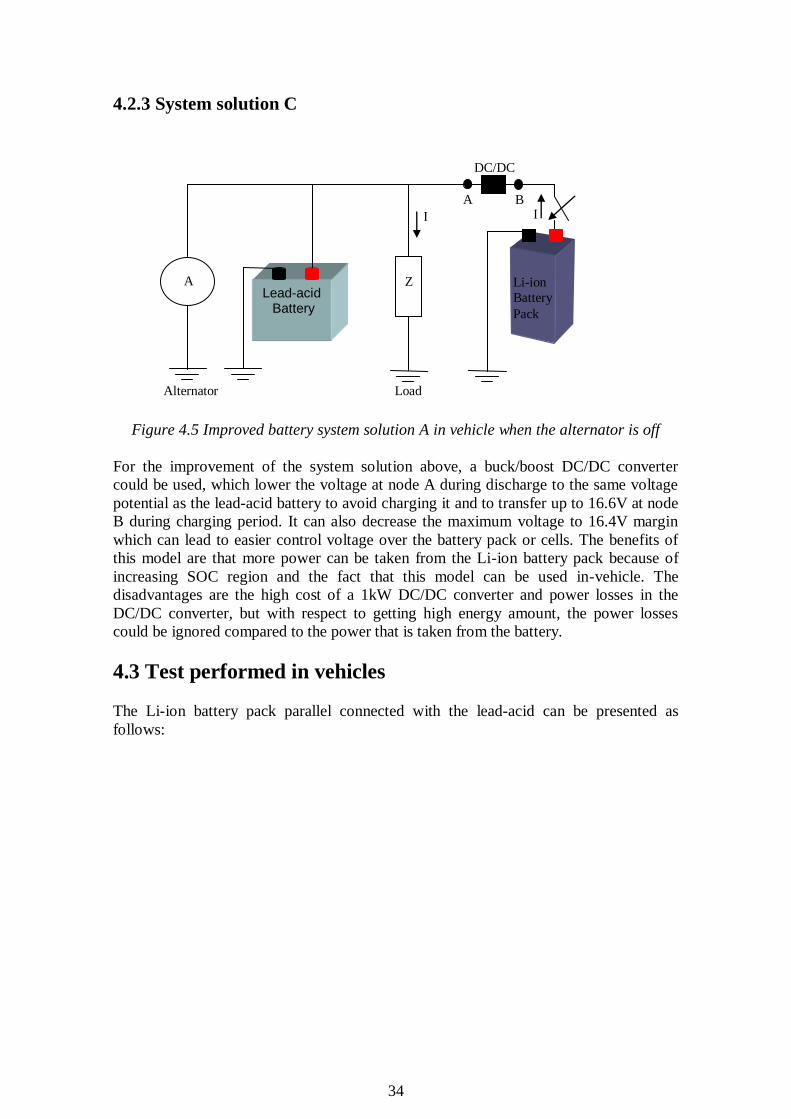
4.2.3 System solution C
Figure 4.5 Improved battery system solution A in vehicle when the alternator is off
For the improvement of the system solution above, a buck/boost DC/DC converter
could be used, which lower the voltage at node A during discharge to the same voltage
potential as the lead-acid battery to avoid charging it and to transfer up to 16.6V at node
B during charging period. It can also decrease the maximum voltage to 16.4V margin
which can lead to easier control voltage over the battery pack or cells. The benefits of
this model are that more power can be taken from the Li-ion battery pack because of
increasing SOC region and the fact that this model can be used in-vehicle. The
disadvantages are the high cost of a 1kW DC/DC converter and power losses in the
DC/DC converter, but with respect to getting high energy amount, the power losses
could be ignored compared to the power that is taken from the battery.
4.3 Test performed in vehicles
The Li-ion battery pack parallel connected with the lead-acid can be presented as
follows:
Lead-acid Battery
Li-ion
Battery
Pack
Z A
I I
A B
DC/DC
Load Alternator
35
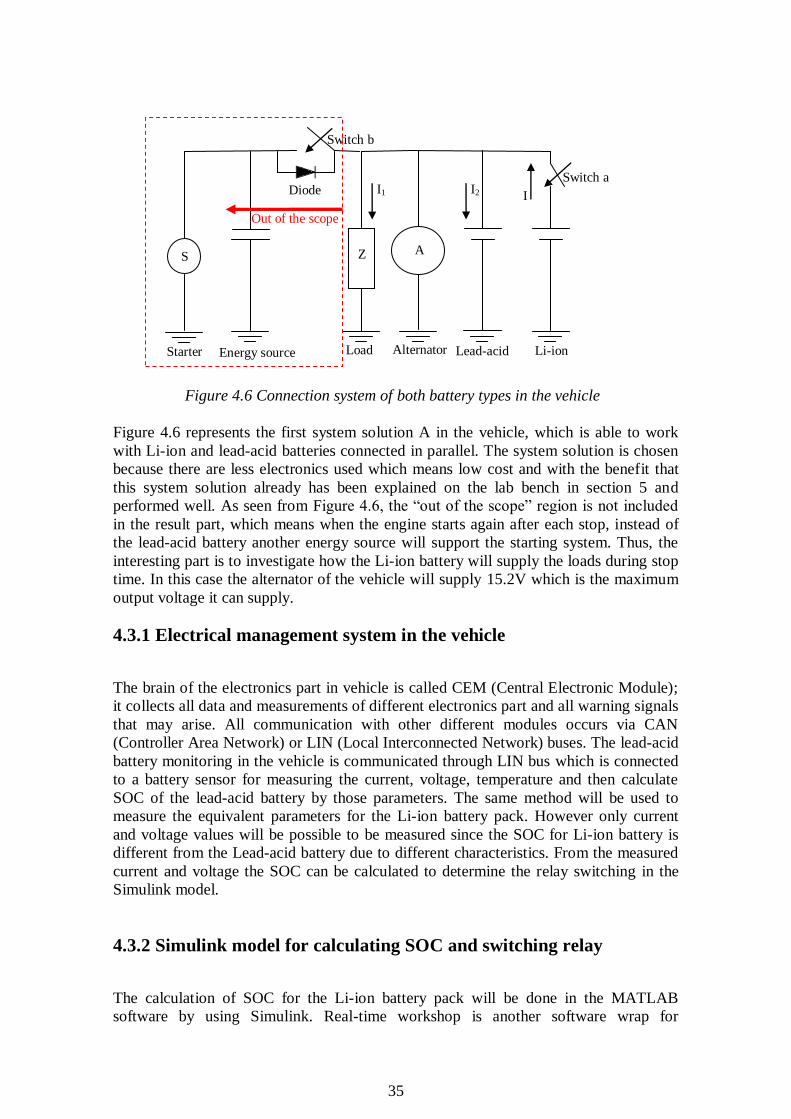
Figure 4.6 Connection system of both battery types in the vehicle
Figure 4.6 represents the first system solution A in the vehicle, which is able to work
with Li-ion and lead-acid batteries connected in parallel. The system solution is chosen
because there are less electronics used which means low cost and with the benefit that
this system solution already has been explained on the lab bench in section 5 and
performed well. As seen from Figure 4.6, the “out of the scope” region is not included
in the result part, which means when the engine starts again after each stop, instead of
the lead-acid battery another energy source will support the starting system. Thus, the
interesting part is to investigate how the Li-ion battery will supply the loads during stop
time. In this case the alternator of the vehicle will supply 15.2V which is the maximum
output voltage it can supply.
4.3.1 Electrical management system in the vehicle
The brain of the electronics part in vehicle is called CEM (Central Electronic Module);
it collects all data and measurements of different electronics part and all warning signals
that may arise. All communication with other different modules occurs via CAN
(Controller Area Network) or LIN (Local Interconnected Network) buses. The lead-acid
battery monitoring in the vehicle is communicated through LIN bus which is connected
to a battery sensor for measuring the current, voltage, temperature and then calculate
SOC of the lead-acid battery by those parameters. The same method will be used to
measure the equivalent parameters for the Li-ion battery pack. However only current
and voltage values will be possible to be measured since the SOC for Li-ion battery is
different from the Lead-acid battery due to different characteristics. From the measured
current and voltage the SOC can be calculated to determine the relay switching in the
Simulink model.
4.3.2 Simulink model for calculating SOC and switching relay
The calculation of SOC for the Li-ion battery pack will be done in the MATLAB
software by using Simulink. Real-time workshop is another software wrap for
S Z
Load Alternator
Switch a
Switch b
Diode I I1 I2
Lead-acid Li-ion Energy source
Out of the scope
A
Starter
36
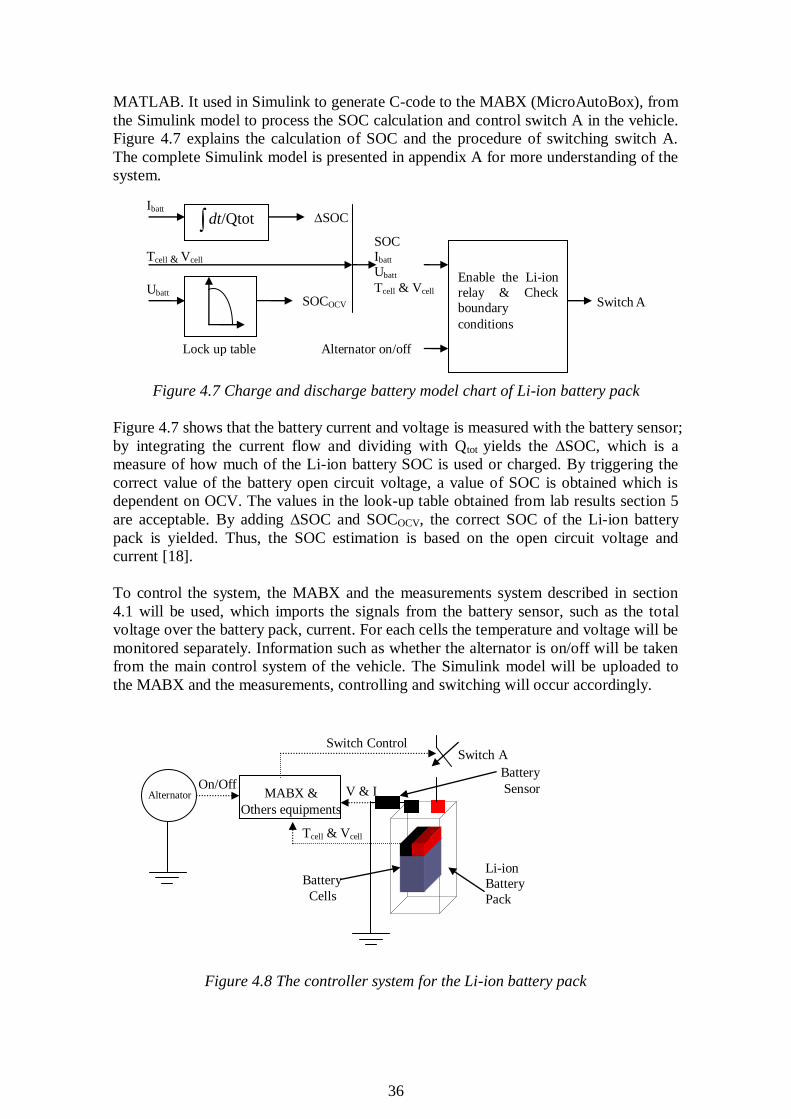
MATLAB. It used in Simulink to generate C-code to the MABX (MicroAutoBox), from
the Simulink model to process the SOC calculation and control switch A in the vehicle.
Figure 4.7 explains the calculation of SOC and the procedure of switching switch A.
The complete Simulink model is presented in appendix A for more understanding of the
system.
Figure 4.7 Charge and discharge battery model chart of Li-ion battery pack
Figure 4.7 shows that the battery current and voltage is measured with the battery sensor;
by integrating the current flow and dividing with Qtot yields the ∆SOC, which is a
measure of how much of the Li-ion battery SOC is used or charged. By triggering the
correct value of the battery open circuit voltage, a value of SOC is obtained which is
dependent on OCV. The values in the look-up table obtained from lab results section 5
are acceptable. By adding ∆SOC and SOCOCV, the correct SOC of the Li-ion battery
pack is yielded. Thus, the SOC estimation is based on the open circuit voltage and
current [18].
To control the system, the MABX and the measurements system described in section
4.1 will be used, which imports the signals from the battery sensor, such as the total
voltage over the battery pack, current. For each cells the temperature and voltage will be
monitored separately. Information such as whether the alternator is on/off will be taken
from the main control system of the vehicle. The Simulink model will be uploaded to
the MABX and the measurements, controlling and switching will occur accordingly.
Figure 4.8 The controller system for the Li-ion battery pack
MABX &
Others equipments
Li-ion
Battery
Pack
Switch A
V & I
Switch Control
Battery
Sensor On/Off
Tcell & Vcell
Battery
Cells
Alternator
Ibatt
/Qtotdt ∆SOC
Ubatt
Lock up table
SOCOCV
SOC Ibatt
Ubatt
Tcell & Vcell
Alternator on/off
Enable the Li-ion
relay & Check
boundary
conditions
Switch A
Tcell & Vcell
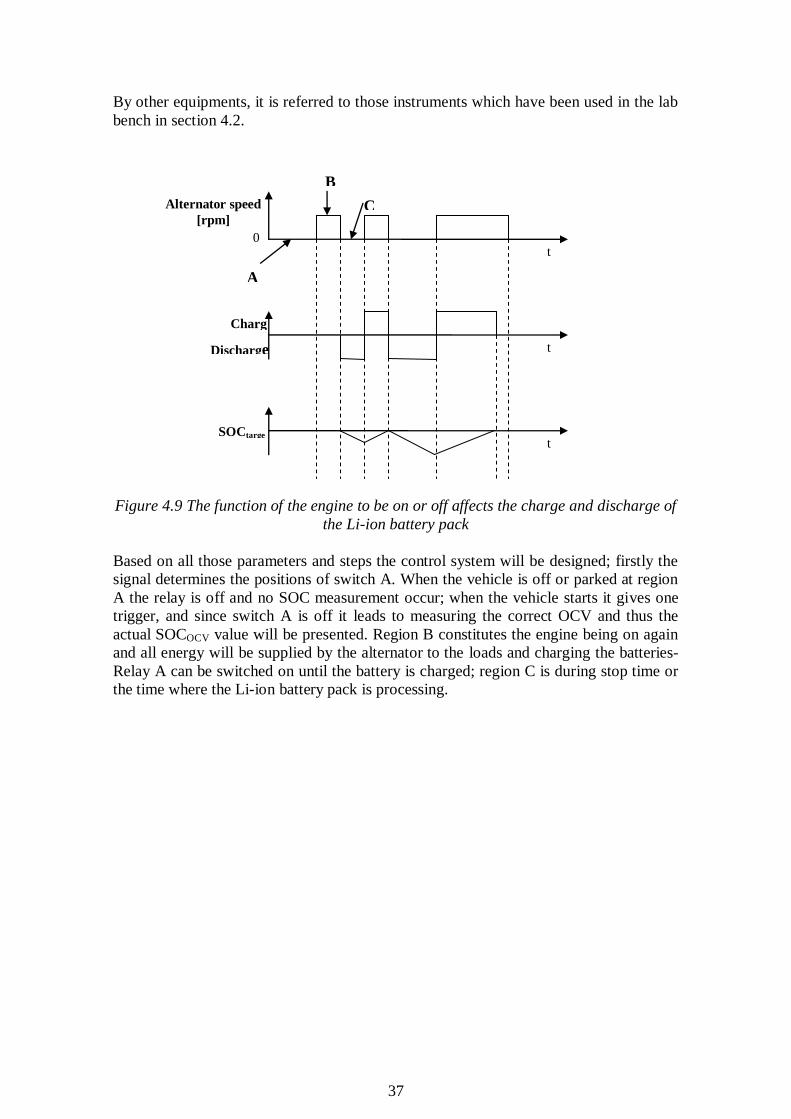
37
By other equipments, it is referred to those instruments which have been used in the lab
bench in section 4.2.
Figure 4.9 The function of the engine to be on or off affects the charge and discharge of
the Li-ion battery pack
Based on all those parameters and steps the control system will be designed; firstly the
signal determines the positions of switch A. When the vehicle is off or parked at region
A the relay is off and no SOC measurement occur; when the vehicle starts it gives one
trigger, and since switch A is off it leads to measuring the correct OCV and thus the
actual SOCOCV value will be presented. Region B constitutes the engine being on again
and all energy will be supplied by the alternator to the loads and charging the batteries-
Relay A can be switched on until the battery is charged; region C is during stop time or
the time where the Li-ion battery pack is processing.
Charg
e Discharge
SOCtarge
t
A
B
C
t
t
t
Alternator speed
[rpm]
0
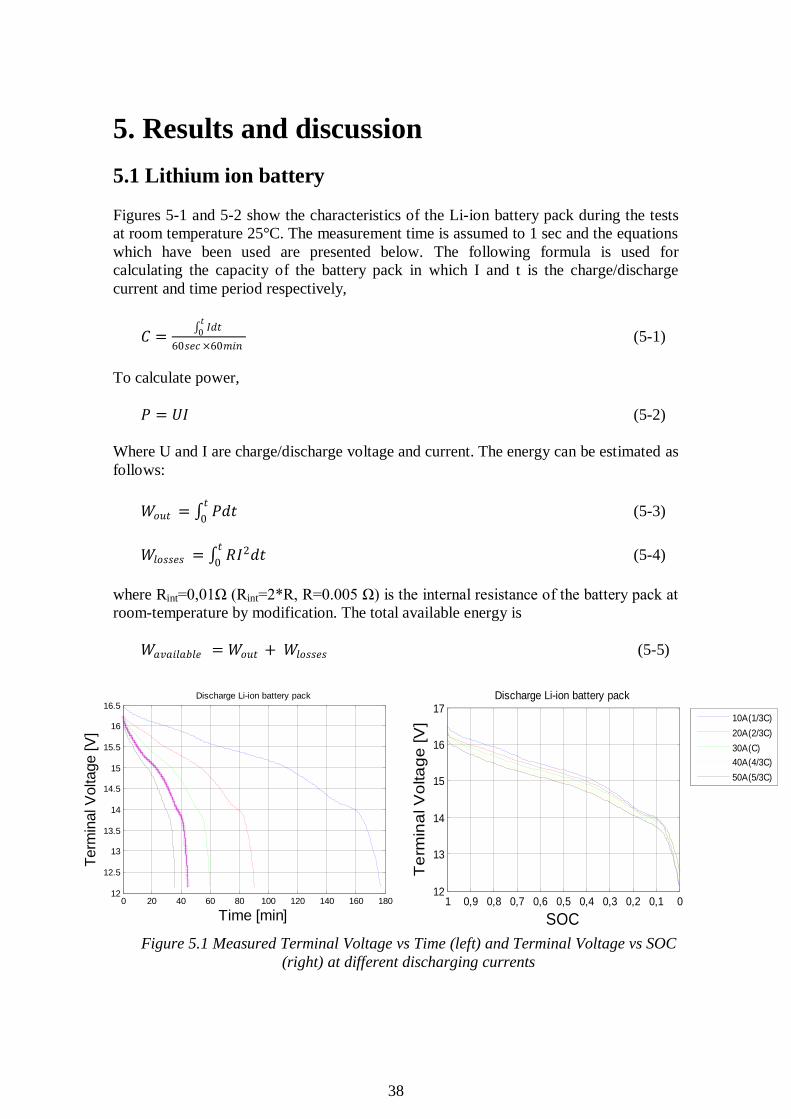
38
5. Results and discussion
5.1 Lithium ion battery
Figures 5-1 and 5-2 show the characteristics of the Li-ion battery pack during the tests
at room temperature 25°C. The measurement time is assumed to 1 sec and the equations
which have been used are presented below. The following formula is used for
calculating the capacity of the battery pack in which I and t is the charge/discharge
current and time period respectively,
𝐶 = 𝐼𝑑𝑡𝑡
0
60𝑠𝑒𝑐×60𝑚𝑖𝑛 (5-1)
To calculate power,
𝑃 = 𝑈𝐼 (5-2)
Where U and I are charge/discharge voltage and current. The energy can be estimated as
follows:
𝑊𝑜𝑢𝑡 = 𝑃𝑑𝑡𝑡
0 (5-3)
𝑊𝑙𝑜𝑠𝑠𝑒𝑠 = 𝑅𝐼2𝑑𝑡𝑡
0 (5-4)
where Rint=0,01Ω (Rint=2*R, R=0.005 Ω) is the internal resistance of the battery pack at
room-temperature by modification. The total available energy is
𝑊𝑎𝑣𝑎𝑖𝑙𝑎𝑏𝑙𝑒 = 𝑊𝑜𝑢𝑡 + 𝑊𝑙𝑜𝑠𝑠𝑒𝑠 (5-5)
Figure 5.1 Measured Terminal Voltage vs Time (left) and Terminal Voltage vs SOC
(right) at different discharging currents
0 20 40 60 80 100 120 140 160 18012
12.5
13
13.5
14
14.5
15
15.5
16
16.5
Time [min]
Term
inal V
oltage [V
]
Discharge Li-ion battery pack
1 0,9 0,8 0,7 0,6 0,5 0,4 0,3 0,2 0,1 012
13
14
15
16
17
SOC
Te
rmin
al V
olta
ge
[V
]
Discharge Li-ion battery pack
10A(1/3C)
20A(2/3C)
30A(C)
40A(4/3C)
50A(5/3C)
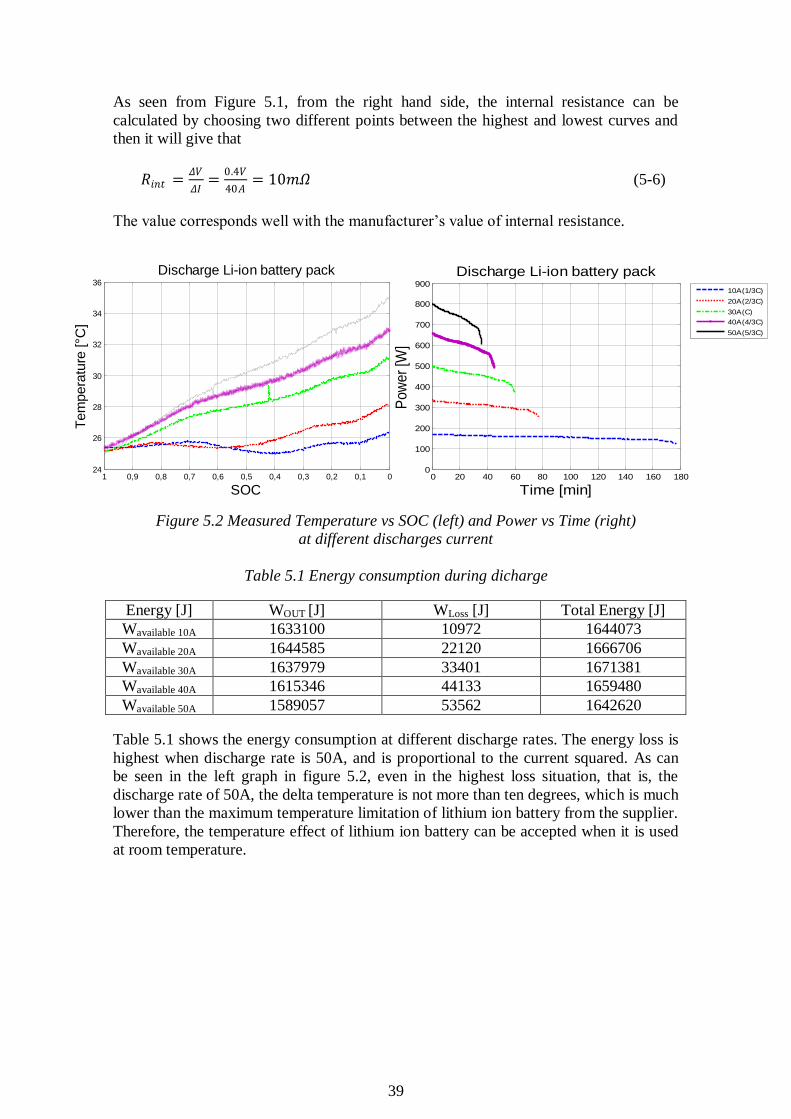
39
As seen from Figure 5.1, from the right hand side, the internal resistance can be
calculated by choosing two different points between the highest and lowest curves and
then it will give that
𝑅𝑖𝑛𝑡 =𝛥𝑉
𝛥𝐼=
0.4𝑉
40𝐴= 10𝑚𝛺 (5-6)
The value corresponds well with the manufacturer’s value of internal resistance.
Figure 5.2 Measured Temperature vs SOC (left) and Power vs Time (right)
at different discharges current
Table 5.1 Energy consumption during dicharge
Energy [J] WOUT [J] WLoss [J] Total Energy [J]
Wavailable 10A 1633100 10972 1644073
Wavailable 20A 1644585 22120 1666706
Wavailable 30A 1637979 33401 1671381
Wavailable 40A 1615346 44133 1659480
Wavailable 50A 1589057 53562 1642620
Table 5.1 shows the energy consumption at different discharge rates. The energy loss is
highest when discharge rate is 50A, and is proportional to the current squared. As can
be seen in the left graph in figure 5.2, even in the highest loss situation, that is, the
discharge rate of 50A, the delta temperature is not more than ten degrees, which is much
lower than the maximum temperature limitation of lithium ion battery from the supplier.
Therefore, the temperature effect of lithium ion battery can be accepted when it is used
at room temperature.
1 0,9 0,8 0,7 0,6 0,5 0,4 0,3 0,2 0,1 024
26
28
30
32
34
36
SOC
Tem
pera
ture
[°C
]
Discharge Li-ion battery pack
0 20 40 60 80 100 120 140 160 1800
100
200
300
400
500
600
700
800
900
Time [min]
Pow
er
[W]
Discharge Li-ion battery pack
10A(1/3C)
20A(2/3C)
30A(C)
40A(4/3C)
50A(5/3C)
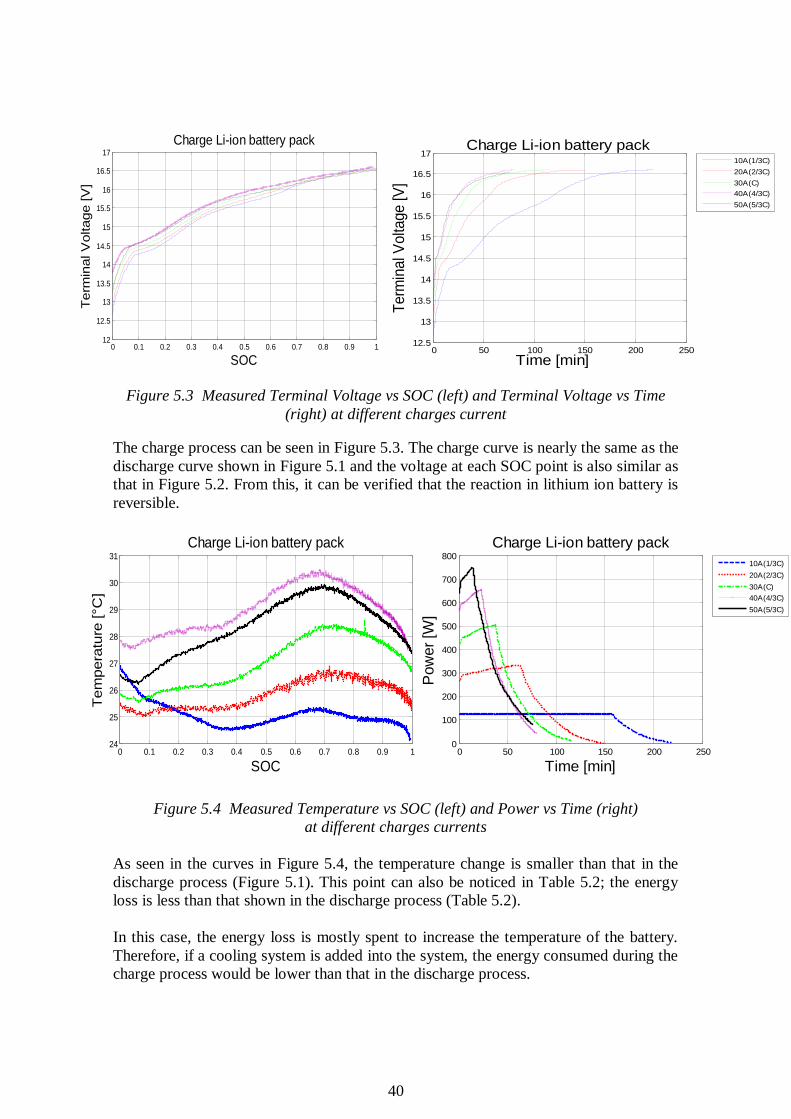
40
Figure 5.3 Measured Terminal Voltage vs SOC (left) and Terminal Voltage vs Time
(right) at different charges current
The charge process can be seen in Figure 5.3. The charge curve is nearly the same as the
discharge curve shown in Figure 5.1 and the voltage at each SOC point is also similar as
that in Figure 5.2. From this, it can be verified that the reaction in lithium ion battery is
reversible.
Figure 5.4 Measured Temperature vs SOC (left) and Power vs Time (right)
at different charges currents
As seen in the curves in Figure 5.4, the temperature change is smaller than that in the
discharge process (Figure 5.1). This point can also be noticed in Table 5.2; the energy
loss is less than that shown in the discharge process (Table 5.2).
In this case, the energy loss is mostly spent to increase the temperature of the battery.
Therefore, if a cooling system is added into the system, the energy consumed during the
charge process would be lower than that in the discharge process.
0 0.1 0.2 0.3 0.4 0.5 0.6 0.7 0.8 0.9 112
12.5
13
13.5
14
14.5
15
15.5
16
16.5
17
SOC
Term
inal V
oltage [V
]
Charge Li-ion battery pack
0 50 100 150 200 25012.5
13
13.5
14
14.5
15
15.5
16
16.5
17
Time [min]
Term
inal V
olta
ge [V
]
Charge Li-ion battery pack
10A(1/3C)
20A(2/3C)
30A(C)
40A(4/3C)
50A(5/3C)
0 0.1 0.2 0.3 0.4 0.5 0.6 0.7 0.8 0.9 124
25
26
27
28
29
30
31
SOC
Tem
pera
ture
[°C
]
Charge Li-ion battery pack
0 50 100 150 200 2500
100
200
300
400
500
600
700
800
Time [min]
Pow
er
[W]
Charge Li-ion battery pack
10A(1/3C)
20A(2/3C)
30A(C)
40A(4/3C)
50A(5/3C)
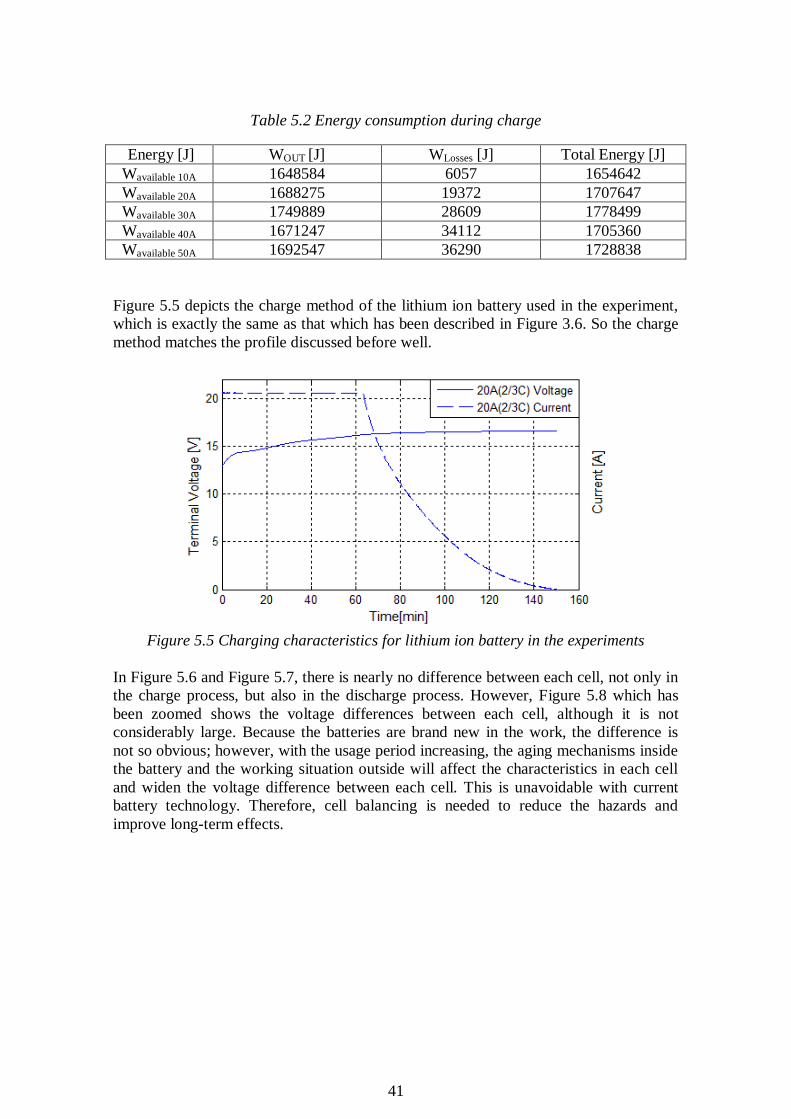
41
Table 5.2 Energy consumption during charge
Energy [J] WOUT [J] WLosses [J] Total Energy [J]
Wavailable 10A 1648584 6057 1654642
Wavailable 20A 1688275 19372 1707647
Wavailable 30A 1749889 28609 1778499
Wavailable 40A 1671247 34112 1705360
Wavailable 50A 1692547 36290 1728838
Figure 5.5 depicts the charge method of the lithium ion battery used in the experiment,
which is exactly the same as that which has been described in Figure 3.6. So the charge
method matches the profile discussed before well.
Figure 5.5 Charging characteristics for lithium ion battery in the experiments
In Figure 5.6 and Figure 5.7, there is nearly no difference between each cell, not only in
the charge process, but also in the discharge process. However, Figure 5.8 which has
been zoomed shows the voltage differences between each cell, although it is not
considerably large. Because the batteries are brand new in the work, the difference is
not so obvious; however, with the usage period increasing, the aging mechanisms inside
the battery and the working situation outside will affect the characteristics in each cell
and widen the voltage difference between each cell. This is unavoidable with current
battery technology. Therefore, cell balancing is needed to reduce the hazards and
improve long-term effects.
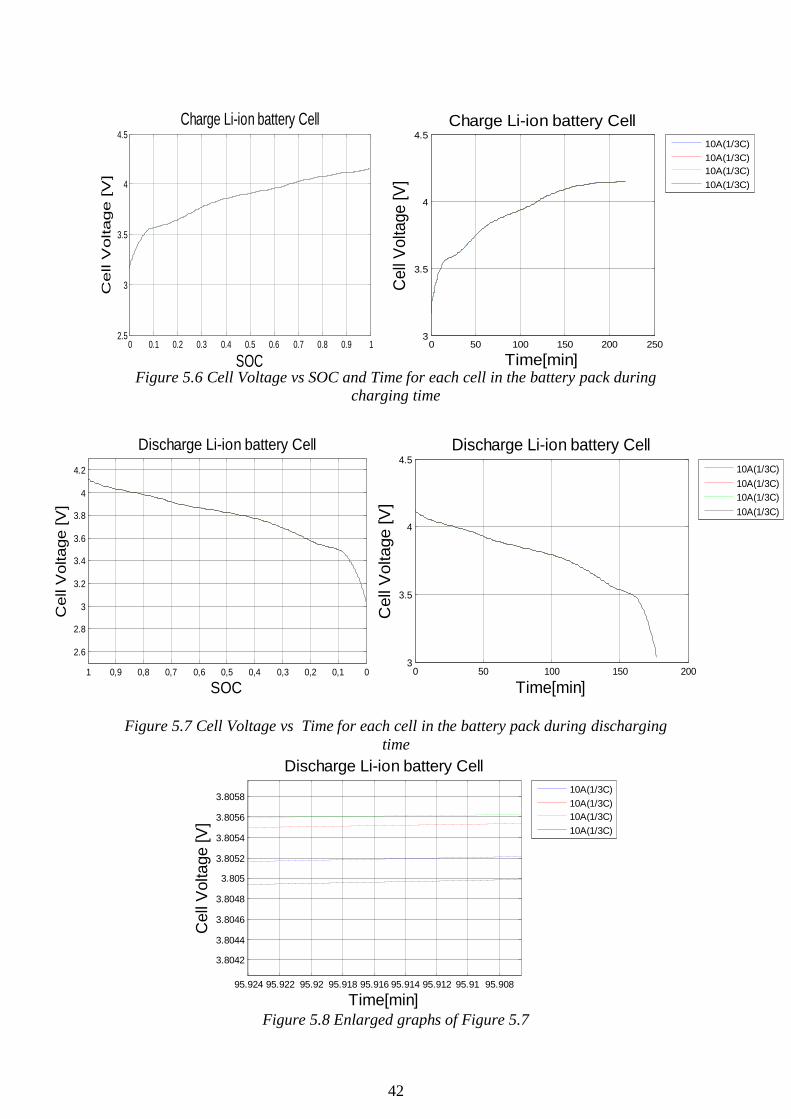
42
Figure 5.6 Cell Voltage vs SOC and Time for each cell in the battery pack during
charging time
Figure 5.7 Cell Voltage vs Time for each cell in the battery pack during discharging
time
Figure 5.8 Enlarged graphs of Figure 5.7
0 50 100 150 2003
3.5
4
4.5
Time[min]
Cell V
oltage [V
]
Discharge Li-ion battery Cell
10A(1/3C)
10A(1/3C)
10A(1/3C)
10A(1/3C)
95.90895.9195.91295.91495.91695.91895.9295.92295.924
3.8042
3.8044
3.8046
3.8048
3.805
3.8052
3.8054
3.8056
3.8058
Time[min]
Cell
Voltage [V
]
Discharge Li-ion battery Cell
10A(1/3C)
10A(1/3C)
10A(1/3C)
10A(1/3C)
0 50 100 150 200 2503
3.5
4
4.5
Time[min]
Cell
Voltage [V
]
Charge Li-ion battery Cell
10A(1/3C)
10A(1/3C)
10A(1/3C)
10A(1/3C)
0 0.1 0.2 0.3 0.4 0.5 0.6 0.7 0.8 0.9 12.5
3
3.5
4
4.5
SOC
Cell V
oltage [V
]
Charge Li-ion battery Cell
1 0,9 0,8 0,7 0,6 0,5 0,4 0,3 0,2 0,1 0
2.6
2.8
3
3.2
3.4
3.6
3.8
4
4.2
SOC
Cell V
oltage [V
]
Discharge Li-ion battery Cell
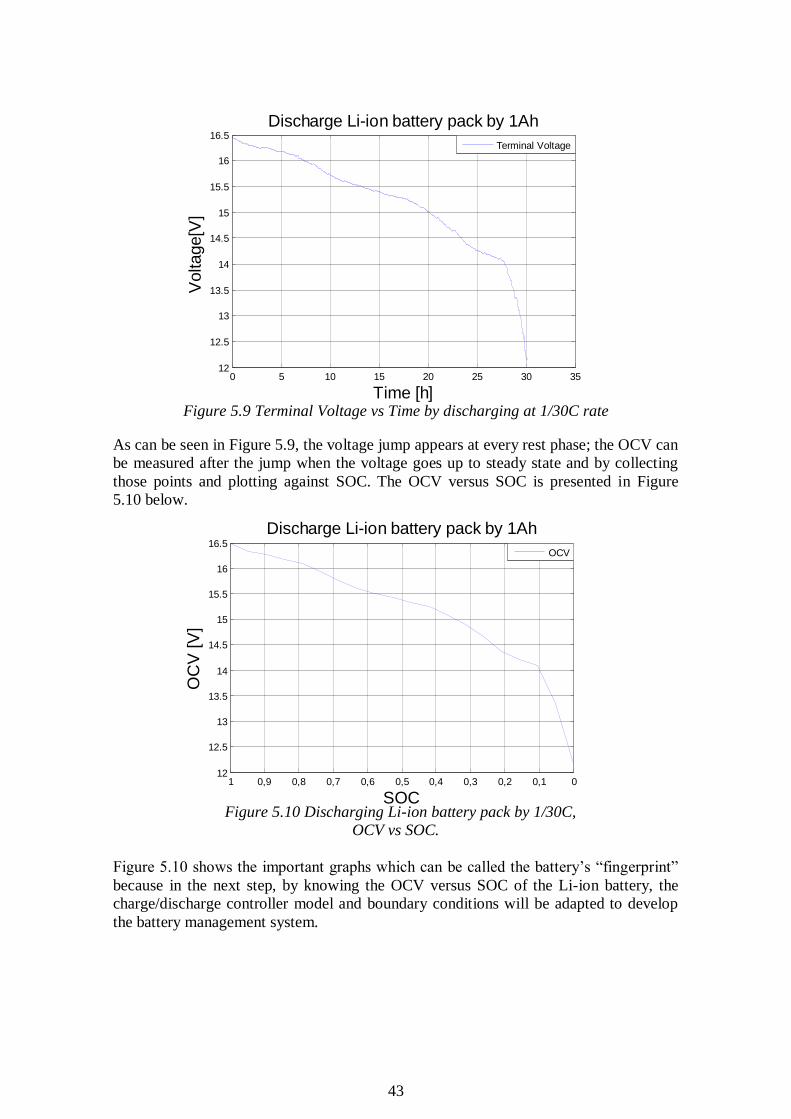
43
Figure 5.9 Terminal Voltage vs Time by discharging at 1/30C rate
As can be seen in Figure 5.9, the voltage jump appears at every rest phase; the OCV can
be measured after the jump when the voltage goes up to steady state and by collecting
those points and plotting against SOC. The OCV versus SOC is presented in Figure
5.10 below.
Figure 5.10 Discharging Li-ion battery pack by 1/30C,
OCV vs SOC.
Figure 5.10 shows the important graphs which can be called the battery’s “fingerprint”
because in the next step, by knowing the OCV versus SOC of the Li-ion battery, the
charge/discharge controller model and boundary conditions will be adapted to develop
the battery management system.
0 5 10 15 20 25 30 3512
12.5
13
13.5
14
14.5
15
15.5
16
16.5
Time [h]
Voltage[V
]
Discharge Li-ion battery pack by 1Ah
Terminal Voltage
1 0,9 0,8 0,7 0,6 0,5 0,4 0,3 0,2 0,1 012
12.5
13
13.5
14
14.5
15
15.5
16
16.5
SOC
OC
V [V
]
Discharge Li-ion battery pack by 1Ah
OCV
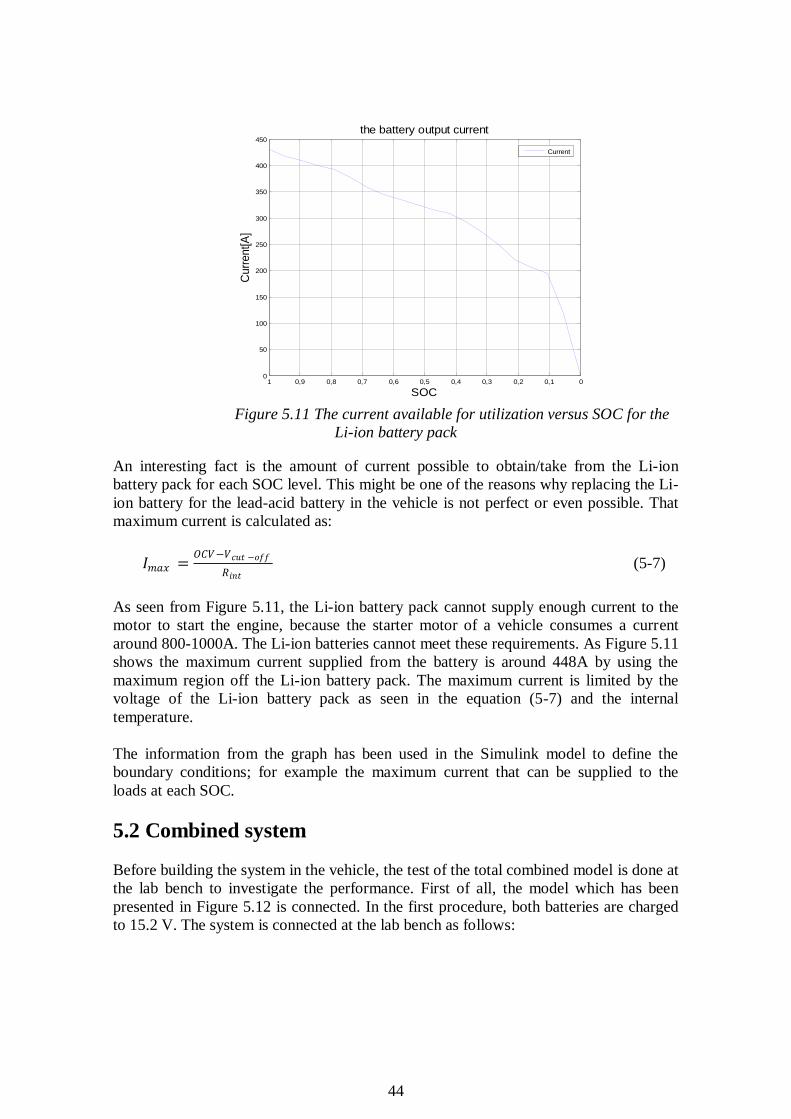
44
Figure 5.11 The current available for utilization versus SOC for the
Li-ion battery pack
An interesting fact is the amount of current possible to obtain/take from the Li-ion
battery pack for each SOC level. This might be one of the reasons why replacing the Li-
ion battery for the lead-acid battery in the vehicle is not perfect or even possible. That
maximum current is calculated as:
𝐼𝑚𝑎𝑥 =𝑂𝐶𝑉−𝑉𝑐𝑢𝑡 −𝑜𝑓𝑓
𝑅𝑖𝑛𝑡 (5-7)
As seen from Figure 5.11, the Li-ion battery pack cannot supply enough current to the
motor to start the engine, because the starter motor of a vehicle consumes a current
around 800-1000A. The Li-ion batteries cannot meet these requirements. As Figure 5.11
shows the maximum current supplied from the battery is around 448A by using the
maximum region off the Li-ion battery pack. The maximum current is limited by the
voltage of the Li-ion battery pack as seen in the equation (5-7) and the internal
temperature.
The information from the graph has been used in the Simulink model to define the
boundary conditions; for example the maximum current that can be supplied to the
loads at each SOC.
5.2 Combined system
Before building the system in the vehicle, the test of the total combined model is done at
the lab bench to investigate the performance. First of all, the model which has been
presented in Figure 5.12 is connected. In the first procedure, both batteries are charged
to 15.2 V. The system is connected at the lab bench as follows:
1 0,9 0,8 0,7 0,6 0,5 0,4 0,3 0,2 0,1 00
50
100
150
200
250
300
350
400
450
SOC
Curr
ent[A
]
the battery output current
Current
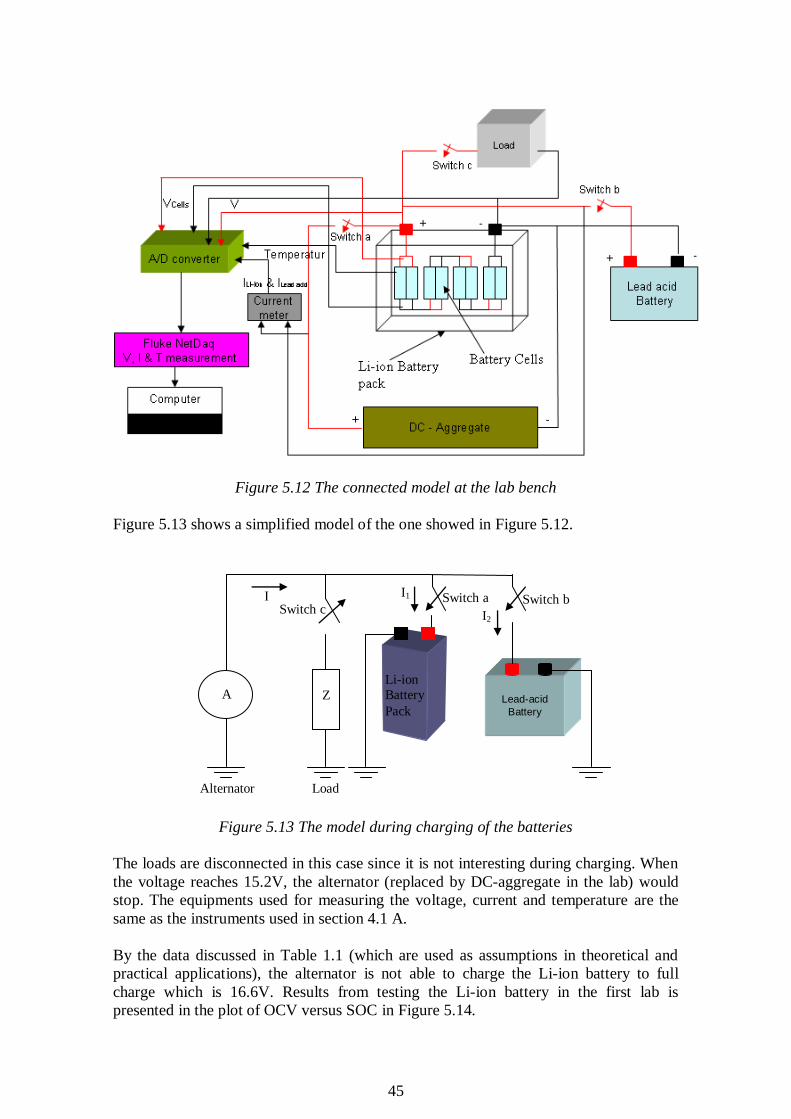
45
Figure 5.12 The connected model at the lab bench
Figure 5.13 shows a simplified model of the one showed in Figure 5.12.
Figure 5.13 The model during charging of the batteries
The loads are disconnected in this case since it is not interesting during charging. When
the voltage reaches 15.2V, the alternator (replaced by DC-aggregate in the lab) would
stop. The equipments used for measuring the voltage, current and temperature are the
same as the instruments used in section 4.1 A.
By the data discussed in Table 1.1 (which are used as assumptions in theoretical and
practical applications), the alternator is not able to charge the Li-ion battery to full
charge which is 16.6V. Results from testing the Li-ion battery in the first lab is
presented in the plot of OCV versus SOC in Figure 5.14.
Lead-acid
Battery
Li-ion
Battery
Pack
Z A
Alternator Load
I I1
I2
Switch a Switch b Switch c
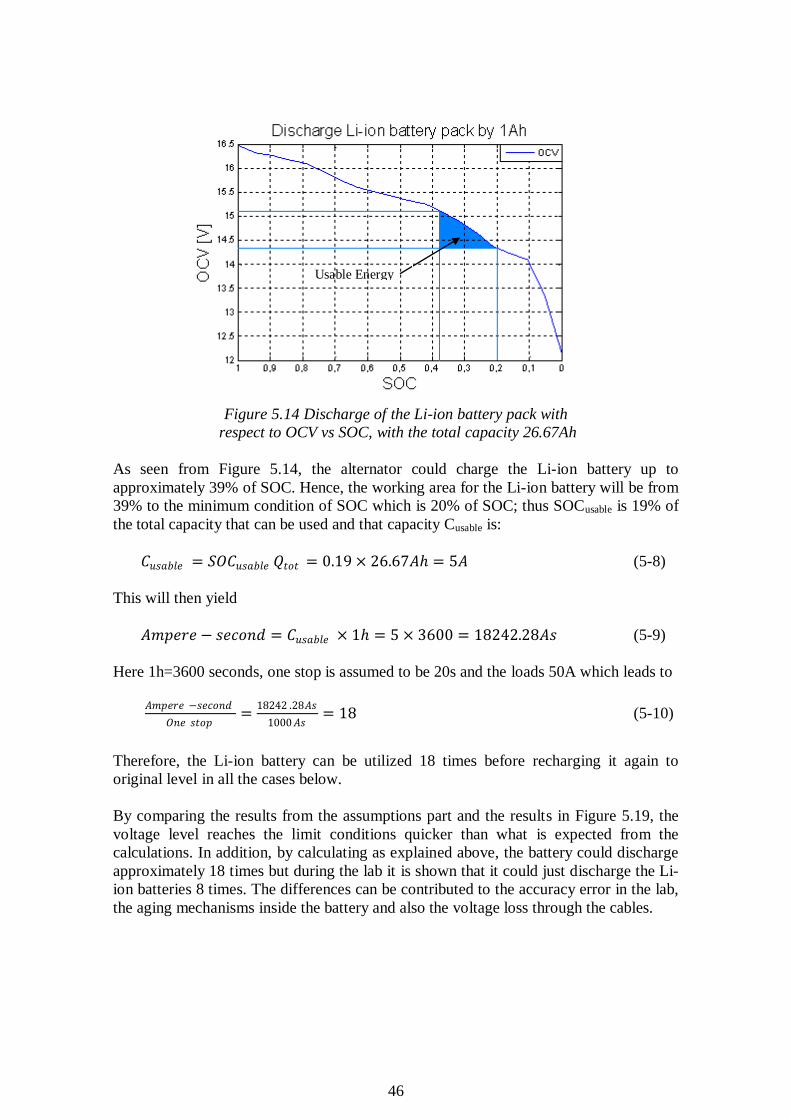
46
Figure 5.14 Discharge of the Li-ion battery pack with
respect to OCV vs SOC, with the total capacity 26.67Ah
As seen from Figure 5.14, the alternator could charge the Li-ion battery up to
approximately 39% of SOC. Hence, the working area for the Li-ion battery will be from
39% to the minimum condition of SOC which is 20% of SOC; thus SOCusable is 19% of
the total capacity that can be used and that capacity Cusable is:
𝐶𝑢𝑠𝑎𝑏𝑙𝑒 = 𝑆𝑂𝐶𝑢𝑠𝑎𝑏𝑙𝑒 𝑄𝑡𝑜𝑡 = 0.19 × 26.67𝐴 = 5𝐴 (5-8)
This will then yield
𝐴𝑚𝑝𝑒𝑟𝑒 − 𝑠𝑒𝑐𝑜𝑛𝑑 = 𝐶𝑢𝑠𝑎𝑏𝑙𝑒 × 1 = 5 × 3600 = 18242.28𝐴𝑠 (5-9)
Here 1h=3600 seconds, one stop is assumed to be 20s and the loads 50A which leads to
𝐴𝑚𝑝𝑒𝑟𝑒 −𝑠𝑒𝑐𝑜𝑛𝑑
𝑂𝑛𝑒 𝑠𝑡𝑜𝑝=
18242 .28𝐴𝑠
1000𝐴𝑠= 18 (5-10)
Therefore, the Li-ion battery can be utilized 18 times before recharging it again to
original level in all the cases below.
By comparing the results from the assumptions part and the results in Figure 5.19, the
voltage level reaches the limit conditions quicker than what is expected from the
calculations. In addition, by calculating as explained above, the battery could discharge
approximately 18 times but during the lab it is shown that it could just discharge the Li-
ion batteries 8 times. The differences can be contributed to the accuracy error in the lab,
the aging mechanisms inside the battery and also the voltage loss through the cables.
Usable Energy
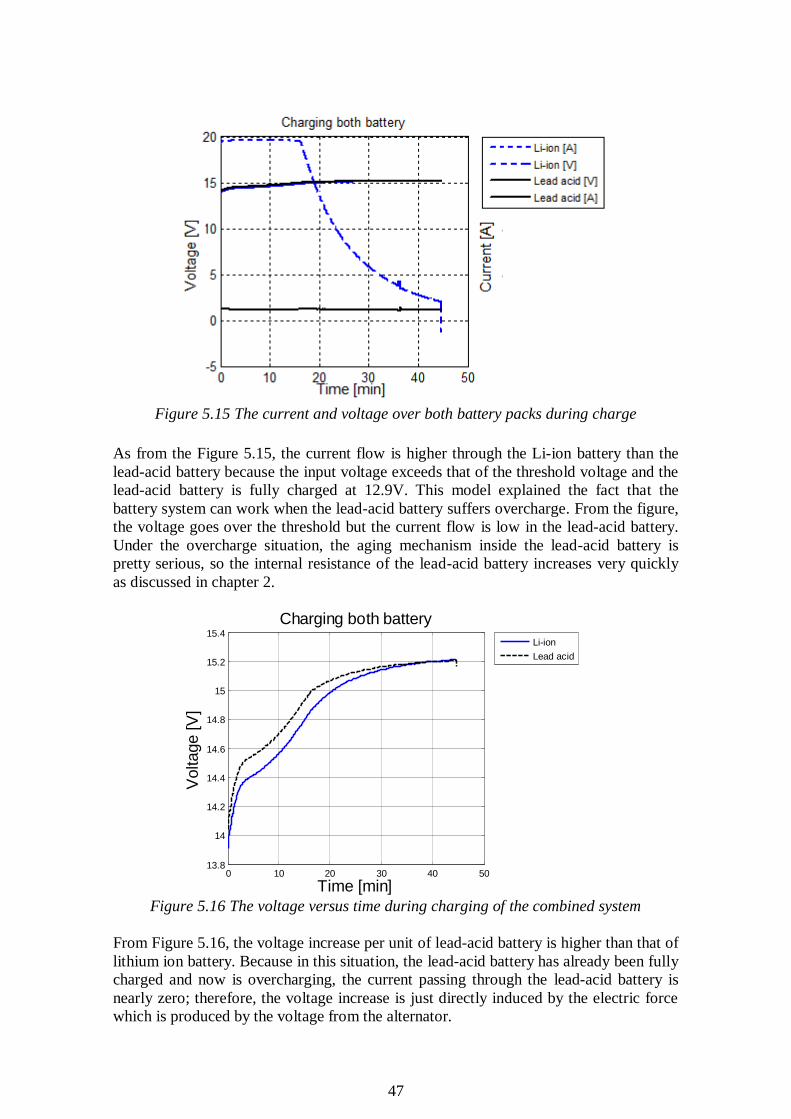
47
Figure 5.15 The current and voltage over both battery packs during charge
As from the Figure 5.15, the current flow is higher through the Li-ion battery than the
lead-acid battery because the input voltage exceeds that of the threshold voltage and the
lead-acid battery is fully charged at 12.9V. This model explained the fact that the
battery system can work when the lead-acid battery suffers overcharge. From the figure,
the voltage goes over the threshold but the current flow is low in the lead-acid battery.
Under the overcharge situation, the aging mechanism inside the lead-acid battery is
pretty serious, so the internal resistance of the lead-acid battery increases very quickly
as discussed in chapter 2.
0 10 20 30 40 5013.8
14
14.2
14.4
14.6
14.8
15
15.2
15.4
Time [min]
Voltage [V
]
Charging both battery
Li-ion
Lead acid
Figure 5.16 The voltage versus time during charging of the combined system
From Figure 5.16, the voltage increase per unit of lead-acid battery is higher than that of
lithium ion battery. Because in this situation, the lead-acid battery has already been fully
charged and now is overcharging, the current passing through the lead-acid battery is
nearly zero; therefore, the voltage increase is just directly induced by the electric force
which is produced by the voltage from the alternator.
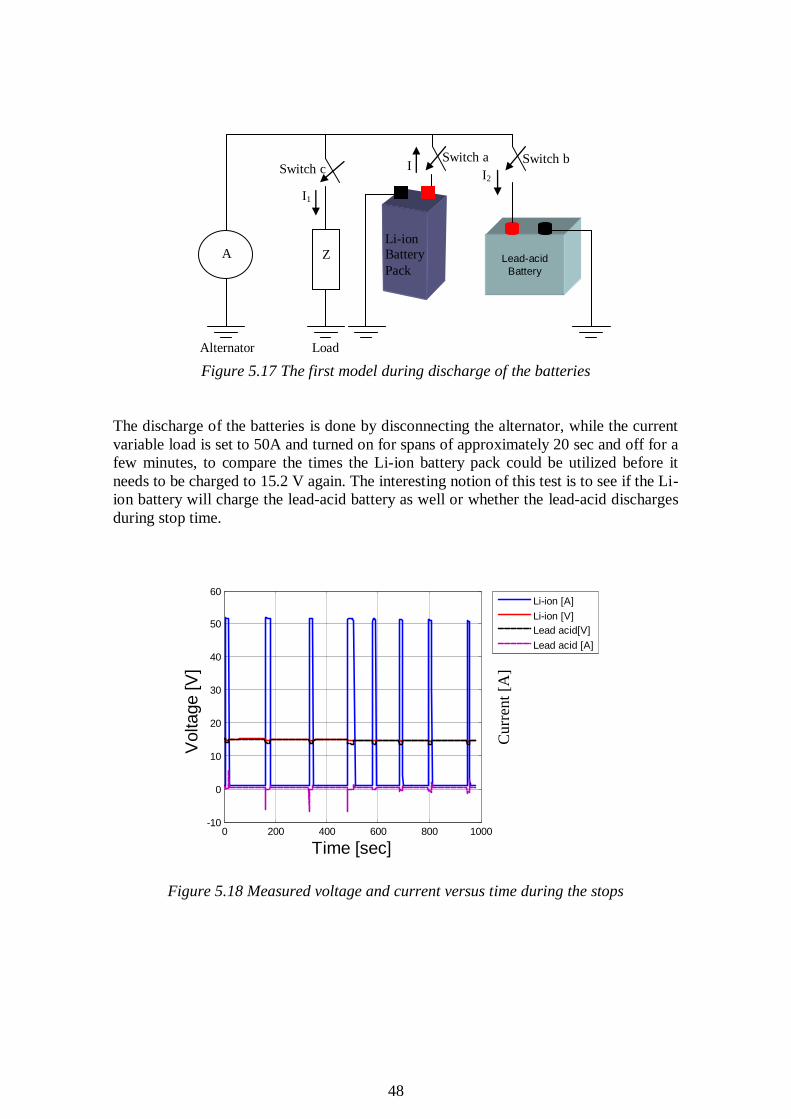
48
Figure 5.17 The first model during discharge of the batteries
The discharge of the batteries is done by disconnecting the alternator, while the current
variable load is set to 50A and turned on for spans of approximately 20 sec and off for a
few minutes, to compare the times the Li-ion battery pack could be utilized before it
needs to be charged to 15.2 V again. The interesting notion of this test is to see if the Li-
ion battery will charge the lead-acid battery as well or whether the lead-acid discharges
during stop time.
Figure 5.18 Measured voltage and current versus time during the stops
Lead-acid
Battery
Li-ion
Battery
Pack
Z A
Alternator Load
I
I1
I2
Switch a Switch b Switch c
Curr
ent
[A]
0 200 400 600 800 1000-10
0
10
20
30
40
50
60
Time [sec]
Voltage [V
]
Li-ion [A]
Li-ion [V]
Lead acid[V]
Lead acid [A]
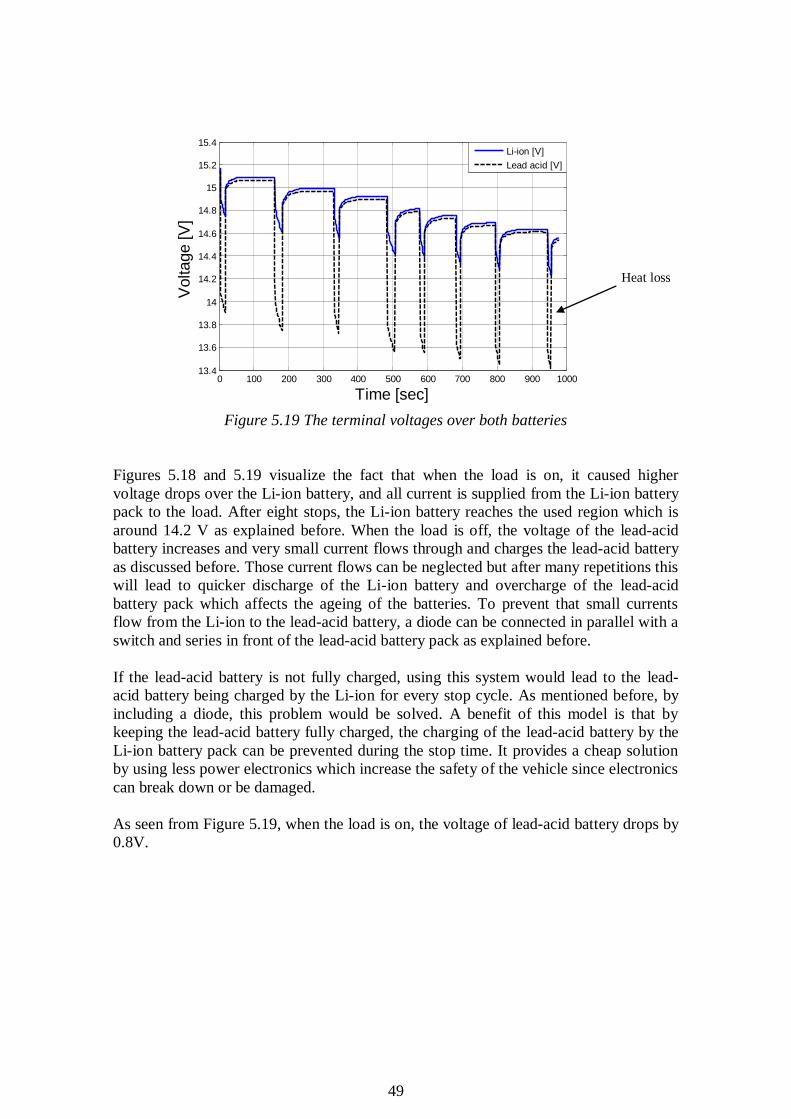
49
0 100 200 300 400 500 600 700 800 900 100013.4
13.6
13.8
14
14.2
14.4
14.6
14.8
15
15.2
15.4
Time [sec]
Voltage [V
]
Li-ion [V]
Lead acid [V]
Figure 5.19 The terminal voltages over both batteries
Figures 5.18 and 5.19 visualize the fact that when the load is on, it caused higher
voltage drops over the Li-ion battery, and all current is supplied from the Li-ion battery
pack to the load. After eight stops, the Li-ion battery reaches the used region which is
around 14.2 V as explained before. When the load is off, the voltage of the lead-acid
battery increases and very small current flows through and charges the lead-acid battery
as discussed before. Those current flows can be neglected but after many repetitions this
will lead to quicker discharge of the Li-ion battery and overcharge of the lead-acid
battery pack which affects the ageing of the batteries. To prevent that small currents
flow from the Li-ion to the lead-acid battery, a diode can be connected in parallel with a
switch and series in front of the lead-acid battery pack as explained before.
If the lead-acid battery is not fully charged, using this system would lead to the lead-
acid battery being charged by the Li-ion for every stop cycle. As mentioned before, by
including a diode, this problem would be solved. A benefit of this model is that by
keeping the lead-acid battery fully charged, the charging of the lead-acid battery by the
Li-ion battery pack can be prevented during the stop time. It provides a cheap solution
by using less power electronics which increase the safety of the vehicle since electronics
can break down or be damaged.
As seen from Figure 5.19, when the load is on, the voltage of lead-acid battery drops by
0.8V.
Heat loss
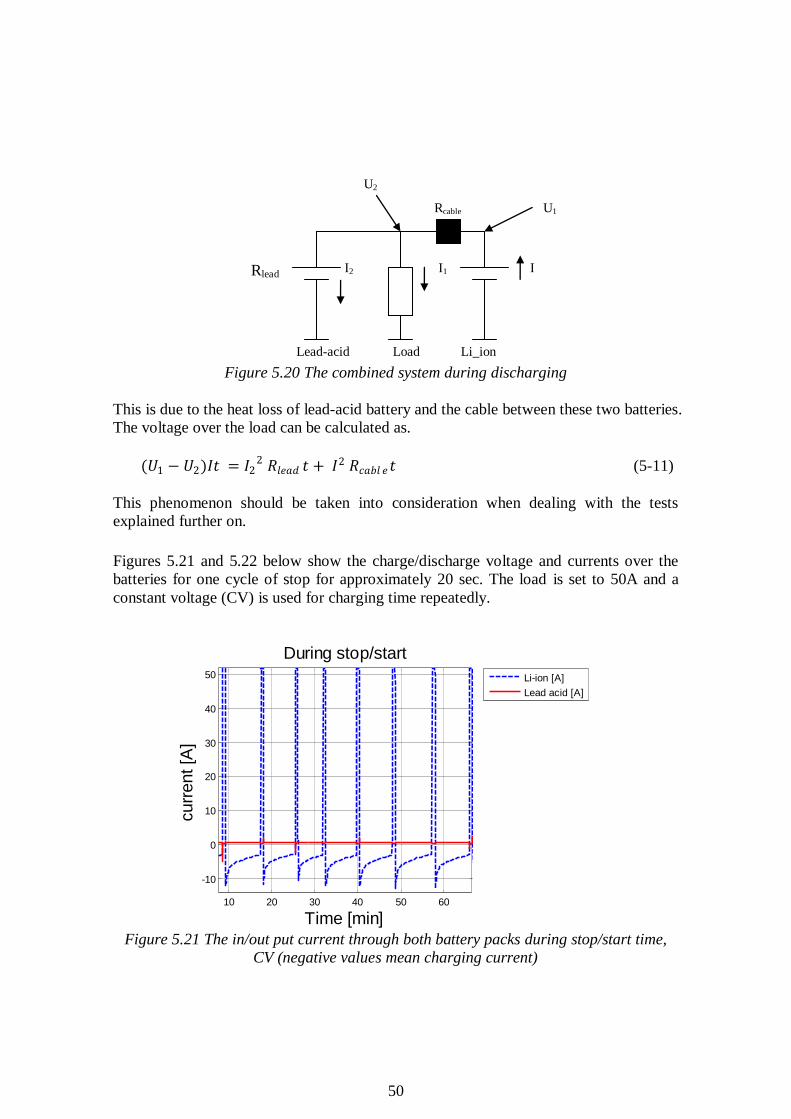
50
Figure 5.20 The combined system during discharging
This is due to the heat loss of lead-acid battery and the cable between these two batteries.
The voltage over the load can be calculated as.
(𝑈1 − 𝑈2)𝐼𝑡 = 𝐼22 𝑅𝑙𝑒𝑎𝑑 𝑡 + 𝐼2 𝑅𝑐𝑎𝑏𝑙 𝑒𝑡 (5-11)
This phenomenon should be taken into consideration when dealing with the tests
explained further on.
Figures 5.21 and 5.22 below show the charge/discharge voltage and currents over the
batteries for one cycle of stop for approximately 20 sec. The load is set to 50A and a
constant voltage (CV) is used for charging time repeatedly.
10 20 30 40 50 60
-10
0
10
20
30
40
50
Time [min]
curr
ent [A
]
During stop/start
Li-ion [A]
Lead acid [A]
Figure 5.21 The in/out put current through both battery packs during stop/start time,
CV (negative values mean charging current)
Lead-acid Load Li_ion
Rcable
I I1
U2
U1
Rlead I2
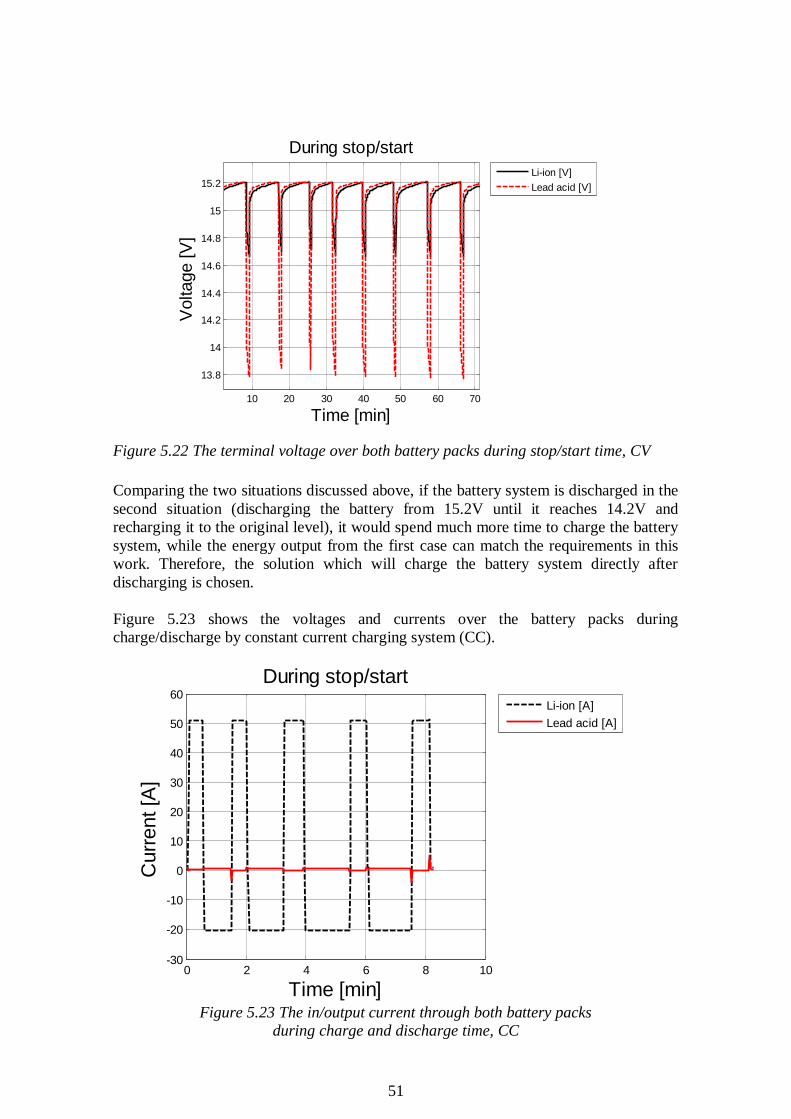
51
Figure 5.22 The terminal voltage over both battery packs during stop/start time, CV
Comparing the two situations discussed above, if the battery system is discharged in the
second situation (discharging the battery from 15.2V until it reaches 14.2V and
recharging it to the original level), it would spend much more time to charge the battery
system, while the energy output from the first case can match the requirements in this
work. Therefore, the solution which will charge the battery system directly after
discharging is chosen.
Figure 5.23 shows the voltages and currents over the battery packs during
charge/discharge by constant current charging system (CC).
0 2 4 6 8 10-30
-20
-10
0
10
20
30
40
50
60
Time [min]
Curr
ent [A
]
During stop/start
Li-ion [A]
Lead acid [A]
Figure 5.23 The in/output current through both battery packs
during charge and discharge time, CC
10 20 30 40 50 60 70
13.8
14
14.2
14.4
14.6
14.8
15
15.2
Time [min]
Voltage [V
]
During stop/start
Li-ion [V]
Lead acid [V]
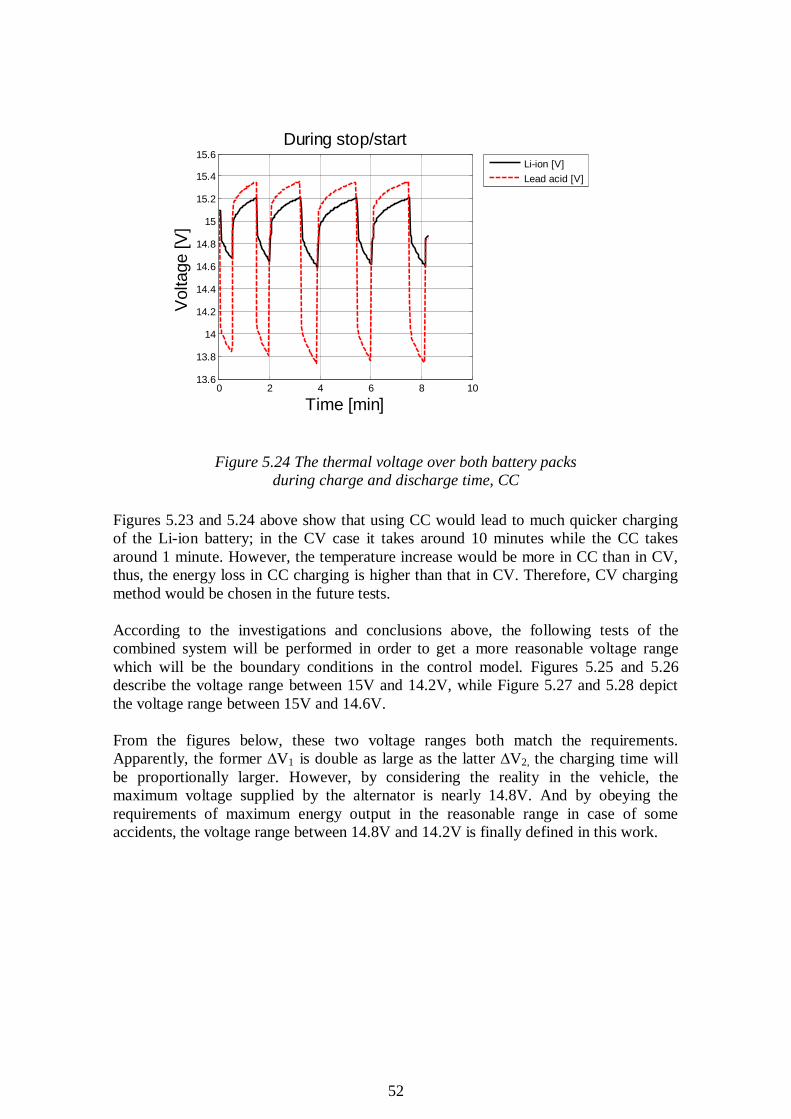
52
0 2 4 6 8 1013.6
13.8
14
14.2
14.4
14.6
14.8
15
15.2
15.4
15.6
Time [min]
Voltage [V
]
During stop/start
Li-ion [V]
Lead acid [V]
Figure 5.24 The thermal voltage over both battery packs
during charge and discharge time, CC
Figures 5.23 and 5.24 above show that using CC would lead to much quicker charging
of the Li-ion battery; in the CV case it takes around 10 minutes while the CC takes
around 1 minute. However, the temperature increase would be more in CC than in CV,
thus, the energy loss in CC charging is higher than that in CV. Therefore, CV charging
method would be chosen in the future tests.
According to the investigations and conclusions above, the following tests of the
combined system will be performed in order to get a more reasonable voltage range
which will be the boundary conditions in the control model. Figures 5.25 and 5.26
describe the voltage range between 15V and 14.2V, while Figure 5.27 and 5.28 depict
the voltage range between 15V and 14.6V.
From the figures below, these two voltage ranges both match the requirements.
Apparently, the former ∆V1 is double as large as the latter ∆V2, the charging time will
be proportionally larger. However, by considering the reality in the vehicle, the
maximum voltage supplied by the alternator is nearly 14.8V. And by obeying the
requirements of maximum energy output in the reasonable range in case of some
accidents, the voltage range between 14.8V and 14.2V is finally defined in this work.
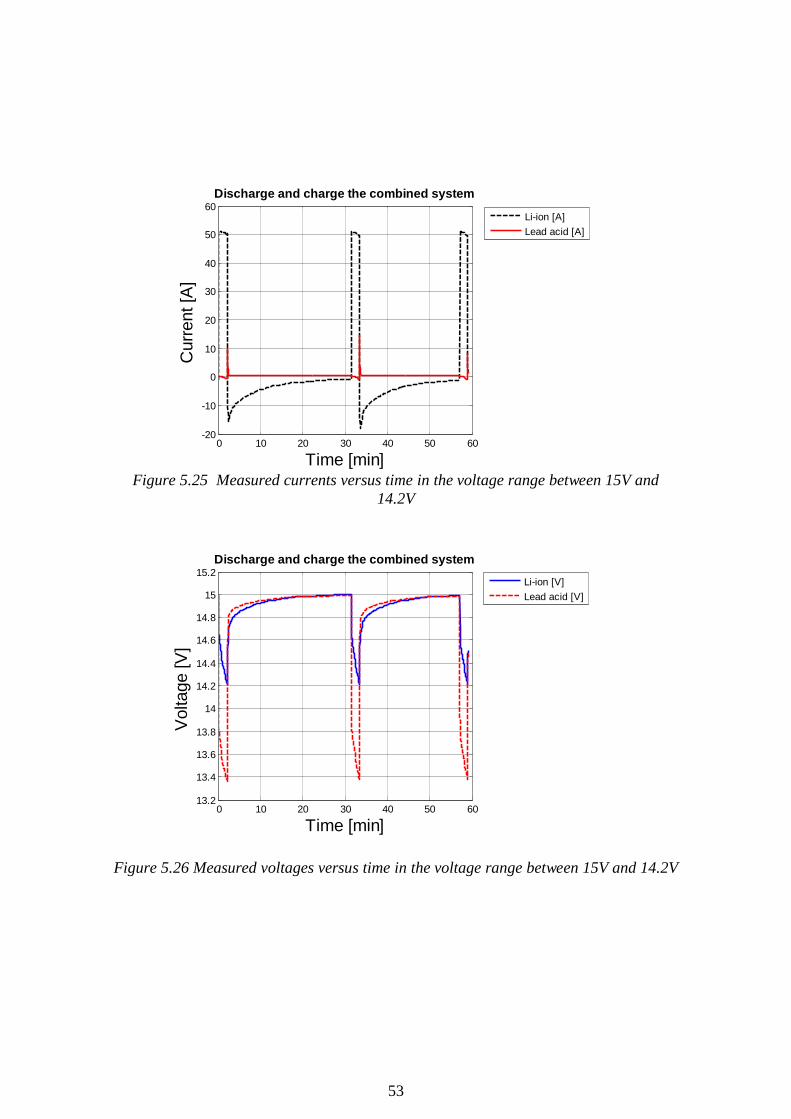
53
0 10 20 30 40 50 60-20
-10
0
10
20
30
40
50
60
Time [min]
Curr
ent [A
] Discharge and charge the combined system
Li-ion [A]
Lead acid [A]
Figure 5.25 Measured currents versus time in the voltage range between 15V and
14.2V
0 10 20 30 40 50 6013.2
13.4
13.6
13.8
14
14.2
14.4
14.6
14.8
15
15.2
Time [min]
Voltage [V
]
Discharge and charge the combined system
Li-ion [V]
Lead acid [V]
Figure 5.26 Measured voltages versus time in the voltage range between 15V and 14.2V
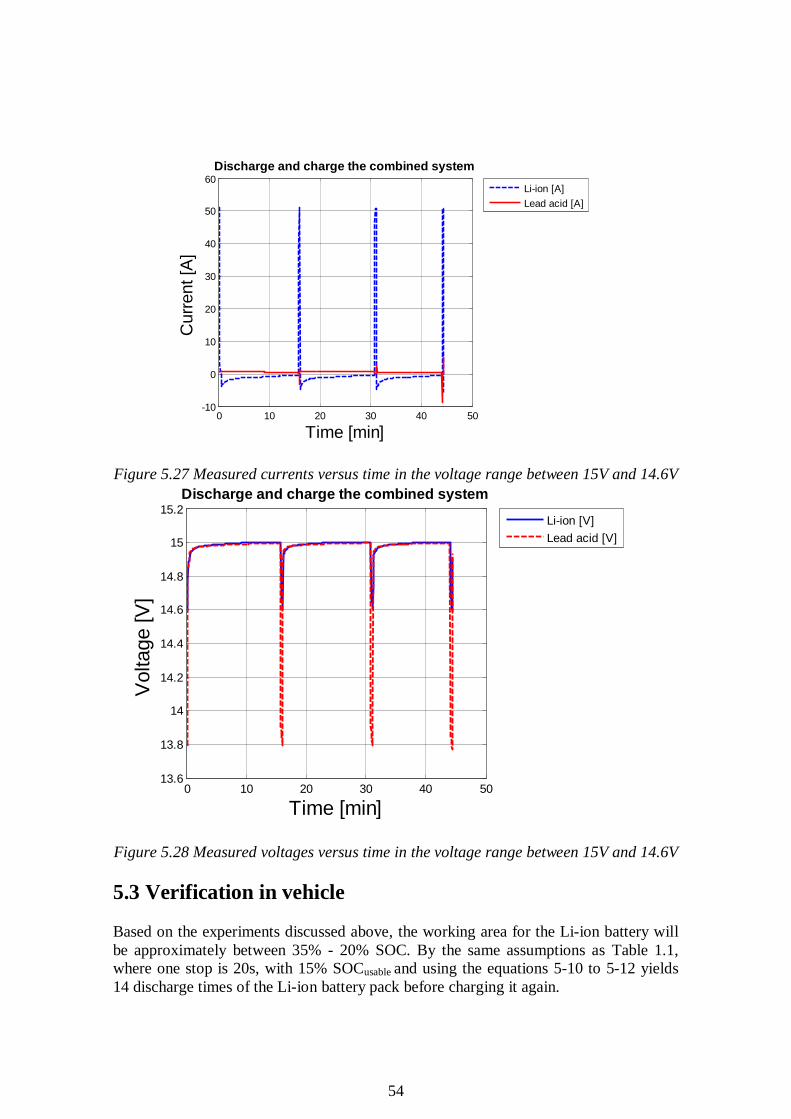
54
0 10 20 30 40 50-10
0
10
20
30
40
50
60
Time [min]
Curr
ent [A
]
Discharge and charge the combined system
Li-ion [A]
Lead acid [A]
Figure 5.27 Measured currents versus time in the voltage range between 15V and 14.6V
0 10 20 30 40 5013.6
13.8
14
14.2
14.4
14.6
14.8
15
15.2
Time [min]
Voltage [V
]
Discharge and charge the combined system
Li-ion [V]
Lead acid [V]
Figure 5.28 Measured voltages versus time in the voltage range between 15V and 14.6V
5.3 Verification in vehicle
Based on the experiments discussed above, the working area for the Li-ion battery will
be approximately between 35% - 20% SOC. By the same assumptions as Table 1.1,
where one stop is 20s, with 15% SOCusable and using the equations 5-10 to 5-12 yields
14 discharge times of the Li-ion battery pack before charging it again.
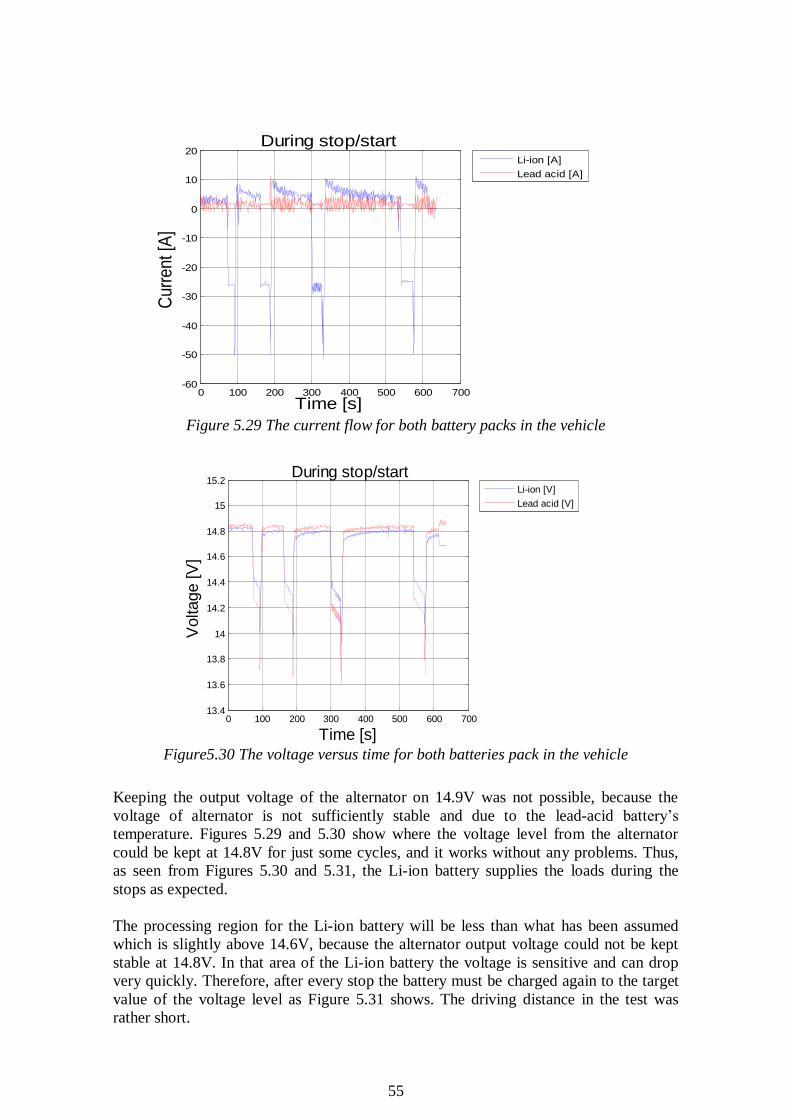
55
0 100 200 300 400 500 600 700-60
-50
-40
-30
-20
-10
0
10
20
Time [s]
Cur
rent
[A]
During stop/start
Li-ion [A]
Lead acid [A]
Figure 5.29 The current flow for both battery packs in the vehicle
0 100 200 300 400 500 600 70013.4
13.6
13.8
14
14.2
14.4
14.6
14.8
15
15.2
Time [s]
Voltage [V
]
During stop/start
Li-ion [V]
Lead acid [V]
Figure5.30 The voltage versus time for both batteries pack in the vehicle
Keeping the output voltage of the alternator on 14.9V was not possible, because the
voltage of alternator is not sufficiently stable and due to the lead-acid battery’s
temperature. Figures 5.29 and 5.30 show where the voltage level from the alternator
could be kept at 14.8V for just some cycles, and it works without any problems. Thus,
as seen from Figures 5.30 and 5.31, the Li-ion battery supplies the loads during the
stops as expected.
The processing region for the Li-ion battery will be less than what has been assumed
which is slightly above 14.6V, because the alternator output voltage could not be kept
stable at 14.8V. In that area of the Li-ion battery the voltage is sensitive and can drop
very quickly. Therefore, after every stop the battery must be charged again to the target
value of the voltage level as Figure 5.31 shows. The driving distance in the test was
rather short.
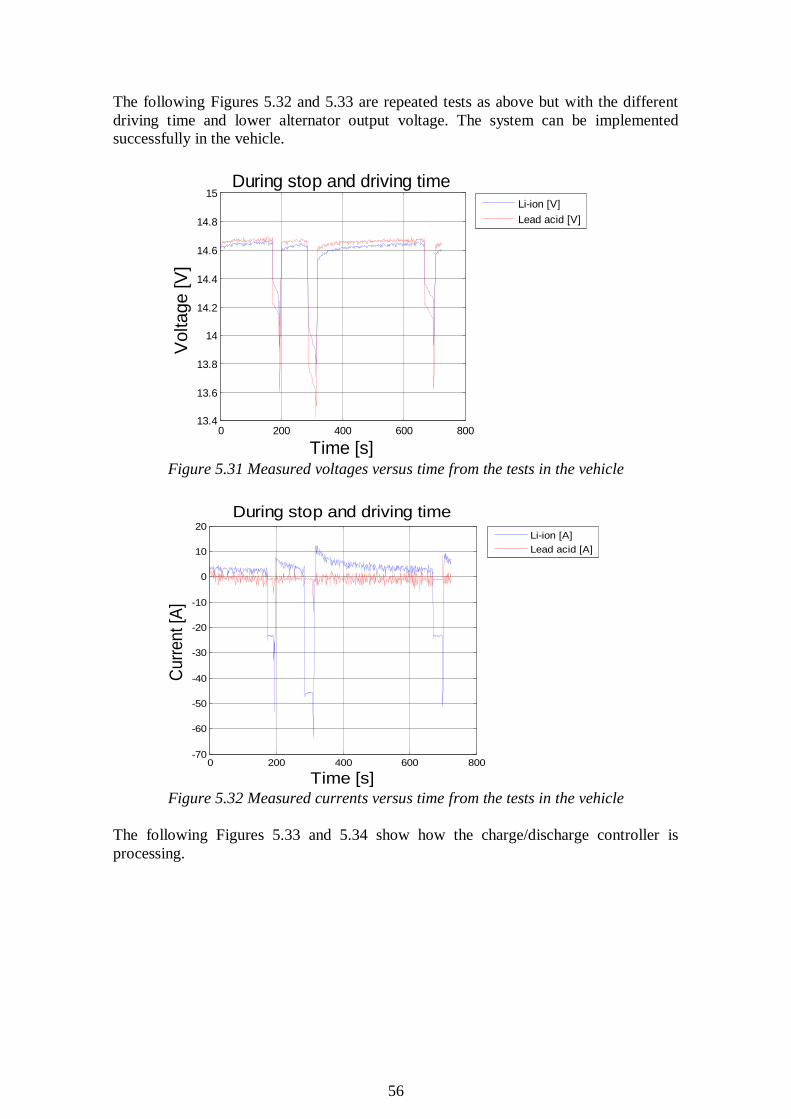
56
The following Figures 5.32 and 5.33 are repeated tests as above but with the different
driving time and lower alternator output voltage. The system can be implemented
successfully in the vehicle.
0 200 400 600 80013.4
13.6
13.8
14
14.2
14.4
14.6
14.8
15
Time [s]
Voltage [V
] During stop and driving time
Li-ion [V]
Lead acid [V]
Figure 5.31 Measured voltages versus time from the tests in the vehicle
0 200 400 600 800-70
-60
-50
-40
-30
-20
-10
0
10
20
Time [s]
Curr
ent [A
]
During stop and driving time
Li-ion [A]
Lead acid [A]
Figure 5.32 Measured currents versus time from the tests in the vehicle
The following Figures 5.33 and 5.34 show how the charge/discharge controller is
processing.
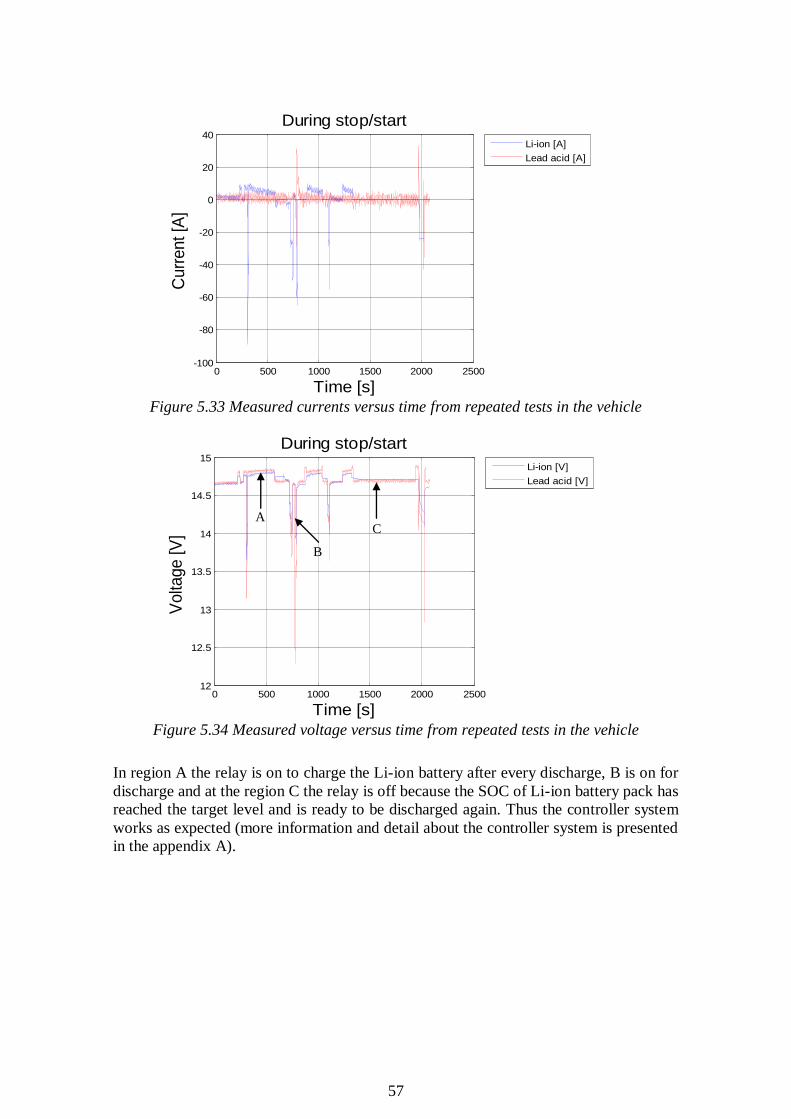
57
0 500 1000 1500 2000 2500-100
-80
-60
-40
-20
0
20
40
Time [s]
Curr
ent [A
]
During stop/start
Li-ion [A]
Lead acid [A]
Figure 5.33 Measured currents versus time from repeated tests in the vehicle
Figure 5.34 Measured voltage versus time from repeated tests in the vehicle
In region A the relay is on to charge the Li-ion battery after every discharge, B is on for
discharge and at the region C the relay is off because the SOC of Li-ion battery pack has
reached the target level and is ready to be discharged again. Thus the controller system
works as expected (more information and detail about the controller system is presented
in the appendix A).
0 500 1000 1500 2000 250012
12.5
13
13.5
14
14.5
15
Time [s]
Volta
ge [V
]
During stop/start
Li-ion [V]
Lead acid [V]
C
B
A
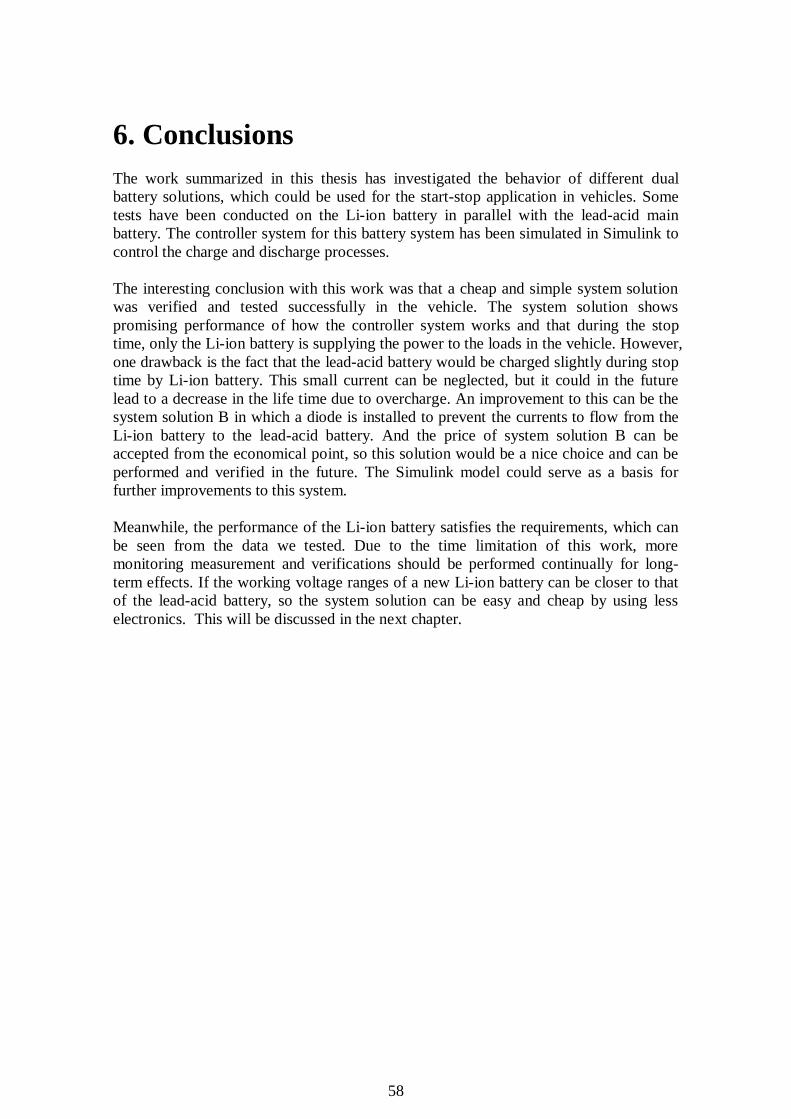
58
6. Conclusions
The work summarized in this thesis has investigated the behavior of different dual
battery solutions, which could be used for the start-stop application in vehicles. Some
tests have been conducted on the Li-ion battery in parallel with the lead-acid main
battery. The controller system for this battery system has been simulated in Simulink to
control the charge and discharge processes.
The interesting conclusion with this work was that a cheap and simple system solution
was verified and tested successfully in the vehicle. The system solution shows
promising performance of how the controller system works and that during the stop
time, only the Li-ion battery is supplying the power to the loads in the vehicle. However,
one drawback is the fact that the lead-acid battery would be charged slightly during stop
time by Li-ion battery. This small current can be neglected, but it could in the future
lead to a decrease in the life time due to overcharge. An improvement to this can be the
system solution B in which a diode is installed to prevent the currents to flow from the
Li-ion battery to the lead-acid battery. And the price of system solution B can be
accepted from the economical point, so this solution would be a nice choice and can be
performed and verified in the future. The Simulink model could serve as a basis for
further improvements to this system.
Meanwhile, the performance of the Li-ion battery satisfies the requirements, which can
be seen from the data we tested. Due to the time limitation of this work, more
monitoring measurement and verifications should be performed continually for long-
term effects. If the working voltage ranges of a new Li-ion battery can be closer to that
of the lead-acid battery, so the system solution can be easy and cheap by using less
electronics. This will be discussed in the next chapter.
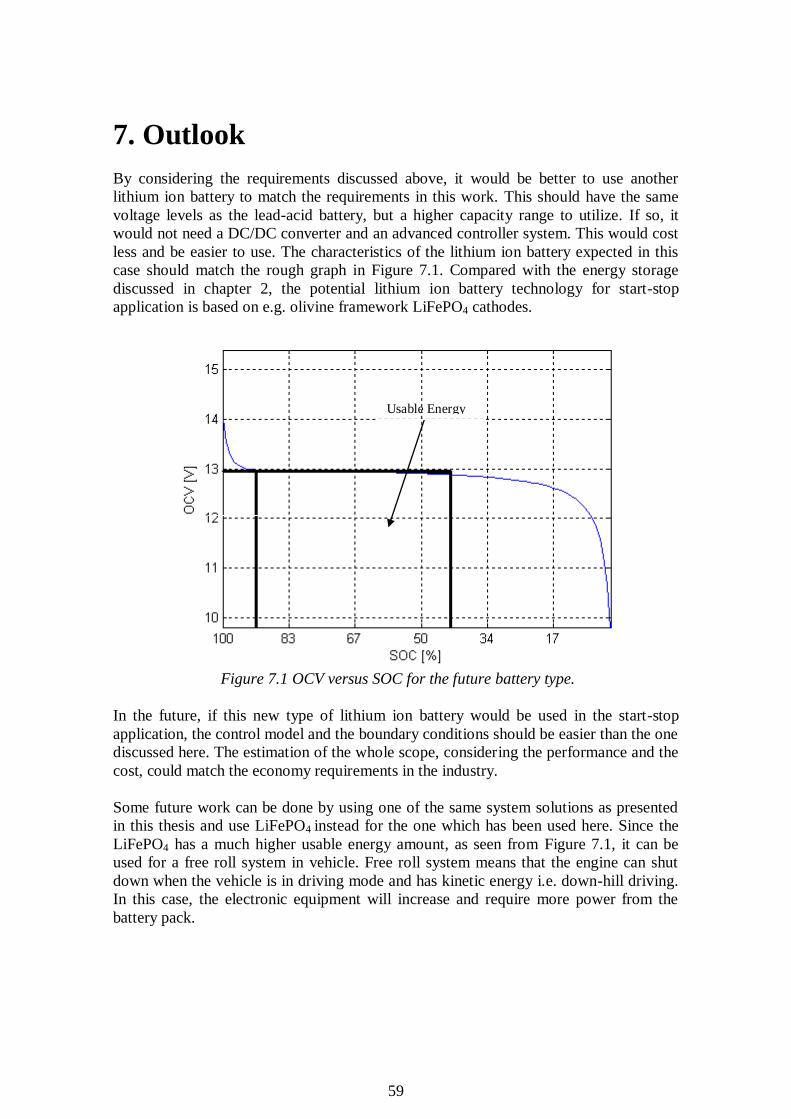
59
7. Outlook
By considering the requirements discussed above, it would be better to use another
lithium ion battery to match the requirements in this work. This should have the same
voltage levels as the lead-acid battery, but a higher capacity range to utilize. If so, it
would not need a DC/DC converter and an advanced controller system. This would cost
less and be easier to use. The characteristics of the lithium ion battery expected in this
case should match the rough graph in Figure 7.1. Compared with the energy storage
discussed in chapter 2, the potential lithium ion battery technology for start-stop
application is based on e.g. olivine framework LiFePO4 cathodes.
Figure 7.1 OCV versus SOC for the future battery type.
In the future, if this new type of lithium ion battery would be used in the start-stop
application, the control model and the boundary conditions should be easier than the one
discussed here. The estimation of the whole scope, considering the performance and the
cost, could match the economy requirements in the industry.
Some future work can be done by using one of the same system solutions as presented
in this thesis and use LiFePO4 instead for the one which has been used here. Since the
LiFePO4 has a much higher usable energy amount, as seen from Figure 7.1, it can be
used for a free roll system in vehicle. Free roll system means that the engine can shut
down when the vehicle is in driving mode and has kinetic energy i.e. down-hill driving.
In this case, the electronic equipment will increase and require more power from the
battery pack.
Usable Energy
60
8. References
1. JB Goodenough. Positive electrode: Layered Metal Oxides (2009). Elsevier B.V.
2. Elton J.Cairns. Batteries, Overview (2004). Encyclopedia of Energy. Vol1.
3. D.A.J.Rand et al. Valve-Regulated Lead-Acid Batteries (2004). Elsevier B.V.
4. J Albers, et al., Lead-acid batteries in micro-hybrid vehicles. J. Power Source (2010),
doi: 10.1016/j.jpowsour.2010.11.094
5. Masataka Wakihara. Recent developments in lithium ion batteries. Materials Science
and Engineering R33(2001) 109-134
6. J.Vetter. Ageing mechanisms in lithium ion batteries. J. Power Source 147(2005)269-
281
7. http://www.mpoweruk.com/chemistries.htm 2011-02-18 entry
8. M.Wakihara. Lithium-ion batteries: fundamentals and performance
9.
http://batteryuniversity.com/learn/article/how_does_internal_resistance_affect_perfo
rmance 2011-03-15 entry
10. Yuichi Sato. Cause of the memory effect observed in alkaline secondary batteries
using nickel electrode. J. of Power Sources 93(2001)20-24
11. Elisabet Ahlberg. Capacity loss in Ni-Cd pocket plate batteries. The origin of the
second voltage plateau. J of Power Source 85(2000)245-253
12. http://www.mpoweruk.com/life.htm 2011-03-20 entry
13. http://www.mpoweruk.com/thermal.htm 2011-03-20entry
14. Minoru Inaba etc. Up-to-date Development of Lithium-ion Batteries in Japan. IEEE
Electrical Insulation Magazine
15. http://www.mpoweruk.com/bms.htm battery management system 2011-05-20 entry
16. Daniel. D Friel. Management of Batteries for Electric Traction Vehicle. USA (2010)
Elsevier B.V.
17. Dennis Doerffel et, all. Large Lithium-Ion Batteries – a Review. UK (2006)
18. http://www.mpoweruk.com/soc.htm 2011-05-30 entry
19. Jie Xu et, all. Design and Study on the State of Charge Estimation for Lithium-ion
Battery Pack in Electric Vehicle. China (2009) IEEE computer society
20. Amir M. Rahimi. A Lithium-Ion Battery Charger for Charging up to Eight Cells.
USA 7-9 Sept. 2005 IEEE
21. http://www.mpoweruk.com/chargers.htm 2011-03-10 entry
22. http://en.wikipedia.org/wiki/Schottky_diode 2011-05-20 entry

61
Appendix A
Simulink model
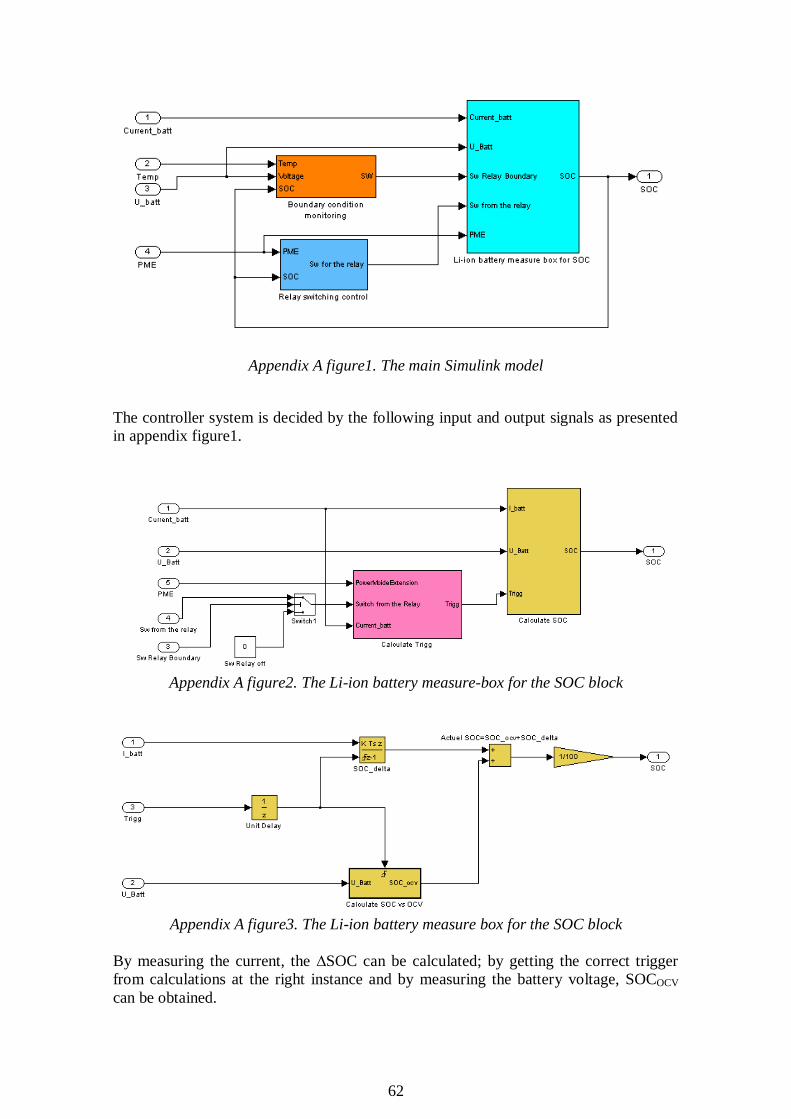
62
Appendix A figure1. The main Simulink model
The controller system is decided by the following input and output signals as presented
in appendix figure1.
Appendix A figure2. The Li-ion battery measure-box for the SOC block
Appendix A figure3. The Li-ion battery measure box for the SOC block
By measuring the current, the ∆SOC can be calculated; by getting the correct trigger
from calculations at the right instance and by measuring the battery voltage, SOCOCV
can be obtained.
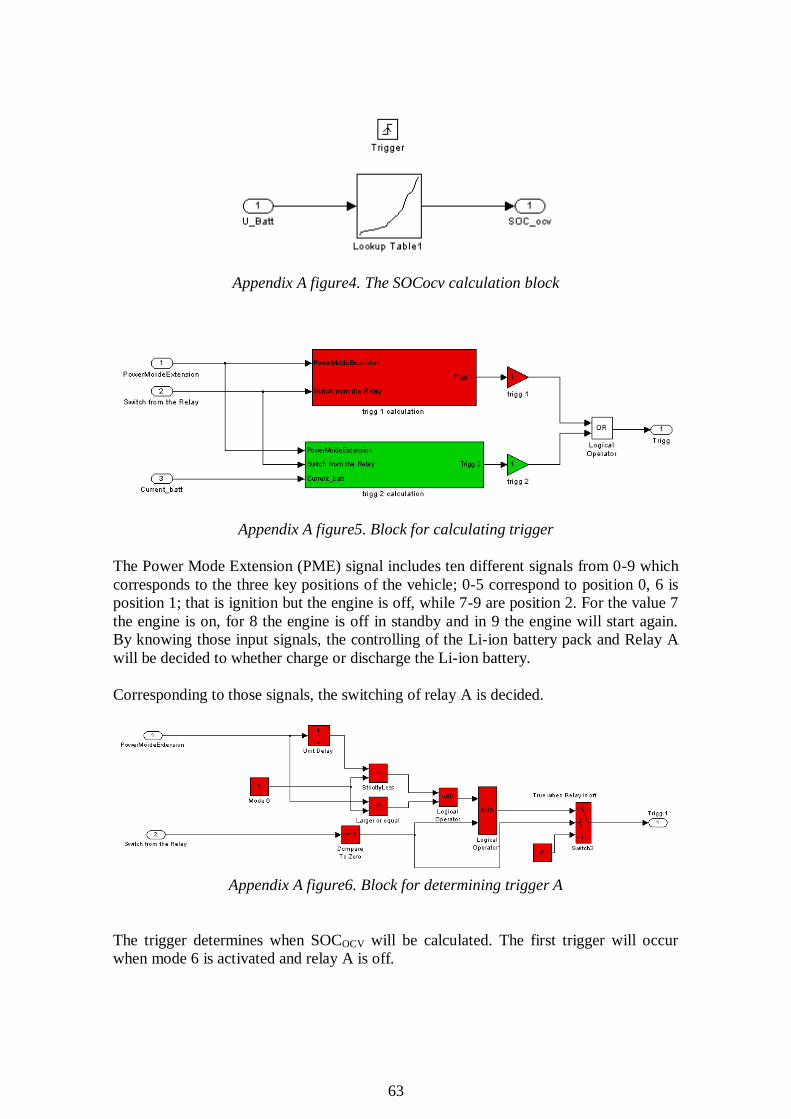
63
Appendix A figure4. The SOCocv calculation block
Appendix A figure5. Block for calculating trigger
The Power Mode Extension (PME) signal includes ten different signals from 0-9 which
corresponds to the three key positions of the vehicle; 0-5 correspond to position 0, 6 is
position 1; that is ignition but the engine is off, while 7-9 are position 2. For the value 7
the engine is on, for 8 the engine is off in standby and in 9 the engine will start again.
By knowing those input signals, the controlling of the Li-ion battery pack and Relay A
will be decided to whether charge or discharge the Li-ion battery.
Corresponding to those signals, the switching of relay A is decided.
Appendix A figure6. Block for determining trigger A
The trigger determines when SOCOCV will be calculated. The first trigger will occur
when mode 6 is activated and relay A is off.
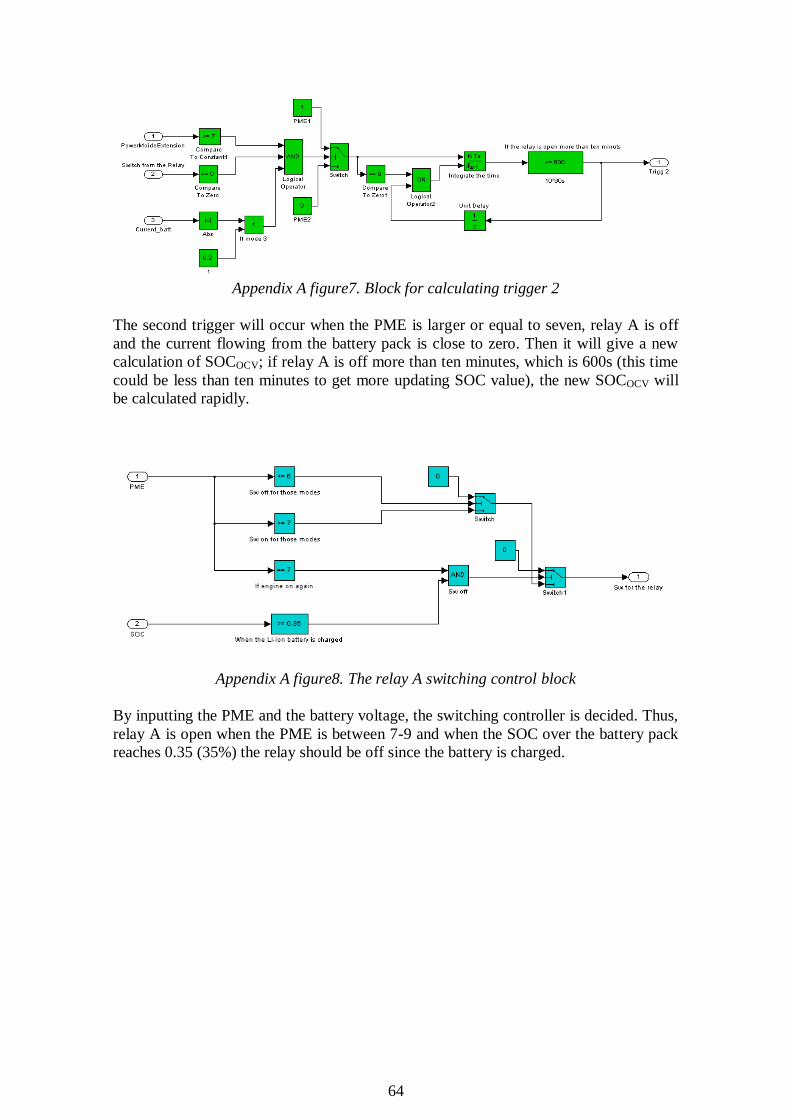
64
Appendix A figure7. Block for calculating trigger 2
The second trigger will occur when the PME is larger or equal to seven, relay A is off
and the current flowing from the battery pack is close to zero. Then it will give a new
calculation of SOCOCV; if relay A is off more than ten minutes, which is 600s (this time
could be less than ten minutes to get more updating SOC value), the new SOCOCV will
be calculated rapidly.
Appendix A figure8. The relay A switching control block
By inputting the PME and the battery voltage, the switching controller is decided. Thus,
relay A is open when the PME is between 7-9 and when the SOC over the battery pack
reaches 0.35 (35%) the relay should be off since the battery is charged.
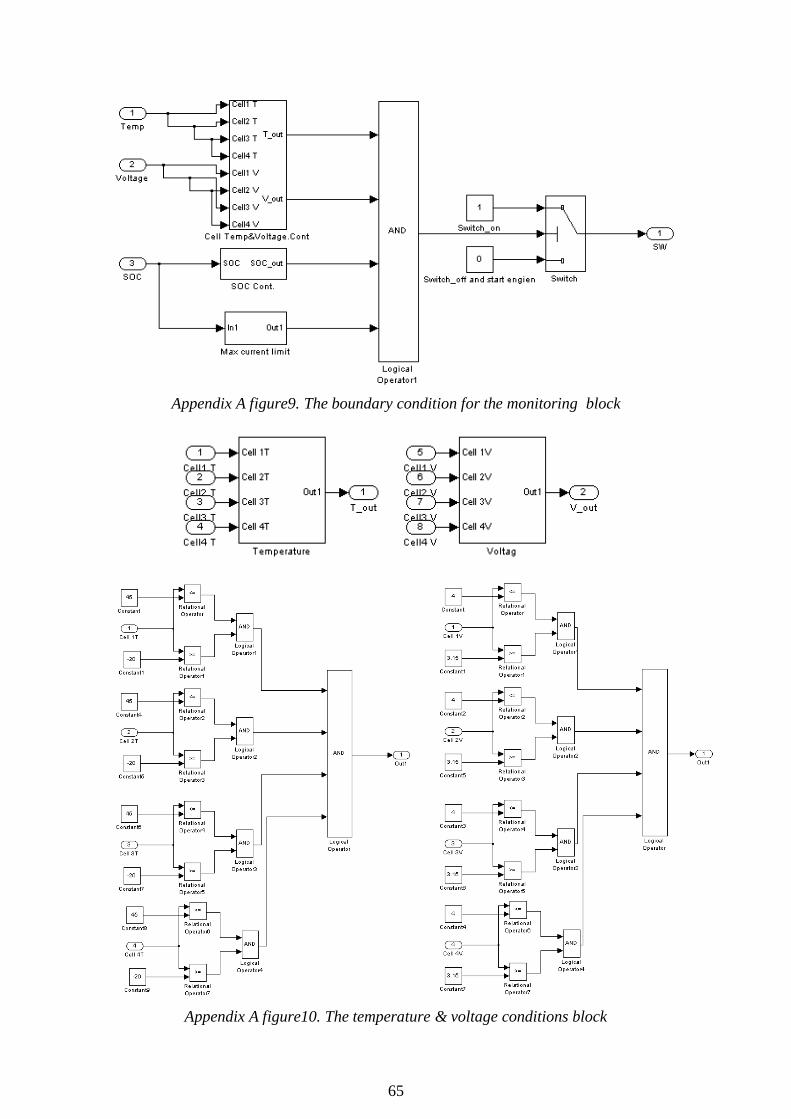
65
Appendix A figure9. The boundary condition for the monitoring block
Appendix A figure10. The temperature & voltage conditions block
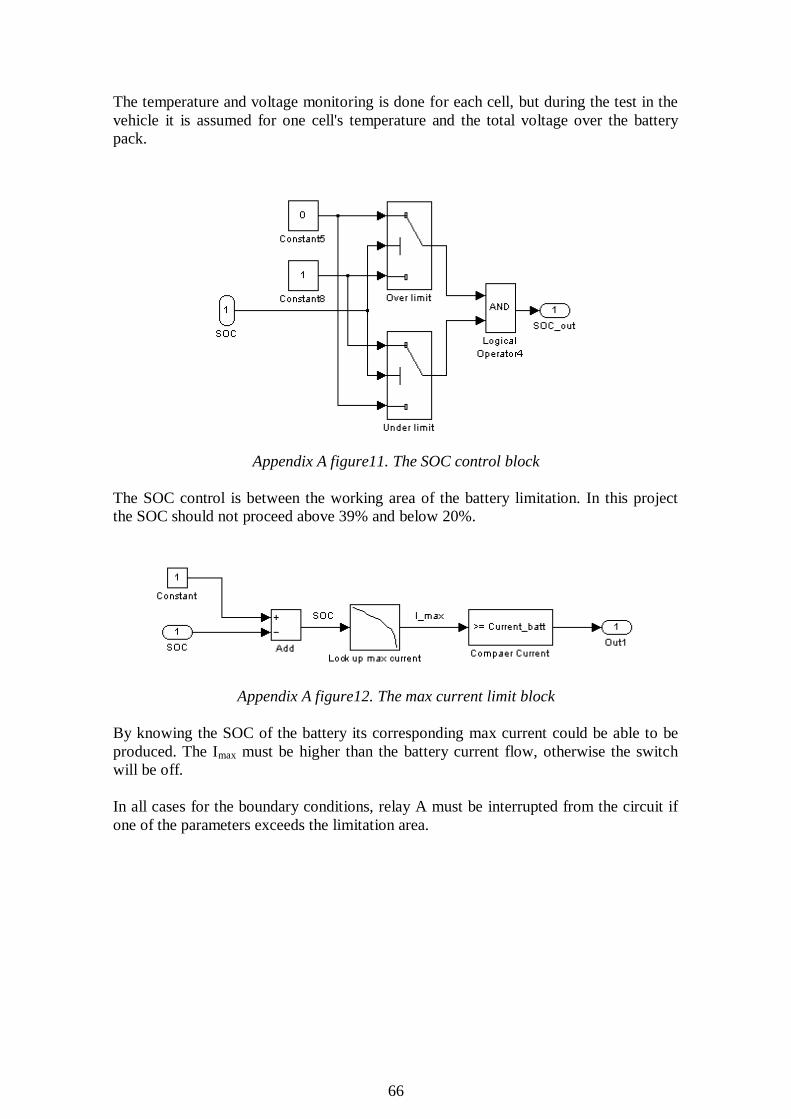
66
The temperature and voltage monitoring is done for each cell, but during the test in the
vehicle it is assumed for one cell's temperature and the total voltage over the battery
pack.
Appendix A figure11. The SOC control block
The SOC control is between the working area of the battery limitation. In this project
the SOC should not proceed above 39% and below 20%.
Appendix A figure12. The max current limit block
By knowing the SOC of the battery its corresponding max current could be able to be
produced. The Imax must be higher than the battery current flow, otherwise the switch
will be off.
In all cases for the boundary conditions, relay A must be interrupted from the circuit if
one of the parameters exceeds the limitation area.