24 march 2011 06:00 utc incident and emergency centre
TRANSCRIPT
Page 1 of 12
3/24/2011 6:40:00 AM
Incident and Emergency Centre
Subject: Status of the Fukushima Daiichi nuclear power plant The Incident and Emergency Centre (IEC) is continuing to monitor the status of the nuclear power plants in Japan following the earthquake. Based on information received by 06:00 UTC on March 24, 2011 the following updated information related to the reactor units at the Fukushima Daiichi Nuclear Power Plant is provided:
Status of the Fukushima Daiichi Nuclear Power Plant
AC Power—Units 1 to 4
The restoration work of off-site power is still in progress. Power distribution panels (Power Center) in Units 2 and 4 have been connected to off-site electricity supply. Individual components are being checked prior to being energized. The lighting in unit 3 control room has been restored. Some instrumentation was recovered for units 1, 2 and 4. Workers for Unit 3 and 4 were temporarily evacuated due to black smoke which appeared from Unit 3 at 07:20 UTC. Workers returned to work from 20:35 UTC on March 23 when no more smoke was confirmed. Due to the extent of damage inflicted by the earthquake and tsunami, it is not possible to estimate when equipment may be returned to service.
AC Power—Units 5 and 6
Power has been restored to a transformer and is being provided to Unit 5 and Unit 6 houseloads.
Unit 1 Seawater continues to be injected into the reactor pressure vessel (about 10 m3/h as of 17:35 UTC on March 23). The temperature at the feed water nozzle of Reactor Pressure Vessel (RPV) is decreased to 243oC and at the bottom of RPV to 229 oC (previous measurments 305 oC and 306 oC respectively).
The dose rate in containment vessel (D/W) and suppression chamber (S/C) has decreased slightly to 44 Sv/h and 27.9 Sv/h, respectively.
The pressure history in the RPV and Containment Vessel and presented in the following graph.
24 MARCH 2011 06:00 UTC

Page 2 of 12
3/24/2011 6:40:00 AM
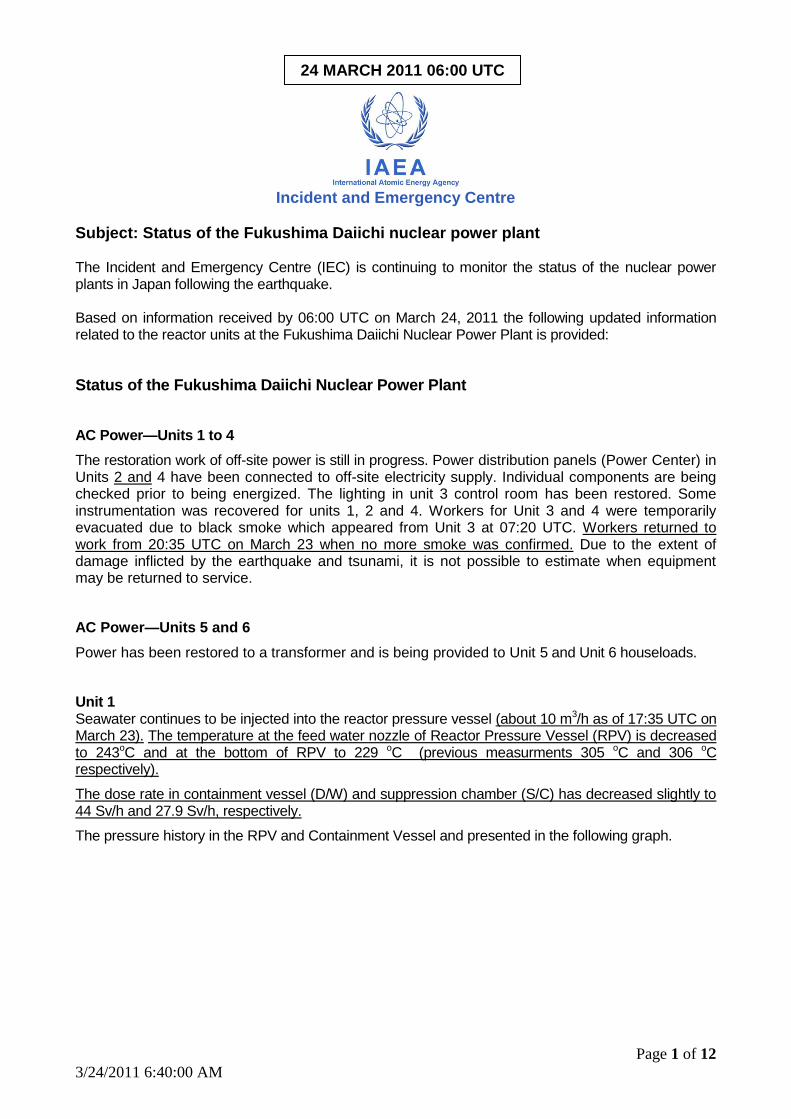
Unit 2 Injection of seawater (18 ton) to the Spent Fuel Pool was carried out. The cumulative total amount of water sprayed is now 58 t. Seawater injection to RPV continues with a flow rate of 11 m3/h. The RPV temperature at the feed water nozzle and at the bottom head of RPV are stable (102 oC and 109 oC respectively). The dose rates in the containment vessel (D/W) and the suppression chamber (S/C) are decreased slightly to 49.3 Sv/h and 1.49 Sv/h, respectively. The RPV and Containment Vessel pressure is shown in the following graph.
0.00
1.00
2.00
3.00
4.00
5.00
6.00
Mar-14 Mar-15 Mar-16 Mar-17 Mar-18 Mar-19 Mar-20 Mar-21 Mar-22 Mar-23 Mar-24
Fukushima Daiichi Unit-1 Reactor Vessel, Contaiment Vessel & Suppression Pool Pressure
U-1 Reactor pressure A (atm) U-1 Reactor pressure B (atm)
U-1 Primary Containment Pressure (atm) U-1 Suppression pool pressure (atm)
Page 3 of 12
3/24/2011 6:40:00 AM
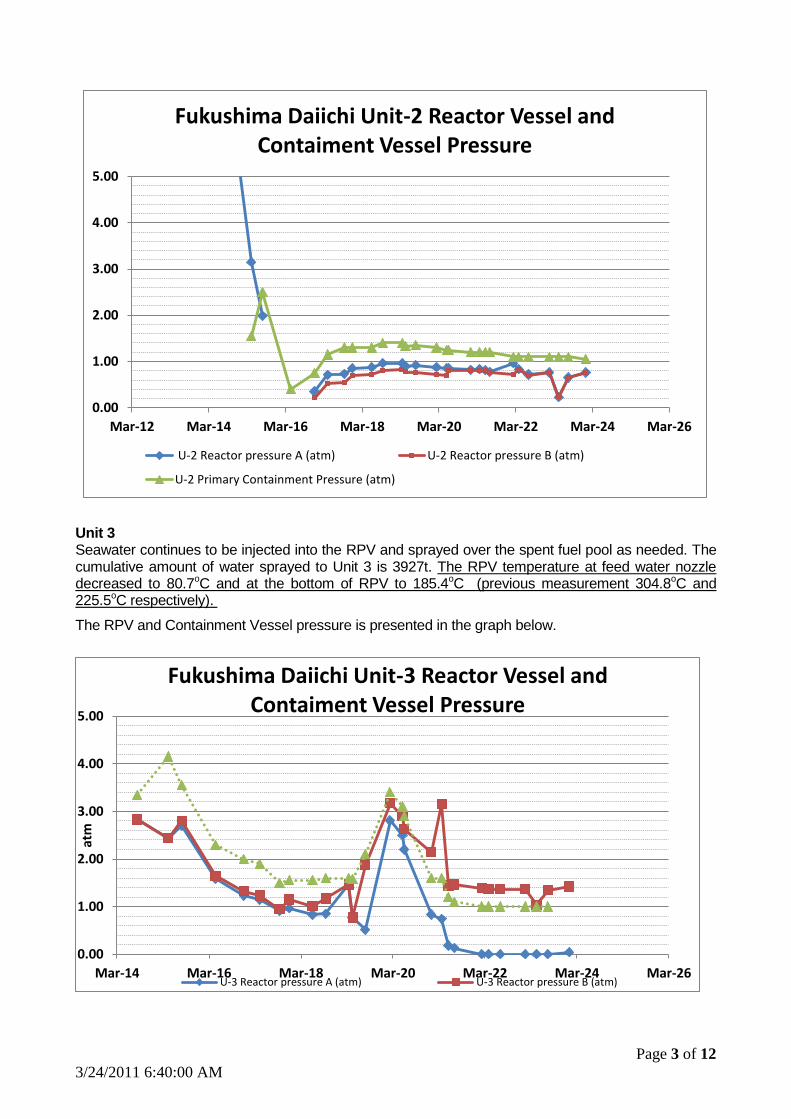
Unit 3 Seawater continues to be injected into the RPV and sprayed over the spent fuel pool as needed. The cumulative amount of water sprayed to Unit 3 is 3927t. The RPV temperature at feed water nozzle decreased to 80.7oC and at the bottom of RPV to 185.4oC (previous measurement 304.8oC and 225.5oC respectively).
The RPV and Containment Vessel pressure is presented in the graph below.
0.00
1.00
2.00
3.00
4.00
5.00
Mar-12 Mar-14 Mar-16 Mar-18 Mar-20 Mar-22 Mar-24 Mar-26
Fukushima Daiichi Unit-2 Reactor Vessel and Contaiment Vessel Pressure
U-2 Reactor pressure A (atm) U-2 Reactor pressure B (atm)
U-2 Primary Containment Pressure (atm)
0.00
1.00
2.00
3.00
4.00
5.00
Mar-14 Mar-16 Mar-18 Mar-20 Mar-22 Mar-24 Mar-26
atm
Fukushima Daiichi Unit-3 Reactor Vessel and Contaiment Vessel Pressure
U-3 Reactor pressure A (atm) U-3 Reactor pressure B (atm)

Page 4 of 12
3/24/2011 6:40:00 AM
Unit 4 Water was poured into the spent fuel pool at a rate of 50 m3/h using a concrete pump for 3 hours on 22nd March . Starting from 01:00 UTC till 04:02 UTC on March 23, 130 t of water was poured in using a concrete pump truck at 50 m3/h. The cumulative amount of water sprayed to Unit 4 is 535 t.
Unit 5 The reactor remains in cold shutdown. The reactor water temperature increased to 71.4oC as RHR pump has stopped when power was switched from temporary to normal. Spent Fuel Pool water temperature increased slightly to 45.1oC.
Unit 6
The reactor remains in cold shutdown. Power was switched from the diesel generator to off-site power.The RPV water temperature descreased to 24.1 oC. Spent Fuel Pool water temperature is
increased slightly to 23.5oC.

Page 5 of 12
3/24/2011 6:40:00 AM
Units 1, 2, 3, 4, 5 and 6 - Plant Status
Parameter / Indications Unit Fukushima Daiichi
Unit 1 Unit 2 Unit 3 Unit 4 Unit 5 Unit 6
Reactor Pressure Vessel Pressure
MPa 0.511 (A)
0.488 (B)
0.076 (A)
0.076 (B)
0.004 (C)
0.142 (A)
- 0.108 0.109
atm 5.11 (A)
4.88 (B)
0.76 (A)
0.76 (B)
0.04 (A)
1.42 (B)
- 1.08 1.09
Containment Vessel (Drywell) Pressure kPa 385 105 Below the scale - - -
atm 3.85 1.05 Below the scale - - -
Reactor Pressure Vessel Level mm (above the top of active fuel)
-1700 (A)
-1700 (B)
-1200 (A)
(B) not available
-1800 (A)
-2300 (B) - 1846 2397
Suppression Pool Temperature °C No Data No Data No Data No Data No Data No Data
Suppression Pool Pressure kPa 370
Below the scale Below the scale - - - atm 3.70
Adding water to Reactor Pressure Vessel
Adding
Not adding
Unknown
Seawater continues to be injected into the reactor pressure vessels as needed.
-
Injection to RPV and the Spent Fuel Pool using make up water
Injection to RPV and the Spent Fuel Pool using make up water
Date/Time of Data Acquisition March 23
16:00 UTC
March 23
16:00 UTC
March 23
17:40 UTC -
March 23
20:00 UTC
March 23
20:00 UTC
* All pressures are absolute pressure (pressure including normal atmospheric pressure)
**(A) and (B) refer to two measurement channels
Page 6 of 12
3/24/2011 6:40:00 AM
Radiation Monitoring Data
Daiichi NPP – On-Site Monitoring
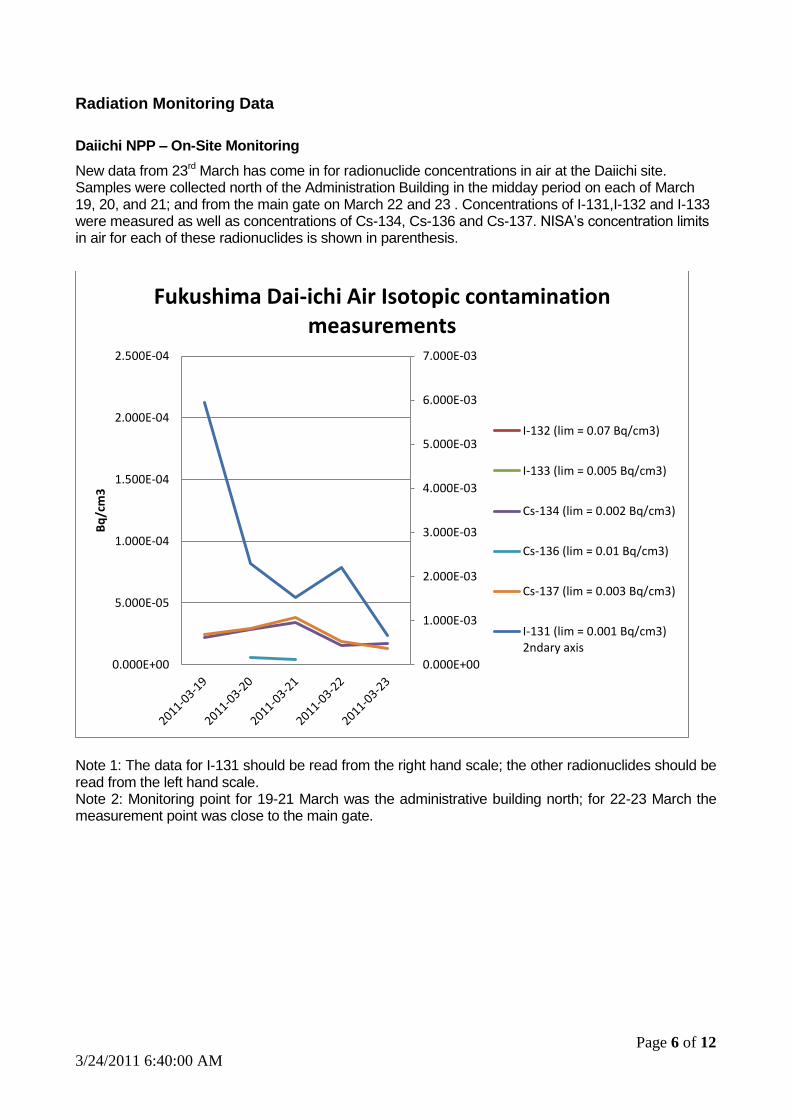
New data from 23rd March has come in for radionuclide concentrations in air at the Daiichi site. Samples were collected north of the Administration Building in the midday period on each of March 19, 20, and 21; and from the main gate on March 22 and 23 . Concentrations of I-131,I-132 and I-133 were measured as well as concentrations of Cs-134, Cs-136 and Cs-137. NISA’s concentration limits in air for each of these radionuclides is shown in parenthesis.
Note 1: The data for I-131 should be read from the right hand scale; the other radionuclides should be read from the left hand scale. Note 2: Monitoring point for 19-21 March was the administrative building north; for 22-23 March the measurement point was close to the main gate.
0.000E+00
1.000E-03
2.000E-03
3.000E-03
4.000E-03
5.000E-03
6.000E-03
7.000E-03
0.000E+00
5.000E-05
1.000E-04
1.500E-04
2.000E-04
2.500E-04
Bq
/cm
3
Fukushima Dai-ichi Air Isotopic contamination measurements
I-132 (lim = 0.07 Bq/cm3)
I-133 (lim = 0.005 Bq/cm3)
Cs-134 (lim = 0.002 Bq/cm3)
Cs-136 (lim = 0.01 Bq/cm3)
Cs-137 (lim = 0.003 Bq/cm3)
I-131 (lim = 0.001 Bq/cm3)2ndary axis
Page 7 of 12
3/24/2011 6:40:00 AM
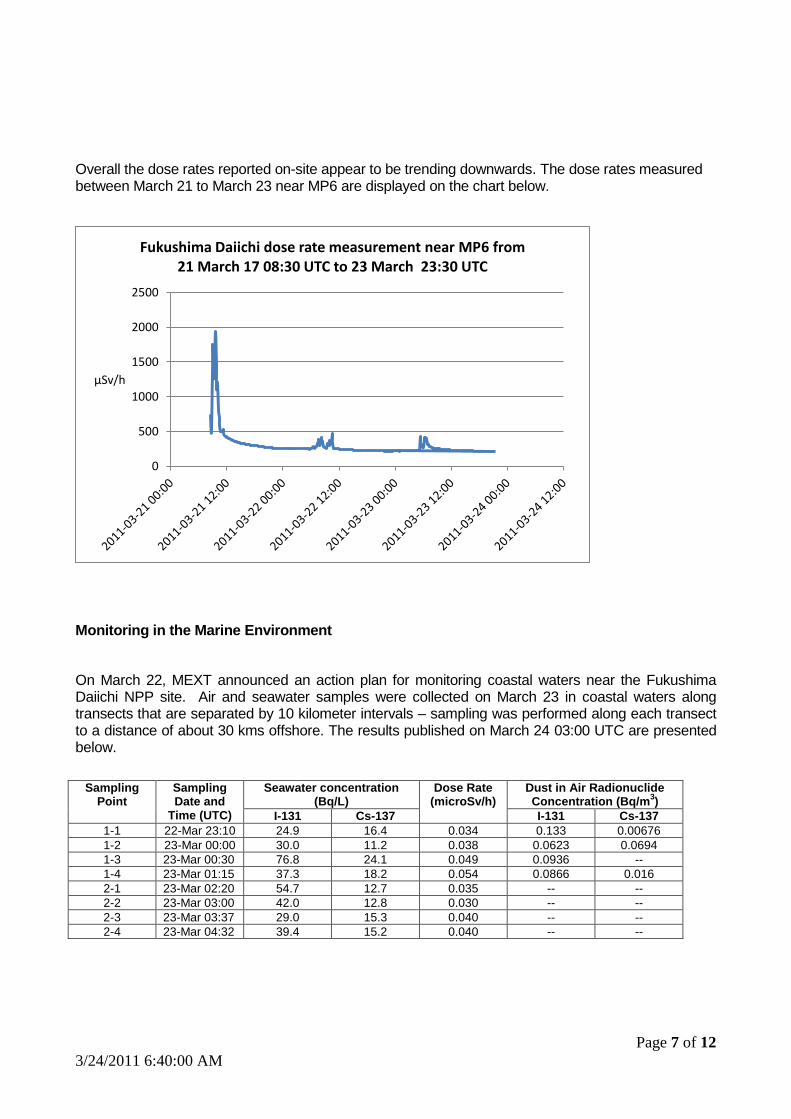
Overall the dose rates reported on-site appear to be trending downwards. The dose rates measured between March 21 to March 23 near MP6 are displayed on the chart below.
Monitoring in the Marine Environment
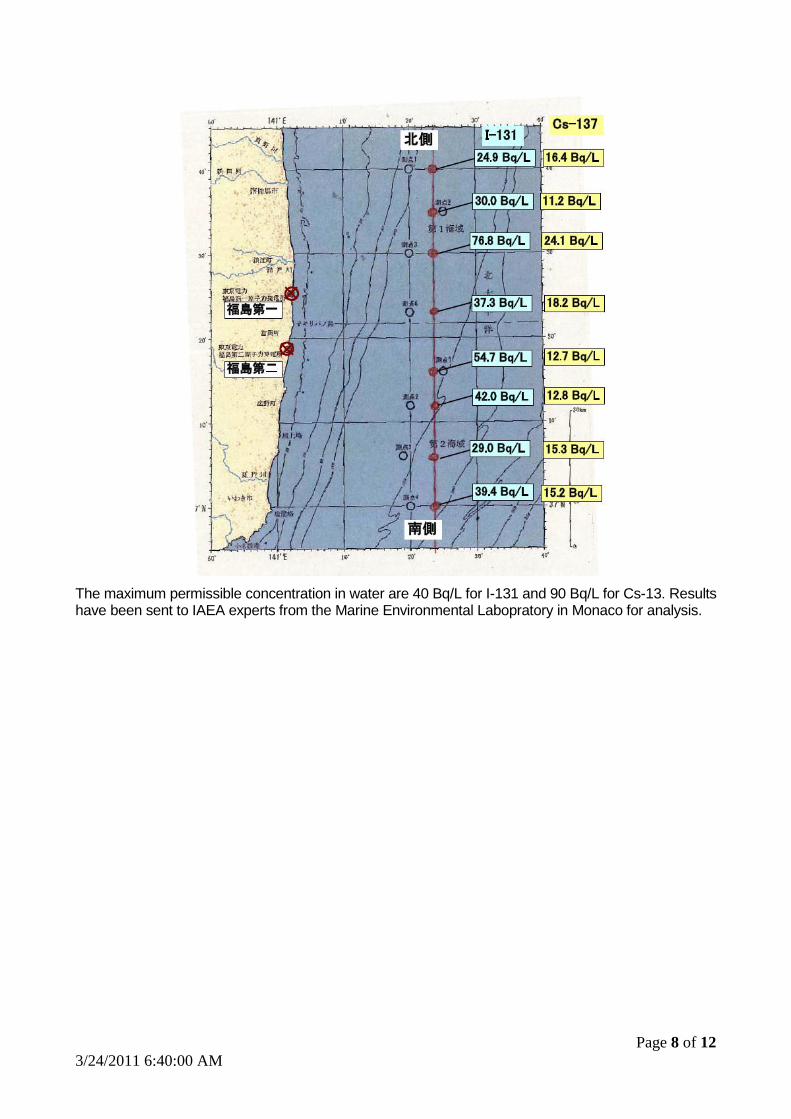
On March 22, MEXT announced an action plan for monitoring coastal waters near the Fukushima Daiichi NPP site. Air and seawater samples were collected on March 23 in coastal waters along transects that are separated by 10 kilometer intervals – sampling was performed along each transect to a distance of about 30 kms offshore. The results published on March 24 03:00 UTC are presented below.
Sampling
Point Sampling Date and
Time (UTC)
Seawater concentration (Bq/L)
Dose Rate (microSv/h)
Dust in Air Radionuclide Concentration (Bq/m
3)
I-131 Cs-137 I-131 Cs-137
1-1 22-Mar 23:10 24.9 16.4 0.034 0.133 0.00676
1-2 23-Mar 00:00 30.0 11.2 0.038 0.0623 0.0694
1-3 23-Mar 00:30 76.8 24.1 0.049 0.0936 --
1-4 23-Mar 01:15 37.3 18.2 0.054 0.0866 0.016
2-1 23-Mar 02:20 54.7 12.7 0.035 -- --
2-2 23-Mar 03:00 42.0 12.8 0.030 -- --
2-3 23-Mar 03:37 29.0 15.3 0.040 -- --
2-4 23-Mar 04:32 39.4 15.2 0.040 -- --
0
500
1000
1500
2000
2500
µSv/h
Fukushima Daiichi dose rate measurement near MP6 from 21 March 17 08:30 UTC to 23 March 23:30 UTC
Page 8 of 12
3/24/2011 6:40:00 AM
The maximum permissible concentration in water are 40 Bq/L for I-131 and 90 Bq/L for Cs-13. Results have been sent to IAEA experts from the Marine Environmental Labopratory in Monaco for analysis.

Page 9 of 12
3/24/2011 6:40:00 AM
Deposition Data by Prefecture
Deposition of I-131 and Cs-137 have been reported in about 10 prefectures. As the Table below illustrates, deposition rates vary appreciably from one day to the next. If rainfall occurs, there can be substantial changes in deposition (i.e. wet deposition). This may explain the increased deposition in Tokyo between the March 20-21 and March 21-22 measurements. New and updated data is underlined.
Deposition (Bq/m2) measured during a 24 hour period, from 9:00 to 9:00
Mar 18-19 Mar 19-20 Mar 20-21 Mar 21-22
Location I-131 Cs-137 I-131 Cs-137 I-131 Cs-137 I-131 Cs-137
Iwate(Morioka) ND ND ND 0.24 4800 690 ND ND Yamagata(Yamagata) ND ND 22 20 58000 4300 590 140 Ibaraki - - 490 48 93000 13000 85000 12000 Tochigi(Utsunomiya) 1300 62 540 45 5300 250 25000 440 Gunma(Maebashi) 230 84 190 63 990 87 1500 72 Saitama(Saitama) 64 ND 66 ND 7200 790 22000 1600 Chiba(Ichihara) 21 ND 44 3.8 1100 110 14000 2800 Tokyo(Shinjyuku) 51 ND 40 ND 2900 560 32000 5300 Yamanashi(Kouhu) 175 ND ND ND ND ND 4400 400
Deposition (Bq/m2) measured during a 24 hour period, from 9:00 to 9:00 Mar 22-23
Location I-131 Cs-137
Iwate(Morioka) 23 13 Yamagata(Yamagata) 2100 1900 Ibaraki 27000 420 Tochigi(Utsunomiya) 23000 99 Gunma(Maebashi) 310 ND Saitama(Saitama) 22000 320 Chiba(Ichihara) 22000 360 Tokyo(Shinjyuku) 36000 340 Yamanashi(Kouhu) 110 26
ND = not detected.
Page 10 of 12
3/24/2011 6:40:00 AM
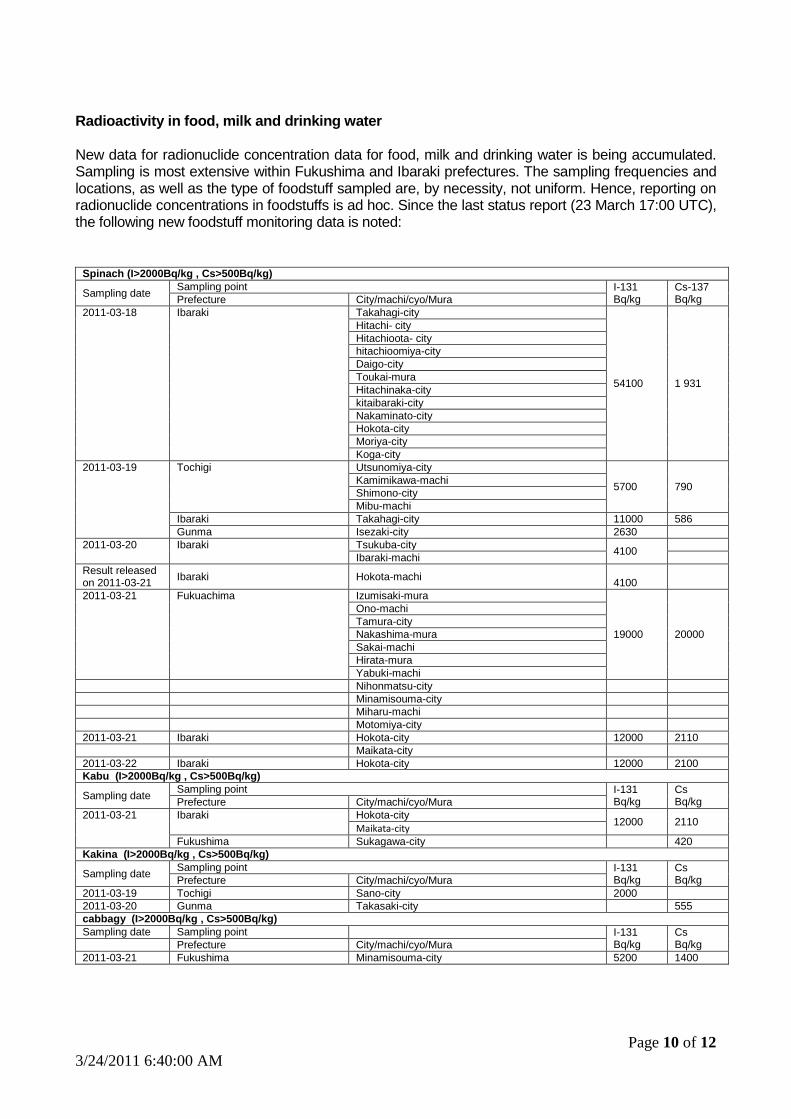
Radioactivity in food, milk and drinking water New data for radionuclide concentration data for food, milk and drinking water is being accumulated. Sampling is most extensive within Fukushima and Ibaraki prefectures. The sampling frequencies and locations, as well as the type of foodstuff sampled are, by necessity, not uniform. Hence, reporting on radionuclide concentrations in foodstuffs is ad hoc. Since the last status report (23 March 17:00 UTC), the following new foodstuff monitoring data is noted:
Spinach (I>2000Bq/kg , Cs>500Bq/kg)
Sampling date Sampling point I-131
Bq/kg Cs-137 Bq/kg Prefecture City/machi/cyo/Mura
2011-03-18 Ibaraki Takahagi-city
54100 1 931
Hitachi- city
Hitachioota- city
hitachioomiya-city
Daigo-city
Toukai-mura
Hitachinaka-city
kitaibaraki-city
Nakaminato-city
Hokota-city
Moriya-city
Koga-city
2011-03-19 Tochigi Utsunomiya-city
5700 790 Kamimikawa-machi
Shimono-city
Mibu-machi
Ibaraki Takahagi-city 11000 586
Gunma Isezaki-city 2630
2011-03-20 Ibaraki Tsukuba-city 4100
Ibaraki-machi
Result released on 2011-03-21
Ibaraki Hokota-machi 4100
2011-03-21 Fukuachima Izumisaki-mura
19000 20000
Ono-machi
Tamura-city
Nakashima-mura
Sakai-machi
Hirata-mura
Yabuki-machi
Nihonmatsu-city
Minamisouma-city
Miharu-machi
Motomiya-city
2011-03-21 Ibaraki Hokota-city 12000 2110
Maikata-city
2011-03-22 Ibaraki Hokota-city 12000 2100
Kabu (I>2000Bq/kg , Cs>500Bq/kg)
Sampling date Sampling point I-131
Bq/kg Cs Bq/kg Prefecture City/machi/cyo/Mura
2011-03-21 Ibaraki Hokota-city 12000 2110
Maikata-city Fukushima Sukagawa-city 420
Kakina (I>2000Bq/kg , Cs>500Bq/kg)
Sampling date Sampling point I-131
Bq/kg Cs Bq/kg Prefecture City/machi/cyo/Mura
2011-03-19 Tochigi Sano-city 2000
2011-03-20 Gunma Takasaki-city 555
cabbagy (I>2000Bq/kg , Cs>500Bq/kg)
Sampling date Sampling point I-131 Bq/kg
Cs Bq/kg Prefecture City/machi/cyo/Mura
2011-03-21 Fukushima Minamisouma-city 5200 1400

Page 11 of 12
3/24/2011 6:40:00 AM
Buroccory (I>2000Bq/kg , Cs>500Bq/kg)
Sampling date Sampling point I-131 Bq/kg
Cs Bq/kg Prefecture City/machi/cyo/Mura
2011-03-21 Fukushima Iitate-mura
17000 7000
Iwaki-chity
Kagami-city
Kunimi-machi
Kuwaori-machi
Date-city
Miharu-machi Kukitana (I>2000Bq/kg , Cs>500Bq/kg)
Sampling date Sampling point I-131 Bq/kg
Cs Bq/kg
Prefecture City/machi/cyo/Mura
2011-03-21 Fukushima Ootama-mura 15000 41000
Motomiya-city
Aburana (I>2000Bq/kg , Cs>500Bq/kg)
Sampling date Sampling point I-131 Bq/kg
Cs Bq/kg
Prefecture City/machi/cyo/Mura
2011-03-21 Fukushima Shirakawa-city 8200 4600
Tamagawa-mura
Chijirena (I>2000Bq/kg , Cs>500Bq/kg)
Sampling date Sampling point I-131 Bq/kg
Cs Bq/kg
Prefecture City/machi/cyo/Mura
2011-03-21 Fukushima Tanakura-machi 3700 4600
Koutaisai (I>2000Bq/kg , Cs>500Bq/kg)
Sampling date Sampling point I-131 Bq/kg
Cs Bq/kg
Prefecture City/machi/cyo/Mura
2011-03-21 Fukushima Nihonmatsu-city 5400 5400
Santona (I>2000Bq/kg , Cs>500Bq/kg)
Sampling date Sampling point I-131 Bq/kg
Cs Bq/kg
Prefecture City/machi/cyo/Mura
2011-03-21 Fukushima Saigou-mura 4900 12000
Shinobufuyuna (I>2000Bq/kg , Cs>500Bq/kg)
Sampling date Sampling point I-131 Bq/kg
Cs Bq/kg
Prefecture City/machi/cyo/Mura
2011-03-21 Fukushima Kawamata-machi 22000 14000
Water, I-131 exceeded permissible level of food (>300Bq/kg)
Sampling date and time Sampling point I-131 Bq/kg
Prefecture City/machi/cyo/Mura
2011-03-17 13:04 Fukushima Tamura-city 348
2011-03-18 11:50 Tamura-city 317
2011-03-20 12:30 Iitate-mura 965
2011-03-21 08:30 492
2011-03-21 450
430
Water, I-131 exceeded permissible level for baby (>100Bq/kg)
Sampling date and time Sampling point I-131 Bq/kg
Prefecture City/machi/cyo/Mura
2011-03-18 11:45 Fukushima Kawamata-machi 293
Minamisouma-city 105
2011-03-19 11:00 Fukushima Kawamata-machi 130
2011-03-19 13:00 Fukushima Minamisouma-city 185
2011-03-19 Fukushima Tamura-city 161
Result released on 2011-03-21 Fukushima Date-city 120
Kooriyama-city 150
2011-03-21 Ffukushima Kawamata-machi 174
Minamisouma-city 137
Iwaki-city 103
2011-03-22 Tokyo Kanamachi water supply plant area 210
2011-03-23 Ibaraki Toukaimura 188.7

Page 12 of 12
3/24/2011 6:40:00 AM
Milk (I-131>300Bq/kg , Cs>200Bq/kg)
Sampling date Sampling point I-131 Bq/kg
Cs-137 Bq/kg
Prefecture City/machi/Cyo/Mura
2011-03-16 Fukushima Kawamata machi 1190
2011-03-17 Fukushima Kawamata machi 1510
2011-03-18 Fukushima Kawamata machi 932
2011-03-19 Fukushima Iwaki-city 5200 210
Kunimi-tyou
Shinti-machi
Fukushima-Iitate-mura
2011-03-20 Fukushima Fukushima-Kawamata-machi 5300
2011-03-19~21 Ibaraki Ibaraki-Mito-City 1700
Ibaraki-Kawauchi-machi
IAEA Radiation Monitoring
On March 23, the IAEA radiation monitoring team took additional measurements at distances from 30 to 73 km from the Fukushima nuclear power plant. Results from gamma dose-rate measurements in air ranged from 0.2 to 6.9 microsievert per hour. The beta-gamma contamination measurements ranged from 0.02 to 0.6 Megabecquerel per square meter.
The second IAEA monitoring team has now arrived in Japan. The two teams in Japan will continue to work closely with the Japanese authorities. Monitoring will be undertaken in the areas of Fukushima and Tokyo. Measurements will be taken to determine more precisely the actual composition of the radionuclides that have been deposited.
Canada radiation monitoring data
Health Canada has started to share its environmental monitoring data with the IEC. Data has been provided from the Canadian CTBT radionuclide stations, noble gas and aerosols (filters) and the Fixed Point Surveillance (FPS) network of dose rate monitors located throughout Canada. These data are being analysed by the IEC. Canada will also share the results of the weekly filter samples from the regular Canadian sites, first results from these are expected by the end of the week.
Hilaire Mansoux
Emergency Response Manager
24-March-2011 06.00 UTC