2.5-2.8 - ch. 8 notes.notebook - ddtwo.org
TRANSCRIPT
2.52.8 Ch. 8 Notes.notebook
1
October 04, 2019
Sep 228:07 AM
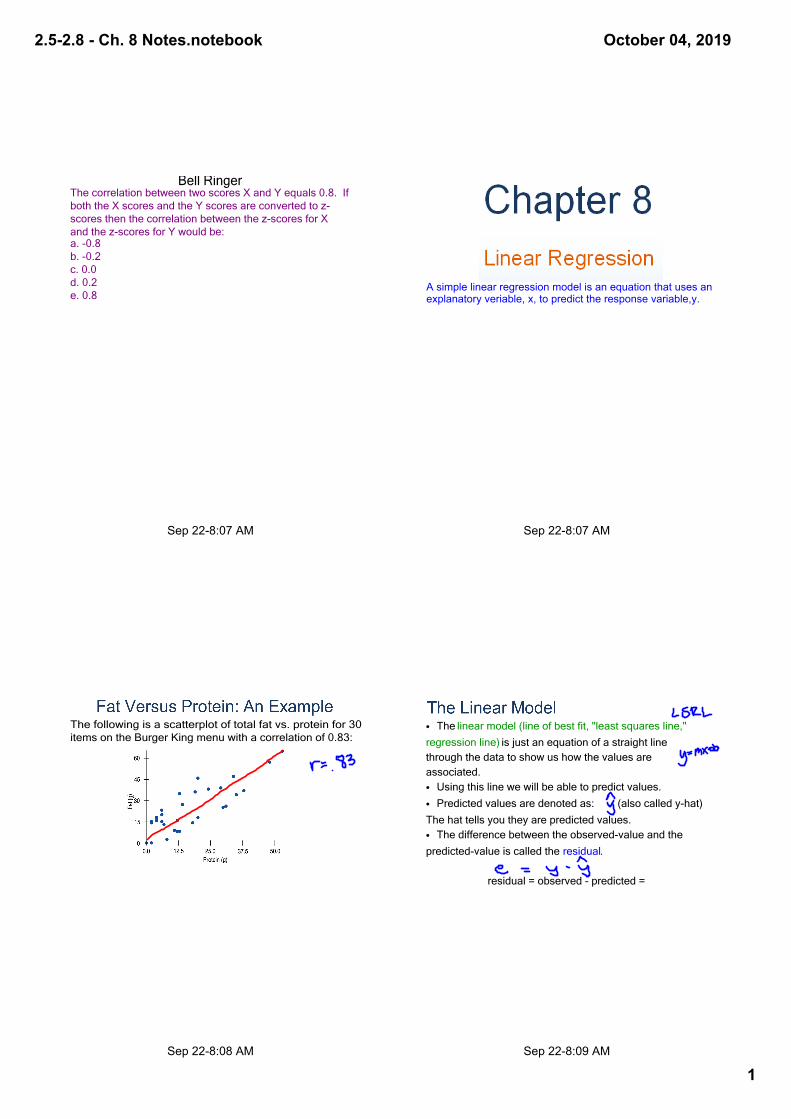
Bell RingerThe correlation between two scores X and Y equals 0.8. If both the X scores and the Y scores are converted to zscores then the correlation between the zscores for X and the zscores for Y would be:a. 0.8b. 0.2c. 0.0d. 0.2e. 0.8
Sep 228:07 AM
A simple linear regression model is an equation that uses an explanatory veriable, x, to predict the response variable,y.
Sep 228:08 AM
The following is a scatterplot of total fat vs. protein for 30 items on the Burger King menu with a correlation of 0.83:
Sep 228:09 AM
• The linear model (line of best fit, "least squares line," regression line) is just an equation of a straight line through the data to show us how the values are associated.• Using this line we will be able to predict values.
• Predicted values are denoted as: (also called yhat) The hat tells you they are predicted values.• The difference between the observedvalue and the predictedvalue is called the residual.
residual = observed predicted =
2.52.8 Ch. 8 Notes.notebook
2
October 04, 2019
Sep 228:14 AM
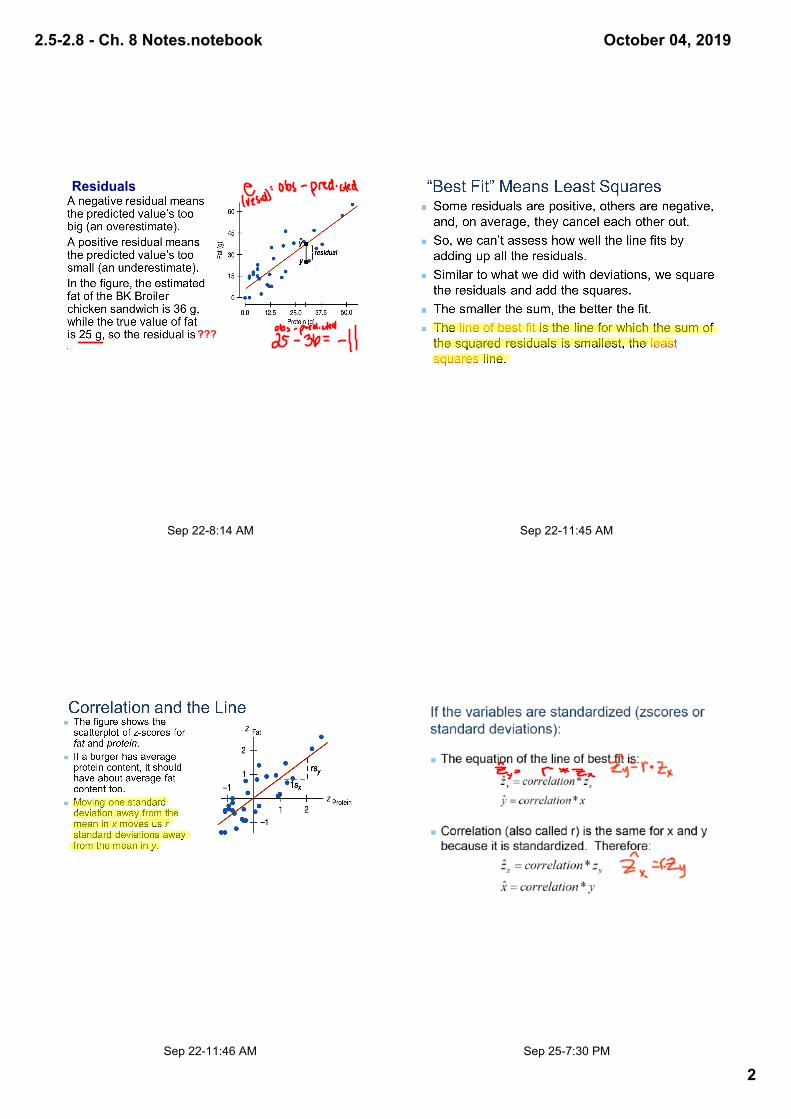
???
Residuals
Sep 2211:45 AM
Sep 2211:46 AM Sep 257:30 PM

2.52.8 Ch. 8 Notes.notebook
3
October 04, 2019
Sep 2211:46 AM Sep 2211:47 AM
Sep 257:31 PM
Example 1: A scatterplot of house prices vs. house size for houses shows a relationship that is straight, with only moderate scatter and no outliers. The correlation between house price and house size is 0.77.
a. You go to an open house and find the house is 1 standard deviation above the mean in size. What would you guess about its price?
b. You read an ad for a house priced 2 standard deviations
below the mean. What would you guess about its size?
c. A friend tells you about a house whose size in square
meters (he's European) is 1.5 standard deviations above the mean. What would you guess about its size in square feet?
Sep 2211:47 AM
2.52.8 Ch. 8 Notes.notebook
4
October 04, 2019
Sep 2211:48 AM Sep 2211:48 AM
Sep 2211:49 AM Mar 78:38 PM
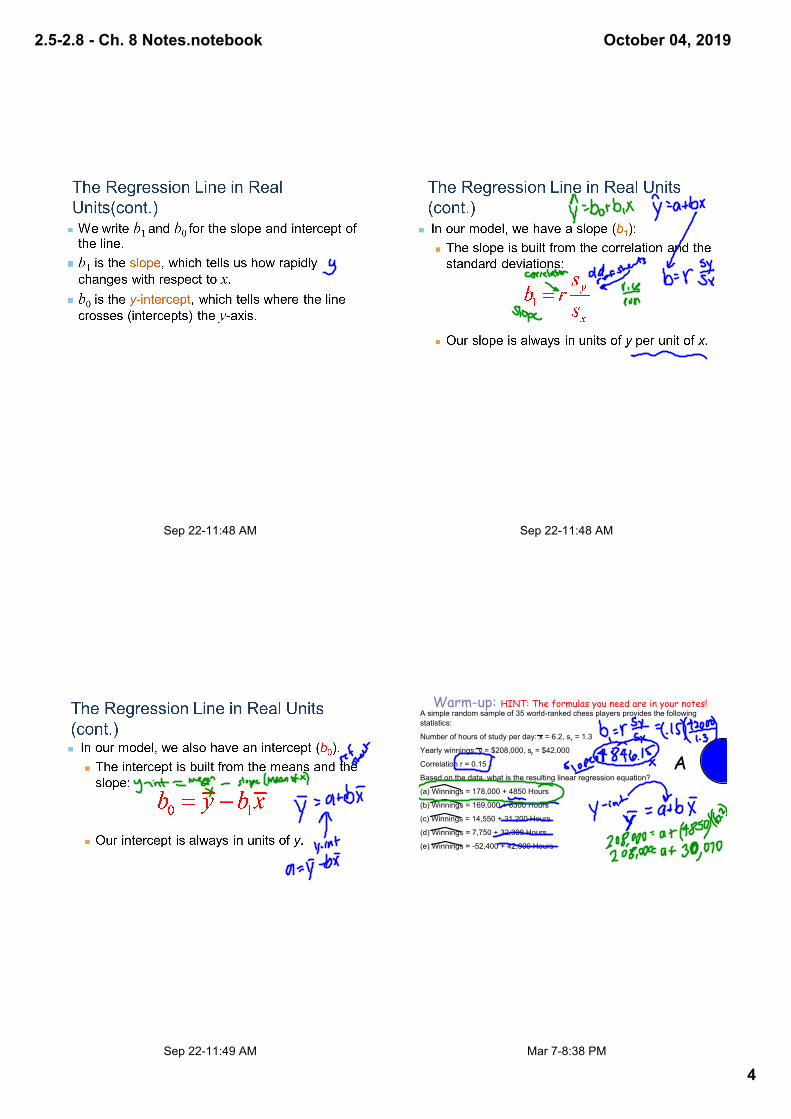
Warm-up: HINT: The formulas you need are in your notes!A simple random sample of 35 worldranked chess players provides the following statistics:
Number of hours of study per day: x = 6.2, sx = 1.3
Yearly winnings: y = $208,000, sy = $42,000
Correlation r = 0.15
Based on the data, what is the resulting linear regression equation?
(a) Winnings = 178,000 + 4850 Hours
(b) Winnings = 169,000 + 6300 Hours
(c) Winnings = 14,550 + 31,200 Hours
(d) Winnings = 7,750 + 32,300 Hours
(e) Winnings = 52,400 + 42,000 Hours
A

2.52.8 Ch. 8 Notes.notebook
5
October 04, 2019
Sep 2211:49 AM
What is the predicted fat content for a BK Broiler chicken sandwich (with 30 g of protein)?
Sep 257:38 PM
To find the regression line (in real units):
1) You may be given the standard deviations, correlation and means
2) OR...You may be given raw data.
3) OR computer printout
Sep 2211:52 AM Oct 17:43 PM
Example 2: The linear model relating hurricanes' wind speeds to their central pressure was:
Predicted MaxWindSpeed = 955.27 (.897)CentralPressure
Hurricane Katrina had a central pressure measured at 920 millibars. What does our regression model predict for her maximum wind speed? How good is that prediction, given that Katrina's actual wind speed was measured at 110 knots?
Interpret the above model. What does the slope mean in
this context? Does the intercept have a meaningful
interpretation?

2.52.8 Ch. 8 Notes.notebook
6
October 04, 2019
Sep 288:59 PM
1. How do you find a residual?
2. How do you know if the actual value isabove, below, or on the LSRL?
3. What is the correlation coefficient?
4. What is a residual plot tell us?
Warmup
Oct 17:50 AM
Residual the vertical distance between theobservation and the LSRL
the sum of the residuals is ALWAYS zero
(resid ws)
Oct 185:23 PM
Plot the points on the scatter plot and find the equation of the LSRL and the correlation coefficient. (#1 and #2)
Oct 185:23 PM
Plot the points on the scatter plot and find the equation of the LSRL and the correlation coefficient. (#1 and #2)
2.52.8 Ch. 8 Notes.notebook
7
October 04, 2019
Oct 185:26 PM
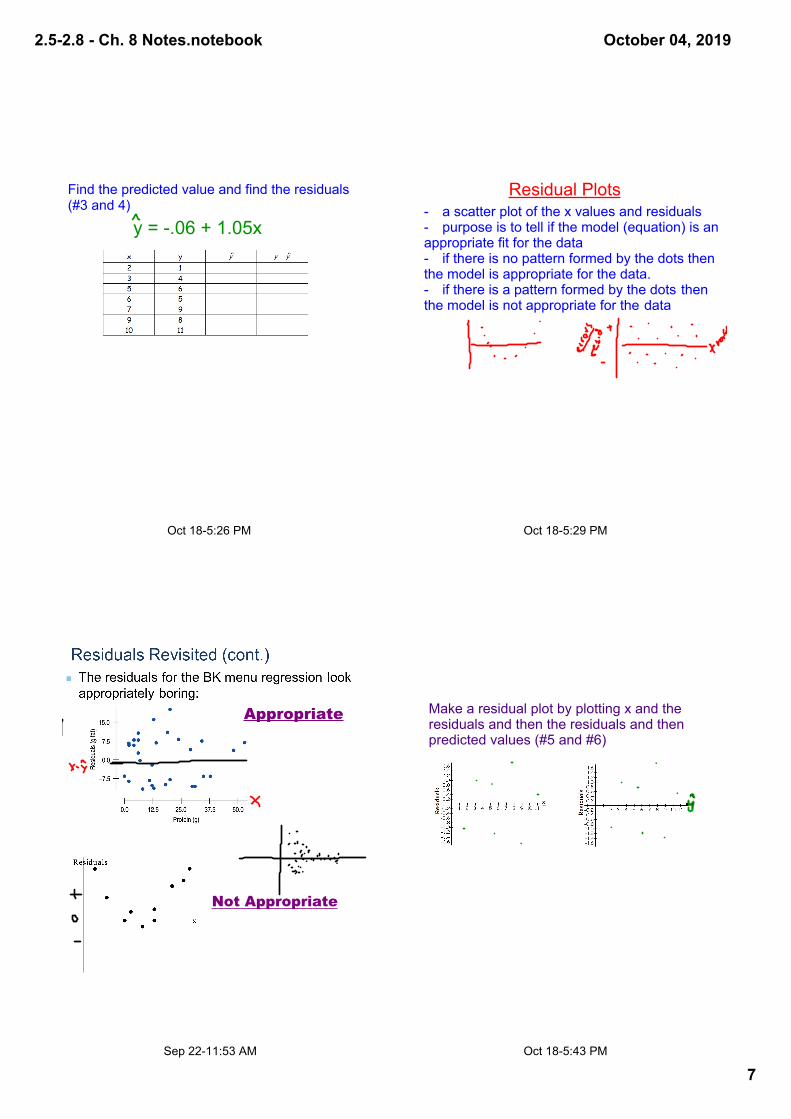
Find the predicted value and find the residuals (#3 and 4)
y = .06 + 1.05x
Oct 185:29 PM
Residual Plots a scatter plot of the x values and residuals purpose is to tell if the model (equation) is an appropriate fit for the data if there is no pattern formed by the dots then the model is appropriate for the data. if there is a pattern formed by the dots then the model is not appropriate for the data
Sep 2211:53 AM
Not Appropriate
Appropriate
Oct 185:43 PM
Make a residual plot by plotting x and the residuals and then the residuals and then predicted values (#5 and #6)

2.52.8 Ch. 8 Notes.notebook
8
October 04, 2019
Sep 288:56 PM
7. What do you notice about these 2 residual plots?
8. Is the LSRL from question 2 an appropriate model for this data? Explain.
Sep 2211:54 AM
Oct 185:47 PM
Coefficient of Determination Symbol: r2 gives the proportion of variation in y that can be attributed to an appropriate model between x and y remains the same no matter what variable is x Interpretation:
Approximately r2 % of the variation in y can be explained by the LSRL of x and y.
In the BK example, r2 = 0.69, so 69% of the variation in total fat is accounted for by variation in the protein content.
Sep 2211:56 AM
2.52.8 Ch. 8 Notes.notebook
9
October 04, 2019
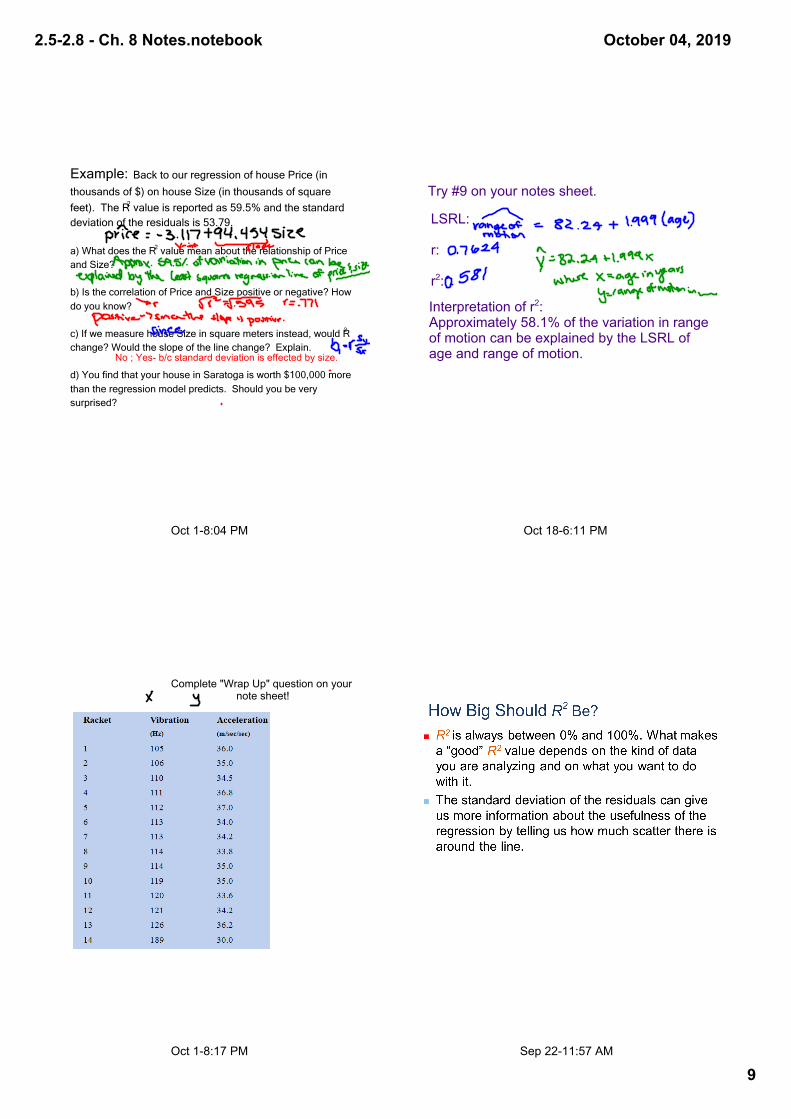
Oct 18:04 PM
Example: Back to our regression of house Price (in thousands of $) on house Size (in thousands of square feet). The R2 value is reported as 59.5% and the standard deviation of the residuals is 53.79.
a) What does the R2 value mean about the relationship of Price and Size?
b) Is the correlation of Price and Size positive or negative? How do you know?
c) If we measure house Size in square meters instead, would R2 change? Would the slope of the line change? Explain.
d) You find that your house in Saratoga is worth $100,000 more than the regression model predicts. Should you be very surprised?
No ; Yes b/c standard deviation is effected by size.
Oct 186:11 PM
LSRL:
r:
r2:
Try #9 on your notes sheet.
Interpretation of r2:Approximately 58.1% of the variation in range of motion can be explained by the LSRL of age and range of motion.
Oct 18:17 PM
Complete "Wrap Up" question on your note sheet!
Sep 2211:57 AM
2.52.8 Ch. 8 Notes.notebook
10
October 04, 2019
Oct 18:36 PM
1. Which of the following is not true of a correlation coefficient?
(a) The correlation coefficient can be estimated from the steepness of the line of best fit.(b) The sign of the correlation coefficient is the same as the sign of the slope of the regression line.(c) A low correlation coefficient does not necessarily indicate a weak relationship between the variables.(d) Two sets of bivariate data can have approximately equal correlation coefficients but very different scatterplots.(e) All of these are true.
Warmup
Sep 289:18 PM
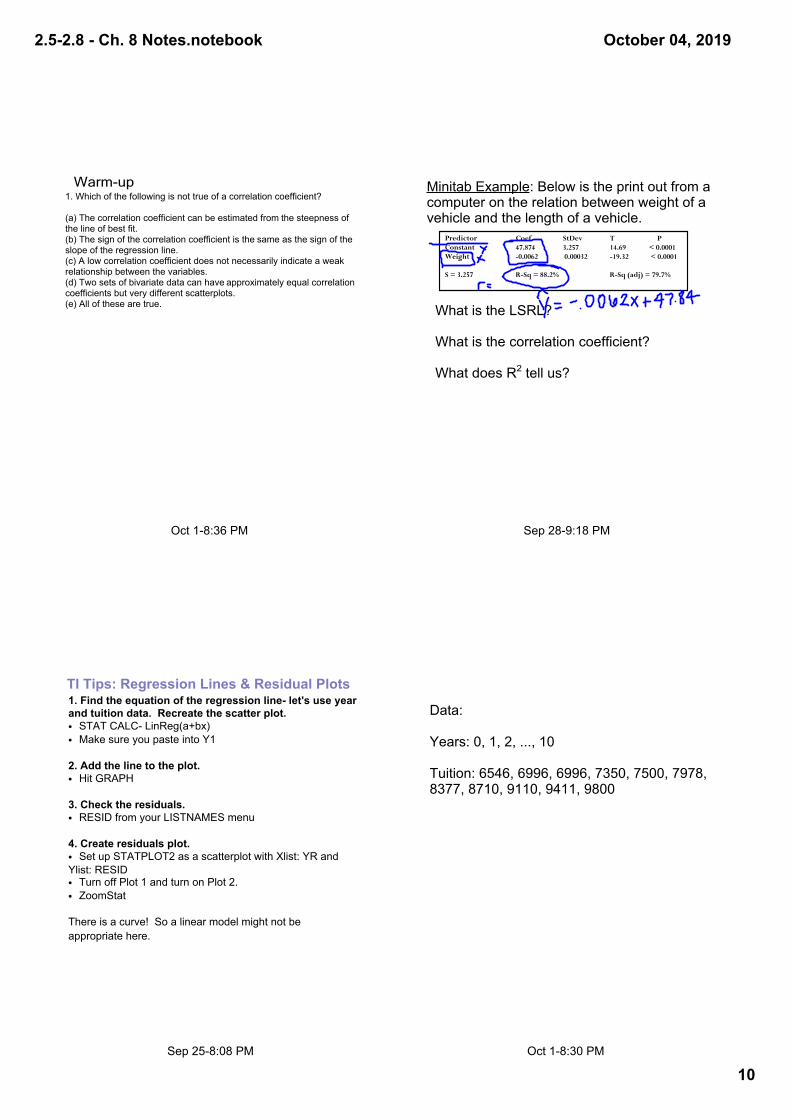
Minitab Example: Below is the print out from a computer on the relation between weight of a vehicle and the length of a vehicle.
Predictor Coef StDev T PConstant 47.874 3.257 14.69 < 0.0001Weight -0.0062 0.00032 -19.32 < 0.0001
S = 3.257 R-Sq = 88.2% R-Sq (adj) = 79.7%
What is the LSRL?
What is the correlation coefficient?
What does R2 tell us?
Sep 258:08 PM
TI Tips: Regression Lines & Residual Plots1. Find the equation of the regression line let's use year and tuition data. Recreate the scatter plot.• STAT CALC LinReg(a+bx)• Make sure you paste into Y1
2. Add the line to the plot.• Hit GRAPH
3. Check the residuals.• RESID from your LISTNAMES menu
4. Create residuals plot.• Set up STATPLOT2 as a scatterplot with Xlist: YR and Ylist: RESID• Turn off Plot 1 and turn on Plot 2.• ZoomStat
There is a curve! So a linear model might not be appropriate here.
Oct 18:30 PM
Data:
Years: 0, 1, 2, ..., 10
Tuition: 6546, 6996, 6996, 7350, 7500, 7978, 8377, 8710, 9110, 9411, 9800
2.52.8 Ch. 8 Notes.notebook
11
October 04, 2019
Sep 2211:57 AM Sep 2211:58 AM
Sep 2211:58 AM Sep 2211:58 AM

2.52.8 Ch. 8 Notes.notebook
12
October 04, 2019
Sep 2211:59 AM Sep 2211:59 AM
Sep 258:18 PM Sep 289:26 PM
A random sample of records of sales of homes from Feb. 15 to Apr. 30, 1993, from the files maintained by the Albuquerque Board of Realtors gives the Price and Size (in square feet) of 117 homes. A regression to predict Price (in thousands of dollars) from Size has an Rsquared of 71.4%. The residuals plot indicated that a linear model is appropriate.
Write a sentence (in context) summarizing what the R2 says about this regression.
2.52.8 Ch. 8 Notes.notebook
13
October 04, 2019
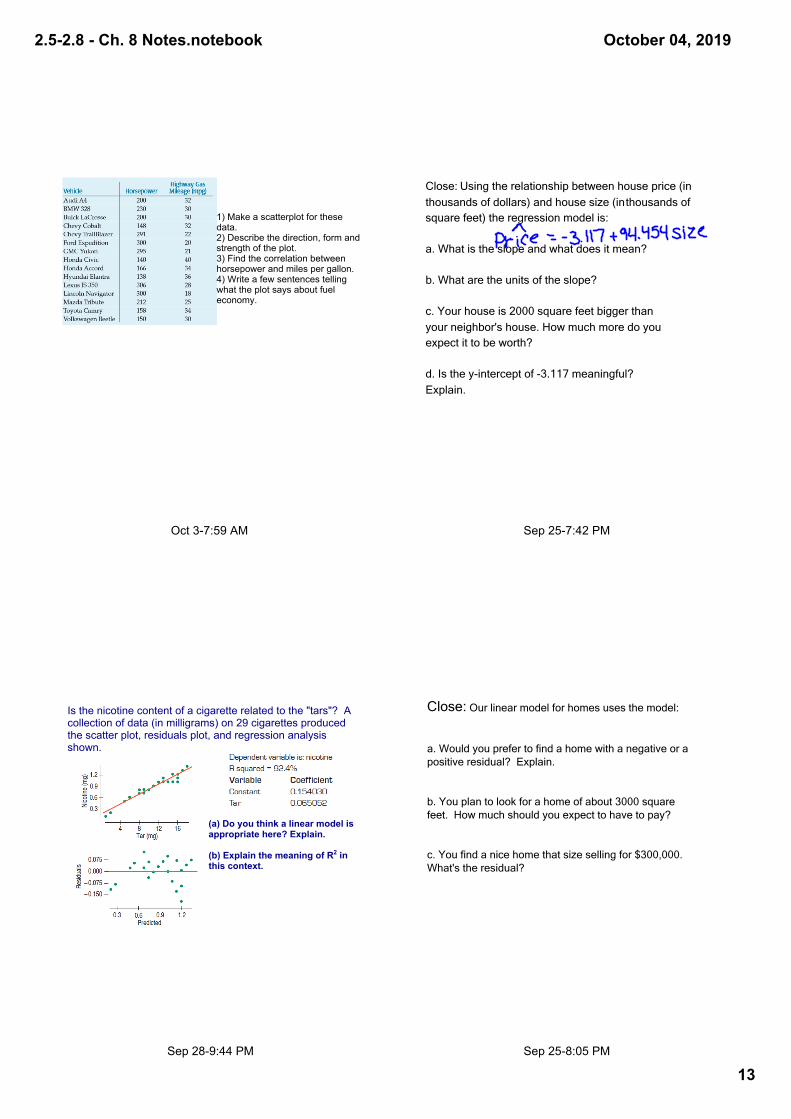
Oct 37:59 AM
1) Make a scatterplot for these data.2) Describe the direction, form and strength of the plot.3) Find the correlation between horsepower and miles per gallon.4) Write a few sentences telling what the plot says about fuel economy.
Sep 257:42 PM
Close: Using the relationship between house price (in thousands of dollars) and house size (in thousands of square feet) the regression model is:
a. What is the slope and what does it mean?
b. What are the units of the slope?
c. Your house is 2000 square feet bigger than your neighbor's house. How much more do you expect it to be worth?
d. Is the yintercept of 3.117 meaningful? Explain.
Sep 289:44 PM
Is the nicotine content of a cigarette related to the "tars"? A collection of data (in milligrams) on 29 cigarettes produced the scatter plot, residuals plot, and regression analysis shown.
(a) Do you think a linear model is appropriate here? Explain.
(b) Explain the meaning of R2 in this context.
Sep 258:05 PM
Close: Our linear model for homes uses the model:
a. Would you prefer to find a home with a negative or a positive residual? Explain.
b. You plan to look for a home of about 3000 square feet. How much should you expect to have to pay?
c. You find a nice home that size selling for $300,000. What's the residual?
2.52.8 Ch. 8 Notes.notebook
14
October 04, 2019
Sep 2212:01 PM Mar 109:36 AM
When you finish:
1) Turn your quiz in to the basket.
2) Pick up and work on the FRAPPY- this will count as a performance task grade. It is due next Wednesday.
3) Read and take notes on Ch. 9