25 - apps.dtic.mil
TRANSCRIPT

Spinfild Va 25
'77
Unclassified• . s -ecc,-y class.rcatio ....IDOCUMENT CONTROL DATA- R&D
5 (ScCiIF crasssica:ion of :1:1. bod. of abstact and in"exbE =otation =-z1 be cnrer d whnt ,veral reporl Is cl~asled"t Ill. ORIGINATING ACTIVITY Waeaor) ZIs. REPORT SECURITY CLASSIFICATIOM
Locheed U sil!es & Space Co apy Unclassified
SunnwveaJ C.ea.lifornia 94M0Z88z GROuP
13. REPORT TITLE
MEWM LL ,__ iES7QTGAiOOt OF TM OF T V ITCIL SURFACE-PIERCIG STRS!N VH PRESENCE OF CAVITATION
4. OESCRIPTIV" NOTES (-i'pe of repwt znd i.nlc.ive dntz)
F~inl1 Report November !966-1arch 1968S. AUTHORiS3 (Firs? s=C. .Idl InItLa W is t .-- e)
, Robert L. Waid
a. REPORT DATE 7. TOTAL 9O. OF PAGES 7b. NO. OF REFS
; -y 1968 65 168T. R TRACT OR GRANT NO Vs. ORIGINATOR*5 REPORT NUMSER9S)
;0004-67-G-o22b. -ROJEC NO. 1l.0/DO!9597
C. 9b. OTHER REPORT NO(S) (Any other n-bers that =vy be asilredthis report)
jd.__ _ _ _ _ _ _ _ _ _ _ _ _ _ _I0. OISTRIBUTION STATEMENT
Approved for Public Release: Distribution Unlimited
It SUPPLEMENTARY NOTTS 12. SPONSORING MILITARY ACTIVITY
Naval Ship Research and Development Center
Office of Naval'Research
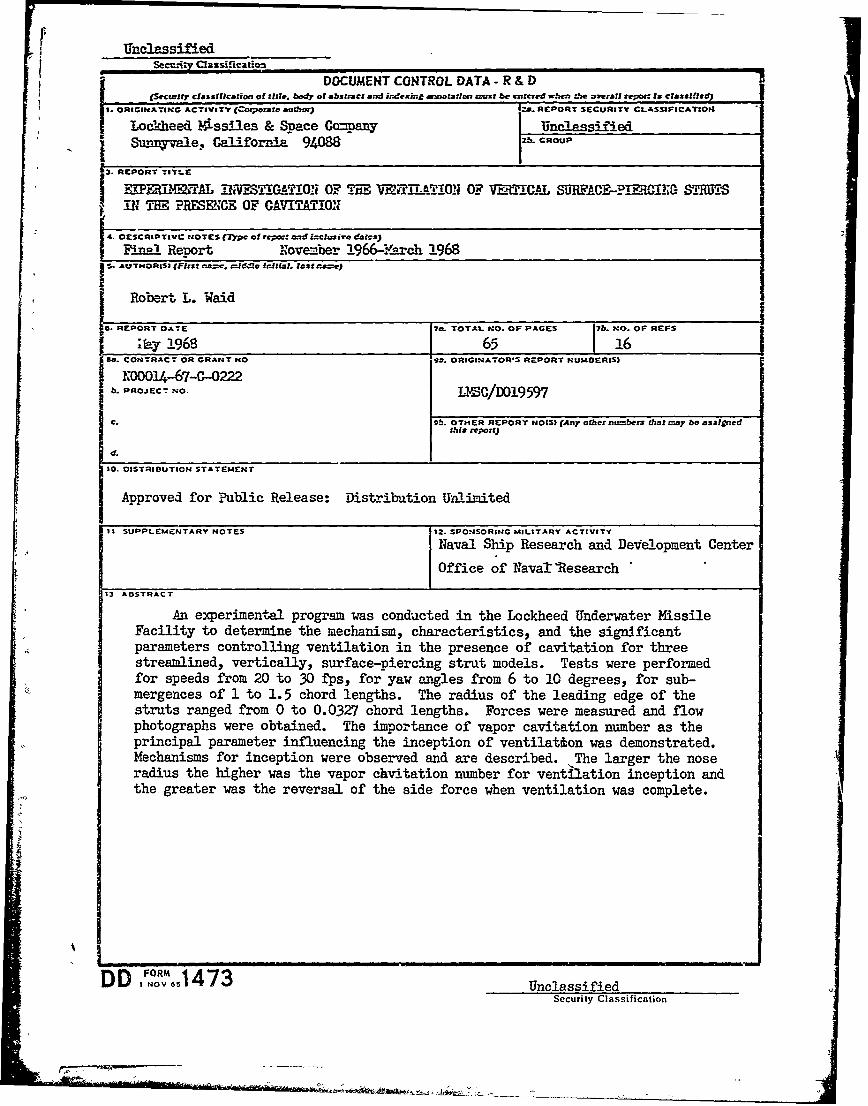
13 ABSTRACT
An experimental program was conducted in the Lockheed Underwater MissileFacility to determine the mechanism, characteristics, and the significantparameters controlling ventilation in the presence of cavitation for threestreamlined, vertically, surface-piercing strut models. Tests were performedfor speeds from 20 to 30 fps, for yaw angles from 6 to 10 degrees, for sub-mergences of 1 to 1.5 chord lengths. The radius of the leading edge of thestruts ranged from 0 to 0.0327 chord lengths. Forces were measured and flowphotographs were obtained. The importance of vapor cavitation number as theprincipal parameter influencing the inception of ventilation was demonstrated.Mechanisms for inception were observed and are described. The larger the noseradius the higher was the vapor chvitation number for ventilation inception andthe greater was the reversal of the side force when ventilation was complete.
FORM 4DD INOV, 1473 UnclassifiedSecurity Classification
0-*

Uin !assifiedS"urity Classification_____ -
KEY W LINK A LINK S LINK CKEY WORDS
ROLE WT ROLE W ROLE WT
st
VentilationCavitationStrut ventilation
3
UnclassifiedSecurity Classification

Final Report
EXERi4__TAL INVESTIGATION OFTHE VENTILATION OF VERTICAL
SURFACE-PIERCIEG STRUTSIN THE PRES.CE OF CAVITATION
May 1968 I.C/D019597
Prepared by
Robert L. W-.id
This research was carried out under theNaval Ship Systems Command
Hydrofoil Advanced Development Program S46-06,Administered by the Naval Ship Research and Development Center
Office of Naval Research Contract N00014-67-C-0222
Approved for Public Release: Distribution Unlimited
LOCKHEED MISSILES & SPACE COMPANY

U.SC/Do19597 ITABLE OF CO'T-2TS,
Section Title Pae
SupNARY i
LIST OF FIGURES ii
NO.ECLkrREF v
1. INT1RODUCTION
2. MODEL DESCRT2TION 3
3. TEST EQUIPMiT DESCRIPTION 4
4. TEST PROCEDURES 5
5. DATA REDUCTION PROCEDURES 7
6. ACCURACY AND REPEATABILITY 8
7. RESULTS AND DISCUSSION 9
7.1 Ventilation Characteristics 9
7.2 Conditions for Inception of Ventilation 14
7.3 Measured Forces 16
8. CONCLUSIONS AND RECOMKENDATIONS 19
9. REFERENCES 22
TABLE I 24
Coordinates of Leading Edge of Strut Models
FIGURES 1-31 I

An exie imental program was conducted in the Lockheed Underwater
Missile Facility to determine the mechanism, characteristics, and the
significant parameters controlling ventilation in the presence of
cavitation for three streamlined, vertically, surface-piercing strut
models. Tests were performed for spe,;ds from 20 to 30 fps, for yaw
angles from 6 to 10 degrees, for sim--ergences of 1 to 1.5 chord lengths.
The radius of the leading edge of the struts ranged from 0 to 0.0327
chord lengths. Forces were measured and flow photographs were obtained.
The importance of vapor cavitation number as the principal parameter
influencing the inception of ventilation was demonstrated. Mechanisms
for inception were cbserved and are described. The larger the nose radius
4 the higher was the vapor cavitation number for ventilation inception and
the greater was the reversal of the side force when ventilation was complete.

IMSC/D019597 IPage ii
MST OF FIGURIF
Nkumber Title Page
1. Physical characteristics of strut models 252. Photograph of towing carriage with strut model installed 26
3. Photograph of strut model installation on force 27balance and elevating mechanism
4. Cavitation on strut model 0 at a yaw angle of 28-8 degrees
5. Inception of ventilation on strut model 0 at a yaw 29angle of -8 degrees
6. Fully developed ventilation on strut model 0 at a 30yaw angle of -8 degrees
7. Strip of motion picture film showing ventilation 31inception and transition for strut model 2 at a yawangle of -8 degrees and a speed of 30 fps. (Timebetween successive frames was 0.01 seconds)
8. Elevation of the surface of the water adjacent 34to strut model at a yaw angle of -10 degrees fornoncavitating conditions.
9. Underwater photograph of strut model 0 at a yaw 35angle of -8 degrees
10. Underwater photograph of strut model 3 at a 36
yaw angle of -6 degrees
11. Water surface and upper cavity boundary for strut 37model 0 at -8 degrees yaw angle
for a speed of
30 fps. (Water surface elevation with no cavi-tation is shown for reference)
12. Water surface and upper cavity boundary for strut 38model 0 at -8 degrees yaw angle for a speed of 30fps and a surface vapor cavitation number of 0.24
13. Sketch of mechanism for inception of surface 39ventilation of a yawed strut through filament-like vortex cores
14. Force and cavitation characteristics during ventila- 40tion transition of strut model 2 at a yaw angle of-8 degrees for a speed of 30 fps and a surface vaporcavitation number of 0.293
• ii

IMC/D019597Page iii
LIST OF FIGURES (continued)
Number Title Page
15. Conditions of flow for strut model 0 at a yaw angle 41of -8 degrees and a submergence of 1.0 chords (Solidsymbol indicates ventilation)
16. Conditions of flow for strut model 2 at a yaw angle 42of -6 degrees and a submergence of 1.0 chords. (Solidsymbol indicates ventilation)
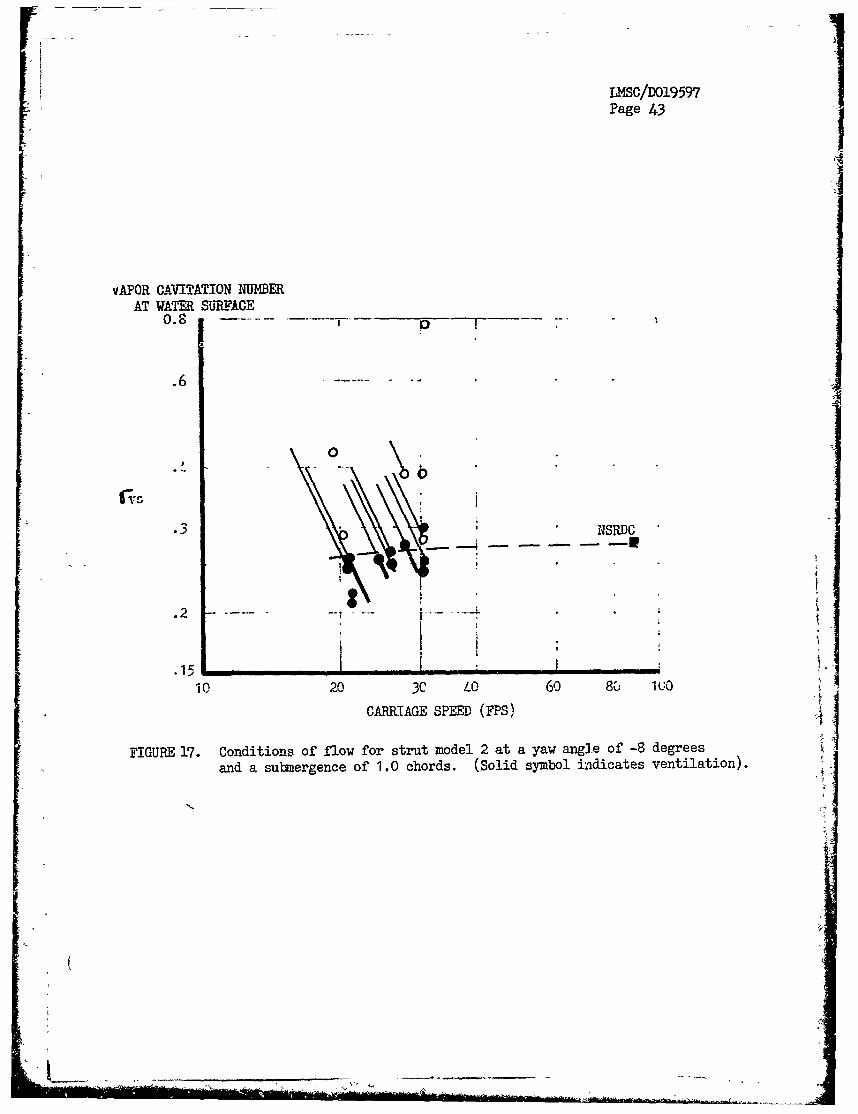
17. Conditions of flow for strut model 2 at a yaw angle 43of -8 degrees and a submergence of 1.0 chords.(Solid symLol indicates ventilation)
18. Conditions of flow for strut model 2 at a yaw angle 44of -10 degrees and a submergence of 1.0 chords.(Solid symbol indicates ventilation)
19. Conditions of flow for strut model 2 at a yaw angle 45of -8 degrees and a submergence of 1.5 chords.(Solid symbol indicates ventilation)
20. Conditions of flow for strut model 3 at a yaw angle 46of -6 degrees and a submergence of 1.0 chords.(Solid symbol indicates ventilation)
21. Conditions of flow for strut model 3 at a yaw angle 47of -8 degrees and a submergence of 1.0 chords.(Solid symbol indicatej ventilation)
22. Conditions for ventilation inception of strut model 2 48based on the vapor cavitation number at a represen-tative depth (0.1 chord lengths). (Solid symbolsindicates ventilation)
23. Vapor cavitation number for incipient ventilation 49at a submergence of 1.0 chord lengths.
24. Side force and drag coefficient for strut model 0 50at a yaw angle of -8 degrees and a submergence of1.0 chord lengths
25. Side force and drag coefficient for strut model 2 51at a yaw angle of -6 degrees and a submergence of1.0 chord lengths
26. Side force and drag coefficient for strut model 2 52at a yaw angle of -8 degrees and a submergence of1.0 chord lengths
27. Side force and drag coefficient for strut model 2 53at a yaw angle of -10 degrees and a submergence of1.0 chord lengths
iii

uA.S(/DO19597Page iv
LIST OF FIGM (concluded)
Nuber Title Page
28. Side force and drag coefficient for strut model 2 54at a yaw angle of -8 degrees and a sublmergence of
1.5 chord lengths
29. Side force and drag coefficient. for strut model 3 55
at a yaw angle of -6 degrees and a submergence of
1.0 cho-dk lengths
30. Side force and drag coefficient for struLt model 3 56
at a yaw angle of -8 degrees and a submergence of
1.0 chord lengths
31. Average side force coefficients as a function of 57
yaw angle for strut models, 0, 2, and 3 at a sub-
mergence of 1.0 chord lengths for a velocity of
30 feet per second. (FN 5.3)
i<
iv

UIM/DO!9597Page v
NOMENCLAT9RE
A ch Submerged planform area of strut model
c 1.00 Chord of strut model hydrofoil (ft)
CD D Drag coefficient
OV2A
CS S Side force coefficient
i PV2A
D Drag force (lbs)
F V Froude number
g 32.150 Acceleration of gravity at LJMF (ft/sec )
h Depth of submergence of bottom edge of strut model (ft)
hR Representative depth for cavitation number (ft)
S Side force (lbs)
Pa Pressure of air above surface of water (psia)
Pv Vapor pressure of water (psia)
Re cV Reynolds number
Speed of carriage (ft/sec)
eDensity of water (slugs/ft3)
v

L.000/019597Page vi
NOlffCLAI1RE (Continued)
(P a PV) 14-Vapor cavitation number at the
a-v ev surface of the water
VO 44 P Representative, vapor
r ~ eV cavitation nu m.ber
Kinematic viscosity of wdater (ft2/sec)
V
-S -S
D
vi

T.14C/D01 9597
Page 1
.1. ,lI1lXOT i X
The phenomenon of ventilation of above-surface ai: through the surface and
into water has been studied for a wide variety of configurations by numerous
investigators. Summaries of these efforts are found in References 1-3.
The preponderance of experimental work in this area is the result of the
comolex interactions of free surface, boundary layer, cavitation, and surface-
tension effects on ventilation. These interactions preclude development of
appropriate mathematical models. Although the variety of test conditions and
configurations used in these studies has been large, they are, unfortunately,
in restrictive combinations which are dictated by the capabilities of each
respective test facility. The widespread application of the conclusions based
on these small-scale results is necessarily provisional. It is important to
note that for full-scale conditions in which ventilation is of potential
significance, the presence of cavitation can also be expected. Since most
of the existing data do not include cavitation, the application of ventilation
criteria must make adequate consideration for the effects of cavitation--the
subject of this study.
The study of ventilation phenomena is generally considered in two areas,
(1) the avoidance of ventilation and (2) the occurrence and use of ventilation.
In this study the avoidance of ventilLtion is the principal area of concern.
In this area, development effort is usually concentrated on determining the
critical shape, arrangement, boundary layer condition, placement of devices
(fences), and safe limits of speed and angle-of-attack operation. The purpose
is to avoid any ventilation, regardless of how it is initiated. Some
analyses1,2 have shown a reasonable ventilation inception mechanism based on
laminar-boundary-layer separation. Unfortunately, the hypothesized mechanism
is incomplete, since there is no method proposed which describes the initiation
of ventilation from the free surface to the separated region in the boundary
layer which occurs somewhere below the free surface. In fact, rough water
test conditions have been utilized5 to provide an artificial method of initiat-
ing ventilation into the separated boundary layer for yaw angles of less than
*References are found on page 22.

U.ISC/D01 9597Page 2
24 degrees for 2- and 3-inch chord models. Without this technique., large
hysterisis of inception occurred, as has been noted by many observers. 1 3
There has been considerable success in correlating various break points in
the ventilation speed for various yaw angles, when compared over a Froude
number range of 2 to 6. Because of the use of atmospheric test facilities,
tests in the 2 to 6 Froude number range have no ca'itation, and in fact re-
quire large angles to effect ventilation inception. These large angles
produce large pressure gradients which encourage separation of the thin
laminar boundary layer occurring at these low velocities on small models.
If cavitation can be made to occur at lower angles of attack than those
required for separation, then a cavitation mechanism of potential ventilation
inception may occur.
It i notd tht reent 6,7it is noted that recent tests6 of blunt-based, parabolic struts at small
yaw angles, have shown leading edge cavities which became ventilated at high
speeds and low cavitation numbers. In these cases the leading edge cavitiesbecame large and long, approaching both the free surface and the base cavity.
It is not -known whether the ventilation in these tests was initiated into the
end of the cavity or through the spray sheet. Regardless of the mechanism,
it is apparent that additional definitive information on the interaction of
the free surface and cavitation on ventilation inception is required if
ventilation is to be avoided.
The objective of this study was to determine the mechanism, characteristics,
and the significant parameters controlling ventilation in the presence of
cavitation for streamlined, surface-piercing struts in calm water. The
parameters primarily examined were the cavitation number (for defining the
extent and location of the cavitation), the submergence and angle of attack
(for defining the effects of strut geometry), and the test speed (for defining
the general flow field including the cavitation), the radius of the nose (for
defining the effects of strut geometry), and the test speed (for defining the
inertial characteristics of the free surface and the fluid layer between the
surface and the cavitation). The sam e strut models tested at the Naval Ship
Research and Development Center were utilized in this study to increase the

U14SC/Ifl 5-597Page 3
useful range of tested conditions and to eliminate ambiguous results whichoften occur between data obtained from different sets of models.
The following sections of this report present a description of the testprogram, the test data, and a discussion of the test results including adescriDtion of the most probable mechanism for ventilation of cavitation onyawed, surface-piercing struts.
2. DDEL DESCRIPTIM
The three strut models which were tested had been fabricated for and previously8tested at the Naval Ship Research and Development Center . The struts wereof rectangular planform with a 1-foot chord and a contoured length of appro.i-
mately 4 feet. The physical characteristics of the struts, as designed, arepresented in figure 1. The lower end of the struts were cut-off sharplynormal to the span of the struts. The 12% maximum thickness of the strutsoccurred at the mid chord. The three struts were from a family of four strutsdesigned to evaluate the effects of the radius zt the leading edge of thestrut, which ranged from 0 (circular arc sectioa) to 0.0327 feet (3.27% chord).The three models selected to be tested in LI ' were done so on the basis ofthe widest expected range of useful results and with consideration of the some-what oversized nose radius which had been machined on strut model 1. Acircular arc was used for the section of the strut between the mid chord and
the trailing edge. The included angle at the trailing edge of all the strutswas 27.2 degrees, as was the included angle at 1;he leading edge for the circulararc strut. The coordinates for the front half-chord length of the struts with
finite leading edge radii were developed so that the profile had a continuous
radius of curvature, convex outward, from the leading edge to the mid-chord.Table I presents the coordinates of the leading edge of the strut models.
The models are designated 0, 1, 2 3 in increasing order of radius at the
leading edge. It is reported8 that the struts, machined from stainless steel,differed from the specified offsets by less than + 0.040 inch with surface
waviness of less than 1 0.005 inch.

ISC/D01 9597
Page 4
3. TEST EQUITPrINT DESCRIPTIC!
The test progra-r was performed in the Lockheed Underater Issile Facility
utilizing the unique, controllable pressure above the surface of water of
the towing tank. Details of the facility are available in Reference 4.Figure 2 show s the JMIF towing carriage with the strut model installed for
testing.
The strut models were attached to the six-component, external force balance9
by an adapter which allowed manual adjustment of Lhe yaw angle of the strut.
These tests we.-e conducted -with the strut models installed perpendicular to
the water surface; i.e., without sweep or dihederal. The force balance was
attached to the elevating mechanism which allowed remote adjustment of the
depth of submergence of the struts. The installation on the forcE balance
of the strut iith the circular arc section is shown in Figure 3. The yaw
angles during these tests were ..-± negative, or ltading edge to the port side.
To minimize ambiquity with the struts and the yaw angle, the negative con-
vention for the yaw angle has been maintained throughout this report.
The outputs from the force balance were ro)uted to a recording oscillograph
which produced oscillograms of the test data. The speed of the towing
carriage, the location of the carriage, and a digitally-coded, time signal
were also recorded on the oscillograms.
Four cameras were uti]ltzed to provide optical data for evaluation of the
cavitation on the strut and the ventilation mechanism. A 70-u camera, in-
stalled on the towing carriage, was aimed for a nearly plan view of the 'trut
from an angle of approxirrately 40 degrees above the horizontal. This -amera
was automatically operated at 1 frame per second. A 16 -rm camera was installed
on the carriage adjacent to the 70-mm camera to operate at 100 frames per
second to provide details of the entire flow field during the transition from
cavitating to ventilating flow. A second 16 -.nu camera was mounted forward
and lower than the other carriage cameras to obtain a better view of the Ccritical region between the cavity wall and the water surface. This camera
was operated at 200 frames per second to allow more resolution of the devails
~~i)

114SSG/DX1 9557Page 5
of ventilation inceotion. The fourth camera -as installed in a vie-ring port
located 2- .feet below the water surface near thr end of the ran of the touing
carriage. This 16--i ca-era was onerated at 200 frames Der second to effec-
tively stop. the notion of the strnut model as it passed the field of view.
The 3 high-speed cameras were equipped with the same digitally-coded, tire
signal wl ich was recorded on the oscilogram, so that all test data could be
tne-related to the details occurring during ventilation incept- i. The
photographic data obtained were instrumental in confirming the details of
the inceDtion of ventilation and transition to fuill ventilation.
The possibility that the inception of ventilation might be difficult to
excerience in the short run time in LIMP led to development of a system to
artificially aid and to forcefully cause ventilation. This system consisted
of a submerged manifold of air jets which was located near the end of the
stroke of the carriage launching catapult. '.he fiell of air bubbles which
were blown into the water acjacent to the low pressure -.ide of the strut
effectively caused ventilation of the strut under most of the required
conditions.
4. TEST PROCEUJRES
Tests runs with the three strut models were performed in LUIMF over a range
of test speeds (20, 25 and 30 fps) with the pressure in the air above the
surface of the water as the primary test parameter. The air pressure was
varied from atmospheric to 1 .3 psia providing a range in vapor cavitation
numbers down to 0.162. The yaw angle of the strut models was set at -6, -8,
and -10 degrees (leading edge to the port side). The submergence of the
models was set at 1.0 and 1.5 chord lengths.
Two techniques were employed to determine the necessary conditions for the
inception of ventilation. In both cases the strut model was at fixed yaw
angles. The steady state technique was first used. In this case, the towing
carriage was catapulted to a pre-set speed, and the carriage maintained that
speed throughout the test run. If the conditions for strut ventilation were

L14SC/DD 19597Page 6
ifrinent, ventilation could be expected to occur during the constant speed
run. A coarse grid of test conditions (velocity and ambient pressure) Eas
first surveyed to bracket the probable region for ventilation. A detailed
study at intermediate conditions near inception ---as then planned.
in practice t his technique was found to be very inadequate for the selection
of critical test conditions that should be tested to determine inception. AtI
-10 degrees yaw angle, strut model 2 ventilated while the strut was being
accelerated by the catapults at 4t/sec for cav taticn numbers as high as
2.3. On zhe other extreme, the same strut was not ventilated at a cavitation
number of 0.2 for a yaw angle of -6 degrees. The inability to obtain venti-
lation, as desired under these steady state conditions, led to the development
of the second technique.
The unsteady, testing technique made use of the variable speed capability of
the towing carriage to provide a slowly changing velocity and cavitation
environment throughout the first half of the test run. The launching acceler-
ation was terminated at approximately 5 fps below the desired steady speed
and the carriage continued to accelerate at 2.6 ft/sec2 to the pre-set speed.
This avoided the occurrence of high accelerations in the vicinity of the
critical ventilation conditions, which appeared to have been the primary
cause of the premature ventilation. The slowly increasing speed of the
carriage allowed a useful range of test conditions to be sampled during one
test run, greatly enhancing the surveying rate. During the latter half of
the test run, the constant speed allowed ventilation to occur under steady-
state conditions which had been approached without large unsteady effects.
The statistical nature of ventilation could then be studied. When ventilation
was encountered by this method several tests were run at various final speeds
to bracket the conditions for inception under both slowly accelerating and
steady state conditions.
Standard testing procedures, as described in detail in Ref. 9, were employed
for all other testing operations.
, s

U4Sc/Do1 9597Page ?
5. DA1TA REICTIQ. PROCELURES
An the data obtained by the external force balance and the several cameras
were reviewed and analyzed with regard to applicability of the data to the
determination of the mechanism and significant parameters controlling venti-
lation in the presence of cavitation.
The external force balance data were converted to engineering units and sum-
marized to obtain the total side force and the drag force on the strut model.The forces on the strat were determined inediately prior to the onset ofventilation during the variable speed portion of the test and also during the
steady-state test conditions. These forces were then reduced to standard,
non-dimensional coefficients, based on the planform area of the portion of
the strut which was submerged below the undisturbed water surface. These
coefficients are defined in the section on nomenclature with the sign conven-
tion as noted there also. In this convention the non-ventilating strut model
at a negative yaw angle develops a side force in the port direction which is
also a negative sense. Upon ventilation, the side force reversed to the star-
board direction for a positive sense.
The test speed was obtained by the determination of the time required for the
towing carriage to travel a known distance, usually the entire constant speed
portion of the test run. In that portion of the test with increasing speed,
a short travel distance centered at the time of the force measurements was
used to determine the average velocity.
The cavitation number that is considered to be most informative for the
inception of ventilation from the surface into the cavity is based on the
difference in pressure between the air above the surface and the pressure
within the cavity. Since no pressure measurement capability was provided in
these models, it has been assumed for the purposes of test description that
the cavity pressure was the vapor pressure of the water at the temperature
of the test. This parameter has been labelled the vapor cavitation number
at the surface of the water, O s
mi n m

LM.SCf/01 9597Page 8
S.ecial measurements of various flow conditions observed in the optical data
were obtained for numerous representative test conditions in support of the
evaluation of the ventilation inception and transition mechanisms. These
data are all presented in the discussion of the results of this study.
6. ACCURACY PAD REPETAIiTITY
The test data are estimated to ha-4e accuracies within the limits as sho-n
below. The ranges of the measurements for this program are also shown in
this table.
Estimated " imitsMeasurement (units) Range tested of k dcurac
of Accxuracy
Side force (lbs) 29 - 199 + 4Drag force (Ibs) 11 - 93 + 2
Tank air pressare (psia) 1.3 - 14.7 + .02
Tank water tamperature (OF) 57.2 - 57.4 + .2
Carriage velocity (fps) 20 - 31.4 + .02
Model depth of submergence (ft) 1 - 1.5 + .008
Model yaw angle (0) 6 - 10 + .05
The repeatability of the test conditions for this program was good, as shown
by the ability to repeat the desired air pressure within + 0.01 psid and to
repeat average test speeds within + 0.3 fps. Unsteady forces on the strut
models caused by shedding of portions of the vapor cavities yielded large
scatter in the measured force data.

Sc/DD1 959tPage 9
7. RESJI_,S A!ID DISWSSTS!a
The ,.st results have been analyzel4 from several different Doints of view so
that thtsa liiced data can be most usefully applied in co--naison with the
other ed existing data in this area, and so that the nature of surface
venti.lation in the presence of cavitation can be understood. The firstsection presents a discussion of tht- ,flo conditions which were obser-ed at
the inception of ventilation and during the process of transition t o fullventilation. The probable mechanism of ventation is discussed relative tothe observed data. The next section present the conditions which were re-
quired for ventilation to occur and relates these to date- from oth - sources.The final section of this discussion presents the su=m-rized force , taobtained during this program.
7.1 Ventilati.bn Characeristics
The very limited data previously available shed little light on the surfaceventilation of vertical struts in the presence of cavitation. The dataobtained during the conduct of this experimental program have been sufficientto allow development of a detailed descri.ption of the mechanism of ventilc Lion
inception with cavitation.
Figures 4 through 6 present a typical series of photographs of the develop-
ment of surface ventilation for strut model 0 (circular arc) at a yaw angleof -8 degrees. Figure 4 was obtained early in the test run when the flow
field was dominated by the vapor-filled cavity originating at the leadingedge of the strut. The other significant feature of the flow field is the
spray sheet which climbs up the side of the strut. The height and shape ofthe spray sheet are functions of the model, chiefly the nose radius i ou±case, the yaw angle and the test -.peed. There is a distinctive row of high-
lights in photographs 4 and 5 which marks the approximate intersection of thethin spray sheet and the local surface of the water adjacent to the strut.
This line roughly parallels the upper edge of the vapor-filled cavity. It
should be of interest to note that near the quarter chord line the cavities
extend above the undisturbed water surface as much as O.15 chord lengths forki

NSC//DD1 9597Page 10
model 3. This cavity exists within the water pushed up by the strut, some
of which later enters the spray sheet. The vapor cavity filling the tip
vortex is readily seen. Because of its short length, the tip vortex is
unable to penetrate the free surface leading to the conclusion that it is
not a primary ventilation factor for these test conditions.
As the test seed is increased, the cavitation number decreases and the cavity
grows in length and in height. Saddenly, there occurs a noticeable disturbance
to the upper edge of the cavity and to the spray sheet intersection near the
leading edge of the strut. Figure 7 presents a time history of the ventilation
by 15 frames reproduced from the test film. The radical separation of the
spray sheet between frames 4 and 8 is the basic clue as to the flow passage
through which the ventilating air is entering the cavity. The cavity then
rapidly grows out of the field of viw and the forces on the strut become re-
versed. This is the ventilation phenomenon which will now be examined in
detail.
The inception mechanism is intimately tied to the proximity of two surfaces;
the local free water surface and the local cavity surface. The surface of
the water immediately adjacent to the strut is displaced upwards to become
the attached spray sheet. A small distance further away from the surface of
the strut the water surface has been observed to be pushed up near the leading
edge of the strut and to be drawn down near the trailing edge of the strut.
These effects are illustrated in figure 8 for noncavitating conditions at
speeds from 10 to 30 fps for a yaw angle of -8 degrees. These data were
obtained from the underwater camera, and are plotted to show that the shape
of the local water surface in the vicinity of the strut is reasonably indepen-
dent of the test speed in the absence of cavitation. The shape of the water
surface in the wake of the strut, however, is a significant function of the
test speed, driving deeper with increasing speed.
Following the inception of cavitation on the strut, a growing region of cavi-
tation develops. For these struts and yaw angles the cavitating region
coalesces into one cavity with a generally steady shape, which is periodically

K4S/D019597Page 11
disrupted by reentrant flow from the rear end or the sides of the cavity.
The sparriise distribution of the cavity length is a function of the aspect
ratio, the existence of end plates or other structures, and the Froude number.
The upper edge of the cavity is influenced by the proximity of the nearby
free-surface. The share of the cavity wall and the water surface is shownfor typical cases in the photographs of figures 9 and 10, and in the diagrams of
figures 11 and 12. Also included in the latter figures are the water pro-
files which were observed in roncavitating flow. It is observed that the
rear portion of the upper edge of the cavity moves upward as the cavitation
number is reduced. The water surface is noted to have moved upward more
sloiwly than the cavity wall. If these two surfaces continued at these rates
they would ultimately intersect, and ventilation could be expected. Hoever,
there are other features in the flow which intercede.
large disturbances (up to k-inch diameter) are seen to protrude below the
mean surface of the drawn-down water. These have been referred to as Rankine
vortices3 . Analysis of these photos and the excellent photos of Reference 8
has revealed that these disturbances grow rapidly in length and width as they
move relative to the strut. Etrapolating toward the leading edge from the
region where the diameter of these disturbances can be measured, the probable
size of the initial disturbance is on the order of the thickness of the
boundary layer. Hence, it is concluded that the vorticity shed from the
boundary layer is the probable source for the initial disturbance of the
water surface. The rapid growth of these small disturbances is a result of
the large acceleration ( up to 20G) which the free surface experiences as it
is drawn down while passing the strut. The instability of the accelerated
interface between a liquia and air, known as the Taylor instability 0 , has
been studied1 1 for finite disturbances and large growth, as exist in this
problem. Photographs of this phenomenon presented in reference 11 appear to
be identical with those obtained 8 with the strut models just prior to venti-
lation inception. While these growing disturbances appear to provide a
mechanism for penetrating into the vapor cavity, computations of their rate
of growth indicates that there is insufficient time for these disturbances to

IMSC/DG1 9597Page 12
penetrate into the cavity under conditions for which ventilation occurs.
Frther evaluation of the flow data re.eal that under some circumstances, thin
vortex cores extend at great speed from the bottom of these longer disturbances.
Figure 13 illustrates this ventilation mechanism. There are two probable
sources for strong vortex flow adja -ent to the strut. These are the original
boundary layer vorticity and the highly rotational flow which exists over the
top edge of the vapor cavity as the flow forms the spray sheet on the inside
of the cavity9 . Penetration of one of these vortex cores into the cavity
while it passes the strut would allow moderate step-Like increases (10 to 20%
per vortex) in the cavity pressure. Such pressure j;..ps would have noticeable
effects on the cavity shape.
There are two other possible mechanisms for inception of ventilation which
should not be overlooked. The extensive reentrant flow into the cavities from
both the rear and the upper and lower edges of the cavity cause significant
disturbances to the overall cavitation pattern. As portions of this erratic,
internal flow encounter the otherwise stable walls of the cavity, either at
the leading edge or the upper edge, major transient changes in the flow
around the cavity are devel-ped. These lead to the periodic shedding and the
large force oscillations usually reported for cavities having lengths which
are between 0.6 and 1 .5 chord lengths. Ventilation inception for several of
the test conditions reported herein was initiated by the blasting of this
erratic, internal flow through the thin sheet of water between the cavity and
the free surface. The disturbance caused by this jet undoubtedly allowed air-
flow passages to be developed in a different manner than hypothesized previously.
The test conditions for ventilation resulting from this type of jet action
were urdistinguishable from the rest of the data. The other possible ventila-
tion mechanism is that resulting from unsteady oscillations of the pressure
in the vapor cavity as caused by shedding and reentrant flow disturbances.
bince there were no pressure measurements obtained within the strut cavities,
it is not possible to thoroughly evaluate the significance of this ventilation
mechanism. It can be estimated that the shedding of cavities by reentrant
flow would produce pressure oscillations having a maximum frequency of L- V
(Ref. 16) or 3 cps at 30 fps. In contrast, the undulations in the cavity wall

LMSC/l 9597Page 13
during transition to ventilation are characterized by a frequency of approxi-
mately 50 cps. This difference relegates the cavity pressure oscillation (if
it exists) to the role of a forcing function which tends to promote ventilation
rather than to the role of the actual inception mechanism.
The typical ventilation transition event shown in figure 7 has several features
which support the hypothesized inception mechanism. The first indication of
inception of ventilation is the sudden change in the shape of the cavity be-
tween the leading edge and the mid chord (frame 3). In the next frame the
disturbed cavity is propagated along the strut by 0.33 chords of travel. How-
ever, no new disturbance of the front portion of the cavity occurs, indicating
that there are no further changes in the cavity pressure. In the next frame (5)the cavity edge near the leading edge of the strut is observed to move again
and to continue to move up the strut during subsequent frames. This second
jump is undoubtedly caused by the pressure rise resulting from the penetration
of more vortex cores into the previously displaced cavity wall. As late as
frame 7 there appears to be a single, unified, rapidly growing cavity which
extends well up and under the spray sheet. The maximum length of the cavity
is seen to have doubled in 5 frames (0.05 seconds=1.5 chords of travel).
Measurements of the cavity length, the elevation of the cavity at the quarter
chord line, and the percentage change in the side force are shown in figure 14.
The simultaneity of the flow changes indicates that the ventilation mechanism
is predominately a process of changing the cavitation pattern from a small
vapor-filled cavity to one large, air-filled cavity by way of a straightforward
air in-flow process. The hesitation in the cavity elevati on as shown in this
figure is quite typical, with some tests encountering as many as 4 to 6 distinct
oscillations during the transition phase. The occurrence of these step-wise
motions lends support to the ventilation mechanism based on multiple vortex
core penetrations. It is significant to note that the maximum rate of growth
in cavity length is equivalent to the test speed. This means that the strut
is simply extending the cavity which was previously created.
The force records were examined to indicate factors which influence the time
(or rate) of the ventilation transition. Tests at 20, 25, and 30 fps for yaw
angles of -8 degrees were found to require approximately 0.07 seconds for the

LSC/D01 9597Page 14
princi al change in force to occur (excluding th. 'ansients). This represents
travel distances of 1.4 -to 2.1 feet. The transi ion tiie was noted to vary
inversely with the yaw angle and to be insensitir-- to submergence or nose
radius.
This section has reviewed the results of the test- conducted in LU,F and asaugmented by data from NSRDC to develop an under: anding of the process ofventilation of a cavitating strut. From this de-elopment it is concluded that
the parameters which influence cavity size and ape are undoubtedly the most
significant parameters that need to be evaluate- with regard to the conditionsfor inception of ventilation.
7.2 Conditions for Inception of Ventilation
The knowledge of the conditions under which : -face ventilation occurs is
crucial to the selection of configurations t-. avoid ventilation, as well asto an understanding of the mechanism which - aduces ventilation. The latter
may ultimately lead to more effective solui mn of the former. A review of the
test film and the oscillograms showed that -here were two methods which could
be used to define the inception of ventilat.on. The sudden change in the side
force records was very distinct and allo .-xi convenient determination from the
test record of the test speed and forcet it the time of inception. The data
film showed similar radical changes in -he flow, but required reference to the
oscillogram for ultimate determination of the conditions at inception. A
comparison of results, as in figure 14, indicated the validity of utilizing
the break in the force records as an accurate identification of the conditions
for inception.
Figures 15 through 21 present these conditions for ventilation inception in
the form of the vapor cavitation nu;,iber at the water surface as function of
the carriage speed for the several -)dels, yaw angles, and submergence ratios.The solid symbols identify the cor.l ions for which natural ventilation
inception occurred, while the ope.-. .ymbols indicate test conditions for which
ventilation was not obtained. TLc narrow lines indicate the approximate range

M sc/1019597Page 15
of conditions which were encountered daring the slowly accelerating portion
of the test run. The broad lines extending to higher speeds than the inception
condition indicate the conditions under which the strut continued to ventilate
as the constant speed portion of the test run was approached. The symbols
without lines represent test runs which were made at constant conditions, follow-
ing catapulting of the toing carriage to speed. Included for comparison are
the ventilation inception conditions for the struts as tested at NSRDC includ-
ing some extrapolated conditions.
It is seen in these figures that the vapor cavitation number at the water
surface for incipient ventilation is nearly independent of the testing speed.
This means that surface ventilation in the presence of cavitation is predomi-
nantly influenced by the cavitation (cavity length, location, or stability).
The effects of fluid inertia, viscosity, and surface tension for a model of
this size are apparently nominal. The incipient cavCtation numbers for the
DUMF data (at moderate speeds) are equal to or less than those obtained at
NSRDO (at high speeds). It is of interest to note that even smaller variations
in vapor cavitation number for incipient ventilation are obtained if the cavi-
tation number is based on the pressure at a more representative depth below
the surface. Observation of the cavity shapes at conditions incipient to
ventilation suggested that a depth of 0.1 chord lengths would be representative
for the strut model 2 at -8 degrees yaw angle. Figure 22 represents the test
conditions for this model based on a vapor cavitation number for a depth of
0.1 chord lengths. Although the change in results is not large, it is quite
evident that a better correlation is provided over a wide range of test speeds.
The importance of this better correlation is that it reduces the number of
parameters which must be considered as being relevant to the mechanism of venti-
lation. On the other hand, the effective use of this representative cavitation
number requires that there be sufficient data available to predict the depth to
be used in the computation of cavitation numbers. The limited amount of perti-
nent data and its significant scatter restrict the assessment of representative
depths to a recognition of trends which are substantiated by the data shown in
figures 15-21. These trends are that more correction (greater representative

I.Sc/Do1 9597Page 16
depth) is required for the struts ii.th smaller nose radii and for the struts
which are operated at larger yaw angles. Blunt struts at small angles reoyire
no correction for good correlation.
The effect of yaw angle on the surface vapor cavitaticn number for v.ntilation
inception is illustrated in figure 23. The cavitation number for ventilation
is seen to increase writh increasing yaw angle at more than a linear rate. A
significantly lower cavitation number is required for ventilation of the cir-
cular arc section (model 0) at -8 degrees. However, the advantage seems to
be lost as the yaw angle exceeds -10 degrees. The strut with the largest nose
radius (model 3) in all cases ventilates at higher cavitation numbers than
the other struts.
This evaluation of the conditions necessary for ventilation inception has
concluded that cavitation is the most significant feature in the flow field
which leads to surface ventilation. Accurate representation of the cavitating
conditions apparently requires some form of consideration of a representative
depth. The importance of these conclusions is that scale-model testing for
ventilation inception principally requires scaling of the -vapor cavitation
number, while scaling of the Froude number would automatically provide the
correction for a representative depth. Corrections for the Froude number effect
may be negligible (blunt strut at moderate yaw angles) or may require separate
determination. Model tests at inordinately high Froude numbers apparently
provide conservative inception conditions.
The next section of this discussion presents the measured force data in b'oth
ventilating and non-ventilating conditions.
7.3 Measured Forces
The side force and drag force coefficients obtained for strut models 0, 2, and
3 are presented in figures 24 through 30 as functions of the vapor cavitation
number at the surface of the water. In these figures the forces which were
measured under ventilating conditions are indicated by a solid symbol, while
those tests in which artificial ventilation was attempted by blowing air at
the start of the test run are indicated by a flagged symbol.

41SC/D01 9597Page 17
The strut force characteristics with partial cavitation are similar to those
customarily encountered with fAilly submerged hydrofoil section. The side
force coefficients do not change significantly when cavitation is initially
encountered. At lower cavitation numbers the larger cavities pi 'duce signi-
ficantly larger side forces when the struts are at yaw angles of -8 and -10
degrees. At -6 degrees the side force coefficient remains essentially constant
throughout the cavitating range. This variable effect of cavitation is
readily explained. The changes in the pressure distributions caused by
cavitation at small incidence angles are small and hence there are small
changes in the forces. The change in the pressure distribution is greatly
increased as the angle of incidence is increased, causing a larger low pressure
region to occur, thereby increasing the normal force. The erratic nature of
the side force data near ventilation is partially indicative of the large
variations in forces which occur as major portions of the cavity are periodi-
cally shed. An added cause for the force scatter was observed during several
runs in which there was some form of cavitation on the "pressure" side of the
strut model. This was evidenced by changes in the cavity shape behind the
trailing edge of the strut which were not related to events occurring on the
low pressure side of the strut. The variable occurrence of cavitation on the
pressure surface will also have a significant effect on the scatter in the
side force measurements. Photographs 8 of the pressure side of these struts
show distinct areas of cavitation beyond the mid-chord of the strut in the
region of ventilation inception. The arrangement of cameras and lights for
this test program, unfortunately, precluded direct observation of the pressure
side of the strut. However, it is quite evident that the local pressures on
the "pressure" surface of the strut will readily approach vapor pressure for
the small angles of incidence tested and for these relatively thick (12%) struts.
The drag force, also, increases in magnitude as the cavitation number is reduced.
This increase occurs for all the strut models and at all the tested yaw angles.
This resalt again is similar to that observed with submerged hydrofoil sections.
Drastic sideforce reversals occur when ventilation of the strut has been estab-
lished. It is this well document1-3 characteristic which has led to these
studies. The reduced scatter in the side force coefficient is a result of the

U-GSC/ID1 9597Page 18
steady-state flow condition existing with the large, full cavity on the lo,
pressure side of the strut and the generally higher pressure field which
exists on the "pressure" surface, which eliminates the potential for vapor
cavitation on the pressure surface. Since these two effects should provide
extremely stable flow conditions and highly repeatable force measurements,
it is apparent from the remaining scatter of the force data that transient
phenomena were still influencing the test data as obtained. A review of the
test oscillograms revealed that the side forces on the strut ,nodels experienced
significant transients following the major force change. Because of the
limited run time for these tests it was not always possible to wait out the
decay or even to obtain measurements at a constant time after ventilation
transition occurred. It is simply concluded that the observed scatter in
measured forces is somewhat a measure of the magnitude of the time-dependent
transient forces which accompany ventilation transition.
The constant value of both the side force and drag force for the artificially
(blowing) ventilated conditions, which is the same as their value in the
naturally ventilating conditions, provides firm evidence that the flow field
is essentially under a zero cavitation number condition for these constant
Froude number tests. Ehpirical evaluation 3 of ventilated sicdt force coefficients
over a range of speeds has shown a predictable Froude number effect.
The average side force coefficients for the fully-wetted condition and for
the fully-ventilated condition at 30 fps and a submergence of 1 chord length
are presented in figure 31 as a function of the yaw angle. The general
characteristics of these data in fully wetted flow are as expected. Comparison
of the data point at -8 degrees for the circular arc model (0) with those
obtained at SIT3 shows essentially the same side force coefficient for the
1-foot chord model in IUMF as for the -foot chord model at SIT. The sudden
shifts in the wetted side force coefficients for models 2 and 3 between -6
and -8 degrees is assumed to be caused by laminar boundary layer separation
near the leading edge of the strut. This phenomena has been extensively
reviewed15 for airfoil sections in similar ranges of Reynolds numbers. The
effect of the small aspect ratio of these struts on the boundary layer separation
has not been studied in detail. Some flow visualization observations , have

LMSC/,10) 9597
Page 19
indicated typical separation regions during tests at loner Reynolds numbers.
Theoretical side force coefficients in wetted flow, which were presented in
Reference 3, have been plotted in figure 31 for comoarison with the test
results. The value of the Weissinger, L-method is apparent Lor the smaller
nose radius and for conditions for which the boundary layer can be exnected
to separate from near the leading edge of the strut. The lifting line theory
is obviously inadequate for representing the force coefficient for these
small aspect ratios. The data presented in Reference 3 indicates improved
comarison with this theory for an aspect ratio of 2:1.
Side forces in the fully ventilated condition increase in magnitude as the
yaw angle is reduced. Again these results are in general agreement with boththe experimental data and the theoretical trends as reported by SIT it is
of interest to note that the ventilated side force increases with increasing
nose radius. This result suggests that a strut having a minimal nose radius
would have the least undesireable effects, if ventilation were encountered.
8. CONCLUSIONS AND RECOIMMENDATIONS
The following conclusions have been developed in the course of this study.
Mechanism of Ventilation Inception
1. The displacement of the water surface adjacent tothe strut during
the passage of a non-cavitating strut is independent of forward speed.
2. The wake behind a non-cavitating strut is function of the speed (or
Froude number).
3. The water surface displacement is altered by the presence of a vapor
cavity.
4. The most commonly occurring and most probable mechanism causing the
inception of ventilation is the penetration into the vapor cavity of
small vortex cores developed from large disturbances on the surface
of the water which grow by Taylor instability from small disturbances
which may be a result of shed vorticity from the strut boundary layer.
i

U!SC/DO195.97Page 20
5. The transiticn from incipience to full ventilation occurs with
distinct oscillations ir the flow pattern but with smooth changes
in cavity length and the overall forces.
6. The time for the major effects of ventilation to take place was
appro3_nately 0.07 seconds at a yaw angle of -8 degrees. The time
varied inversely with yaw angle and was insensitive to nose radius
or submergence.
7. Several tests were obs.;rved to experience ventilation incepUin as
a result of penetration of the water sh-et by erratic reentrant-jet
flow from inside the vapor cavity.
Conditions for Inception of Ventilation
1. The vapor cavitation number is the mostsignificant parameter
influencing ventilation inception.
2. Selection of a representati,,F, depth for determining the vapor
cavitation number provided an improved comparison between the NSRDC
data attained at high speed and the IUJN data obtained at moderate
speeds. A depth of 0.1 chord lengths was effective in improving the
comparison for strut model 2 at a yaw angle of -8 degrees. (The use
of a representative depth for improved comparison of results is in
effect a Froude number correction.)
3. The cavitation number required for inception of ventilation was a
direct function of the radias of the leading edge of the strut models
in the range of angles from -6 to -10 degrees.
Measured Forces
1. The forces on the strut models increased as the amount of cavitation
was increased for large yaw angles and remained unchanged for a yaw
angle of -6 degrees.
2. The side force reversed direction upon full ventilation of the strut
models for yaw angles from -6 to -10 degrees.
3. The side force developed by artificially induced ventilation (by
blowing air) was independent of the ambient pressure in the tank

.mSC/Doi 9597Page 21
indicating a condition of essentialy zero cavitation number.
L. The side force developed during ventilation conditions was a direct
function of the radius of the leading edge of the strut model.
5. The side force measured on the circular arc strut model (0) compared
well with data from Sn 3 .
The following recommendations have been developed during this study.
1. The distinct advantages shoirn by the circular arc strut model (low
vapor cavitation number for inception and low force reversal if ventilation
occurs) suggest that further work on strut ventilation should be directed to
this class of sections.
2. The effect of Froude number, only suggested in the current study as
a means of providing a small improvement in data comparison, should be examined
more closely with wider ranges of speeds and models sizes.
3. Scale-model testing of surface piercing struts can be adequately (if
not preferably) performed at moderate speeds under conditions of variable,
vapor cavitation number.

U4SC/D01 9597Page 22
9. REFERRICES
1. Wadlin, K. L., "Mechanism of Ventilation inception," Second Symposium,
Naval Hydrodynamics, U.IR/ACR-38, Aug. 1958.
2. Barr, R. A., "Ventilation Inception of Surface Piercing and SubmergedFoils and Struts, Chapter 3 of Hydrodynamics of Hydrofoil Craft, Oub-cavitating Hydrofoil System," Hydronautics, Inc., Technical Report 463-1.
3. Breslin, J. P. and Skalak, R., "Exploratory Study of Ventilated FlowsAbout Yawed Surface Piercing Struts," National Aeronautics and Space
Administratio, Memo 2-23-59,, April 1959.
4. Waid, R. L., "Cavitation Research Capabilities of the Lockheed UnderwaterMissile Facility," Symposium on Cavitation Research Facilities andTechniques, American Society of Mechanical Ehgineers, 1964.
5. Wetzel, J. M., "Ventilation of Bodies Piercing a Free Surface," Second
S mposium, Naval Hydrodynamics, OR/ACR-38, 1964.
6. "Hydrodynamic Characteristics of a Base-Vented and Sapercavitating Strutfor Hydrofoil Ships," Aerojet-General Corp., Report No. 2796, August 1964.
7. "Waterjet Propulsion System Study, Report No. 4, External Flow Tests,"
Lockheed California Company, LR 17885-4.
8. Rothblum, R. S., and Wilburn, G. M., "Investigation of Ventilation of
Surface Piercing Struts," Naval Ship Research and Development Center,Test and Evaluation Report 217-H-01, June 1967.
9. Waid, R. L., "Experimental Investigation of the BaShips Parent Hydrofoil--
Lockheed Underwater Missile Facility," Lockheed Missiles & Space Company,
IMSC/805568, December 1965.
10. Taylor, G. I., "The Instability of Liquid Surfaces When At&eerated in a
Direction Perpendicular to Their Planes," Proc. Roy. Soc. A, 201, 192-6, 1950.

INSO/Dl 9597Page 23
11. E mons, H. W., Chang, C. T., and Watson, B. D., "Taylor Instability of
Finite Surface Waves," Jour. of Fluid lch., Vol. 7, Part 2, Feb. 1960.
12. .ayer, D. A., "Investigation of Surface Piercing Struts," Naval Ship
Research and Development Center. Report (in preparation 1968).
13. Kiceniuck, T., "A Preliminary EBperinmental Study of Vertical Hydrofoils
of Low Aspect Ratio Piercing a Water Surface," California institute of
Technology, Hydrodynamics laboratory, Report No. E-55.2, December 1954.
14. Chey, Y., and Kowalski, T., "interference Effects of a Submerged Hydrofoilon a Srface-Piercing Ctrut," Stevens Institute of Techuology, Davidson
laboratory, Report 936, June 1963.
15. McCullough, G. B., and Gault, D. E., "Examples of Three Representative
Types of Airfoil-Section Stall at Low Speeds," NACA 2I 2502, Sept., 1951.
16. Wade, R. B., and Acosta, A. J., "E~eri _ental Observation on the Flow
Past a Piano-Convex Hydrofoil," California Institute of Technology,
Hydrodynamics laboratory, Report No. E-79.8, Feb. 1965.

LMC/DOl9597Page 24
TABLE I
COORDML A OF LEADIN EDGE OF STRUT MODELS
Dist. fromLeading Edge Distance from Strut Centerline - in.
In.STRUT 1 STRUT 2 STRUT 3
0 0 0 0
.030 .082 .107 .140
.060 .113 .146 .191
.090 .136 .175 .227
.120 .155 .198 .255.180 .186 .234 .299
.240 .211 .263 .332
.300 .232 .286 .359
.360 .250 .306 .380
.480 .282 .339 .416
.600 .308 .366 •443
.720 .331 .388 .464
.840 .352 .408 .482
.960 .371 .425 .4961.080 .389 .440 .508
1.200 .405 .454 .519
1.320 .420 .467 .529
1.440 .435 .479 .5371.560 .449 .490 .5451.680 .462 .501 .5521.800 .475 .511 .5591.920 .487 .521 .5652.100 .505 .535 .5742.400 .533 .557 .5892.700 .559 .578 .603
3.000 .584 .598 .618
3.300 .607 .618 .632
3.600 .628 .636 .646
3.900 .648 .653 .660
4.200 .666 .669 .6734.500 .681 .683 .686
4.800 .694 .695 .697
5.100 .705 .706 .706
5.400 .713 .713 .7145.700 .718 .718 .7186.000 .720 .720 .720
NOSE RADIUS - in. .122 .219 .392
NOSE RADIUS/CHORD .0102 .0182 .0327

C/D01959 7Page 25
DESIGNED
LEADING
00 EDGE0 0 0 RUDIUS
0 (Circular firc)
2x13.6 =27.20
R = 25.36 in
0.122 in. <
(1.02, chord)
Co
0.219 in. MODEL 2
(1.82% chord) }
0.392 in.MODEL 3141
(3.27% chord
NOSE SECTIONS
(Approx j scale)
Figure 1. Physical Characteristics of Strut Models

imscl~)1951Page 26
C H0
'-4t 0
o, jcoo
LOCKEED ISSIES SPAE COPAN

L4SC/1 9597Page 27
• 0
"ski
FIGURE 3. Photograph of strut model installation on force balance and elevating mechanism
LOCKHEED MISSILES & SPACE COMPANY

IMS C/D0i 9597Page 28
co
It 4
0
0
4)3
0a
LOCKEED ISSIES SPAE COPAN

I1-ISC/DO1 9597Page 29
ca
co)
0
0
0 .
0!
0
cu
"p.4s
0
0
13)
C.)
LOCKEEDIVIISILS &SPAC COPAN

11-130/D1 19597Page 30
Vd)
C)
0
4-)cu
I:Zes-
0
iti
LOCKEEDMISSLES SPAC COPAN

INSC/D)1 9597Page 31
t-
FIGUR 7. Strip of motion picture film showing ventilation inception and transitionfor strut model 2 at a yaw angle of -8 degrees and a speed of 30 fps.(time between successive frames was 0.01 seconds)
LOCKHEED MjSSILES & SPACE COMPANY

DIs/Ini 9597Page 32
FGURlE 7.( Cniud
LOCKHEED MISSILES & SPACE COMPANYj

IHSQ/D019597Page 33
'4i
•O i,- ' -_
FIGURE 7. (Continued)
LOCKHEED MISSILES & SPACE COMPANY

LMSC/DO!9597Page 34
TEST SPEED (fps)
30
FIGURE 8. Elevation of the surface of the water adjacent to strut model ata yaw angle of -10 degrees for noncavitating conditions.
L1i

U4SO/DOi 9597Page 35
FIGURE 9. Underwater Photograph of' Strut Model 0 at a Yawi Angle of -8 Degrees
LOCKHEED MISSILES & SPACE COMPANY

I.sc/Dfl 9597Page 36
FIGURE 10. Underwater Photograph of Strut Model 3 at Yaw Angle of -6 Degrees
LOCKHEED MISSILES & SPACE COMPANY

1.SC/D019597Page 37
Water elevation
,VMWL
Cavity boundary
y ago 3 f Water elevationih
FIGURE 11. Water surface and upper cavity boundary for strut model 0 at -8 degreesyaw angle for a speed of 30 fps. (Water surface elevation with no
cavitation is shown for reference).

IOSC/D0.9597Page 38
j Water elevationwith cavitation
Water elevation -L with no cavitation "M.IL
cavity boundary
LEADING EDGE
FIGURE 12. Water surface and upper cavity boundary for strut model 3 at -6 degrees yaw
angle for a speed of 30 fps and a surface vapor cavitation number of 0.24.
I = ..

LNSG/D019597Page 39
I -W
,ou
st ac-. Untbe/rwh
IF w Flow
yawed~ ~ ~ ~~~~~i stuVtrugriamn-lkeorexcrs
LOCKHEED MISSILES & SPACE COMPANY

LMSC/DO1g97?age 40
ELEVATION OF CAVITYAT QUARTR CHORD/CHORD
0.7
CAVITY ELEVATION
AT qUARTER CHORD0.6
CAVITY PERCENTAGELENGTH OF CHA14GE
XIN SIDF FORCECHORD
5 0.5 100SPRAY FRE
4 0.4 80
3 0.3 60
2 0.2 40
1 0.1 20
LEADINGEDGE WL 0
0.1 0.2
TIME SECONDS
FIGURE 14. Force and cavitation characteristics during ventilation transitionof strut model 2 at a yaw angle of -8 degrees for a speed of 30 fpsand a surface vapor cavitation number of 0.293

Ll4SC/D019597Page 41
JAPOR :A7ITATI0N NIJh3ERAT WATER SURFACE
0.8
.6 ....__ _ _ _ _ - -
I I--~-- - I
Tes conditionjwitlout ventilation
.3.
/ I Ts odto I /.2 M
entilation incep ion e condition:
* ______________ ventilati~n.1 5 t 1 1 1 -,
10 20 30 40 60 &) 10k
CARRIAGE SPEED (FPS)
FIGURE 15. Conditions of flow for strut model 0 at a yaw angl e of -8 degrees and asubmergence of 1.0 chords. (Solid symbol indicates ventilation.)
I'

LMSC/D0!9597Page 42
VAPOR CAVITATION NUIBERAT WATER SURFACE
0.8
.2 0 -kEV'RPA-D
.6
CARRIAGE SPEED (FPS)
FIGURE 16. Conditions of flow for strut model 2 at a yaw angle of -6 degreesand a submergence of i.0 chords. (Solid sT .ool indicates ventil.,tion).
I
LMSC/Dol9 597Page 43
vAPOR CAVITATION NUMBERAT WATER SURFACE
0.8
.6
0
NSRDC
.2 zi H
.15 ,I
10 20 3C LO 60 8K 1iC0
CARRIAGE SPEED (FPS)
FIGURE 17. Conditions of flow for strut model 2 at a yaw angle of -8 degreesand a subnergence of 1.0 chords. (Solid symbol indicates ventilation).
1,1
V.,-.

LMSC/D019597Page 44
0.8
.6
.4
.3
.2 -
.-5, 20 30 .0
CARRIAGE SPEED (FPS)
FIGURE 18. Conditions of flow for strut model 2 at a yaw angle of -10 degreesand a submergence of 1.0 chords. (Solid symbol indicates ventilation).

LMSC/D019597Page 45
tI
VAPOR CAVITATION NUNBERAT WATER SURFACE
.6 --
.3NSRD C
10 20 30 40
CAP.PTAGE SPEED (FPS)
FIGURE 19. Conditions of flow for strut model 2 at a yaw angle of -8 degreesand a submnergence of 1.5 chords. (Solid symbol indicates ventilation).

L-MSC/DO19597Page 46
VAPOR OpAXYTATION YT MBERAT WATER SURFACE
"I' -- . .. __ - ,
_ (EXTRAPOLATED)
10 20 30 10 . 1.o
CAR R-,GE SPEED (FPS)
FIGURE 20 Conditions of flow for strut model 3 at a yaw angle of -6 degreesand a submergence of 1.0 chords. (Solid symbol indicates ventilation).

L!'4Sr/DO19 597
Page 47
VAPOR CAVITATION NUMBERAT WATER SURFACE
0 . 8 ... .. , - -
.6
. 4 . ... . ..-. .
_____ S!.'.3 . -- 3
.2
.1510 20 0 8' ,(O
CAR'-AGE SPEED (FPS)
FIGURE 21 Conditions of flow for s trut model 3 at a yaw angle of -8 degreesand a submergence of 1.0 chords. (Solid symbol indicates ventilation).
41,

LIMSC/DO19597Page 48
VAFOR CAVITATION NUMBERAT 0.1 CHORD LENGTHS DEPTH
.8 0
MODEL 2_8o
.6 h/c= 1.0
0
O'vr .4 00
.3 0 NSRDCII
.20
.151
10 20 30 40 60 so 100
CARRIAGE SPEED (FES)
FIGURE 22. Conditions for ventilation inception of strut model 2 based onthe vapor cavitation number at a representative depth(0,I chord lengths). (Solid symbols indicate ventilation)

LMSC/D019597Page 49
I
- LUMF V = 30fs
NSRDC V > 75fps STRUT
0.4 MODEL
3
// 2
0.3 7 /
o 0.2I--
'--4
0
0 -2 -4 -6 -8 -10 SYAW ANGLE (DEGREES)
FIGURE 23. Vapor cavitation number for incipient ventilation at a submergence
of 1.0 chord lengths.

L-OC/DOl9597
SIDE FORCE COEFFICIENT Page 50
.10 T
.08
.06
.04 -. . .
-02 :1 -4 a
0 v
-.02 1-. 04 - LEGEND
I NOMINA-L VELOCITY
-.06 -0 20 FPS0 25 FPS
-. 08 A 30 FPS* SOLID - VENT-LATON
-. 10 - FLAGGED - BLOWING
-.12 - "I IIA It .
-.14 - I
-. 16 ._ -
-. 18 ,
-.20
DRAG COEFFICIENT
.15
.10 I
.05 --
0 0.2 0.4 0.6 0.8 1.0 2 4 6
VAPOR CAVITATION NUMBER AT WATER SURFACE
FIGURE 24; Side force and drag coefficient for strut model 0 at a yaw angleof -8 degrees and a submergence of 1.0 chord lengths.
: - . --

J.M.SC/DO.19 y';Page 51
SIDE FORCE COEFFICIENT.12
110
LEGEND.08 N01TIAL VELOCITY
x060 0 --,?S25 FFS30 FPS
.04 SOLID - !E-TI!ATIONFLAGGED - P-LowIr:G
.02
0 -
-. 02
-. 04
-. 06 A
-.08
-.10
-. 12 A AAA 0 A
-. 1L
-. 16
-.18
DRAG COEFFICIENT10
.08
AA.06 -
.04
.02
0 0.2 0.4 0.6 0.8
VAPOR CAVITATION NUMBER AT WATER SURFACE
FIGURE 25- Side force and drag coefficient for strut model 2 at a yaw angleof -6 degrees and a submergence of 1.0 chord lengths.

LMSc/Do19597
SIDE FORCE COEFFICIE5 Page 52.12
.10 kkA
.06
.04
.02 -
0
-.02
LEGEND-. 04 NOMINAL VELOCITY
-. 06 i O20 FPS(> 25 FPS
-. 08 A 30 FPSSOLID - VENTILATION
-. 10 FLAGGED - BLOWING
-.12 ---- A
-.14 0--]
.
-. 16 4, -
0
~-.18 - -- O0 I ..
-. 201-
DRAG COEFFICIENT.20
.15
.10 .
.05 0
00 0.2 0.4 0.6 0.8 1.0 2 4 6
VAPOR CAVITATION NUMBER AT WATER SURFACE
Figure26 Side force and drag coefficient for strut model 2 at a yaw angleof -8 degrees and a submergence of 1.0 chord lengths.

LMSC/DO19597SIDE FORCE COEFFICIENT Page 53
.10 q.oI A '
A-.08 A=-
.06
.04
.02
0,
-,02 LEGENDNOMINAL VELOCITY
-,06 0 20 FPS25 FFS
-.08 30 FPSSOLID - VENTILATIONFLAGGED - BLOWING
-.18 -
A!
-.12
-.16
-.18 -
-.2o0
-.20 0. 0 0
VTADRAG COEFFICIENT
anl f0. degee and a0ubegeceo 1.0 chr lenths.15OR AC
anl -0 0.2 ee 0 n4 o.6bege o 1.0 2r legts
-" "'l ''ir II 'r l . .. '" ... = ... A POR CAVITATIO NUMB,- .... WATER .. .,SU,-.R..FAC... E. . ,, ....... . ...... ...

ULSC/D019597
SIDE FORCE COEFFICIENT Page 5+
.10 L
.08
.06 0
.04
.02
0
-.02
LEG2ND-. 04 NOMINAL VELOCITY
-. 06 0 20 FIS25 FP-S
-. 08 A 30 FPSSOLID - VENTILATION
A FLAGGED - BLOWING-. 10
~A-. 12
-.14
-.16
-.18
-.20 0 - I I_ _ I fP
-.221
DRAG COEFFICIENT.20 -
0.10 I-
.05 -... . . i
0 0.2 0.4 0.6 0.8 1.0 2 4 6
VAPOR CAVITATION NUMBER AT WATER SURFACE
FIGURE 28: Side force and drag coefficient for strut model 2 at a yaw angleof -8 degrees and a submergence of1.5 chord lengths.
' " ' , ''I ' '
°f ...... - . . .. , ,r " , i .. , , i .. .... .. . - -- , -- , - ... . .-. .. .-: . . . . . . . . . .-

LMSC/D019597SIDE FORCE COEFFICIENT Page 55
.1
.10 --
.10
.08 -LEGEND 01-N0!NAL VELOCITY
.06-- - 20 FPS* 25 FS
.04A 30 FSSOLID - VENTILATIONFLAGGED- BLOWING
.02 . . ....
0
-.02
-.04
-. 06
-. 08A
-. 10 A
-. 12 A
-. 14 { A
-. 16-.
DRAG COEFFICIENT
.15 -- I
.10 4
.05
0 0.2 0.4 0.6 0.8 1.0 2 4 b
VAPOR CAVITATION NUMBER AT WATER SURFACE
FIGURE 29: Side force and drag coefficient for strut model 3 at a yaw angleof -6 degrees and a submergence of 1.0 chord lengths

SIDE FORCE COEFFICIENT I0S/D019597.2- k- Page 56
.12
.10 - .II
.08 -
.06
.04
.02
0
-.02
-. 04- LEGENDNOMINAL VELOCITY
-. 06
0 20 FFS* 25 FPS-.08 A
A 30 FPSSOLID - VENTILATION
-. 1I0 FLAG ZED -BLOWIN G
-.12
-.14 -
-. 16 I
-. 18 . _ I
-.20
-.22 j-. ..... -- *
-. 24DRAG COEFFICIENT
.15
.10 1-.-.-
.05
0 I '0 0.2 0.4 0.6 0.8 1.0 2 4 6
VAPOR CAVITATION NUMBER AT WATER SURFACE
FIGURE 30. Side force and drag coefficient for strut model 3 at a yaw angleof -8 degrees and a submergence of 1.0 chord lengths.

LMSC/D019597Page 57
SIDE FORCE CERGE~
V~ED MODEL 3
0.10
MODEL 2SIT
CIRCULAR ARC -
0DLO
YA-2- - 1
SITN CIRCULAR
% %N. ARC (REF. 3)
%NACA 64-C-.- (R61' " 4
-0.10%%
"N
CIRCULAR ARC N-0.20 Nb
%b %L-ETHOD(Ref. ~
LIFTING LIND THEORY(Ref. 14)
FIGURE 31. Average side force coefficients as a function of yaw anglefor strut models 0, 2, and 3 at a sulrn' rgence of 1 .0 chordlengths for a velccity of' 30 f^eet pur second. (FN 5-3
LW"