26 september 2017 - transport and travel in scotland … september 2017 transport and travel in...
TRANSCRIPT

26 September 2017
Transport and Travel in Scotland 2016 This bulletin provides the results of the Transport and Travel related questions asked in the Scottish Household Survey (including the travel diary) and uses data from a range of sources to provide context. The survey and travel diary had around 9,600 respondents in 2016.
This publication is split into 4 broad themes:
Personal travel Motor vehicles, traffic and driving Public transport and aviation Walking and cycling
This bulletin provides updates to two National Indicators, which form part of the Scotland Performs national framework – congestion, which shows performance maintaining, and public and active travel to work, which shows performance maintaining.
Overview of travel trends in Scotland Ferry, rail and air passenger numbers and distance cycled are estimated to have increased between 2012 and 2016, as has car traffic. Bus passenger numbers were lower in 2016 than five years ago. Compared to 2015, the biggest changes are an increase in the number of air passengers and a decrease in bus passenger numbers.
Table 1: Traffic and passenger numbers in Scotland, 2012 to 2016
2012 2015 2016 % change
over 1 year
% change over 5 years
Car traffic (m/veh km) on all roads &
33,777 34,669 35,362 2.0% 4.7%
Pedal cycles (m/veh km) on all roads &
310 343 352 2.6% 13.5%
ScotRail passengers (millions)$ 83 93 94 1.1% 13.3%
Bus passengers (millions)$ 421 409 393 -3.8% -6.7%
Air passengers (millions) 22 26 27 3.8% 22.7%
Ferry passengers in Scotland (millions)#
8 8 8 0.0% 0.0%
Sources: DfT, ORR, CAA, ferry operators (Not all National Statistics) Notes: $ Based on financial year, *provisional figures, # Does not include figures for passenger numbers on the Corran ferry service, &traffic estimates indicate the broad level of traffic, so year-on-year comparisons should be made with caution as they are estimated based on a small cross-section of Scottish roads, particularly for cycle traffic.

Contents INFOGRAPHIC SUMMARY SHEET .................................................................................................................. 3
NATIONAL INDICATORS .................................................................................................................................. 4
INTRODUCTION ................................................................................................................................................ 5
PERSONAL TRAVEL ........................................................................................................................................ 6
MOTOR VEHICLES, TRAFFIC AND DRIVING ............................................................................................... 10
PUBLIC TRANSPORT AND AVIATION .......................................................................................................... 13
WALKING AND CYCLING .............................................................................................................................. 17
STATISTICAL TABLES ................................................................................................................................... 19
SOURCES ........................................................................................................................................................ 21
BACKGROUND INFORMATION ..................................................................................................................... 22
2

2. NATIONAL INDICATORS
3

NATIONAL INDICATORS - DETAIL
30.6% of journeys to work were by Public or Active travel, a decrease on 2015 (31.4%). This figure provides an update to National Indicator 48. A one percentage point change is required to show performance improving or worsening. Since the difference is smaller, the indicator will show performance maintaining. Twelve per cent of journeys to work were on foot, ten per cent were by bus, five per cent were by train and just under three per cent were by bicycle.
11.7% of driver journeys were delayed due to congestion, a lower proportion than in 2015 (12.4%) and below the 2006 baseline. This figure provides an update to National Indicator 4. A two percentage point change is required to show performance improving or worsening. Since the difference is smaller, the indicator will show performance maintaining.
This bulletin provides updates to two National Indicators, which form part of the Scottish Government’s National Performance Framework. The National Performance Framework measures and reports on the progress towards the Scottish Government’s Purpose: creating a more successful country, with opportunities for all to flourish through increasing sustainable economic growth. Progress towards the Purpose is tracked by 7 Purpose Targets and supported by 16 National Outcomes - describing the kind of Scotland we want to be - and 50 National Indicators, covering key areas of health, justice, environment, economy, and education to measure progress.
National Indicator No. 4: Reduce number of driver journeys delayed due to traffic congestion
National Indicator No. 48: Increase the proportion of journeys to work made by public or active travel
FURTHER INFORMATION: For further information on the Scottish Government’s National Performance Framework, please visit: http://www.gov.scot/About/Performance/scotPerforms
4

3. INTRODUCTION
This bulletin provides the results of the Transport and travel related questions asked in the Scottish Household Survey, including information from the travel diary, and uses data from a range of other sources to provide some context around transport and travel in Scotland.
The bulletin includes information on a number of new questions in the Scottish Household Survey on plug-in electric cars or vans. Annex B features the results of a new piece of analysis on the accessibility of bus services in Scotland.
Most tables in TATIS provide estimates for single years where possible in order to maximise the utility of the data, with the caveat that care should be taken when using estimates with lower sample sizes. A lookup table for confidence intervals is included (Table A), which can be used in conjunction with the estimates and sample size, to give an indication of what inferences can reliably be made from the data. In some cases, where the sample size would be below 50 respondents, years have been combined or estimates suppressed.
Data sources are listed in Section 9 of this publication. Further explanation of definitions can be found in the relevant topic chapters of Scottish Transport Statistics https://www.transport.gov.scot/publication/scottish-transport-statistics-no-35-2016-edition/
Scottish Transport Statistics will be published in February 2018 and will contain a comprehensive statistical picture of transport statistics in Scotland. For a full list of transport statistics publications see: https://www.transport.gov.scot/publications/?publicationtype=1271
Jeanine Bezuijen
Transport Analytical Services Transport Scotland Victoria Quay Edinburgh EH6 6QQ Telephone: 0131 244 7256 or 0131 244 1457 [email protected]
5

4. PERSONAL TRAVEL
This section contains analysis and headline findings from the Scottish Household Survey questions relating to personal travel (including the Travel Diary part of the survey).
WHO TRAVELS?
Three quarters (75%) of adults travelled the previous day. The number of people travelling the previous day has decreased slightly from 77% in 2015. Men were more likely to have travelled than women; 76 per cent of men had travelled the previous day compared to 74 per cent of women. Older people were less likely to have travelled the previous day. Only 51 per cent of those aged 80 and over had travelled the previous day and 65 per cent of those aged 70 to 79. In the younger age groups, over seventy five per cent had travelled the previous day. [Table TD1]
WHY DO PEOPLE TRAVEL?
Most journeys were for the purpose of commuting (23%), shopping (23%) or visiting friends or relatives (11%). [Table TD3].
There has been little change in journey purpose since 2012.
Travel to Work
How do people travel to work?
Two thirds of people usually travelled to work by car / van, either as a driver (62%) or passenger (5%). Twelve per cent of people usually travelled to work on foot. Ten per cent of people usually travelled to work by bus and five per cent travelled by rail. Less than three per cent of people usually travelled to work by bicycle in 2016. [Table SUM1]
Who travels to work by which mode?
Women were more likely than men to walk or catch the bus to work. Men were more likely to cycle to work or travel by train. People in lower income households were more likely to walk or take the bus; people in higher income households were more likely to drive. People in rural areas were also more likely to drive than those in urban areas. Younger people (aged 16 to 29) were least likely to drive to work. [Table 7]
Why do people choose these modes?
Of those who drive to work, 46% said that they could use public transport. The main reasons for not using public transport were that it takes too long (42% of respondents) and that there is no direct route (23% of respondents). [Table 13 and Table 14]
Thirteen per cent of people car shared in 2013-2016. Of these, the majority (92%) arranged it between themselves, with only 8% organising it through their employer. The
30.6%of people usually travelled to work by public or active travel in 2016.
6

Personal Travel
main reasons given for not car sharing were that nobody from work lives nearby (63%) and the lack of regular work hours (23%). [Table 11]
Relatively few people have changed the mode of transport they used to get to work. Of all the modes, driving seems to be most resistant to change. Based on data for the last 5 years, of those who drove to work a year ago, 98 per cent still drove to work. For other modes, the biggest shift was to driving; eight per cent of those who cycled and 5 per cent of those who walked a year ago now reported driving. [Table 10]
The main reasons given by respondents for changing their usual mode of travel to work in 2016 were changing job (39%) and moving house (20%). [Table 10a]
Of those who didn’t cycle to work in 2014, the main reason given for not doing so was ‘it’s too far’ (33%), followed by ‘too many cars on the road’ (18%). ‘The weather’ and ‘traffic travels too fast’ accounted for 16 per cent and 12 per cent respectively. [Table 26]
Travel to School
How do children travel?
Around half of children (52%) walked to school, nineteen per cent travelled by bus and around a quarter (26%) travelled by car. [Table SUM1]
There was variation in mode of travel by age. In the 4 to 11 age group, 58 per cent reported walking to school, compared to 42 per cent in the 12 to 18 age group. Older children were more likely to catch a bus than younger children; 35 per cent compared to 9 per cent. [Table 15]
The Sustrans Hands Up Scotland publication also covers travel to school. Due to the use of different categories, it is not possible to make a direct comparison with the Scottish Household Survey: http://www.sustrans.org.uk/scotland/what-we-do/schools-and-universities/hands-scotland
Why do parents choose these modes?
Of those walking, eighty nine per cent did so because the school is close by. Of those travelling by car, most parents used this because it was the most convenient mode (39%). Parents also chose to use the car because it was too far to walk (16%) and because it was the safest method (15%). ‘Most convenient’ also was the most popular reason for children traveling by school bus (43%) and service bus (39%). The second most popular reason for those who travel by school bus (20%) or service bus (24%) was that it was too far to walk. [Table 16]
The main reason for primary children not using public transport was that ‘they are too young to travel on own’ (54%). For secondary-aged children the main reasons were that parents ‘prefer to use the car’ (34%) or ‘no service available’ (28%). [Table 17]
7

Personal Travel
11.7% of driver journeys were perceived to be delayed due to congestion in 2016, a decrease on 2015 (12.4%).
WHEN DO PEOPLE TRAVEL?
Slightly more journeys were reported on weekdays (14-15% of journeys on each day) than at weekends, with most journeys reported on Wednesdays, Thursdays and Fridays (15% of journeys) and least travel reported on Sundays (12% of journeys). [Table TD8]
Peak travel on a weekday was between 7 am and 9:30 am (19% of weekday journeys started between these times). The afternoon peak is more spread out with 17 per cent of journeys starting between 2 pm and 4:30 pm and another 16 per cent starting between 4:30 pm and 6:30 pm. The busiest time for travel on the weekend is between 12 noon and 2pm, with slightly less than a quarter (24%) of weekend journeys taking place between these times. Twenty nine per cent of weekend journeys start before noon and 47% of journeys staring after 2pm.
There has been little change in these travel patterns reported in the survey over recent years. [Table TD7 and Table TD8]
Duration
Most journeys were short: sixty nine per cent of journeys lasted up to 20 minutes, with thirty seven per cent lasting between five and ten minutes. Only seventeen per cent of journeys lasted more than half an hour, of which around five per cent lasted more than an hour. [Table TD6]
Perceptions of Congestion
The main reason suggested for delays was ‘volume of traffic’ (79%), up from 76 per cent in 2015. Delays as a result of road maintenance have risen from 28 per cent in 2015 to 29 per cent in 2016. [Table TD10a]
Around twelve per cent (11.7%) of car driver journeys were perceived to be delayed due to congestion in 2016, a decrease on 2015 (12.4%). This provides an update to National Indicator 4, which will show performance maintaining. Ten per cent of bus journeys were delayed due to congestion, a similar figure to 2015. [Table TD11]
Around half (51%) of all journeys to work were perceived to not be affected by congestion but the proportions were lower for car driver and bus journeys (37% of car driver journeys and 37% of bus journeys), indicating that these groups experience congestion more frequently. Forty one per cent of people who drive to work reported experiencing congestion at least once a week. The proportion was 43 per cent for buses. [Table 8]
Around a quarter (25%) of drivers allowed no extra time for congestion on their journey to work, over a third (35%) allow ten minutes or less. For bus passengers, thirty per cent allowed no extra time and thirty one per cent allowed ten minutes or less. [Table 8]
Twenty one per cent of driver commuting journeys and eighteen per cent of driver business journeys were delayed by congestion. Journeys for medical appointment (18%) were also affected by congestion. Weekday journeys were more frequently affected by congestion than weekend journeys. As would be expected, the morning and evening peak
8

Personal Travel
periods on weekdays saw the highest proportion of driver journeys delayed by congestion: twenty two per cent for journeys starting between 7 and 9 am and twenty seven per cent between 5 and 6 pm. [Table TD12]
HOW DO PEOPLE TRAVEL? Driving remained the most popular mode of transport: 51 per cent of journeys were made as a car or van driver, the same level as in 2015. A further 13 per cent were made as a passenger. [Table TD2 and Table SUM1]
The second most used mode of transport was walking at 24 per cent, an increase from 22 per cent in 2015. [Table TD2 and Table SUM1]
Around eight per cent of journeys were made by bus, a decrease from 10 per cent in 2015. There has been little change in share for other modes of transport with two per cent of journeys made by rail and around one (1.2) per cent by bicycle in 2016. [Table TD2]
Similar estimates of modal share were seen when looking at journey stages. [Table TD2b]
Use of multiple modes
Three per cent of journeys reported in the Travel Diary in 2016 were multi-stage. Three quarters of multi-stage journeys reported consisted of two stages. [Table TD2c]
Multi-stage journeys are highest for ferry and air travel. Ferry journeys have an average of 1.83 stages, aeroplane journeys have an average of 1.95 stages. For rail the average is 1.62 stages per journey and for all other modes the average number of stages per journey is only just over one. [Table TD2c]
WHERE DO PEOPLE TRAVEL?
Most journeys in Scotland started and finished in the same local authority. The proportion was highest in Grampian (Aberdeen City, Aberdeenshire and Moray), where 98% of journeys started and finished in the same area, and Highlands and Islands, where this was the case for 97% of all journeys. The proportion was lowest in Glasgow and South Lanarkshire, where 72% of all journeys started and finished in the same council area. [Table TD13 and TD14]
HOW FAR DO PEOPLE TRAVEL?
Around a fifth (20%) of journeys were under 1 km, and more than half (55%) of journeys were under 5 km. These numbers are broadly similar to 2015. [Table TD4] The median journey length was 4 km and the mean journey length was 19.8 km. [Table TD5]
Walking journeys had the shortest average (mean) length (3.8 km), then taxi/minicab(4.9 km). The average car driver journey was 22.8 km, bus journeys averaged 19.3 km and rail journeys had the longest average length at 62.3 km. [Table TD5a]
Slightly less than two thirds (65%) of journeys under 1 km were made on foot; car or van journeys accounted for most of the remainder (32%). [Table TD2a]
9

5. MOTOR VEHICLES, TRAFFIC AND DRIVING
This section contains analysis and headline findings from the Scottish Household Survey questions on driving and car access (including the Travel Diary part of the survey), as well as comparisons with data from a range of other sources.
DRIVING LICENCES
Sixty nine per cent of the population (17+) had a driving licence in 2016, a slight increase compared to sixty eight per cent in 2015. [Table SUM1 and Table 1]
Three quarters (75%) of men aged 17+ had a driving licence, compared to 63 per cent of women. There has been a narrowing of this gap over the years of the survey. [Table 1 and Figure 1]
Figure 1: Driving licence possession by gender
Driving licence possession was lowest amongst younger and older people (17-19: 30% and 80+: 43%) and highest amongst those aged 40-49 (81%). [Table 1]
Driving licence possession increased with net annual household income (46% for adults in households with less than £10,000 of income compared to 89% in households with an income over £40,000). [Table 19]
Driving licence possession is more common in rural areas (62% of adults in large urban areas have a driving licence, compared to 82% of those in remote rural areas). [Table 19]
10

Public transport, aviation and ferries
CAR AND VAN ACCESS
Seventy one per cent of households had access to one or more cars or vans for private use in 2016. Twenty nine per cent of households had access to two or more cars (or vans). [Tables 18 & SUM1]
Car access increases with household income, as does the number of cars available per household: seven per cent of households with an annual income up to £10,000 had access to two or more cars, compared to sixty nine per cent of households with an annual income of more than £40,000. [Table 18]
Households in rural areas were more likely to have access to a car than those in urban areas, and households in rural areas were also more likely to have access to more than one car than households in urban areas. [Table 18]
FREQUENCY OF DRIVING
Sixty nine per cent of those aged 17+ drove at least once a week in 2016, with 42 per cent driving every day. [Tables 20 & SUM1]
Frequency of driving increased with income and with rurality. Thirty five per cent of adults in large urban areas drove every day compared to forty nine per cent of adults in remote rural areas. Twenty per cent of adults living in households with a total annual income of under £10,000 drove every day, compared to sixty three per cent of those who lived in households with a total annual income of over £40,000. [Table 20]
CAR OCCUPANCY
The average car occupancy was 1.5 people in 2016; the rate has remained similar in recent years. The proportion of single occupancy journeys has seen increases in recent years and accounted for around two thirds (67%) of car journeys in 2016, an increase from 62% in 2007. [Table TD9]
FUEL SPEND
The average amount which households spent on fuel in the last month fell slightly between 2015 and 2016, from £109.20 to £105.60. The median figure, however, remains at £80. [Table 2]
LICENSED VEHICLES
There were 270,000 new vehicles registered in Scotland in 2016, the highest number of new registrations since 2007. [Table SUM2]
11

Public transport, aviation and ferries
The number of vehicles licensed for use on the roads increased by 1.5 per cent from 2.82 million to 2.86 million between 2014 and 2015. [Table SUM2]
More detailed statistics on vehicles licensed in Scotland can be found in the Road Transport Vehicles Chapter of Scottish Transport Statistics.
ROAD NETWORK
There are 56,250 kms of road in Scotland. Of this, 6.5 per cent (3,669 km) is Trunk road, the remaining 52,581 km are managed by Local Authorities. [Table SUM2]
More detailed statistics on the road network in Scotland can be found in the Road Network chapter of Scottish Transport Statistics.
ROAD TRAFFIC
The estimated volume of traffic on Scotland’s roads was at its highest ever - 46.4 billion vehicle kilometres in 2016, an increase on 2015 and slightly above the previous recent peak in 2007 of 44.7 billion. [Table SUM2] More detailed statistics on road traffic in Scotland can be found in the Road Traffic chapter of Scottish Transport Statistics.
REPORTED ROAD CASUALTIES
Provisional figures show a total of 10,881 road casualties reported to the police in 2016 (1%, fewer than in 2015), the lowest figure since records began in 1950. Of these, there were 191 fatalities; 23 (14%) more than in 2015. There were 1,693 serious injuries; 93 (or 6%) more than in 2015 and 8,997 slightly injured: 209 (or 2%) fewer than in 2015. More detailed statistics can be found in Key Reported Road Casualties.
ELECTRIC VEHICLES
In 2016, the Scottish Household Survey contained a number of new questions on plug-in electric cars or vehicles. Thirty six per cent of respondents said they would consider buying an electric car or van; forty nine per cent said they would not. Less than one per cent of respondents said they already owned an electric car or van. [Table 49]
Of the people who had bought or would consider buying a plug-in electric car or vehicle, the main reason was that these vehicles are environmentally friendly (68%) and fuel or running costs (64%). [Table 50] For those who said they would not consider buying an electric vehicle, the distance travelled on a single charge (46%) and the availability or convenience of charging points (also 46%) were the main deterrents. [Table 51]
12

Public transport, aviation and ferries
6. PUBLIC TRANSPORT AND AVIATION This section contains analysis and headline findings from the Scottish Household Survey questions on public transport (including the Travel Diary part of the survey), as well as comparisons with data from a range of other sources.
SATISFACTION WITH PUBLIC TRANSPORT
Seventy two per cent of people were very or fairly satisfied with public transport in 2016, a decrease on 2015 (74%). The proportion of people that are very satisfied has decreased slightly from 23 per cent to 21 per cent. [Table 4]
LOCAL BUS SERVICES
Provisional figures indicate that there were 393 million bus journeys made in Scotland in 2016/17, a reduction from 409 million in 2015/16. [Table SUM2]
Twenty eight per cent of adults used the bus at least once a week. Fifty nine per cent had not used it in the past month. [Table 28]
Women tended to use buses more frequently than men (30% of women used the bus at least once a week compared to 25% of men). [Table 28]
Frequency of bus use differed across age groups and was highest amongst younger people (41% of 16-19 year olds had not used the bus in the last month). It was lowest in people aged between forty and fifty nine, and increased again for people over sixty, presumably due to the concessionary travel scheme. [Table 28]
Frequency of bus use was also higher in urban areas (41% of people in large urban areas use the bus at least once a week compared to 11% in remote rural areas). [Table 28]
People were satisfied with most of the aspects of bus services asked about in the survey. Agreement was highest for respondents feeling safe and secure during the day (93%), for finding it simple to decide which ticket to use (88%) and for finding routes and times easily (83%). Lowest levels of agreement were with fares being good value (61%) and buses being environmentally friendly (62%). [Table 29]
When asked what discourages them from using the bus more, 20 per cent said they had no need to use the bus more, 19 per cent of respondents said they used their own car and 19 per cent said it takes too long. Eighteen per cent indicated nothing discourages them from using the bus more often than they do. [Table 41]
Further bus statistics can be found in the Bus and Coach Chapter of Scottish Transport Statistics.
Concessionary travel
The National Concessionary Travel Scheme was rolled out across Scotland in April 2006. The scheme enables individuals aged 60+ or those with a disability (who meet certain criteria) to travel free on buses across Scotland.
13

Public transport, aviation and ferries
There were 143 million concessionary travel journeys in 2015-16 (the latest year for which data are available), accounting for 35 per cent of all bus journeys in that year. [Table 2.2a Scottish Transport Statistics]
Eighty-seven per cent of adults aged 60+ hold a National Concessionary Travel pass in 2016, a similar figure to previous years. Twenty nine per cent of adults aged 16+ hold a pass. [Table 5]
Of those aged 60+, thirty seven per cent have a card and use it at least once a week (10% use it every day or almost every day). Thirty three per cent have a pass but had not used it in the last month. [Table 32]
Those living in urban areas use their pass more frequently than those living in rural areas. Women use their pass more frequently than men (43% of women aged 60+ have a pass and use it at least once a week, compared to 31% of men aged 60+). [Table 32]
Statistics on concessionary journeys, and card holder numbers from the National Concessionary Travel administrative systems, are included in Bus and Coach Chapter of Scottish Transport Statistics.
Accessibility
Annex B provides the results of analysis on the accessibility of bus services in Scotland, carried out by the GI-SAT team in Scottish Government. The Scottish Access to Bus Indicator (SABI) gives a score for the accessibility of bus services in each data zone and provides an objective measure of accessibility to public transport by bus in Scotland.
The analysis was based on Traveline data, which was used to find all bus stops within a 400 meter walking distance, by path or road, of each 2011 Census Output Area Centroid in Scotland. For each centroid, the total frequency of buses per hour for each bus stop within 400 meter was summed. This resulted in a total average number of buses per hour accessible within 400 meter of each output area centroid, on both weekdays and at the weekend. Transport Scotland chose the 400 meter distance to walk to a bus stop, in line with DfT work and wider public transport planning guidance.
The indicator provides separate scores for weekday and weekend services. The output areas are aggregated to data zones using a population weighted average. The datazones are then ordered by quintile and decile, from least to most accessible.
As the maps show, weekday access to bus services is highest in urban areas, in the central belt and Aberdeen. Outside these areas, access to bus services is poorer. The results are similar for weekend access.
The tables confirm this picture. The weekday scores by quintile show that 48.1% of all datazones in large urban areas are in the most accessible quintile. For remote rural areas, only 0.1% is in the most accessible quintile, and 82.6% is in the least accessible quintile. [SABI table 3]
The full dataset is available for download on statistics.gov.scot
14

Public transport, aviation and ferries
RAIL TRAVEL
There were 94.2 million passengers carried by ScotRail in 2016, a small increase on 2015. [Table SUM2]
Nine per cent of the population (16+) reported using the train at least once a week in 2016. Seventy one per cent had not used the train in the last month, a decrease from seventy seven per cent in 2007. [Table 28 and Table SUM1]
The proportion of people who reported that they hadn’t used the train in the last month increased with age (59% of those aged 16-19 hadn’t used the train in the last month, compared to 91% of those aged 80+). [Table 28]
Train use was higher in higher income households (79% of those interviewed with a household income of less than £10,000 had not used the train in the last month, compared to 60% for those in households with an income of more than £40,000. [Table 28]
Of those who had used the train in the last month, the most frequent journey purpose was shopping (35%), followed by visiting friends or relatives (25%) and other recreational activities (20%). [Table 44]
People were satisfied with most aspects of rail services that the survey asks about. The level of agreement was highest with personal safety during the day (95%), ease of finding out about routes and times (90%) and ease of finding out what ticket is needed (87%). The lowest level of agreement was with the statement that train fares are good value (56%). [Table 30]
When asked what discourages train users from using the train more, the main reason given, other than nothing (53%) or “no need” (15%) was cost (12%) with the next largest proportion being ‘no nearby station’ (8%). For those who hadn’t used the train in the previous month, the main reasons were “nothing” (34%), “no need” (24%), “no nearby station” (19%), cost (9%) and “health reasons” (5%). [Table 42 & 42a]
Detailed rail statistics can be found in the Rail Chapter of Scottish Transport Statistics.
AVIATION
Air terminal passengers increased from 2015 to 2016, from 25.5 million to 26.9 million. [Table SUM2]
In 2016, 50 per cent of people had flown for leisure purposes, an 4 percentage point increase on 2014, when this data was last collected. Eight per cent of people had flown for business, a similar figure to 2014. [Table 37a and 38a]
Photo courtesy of ScotRail
15

Public transport, aviation and ferries
Of those who flew for leisure in the last 12 months, 44% made up to two flights (return flights count as two, as does changing flights), and around a quarter made three to four flights (26%). There was an increase in the mean and median number of flights compared to 2014. [Table 37b]
Most people who flew for leisure flew to Europe. Of those who flew for leisure in the last 12 months, 74% made at least one flight to Europe in the previous year. Five per cent made at least one flight within Scotland, 30% made at least one flight to the rest of the UK and 33% made at least one flight out of Europe. [Table 37b]
Of those who flew for business in the last 12 months, most took up to two flights (35%), followed by three or four flights (17%). Over half of people who travelled for business took four flights or fewer. Around 15% took more than twenty flights (returns count as two, as does changing flights). There was a decrease in the mean and median number of business flights compared to 2014. [Table 38b]
Most people who fly for business flew within the UK. Of those who flew for business in the last 12 months, 73% had flown to the rest of the UK. Eleven per cent had flown within Scotland, 35% had flown to Europe and 21% had flown outside of Europe. [Table 38b]
The majority of people flying for business or leisure within the UK did so because it was quicker than alternative modes (84%). Just under a quarter (24%) did so because it was cheaper. [Table 39]
Detailed aviation statistics can be found in the Aviation Chapter of Scottish Transport Statistics.
CHANGING MODES Most users (84%) reported no difficulties changing between modes of public transport. Six per cent reported that they had a long wait between journeys and four per cent reported not having enough time to change modes. A lack of information about connecting modes was reported by three per cent of users. [Table 45]
16

7. WALKING AND CYCLING
This section contains analysis and headline findings from the Scottish Household Survey questions on cycling and walking (including the Travel Diary part of the survey).
CYCLING
Distance cycled on all roads is estimated to have increased from 343 million vehicle kilometres in 2015 to 352 million vehicle kilometres in 2016. [DfT traffic estimates 2016] Traffic estimates indicate only the broad level of traffic, so year-on-year comparisons should be made with caution as they are estimated based on a small cross-section of Scottish roads.
One per cent of journeys had cycling as the main mode of transport, a similar proportion to 2015. [Table SUM1 & TD2] The average (mean) cycling journey was 7.6 km in length, using road network distance. [Table TD25a]
Just less than three (2.6%) per cent of adults usually cycle to work, compared to 2.2 per cent in 2015. Just less than two per cent (1.4%) of children cycled to school. [Tables 7, 15 & SUM1]
Figure 2: Percentage of adults cycling at least once per week by age, 2016
Bicycle access
A third (34%) of households had access to at least one bicycle for adult use in 2016. Eighteen per cent had access to two or more. [Table 18]
Household access to bikes increased with household income and household size; 60% of households with an income of £40,000 or more have access to one or more
17

bikes, compared to 19% of households with an income up to £10,000. Bicycle access was higher in rural areas than urban areas. [Table 18]
WALKING
Off all journeys reported in the SHS travel diary, 24 per cent had walking as the main mode, an increase from 2015. Twelve per cent of adults usually walk to work and 52 per cent of children usually walk to school as their main mode of transport. [Tables 7, 15, TD2 & SUM1]
The median walking journey was just under one kilometre in length. [Table TD5a]
Two thirds of people had walked as a means of transport on at least one day in the previous week. Twenty three per cent had walked as a means of transport on 6-7 days. Sixty one per cent of people had walked for pleasure at least once in the last week, an increase from 2014. [Table 3a]
Frequency of walking decreased with age (77% of those aged 16-19 had walked to go somewhere in the last week, compared to 44% of those aged 80+). [Table 25]
Figure 3: Percentage walking at least once per week by age, 2016
When respondents were asked what discourages them from walking more, the main reasons given, other than nothing (54%) were weather (18%) and health (16%). [Table 43]
18

8. STATISTICAL TABLES
SHS TRANSPORT AND TRAVEL TABLES Table SUM1 Summary of Scottish Household Survey results Table SUM2 Summary of Transport in Scotland Table 1 People aged 17 or over –full driving licence: 2007-2016 Table 2 Amount spent of fuel in the past month: 2009-2016 Table 3a Frequency of walking in the previous seven days: 2007–2016 Table 3b Frequency of cycling in the previous seven days: 2007–2016 Table 4 Adults views on satisfaction* of public transport: 2010-2016 Table 5 Possession of a concessionary fare pass: 2007-2016 Table 7 Employed adults not working from home -usual method of travel to work: 2016 Table 8 Effects of traffic congestion on travel to work journey: 2012-2016 Table 10a How random adult usually travelled to work a year ago by current main mode of travel: 2012-2016 Table 10b Reason for changing mode of travel to work: 2012-2016 Table 11 Car sharing journeys to work: 2013-2016 Table 13 Employed adults method of travel to work and whether they could use public transport: 2016 Table 14 Reasons why public transport is not used for travel to work: 2012-2016 Table 15 School children in full-time education, usual method of travel: 2016 Table 16 Reasons for transport choice to children's full time education establishment: 2012-2016 Table 17 Reasons why public transport is not used by school children: 2012-2016 Table 18a Households with bicycles available for private use: 2016 Table 18b Households with cars available for private use: 2016 Table 19 People aged 17+ that hold a full driving licence: 2016 Table 20 People aged 17+, frequency of driving: 2016 Table 21 Part driving/parking journeys: 2009-2015 Table 22 Mode of transport used in conjunction with driving by where parked: 2009-2015 Table 25a Frequency of walking in the previous seven days: 2016 Table 25b Frequency of cycling in the previous seven days: 2016 Table 26 Reasons why do not cycle to work: 2009-2014 Table 28 Adults use of local bus and train services, in the past month: 2016 Table 29 Adults (16+) who have used the bus in the previous month, views on their local bus services: 2016 Table 30 Adults (16+) who have used the train in the previous month, views on their local train services: 2016 Table 31 Possession of concessionary fare pass for all adults aged 16+: 2016 Table 32 Possession of concessionary fare pass for all adults aged 60+: 2016 Table 33 Access to services that respondents thought were very or fairly convenient: 2016 Table 37 Whether taken flights for leisure in the last 12 months: 2012-2016 Table 38 Whether taken flights for business in the last 12 months: 2012-2016 Table 39 Reasons for choosing flying within the UK over other modes of transport: 2012-2016
19

Table 41 In general, What discourages you from using buses more often than you do?: 2012-2016 Table 42 In general, What discourages you from using trains more often than you do?: 2012-2016 Table 43 In general, What discourages you from walking more often than you do?: 2012-2016 Table 44 Purpose of train journeys: 2012-2016 Table 45 Difficulties experienced when changing between public transport: 2012-2016 Table 46 Awareness of sustainable transport policies: 2016 Table 47 Uptake of sustainable transport policies: 2016 Table 49 Would you consider buying a plug-in electric car or van?: 2016 Table 50 Reasons for having bought or would consider buying a plug-in electric car or van: 2016 Table 51 Reasons for not considering to buy a plug-in electric car or van: 2016
SHS TRAVEL DIARY TABLES Table TD1 Percentage of adults travelling on previous day: 2007-2016 Table TD2 Percentage of journeys made by main mode of travel: 2007-2016 Table TD2a Percentage of journeys by main mode of travel and distance: 2016 Table TD2b Percentage of stages by main mode of travel: 2007-2016 Table TD2c Multi Stage journeys Table TD3 Percentage of journeys made by purpose of travel: 2007-2016 Table TD4 Percentage of journeys made by distance of travel: 2007-2016 Table TD4a Percentage of journeys made by distance and main mode of travel: 2016 Table TD5 Distance summary statistics: 2007-2016 Table TD5a Distance summary statistics by mode of transport: 2016 Table TD6 Percentage of journeys made by duration of journey: 2007-2016 Table TD7 Percentage of journeys made by start time of journey: 2007-2016 Table TD8 Percentage of journeys made by day of travel: 2007-2016 Table TD9 Percentage of car stages by car occupancy: 2007-2016 Table TD10 Percentage of car/van stages delayed by congestion: 2007-2016 Table TD10a Reason for congestion for car/van stages: 2013-2016 Table TD11 Percentage of bus stages where passenger experienced delay: 2007-2016 Table TD12 Percentage of driver stages where delay experienced by amount of delay: 2016 Table TD13 Percentage of journeys originating in each council area by destination council area: 2007-2016 (combined) Table TD14 Percentage of journeys ending in each council area by area of origin: 2007-2016 (combined) Table TD15 Percentage of employed people resident in each council area by council area of workplace: 2007-2016 (combined) Table TD16 Percentage of employed people in each council area by council area of residence: 2007-2016 (combined) Table A 95% confidence limits for estimates, based on SHS sub-samples sizes Annex A Straight line distance
OTHER TABLES Annex B Scottish access to bus indicator Local Authority tables will be published online at http://bit.ly/2wLA2WV
20

Table Sum 1 Summary of Scottish Household Survey results 1
2007 2008 2009 2010 2011 2012 2013 2014 2015 2016column percentages
Modal share of all journeys 3
Walking 22.0 22.2 21.8 22.0 22.1 26.0 23.3 25.0 21.6 23.5Driver car/van 50.2 49.8 51.0 51.1 49.9 48.3 50.0 48.1 49.7 50.6Passenger car/van 13.4 13.8 13.3 14.3 13.1 12.7 13.6 13.0 13.3 13.1Bicycle 0.7 1.0 0.9 0.8 1.3 1.2 1.0 1.4 1.2 1.2Bus 9.3 9.1 8.6 8.7 9.1 8.1 8.5 8.6 9.5 7.7Taxi/minicab 1.5 1.5 1.4 0.8 1.3 1.3 1.6 1.2 1.3 0.9Rail 1.7 1.6 1.9 1.4 2.0 1.8 1.7 2.1 1.7 2.2Other 1.1 1.0 1.0 1.0 1.2 0.7 0.3 0.6 0.6 0.7
Sample size (=100%) 20,520 20,450 18,680 16,300 17,590 19,740 20,180 19,930 18,710 19,050
Place of workWorks from home 11.2 10.0 11.4 10.1 10.6 13.2 13.3 13.1 14.1 14.5Does not work from home 88.8 90.0 88.6 89.9 89.4 86.8 86.7 86.9 85.9 85.5
Sample size (=100%) 5,890 6,090 6,100 5,860 6,190 4,730 4,850 4,810 4,670 4,720
Travel to work 2
Walking 11.9 12.5 12.3 13.4 12.9 13.6 12.9 12.9 13.6 12.3Car or Van 68.0 66.0 67.0 67.3 66.6 67.3 66.2 67.7 65.9 67.0
Driver 61.3 59.9 60.7 61.0 59.1 61.4 60.6 61.6 60.3 61.7Passenger 6.7 6.1 6.4 6.3 7.5 6.0 5.6 6.0 5.6 5.3
Bicycle 1.7 2.3 2.4 2.3 2.0 2.0 2.5 2.6 2.2 2.6Bus 12.7 12.1 12.1 10.8 12.0 10.1 11.3 10.2 11.2 10.4Rail, including underground 3.5 4.3 3.9 3.6 3.9 4.3 4.0 4.2 4.4 5.2Other 2.3 2.7 2.3 2.7 2.6 2.6 3.1 2.5 2.7 2.4
Sample size (=100%) 5,180 5,440 5,370 5,220 5,510 4,100 4,160 4,130 3,950 3,970
% Public and Active Travel (National In 29.7 31.2 30.7 30.1 30.8 30.1 30.7 29.8 31.4 30.6
Travel to schoolWalking 52.8 48.8 50.0 49.7 50.6 51.4 51.7 51.2 48.8 51.8Car or Van 21.9 23.6 24.4 23.0 23.4 24.1 24.4 24.5 25.8 25.6Bicycle 0.8 1.5 1.0 1.4 1.4 0.8 1.2 1.7 1.2 1.4Bus (school or service) 21.9 23.9 22.0 23.9 21.7 21.1 19.9 20.3 21.0 19.3
School bus 14.8 16.5 16.0 16.1 15.1 14.9 14.5 14.5 15.3 12.9Service bus 7.1 7.3 5.9 7.8 6.6 6.2 5.4 5.8 5.7 6.4
Rail, including underground 0.9 0.7 0.7 0.3 0.7 0.4 0.6 0.7 1.1 0.5Other 1.7 1.5 1.8 1.7 2.2 2.2 2.2 1.7 2.1 1.5
Sample size (=100%) 2,520 2,750 2,880 2,680 2,720 1,920 1,980 1,980 1,880 1,890
Household access to car4 / bikeNo car 30.3 30.2 30.7 30.3 30.1 31.0 30.2 30.8 30.0 27.6One car 44.3 43.9 43.7 44.0 44.5 43.0 44.0 43.3 43.3 43.2Two Cars 21.4 21.9 21.5 21.6 21.0 21.3 21.3 21.1 21.7 23.5Three or more cars 4.0 4.0 4.2 4.1 4.4 4.7 4.6 4.7 5.1 5.7
One or more cars 69.7 69.8 69.3 69.7 69.9 69.0 69.8 69.2 70.1 72.3Two or more cars 25.3 25.8 25.6 25.7 25.4 26.0 25.8 25.9 26.8 29.2
1+ Bicycles which can be used by adults 36.9 36.8 35.5 34.3 35.1 35.0 34.3 34.4 35.1 33.8
Sample size 13,410 13,820 14,190 14,210 14,360 10,640 10,650 10,630 10,330 10,470
Driving (aged 17+) Those with a full driving licence
Male 75.8 76.0 76.2 75.6 75.6 75.6 76.0 75.8 73.4 75.4 Female 59.2 59.9 60.6 60.2 59.8 61.6 61.4 61.8 63.1 63.1 All 67.0 67.6 68.0 67.6 67.3 68.3 68.4 68.5 68.0 69.0
Frequency of driving Every day 45.2 44.9 43.4 41.4 40.7 42.0 41.9 40.9 40.9 42.2At least three times a week 10.0 10.4 11.9 12.8 13.3 13.1 13.3 13.9 14.5 14.3Once or twice a week 5.1 5.6 5.6 6.0 6.2 6.0 5.6 5.9 5.9 6.0At least 2-3 times a month 0.9 1.0 0.9 0.9 0.9 0.8 1.0 0.9 0.8 1.0At least once a month 0.6 0.4 0.4 0.4 0.4 0.3 0.5 0.7 0.5 0.5Less than once a month 1.7 1.3 1.6 1.8 1.7 1.7 1.6 1.8 1.4 1.6Holds full licence, never drives 3.5 4.0 4.2 4.3 4.1 4.5 4.5 4.3 4.0 3.4Does not have a full driving licence 33.0 32.4 32.0 32.4 32.7 31.7 31.6 31.5 32.0 31.0
Sample size (=100%) 12,150 12,260 12,450 12,360 12,800 9,830 9,840 9,720 9,340 9,570
Percentage of car / van stages delayed by traffic congestion
National Indicator 4 14.4 13.1 11.0 10.5 11.2 9.9 9.7 11.7 12.4 5 11.7
Sample size (=100%) 9,260 9,320 8,680 7,580 8,310 9,830 10,200 9,820 9,690 9,790
Frequency of use of local bus/train service (aged 16+)Bus service
Every day or almost every day 12.3 12.6 11.3 11.0 11.1 9.3 11.3 9.7 11.7 9.32 or 3 times per week 11.7 12.2 11.8 11.7 12.5 11.0 11.4 11.3 11.6 10.6About once a week 7.7 7.8 8.4 7.7 7.8 7.8 7.8 7.6 8.1 7.7Once or twice a month 13.9 13.9 14.1 13.5 14.2 13.7 14.1 13.6 14.3 13.2Not used in the past month 54.4 53.6 54.5 56.1 54.3 58.2 55.4 57.7 54.2 59.2
Train serviceEvery day or almost every day 2.0 2.3 2.1 1.9 2.0 2.5 2.2 2.2 2.1 2.3
2 or 3 times per week 1.8 2.0 2.1 1.9 2.2 2.4 2.5 2.1 2.5 2.1About once a week 3.2 3.2 3.7 3.5 3.7 4.2 4.0 5.0 4.4 4.2Once or twice a month 16.3 16.4 15.9 17.3 17.9 19.1 19.5 21.2 20.7 20.8Not used in the past month 76.6 76.1 76.2 75.5 74.2 71.8 71.8 69.5 70.2 70.5
Sample size (=100%) 12,120 12,300 12,520 12,420 12,890 9,890 9,920 9,800 9,410 9,640
1. The apparent year-to-year fluctuations in some of the figures may be due to sampling variability.2. Employed adults (aged 16+) not working from home3. The Travel diary methodology changed in 2007 and in 2012, creating a break in the time series.4. From 2012 Q4 the question was changed to ask about access to cars / vans instead of just cars.5. Data published in 2015 erroneously included a value of 12.5 because of the exclusion of vans; this table contains the revised data.
21

Table Sum2 Summary of Transport in Scotland SUMMARYNumbers
2006 2007 2008 2009 2010 2011 2012 2013 2014 2015 2016
Vehicles Licensed thousands
Private and Light Goods 1 2,259 2,313 2,347 2,362 2,364 2,369 2,395 2,436 2,496 2,537 2,594All Vehicles 1 2,564 2,627 2,665 2,684 2,685 2,691 2,717 2,759 2,821 2,863 2,919New Registrations 243 251 215 216 209 202 216 241 262 268 270
Local Bus Services2 millionsPassenger Journeys
(boardings)3 476 487 484 458 430 436 421 422 416 409 393 12
Vehicle Kilometres3 384 397 386 377 346 338 327 332 330 328 ..Passenger Revenue £ million
at latest year's prices3 652 677 701 702 669 676 685 675 658 671 ..
Freight Lifted million tonnes
Road 4, 9 170.0 176.8 157.0 131.9 131.9 144.2 150.6 135.8 137.6 153.9 183.5Rail 2 12.96 11.35 10.36 9.69 8.33 9.87 8.43 .. .. .. ..Coastwise traffic 20.6 22.8 23.3 19.8 18.0 16.3 12.5 11.4 11.8 14.2 ..One Port traffic 1.48 1.83 1.75 3.59 1.88 2.42 2.57 2.10 2.19 .. ..Inland waterway traffic 10.16 10.50 12.19 10.10 10.89 10.70 10.79 10.69 9.41 10.27 ..Pipelines 5 27.8 27.5 27.6 27.6 27.6 27.8 28.2 .. .. .. ..Total 243.0 250.8 232.2 202.7 198.6 211.3 213.1 .. .. .. ..
Public Road Lengths kilometres
Trunk (A and M)10 3,518 3,505 3,505 3,520 3,518 3,536 3,566 3,565 3,637 3,638 3,669Other Major (A and M) 7,424 7,381 7,421 7,421 7,414 7,467 7,473 7,473 7,406 7,414 7,418Minor Roads 44,026 44,300 44,418 44,591 44,694 44,769 44,873 44,938 45,011 45,100 45,163All Roads10 54,968 55,186 55,344 55,532 55,626 55,772 55,912 55,975 56,054 56,152 56,250
Road Traffic million vehicle-kilometres
Motorways 11 6,433 6,577 6,683 6,633 6,503 6,570 7,140 7,262 7,421 7,477 7,757A roads 22,465 22,408 22,126 22,327 21,992 21,996 21,712 21,786 22,025 22,395 22,796All roads (incl. B, C, uncl.) 44,119 44,666 44,470 44,219 43,488 43,390 43,549 43,840 44,839 45,374 46,437
Reported Road Accident CasualtiesKilled 314 281 270 216 208 185 176 172 203 168 191Killed and Serious 2,949 2,666 2,845 2,503 2,177 2,065 2,157 1,843 1,906 1,768 1,884All (Killed, Serious, Slight) 17,269 16,239 15,592 15,043 13,338 12,786 12,712 11,502 11,308 10,974 10,881
Passenger Rail 2,6 millions
ScotRail passenger journeys 6 71.6 74.5 76.4 76.9 78.3 81 83.3 86.3 92.7 93.2 94.24
ORR data:
Rail journeys in/from Scotland 7 69.8 72.7 76.3 76.5 79.4 83.3 85.8 86.7 91.7 93.4 ..
Passenger receipts (2015 £mill) 324.2 369.1 370.6 407.1 421.9 432.4 449.3 462.6 486.4 504.31 ..
Air Transport thousands
Terminal Passengers 24,437 25,132 24,348 22,496 20,907 22,065 22,207 23,250 24,076 25,507 26,924Transport Movements 420.6 428.2 417.1 382.7 354.4 366.3 372.1 376.4 376.2 376.4 376.0
thousand tonnes
Freight 83.3 66.1 50.2 50.9 47.5 45.2 52.2 54.2 59.9 56.4 55.4
Ferries 8 thousands
Passengers 10,589 10,671 10,014 10,219 9,990 9,631 9,698 9,662 9,680 9,555 10,076Vehicles 3,113 3,246 3,056 3,135 3,072 3,071 3,076 2,972 3,074 3,146 3,372
of which on routes within Scotland
Passengers 8,453 8,466 8,001 8,272 8,016 7,773 7,888 7,831 7,885 7,825 8,322 Vehicles 2,610 2,713 2,569 2,648 2,554 2,551 2,628 2,577 2,625 2,704 2,931
1 DfT has revised the figures for the light goods and goods body types back to 2001. DfT does not have the underlying data to revise earlier years' figures.
2 Financial years
3 The DfT have revised figures from 2004/05 onwards as a result of methodological improvements. Figures prior to this period are not directly comparable.
See Chapter 2 for more detail. Figures from 2006 include Government support for buses which is not available for the two previous years.
4 Freight lifted in Scotland by UK-registered hauliers, regardless of whether the destination is in Scotland, elsewhere in the UK or outwith the UK.
The figures for 2004 onwards are not compatible with those for earlier years due to changes in methodology and processing system for the survey.
5 The estimated amounts of crude oil and products carried by pipelines over 50km in length. 2012 figures are provisional.
6 ScotRail introduced a new methodology which better estimates Strathclyde Zonecard journeys from 2009/10. Figures from 2003/04 onwards
present the impact of this on previously reported data to provide a more meaningful year on year comparison. Note that this has no impact on actual
journeys undertaken.
7 The Office of Rail and Road (ORR) produce total passenger figures. These are not adjusted to reflect ScotRail's revised methdology and are therefore
not comparable with ScotRail figures. There is a series break between 2007-08 and 2008-09 due to a change in the methodology.
From 2008-09 estimates of PTE travel (zone cards) are included.
8 Services to Europe, Northern Ireland and within Scotland (Previous versions of STS only included services where data is available back to 1975, this
can still be found in Table H1). Figures for passenger numbers on the Corran ferry service in 2013, 2014 and 2015 have not been included in the total for
Scotland as the figures are new estimates and considered as ‘data under development'.
9 Domestic freight estimates for 2006 to 2009 were revised on 27 October 2011.
10 Totals have been revised in 2012 to include slip roads on Trunk A roads which had previously excluded. See Road Network chapter for more information.
11 Changes in the layout of the M74/M77/M8 during 2012 are likely to have affected the traffic data for motorways.
12. Figure is provisional
22

Table 1: [Driving licence] People aged 17 or over - those who hold full driving licence, 2007 – 2016
2007 2008 2009 2010 2011 2012 2013 2014 2015 20162016
sample size
cell percentagesAll aged 17+ 67.0 67.6 68.0 67.6 67.3 68.3 68.4 68.5 68.0 69.0 9,570by gender:
Male 75.8 76.0 76.2 75.6 75.6 75.6 76.0 75.8 73.4 75.4 4,360Female 59.2 59.9 60.6 60.2 59.8 61.6 61.4 61.8 63.1 63.1 5,210
by age:17-19 28.1 32.5 24.8 26.6 25.9 27.5 26.3 29.3 25.8 29.9 19020-29 57.7 56.4 58.4 57.8 54.1 58.3 56.2 56.1 54.4 55.4 1,10030-39 78.4 78.5 76.8 76.3 77.0 74.9 74.2 73.2 71.8 73.0 1,37040-49 80.0 82.6 80.1 80.8 80.3 79.8 80.0 82.1 81.9 80.8 1,51050-59 76.4 77.8 78.1 77.9 78.1 79.3 80.0 79.1 77.8 80.5 1,62060-69 69.1 70.1 74.6 72.3 73.9 73.5 74.3 74.4 75.7 75.8 1,70070-79 55.2 53.4 54.6 54.2 57.5 59.0 60.2 61.2 62.0 63.2 1,37080+ 35.4 30.8 37.4 36.5 35.4 37.2 41.2 39.8 43.1 43.2 710
Sample size (=100%) 12,150 12,270 12,450 12,360 12,800 9,830 9,840 9,720 9,340 9,570
Table 2: [Fuel] Amount spent on fuel in the past month, 2009-2016
2009 2010 2011 2012 2013 2014 2015 2016Amount spent on fuel in the past month column percentages
£1 to £19 2.7 2 1.6 1.1 1.4 1.2 1.5 1.7£20 to £39 13.8 11.5 7.5 7.9 8.2 7.9 11.1 11.8£40 to £59 20.4 18.3 14.7 15.3 15.6 16.9 19.2 19.9£60 to £99 22.9 20.9 20.3 21.2 19.9 21.1 23.0 21.9£100 to £149 18.9 20.3 22.6 19.8 21.2 22.6 19.9 20.2£150 and over 21.3 27 33.3 34.7 33.7 30.3 25.3 24.3
Median 80 80 100 100 100 100 80 80Average 99.6 112.2 131 134.5 128.9 123.7 109.2 105.6Sample size(=100%) 9,100 9,100 9,280 4,580 7,020 6,900 6,760 6,890
Table 3: [Walking] Frequency of walking in the previous seven days*, 2007 – 2016
2007 2008 2009 2010 2011 2012 2013 2014 2015 2016column percentages
None 48.0 47.5 41.0 38.0 36.9 34.2 .. 33.1 .. 31.41-2 days 17.9 17.2 17.5 18.9 19.1 19.8 .. 19.1 .. 19.43-5 days 19.8 21.7 22.4 24.3 24.4 23.2 .. 26.2 .. 26.36-7 days 14.3 13.6 19.1 18.8 19.6 22.7 .. 21.6 .. 22.91+ days 52.0 52.5 59.0 62.0 63.1 65.8 .. 66.9 .. 68.6
Sample size (=100%) 6,120 6,200 6,140 6,180 6,380 9,840 .. 9,740 .. 9,580
None 53.1 54.9 51.6 48.7 46.0 45.1 .. 41.7 .. 38.61-2 days 17.6 18.4 19.1 17.7 18.9 18.9 .. 20.2 .. 20.33-5 days 13.7 13.0 13.1 16.5 16.7 16.7 .. 17.7 .. 19.86-7 days 15.5 13.7 16.1 17.2 18.5 19.3 .. 20.4 .. 21.21+ days 46.9 45.1 48.4 51.3 54.0 54.9 .. 58.3 .. 61.4
Sample size (=100%) 6,120 6,210 6,120 6,140 6,370 9,810 .. 9,690 .. 9,580
Table 3a: [Cycling] Frequency of cycling in the previous seven days*, 2007 – 2016
2007 2008 2009 2010 2011 2012 2013 2014 2015 2016column percentages
None 96.8 96.2 .. .. .. 93.9 .. 93.9 .. 94.11-2 days 1.7 1.7 .. .. .. 2.7 .. 2.7 .. 2.83-5 days 1.1 1.4 .. .. .. 2.3 .. 2.3 .. 2.16-7 days 0.4 0.7 .. .. .. 1.1 .. 1.2 .. 1.01+ days 3.2 3.8 .. .. .. 6.1 .. 6.1 .. 5.9
Sample size (=100%) 6,150 6,230 .. .. .. 9,890 .. 9,800 .. 9,640
None 95.4 96.2 .. .. .. 94.1 .. 93.9 .. 93.51-2 days 3.2 2.8 .. .. .. 3.1 .. 3.5 .. 3.83-5 days 1.0 0.9 .. .. .. 1.9 .. 2.0 .. 1.96-7 days 0.3 0.2 .. .. .. 0.9 .. 0.7 .. 0.81+ days 4.6 3.8 .. .. .. 5.9 .. 6.1 .. 6.5
Sample size (=100%) 6,150 6,230 .. .. .. 9,890 .. 9,800 .. 9,640
Table 4: [Public Transport] Adults views on satisfaction* of public transport, 2007-2016Satisfaction with public transport
2007 2008 2009 2010 2011 2012 2013 2014 2015 2016column percentages
Very satisfied 18.6 20.6 26.8 26.8 26.3 21.2 23.6 22.7 23.3 20.9Fairly satisfied 50.7 52.2 48.2 47.5 49.7 51 47.5 52.4 50.4 50.9Neither satisfied nor dissatisfied 13.8 12 10.6 12.1 9.9 13.8 12.2 13.5 12.1 15.5Fairly dissatisfied 10.7 10 9 8.6 8.7 9.4 10.6 7.3 8.9 8.5Very dissatisfied 6.2 5.2 5.4 5 5.4 4.7 6.1 4.2 5.4 4.2
sample size † (=100%) 8,600 7,740 8,110 7,590 8,220 8,330 8,400 8,480 8,180 8,510
Table 5: [Concessionary fare pass] Possession of a concessionary fare pass, 2007-2016
2007 2008 2009 2010 2011 2012 2013 2014 2015 2016cell percentages
Adults aged 16+ 23.5 24.5 26.4 26.6 26.7 27.0 26.3 27.0 27.6 28.5Adults aged 60+ 81.5 84.3 86.7 87.1 87.5 88.4 86.4 87.3 86.9 87.2Adults aged 60-64 74.9 74.7 78.1 78.5 80.3 81.5 75.0 75.3 73.8 75.3Adults aged 65+ 84.0 88.1 90.0 90.5 90.2 91.0 90.4 91.3 91.2 91.2Sample size = (100%) 12,240 12,370 12,540 12,440 12,890 9,890 9,920 9,800 9,410 9,640
As a means of transport:
*Only relates to journeys over a quarter of a mile. In 2005 and 2006 the question was asked of half the sample. Between 2007 and 2011 the question was asked of 1/3 of the sample. From 2012 the question is asked of the full sample every other year.
Just for pleasure:
As a means of transport:
Just for pleasure:
*Only relates to journeys over a quarter of a mile. Between 2007 and 2008 the question was asked of 1/3 of the sample and was then not asked again until 2012. From 2012 the question is asked of the full sample every other year.
* Excludes respondents who answered 'no opinion' in line with figures published in the SHS Annual Report and the National Indicator on improving people's perceptions of the quality of public services. Approximately 15% of all respondents answered 'no opinion' in 2007-2011.† Sample sizes relate to those who provided an opionion on public transport only and so will differ from that reported in the SHS Annual Report.
23

Table 6: Adults with limited mobility
Table 7: [Travel to work] Employed adults not working from home -usual method of travel to work*, 2016
Walking Driver Passenger Bicycle Bus Rail OtherSample
size (=100%)
% Public / Active
(National Indicator)
Row percentagesAll 12.3 61.7 5.3 2.6 10.4 5.2 2.4 3,970 30.6by gender:
Male 9.9 62.1 5.3 3.8 8.9 6.6 3.4 1,880 29.2Female 14.8 61.3 5.4 1.4 12.0 3.8 1.3 2,090 31.9
by age:16 - 19 33.6 12.3 7.4 0.0 30.3 14.7 1.7 50 78.620 - 29 15.3 48.5 7.7 2.8 15.1 8.2 2.4 640 41.430 - 39 12.8 62.7 5.1 3.9 9.4 4.6 1.6 910 30.740 - 49 10.4 69.3 3.0 2.3 6.7 5.4 3.0 1,000 24.850 - 59 10.9 67.2 5.6 2.0 8.9 3.6 1.8 970 25.560 and over 8.8 64.5 6.1 1.7 12.8 1.5 4.6 400 24.8
by current situation:Self employed 13.4 64.8 2.8 3.2 3.4 6.4 6.1 230 26.3Employed full time 11.1 63.4 5.1 2.7 9.5 5.8 2.4 2,860 29.1Employed part time 16.6 54.5 6.8 2.2 15.7 2.8 1.4 880 37.4
by annual net household income:up to £10,000 p.a. 18.5 45.3 5.6 ** 21.4 2.9 ** 130 48.0over £10,000 - £15,000 23.2 38.9 7.4 3.6 22.2 3.7 1.0 350 52.7over £15,000 - £20,000 19.0 47.3 8.7 3.0 15.6 5.2 1.2 480 42.8over £20,000 - £25,000 15.0 58.0 5.8 2.0 15.0 2.8 1.3 520 34.9over £25,000 - £30,000 14.3 61.8 7.6 1.8 10.5 1.6 2.5 470 28.1over £30,000 - £40,000 11.7 61.9 5.0 2.1 9.4 7.5 2.4 790 30.7over £40,000 p.a. 7.1 71.7 3.4 2.9 5.2 6.4 3.2 1,210 21.6
by Scottish Index of Multiple Deprivation:1 - Most Deprived 15.0 51.3 6.9 2.9 16.4 5.9 1.5 680 40.32 14.4 56.0 7.4 2.4 13.8 5.1 0.9 820 35.73 11.3 63.8 4.7 3.1 8.8 4.7 3.7 860 27.84 10.1 70.2 3.6 2.5 5.8 4.3 3.6 860 22.75 - Least Deprived 10.9 66.5 4.3 2.2 7.7 6.1 2.3 750 27.0
by urban/rural:Large urban areas 16.1 49.7 5.3 4.3 16.7 6.0 2.0 1,250 43.1Other urban 10.8 66.1 5.6 1.8 8.3 6.0 1.5 1,360 26.9Small accessible towns 11.3 66.0 5.4 ** 7.2 5.9 3.2 360 25.5Small remote towns 18.7 61.2 4.8 5.3 2.5 ** 6.4 230 27.7Accessible rural 3.8 81.8 4.1 ** 3.6 2.2 3.8 420 10.4Remote rural 11.9 67.5 8.1 ** 4.9 ** 5.0 350 19.4
by number of cars:none 36.6 3.3 8.7 4.5 35.8 8.1 3.1 630 85.0one 13.2 56.6 7.7 3.5 10.9 5.3 2.9 1,780 32.8two + 4.5 83.2 2.3 1.3 2.6 4.4 1.7 1,550 12.8
Household typeSingle adult 17.8 55.1 3.7 2.9 11.6 5.2 3.7 950 37.6Small adult 14.1 59.9 5.2 3.2 10.2 5.5 2.0 960 32.9Single parent 17.0 58.6 3.4 ** 16.7 2.8 ** 300 37.1Small family 10.6 66.6 4.8 2.9 7.0 5.7 2.2 810 26.3Large family 7.3 69.0 7.2 2.8 5.5 5.7 2.4 220 21.3Large adult 9.0 59.9 6.5 1.7 14.8 5.7 2.4 380 31.3Older smaller 10.9 64.3 7.0 ** 11.0 2.3 2.7 350 25.9
** value supressed as cell contains fewer than 5 responses* Those in full-time employment, part-time employment and self-employed only.
Following changes to the Scottish Household survey, data for Table 6 is no longer collected - Please see TATIS 2011 for the most recently produced version of the table.
24

Table 8: [Congestion] Effects of traffic congestion on travel to work journey, 2012-2016Driver
car/vanPassenger
car/vanBus Other All
How often journey to work affected by traffic congestion column percentagesAt least once a week 40.8 32.6 43.3 7.3 31.8Less often 22.0 19.3 20.2 7.2 17.7Never 37.2 48.1 36.6 85.5 50.5
Sample size (=100%) 12,900 1,190 2,650 5,530 22,260
How much extra time normally allowed for journey to workNone 24.5 24.0 30.2 37.7 26.5Less than 5 mins 7.8 9.2 6.7 9.3 7.85-10 mins 27.3 34.1 23.8 21.6 26.711-30 mins 31.6 26.8 29.6 23.2 30.331-60 mins 6.7 4.7 7.2 5.9 6.6more than 1 hr 2.0 1.1 2.6 2.3 2.0
Sample size (=100%) 7,240 550 1,570 730 10,080
Table 9: Journeys carried out on way to/from work
Table 10: [Travel to work] How random adult usually travelled to work a year ago by current main mode of travel, 2012-2016
Walking Driver Passenger Bicycle Bus Rail Other AllCurrent usual mode column percentages
Walking 87.5 0.8 1.4 3.1 5.0 2.6 1.5 12.6Driver 5.2 97.5 5.4 7.7 4.9 8.9 6.2 62.9Passenger 2.0 0.5 88.3 ** 2.2 0.8 1.0 5.4Bicycle 0.8 0.2 0.5 86.2 1.0 1.3 ** 2.3Bus 3.0 0.5 2.3 1.4 85.3 2.8 ** 10.1Rail 0.6 0.4 0.8 ** 1.3 82.9 1.6 4.3Other 0.8 0.2 1.3 ** 0.4 0.7 88.1 2.4
Sample size (=100%) 2,540 11,920 900 390 1,920 770 470 18,910 This table can be used to establish the mode of travel people used in the previous year by their current mode.
Table 10a: [Travel to work] Reason for changing mode of transport for travel to work, 2012-2016
2012 2013 2014 2015 2016 2012-2016column percentages
Changed job 36.3 29.2 41.7 34.9 38.8 36.1Moved home 23.9 22.7 20.6 24.7 20.4 22.6Employer re-located 3.6 11.2 2.2 7.9 4.2 6.0Bought a car 3.9 6.1 9.0 7.1 7.0 6.7Sold car 2.8 2.1 ** 1.8 . 1.8Lost licence ** ** ** ** ** 0.6
. ** ** ** . 0.5** ** ** ** ** 0.7
Changed working hours ** ** 2.6 3.6 4.5 2.7Had a baby . ** ** ** . 0.6Passed driving test ** ** 2.9 6.1 4.5 3.7
** 2.0 ** ** ** 0.8Fresh air / exercise ** 5.9 1.9 2.6 6.2 3.6Other 29.0 25.7 21.7 16.1 17.9 21.8Sample size (=100%) 210 230 240 250 190 1,130** denotes cell value supressed as based on fewer than 5 responsesColumns will sum to more than 100% as multiple responses can be provided.
Table 11: [Car share] Car sharing journeys to work, 2013-2016
2013-2016Whether involved in any car sharing arrangement column percentages
Yes 12.8No 87.2
Sample size (=100%) 9,090
How car sharing is organisedNormally between ourselves 91.8Through employer 7.5Other 0.7
Sample size (=100%) 1,150
Reasons why not involved in a car share arrangementNobody in my work lives near me 63.2Don't work regular hours 22.6Journey to work is not regular/work in different places 6.4Wouldn't like to share with a stranger 5.9Prefer to drive on my own 4.1Prefer to drive than be a passenger 1.9Make journey longer 0.8Only work a few days a week 1.1Other people would be unreliable / late 0.9Other 1.2
Sample size (=100%) 7,950
Usual mode one year ago
Following changes to the Scottish Household survey, data forTable 9 is no longer collected - Please see TATIS 2011 for the most recently produced version of the table.
Public transport service addedPublic transport service withdrawn
Example: Of the people who currently walk to work, last year 87.5% walked, 0.8% drove, 1.4% was a passenger, 3.1% used a bicycle, etc. Of the people who drove a car last year, 0.8% now walks, 97.5% still drives, etc.
Husband/wife/Partner has more need for car
25
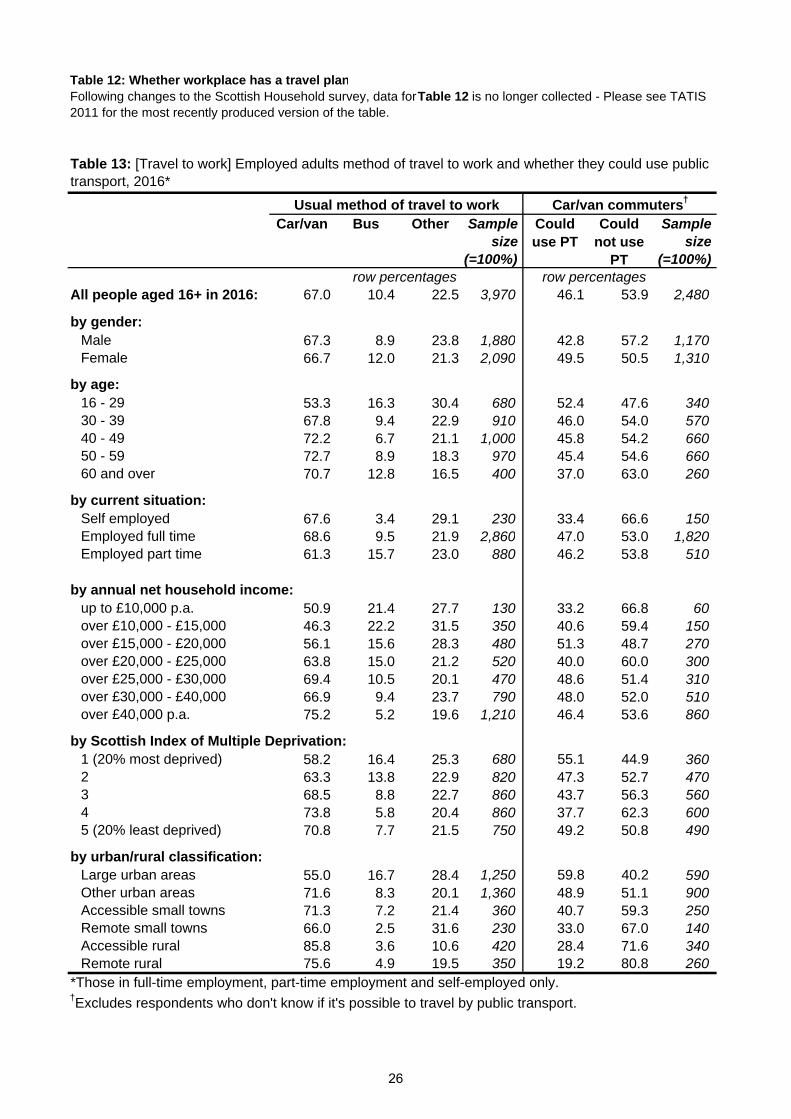
Table 12: Whether workplace has a travel plan
Car/van Bus Other Sample size
Sample size
(=100%) (=100%)row percentages row percentages
All people aged 16+ in 2016: 67.0 10.4 22.5 3,970 46.1 53.9 2,480
by gender:Male 67.3 8.9 23.8 1,880 42.8 57.2 1,170 Female 66.7 12.0 21.3 2,090 49.5 50.5 1,310
by age:16 - 29 53.3 16.3 30.4 680 52.4 47.6 340 30 - 39 67.8 9.4 22.9 910 46.0 54.0 570 40 - 49 72.2 6.7 21.1 1,000 45.8 54.2 660 50 - 59 72.7 8.9 18.3 970 45.4 54.6 660 60 and over 70.7 12.8 16.5 400 37.0 63.0 260
by current situation:Self employed 67.6 3.4 29.1 230 33.4 66.6 150 Employed full time 68.6 9.5 21.9 2,860 47.0 53.0 1,820 Employed part time 61.3 15.7 23.0 880 46.2 53.8 510
by annual net household income:up to £10,000 p.a. 50.9 21.4 27.7 130 33.2 66.8 60 over £10,000 - £15,000 46.3 22.2 31.5 350 40.6 59.4 150 over £15,000 - £20,000 56.1 15.6 28.3 480 51.3 48.7 270 over £20,000 - £25,000 63.8 15.0 21.2 520 40.0 60.0 300 over £25,000 - £30,000 69.4 10.5 20.1 470 48.6 51.4 310 over £30,000 - £40,000 66.9 9.4 23.7 790 48.0 52.0 510 over £40,000 p.a. 75.2 5.2 19.6 1,210 46.4 53.6 860
by Scottish Index of Multiple Deprivation:1 (20% most deprived) 58.2 16.4 25.3 680 55.1 44.9 360 2 63.3 13.8 22.9 820 47.3 52.7 470 3 68.5 8.8 22.7 860 43.7 56.3 560 4 73.8 5.8 20.4 860 37.7 62.3 600 5 (20% least deprived) 70.8 7.7 21.5 750 49.2 50.8 490
by urban/rural classification:Large urban areas 55.0 16.7 28.4 1,250 59.8 40.2 590 Other urban areas 71.6 8.3 20.1 1,360 48.9 51.1 900 Accessible small towns 71.3 7.2 21.4 360 40.7 59.3 250 Remote small towns 66.0 2.5 31.6 230 33.0 67.0 140 Accessible rural 85.8 3.6 10.6 420 28.4 71.6 340 Remote rural 75.6 4.9 19.5 350 19.2 80.8 260
*Those in full-time employment, part-time employment and self-employed only.†Excludes respondents who don't know if it's possible to travel by public transport.
Table 13: [Travel to work] Employed adults method of travel to work and whether they could use public transport, 2016*
Usual method of travel to work Car/van commuters†
Could use PT
Could not use
PT
Following changes to the Scottish Household survey, data for Table 12 is no longer collected - Please see TATIS 2011 for the most recently produced version of the table.
26

Car/Van Driver/Passenger
column percentagesBy whether they could use public transport
Yes 46.2 No 52.1
Sample size (=100%) 7,670
If they could use public transport, reasons for not using itTakes too long 42.4No direct route 22.7Prefer to use car 14.4Need a car for work 10.2Work unusual hours 6.9Cost 8.1Lack of service 6.1Nothing **Public transport is unreliable 3.4Too infrequent 3.5Too much to carry 2.5Long walk to bus stop 2.6Dislike waiting about 1.6Uncomfortable 0.6Health reasons 0.7Prefer to walk 0.7Other reasons are all less than 1% when rounded
Sample size (=100%) 3,380
If they could not use public transport, reasons why they cannotNo direct route 33.2Lack of service 26.1Takes too long 17.9Inconvenient 12.9Need a car for work 13.9Work unusual hours 12.1Prefer to use car 5.9Too much to carry 5.5Too infrequent 3.6Public transport is unreliable 3.7Nothing .Long walk to bus stop 1.9Cost 1.5Live centrally / within walking distance 0.5Other reasons are all less than 1% when rounded
Sample size (=100%) 1,380
Table 14: [Travel to work reasons] Reasons why public transport is not used for travel to
work, 2012-20161
1. Question asked every other year from 2012. 2016 data is latest available.
27

Table 15: [Travel to school] School children in full-time education, usual method of travel, 2016
Walking Car or van Bicycle School bus* Service busRail (inc. Glas
U/g)All other
modes
Sample size
(=100%)Row percentages
All people 51.8 25.6 1.4 12.9 6.4 0.5 1.5 1,890 by gender:
Male 51.3 24.5 2.4 13.4 6.1 ** 2.0 980 Female 52.3 26.8 ** 12.4 6.6 0.7 0.9 920
by age:age 4-5 57.2 37.3 ** 2.6 ** . ** 180 age 6-7 54.6 35.3 1.3 6.7 1.2 . ** 350 age 8-9 60.6 26.6 1.3 7.1 2.9 . 1.4 330 age 10-11 61.3 25.0 1.8 6.2 4.7 . ** 290 All 4-11 58.6 30.1 1.4 6.1 2.7 . 1.0 1,130 age 12-13 41.6 18.6 ** 21.1 12.5 ** 3.9 270 age 14-15 44.7 16.7 ** 24.2 11.4 ** 1.4 280 age 16-18 37.5 22.6 ** 24.1 11.4 ** ** 210 All 12-18 41.6 19.0 1.3 23.0 11.8 1.2 2.1 760
by annual net household income:Up to £15,000 57.9 19.0 ** 9.2 10.1 . ** 170 £15,000 - £20,000 57.4 17.9 ** 9.7 10.2 ** 3.1 230 £20,000 - £25,000 59.1 20.6 ** 11.9 5.5 . 1.7 250 £25,000 - £30,000 54.6 25.8 ** 11.1 5.6 . ** 200 £30,000 - £40,000 48.2 29.3 ** 14.2 4.3 ** 2.5 370 over £40,000 p.a. 47.7 28.9 1.9 15.0 5.8 ** ** 660
by Scottish Index of Multiple Deprivation:1 - Most Deprived 56.3 22.2 ** 7.0 11.1 ** 3.0 390 2 59.2 19.6 1.4 11.1 7.5 ** ** 380 3 49.4 25.4 ** 15.6 5.3 ** 2.0 400 4 44.7 27.7 2.2 21.3 2.6 ** ** 390 5 - Least Deprived 48.3 34.3 2.2 10.4 4.3 ** ** 340
by urban/rural:Large urban areas 53.7 28.9 1.1 4.7 9.5 ** 1.3 530 Other urban 57.6 26.4 1.2 9.1 4.8 ** 0.5 670 Small accessible towns and small remote towns 56.8 25.8 2.1 10.7 2.7 ** 1.6 280 Accessible rural 35.8 21.3 ** 33.6 4.3 ** 3.0 210 Remote rural 27.7 13.3 ** 41.9 10.4 . ** 200
by number of cars:None 73.0 3.5 ** 5.7 14.4 ** 2.1 320 One 54.2 24.5 1.8 12.1 4.4 0.9 2.1 750 Two + 41.4 35.3 1.1 16.4 5.1 ** 0.6 830
Household typeSingle parent 60.3 18.2 1.1 10.3 6.3 . 3.8 440 Small family 52.1 29.4 1.5 10.6 4.7 0.6 1.2 850 Large family 47.7 26.0 1.6 16.3 7.4 ** ** 470 Large adult 40.6 22.6 . 24.1 11.1 ** . 110
28

Walking Car or van School bus Service busCell percentages
Close / Nearby / Not far away 89.0 6.4 5.2 7.8Most convenient 8.3 39.4 42.5 39.3Travel with friends 3.8 1.3 4.4 5.0Safest method 1.0 15.0 14.8 6.3Quickest method 2.7 14.5 6.8 13.0Only method available 1.7 10.8 20.4 19.8Too far to walk . 15.7 20.4 23.9No public transport 0.4 3.4 2.8 0.5Publ transp unsuitable (eg too infreq.) 0.1 2.8 2.4 0.2Good exercise / fresh air 5.8 . . 0.7No car / transport 0.6 . 0.6 1.7Cheapest method 0.4 1.0 1.1 1.2It is free 0.6 0.2 15.6 1.8On way to work 0.1 8.0 0.1 0.2Too young to travel any other way 0.1 6.8 1.8 0.6Relative meets child . 0.9 . .Other reason(s) 0.4 2.8 1.5 1.2Sample size (=100%) 4,800 2,360 1,480 580
Primary: 4-11
Secondary: 12-18 All
By whether they could use public transport Yes 20.8 51.3 30.5 No 79.2 48.7 69.5
Sample size (=100%) 990 440 1,420
If they could use public transport, reasons for not using itToo young to travel on own 54.1 11.1 31.0Inconvenient 5.1 6.0 5.6No service available 18.5 27.6 23.4Too far to bus stop 4.2 4.2 4.2Cost, too expensive 5.6 13.0 9.6Too short a distance, not worth it 6.9 4.1 5.4Prefer to use car 11.2 34.2 23.6Others 6.5 12.0 9.5
Sample size (=100%) 200 220 430
If they could not use public transport, reasons why they cannotToo young to travel on own 48.4 13.8 40.7No service available 44.1 62.5 48.2Inconvenient 5.5 12 6.9Too far to bus stop 2.8 11.1 4.6Cost, too expensive 0.5 0.6 0.5Too short a distance, not worth it 10.2 5.4 9.2Prefer to use car 4.3 6.2 4.7Others 1.9 2.9 2.1
Sample size (=100%) 790 210 1,000
*Percentages may total to more than 100% as respondents can give multiple answers. Table only includes those who have given a reason (question asked only of a sub-sample). Figures may not sum due to rounding.
Age
cell percentages
Table 16: [Travel to school reasons] Reasons for transport choice to children's full time education establishment, 2012-2016
Table 17: [Travel to school reasons] Reasons why public transport is not used by school children, 2012-2016
Usual method of travel to school
*Percentages may total to more than 100% as respondents can give multiple answers. Table only includes those who have given a reason (question asked only of a sub-sample).
29

Tab
le 1
8: [C
ar /
Bic
ycle
acc
ess]
Hou
seho
lds
with
bic
ycle
s ca
rs /
vans
ava
ilabl
e fo
r pr
ivat
e us
e, 2
016
No
ne
On
eT
wo
Th
ree
+O
ne
+T
wo
+S
amp
le
size
(=
100%
)N
on
eO
ne
Tw
oT
hre
e +
On
e+T
wo
+ S
amp
le
size
(=
100%
)R
ow p
erce
ntag
esC
ell p
erce
ntag
esR
ow p
erce
ntag
esC
ell p
erce
ntag
esA
ll h
ou
seh
old
s66
.216
.311
.95.
633
.817
.510
,470
29
.342
.123
.05.
670
.728
.510
,470
b
y h
ou
seh
old
typ
e:S
ingl
e ad
ult
71.7
23.4
3.3
1.6
28.3
4.9
1,87
0
49.2
44.1
5.1
1.6
50.8
6.7
1,87
0
Sm
all a
dult
56.1
18.6
19.6
5.6
43.9
25.3
1,62
0
18.3
38.5
37.8
5.4
81.7
43.2
1,62
0
Sin
gle
pare
nt75
.014
.96.
63.
525
.010
.160
0
47
.846
.94.
70.
752
.25.
460
0
S
mal
l fam
ily46
.819
.525
.08.
753
.233
.61,
300
10
.841
.943
.63.
789
.247
.31,
300
La
rge
fam
ily43
.918
.017
.121
.056
.138
.153
0
9.
133
.944
.312
.790
.956
.953
0
La
rge
adul
t47
.817
.418
.915
.952
.234
.888
0
10
.025
.934
.529
.690
.064
.188
0
O
lder
sm
alle
r73
.711
.311
.63.
326
.315
.01,
830
14
.455
.726
.93.
085
.629
.91,
830
S
ingl
e pe
nsio
ner
91.8
6.9
0.7
0.6
8.2
1.3
1,85
0
56.9
40.6
2.1
0.4
43.1
2.5
1,85
0
by
ann
ual
net
ho
use
ho
ld in
com
e:up
to £
10,0
00 p
.a.
80.9
13.7
3.7
1.7
19.1
5.4
1,21
0
59.3
34.1
5.2
1.4
40.7
6.6
1,21
0
over
£10
,000
- £
15,0
0083
.511
.93.
61.
016
.54.
61,
710
54
.238
.26.
21.
445
.87.
61,
710
ov
er £
15,0
00 -
£20
,000
78.9
14.3
5.2
1.5
21.1
6.7
1,51
0
40.4
49.0
8.4
2.2
59.6
10.7
1,51
0
over
£20
,000
- £
25,0
0068
.419
.19.
62.
931
.612
.51,
260
26
.153
.917
.03.
073
.920
.01,
260
ov
er £
25,0
00 -
£30
,000
62.9
17.2
14.1
5.9
37.1
19.9
990
12.9
58.9
22.8
5.4
87.1
28.2
990
over
£30
,000
- £
40,0
0054
.320
.617
.67.
545
.725
.11,
440
8.
646
.037
.08.
591
.445
.41,
440
ov
er £
40,0
00 p
.a.
39.6
18.2
26.3
15.9
60.4
42.2
1,97
0
2.8
28.0
55.0
14.2
97.2
69.2
1,97
0
by
Sco
ttis
h In
dex
of
Mu
ltip
le D
epri
vati
on
:1
- M
ost D
epriv
ed78
.613
.94.
82.
721
.47.
51,
970
50
.036
.511
.32.
250
.013
.51,
970
2
72.8
15.5
8.5
3.2
27.2
11.7
2,13
0
36.8
43.1
16.4
3.6
63.2
20.1
2,13
0
364
.617
.113
.94.
435
.418
.32,
270
26
.043
.125
.15.
874
.030
.92,
270
4
58.7
17.1
16.4
7.8
41.3
24.2
2,26
0
16.8
43.5
31.2
8.5
83.2
39.7
2,26
0
5 -
Leas
t Dep
rived
54.6
17.9
17.0
10.5
45.4
27.5
1,84
0
14.7
44.8
32.3
8.2
85.3
40.5
1,84
0
by
urb
an/r
ura
l cla
ssif
icat
ion
:La
rge
urba
n ar
eas
70.3
15.7
10.3
3.7
29.7
14.0
3,14
0
39.6
40.4
16.8
3.2
60.4
20.0
3,14
0
Oth
er u
rban
67.6
16.2
10.5
5.7
32.4
16.2
3,56
0
29.5
41.7
23.4
5.4
70.5
28.8
3,56
0
Sm
all a
cces
sibl
e to
wns
64.5
15.2
12.5
7.7
35.5
20.2
1,00
0
19.5
46.1
27.7
6.7
80.5
34.4
1,00
0
Sm
all r
emot
e to
wns
59.6
20.9
12.1
7.4
40.4
19.6
590
26.8
47.5
22.0
3.8
73.2
25.7
590
Acc
essi
ble
rura
l56
.516
.818
.48.
343
.526
.61,
150
11
.941
.435
.511
.288
.146
.71,
150
R
emot
e ru
ral
57.4
17.7
17.7
7.2
42.6
24.9
1,03
0
14.7
46.8
28.3
10.2
85.3
38.5
1,03
0
1. F
rom
201
2 Q
4 th
e qu
estio
n w
as a
men
ded
to a
sk a
bout
acc
ess
to c
ars
/ van
s in
stea
d of
just
van
s.
Bic
ycle
s th
at c
an b
e u
sed
by
adu
lts:
Car
s / v
ans
1 a
vaila
ble
fo
r p
riva
te u
se:
30

Table 19:[ Driving licence] People aged 17+ that hold a full driving licence, 2016
17-19 20-29 30-39 40-49 50-59 60-69 70-79 80+All
17+
Sample size of group
percentage of the relevant sub-group*
All people aged 17+: 29.9 55.4 73.0 80.8 80.5 75.8 63.2 43.2 69.0 9,570
by gender:Male 35.7 58.1 77.6 81.8 84.7 83.2 80.9 65.2 75.4 4,360 Female 26.0 52.6 68.5 79.9 76.7 68.0 50.3 27.9 63.1 5,210
by current situation:Self employed ** 62.2 85.3 96.3 91.3 95.5 ** ** 89.1 630 Employed full time ** 70.3 82.6 88.8 87.8 90.7 ** ** 82.4 3,120 Employed part time ** 47.4 68.7 83.2 83.2 73.0 ** ** 71.7 960 Looking after the home or family ** 39.2 55.1 65.8 69.4 ** ** ** 56.4 460 Permanently retired from work ** 0.0 0.0 ** 92.5 73.6 62.6 43.1 64.1 3,180 Unemployed and seeking work ** 22.8 30.4 47.1 51.0 ** ** ** 36.5 320 In further / higher education 35.6 43.5 ** ** ** ** ** ** 42.1 320 Permanently sick or disabled ** ** ** 36.1 36.4 49.1 ** ** 33.9 430
by annual net household income:up to £10,000 p.a. 34.5 37.2 32.1 54.9 60.7 52.9 46.3 34.0 45.9 1,150 over £10,000 - £15,000 12.7 31.9 43.8 47.9 55.5 61.7 54.1 37.9 47.3 1,610 over £15,000 - £20,000 21.4 48.1 58.7 67.0 67.1 68.2 57.8 42.0 58.1 1,420 over £20,000 - £25,000 3.4 53.8 67.9 77.9 76.5 77.2 73.4 51.7 67.8 1,160 over £25,000 - £30,000 23.4 59.6 66.3 82.2 90.1 82.1 78.5 ** 74.6 890 over £30,000 - £40,000 47.0 72.2 80.1 85.0 86.2 92.2 81.8 ** 81.2 1,260 over £40,000 p.a. 41.4 74.4 91.3 96.6 94.2 92.8 95.6 ** 89.1 1,740
by Scottish Index of Multiple Deprivation:1 - Most Deprived ** 46.7 54.4 60.2 52.9 46.6 38.5 19.0 48.8 1,790 2 ** 47.5 65.5 73.1 74.3 67.7 53.2 36.1 60.6 1,960 3 ** 61.2 79.1 83.5 88.8 76.9 61.2 40.7 72.3 2,100 4 ** 62.7 85.3 92.3 92.4 86.4 73.7 57.4 80.7 2,030 5 - Least Deprived ** 64.6 86.6 94.8 93.2 91.0 81.2 55.0 82.1 1,690
by urban/rural:Large urban areas 28.5 50.6 69.1 73.4 72.8 68.5 50.9 35.2 61.8 2,870 Other urban 32.2 54.3 70.6 80.0 77.9 71.4 62.3 40.6 66.9 3,260 Small accessible towns 19.2 64.3 78.7 86.7 86.2 86.3 71.3 43.5 76.0 920 Small remote towns ** 49.3 87.9 81.4 83.6 76.8 61.5 ** 72.6 550 Accessible rural ** 74.3 85.3 92.4 95.1 88.7 78.3 62.4 85.0 1,040 Remote rural 44.4 75.5 85.5 91.9 92.9 85.1 75.3 57.9 82.2 950
Sample size of age groups 190 1,100 1,370 1,510 1,620 1,700 1,370 710 9,570
Estimates based on smaller sample sizes may be subject to larger levels of variation and therefore may see relatively large fluctuations over time
`
** Percentages based on a denominator of 50 respondents or fewer are not shown. * Denominator includes people for whom it was not known, or not recorded, what type of driving licence (if any) was held.
31

Table 20: [Frequency of driving] People aged 17+, frequency of driving, 2016*
Every day
At least 3 times per
week
1 - 2 times per
week
At least 2 - 3 times
per month
At least once a month
Less than
once a month
Has licence
but never drives
Does not have a
full driving licence
sample size
(=100%)
All people 42.2 14.3 6.0 1.0 0.5 1.6 3.4 31.0 9,570 by gender:
Male 47.5 15.2 6.5 0.9 0.4 1.4 3.5 24.6 4,360 Female 37.3 13.4 5.6 1.0 0.5 1.8 3.4 36.9 5,210
by age:17-19 16.6 5.2 ** ** ** ** 4.5 70.1 190 20-29 34.3 9.8 4.8 0.5 0.9 2.2 2.9 44.6 1,100 30-39 49.1 12.6 6.7 1.3 ** 1.2 2.0 27.0 1,370 40-49 55.6 14.0 5.2 1.2 0.4 1.0 3.3 19.2 1,510 50-59 54.6 14.8 5.3 0.5 0.3 1.4 3.6 19.5 1,620 60-69 40.5 20.0 7.8 1.1 0.6 1.2 4.6 24.2 1,700 70-79 26.7 19.4 8.5 1.5 0.5 2.8 3.8 36.8 1,370 80+ 15.1 12.1 7.3 0.8 ** 2.8 4.8 56.8 710
by current situation:Self employed 61.8 15.5 8.7 1.0 ** ** 1.4 10.9 630 Employed full time 58.9 13.9 5.6 0.6 0.2 1.3 1.8 17.6 3,120 Employed part time 48.3 14.0 3.9 ** 0.4 0.8 3.8 28.3 960 Looking after the home or family 30.0 11.8 5.7 2.1 ** ** 4.4 43.6 460 Permanently retired from work 27.5 19.7 8.4 1.3 0.6 2.4 4.3 35.9 3,180 Unemployed and seeking work 15.3 5.7 3.3 ** ** 2.1 7.4 63.5 320 In further / higher education 21.2 8.5 2.2 1.0 1.4 2.8 5.0 57.9 320 Permanently sick or disabled 12.3 4.6 5.8 1.5 0.0 2.5 7.2 66.1 430
by annual net household income:up to £10,000 p.a. 19.8 10.1 6.3 0.9 ** 2.6 5.7 54.1 1,150 over £10,000 - £15,000 21.5 10.6 6.8 1.3 0.4 1.2 5.5 52.7 1,610 over £15,000 - £20,000 29.6 13.6 5.9 0.8 0.3 1.9 6.0 41.9 1,420 over £20,000 - £25,000 40.7 13.1 6.8 1.5 0.4 2.0 3.2 32.2 1,160 over £25,000 - £30,000 47.1 15.0 5.8 0.8 1.2 2.0 2.7 25.4 890 over £30,000 - £40,000 53.0 16.8 6.5 1.2 0.3 1.2 2.2 18.8 1,260 over £40,000 p.a. 63.2 17.2 5.5 0.6 ** 1.2 0.9 10.9 1,740
by Scottish Index of Multiple Deprivation:1 - Most Deprived 30.9 7.2 3.5 0.7 ** 1.0 5.2 51.2 1,790 2 36.9 12.2 5.3 0.8 0.3 1.5 3.6 39.4 1,960 3 42.8 14.3 7.7 1.3 0.7 2.1 3.4 27.7 2,100 4 51.3 18.2 5.0 1.0 0.5 1.6 3.1 19.3 2,030 5 - Least Deprived 48.9 19.5 8.5 0.9 0.7 1.7 1.9 17.9 1,690
by urban/rural:Large urban areas 34.6 12.7 6.3 0.8 0.7 2.3 4.5 38.2 2,870 Other urban 42.3 13.6 5.3 0.9 0.4 1.3 3.2 33.1 3,260 Small accessible towns 45.7 17.9 6.7 1.6 0.3 1.0 2.8 24.0 920 Small remote towns 48.3 12.0 5.4 2.2 1.3 ** 2.6 27.4 550 Accessible rural 57.3 17.9 5.7 0.7 ** 1.3 1.9 15.0 1,040 Remote rural 49.2 17.2 9.1 1.5 ** 1.6 3.1 17.8 950
*The frequency of driving is shown only for those who hold a full driving licence
32

Table 21: [Park & Ride] Part driving/parking journeys, 2009 - 20151
2009 2010 2011 2012 2013 2014Whether made any journeys using part driving/parking in past month column pe
Yes 19.3 19.2 19.9 18.7 16.3 17.2
No 80.6 80.5 80 81.3 83.5 82.8
Sample size (=100%) 7,730 7,610 7,910 6,110 6,220 6,080
Where parked last time used part driving/parking cell peA specially designated Park and Ride facility 27.4 27.2 29.4 30 29.3 28.2An ordinary car park at a bus station, train station or airport 27.7 29.9 27.5 30.3 30.7 28.6A public car park 15.2 14.7 14.5 13.9 13.4 15.4On the street near a station or bus stop 15.2 14.2 13.3 13.8 17.2 14.9On the street elsewhere 11.8 13.3 12.2 11.5 8.6 12.7Other 2.6 0.6 3.1 0.6 0.8 0.1
Sample size (=100%) 1,430 1,430 1,540 1,100 1,000 1,000
Reasons for not using designated park and ride facility when made a part driving/parking journey column peNo designated Park and Ride facility available 74.5 73.4 77.6 Journey would take longer 10.8 10.0 12.2 No need/car park in town 4.9 1.9 4.2 Other (specify) 3.5 6.0 1.6 Too much to carry 2.3 2.8 0.9 Costs too much 2.0 5.0 1.0 Concerns about vehicle / car park security 0.9 ** 1.2
Sample size (=100%) 690 630 670*Table only includes those who have given a reason.
Table 22: [Park & Ride] Mode of transport used in conjunction with driving by where parked, 2009 - 2015* 1
Bus Train Walk
Sample size
(=100%)row percentages
All adults who used driving/parking in past month 28.7 53.5 14.1 4,080by where parked: A specially designated Park and Ride facility 45.4 54.5 1.2 1,150 An ordinary car park at a bus station, train station or airport 9.6 82.0 2.4 1,220 A public car park 33.0 32.1 28.8 600 On the street near a station or bus stop 37.7 46.6 15.2 630 On the street elsewhere 19.0 13.5 58.6 410*Percentages may total to more than 100% as respondents can give multiple answers.
Table 23: Concerns with traffic growthFollowing changes to the Scottish Household survey data for Table 23 is no longer collected - Please see TATIS 2011 for the most recently produced version of the table.
Table 24: Incidents of road rage directed at respondents in past yearFollowing changes to the Scottish Household survey data for Table 24 is no longer collected - Please see TATIS 2011 for the most recently produced version of the table.
1. Question asked every other year from 2015. 2015 data is latest available.
1. Question asked every other year from 2015. 2015 data is latest available.
33

Table 25: [Walking] Frequency of walking in the previous seven days*, 2016 1
None 1-2 days 3-5 days 6-7 days None 1-2 days 3-5 days 6-7 days
row percentages
All people: 31.4 19.4 26.3 22.9 38.6 20.3 19.8 21.2 9,540
by gender:
Male 30.8 18.6 25.8 24.7 37.8 20.7 19.8 21.6 4,360
Female 31.8 20.0 26.9 21.3 39.4 19.9 19.8 20.9 5,180
by age:
16-19 22.8 16.4 37.2 23.6 41.3 21.5 19.8 17.4 250
20-29 19.3 19.7 31.4 29.5 35.9 23.3 21.7 19.0 1,080
30-39 24.6 22.5 27.7 25.1 32.6 24.0 23.0 20.4 1,360
40-49 30.0 21.7 25.0 23.4 33.0 20.3 21.4 25.3 1,500
50-59 35.5 17.6 27.2 19.7 36.0 20.0 19.7 24.4 1,610
60-69 34.9 19.0 23.5 22.6 38.9 18.2 18.3 24.6 1,690
70-79 43.4 17.3 21.2 18.0 49.4 17.5 17.1 15.9 1,360
80+ 55.6 15.7 13.6 15.1 68.6 10.7 8.7 11.9 700
by current situation:
Self employed 28.4 17.5 26.3 27.8 29.5 20.6 19.4 30.4 620
Employed full time 28.4 21.0 27.8 22.8 34.3 23.9 20.5 21.4 3,100
Employed part time 28.7 20.0 27.9 23.3 33.6 20.9 22.7 22.9 960
Looking after the home/family 22.9 18.6 32.8 25.7 32.2 18.7 25.8 23.4 460
Permanently retired from work 41.2 18.0 21.1 19.7 47.9 16.0 17.4 18.7 3,150
Unemployed/seeking work 18.3 16.9 32.5 32.3 33.4 16.0 25.1 25.6 320
In further/higher education 16.3 19.6 31.9 32.3 31.8 23.7 22.7 21.8 320
Permanently sick or disabled 58.8 16.4 12.4 12.4 67.7 10.9 7.5 13.9 430
by annual net household income:
up to £10,000 p.a. 31.0 17.9 24.5 26.6 41.7 16.6 21.4 20.3 1,140
over £10,000 - £15,000 31.9 18.6 25.4 24.1 46.4 18.1 17.7 17.8 1,600
over £15,000 - £20,000 32.1 18.1 28.1 21.7 45.3 15.2 19.8 19.8 1,410
over £20,000 - £25,000 35.6 16.5 27.1 20.8 41.5 17.7 19.8 21.1 1,160
over £25,000 - £30,000 31.1 18.9 26.1 23.8 40.9 21.9 18.0 19.3 890
over £30,000 - £40,000 30.9 21.6 25.6 21.9 34.0 24.1 20.1 21.8 1,260
over £40,000 p.a. 29.0 21.7 26.7 22.6 30.4 24.4 20.6 24.6 1,750
by Scottish Index of Multiple Deprivation quintiles:
1 (20% most deprived) 31.2 18.0 28.7 22.1 45.8 17.6 19.8 16.8 1,770
2' 30.9 19.7 27.1 22.3 42.7 19.3 19.1 18.9 1,960
3' 33.8 18.3 25.1 22.9 36.6 19.7 19.9 23.8 2,090
4' 33.7 21.1 24.8 20.3 33.1 21.8 20.8 24.2 2,030
5 (20% least deprived) 27.1 19.8 26.1 27.1 35.1 23.1 19.4 22.3 1,690
by urban/rural classification:
Large urban areas 25.1 17.8 27.9 29.1 41.3 19.0 19.4 20.4 2,840
Other urban 31.2 22.0 27.3 19.6 40.3 20.9 20.3 18.5 3,240
Small accessible towns 34.3 19.8 25.4 20.5 35.1 22.8 22.0 20.1 920
Small remote towns 31.3 18.7 29.5 20.5 43.1 18.1 15.5 23.3 550
Accessible rural 39.7 18.2 22.1 20.0 29.4 21.0 20.1 29.5 1,040
Remote rural 49.5 15.1 18.6 16.8 33.6 20.5 18.2 27.8 960
by frequency of driving†:
Every day 36.9 21.2 23.8 18.1 34.7 20.5 20.5 24.3 3,750
At least three times a week 29.0 23.6 27.0 20.5 31.0 25.3 24.6 19.1 1,500
Once or twice a week 28.6 18.6 27.6 25.2 36.4 24.1 16.7 22.8 570
Less often 28.2 17.6 23.7 30.5 41.7 21.0 17.6 19.8 280 Never, but holds full driving licence 24.1 14.5 29.4 32.1 44.3 13.1 18.6 24.0 370
*Only trips longer than a quarter of a mile are recorded.†Only includes those with a full driving licence.1. Question asked in survey every other year. 2016 is the most recent data available.
Walking as a means of transport Walking just for pleasure / to keep fit Sample size
(=100%)
34

Table 25a: [Cycling] Frequency of cycling in the previous seven days*, 2016
None 1-2 days 3-5 days 6-7 days None 1-2 days 3-5 days 6-7 daysrow percentages
All people: 94.1 2.8 2.1 1.0 93.5 3.8 1.9 0.8 9,640 by gender:
Male 91.5 4.1 3.1 1.4 91.1 5.0 3.0 1.0 4,400 Female 96.6 1.6 1.1 0.7 95.8 2.6 1.0 0.6 5,240
by age: 16-19 92.5 4.7 1.7 1.0 91.0 3.7 5.0 0.2 250 20-29 91.6 3.4 3.3 1.7 92.8 4.1 1.7 1.3 1,100 30-39 91.4 3.6 3.5 1.6 91.5 4.8 2.8 1.0 1,370 40-49 93.0 3.7 2.4 0.8 91.2 5.2 2.6 0.9 1,510 50-59 94.4 3.0 1.5 1.1 92.6 4.9 1.6 0.8 1,620 60-69 96.4 1.6 1.6 0.4 95.7 2.2 1.7 0.5 1,700 70-79 98.5 0.5 0.5 0.5 98.0 1.3 0.3 0.4 1,370 80+ 99.7 0.3 0.0 0.0 99.9 0.1 0.0 0.0 710
by current situation: Self employed 92.0 4.1 3.3 0.6 91.0 5.5 2.6 0.9 630 Employed full time 92.6 3.4 2.8 1.2 91.2 5.7 2.4 0.7 3,120 Employed part time 94.0 2.9 1.8 1.3 94.0 3.1 1.9 1.1 960 Looking after the home/family 96.3 2.0 1.1 0.6 95.5 2.5 1.2 0.9 460 Permanently retired from work 97.9 1.1 0.6 0.4 97.3 1.5 0.7 0.4 3,180 Unemployed/seeking work 91.3 4.1 3.1 1.5 93.1 3.4 2.3 1.2 320 In further/higher education 89.5 3.8 3.5 3.2 91.6 3.2 2.8 2.4 330 Permanently sick or disabled 99.0 0.6 0.4 0.0 99.3 0.5 0.0 0.2 430
by annual net household income: up to £10,000 p.a. 93.3 3.1 1.4 2.1 94.4 2.3 1.7 1.5 1,150 over £10,000 - £15,000 95.7 2.4 1.2 0.7 96.0 2.8 0.7 0.5 1,620 over £15,000 - £20,000 96.1 1.0 1.8 1.1 96.1 1.5 1.5 1.0 1,420 over £20,000 - £25,000 95.3 2.8 1.3 0.6 94.0 4.4 1.1 0.5 1,170 over £25,000 - £30,000 93.2 4.4 1.8 0.6 93.8 3.1 2.3 0.8 900 over £30,000 - £40,000 95.0 1.9 2.7 0.4 93.5 3.5 2.7 0.2 1,280 over £40,000 p.a. 92.1 3.6 3.1 1.1 90.3 6.3 2.6 0.8 1,760
by Scottish Index of Multiple Deprivation quintiles: 1 (20% most deprived) 96.3 1.7 1.5 0.5 96.6 1.9 1.3 0.2 1,800 2' 94.5 2.9 1.6 1.0 94.8 2.3 2.0 0.9 1,980 3' 93.7 2.7 2.3 1.4 93.0 3.9 1.8 1.3 2,110 4' 93.4 3.2 2.6 0.9 92.1 4.9 2.5 0.5 2,050 5 (20% least deprived) 92.8 3.5 2.5 1.2 91.2 5.8 2.1 0.9 1,710
by urban/rural classification: Large urban areas 91.8 3.5 2.8 1.9 92.7 4.1 1.9 1.2 2,880 Other urban 95.6 2.2 1.6 0.5 94.8 3.2 1.5 0.5 3,280 Small accessible towns 95.5 2.1 2.2 0.3 94.1 3.5 2.2 0.3 930 Small remote towns 90.2 7.9 0.8 1.1 89.7 4.5 4.8 1.0 550 Accessible rural 96.1 1.4 1.9 0.5 93.8 3.0 2.6 0.6 1,050 Remote rural 95.2 2.4 1.8 0.6 91.3 6.6 1.9 0.2 960
by frequency of driving†: Every day 95.1 2.6 1.8 0.5 93.4 4.2 2.0 0.4 3,780 At least three times a week 93.0 3.6 2.4 1.0 92.0 5.5 2.0 0.5 1,510 Once or twice a week 89.6 3.8 4.0 2.5 90.1 5.6 2.5 1.8 580 Less often 91.2 2.0 3.2 3.6 91.8 2.5 3.7 2.0 280 Never, but holds full driving licence 91.6 2.2 2.4 3.7 90.9 3.8 2.0 3.3 380
*Only trips longer than a quarter of a mile are recorded.†Only includes those with a full driving licence.
Cycling as a means of transport Cycling just for pleasure / to keep fit Sample size
35

Table 26: [Cycling] Reasons why do not cycle to work, 2009-20141
2009 2010 2011 2012 2013 2014Reasons why do not cycle to work
Too far to cycle 35.6 38.9 34.9 34.3 37.4 33.3Weather too cold / wet / windy 17.6 18.2 19.3 21.0 19.8 16.2Do not have a bike 13.8 13.9 12.2 16.4 14.3 11.9Too many cars on the road 15.7 12.8 11.9 14.8 14.7 18.2Traffic travels too fast 13.2 11.5 10.1 12.4 11.6 12.4Prefer to drive 10.2 11.4 9.1 10.6 10.0 9.1Inconsiderate drivers 10.0 8.5 8.0 9.9 8.9 9.1Concerns for personal safety on dark / lonely roads 9.9 9.1 9.6 9.1 9.0 6.7No way to carry luggage / shopping 9.4 10.3 7.9 8.3 7.9 5.9Nowhere at work to shower / change 7.7 7.8 7.6 7.5 7.3 5.5Don't have time to cycle 7.9 7.9 7.0 9.2 8.3 9.2Too hilly 5.8 5.9 7.2 7.6 6.2 4.4Not fit enough 5.7 6.6 6.0 5.8 4.9 5.6Can't be bothered 6.4 6.3 6.4 6.8 5.9 5.3Road surfaces are dangerous 3.9 5.1 6.1 4.9 5.6 4.2Not enough safe places to lock bike 2.5 2.7 2.7 2.2 4.1 1.7Can’t ride a bike 2.4 1.7 1.8 2.1 2.4 2.1Health reasons 2.3 1.9 1.4 2.3 1.9 2.5
Difficult taking bike onto other forms of transport 2 .. .. .. 1.7 2.0 1.6Inconsiderate pedestrians in towns\cities 1.0 0.6 0.6 0.5 0.7 0.7Worried about pollution from traffic 1.6 1.6 1.1 1.5 1.3 1.5Nowhere to keep a bicycle at home 0.6 0.9 0.6 0.3 0.8 0.5Too many bikes stolen 0.9 0.5 0.5 0.4 0.7 1.3
Sample size (=100%) 2,770 2,350 2,580 1,610 1,540 1,590
2. Asked from 2012 only
Table 27: Households' bus availabilityFollowing changes to the Scottish Household survey data for Table 27 is no longer collected - Please see TATIS 2011 for the most recently produced version of the table.
1. The survey routing was updated in 2012 to ensure that only those with at least one bike in their household were asked this question. To ensure comparability, responses from previous years have only been included in this table where the respondent's household had a bike. The question was moved to biennial in 2014, and has been omitted from the 2016 survey in error. 2014 is the latest available data.
36

Table 28: [Bus and train use] Adults use of local bus and train services, in the past month, 2016
Bus Train
Every day, or almost
every day
2 or 3 times per
week
About once a week
About once a
fortnight, or about once a month
Not used in past month
Every day, or almost
every day
2 or 3 times per
week
About once a week
About once a
fortnight, or about once a month
Not used in past month
Sample size(=100%)*
Row percentages Row percentagesAll people aged 16+ 9.3 10.6 7.7 13.2 59.2 2.3 2.1 4.2 20.8 70.5 9,640by gender:
Male 8.3 8.5 7.8 13.3 62.0 2.8 2.8 4.2 19.4 70.7 4,400Female 10.2 12.4 7.6 13.0 56.6 1.9 1.5 4.1 22.1 70.3 5,240
by age:16-19 20.0 13.9 9.6 15.1 41.4 5.6 4.2 5.6 25.6 59.0 25020-29 13.9 8.8 9.3 14.3 53.7 4.9 3.8 5.6 25.2 60.5 1,10030-39 8.4 8.4 7.0 14.0 62.2 2.5 1.8 5.3 24.7 65.7 1,37040-49 5.8 7.1 5.5 11.5 70.2 2.7 2.0 3.9 23.9 67.5 1,51050-59 7.0 6.6 5.2 11.9 69.4 2.1 1.7 3.8 20.8 71.6 1,62060-69 7.9 16.0 9.9 15.3 51.0 0.2 1.8 3.8 16.5 77.8 1,70070-79 9.6 15.9 9.8 13.1 51.4 0.1 1.2 2.6 13.6 82.6 1,37080+ 8.3 17.5 8.4 8.9 56.9 0.3 0.7 1.2 6.7 91.1 710
by current situation:Self employed 2.4 4.9 3.8 14.0 74.9 2.1 2.3 4.0 22.4 69.2 630Employed full time 8.9 4.7 5.4 12.0 69.0 4.4 2.8 5.1 24.6 63.2 3,130Employed part time 12.0 10.6 5.7 12.9 58.7 1.4 2.4 4.0 22.4 69.8 960Looking after the home or family 3.9 16.9 8.5 14.8 55.9 . 0.6 1.5 20.7 77.2 460Permanently retired from work 8.3 16.5 10.4 13.4 51.4 0.1 1.2 3.2 13.3 82.2 3,180Unemployed and seeking work 13.6 19.9 15.4 17.6 33.4 0.5 2.4 7.9 16.6 72.6 320In further / higher education 16.6 14.3 9.3 13.4 46.4 5.9 4.0 4.8 30.6 54.7 330Permanently sick or disabled 9.0 13.6 11.2 13.4 52.8 . 0.6 0.6 11.0 87.9 430
by annual net household income:up to £10,000 p.a. 11.9 17.7 12.4 10.4 47.6 0.3 2.0 3.1 16.0 78.6 1,150over £10,000 - £15,000 14.5 17.4 10.1 11.3 46.7 1.2 2.3 3.4 15.7 77.4 1,620over £15,000 - £20,000 11.5 14.0 9.9 14.3 50.2 1.8 1.6 3.9 15.8 76.9 1,420over £20,000 - £25,000 10.5 10.8 8.0 12.7 58.1 1.2 2.1 3.4 19.3 74.0 1,170over £25,000 - £30,000 9.4 9.4 7.4 13.7 60.1 1.2 1.9 3.8 19.7 73.5 900over £30,000 - £40,000 6.9 5.9 6.3 12.8 68.0 4.4 2.8 4.0 23.4 65.4 1,280over £40,000 p.a. 5.4 5.2 4.3 14.5 70.6 4.0 2.2 5.8 27.9 60.0 1,760
by Scottish Index of Multiple Deprivation:1 - Most Deprived 14.9 14.1 8.9 11.6 50.5 2.5 2.1 3.6 16.8 75.0 1,8002 11.2 10.4 9.1 12.9 56.4 2.6 2.5 3.9 18.6 72.4 1,9803 8.6 9.5 7.0 12.6 62.3 1.8 2.3 4.3 21.7 69.9 2,1104 5.1 7.9 5.9 11.8 69.3 1.6 2.2 3.4 20.7 72.1 2,0505 - Least Deprived 6.8 11.0 7.8 17.0 57.4 3.1 1.7 5.6 26.2 63.3 1,710
by urban/rural:Large urban areas 15.4 15.1 10.0 15.6 43.8 2.7 2.5 5.8 20.8 68.1 2,880Other urban 7.6 9.7 7.2 12.1 63.5 2.9 2.5 3.9 23.7 66.9 3,280Small accessible towns 6.4 6.8 7.8 13.3 65.8 2.6 2.0 3.0 20.7 71.7 930Small remote towns 2.4 7.7 4.2 8.3 77.5 . 0.4 1.7 15.1 82.7 550Accessible rural 3.8 6.1 5.2 12.8 72.1 0.7 1.4 2.7 19.0 76.2 1,050Remote rural 1.9 4.5 4.1 8.4 81.0 0.5 0.5 1.9 10.7 86.5 960
by frequency of driving†:Every day 0.8 2.6 3.8 12.4 80.4 1.2 1.3 3.5 24.2 69.8 3,780At least three times a week 4.1 9.1 7.0 14.7 65.1 2.2 2.5 5.8 20.6 68.8 1,510Once or twice a week 7.6 12.1 6.3 12.8 61.1 4.7 1.7 4.9 17.5 71.3 580Less often 14.9 12.6 10.0 15.2 47.3 2.8 2.6 6.2 24.3 64.1 280Never, but holds full driving licence 17.8 20.9 15.6 11.5 34.3 1.4 2.5 4.6 20.0 71.5 380
by driving licence:Holds a full driving licence 3.5 6.2 5.5 13.0 71.8 1.8 1.7 4.2 22.6 69.6 6,530Does NOT hold a full driving licence 21.4 19.8 12.4 13.6 32.7 3.4 3.0 4.0 17.0 72.5 3,110
†Only includes those with a full driving licence
* Sample size given is for train use as the bus use and train use numbers are comparable.
37

Tab
le 2
9: [U
sers
' vie
ws
on lo
cal b
us s
ervi
ces]
Adu
lts (
16+
) w
ho h
ave
used
the
bus
in th
e pr
evio
us m
onth
, vie
ws
on th
eir
loca
l bus
ser
vice
s, 2
016
Str
on
gly
ag
ree
Ten
d t
o
agre
eT
ota
l ag
ree
Nei
ther
ag
ree
no
r d
isag
ree
Ten
d t
o
dis
agre
eS
tro
ng
ly
dis
agre
eN
o
op
inio
nS
amp
le
size
(=
100%
)R
ow p
erce
ntag
esB
uses
run
to ti
met
able
25.7
48.8
74.5
7.3
10.5
5.9
1.9
3,91
0B
us s
ervi
ce is
sta
ble
and
not r
egul
arly
cha
ngin
g29
.550
.780
.28.
56.
32.
72.
33,
910
Bus
es a
re c
lean
26.8
51.8
78.6
10.5
7.8
2.1
1.0
3,91
0B
uses
are
env
ironm
enta
lly fr
iend
ly17
.144
.561
.617
.57.
43.
010
.53,
910
Fee
l saf
e/se
cure
on
bus
durin
g th
e da
y46
.147
.093
.13.
31.
80.
80.
93,
910
It is
sim
ple
deci
ding
wha
t typ
e of
tick
et I
need
46.4
41.1
87.5
4.7
2.5
1.1
4.2
3,91
0F
indi
ng o
ut a
bout
rou
tes
and
times
is e
asy
37.6
45.5
83.1
6.7
5.2
2.5
2.5
3,91
0
Eas
y to
cha
nge
from
bus
es to
oth
er fo
rms
of tr
ansp
ort
29.2
46.3
75.5
9.9
4.2
1.7
8.7
3,91
0B
us fa
res
are
good
val
ue29
.332
.061
.310
.012
.610
.26.
03,
910
Fee
l saf
e/se
cure
on
bus
durin
g th
e ev
enin
g27
.742
.269
.910
.86.
82.
99.
73,
910
Tab
le 3
0: [U
sers
' vie
ws
on lo
cal t
rain
ser
vice
s] A
dults
(16
+)
who
hav
e us
ed th
e tr
ain
in th
e pr
evio
us m
onth
, vie
ws
on th
eir
loca
l tra
in s
ervi
ces,
201
6
Str
on
gly
ag
ree
Ten
d t
o
agre
eT
ota
l ag
ree
Nei
ther
ag
ree
no
r d
isag
ree
Ten
d t
o
dis
agre
eS
tro
ng
ly
dis
agre
eN
o
op
inio
nS
amp
le
size
(=
100%
)R
ow p
erce
ntag
esT
rain
s ru
n to
tim
etab
le35
.549
.484
.94.
75.
82.
52.
12,
560
Tra
in s
ervi
ce is
sta
ble
and
not r
egul
arly
cha
ngin
g34
.849
.083
.86.
65.
21.
72.
72,
560
Tra
ins
are
clea
n32
.953
.286
.17.
44.
61.
01.
02,
560
Fee
l saf
e/se
cure
on
trai
ns d
urin
g th
e da
y51
.443
.995
.32.
31.
00.
31.
12,
560
It is
sim
ple
deci
de w
hat t
ype
of ti
cket
I ne
ed42
.244
.486
.65.
14.
42.
11.
82,
560
Fin
ding
out
abo
ut r
oute
s an
d tim
es is
eas
y43
.346
.589
.85.
32.
70.
81.
52,
560
Eas
y to
cha
nge
from
trai
ns to
oth
er fo
rms
of tr
ansp
ort
31.6
44.2
75.8
11.6
4.8
1.4
6.4
2,56
0T
rain
fare
s ar
e go
od v
alue
18.9
37.0
55.9
12.9
18.5
10.7
1.9
2,56
0F
eel s
afe/
secu
re o
n tr
ains
dur
ing
the
even
ing
33.8
43.6
77.4
8.4
7.2
1.9
5.2
2,56
0
38

Table 31: [Concessionary fare pass] Possession of concessionary fare pass for all adults aged 16+, 2016
Every dayAlmost
every day
2 or 3 times a
week
Once a week
Once a fortnight
Once a month
Not used No passSample
size (=100%)
Row percentagesAll adults aged 16+ 0.8 2.7 5.9 3.2 2.1 3.3 10.5 71.5 9,640
16 - 39 0.2 0.5 0.8 0.3 0.1 0.2 0.4 97.5 2,720 40 - 49 0.4 0.7 1.2 0.3 0.4 0.3 1.2 95.6 1,510 50 - 59 0.0 0.5 1.1 0.3 0.6 1.2 1.6 94.6 1,620 60 - 64 2.5 6.2 15.4 8.6 7.6 9.2 25.8 24.7 820 65 - 69 2.0 9.4 15.9 12.2 6.8 10.8 32.6 10.4 880 70 - 74 3.1 7.6 19.8 9.4 6.0 11.2 35.9 7.1 750 75 - 79 2.2 8.7 18.1 10.6 6.6 11.3 35.0 7.3 620 80 + 2.0 6.8 19.1 8.7 4.4 8.2 41.1 9.8 710
Table 32: [Concessionary fare pass] Possession of concessionary fare pass for all adults aged 60+, 2016
Every dayAlmost
every day
2 or 3 times a week
Once a week
Once a fortnight
Once a month
Not used No passSample
size (=100%)
Row percentagesAll 2.4 7.7 17.4 9.9 6.4 10.1 33.3 12.8 3,780 by gender:
Male 2.5 5.6 12.5 10.2 7.0 10.3 35.2 16.6 1,690 Female 2.2 9.5 21.6 9.7 5.9 10.0 31.6 9.5 2,090
by current situation:Employed 2.2 5.7 10.2 6.9 5.5 9.7 30.7 29.1 570 Permanently retired 2.3 7.9 18.9 10.4 6.7 10.4 34.4 9.0 3,080
by annual net household income:up to £10,000 p.a. 3.4 9.6 22.1 8.8 6.2 7.8 30.5 11.6 650 £10,000 - £15,000 4.2 8.0 18.4 11.5 4.8 9.3 35.6 8.2 890 £15,000 - £20,000 2.3 9.9 20.8 10.7 8.1 9.1 29.1 10.0 690 over £20,000 p.a. 1.3 6.1 14.0 9.4 6.7 11.5 34.7 16.2 1,380
by Scottish Index of Multiple Deprivation quintiles:1 - Most Deprived 4.4 10.3 26.6 9.5 4.2 6.4 27.2 11.5 580 2 1.9 7.9 18.8 10.0 5.9 10.1 34.2 11.2 730 3 2.6 7.1 12.6 8.3 5.7 10.5 39.1 14.2 840 4 1.3 4.7 13.2 9.5 7.9 10.5 36.8 16.2 890 5 - Least Deprived 2.1 9.3 18.3 12.2 7.7 12.1 27.9 10.4 730
by urban/rural classification:Large urban areas 5.4 14.0 25.0 11.6 6.9 7.3 20.0 9.8 980 Other urban 1.4 7.2 17.6 10.0 6.1 10.2 35.9 11.5 1,260 Small accessible towns 1.2 3.4 17.0 10.8 7.6 11.1 35.4 13.5 400 Small remote towns 0.0 3.0 9.5 7.2 7.2 8.2 49.6 15.2 240 Accessible rural 0.9 3.7 9.0 8.8 6.3 14.5 38.2 18.7 470 Remote rural 0.3 1.1 5.4 5.3 4.2 13.2 53.0 17.5 450
by frequency of driving†:Every day 0.6 1.4 9.1 8.7 7.8 13.6 41.0 17.9 1,130 At least once a week 1.0 5.3 14.4 11.5 7.0 12.8 35.3 12.8 1,000 Less often 4.3 14.3 20.7 10.5 4.4 7.8 26.3 11.6 320
by whether they hold a full driving licenceHolds a full driving licence 1.1 4.4 12.7 10.1 7.0 12.5 37.1 15.1 2,420 Does NOT hold a full driving licence 4.9 14.3 26.6 9.5 5.3 5.4 25.8 8.3 1,360
by whether has a long term physical / mental health condition / illnessNo 2.1 8.1 17.4 10.6 7.8 10.7 29.6 13.6 1,910 Yes 2.7 7.4 17.4 9.3 5.1 9.5 36.9 11.8 1,850
If yes, does it impact on ability to carry out day to day activities A lot 1.8 5.3 13.2 7.1 3.4 8.2 46.2 14.7 810 A little 3.5 9.1 22.1 10.9 6.4 8.1 29.4 10.4 740 Not at all 3.0 8.4 17.4 10.8 6.2 14.7 31.4 8.2 360 †Only includes those with a full driving licence
How often uses free travel pass
How often uses free travel pass
39

Tab
le 3
3: [A
cces
s to
ser
vice
s] A
cces
s to
ser
vice
s th
at r
espo
nden
ts th
ough
t wer
e ve
ry o
r fa
irly
conv
enie
nt, 2
016
Po
st
off
ice
Do
cto
rs
surg
ery
Sm
all f
oo
d
sho
pp
ing
Cas
h
mac
hin
eB
anki
ng
Ch
emis
tH
osp
ital
o
utp
atie
nts
Pet
rol
stat
ion
Pu
blic
tr
ansp
ort
Den
tist
Sam
ple
si
ze
(=10
0%)
All
83.6
83.6
93.6
89.1
71.8
89.4
60.3
76.7
82.4
77.0
9,64
0b
y g
end
er:
Mal
e83
.783
.694
.189
.071
.789
.660
.078
.682
.376
.54,
400
Fem
ale
83.4
83.6
93.1
89.1
71.9
89.1
60.5
74.9
82.5
77.5
5,24
0b
y ag
e:16
- 3
985
.982
.595
.091
.774
.691
.060
.175
.886
.477
.32,
720
40 -
49
84.3
83.8
93.4
89.2
72.1
88.9
63.9
81.5
80.1
78.7
1,51
050
- 5
982
.483
.793
.789
.571
.590
.262
.381
.580
.079
.41,
620
60 +
80.9
84.9
91.8
85.5
68.4
87.1
57.3
72.2
80.1
74.5
3,78
0b
y u
rban
/ru
ral c
lass
ific
atio
n:
Larg
e ur
ban
area
s84
.483
.895
.191
.572
.192
.160
.374
.991
.779
.32,
880
Oth
er u
rban
83.3
84.3
95.0
92.2
78.9
91.2
65.9
81.1
85.9
81.5
3,28
0S
mal
l acc
essi
ble
tow
ns88
.088
.594
.793
.669
.694
.054
.375
.778
.481
.693
0S
mal
l rem
ote
tow
ns91
.987
.092
.690
.583
.393
.271
.387
.180
.882
.755
0A
cces
sibl
e ru
ral
77.1
76.0
87.3
75.4
55.9
79.5
51.7
66.6
59.9
62.9
1,05
0R
emot
e ru
ral
80.8
83.4
87.1
74.2
55.0
70.9
45.8
75.5
56.1
53.4
960
by
ann
ual
net
ho
use
ho
ld in
com
e:up
to £
10,0
00 p
.a.
83.8
82.2
94.1
88.0
74.7
87.7
53.6
63.4
84.8
72.9
1,15
0£1
0,00
0 -
£15,
000
84.5
82.4
92.9
87.2
71.9
88.4
54.3
64.5
86.5
73.0
1,62
0£1
5,00
0 -
£20,
000
84.4
85.4
94.5
90.5
70.9
88.3
58.8
71.1
84.0
76.0
1,42
0ov
er £
20,0
00 p
.a.
83.3
84.1
93.5
89.4
71.7
90.2
63.2
83.3
80.7
79.2
5,10
0b
y lic
ence
po
sses
sio
n:
Hol
ds a
full
driv
ing
licen
ce83
.985
.293
.889
.772
.089
.962
.986
.780
.178
.96,
530
Doe
s N
OT
hol
d a
full
driv
ing
licen
ce82
.880
.293
.187
.771
.588
.254
.755
.587
.373
.23,
110
by
nu
mb
er o
f ca
rs a
vaila
ble
:no
ne82
.478
.693
.187
.371
.988
.052
.545
.788
.870
.92,
730
one
+83
.985
.193
.789
.671
.889
.862
.686
.080
.578
.96,
910
Tab
le 3
4: H
ow
ad
ult
s n
orm
ally
tra
vel t
o a
do
cto
rs s
urg
ery
Tab
le 3
5: H
ow
ad
ult
s n
orm
ally
tra
vel t
o a
ho
spit
al o
utp
atie
nts
dep
artm
ent
Tab
le 3
6: H
ow
ad
ult
s n
orm
ally
tra
vel t
o a
den
tis t
Fol
low
ing
chan
ges
to th
e S
cotti
sh H
ouse
hold
sur
vey
data
for
Tab
le 3
4 is
no
long
er c
olle
cted
- P
leas
e se
e T
AT
IS 2
011
for
the
mos
t rec
ently
pro
duce
d ve
rsio
n of
the
tabl
e.
Fol
low
ing
chan
ges
to th
e S
cotti
sh H
ouse
hold
sur
vey
data
for
Tab
le 3
5 is
no
long
er c
olle
cted
- P
leas
e se
e T
AT
IS 2
011
for
the
mos
t rec
ently
pro
duce
d ve
rsio
n of
the
tabl
e.
Fol
low
ing
chan
ges
to th
e S
cotti
sh H
ouse
hold
sur
vey
data
for
Tab
le 3
6 is
no
long
er c
olle
cted
- P
leas
e se
e T
AT
IS 2
011
for
the
mos
t rec
ently
pro
duce
d ve
rsio
n of
the
tabl
e.
40

Table 37a: Flights in the last 12 months for leisure, holidays, visiting friends or family 1
2009 2010 2011 2012 2013 2014 2015 2016Column percentages
Yes 46.8 44.3 43.4 45.9 46.7 46.2 .. 49.9No 52.9 55.5 56.5 54.1 53.3 53.8 .. 50.0Sample size (=100%) 12,540 12,440 12,890 9,890 9,920 9,800 .. 9,640
Table 37b: Frequency of flying for leisure by destination in last 12 months for those who have flown
2009 2010 2011 2012 2013 2014 2015 2016All leisure flights Column percentages
1 or 2 49.8 50.9 50.6 49.4 50.2 49.6 .. 43.73 or 4 25.1 23.8 24.3 24.9 23.6 24.2 .. 26.15 or 6 11.4 10.8 10.4 11.5 12.2 11.0 .. 12.67 or 8 6.1 5.6 5.6 6.2 5.9 5.9 .. 7.79 to 12 4.4 5.0 5.1 5.1 5.1 5.3 .. 5.813 to 20 2.3 2.8 3.1 2.0 2.2 2.9 .. 3.1More than 20 0.9 1.2 0.9 0.9 0.9 1.1 .. 1.1
Lower decile 2.0 2.0 2.0 2.0 2.0 2.0 .. 2.0Lower quartile 2.0 2.0 2.0 2.0 2.0 2.0 .. 2.0Median 3.0 2.0 2.0 3.0 2.0 3.0 .. 4.0Upper quartile 5.0 5.0 5.0 6.0 6.0 6.0 .. 6.0Upper decile 8.0 8.0 8.0 8.0 8.0 8.0 .. 8.0Mean* 4.2 20.8 4.3 4.2 4.3 4.4 .. 4.7
Of which:Flights within Scotland
0 92.9 93.8 95.9 94.2 94.3 95.2 .. 95.31 or 2 4.9 4.6 2.8 4.1 4.0 3.3 .. 2.63 or 4 1.2 0.9 0.7 1.0 0.8 0.8 .. 1.05 or 6 0.5 0.3 0.3 0.3 0.5 0.3 .. 0.47 or 8 0.2 0.1 0.1 0.1 0.2 0.2 .. 0.29 to 12 0.2 0.3 0.1 0.2 0.2 0.1 .. 0.313 to 20 0.1 ** ** 0.1 0.1 0.1 .. 0.0More than 20 0.1 ** ** 0.0 ** 0.1 .. 0.0
Flights to rest of UK0 67.2 67.0 68.9 69.8 70.5 71.7 .. 69.31 or 2 22.4 22.0 20.3 19.8 18.8 17.8 .. 19.93 or 4 5.8 5.7 5.3 6.0 5.5 5.6 .. 5.75 or 6 2.3 2.2 2.2 2.0 2.3 2.6 .. 2.37 or 8 0.8 1.5 1.3 1.3 1.3 1.0 .. 1.29 to 12 0.8 0.9 1.3 0.8 1.0 0.8 .. 1.013 to 20 0.4 0.4 0.5 0.2 0.2 0.4 .. 0.4More than 20 0.2 0.3 0.2 0.1 0.3 0.2 .. 0.2
Flights to other European Countries0 27.1 30.5 28.1 26.2 25.9 24.0 .. 26.31 or 2 49.7 47.8 48.6 48.7 48.7 49.5 .. 48.33 or 4 15.3 13.5 15.1 17.0 16.2 15.7 .. 16.15 or 6 4.7 4.3 4.5 4.6 5.8 6.2 .. 5.47 or 8 2.0 2.1 1.9 2.2 1.9 2.3 .. 2.19 to 12 0.9 1.2 1.1 1.2 1.2 1.7 .. 1.313 to 20 0.3 0.5 0.5 0.2 0.2 0.6 .. 0.4More than 20 ** 0.2 0.1 ** 0.2 0.1 .. 0.1
Flights to countries outside Europe0 68.3 63.5 66.1 67.3 70.2 69.3 .. 67.51 or 2 25.2 29.0 26.6 26.6 23.7 24.2 .. 25.73 or 4 4.3 4.9 5.0 4.0 4.1 4.1 .. 4.55 or 6 1.3 1.5 1.5 1.1 1.2 1.3 .. 1.37 or 8 0.4 0.7 0.3 0.4 0.4 0.6 .. 0.59 to 12 0.3 0.4 0.5 0.3 0.2 0.4 .. 0.413 to 20 0.1 0.1 ** 0.2 ** 0.1 .. 0.1More than 20 ** ** . ** ** . .. 0.0
Sample size (=100%) 5,310 4,180 5,100 4,250 4,380 4,280 .. 4,450
** value supressed as cell contains fewer than 5 responses
1. Sample size is those who answered yes to previous question asking whether respondent had flown for leisure, holildays * Note mean value can be dragged up by a handful of respondents reporting making a large number of flights eg in 2010. The median is a better measure of the average.
1. Percentages may not add up to exactly 100% as very small numbers of people responded 'don't know' or refused to answer.
41

Table 38a: Flights in the last 12 months for work or business purposes 1
2009 2010 2011 2012 2013 2014 2015 2016Column percentages
Yes 8.7 6.9 7.9 7.8 8.0 7.9 .. 7.8No 90.9 92.9 92.1 92.1 91.9 92.1 .. 92.0Sample size (=100%) 12,540 12,440 12,890 9,890 9,920 9,800 .. 9,640
Table 38b: Frequency of flying for business by destination in last 12 months 1
2009 2010 2011 2012 2013 2014 2015 2016All business flights Column percentages
1 or 2 33.8 31.0 28.7 31.5 27.8 31.4 .. 34.83 or 4 15.9 15.6 18.1 14.1 17.2 15.2 .. 16.85 or 6 9.4 9.7 8.7 10.2 9.1 10.1 .. 8.87 or 8 6.9 5.3 6.7 5.8 8.0 5.9 .. 6.49 to 12 10.3 9.3 8.7 8.6 8.9 10.0 .. 11.313 to 20 7.3 9.6 9.4 9.5 8.4 8.5 .. 7.0More than 20 16.3 19.6 19.7 20.4 20.6 18.9 .. 14.9
Lower decile 2 2 2 2 2 2 .. 2Lower quartile 2 2 2 2 2 2 .. 2Median 5 6 6 6 6 6 .. 4Upper quartile 12 16 16 18 16 14 .. 12Upper decile 30 40 40 40 40 34 .. 30Mean* 14.4 23.3 16.5 16.0 14.3 14.1 .. 12.3
Of which:Flights within Scotland
0 83.3 85.7 83.8 86.2 85.4 86.5 .. 89.21 or 2 7.7 5.2 5.8 3.9 5.4 4.9 .. 4.63 or 4 2.3 1.1 2.5 1.8 2.7 1.6 .. 2.05 or 6 2.0 1.5 1.3 1.3 0.7 0.8 .. 1.57 or 8 0.8 1.3 1.7 0.6 1.4 0.9 .. 0.39 to 12 2.0 2.4 0.9 1.7 1.0 0.6 .. 0.513 to 20 0.9 0.6 1.3 1.6 0.8 0.9 .. 0.7More than 20 1.0 2.1 2.5 3.0 2.6 3.9 .. 1.3
Flights to rest of UK0 24.2 26.1 25.9 26.6 27.8 28.1 .. 26.81 or 2 30.8 28.7 25.1 25.2 25.7 25.1 .. 26.53 or 4 11.2 10.5 13.9 11.8 11.4 11.6 .. 12.25 or 6 8.9 8.0 7.7 7.7 6.6 8.3 .. 7.57 or 8 4.7 3.6 3.8 4.6 5.3 4.1 .. 4.29 to 12 6.7 7.1 9.3 8.9 6.7 7.6 .. 8.013 to 20 5.0 5.3 4.7 5.0 4.7 5.4 .. 4.6More than 20 8.5 10.7 9.5 10.1 11.8 9.7 .. 10.2
Flights to other European Countries0 65.9 64.2 65.0 67.8 64.5 67.0 .. 65.51 or 2 16.5 17.8 14.5 11.9 16.4 13.2 .. 14.83 or 4 5.4 6.1 6.2 6.4 7.8 6.7 .. 6.95 or 6 3.6 2.5 3.3 2.6 1.9 4.2 .. 2.97 or 8 1.4 1.2 2.0 2.2 2.6 3.0 .. 2.29 to 12 3.8 4.3 3.0 3.9 2.2 2.7 .. 3.113 to 20 1.9 1.6 2.3 1.7 2.0 1.2 .. 1.9More than 20 1.5 2.4 3.7 3.4 2.6 2.0 .. 2.7
Flights to countries outside Europe0 78.2 77.3 79.2 75.6 80.9 77.4 .. 78.61 or 2 10.7 9.9 10.1 12.3 8.7 11.0 .. 10.13 or 4 3.6 3.2 3.3 3.9 2.8 4.4 .. 3.55 or 6 1.6 2.1 1.9 2.1 1.0 1.3 .. 1.77 or 8 0.5 0.5 1.8 1.6 1.5 0.7 .. 1.19 to 12 2.9 2.3 2.1 1.6 2.2 2.5 .. 2.113 to 20 1.4 2.5 0.9 1.1 1.4 1.7 .. 1.4More than 20 1.0 2.3 0.8 1.8 1.5 1.2 .. 1.3
Sample size (=100%) 980 690 930 740 740 710 .. 680
1. Sample size is those who answered yes to previous question asking whether respondent had flown for work or business purposes in the last 12 months.* Note mean value can be dragged up by a handful of respondents reporting making a large number of flights eg in 2010. The median is a better measure of the average.
1. Percentages may not add up to exactly 100% as very small numbers of people responded 'don't know' or refused to answer.
42

Table 39: Reason for choosing flying within the UK over other forms of transport 1
2009 2010 2011 2012 2013 2014
Quicker 80.4 82.8 83.1 83.2 82.5 84.6Cheaper 27.7 28.1 25.2 27.8 23.4 22.3Easy/convenient 3.6 1.5 1.3 1.6 2.2 0.7Employer/someone else organised 2.6 1.2 1.1 1.2 1.7 1.2Connecting flight/part of holiday 1.9 1.8 2.4 2.0 2.5 2.2No alternative 1.6 1.1 1.6 0.8 1.3 0.6Sample size (=100%) 1,590 1,510 1,150 2,010 2,050 1,920 1. Percentages will sum to more than 100% as multiple answers can be given.
Table 40a: Frequency of use of ferry services: 2012-2013
Table 40b: Purpose of ferry use
Table 40c: Reason for choosing to travel by ferry
Following changes to the Scottish Household survey data for Table 40a is no longer collected - Please see TATIS 2014 for the most recently produce
Following changes to the Scottish Household survey data for Table 40b is no longer collected - Please see TATIS 2014 for the most recently produce
43

2012 2013 2014 2016 2012 2013 2014 2015 2016Nothing discourages 14.35 14.16 16.3 17.6 Nothing 57.0 55.8 56.3 .. 53.4Takes too long 16.54 13.21 15.61 19 No nearby station 3.7 4.6 5.8 .. 8.2Inconvenient 10.84 9.08 7.53 9.9 Takes too long 1.3 1.3 0.8 .. 1.4No direct route 12.43 10.58 10.1 11.5 Inconvenient 2.9 2.5 1.1 .. 2.4Use my own car 23.75 20.63 18.86 19.3 No direct route 2.2 2.2 1.7 .. 2.1Need a car for / at work 6.18 6.72 4.6 5.4 Use my own car 5.5 2.5 1.9 .. 2.8Cost 9.39 9.23 8.2 7.6 Need a car for/at work 0.5 0.8 0.7 .. 1.1Work unsocial /unusual hours 2.06 2.42 1.55 1.8 Cost 16.9 17.5 12.0 .. 11.5Public transport unreliable 2.9 3.63 2.59 2.9 Work unsocial/unusual hours 0.2 0.2 0.2 .. 0.2Lack of service 11.34 11.62 10.14 9.7 Lack of service 1.8 1.4 1.2 .. 2.1Too infrequent 5.16 4.43 4.47 4.6 Too infrequent 0.8 0.4 0.8 .. 0.8Health reasons 9.41 8.66 8.1 7.9 Health reasons 0.4 1.0 0.3 .. 0.6Difficult access,on-off steps 1.33 1.59 1.05 1.5 Difficult to access 0.1 0.6 0.3 .. 0.4Too much to carry,awkward 3.19 2.83 2.08 2.2 Too much to carry/awkward 0.5 0.3 0.1 .. 0.2Uncomfortable 1.73 1.56 1.37 1.4 Uncomfortable 0.4 0.4 0.1 .. 0.3No need 15.96 18.95 20.22 19.9 No need 8.1 10.1 16.9 .. 15.3Prefer to walk/cycle 4.13 4.98 3.89 4 Prefer to walk 0.2 0.3 0.2 .. **Dislike waiting about 2.56 2.41 1.65 2.5 Dislike waiting 0.1 0.3 0.1 .. 0.1Long walk to bus stop 3.29 2.65 2.26 3.2 Live centrally/within walking distance 0.4 0.4 0.2 .. 0.4Lives centrally,within walking distance 2.49 2.62 2.67 1.4 Use other things - bus/underground/taxi 0.5 0.1 1.0 .. 1Sample size (=100%) 7,900 7,700 7,759 7,700 Smoking policy 0.1 - - .. *** response options that account for less than 1% have been suppressed Dirty/filthy 0.2 0.1 0.2 .. 1.3
Given lifts 0.0 0.1 - .. **Too crowded 0.8 0.7 0.5 .. 2.7
Not safe 0.4 0.6 0.3 .. **Laziness 0.1 0.0 0.1 .. **
2014 2015 2016 Other 2.9 2.4 1.6 .. 4.1Nothing 39.01 .. 34.4 Sample size (=100%) 2,060 2,110 2,300 .. 2,210 No nearby station 16.13 .. 18.7 1. This question is now also asked of people who did not use a train at all in the previous month; Takes too long 0.71 .. 1.5 results for these respondents are provided in Table 42a. This table continues the series on the Inconvenient 1.74 .. 2.7 same basis as previous years, excluding respondents who had not taken the trainNo direct route 2.95 .. 3.5 in the previous month.Use my own car 3.72 .. 4.1 ** value supressed as cell contains fewer than 5 responsesNeed a car for/at work 0.71 .. 1Cost 9.78 .. 9.2 Table 43: In general, What discourages you from walking more often than you do? (2012-2016)Work unsocial/unusual hours 0.09 .. 0.2 2012 2013 2014 2015 2016Lack of service 1.93 .. 1.8 Nothing 51.0 60.1 57.3 .. 54.1Too infrequent 0.37 .. 0.5 Takes too long 3.9 4.1 4.5 .. 6.1Health reasons 5.19 .. 5.2 Health reasons / unable to walk far 15.9 15.9 15.3 .. 15.8Difficult to access 0.35 .. 0.8 Weather 20.3 11.1 14.7 .. 17.5Too much to carry/awkward 0.11 .. 0.3 Not safe 0.9 1.1 0.7 .. 0.7Uncomfortable 0.25 .. 0.3 Lack of walking paths 0.7 1.0 0.4 .. 0.9No need 22.6 .. 24.3 Poor quality paths 0.4 0.8 0.5 .. 0.7Prefer to walk 0.13 .. 0.2 Inconvenient 0.4 0.6 0.3 .. 0.6Dislike waiting 0.04 .. 0.1 Too much to carry/awkward 0.5 0.5 0.3 .. 0.7Live centrally/within walking distance 0.19 .. 0.2 Travelling with others 0.1 0.1 0.1 .. 0.1Use other things - bus/underground/taxi 0.89 .. 1.2 No need 2.6 1.5 1.8 .. 1.6Smoking policy - .. ** Live too far away 0.4 1.0 0.4 .. 0.6Dirty/filthy 0.1 .. 0.1 Prefer to use other modes - car/bus/train 0.7 0.5 0.5 .. 0.4Given lifts 0.08 .. 0.1 Given lifts 0.1 0.1 0.1 .. 0.1Too crowded 0.34 .. 0.5 Laziness 4.4 4.8 4.4 .. 4.4Not safe 0.2 .. 0.1 Other 3.8 2.7 3.2 .. 3.8Laziness 0.02 .. ** Sample size (=100%) 9,890 9,920 9,800 .. 9,640 Other 1.57 .. 3.7Sample size (=100%) 7,160 .. 7,080 ** value supressed as cell contains fewer than 5 responses
Table 42a: In general, What discourages you from using the train? (only those who did not take the train at all in the past month) (2014-2016)
Table 41: In general, What discourages you from using buses more often than you do? (2012-2016)
Table 42: In general, What discourages you from using the train more often than you do?
(2012-2016)1
44

Table 44: Journey purpose for train journeys: 2012-20161
2012 2013 2014 2015 2016Travel:
To place of work 14.0 11.1 10.7 11.9 12.0In the course of work 10.3 12.3 12.2 9.5 9.8For education 5.5 4.6 4.3 3.5 4.2For shopping 32.7 34.2 32.8 39.0 35.4To hospital, doctor or other health service 2.7 2.7 1.7 2.0 1.6To visit friends or relatives 26.2 25.4 25.3 26.2 24.6For holiday / day trip 12.5 13.4 13.5 15.6 16.2For other recreational activity 18.4 20.5 20.2 20.6 20.3
Sample size (=100%) 2,440 2,480 2,640 2,500 2,560
Table 45: Difficulties experienced when changing between Public Transport: 2012-2016 1
2012 2013 2014 2015 2016None 86.5 … 86.9 … 84.1Not enough time to change modes 3.1 … 2.8 … 4.0Long wait between journeys 5.4 … 5.6 … 6.1Lack of information about connecting modes 2.2 … 2.5 … 2.8Lack of signposting to connecting modes 0.9 … 0.8 … 0.9Unable to use one ticket/ travel pass for all journeys/ modes 1.0 … 1.1 … 1.2Stops/stations not close enough to each other 1.7 … 1.8 … 2.4Accessibility between stops/stations 1.4 … 1.0 … 1.6Other 2.7 … 2.3 … 2.6 Sample Size (=100%) 3,850 … 3,940 … 3,860
1. This question is asked of anyone who has used the train in the last month. Question not asked of bus users.
1. This question is asked of those who use public transport at least once a month. The question is asked in the survey every other year.
45

Table 46: Awareness of sustainable transport policies, 2016
Aware of - electric
vehicles?
Aware of - cycle hire schemes?
cell percentagesAll people: 28.7 14.0 57.8 37.4 9,640 by gender:
Male 33.5 17.9 63.3 41.7 4,400 Female 24.2 10.4 52.6 33.4 5,240
by age: 16-19 13.1 9.2 47.2 28.0 250 20-29 27.5 14.9 59.8 41.3 1,100 30-39 33.4 14.9 60.2 42.1 1,370 40-49 36.4 18.1 66.0 44.9 1,510 50-59 32.3 14.6 61.8 39.3 1,620 60-69 29.8 14.2 58.1 35.1 1,700 70-79 18.9 9.9 46.7 26.6 1,370 80+ 13.5 6.0 35.8 17.8 710
by current situation: Self employed 36.4 19.8 70.6 46.5 630 Employed full time 37.0 18.1 67.4 45.9 3,130 Employed part time 30.6 10.9 53.6 36.9 960 Looking after the home/family 19.1 8.6 47.0 23.0 460 Permanently retired from work 21.7 10.4 49.6 28.4 3,180 Unemployed/seeking work 14.9 10.8 47.0 29.9 320 In further/higher education 28.8 16.0 59.5 45.8 330 Permanently sick or disabled 15.0 8.1 44.6 22.3 430
by annual net household income: up to £10,000 p.a. 18.0 7.8 40.2 24.8 1,150 over £10,000 - £15,000 16.1 7.7 42.7 25.8 1,620 over £15,000 - £20,000 21.6 12.0 52.1 33.3 1,420 over £20,000 - £25,000 26.4 13.2 56.2 35.7 1,170 over £25,000 - £30,000 28.6 14.6 59.3 35.1 900 over £30,000 - £40,000 34.1 17.6 66.6 43.6 1,280 over £40,000 p.a. 42.6 19.6 71.6 48.9 1,760
by Scottish Index of Multiple Deprivation quintiles: 1 (20% most deprived) 16.4 8.7 48.7 29.8 1,800 2' 21.0 11.9 53.5 34.6 1,980 3' 31.7 16.0 59.7 38.5 2,110 4' 32.1 15.2 60.0 38.5 2,050 5 (20% least deprived) 41.7 18.2 66.6 45.3 1,710
by urban/rural classification: Large urban areas 32.0 11.9 57.9 41.8 2,880 Other urban 24.5 14.6 58.0 35.6 3,280 Small accessible towns 28.8 15.4 58.5 39.4 930 Small remote towns 21.9 11.7 49.0 23.7 550 Accessible rural 34.2 17.5 60.8 34.4 1,050 Remote rural 26.1 15.5 53.2 31.7 960
by frequency of driving†: Every day 36.5 19.6 67.3 44.7 3,790 At least three times a week 34.3 15.6 68.4 40.3 1,530 Once or twice a week 37.0 15.3 63.7 42.0 640 Less often 30.5 10.8 65.4 43.6 330 Never, but holds full driving licence 24.4 12.5 55.8 38.5 620
Sample size (=100%)
Aware of - car clubs or formal car
sharing schemes?
Aware of - fuel efficient
driver training
courses?
46

Table 47: Uptake of sustainable transport policies (of those who were aware of the policy): 2015, 20161
Used a cycle hire scheme in the last 12
monthscell percentages
All people: 2.2 2990 10.9 1340 3.6 2,830 by gender:
Male 2.7 1530 13.3 820 4.4 1,490 Female 1.6 1460 6.6 520 2.6 1,340
by age: 16-19 ** 30 ** 10 ** 40 20-29 1.0 260 4.5 130 6.0 340 30-39 2.9 480 18.1 210 4.2 490 40-49 3.0 640 14.0 250 3.8 580 50-59 2.7 640 12.6 310 3.3 540 60-69 1.2 580 8.0 250 ** 490 70-79 1.1 280 2.4 120 ** 280 80+ . 90 4.7 50 . 70
by current situation: Self employed 0.5 280 9.9 130 3.9 270 Employed full time 2.8 1350 15.1 630 4.5 1,300 Employed part time 3.6 330 10.1 130 1.7 300 Looking after the home/family 1.0 90 ** 30 ** 80 Permanently retired from work 1.4 760 5.2 330 ** 670 Unemployed/seeking work ** 50 ** 20 ** 50 In further/higher education 0.6 60 ** 30 6.8 90 Permanently sick or disabled . 60 ** 30 ** 50
by annual net household income: up to £10,000 p.a. 0.7 180 7.1 90 ** 160 over £10,000 - £15,000 1.2 320 8.7 130 3.1 290 over £15,000 - £20,000 1.7 370 8.7 170 3.2 360 over £20,000 - £25,000 1.9 350 6.4 160 1.4 360 over £25,000 - £30,000 1.5 320 7.1 150 2.7 300 over £30,000 - £40,000 3.0 540 13.6 260 4.0 490 over £40,000 p.a. 2.6 850 14.2 350 4.2 830
by Scottish Index of Multiple Deprivation quintiles: 1 (20% most deprived) 1.8 320 10.2 150 3.8 350 2' 2.0 490 10.4 230 3.8 470 3' 1.9 620 7.8 290 3.9 630 4' 3.0 810 14.3 380 2.6 670 5 (20% least deprived) 1.9 750 10.5 290 3.8 700
by urban/rural classification: Large urban areas 1.7 890 9.7 320 5.1 900 Other urban 3.2 910 10.0 420 2.6 890 Small accessible towns 1.2 310 10.8 140 2.7 300 Small remote towns 2.7 170 14.1 90 ** 110 Accessible rural 1.9 420 15.5 200 2.7 350 Remote rural 1.9 300 8.2 170 3.4 270
by frequency of driving†: Every day 2.5 1810 12.6 850 3.0 1,670 At least three times a week 1.6 650 8.0 260 3.4 560 Once or twice a week 1.7 250 12.1 110 5.5 250 Less often 2.7 100 ** 40 7.2 130 Never, but holds full driving licence 0.5 170 5.8 70 3.9 210
** value supressed as cell contains fewer than 5 responses
Table 48: Annual car mileage (those who own a car which they use for transport)
Following changes to the Scottish Household survey data for Table 48 is no longer collected. Please see TATIS 2015 for the most recently produced version of the table.
Member of a car club or formal
car sharing scheme
Attended a fuel efficient
driver training course
Sample size
(=100%)
Sample size
(=100%)
Sample size
(=100%)
1. Questions on car club membership and fuel efficient driver training are asked on a biennial basis. The data in the table refers to 2015. The data on cycle hire schemes refers to 2016.
47

2016I already own an electric car or van 0.3I am thinking about buying an electric car or van quite soon 1.0I would consider buying an electric car or van in the future 35.9I would not consider buying an electric car or van 48.7I don’t drive/don’t need a car 3.0No opinion 11.0Sample Size (=100%) 4,440
Table 50: [Sustainable travel] Reasons for having bought or would consider buying a plug-in electric car or van (2016) 1
2016Cost of vehicle purchase 23.1Fuel or running costs 63.7Battery: distance travelled on charge 19.4Availability or convienience of recharging 21.8Vehicle resale value 5.1Vehicle performance, size, practicallity or looks 13.3Availability of different models 4.8Environmentally friendly 67.8Reliability 15.8Opinion of friends and family 4.0Don't know 0.6Other 2.3Sample Size (=100%) 1,550
Table 51: [Sustainable travel] Reasons for not considering to buy a plug-in electric car or van (2016) 1
2016Limited choice (not many vehicles to choose from) 15.7Lack of knowledge about electric vehicles 27.3Running costs (maintenance and fuel) 6.4Cost of vehicle purchase 26.4Battery: distance travelled on charge 46.0Availability or convenience of charging points 45.5Vehicle resale value 5.5Vehicle performance, size, practicality or looks 15.1Technology - doesn't work or not proven 10.0Opinions of friends or family 2.0No intention to buy a car of any kind 7.8Other 4.8Don't know 1.4Sample Size (=100%) 2,270
Table 49: [Sustainable travel] Would you consider buying a plug-in electric car or van? (2016)
1. This question is asked of those in table 49 who own an electric car or van, are thinking of buying one or would consider one in the future.
1. This question is asked of those in table 49 who would not consider buying an electric car or van.
48

2007 2008 2009 2010 2011 2012 2013 2014 2015 2016cell percentages
All 80.4 78.5 76.6 73.9 73.2 73.4 75.6 76.9 76.6 75.0 9,640 Gender
male 82.4 80.4 77.8 76.5 75.5 74.5 77.2 78.6 78.4 75.9 4,400 female 78.6 76.7 75.4 71.5 71.2 72.4 74.2 75.2 74.9 74.1 5,240
Age16 - 19 84.6 77.9 75.4 75.5 76.4 77.7 76.4 80.0 82.2 79.3 250 20 - 29 87.5 83.2 80.0 77.8 74.3 76.2 79.8 80.5 79.3 77.4 1,100 30 - 39 85.1 79.8 81.2 80.0 77.5 77.3 78.2 79.7 80.2 78.3 1,370 40 - 49 82.3 83.1 79.4 80.1 78.8 78.5 79.7 82.2 82.3 77.8 1,510 50 - 59 82.5 81.3 79.9 75.1 76.3 74.8 79.9 78.7 76.4 77.4 1,620 60 - 69 77.3 75.3 76.6 70.6 69.8 72.3 74.4 75.6 75.4 75.5 1,700 70 - 79 66.4 68.8 64.8 63.4 64.0 64.3 63.6 68.0 67.5 65.4 1,370 80 and over 50.8 55.0 50.9 38.6 48.7 40.1 47.2 45.7 51.4 51.3 710
Sample size 8,820 9,150 9,300 8,590 9,240 9,890 9,920 9,800 9,410 9,640
2007 2008 2009 2010 2011 2012 2 2013 2014 2015 2016column percentages
Walking 22.0 22.2 21.8 22.0 22.1 26.0 23.3 25.0 21.6 23.5Driver car/van 50.2 49.8 51.0 51.1 49.9 48.3 50.0 48.1 50.7 50.6Passenger car/van 13.4 13.8 13.3 14.3 13.1 12.7 13.6 13.0 13.3 13.1Bicycle 0.7 1.0 0.9 0.8 1.3 1.2 1.0 1.4 1.2 1.2Bus 9.3 9.1 8.6 8.7 9.1 8.1 8.5 8.6 9.5 7.7Taxi/minicab 1.5 1.5 1.4 0.8 1.3 1.3 1.6 1.2 1.3 0.9Rail 1.7 1.6 1.9 1.4 2.0 1.8 1.7 2.1 1.7 2.2Other 1.1 1.0 1.0 1.0 1.2 0.7 0.3 0.6 0.7 0.7Sample size (=100%) 20,520 20,450 18,680 16,300 17,590 19,740 20,180 19,930 18,710 19,050 1 Where a journey involves more than one mode of transport (e.g. a bus, then a train), the main mode is defined as the one used for the longest (in distance) stage.2 The questionnaire was changed in 2012 and as a result more walking journeys are recorded so there is a break in the time series between 2011 and 2012.
Table TD2a: [Main mode by distance] Percentage of journeys by main mode by road network distance 1 2016
Walking Driver car/van
Passenger car/van
Bicycle Bus Taxi/ minicab Rail OtherSample size
All 23.5 50.7 13.1 1.2 7.7 0.9 2.2 0.8 19,050 by distance:
Under 1 km 64.6 25.7 5.9 1.2 1.6 0.5 0.1 0.4 4,110 1 to under 2km 40.6 39.7 10.4 2.5 4.9 1.4 . 0.4 2,740 2 to under 3km 27.2 47.6 11.1 1.9 8.8 2.0 0.2 1.2 1,810 3 to under 5km 12.1 52.2 16.3 1.5 14.7 1.0 0.9 1.3 2,180 5 to under 10km 4.6 61.4 15.2 1.0 13.9 1.3 1.9 0.6 2,780 10 to under 15km 1.9 69.3 16.2 0.7 8.6 0.7 2.3 0.3 1,550 15 to 20km 1.2 70.0 14.1 0.1 9.3 0.2 3.6 1.5 950 20 to 40km 1.0 68.5 16.7 0.5 5.4 0.4 7.3 0.2 1,730 40km and over 1.9 60.2 21.1 0.2 3.9 0.0 10.3 2.3 1,200
2007 2008 2009 2010 2011 2012 3 2013 2014 2015 3 2016column percentages
Walking 21.7 22.1 21.6 21.7 21.8 26.7 24.1 25.9 22.8 24.7Driver car/van 50 49.6 50.9 50.8 49.8 47.4 49.2 47.1 49.7 49.4Passenger car/van 13.5 13.8 13.3 14.3 13.1 12.7 13.5 12.8 13.1 12.8Bicycle 0.8 1.0 0.9 0.8 1.3 1.3 1.0 1..4 1.3 1.2Bus 9.5 9.1 8.7 8.8 9.3 8.1 8.5 8.7 9.4 7.7Taxi/minicab 1.5 1.6 1.4 1.0 1.4 1.3 1.6 1.3 1.4 1.0Rail 1.8 1.7 2.1 1.5 2.1 1.8 1.7 2.1 1.7 2.3Other 1.2 1.1 1.2 1.2 1.3 0.7 0.4 0.7 0.8 0.9Sample size (=100%) 20,730 20,640 18,930 16,550 17,810 20,310 20,780 20,500 19,110 19,720
2007 2008 2009 2010 2011 2012 1 2013 2014 2015 2016column percentages
Commuting 23.6 24.2 23.8 26.5 25.8 23.4 22.5 23.0 22.4 23.4Business 1.5 1.2 1.2 0.9 0.7 1.9 2.5 2.3 2.2 1.9Education 3.4 3.1 3.7 3.5 3.6 6.2 6.5 6.6 6.8 6.6Shopping 23.4 22.8 23.1 23.3 21.1 23.1 23.1 22.6 23.8 23.4Visit Hospital or other health 2.6 2.4 2.5 2.5 2.3 2.2 2.0 2.0 2.1 2.1Other personal business 6.9 6.2 6.9 6.4 6.9 3.4 4.3 3.4 4.4 4.3Visiting friends or relatives 10.9 12 11.2 10.8 11.9 11.3 12.1 10.6 11.3 10.9Eating/Drinking 4.8 4.3 4.1 3.7 4.1 2.8 3.2 3.0 3.6 3.3Sport/Entertainment 7.1 7.3 7.9 6.8 7.6 5.3 5.4 5.5 6.1 4.1Holiday/daytrip 1.7 2 2.3 1.9 1.8 0.9 1.0 1.1 1.3 1.1Other Journey 0.2 0.1 0.5 0.4 0.3 4.8 3.0 4.9 1.5 2.4Escort 8 7.5 6.7 7.3 7.5 1.2 1.6 1.6 1.9 1.6Go Home 2.6 3.2 3.2 2.7 3.4 8.0 7.3 6.9 7.8 7.0Go for a walk 3.6 3.7 2.9 3.2 3 5.9 5.7 6.3 4.8 6.1Sample size (=100%) 20,520 20,450 18,680 16,300 17,590 19,740 20,180 19,930 18,710 19,050 1 Changes to the questionnaire design in 2012 resulted in a higher proportion of journeys being recorded as 'Go home'. This creates a discontinuity in the time series between 2011 and 2012.
2016 sample size
Table TD2b: [Stage mode] Percentage of stages 1 by mode of travel 2007-2016
1 A stage is defined as a part of a journey involving one form of transport. A journey will have one or more stages (e.g. a bus then a train) counts as one bus stage and one train stage. Short walks between modes of transport are not included.
row percentages
Main Mode of Transport
Table TD1: [Travel on previous day] Percentage of adults travelling on previous day 2007-2016
Table TD2: [Main mode] Percentage of journeys made by main mode 1 of travel 2007-2016 2
3 Previously, 2015 data in the 'other' category did not include tram journeys. The data has now been revised to include tram journeys, changing this value from 0.7 to 0.8.
Table TD3: [Purpose] Percentage of journeys made by purpose of travel 2007-2016
2 The questionnaire was changed in 2012 and as a result more walking journeys are recorded so there is a break in the time series between 2011 and 2012.
1. Straight line distance tables are available in online annex A. More details on the differences between the straight line and road network distance can be found in TATIS Appendix A.
49

Table TD2c: [Multi stage journeys] Percentage of journeys by number of stages 2012-2016 1
Sample size
1 2 3 4 5 (=100%)Row percentages
All journeys 97.7 1.7 0.5 0.0 0.0 97,610 1.03Survey year
2012 97.6 1.8 0.5 0.0 0.0 19,740 1.032013 97.7 1.7 0.5 0.0 ** 20,180 1.032014 97.7 1.8 0.5 0.0 ** 19,930 1.032015 98.2 1.3 0.5 0.0 . 18,710 1.022016 97.3 2.0 0.6 0.0 0.0 19,050 1.03
Main Mode of TransportWalking 99.3 0.6 0.1 ** . 24,130 1.01Driver car/van 99.4 0.6 0.1 ** ** 48,870 1.01Passenger car/van 98.8 1.1 0.1 ** ** 12,050 1.01Motorcycle/moped 96.2 ** . ** . 110 1.05Bicycle 98.9 1.0 ** . . 1,110 1.01School Bus 95.4 2.1 ** . . 120 1.07Works Bus 88.7 9.8 ** ** . 210 1.13Service Bus 92.0 6.4 1.5 0.1 ** 7,780 1.10Taxi/minicab 96.8 2.3 0.7 ** . 1,270 1.04Rail 56.5 27.0 14.9 1.1 0.4 1,500 1.62Underground 84.7 6.4 8.9 . . 100 1.24Ferry 46.6 28.2 20.5 4.4 ** 50 1.83Aeroplane 52.4 9.9 29.4 ** ** 70 1.95Other 86.8 13.2 ** . . 230 1.13
** value supressed as cell contains fewer than 5 responses . .
Number of stages in journeyAverage (mean)
number of stages
50

2012 2013 2014 2015 2016column percentages
Under 1 km 24.2 16.3 17.2 19.1 19.71 to under 2km 13.7 15.0 14.7 12.8 13.62 to under 3km 8.8 9.6 9.6 9.8 9.63 to under 5km 12.4 13.3 13.1 13.0 12.25 to under 10km 14.6 16.4 16.8 16.6 15.510 to under 15km 8.4 9.4 8.7 8.4 8.115 to 20km 4.2 5.0 4.9 4.7 4.820 to 40km 8.4 8.9 9.5 9.1 9.940km and over 5.4 6.2 5.4 6.6 6.7Sample size (=100%) 19,290 20,180 19,930 18,490 19,050
2. Note that 1km = 0.6 miles
10 to under15km
All 19.7 13.6 9.6 12.2 15.5 8.1 4.8 9.9 6.7 19,050 by mainmode:
Walking 54.2 23.5 11.1 6.3 3.1 0.6 0.2 0.4 0.5 4,690 Driver car 9.8 10.7 9.0 12.6 19.0 11.0 6.6 13.5 7.8 140 Driver van 15.1 7.9 8.5 12.6 14.8 10.4 7.0 11.5 12.3 220 Passenger car 8.5 10.9 8.4 15.5 17.7 10.1 5.0 12.8 11.0 1,470 Passenger van 21.3 8.6 . ** 30.7 8.3 9.2 7.9 7.2 220 Bicycle 19.9 27.6 15.0 14.6 12.5 4.8 0.3 ** ** 340 Bus 4.1 8.6 10.9 23.2 28.1 9.0 5.8 6.9 3.4 9,290 Taxi/minicab 10.7 21.3 20.5 13.9 22.2 6.0 1.0 ** ** 390 Rail ** . 0.7 5.1 13.3 8.4 7.8 32.7 31.4 2,240 Other 9.4 6.9 15.2 20.1 ** 2.8 9.2 2.9 20.3 60
** value suppressed as cell contains fewer than 5 responses
Table TD5: [Distance] Distance1 summary statistics 2012-2016 2
2012 3 2013 2014 2015 2016Kilometres
Lower Decile 0.2 0.7 0.6 0.4 0.4Lower Quartile 1.0 1.5 1.5 1.4 1.4Median 3.4 4.2 4.2 4.1 4.0Upper Quartile 10.7 11.9 11.8 12.1 12.5Upper Decile 26.1 27.6 26.9 29.0 29.1Mean 10.5 11.6 11.4 16.7 19.8Sample size 19,290 20,180 19,930 18,490 19,050
2. Note that 1km = 0.6 miles3. The questionnaire was changed in 2012 and as a result more walking journeys are recorded so there is a break in the time series between 2011 and 2012
Table TD5a: [Distance] Distance summary statistics by mode of transport, 2016
Walking Driver car/van
Passenger car/van
Bicycle Bus Taxi/ minicab Rail Other All modes
KilometresLower Decile 0.0 1.0 1.1 0.0 1.8 0.9 5.9 1.2 0.4Lower Quartile 0.4 2.5 2.6 1.3 3.1 1.7 13.6 2.2 1.4Median 0.9 6.6 6.1 2.2 5.3 2.8 25.0 4.7 4.0Upper Quartile 1.8 17.1 18.4 4.4 10.1 6.0 51.0 19.9 12.5Upper Decile 3.2 34.5 41.2 10.3 20.7 10.2 92.4 95.3 29.1Mean 3.8 22.8 28.7 7.6 19.3 4.9 62.3 80.9 19.8Sample size 4,690 9680 2300 220 1,470 220 340 140 19,050 1. Distances are calculated using the road network distance. A version of this table using the straight line distance is included in Annex A of theweb tables. More details on the differences between the straight line and road network distance can be found in TATIS Appendix A.
Under 1 km
Row percentages
1. Distances are calculated using the road network distance. A version of this table using the straight line distance is included in Annex A of the web tables. More details on the differences between the straight line and road network distance can be found in TATIS Appendix A.
1.A version of this table using the straight line distance is included in Annex A of the web tables. More details on the differences between the straight line and road network distance can be found in TATIS Appendix A.
3 to under 5km
40km and over
Main Mode of Transport
1 to under 2km
2 to under 3km
1.A version of this table using the straight line distance is included in Annex A of the web tables. More details on the differences between the straight line anroad network distance can be found in TATIS Appendix A.
Table TD4a: [Distance by main mode] Percentage of journeys by road network distance1 by main mode, 2016Sample size
Table TD4: [Distance] Percentage of journeys made by road distance distance1 travelled, 2007-2016 2
5 to under 10km
15 to 20km 20 to 40km
51

2007 2008 2009 2010 2011 2012 1 2013 2014 2015 2 2016column percentages
Less than 5 min 6.2 6.9 6.3 5.5 5.1 4.5 4.1 3.7 3.9 4.15 to 10 min 39.6 39.4 38.4 36.4 37.7 40.1 38.3 38.1 38.4 37.111 to 20 min 26.6 26.9 25.9 26.9 26.4 26.9 28.1 28.3 28.0 27.421 to 30 min 12.5 12.4 12.8 13.5 14.2 13.4 14.2 13.9 13.2 14.431 to 60 min 10.5 10 10.8 11.5 11.1 10.8 10.9 11.8 11.9 12.261 to 120 min 3.3 3.1 3.7 4.1 3.7 3 3.1 3.0 3.5 3.4121 to 179 min 0.4 0.4 0.6 0.7 0.6 0.4 0.4 0.4 0.4 0.6180 min and over 0.8 0.9 1.5 1.4 1.2 0.9 0.8 0.8 0.7 0.8Sample size (=100%) 20,520 20,450 18,680 16,300 17,590 19,740 20,180 19,930 18,710 19,050 1 The questionnaire was changed in 2012 and as a result more walking journeys are recorded so there is a break in the time series between 2011 and 2012
2 Data published in 2015 contained an error; this table contains the revised data.
2015 published
2015 revised
Less than 5 min 3.9 3.9
5 to 10 min 31.4 38.4
11 to 20 min 29.3 28.0
21 to 30 min 15.7 13.231 to 60 min 13.1 11.961 to 120 min 4.4 3.5
121 to 179 min 0.9 0.4180 min and over 2.1 0.7
2007 2008 2009 2010 2011 2012 2013 2014 2015 2016Weekdays column percentages
Before 7am 4.8 4.2 4.2 4.2 4.0 3.7 3.9 3.7 4.2 3.87am to 9:30am 18.2 18.9 20.2 19.9 20.5 18.8 19.3 19.5 19.5 19.4After 9:30am to before 12noon 13.6 13.1 13.6 13.3 12.7 13.1 12.6 13.2 13.1 13.112noon to 2 pm 15.5 14.9 15.2 15.5 14.6 15.2 15.1 14.8 15.5 14.5After 2pm to before 4:30pm 16.5 16.4 15.9 15.8 16.5 17.9 17.4 17.1 17.7 17.34:30pm to before 6:30pm 15.3 15.6 15.4 15.8 16.3 16.6 16.6 16.3 15.4 16.36:30pm onwards 16.1 17.0 15.7 15.5 15.3 14.8 15.2 15.5 14.7 15.7
Sample size (=100%) 16,210 16,070 15,000 12,830 13,940 15,410 15,890 15,550 14,640 15,050
Weekends
Before 9:30am 1 11.0 9.7 9.9 9.8 10.3 9.8 8.4 8.9 7.7 9.29:30am to before 12noon 19.0 17.4 19.4 20.4 19.1 18.5 18.5 20.4 19.4 19.912noon to 2 pm 21.8 22.9 23.2 22.7 23.9 23.6 24.7 25.1 24.9 24.2After 2pm to before 4:30pm 16.5 18.1 16.9 18.2 18.1 18.4 19.1 18.9 18.5 19.64:30pm to before 6:30pm 14.4 13.3 15.0 14.2 13.5 14.1 13.6 13.4 14.1 13.46:30pm onwards 17.3 18.7 15.8 14.7 15.1 15.7 15.8 13.4 15.4 13.8
Sample size (=100%) 4,310 4,380 3,680 3,470 3,650 4,330 4,290 4,380 4,070 4,000 1 Before 7am combined with 7am to 9:30am for weekends due to small sample sizes
2007 2008 2009 2010 2011 2012 2013 2014 2015 2016column percentages
Monday 14.1 14.1 14 13.9 14.9 14.6 14.0 14.1 14.6 14.2Tuesday 14.9 14.5 14.5 14.9 15.2 15.7 15.3 14.7 14.4 15.0Wednesday 15.3 14.8 14.9 14.8 14.6 15.5 15.1 15.1 14.8 15.3Thursday 15.4 14 14.8 15.2 15.3 15.3 15.9 15.4 15.0 15.3Friday 14.8 15.9 14.3 15.9 15.5 15.1 15.2 16.5 15.7 15.3Saturday 13.3 14.8 13.9 13.2 12.8 12.5 12.6 12.7 13.9 12.9Sunday 12.2 11.7 13.7 12 11.7 11.4 11.9 11.6 11.6 12.0Sample size (=100%) 20,520 20,450 18,680 16,300 17,590 19,740 20,180 19,930 18,710 19,050
Table TD8: [Travel Day] Percentage of journeys made by day of travel, 2007-2016
Table TD6: [Duration] Percentage of journeys made by duration of journey, 2007-2016
Table TD7: [Start time] Percentage of journeys made by start time of journey, 2007-2016
52

2007 2008 2009 2010 2011 2012 2013 2014 2015 2016column percentages
One 61.5 60.2 60.5 61.5 63.4 64.0 65.3 64.5 64.7 66.4Two 26.3 27.1 25.8 25.8 25.6 25.4 23.6 24.7 25.0 23.6Three 7.3 7.4 8.3 8.1 6.8 6.9 7.1 6.9 6.7 6.2Four 3.7 3.9 4.3 3.2 3.4 2.8 3.0 3.0 3.0 3.0Five or More 1.2 1.4 1.1 1.3 0.9 0.9 1.1 0.8 0.5 0.8
peopleAverage occupancy 1.57 1.59 1.6 1.57 1.53 1.51 1.51 1.51 1.50 1.48
Sample size (=100%) 10,370 10,330 9,660 8,330 8,880 9,830 10,200 9,820 9,320 9,400
2 Based on drivers who responded to the question on car occupancy. Respondents asked for all car stages.
Table TD10: [Congestion] Percentage of car / van stages 1 delayed by traffic congestion, 2007-2016
2007 2008 2009 2010 2011 2012 2013 2014 2015 2 2016Driver congestion 14.4 13.1 11.0 10.5 11.2 9.9 9.7 11.7 12.4 11.7Sample size (=100%) 9,260 9,320 8,680 7,580 8,310 9,830 10,200 9,820 9,690 9,790
2 Data published in 2015 erroneously included a value of 12.5 because of the exclusion of vans; this table contains the revised data.
2012 2013 2014 2015 2016
72.8 80.0 82.0 76.2 79.225.8 17.9 18.9 27.7 29.3
1.1 1.6 1.7 1.5 1.80.7 ** 0.5 0.7 **3.1 2.6 2.0 2.1 1.51.3 ** ** ** **1.4 1.6 1.5 1.0 0.52.8 3.2 1.0 1.1 1.60.4 ** ** ** 0.8
Sample size (=100%) 810 780 930 1,020 930
Table TD11: [Bus Delays] Percentage of bus stages 1 where passenger experienced delay, 2007-2016
2007 2008 2009 2010 2011 2012 2013 2014 2015 2016Service Bus 12.5 14.4 9.9 12.4 10.5 11.1 10.2 10.7 9.9 10.0Sample size (=100%) 1,670 1,720 1,460 1,310 1,440 1,540 1,690 1,630 1,690 1,480 1 A journey can consist of one or more stages. A new stage is defined when there is a change in the form of transport or when there is a change of vehicle requiring a separate
Traffic lights / signals not
1 Respondents can provide more than one reason so percentages will not add up to 100%** Less than 1% and supressed as based on fewer than 5 responses
Table TD10a: [Congestion - reason] Reason for congestion for car / van stages, 2012-2016 1
Lane blocked by parked Bad weatherOtherDon't know
Road or maintenance Road accidentBroken down car
Table TD9: [Car Occupancy] Percentage of car stages 1 by car occupancy, 2007-2016 2
1 A journey can consist of one or more stages. A new stage is defined when there is a change in the form of transport or when there is a change of vehicle requiring a separate ticket.
1 A journey can consist of one or more stages. A new stage is defined when there is a change in the form of transport or when there is a change of vehicle requiring a separate ticket.
Volume of traffic
53

Not delayed 0-2 minutes about 5 mins
about 10 mins
about 15 mins
20 to 30 mins
over 30 Delayed
All driver stages 88.3 0.7 3.8 3.6 1.3 1.6 0.6 11.7 9,790
by purpose of journey:Commuting 79.0 0.7 4.4 7.6 3.4 3.8 1.1 21.0 2,610 Business 82.0 . 4.2 6.1 0.6 2.0 2.9 18.0 290 Education 87.8 1.5 5.6 4.3 ** ** . 12.2 480 Shopping 95.1 0.4 2.6 1.2 0.4 ** . 4.9 2,200 Visit hospital/other health 82.5 ** 10.6 ** . ** . 17.5 220 Other personal business 93.3 ** 1.8 1.6 ** ** ** 6.7 510 Visiting friends/relatives 93.7 0.6 2.9 1.8 0.4 0.4 ** 6.3 1,140 Eating/drinking 94.2 . 5.0 ** . . . 5.8 180 Entertainment 91.2 ** ** ** ** ** . 8.8 120 Sport 93.3 1.8 3.6 ** . 0.3 . 6.7 460 Holiday/day trip 89.8 . ** ** . ** ** 10.2 130 Other 88.4 . 5.9 3.5 . ** ** 11.6 260 Escort 90.9 ** 4.6 ** ** . ** 9.1 240 Go home 89.4 ** 3.8 2.6 0.7 1.5 1.1 10.6 770 Just go for a walk 95.7 ** ** ** ** . . 4.3 170
by day of the week:Monday 87.3 0.4 4.5 4.0 1.7 1.4 0.3 12.7 1,910 Tuesday 86.6 1.1 3.6 4.1 1.8 2.1 0.5 13.4 1,740 Wednesday 85.5 0.4 5.2 3.9 1.5 2.7 0.7 14.5 1,760 Thursday 86.1 0.6 4.4 4.2 1.3 2.5 0.9 13.9 1,310 Friday 85.8 1.1 3.5 5.4 1.7 1.4 1.2 14.2 1,170 Saturday 94.2 ** 2.4 1.5 0.7 ** ** 5.8 760 Sunday 95.2 0.5 2.2 1.5 ** 0.2 ** 4.8 1,150
Weekday journeys - by start time:Before 7 a.m. 86.0 . 2.4 4.0 2.7 3.5 1.5 14.0 320 7:00 to 7:59 a.m. 78.5 ** 3.3 8.6 3.1 4.2 ** 21.5 510 8:00 to 8:59 a.m. 78.4 1.5 4.9 9.1 2.4 2.8 0.9 21.6 700 9:00 to 9:59 a.m. 88.8 ** 7.2 2.0 ** ** . 11.2 460 10:00 to 10:59 a.m. 92.3 2.0 2.8 ** . ** ** 7.7 460 11:00 to 11:59 a.m. 94.9 ** 2.2 ** ** ** ** 5.1 530 noon to 12:59 p.m. 93.5 ** 2.9 1.7 . . ** 6.5 510 1:00 to 1:59pm 90.3 ** 3.6 4.0 ** ** . 9.7 450 2:00 to 2:59pm 91.3 ** 3.8 3.5 ** ** ** 8.7 560 3:00 to 3:59pm 85.9 ** 5.6 3.3 1.4 2.6 ** 14.1 610 4:00 to 4:59pm 75.1 ** 9.0 5.5 3.1 4.6 2.3 24.9 740 5:00 to 5:59pm 73.5 1.4 6.4 10.1 3.5 4.5 ** 26.5 690 6:00 to 6:59pm 87.6 1.5 3.9 2.9 2.1 1.3 ** 12.4 470 7:00 to 7:59pm 97.9 ** ** ** ** ** . 2.1 330 8:00 to 8:59pm 98.8 . ** ** . . . 1.2 220 9:00 to 9:59pm 99.3 . ** . . . . 0.7 170 After 10pm 97.9 . ** . ** ** . 2.1 170
Weekend journeys - by start time:Before 9:30am 97.1 . ** ** . . . 2.9 190 9:30am to before 12noon 95.8 ** 2.4 ** . ** . 4.2 400 12noon to 2 pm 93.6 ** 2.1 2.6 ** ** . 6.4 480 After 2pm to before 4:30pm 91.9 . 4.1 2.1 ** ** ** 8.1 360 4:30pm to before 6:30pm 93.4 ** ** ** ** ** ** 6.6 250 6:30pm onwards 98.6 . ** ** . . . 1.4 240
by urban/rural classification:Large urban areas 84.8 1.1 4.4 5.2 1.4 2.0 0.9 15.2 2,230 Other urban areas 87.8 0.7 4.0 3.9 1.6 1.4 0.5 12.2 3,190 "Accessible" small towns 89.1 0.7 2.8 3.1 1.5 2.3 ** 10.9 930 "Remote" small towns 97.8 ** 0.7 ** ** ** . 2.2 690 "Accessible" rural areas 88.1 0.3 4.7 2.8 1.3 2.2 0.5 11.9 1,420 "Remote" rural areas 96.2 ** 1.8 1.0 . ** ** 3.8 1,340
1 A journey can consist of one or more stages. A new stage is defined when there is a change in the form of transport or when there is a change of vehicle requiring a separate ticket.
2 Car drivers were asked "was this part of your trip delayed due to traffic congestion?". No definition of "traffic congestion" is given, so respondents can interpret the term as they wish. Those drivers who said that they had been delayed by traffic congestion were asked "how much time do you think was lost due to traffic congestion?".
Table TD12: [Congestion delays] Percentage of driver stages 1 where congestion delays were experienced by amount of time delayed, 2016 2
Sample size (=100%)
** Cell values supressed as percentage figure based on less than 5 responses
54

Table TD13: [Council travel - destination] ]Percentage of journeys originating in each council area by destination council area, 2012-2016
Sa
mp
le s
ize
(=
100%
)
Journey Origin (Council Area)Highland / Islands 96.9 1.3 0.2 ** 0.1 0.2 ** 0.2 0.1 0.2 . ** ** ** 0.6 11,400 Grampian 0.6 97.5 1.0 ** ** 0.1 ** 0.1 ** ** ** ** 0.0 ** 0.4 9,350 Tayside 0.2 1.3 92.3 0.8 2.9 0.6 0.3 0.4 0.1 0.2 ** 0.1 ** 0.2 0.6 7,970 Central ** ** 1.2 86.4 1.6 2.0 2.3 2.2 1.1 0.3 1.5 0.5 0.2 0.2 0.5 7,420 Fife ** ** 4.0 1.4 88.5 3.1 1.1 0.4 0.1 0.2 0.2 ** 0.1 0.1 0.7 4,690 Edinburgh 0.1 0.1 0.5 1.0 1.7 83.3 9.7 0.7 0.2 0.3 0.3 0.3 0.2 0.8 0.8 8,040 Lothians . ** 0.4 2.0 1.0 15.2 77.0 0.7 0.1 0.2 1.1 0.6 0.1 0.9 0.6 6,800 Glasgow 0.1 ** 0.2 0.9 0.3 0.7 0.4 71.9 6.0 7.8 4.2 5.0 2.0 0.1 0.3 9,250 Dunbartonshire / Argyll & Bute 0.1 ** 0.2 1.4 0.1 0.4 0.2 14.1 76.5 3.2 1.9 0.7 0.4 0.1 0.5 6,830 Renfrewshire / Inverclyde 0.1 ** 0.3 0.3 0.2 0.6 0.3 15.3 2.7 73.5 0.9 1.8 3.3 ** 0.7 6,920 North Lanarkshire ** . 0.1 1.8 0.3 0.7 1.4 9.4 2.0 1.2 74.0 8.0 0.2 0.2 0.7 3,510 South Lanarkshire ** ** 0.2 0.5 ** 0.5 0.9 12.5 0.6 2.4 8.6 72.0 0.7 0.4 0.6 3,360 Ayrshire ** ** ** 0.1 0.1 0.2 0.1 3.8 0.4 3.2 0.3 0.6 89.9 0.6 0.5 6,440 Borders / Dumfries & Galloway ** ** 0.3 0.1 0.1 1.8 1.1 0.4 0.1 ** 0.1 0.5 0.6 92.5 2.2 4,810 Not Known 4.9 6.0 8.9 4.6 6.6 10.5 6.7 6.7 4.3 5.4 2.9 3.7 3.7 12.8 12.2 820 All journeys reported 11,410 9,360 8,000 7,440 4,680 8,060 6,840 9,300 6,850 6,930 3,510 3,370 6,450 4,820 590 97,610
** denotes cells with values supressed as they contain fewer than 5 respondents.
Table TD14: [Council travel - origin] Percentage of journeys ending in each council area by area of origin, 2012-2016
Sample size (=100%)
Journey Destination (Council Area)
Highland / Islands 97.1 1.3 0.2 ** ** 0.1 . 0.2 0.1 0.1 ** ** ** ** 0.8 11,410 Grampian 0.7 97.4 1.0 ** ** 0.1 ** ** ** ** . ** ** ** 0.5 9,360 Tayside 0.2 1.4 91.8 0.8 3.0 0.6 0.3 0.3 0.1 0.2 0.1 ** ** 0.1 1.0 8,000 Central ** ** 1.3 86.2 1.6 2.0 2.4 1.9 1.2 0.3 1.6 0.5 0.1 0.1 0.8 7,440 Fife 0.1 ** 3.9 1.3 88.6 2.7 1.1 0.5 0.1 0.2 0.3 ** 0.1 0.1 1.0 4,680 Edinburgh 0.1 0.2 0.5 1.0 1.9 83.1 9.6 0.7 0.2 0.3 0.3 0.2 0.1 0.8 0.9 8,060 Lothians ** ** 0.4 1.9 1.0 15.3 76.6 0.7 0.2 0.3 1.0 0.6 0.1 0.8 1.0 6,840 Glasgow 0.1 0.1 0.3 1.1 0.2 0.7 0.4 71.6 6.0 7.8 4.0 5.1 1.9 0.2 0.6 9,300 Dunbartonshire / Argyll & Bute 0.1 ** 0.2 1.3 0.1 0.4 0.2 14.1 76.4 3.2 2.0 0.5 0.5 0.1 0.8 6,850 Renfrewshire / Inverclyde 0.2 ** 0.3 0.3 0.2 0.6 0.3 15.2 2.6 73.3 1.0 1.9 3.2 ** 0.9 6,930 North Lanarkshire . ** ** 1.6 0.3 0.6 1.5 9.7 1.9 1.1 73.9 8.1 0.4 0.1 0.6 3,510 South Lanarkshire ** ** 0.3 0.6 ** 0.7 0.9 12.2 0.7 2.3 8.4 71.9 0.7 0.5 0.8 3,370 Ayrshire ** 0.1 ** 0.2 0.1 0.3 0.1 3.9 0.4 3.3 0.2 0.6 89.8 0.5 0.6 6,450 Borders / Dumfries & Galloway ** ** 0.3 0.2 0.1 1.7 1.2 0.3 0.1 ** 0.2 0.4 0.7 92.3 2.5 4,820 Not Known 5.0 6.0 6.6 3.7 6.0 11.1 5.6 5.1 3.5 5.2 4.4 3.5 4.3 14.7 15.4 590 All journeys reported 11,400 9,350 7,970 7,420 4,690 8,040 6,800 9,250 6,830 6,920 3,510 3,360 6,440 4,810 820 97,610
Re
nfr
ew
sh
ire
/ In
ve
rcly
de
For example, the percentage of journeys starting in Fife which end in Edinburgh can be found by locating the row labelled Fife beneath Journey Origin and looking across to the figure appearing in the vertical column labelled Edinburgh. In this case 3% of journeys starting in Fife end in Edinburgh
** denotes cells with values supressed as they contain fewer than 5 respondents.
Gla
sg
ow
council area of destination
Hig
hla
nd
/ Is
lan
ds
Gra
mp
ian
Ta
ys
ide
Bo
rde
rs /
Du
mfr
ies
&
Ga
llow
ay
Du
nb
art
on
sh
ire
/ A
rgy
ll &
Bu
te
Fif
e
Ay
rsh
ire
Ed
inb
urg
h
So
uth
La
na
rks
hir
e
Lo
thia
ns
No
t K
no
wn
For example, the percentage of journeys ending in Fife that started in Edinburgh can be found by locating the horizontal row labelled Fife beneath Journey Destination and looking across to the figure appearing in the vertical column labelled Edinburgh. In this case 2% of journeys ending in Fife originated in Edinburgh.
Du
nb
art
on
sh
ire
/ A
rgy
ll &
Bu
te
Re
nfr
ew
sh
ire
/ In
ve
rcly
de
No
rth
La
na
rks
hir
e
So
uth
La
na
rks
hir
e
Row percentages
Ce
ntr
al
Gla
sg
ow
Ay
rsh
ire
Bo
rde
rs /
Du
mfr
ies
&
Ga
llow
ay
Ed
inb
urg
h
Fif
e
This table can be used to establish the percentage of journeys starting in a given council area that end in that and other council areas.
Lo
thia
ns
No
rth
La
na
rks
hir
e
Note: In publications prior to 2011 this table has been orientated the opposite way to the above - with the origin council area forming the rows and the destination council area forming the columns.
council area of origin
Hig
hla
nd
/ Is
lan
ds
Gra
mp
ian
Ta
ys
ide
Ce
ntr
al
No
t K
no
wn
Row percentages
This table can be used to establish the percentage of journeys ending in a given council area that originated in that and other council areas.
55
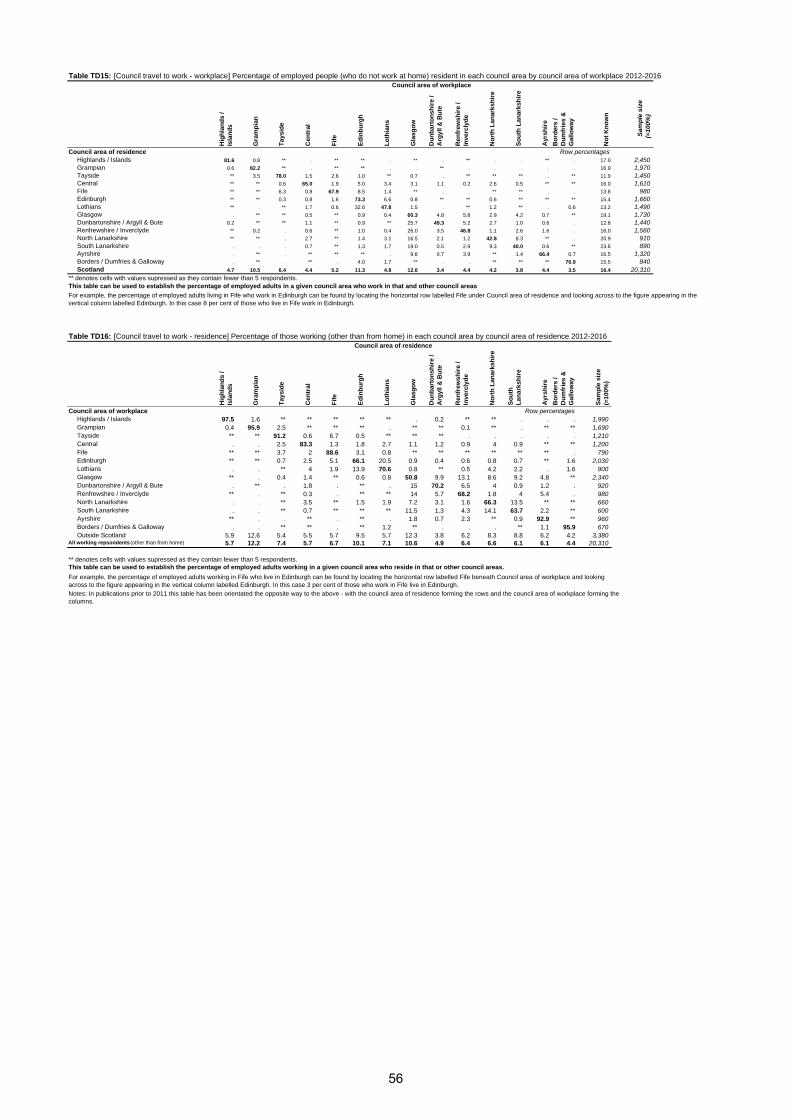
Table TD15: [Council travel to work - workplace] Percentage of employed people (who do not work at home) resident in each council area by council area of workplace 2012-2016
Sam
ple
siz
e (=
100%
)
Council area of residence Row percentagesHighlands / Islands 81.6 0.8 ** . ** ** . ** . ** . . ** . 17.0 2,450 Grampian 0.6 82.2 ** . ** ** . . ** . . . . . 16.9 1,970 Tayside ** 3.5 78.0 1.5 2.6 1.0 ** 0.7 . ** ** ** . ** 11.9 1,450 Central ** ** 0.6 65.0 1.9 5.0 3.4 3.1 1.1 0.2 2.6 0.5 ** ** 16.0 1,610 Fife ** ** 6.3 0.8 67.9 8.5 1.4 ** . . ** ** . . 13.8 980 Edinburgh ** ** 0.3 0.8 1.6 73.3 6.6 0.8 ** ** 0.6 ** ** ** 15.4 1,660 Lothians ** . ** 1.7 0.6 32.6 47.8 1.5 . ** 1.2 ** . 0.6 13.2 1,490 Glasgow . ** ** 0.5 ** 0.9 0.4 60.3 4.8 5.8 2.9 4.2 0.7 ** 19.1 1,730 Dunbartonshire / Argyll & Bute 0.2 ** ** 1.1 ** 0.9 ** 25.7 49.3 5.2 2.7 1.0 0.6 . 12.8 1,440 Renfrewshire / Inverclyde ** 0.2 . 0.6 ** 1.0 0.4 26.0 3.5 46.8 1.1 2.6 1.6 . 16.0 1,560 North Lanarkshire ** ** . 2.7 ** 1.4 3.1 16.5 2.1 1.2 42.8 8.3 ** . 20.9 910 South Lanarkshire . . . 0.7 ** 1.3 1.7 19.0 0.5 2.9 9.3 40.0 0.6 ** 23.6 890 Ayrshire . ** . ** ** ** . 9.8 0.7 3.9 ** 1.4 66.4 0.7 16.5 1,320 Borders / Dumfries & Galloway . ** . ** . 4.0 1.7 ** . . ** ** ** 76.9 15.5 840 Scotland 4.7 10.5 6.4 4.4 5.2 11.3 4.8 12.6 3.4 4.4 4.2 3.8 4.4 3.5 16.4 20,310
** denotes cells with values supressed as they contain fewer than 5 respondents.
Table TD16: [Council travel to work - residence] Percentage of those working (other than from home) in each council area by council area of residence 2012-2016
Council area of workplace Row percentagesHighlands / Islands 97.5 1.6 ** ** ** ** ** . 0.2 ** ** . . . 1,990 Grampian 0.4 95.9 2.5 ** ** ** . ** ** 0.1 ** . ** ** 1,690 Tayside ** ** 91.2 0.6 6.7 0.5 ** ** ** . . . . . 1,210 Central . . 2.5 83.3 1.3 1.8 2.7 1.1 1.2 0.9 4 0.9 ** ** 1,200 Fife ** ** 3.7 2 88.6 3.1 0.8 ** ** ** ** ** ** . 790 Edinburgh ** ** 0.7 2.5 5.1 66.1 20.5 0.9 0.4 0.6 0.8 0.7 ** 1.6 2,030 Lothians . . ** 4 1.9 13.9 70.6 0.8 ** 0.5 4.2 2.2 . 1.6 900 Glasgow ** . 0.4 1.4 ** 0.6 0.8 50.8 9.9 13.1 8.6 9.2 4.8 ** 2,340 Dunbartonshire / Argyll & Bute . ** . 1.8 . ** . 15 70.2 6.5 4 0.9 1.2 . 920 Renfrewshire / Inverclyde ** . ** 0.3 . ** ** 14 5.7 68.2 1.8 4 5.4 . 980 North Lanarkshire . . ** 3.5 ** 1.5 1.9 7.2 3.1 1.6 66.3 13.5 ** ** 660 South Lanarkshire . . ** 0.7 ** ** ** 11.5 1.3 4.3 14.1 63.7 2.2 ** 600 Ayrshire ** . . ** . ** . 1.8 0.7 2.3 ** 0.9 92.9 ** 960 Borders / Dumfries & Galloway . . ** ** . ** 1.2 ** . . . ** 1.1 95.9 670 Outside Scotland 5.9 12.6 5.4 5.5 5.7 9.5 5.7 12.3 3.8 6.2 8.3 8.8 6.2 4.2 3,380
All working repsondents (other than from home) 5.7 12.2 7.4 5.7 6.7 10.1 7.1 10.6 4.9 6.4 6.6 6.1 6.1 4.4 20,310
Cen
tral
Tay
sid
e
** denotes cells with values supressed as they contain fewer than 5 respondents.This table can be used to establish the percentage of employed adults working in a given council area who reside in that or other council areas.
For example, the percentage of employed adults working in Fife who live in Edinburgh can be found by locating the horizontal row labelled Fife beneath Council area of workplace and looking across to the figure appearing in the vertical column labelled Edinburgh. In this case 3 per cent of those who work in Fife live in Edinburgh.Notes: In publications prior to 2011 this table has been orientated the opposite way to the above - with the council area of residence forming the rows and the council area of workplace forming the columns.
Council area of residence
So
uth
L
anar
ksh
ire
Ayr
shir
e
Bo
rder
s /
Du
mfr
ies
&
Gal
low
ay
Sam
ple
siz
e (=
100%
)
Gla
sgo
w
Lo
thia
ns
Gla
sgo
w
This table can be used to establish the percentage of employed adults in a given council area who work in that and other council areas
For example, the percentage of employed adults living in Fife who work in Edinburgh can be found by locating the horizontal row labelled Fife under Council area of residence and looking across to the figure appearing in the vertical column labelled Edinburgh. In this case 8 per cent of those who live in Fife work in Edinburgh.
Hig
hla
nd
s /
Isla
nd
s
Gra
mp
ian
Ed
inb
urg
h
Fif
e
Ed
inb
urg
h
Du
nb
arto
nsh
ire
/ A
rgyl
l & B
ute
Ren
frew
shir
e /
Inve
rcly
de
No
rth
Lan
arks
hir
e
Du
nb
arto
nsh
ire
/ A
rgyl
l & B
ute
Ren
frew
shir
e /
Inve
rcly
de
No
rth
Lan
arks
hir
e
Lo
thia
ns
No
t K
no
wn
So
uth
Lan
arks
hir
e
Ayr
shir
e
Bo
rder
s /
Du
mfr
ies
&
Gal
low
ay
Council area of workplace
Hig
hla
nd
s /
Isla
nd
s
Gra
mp
ian
Tay
sid
e
Cen
tral
Fif
e
56

Table TD17: Use of ordering services the previous day, 2016
Mail order
Ordered goods by
phone
Ordered takeaway
food delivery
Sample size
(=100%) Yes Nocell percentages
All people: 1.0 7.4 0.8 0.8 3.2 7,040 4.5 94.3 730 by gender:
Male 0.6 7.1 0.5 0.8 3.6 3,280 5.3 93.5 340 Female 1.4 7.6 1.1 0.8 2.9 3,760 3.7 95.1 400
by age: 16-19 0.6 3.5 1.0 0.8 5.8 200 ** ** 20 20-29 1.4 9.2 1.4 1.1 6.4 860 3.9 95.6 140 30-39 1.5 10.0 0.5 0.8 3.9 1,080 7.5 90.5 150 40-49 0.6 9.7 1.1 0.9 4.2 1,170 3.4 95.3 160 50-59 0.8 6.8 0.7 0.6 1.9 1,230 5.1 93.8 120 60-69 0.7 6.1 0.3 0.6 0.7 1,250 1.5 98.4 90 70-79 1.0 3.0 0.3 0.9 0.6 900 ** ** 40 80+ 1.4 1.0 0.9 0.7 0.8 360 ** ** 10
by current situation: Self employed 1.3 8.9 0.5 1.8 1.6 480 8.7 88.8 70 Employed full time 0.9 8.5 0.8 0.7 4.3 2,620 5.5 93.3 340 Employed part time 1.1 9.3 1.1 1.0 2.8 780 2.7 95.6 90 Looking after the home/family 1.5 9.7 0.6 1.1 4.6 310 2.4 97.6 50 Permanently retired from work 1.0 4.3 0.4 0.7 0.7 2,050 0.8 99.1 110 Unemployed/seeking work 1.8 2.6 0.8 0.0 5.9 200 ** ** 20 In further/higher education 0.9 10.5 1.7 1.1 4.1 250 2.3 97.7 40 Permanently sick or disabled 0.9 3.4 1.2 0.4 4.5 210 0.0 100 20
by annual net household income: up to £10,000 p.a. 0.9 3.4 0.4 0.8 3.7 700 ** ** 40 over £10,000 - £15,000 1.1 4.3 0.8 1.0 3.7 1,070 6.4 93.6 90 over £15,000 - £20,000 1.0 4.2 0.5 0.5 3.5 990 6.9 89.7 70 over £20,000 - £25,000 0.4 5.4 0.3 0.9 2.6 880 0.0 96.5 80 over £25,000 - £30,000 0.9 7.2 0.8 1.0 4.0 690 2.5 97.5 80 over £30,000 - £40,000 0.7 9.0 0.5 0.9 3.3 1,040 8.3 91.7 130 over £40,000 p.a. 1.5 11.3 1.4 0.7 2.9 1,460 3.8 94.6 230
by Scottish Index of Multiple Deprivation quintiles: 1 (20% most deprived) 0.6 5.9 0.5 0.9 4.8 1,200 1.4 96.9 110 2' 1.2 5.9 0.5 0.6 2.9 1,400 4.9 95.1 140 3' 0.6 7.7 1.1 0.8 4.1 1,560 3.3 95.9 180 4' 1.1 8.3 1.1 1.2 1.8 1,560 7.7 90.7 170 5 (20% least deprived) 1.6 8.7 0.6 0.6 2.8 1,340 4.6 93.7 140
by urban/rural classification: Large urban areas 1.3 6.7 1.1 0.7 2.7 2,090 3.4 96.6 190 Other urban 0.7 8.0 0.6 0.9 4.2 2,350 4.4 94.1 270 Small accessible towns 0.5 6.8 0.1 0.4 4.1 660 1.7 91.0 60 Small remote towns 0.8 9.1 0.2 1.5 5.1 450 7.2 92.8 50 Accessible rural 1.4 7.9 1.2 0.9 0.8 780 10.0 90.0 80 Remote rural 1.1 6.6 0.5 0.7 3.0 720 2.4 97.4 80
by frequency of driving†: Every day 1.2 8.5 1.1 0.8 3.5 3,180 5.2 93.0 390 At least three times a week 0.7 8.4 0.7 1.1 2.7 1,140 4.0 96.0 110 Once or twice a week 0.8 8.6 0.4 1.0 2.5 430 2.8 97.2 50 Less often 2.6 5.2 0.7 1.4 1.9 220 ** ** 20 Never, but holds full driving licence 1.6 6.6 0.6 0.2 3.5 420 ** ** 40 ** values based on an overall sample size below 50 have been suppressed
Supermarket home delivery
Internet shopping
Sample size (=100%)
(if used ordering services the previous day) did this impact on the number of
trips you made yesterday?
57

Table A: [Confidence limits] 95% confidence limits for estimates, based on SHS sub-samples sizes
5% 10% 15% 20% 25% 30% 35% 40% 45%or or or or or or or or or
95% 90% 85% 80% 75% 70% 65% 60% 55% 50%
100 5.0 6.8 8.1 9.1 9.8 10.4 10.8 11.1 11.3 11.4200 3.5 4.8 5.7 6.4 7.0 7.4 7.7 7.9 8.0 8.0300 2.9 3.9 4.7 5.3 5.7 6.0 6.3 6.4 6.5 6.6400 2.5 3.4 4.1 4.5 4.9 5.2 5.4 5.6 5.7 5.7500 2.2 3.1 3.6 4.1 4.4 4.7 4.8 5.0 5.1 5.1600 2.0 2.8 3.3 3.7 4.0 4.3 4.4 4.5 4.6 4.6700 1.9 2.6 3.1 3.4 3.7 3.9 4.1 4.2 4.3 4.3800 1.8 2.4 2.9 3.2 3.5 3.7 3.8 3.9 4.0 4.0900 1.7 2.3 2.7 3.0 3.3 3.5 3.6 3.7 3.8 3.8
1,000 1.6 2.2 2.6 2.9 3.1 3.3 3.4 3.5 3.6 3.61,200 1.4 2.0 2.3 2.6 2.8 3.0 3.1 3.2 3.3 3.31,400 1.3 1.8 2.2 2.4 2.6 2.8 2.9 3.0 3.0 3.01,600 1.2 1.7 2.0 2.3 2.5 2.6 2.7 2.8 2.8 2.81,800 1.2 1.6 1.9 2.1 2.3 2.5 2.6 2.6 2.7 2.72,000 1.1 1.5 1.8 2.0 2.2 2.3 2.4 2.5 2.5 2.52,500 1.0 1.4 1.6 1.8 2.0 2.1 2.2 2.2 2.3 2.33,000 0.9 1.2 1.5 1.7 1.8 1.9 2.0 2.0 2.1 2.13,500 0.8 1.2 1.4 1.5 1.7 1.8 1.8 1.9 1.9 1.94,000 0.8 1.1 1.3 1.4 1.6 1.6 1.7 1.8 1.8 1.85,000 0.7 1.0 1.1 1.3 1.4 1.5 1.5 1.6 1.6 1.66,000 0.6 0.9 1.0 1.2 1.3 1.3 1.4 1.4 1.5 1.57,000 0.6 0.8 1.0 1.1 1.2 1.2 1.3 1.3 1.4 1.48,000 0.6 0.8 0.9 1.0 1.1 1.2 1.2 1.2 1.3 1.39,000 0.5 0.7 0.9 1.0 1.0 1.1 1.1 1.2 1.2 1.2
10,000 0.5 0.7 0.8 0.9 1.0 1.0 1.1 1.1 1.1 1.112,000 0.5 0.6 0.7 0.8 0.9 1.0 1.0 1.0 1.0 1.014,000 0.4 0.6 0.7 0.8 0.8 0.9 0.9 0.9 1.0 1.016,000 0.4 0.5 0.6 0.7 0.8 0.8 0.9 0.9 0.9 0.918,000 0.4 0.5 0.6 0.7 0.7 0.8 0.8 0.8 0.8 0.820,000 0.4 0.5 0.6 0.6 0.7 0.7 0.8 0.8 0.8 0.825,000 0.3 0.4 0.5 0.6 0.6 0.7 0.7 0.7 0.7 0.730,000 0.3 0.4 0.5 0.5 0.6 0.6 0.6 0.6 0.7 0.735,000 0.3 0.4 0.4 0.5 0.5 0.6 0.6 0.6 0.6 0.640,000 0.2 0.3 0.4 0.5 0.5 0.5 0.5 0.6 0.6 0.645,000 0.2 0.3 0.4 0.4 0.5 0.5 0.5 0.5 0.5 0.550,000 0.2 0.3 0.4 0.4 0.4 0.5 0.5 0.5 0.5 0.5
e.g. an estimate of 55% that is based on a sample of 800 has 95% confidence limits of 55% ± 4.1% points2013 Design factor = 1.16Formula used is CI = 1.16 x 1.96 x SQRT((% x (1-%)) / n )
Sub-sample
size (=100%)
Estimate
percentage points ( + / - )
58

Annex A
Walking Driver car/van
Passenger car/van
Bicycle Bus Taxi/ minicab Rail OtherSample size
All 23.5 50.7 13.1 1.2 7.7 0.9 2.2 0.8 19,050 by distance:
Under 1 km 64.7 26.7 5.4 0.8 1.5 0.5 . 0.3 4,110 1 to under 2km 32.2 41.9 13.1 2.8 7.3 1.8 ** 0.8 2,740 2 to under 3km 16.1 52.6 14.3 2.1 11.9 1.2 0.5 1.2 1,810 3 to under 5km 7.2 57.6 16.0 1.1 13.7 1.4 1.9 1.2 2,180 5 to under 10km 2.1 64.9 15.8 1.0 13.4 1.1 1.6 0.1 2,780 10 to under 15km 0.7 69.5 15.8 0.4 8.3 0.2 4.1 0.9 1,550 15 to 20km ** 67.4 16.1 0.6 5.4 0.5 8.1 1.5 950 20 to 40km ** 71.2 16.8 0.5 4.7 0.2 6.4 0.1 1,730 40km and over . 56.3 20.9 ** 4.1 ** 14.3 3.7 1,200
** denotes cells with values supressed as they contain fewer than 5 respondents.
Table TD4: [Distance] Percentage of journeys made by straight line distance travelled, 2012-2016 1
2012 2013 2014 2015 2016column percentages
Under 1 km 25.9 24.6 25.4 22.7 24.11 to under 2km 15.6 15.2 14.9 15.3 15.52 to under 3km 10.6 10.1 9.8 10.0 9.73 to under 5km 11.9 12.3 12.6 13.1 12.25 to under 10km 14.7 16.0 15.3 16.2 15.010 to under 15km 7.2 7.2 7.5 7.2 7.315 to 20km 4.0 4.2 4.3 4.2 4.420 to 40km 6.6 6.6 6.8 7.2 7.840km and over 3.5 3.8 3.4 4.1 3.8Sample size (=100%) 19,740 20,180 19,930 18,710 19,050
10 to under
15km
All 24.1 15.5 9.7 12.2 15.0 7.3 4.4 7.8 3.8 19,050 by mainmode:
Walking 66.6 21.3 6.7 3.8 1.4 0.2 ** ** . 4,690 Driver car 12.7 12.9 10.0 14.0 19.4 10.0 5.9 11.0 4.0 9,290 Driver van 13.7 10.9 11.9 13.3 15.4 9.4 6.7 10.7 8.0 390 Passenger car 10.2 15.7 10.7 14.9 18.0 8.8 5.1 10.2 6.2 2,240 Passenger van 4.6 12.0 6.9 15.9 27.0 8.9 17.3 6.3 1.2 60 Bicycle 16.2 35.7 16.9 10.6 12.3 2.4 2.0 3.4 ** 220 Bus 4.8 15.3 15.4 21.6 26.5 7.9 2.6 3.9 2.0 1,430 Taxi/minicab 14.1 29.8 12.6 18.2 17.3 1.7 2.6 1.5 ** 220 Rail . ** 2.2 10.2 10.5 13.6 16.2 22.6 24.3 340 Other 28.9 8.8 3.2 14.8 3.2 9.7 10.3 4.1 17.1 60
** denotes cells with values supressed as they contain fewer than 5 respondents.
Table TD5: [Distance] Distance (straight line) summary statistics 2012-2016 1
2012 2 2013 2014 2015 2016Kilometres
Lower Decile 0.4 0.4 0.4 0.4 0.4Lower Quartile 1.0 1.0 1.0 1.1 1.0Median 2.7 3.0 3.0 3.3 3.1Upper Quartile 8.3 8.7 8.5 9.0 9.2Upper Decile 20.2 20.8 20.2 21.8 22.3Mean 8.3 8.5 8.4 8.9 8.8Sample size 19,740 20,180 19,930 18,710 19,050 1 Note that 1km = 0.6 miles
Table TD5a: [Distance] Distance (straight line) summary statistics by mode of transport, 2016
Walking Driver car/van
Passenger car/van
Bicycle Bus Taxi/ minicab Rail Other All modes
Lower Decile 0.2 0.9 1.0 0.6 1.4 0.8 4.2 1.3 0.4Lower Quartile 0.3 1.9 2.0 1.2 2.4 1.4 10.6 2.1 1.0Median 0.6 5.1 4.7 2.0 4.2 2.1 18.5 3.7 3.1Upper Quartile 1.3 12.8 13.3 3.9 8.0 5.0 38.8 16.7 9.2Upper Decile 2.2 24.7 29.7 9.3 14.8 8.7 73.7 68.9 22.3Mean 1.0 10.5 12.2 4.6 7.4 8.2 34.1 28.6 8.8Sample size 4,690 9,680 2,300 220 1,470 220 340 140 19,050
Main Mode of Transport
2 to under 3km
3 to under 5km
Main Mode of Transport
Kilometres
15 to 20km
Row percentages
20 to 40km
Table TD4a: [Distance by main mode] Percentage of journeys by straight line distance by main mode, 2016
5 to under 10km
Table TD2a: [Main mode by distance] Percentage of journeys by main mode by straight line distance, 2016 1
row percentages
Sample sizeUnder 1 km 1 to under
2km40km and
over
1. Distances are calculated as a straight line between the start and end points of each stage / journey. A version of this table using the road network distance is included in thon the differences between the straight line and road network distance can be found in TATIS Appendix A. Note that 1km = 0.6 miles
1. Distances are calculated as a straight line between the start and end points of each stage / journey. A version of this table using the road network distance is included in thon the differences between the straight line and road network distance can be found in TATIS Appendix A. Note that 1km = 0.6 miles
59

Annex B: Scottish Access to Bus Indicator
SABI table 1: Weekday scores (deciles)Least accessible 2 3 4 5 6 7 8 9 Most accessible
Large urban areas 2.6% 2.4% 3.7% 4.4% 5.5% 8.4% 10.4% 14.5% 21.0% 27.1%Other urban 4.8% 7.1% 10.3% 12.5% 14.3% 14.7% 14.3% 12.0% 7.6% 2.4%Small accessible towns 12.2% 14.1% 15.3% 16.1% 16.6% 11.6% 8.5% 4.4% 1.2% 0.0%Small remote towns 12.8% 23.5% 23.5% 18.1% 11.7% 6.4% 2.7% 1.3% 0.0% 0.0%Accessible rural 24.5% 20.8% 16.4% 12.0% 9.6% 5.7% 5.5% 3.4% 1.4% 0.6%Remote rural 55.7% 27.0% 10.5% 4.3% 1.5% 0.9% 0.1% 0.0% 0.1% 0.0%
SABI table 2: Weekend scores (deciles)Least accessible 2 3 4 5 6 7 8 9 Most accessible
Large urban areas 2.6% 2.4% 4.0% 4.7% 5.9% 7.9% 9.7% 14.5% 20.6% 27.6%Other urban 4.8% 7.4% 10.2% 12.3% 13.6% 14.6% 14.7% 12.4% 8.0% 2.0%Small accessible towns 12.1% 14.5% 14.6% 16.5% 16.9% 12.2% 8.1% 3.9% 1.2% 0.0%Small remote towns 14.1% 26.2% 20.8% 17.4% 11.4% 7.4% 2.3% 0.3% 0.0% 0.0%Accessible rural 23.4% 20.2% 16.8% 12.9% 9.8% 5.9% 5.3% 3.4% 1.7% 0.6%Remote rural 55.6% 28.2% 9.4% 4.0% 1.7% 1.0% 0.2% 0.1% 0.0% 0.0%
SABI table 3: Weekday scores (quintiles)Least accessible 2 3 4 Most accessible
Large urban areas 5.0% 8.1% 13.9% 24.9% 48.1%Other urban 11.9% 22.8% 29.0% 26.3% 10.1%Small accessible towns 26.3% 31.4% 28.2% 12.9% 1.2%Small remote towns 36.2% 41.6% 18.1% 4.0% 0.0%Accessible rural 45.3% 28.4% 15.4% 8.9% 2.0%Remote rural 82.6% 14.7% 2.4% 0.1% 0.1%
SABI table 4: Weekend scores (quintiles)Least accessible 2 3 4 Most accessible
Large urban areas 5.0% 8.7% 13.9% 24.2% 48.2%Other urban 12.2% 22.5% 28.2% 27.1% 9.9%Small accessible towns 26.6% 31.1% 29.1% 12.0% 1.2%Small remote towns 40.3% 38.3% 18.8% 2.7% 0.0%Accessible rural 43.6% 29.7% 15.7% 8.7% 2.4%Remote rural 83.7% 13.3% 2.6% 0.3% 0.0%
highest row percentage
60

© Crown copyright. All rights reserved ScottishGovernment 2017. © Crown copyright anddatabase right 2017. Ordnance Survey (OSLicence number 100024655).
Scottish Government GI Science & AnalysisTeam, February 2017, Job 5721 - la
1:2,550,000Scale:
Scottish Access to Bus Indicator 2017 -Weekday ScoreMap shows the weekday results for SABI 2017,categorised into deciles where 1 indicates the datazones in Scotland with the poorest accessibility to busservices and 10 indicates those with the greatest.
Weekday Score(Decile)
12345678910
61
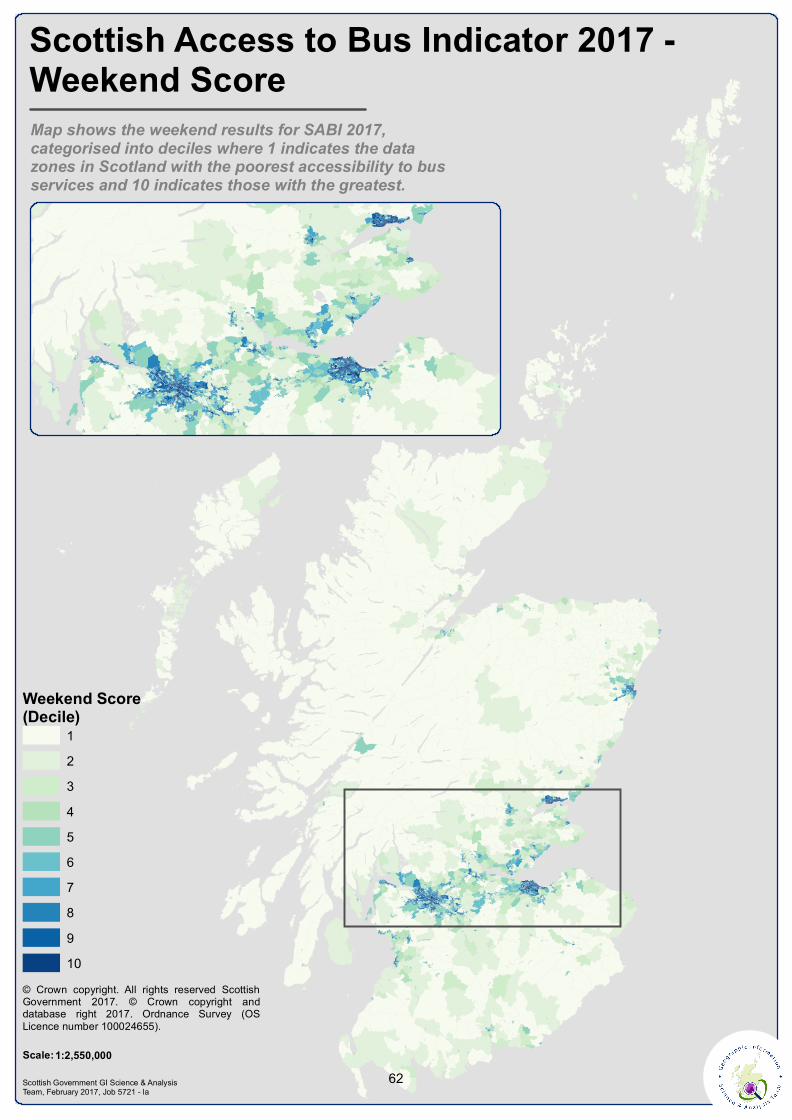
© Crown copyright. All rights reserved ScottishGovernment 2017. © Crown copyright anddatabase right 2017. Ordnance Survey (OSLicence number 100024655).
Scottish Government GI Science & AnalysisTeam, February 2017, Job 5721 - la
1:2,550,000Scale:
Scottish Access to Bus Indicator 2017 -Weekend ScoreMap shows the weekend results for SABI 2017,categorised into deciles where 1 indicates the datazones in Scotland with the poorest accessibility to busservices and 10 indicates those with the greatest.
Weekend Score(Decile)
12345678910
62

9. SOURCES Vehicle Licensing Department for Transport https://www.gov.uk/government/collections/vehicles-statistics Local Bus Services Department for Transport https://www.gov.uk/government/collections/bus-statistics Freight (Road) Department for Transport https://www.gov.uk/government/collections/road-freight-domestic-and-international-statistics Freight (Rail) Freightliner/English Welsh & Scottish Railways/Direct Rail Services https://www.gov.uk/government/collections/rail-statistics http://uk.dbcargo.com/rail-uk-en/start/ Coastwise Traffic Department for Transport https://www.gov.uk/government/statistical-data-sets/dwf03-coastwise-traffic Pipelines Department of Energy and Climate Change https://www.gov.uk/government/organisations/department-of-energy-climate-change Public Road Lengths Transport Scotland [email protected] Road Traffic Department for Transport https://www.gov.uk/government/organisations/department-for-transport/series/road-traffic-statistics Road Accident Casualties Transport Scotland Transport Statistics https://www.transport.gov.scot/publication/reported-road-casualties-scotland-2015/ Rail Services Office of Rail Regulation & ScotRail http://orr.gov.uk/statistics Air Transport Civil Aviation Authority http://www.caa.co.uk/default.aspx?catid=80&pagetype=88&pageid=3&sglid=3 Ferries Caledonian MacBrayne & North Link Ferries http://www.calmac.co.uk/ http://www.northlinkferries.co.uk/ Scottish Household Survey http://www.scotland.gov.uk/Topics/Statistics/16002 Travel in GB National Travel Survey https://www.gov.uk/government/collections/national-travel-survey-statistics Sustrans Hands Up Scotland Survey http://www.sustrans.org.uk/scotland/what-we-do/schools-and-universities/hands-scotland Scotland and GB Travel to Work – Labour Force Survey https://www.gov.uk/government/statistical-data-sets/tsgb01-modal-comparisons
63

10. BACKGROUND INFORMATION
The Scottish Household Survey (SHS) started in February 1999. Its principal purpose is to collect information to inform policy on Transport, Communities and Local Government, but other topics are covered, such as household composition, amenities, employment or unemployment, income, assets and savings, credit and debt, health, disabilities and care, and other topics. The SHS provides the first representative Scottish data on many subjects, such as access to the Internet, daily travel patterns, etc.
Where appropriate, the SHS uses the harmonised concepts and questions for government social surveys which have been developed by the Government Statistical Service, to facilitate comparison with the results of other government surveys. However, differences in sampling and survey methods mean that SHS results will differ from those of other surveys. The SHS is not designed to produce statistics on unemployment or income: it collects such information only for selecting the data for particular groups of people (such as the unemployed or the low-paid) for further analysis, or for use as background variables when analysing other topics.
The SHS is intended to be a survey of private households. For the purposes of the survey, a household is defined as one person or a group of people living in accommodation as their only or main residence and either sharing at least one meal a day or sharing the living accommodation. A student's term-time address is taken as his/her main residence, in order that they are counted where they live for most of the year.
The sample was drawn from the Small User file of the Postcode Address File (PAF), which is a listing of all active address points maintained by the Post Office. The Small User file excludes addresses where an average of more than 25 items of post is delivered per day. Blocks of flats etc, which have several dwellings at the same address, are not excluded from the Small User file: in such cases, the file's Multiple Occupancy Indicator is used to count each dwelling separately for the selection of the sample.
People in certain types of accommodation (such as nurses’ homes, student halls of residence etc.) will be excluded from the SHS unless the accommodation is listed on the Small User file of the PAF and it represents the sole or main residence of the people concerned. People living in bed and breakfast accommodation may be included, if it is listed in the Small User file of the PAF and if it is their sole or main residence. Prisons, hospitals and military bases are excluded.
Published results, and anonymised data
SHS results are also included in Scottish Transport Statistics, published in February.
Transport statistics publications are available on the Transport Scotland Statistics webpages at https://www.transport.gov.scot/publications/
The SHS Annual Report is published by the Scottish Government and can be found here: http://www.scotland.gov.uk/Topics/Statistics/16002/PublicationAnnual
Anonymised copies of the survey data are deposited at the UK Data Archive
64

Enquiries and further information
General enquiries about the SHS should be addressed to the survey’s Project Manager:
SHS Project Manager Communities Analytical Services Scottish Government Victoria Quay Edinburgh, EH6 6QQ Tel: 0131 244 0824 Fax: 0131 244 7573 E-mail: [email protected]
Enquiries about the statistics in this bulletin should be addressed to:
Jeanine Bezuijen Transport Analytical Services Transport Scotland Scottish Government Victoria Quay Edinburgh, EH6 6QQ Tel: 0131 244 1457 E-mail: [email protected]
Further information about the survey can be found on the SHS website at www.scotland.gov.uk/shs
This website provides some background to the survey, information about the progress of the survey, and the published results. Copies of the Transport Statistics bulletins can be found on the Transport Scotland Statistics webpages at: https://www.transport.gov.scot/publications/
Please use the SHS Web site to register your interest in Population and Household Surveys if you wish to be added to an e-mail mailing list to be kept informed of SHS news and developments. The Project Manager will also, on request, distribute paper copies of information about the survey, and about significant developments when they occur, to people who are unable to access the website.
To keep informed with changes to Scottish statistics, please register your interest with ScotStat at www.scotland.gov.uk/scotstat.
65

A NATIONAL STATISTICS PUBLICATION FOR SCOTLAND
The United Kingdom Statistics Authority has designated these statistics as National Statistics, in accordance with the Statistics and Registration Service Act 2007 and signifying compliance with the Code of Practice for Official Statistics.
Designation can be interpreted to mean that the statistics: meet identified user needs; are produced, managed and disseminated to high standards; and are explained well.
Correspondence and enquiries For enquiries about this publication please contact: Jeanine Bezuijen Transport Scotland Analytical Services, Telephone: 0131 244 1457 e-mail: [email protected]
For general enquiries about Scottish Government statistics please contact: Office of the Chief Statistician, Telephone: 0131 244 0442, e-mail: [email protected]
How to access background or source data
The data collected for this statistical bulletin:
☐ are available as part of a GB dataset on data.gov.uk
☒ may be made available on request, subject to consideration of legal and ethical factors. Please [email protected] or further information.
☐ cannot be made available by Scottish Government for further analysis as Scottish Government is not thedata controller.
Complaints and suggestions If you are not satisfied with our service or have any comments or suggestions, please write to the Chief Statistician, 3WR, St Andrews House, Edinburgh, EH1 3DG, Telephone: 0131 244 0302, e-mail [email protected].
If you would like to be consulted about statistical collections or receive notification of publications, please register your interest at www.scotland.gov.uk/scotstat Details of forthcoming publications can be found at www.scotland.gov.uk/statistics
Most recent editions of Transport Statistics Publications - available here https://www.transport.gov.scot/publications/
TitleScottish Transport Statistics
Transport and Travel in Scotland
Last published Notes February 2017 September 2017 Web only
Reported Road Casualties Scotland October 2016 Key Reported Road Casualties Scotland June 2017 Web only
ISSN 1351 3869 ISBN 978-1-911582-17-5
Crown Copyright You may use or re-use this information (not including logos) free of charge in any format or medium, under the terms of the Open Government Licence. See: www.nationalarchives.gov.uk/doc/open-government-licence/