2d and 3d modelling of magnetic and resistivity data from Äspö
TRANSCRIPT

Svensk Kärnbränslehantering ABSwedish Nuclear Fueland Waste Management Co
Box 250, SE-101 24 Stockholm Phone +46 8 459 84 00
P-11-19
2D and 3D modelling of magnetic and resistivity data from Äspö
Håkan Mattsson, GeoVista AB
May 2011
CM
Gru
ppen
AB
, Bro
mm
a, 2
011

Tänd ett lager:
P, R eller TR.
2D and 3D modelling of magnetic and resistivity data from Äspö
Håkan Mattsson, GeoVista AB
May 2011
ISSN 1651-4416
SKB P-11-19
Keywords: Magnetic, Resistivity, Lineament, Geophysics, Inversion, Modelling, Geology, Bedrock, Fractures, Äspö, Deformation zone.
This report concerns a study which was conducted for SKB. The conclusions and viewpoints presented in the report are those of the author. SKB may draw modified conclusions, based on additional literature sources and/or expert opinions.
Data in SKB’s database can be changed for different reasons. Minor changes in SKB’s database will not necessarily result in a revised report. Data revisions may also be presented as supplements, available at www.skb.se.
A pdf version of this document can be downloaded from www.skb.se.

P-11-19 3
Abstract
This report presents results from modelling of geophysical data. Ground magnetic and geoelectric data were collected in 1988 as part of the pre-investigations carried out before the construction of the Äspö Hard Rock Laboratory (HRL). The work presented in this report is an evaluation of the magnetic and geoelectric data with the focus on estimating variations in geometry and dip of some of the possible deformation zones indicated in lineament interpretations presented earlier. This was done by 2D forward magnetic modelling, 2D forward resistivity modelling and 3D inversion of the magnetic data.
The specific aims of this work are:
1. Produce magnetic 2D forward models across 12 selected linked lineaments.2. Produce a 3D susceptibility model of the entire data set of Äspö.3. Use 2D forward resistivity modelling to produce electric anomaly response diagrams for
a dipole-dipole survey across low resistivity zones with various dips.
The results of the modelling work will mainly be used as supportive information for deterministic geological modelling of deformation zones and rock units in the vicinity of the Äspö HRL.
The results of the 2D forward modelling of magnetic data show geologically reasonable solutions, and in most cases it is possible to make reliable estimates of the width and orientation of the cause of the targeted lineament. The possible deformation zones generally dip steeply (80°–90°) and have a width of c. 30–50 m. In some cases the modelled lineament has a diffuse character with low amplitude, which makes the model solution uncertain.
Two 3D susceptibility models were created by use of inversion of the ground magnetic data; one coarse model of the entire Island of Äspö and one more detailed model of the south-eastern peninsula of the Island, covering the volume of the Äspö HRL. The two models fit nicely to the measured data and they are geologically realistic. It is possible to identify well-defined bodies (rock volumes) of increased as well as decrease magnetization. The former most likely indicate the distribution of Ävrö granite-granodiorite and Äspö diorite, and the latter indicate linear or semi-linear low magnetic features, most likely related to possible deformation zones.
The results of the 2D forward modelling of low resistivity zones of various dips indicates that it is not possible to reliably estimate the dip of these zones based on a data from a dipole-dipole survey with fixed electrode spacing (the type of data collected in 1988). A reliable dip estimation would most likely require 2D pseudo section data from new electric measurements with multi electrode configuration.

4 P-11-19
Sammanfattning
Föreliggande rapport presenterar resultat från modellering av geofysiska data från Äspö, insamlade i samband med förundersökningarna inför byggandet av Äspö HRL 1988. Arbetet är utfört med fokus på att uppskatta geometri och orientering på möjliga deformationszoner från tidigare utförda lineamentstolkningar. De tre tekniker som användes var 2D forward modellering och 3D inversions modellering av markmagnetiska data samt 2D forward modellering av geoelektriska data.
Specifika mål med arbetet är att:
1. Producera magnetiska forward modeller i 2D över 12 st utvalda lineament.2. Producera en modell i 3D över variationer i magnetisk susceptibilitet över Äspö.3. Med hjälp av elektrisk 2D forward modellering ta fram responskurvor från en tänkt geoelektrisk
mätning med dipol-dipol konfiguration över lågresistiva zoner med varierande stupning.
Resultaten av de utförda modelleringarna ska främst användas som stödjande information till de deterministiska geologiska modelleringar av deformationszoner och berggrunden som utförs på Äspö, i området kring Äspö HRL.
Resultaten av den magnetiska 2D modellering visar på geologiskt trovärdiga modeller, och i flertalet fall är det möjligt att uppskatta bredd och stupning på orsaken till det undersökta lineamentet. De möjliga deformationszonerna har generellt brant till vertikal stupning (ca 80°–90°) och de har i snitt en bredd på ca 30–50 m. I några fall är den magnetiska anomalin som modelleras så diffus, och har så låg amplitud, att modellen blir mycket osäker.
Två stycken 3D susceptibilitetsmodeller togs fram efter inversion av det magnetiska datasetet; en grov modell över hela Äspö och en mer detaljerad modell över den sydöstra delen av Äspö, i området där Äspölaboratoriet ligger. Båda modellerna är väl anpassade till mätdata. Ur modellerna är det möjligt att identifiera väldefinierade volymer både med ”normal” till förhöjd susceptibilitet, och flera linjära-semilinjära volymer (områden) med avvikande låg susceptibilitet. Volymerna speglar sannolikt förekomst av olika bergartstyper (Ävrö granit-granodiorit och Äspödiorit) samt möjliga deformationszoner.
Den geoelektriska modellering över lågresistiva zoner med varierande stupning indikerar att det inte är möjligt att utifrån en mätning med fast dipol-dipol konfiguration (den konfiguration som användes under mätningarna 1988) säkert uppskatta stupningen på möjliga deformationszoner. För att kunna göra en sådan uppskattning baserad på geoelektriska data krävs att man utför 2D pseudosektions-mätningar med multipla elektrodkonfigurationer.

P-11-19 5
Contents
1 Introduction 7
2 Objective and scope 9
3 Equipment 113.1 Description of interpretation tools 11
4 Data processing 134.1 Data preparation 134.2 Magnetic data 13
4.2.1 Magnetic 2D forward modelling 134.2.2 Magnetic 3D inversion modelling 15
4.3 Resistivity data 16
5 Modelling results 175.1 2D forward magnetic modelling 175.2 3D inversion of magnetic data 235.3 2D forward modelling of resistivity data 245.4 Uncertainties 25
6 Delivered data 27
References 29

P-11-19 7
1 Introduction
This document reports the results of geophysical modelling of data from detailed ground magnetic and resistivity surveys performed at Äspö in 1988 /Nisca and Triumf 1989/, see Figure 1-1. The work is a continuation of the lineament interpretation reported by /Mattsson and Wahlgren 2010/ and was carried out in accordance with activity plan AP TD F140-10-026. In Table 1-1 controlling documents for performing this activity are listed. Activity plans and method descrip tions are SKB’s internal controlling documents.
The ground magnetic and geoelectric data were collected in 1988 as part of the pre-investigations that were carried out before the construction of the Äspö Hard Rock Laboratory (HRL) /Nisca and Triumf 1989/. In the work presented by /Mattsson and Wahlgren 2010/ the geophysical data and topographic data were re-processed and re-interpreted with focus on identifying lineaments on the ground surface. These lineaments have been used as supportive information in the work with deterministic modelling of deformation zones at Äspö.
The work presented in this report constitutes a continuous evaluation of the magnetic and geoelectric data with the focus on estimating variations in geometry and dip of some of the possible deformation zones indicated in the lineament interpretation. This was done by 2D forward magnetic modelling, 2D forward resistivity modelling and 3D inversion of the magnetic data.
The interpretation presented in this report is performed by GeoVista AB in accordance with the instructions and guidelines from SKB under supervision of Leif Stenberg.
The data and interpretation products are stored in the database Sicada and are traceable by the activity plan number.
Figure 1‑1. General overview over the island of Äspö from aerial photo, © Lantmäteriet.

8 P-11-19
Table 1‑1. Controlling documents for the performance of the activity.
Activity plan Number VersionTokning av detaljerade markgeofysiska mätningar utförda 1988 på Äspö. AP TD F140-10-026 1.0
Method descriptions Number VersionMetodbeskrivning för lineamentstolkning baserad på topografiska data. SKB MD 120.001 1.0

P-11-19 9
2 Objective and scope
The general aim of geophysical modelling is to estimate geometry and physical character of the cause to an investigated anomaly, for example a low magnetic linear feature. In 2D forward model-ling work the data along a profile are interpreted. A geological model of rock “bodies” is constructed and the bodies are given physical properties; in our case based on petrophysical data from the KAS02 borehole /Mattsson and Wahlgren 2010/. The response of the model bodies is calculated and visualized together with the measured data, and the fit between the measured data and the “model data” can be compared. The properties and geometries of the model bodies are changed until a reasonably good fit is achieved. The model solution is not unique, but with knowledge of the geology and petrophysi-cal properties it is possible to achieve geologically reasonable model solutions. In the 3D magnetic inversion modelling the distribution of the magnetic susceptibility in a volume beneath the survey area is estimated. A 3D susceptibility start model is created and in the inversion process the response from the model is compared statistically with the measured data, which results in a misfit. The model is changed and updated during a number of iterations until the misfit levels out, or the maximum number of iterations is reached. The model solution is not unique, but it is often geologically relevant since the model calculations are based on potential field theory and model susceptibilities are governed by boundary conditions that are based on petrophysical properties.
The specific aims of this work are:
1. Produce magnetic 2D forward models across 12 selected linked lineaments.2. Produce a 3D susceptibility model of the entire data set of Äspö.3. Use 2D forward resistivity modelling to produce electric anomaly response diagrams for a
dipole-dipole survey across low resistivity zones with various dips. This will make it possible to compare the model diagrams with measured data in order to roughly estimate the dip of bodies giving rise to low resistivity anomalies.
The results of the modelling work will mainly be used as supportive information for deterministic geological modelling of deformation zones and rock units in the vicinity of the Äspö HRL.

P-11-19 11
3 Equipment
3.1 Description of interpretation tools The processing, interpretation and reporting included the use of the following specialized software:
Profile Analyst Professional v. 9.0 (Encom) (Model visualization)ModelVision v. 10.00 (Encom) (2D forward magnetic modelling)MAG3D v. 4.0 (UBC) (3D magnetic inversion modelling)DCIP3D v. 2.1 (UBC) (2D forward resistivity modelling)Surfer 8 (Golden software) (Data processing)MapInfo Professional 10.0 (Pitney Bowes) (Data processing and visualization)

P-11-19 13
4 Data processing
4.1 Data preparationMost of the data processing was carried out in connection with the lineament interpretation /Mattsson and Wahlgren 2010/. All data were acquired from the Sicada database and delivered by SKB via email. The magnetic and geoelectric data were delivered as point data in Microsoft Excel-files. The point data were measured with reference to the local co-ordinate system ÄSPÖ96. The data were transformed to the system RT90 2.5 gon west, standard, by use of transformation parameters enclosed with the data delivery. The correctness of the transformation procedure was checked by control data points with given co-ordinates in both systems.
4.2 Magnetic data4.2.1 Magnetic 2D forward modellingFor the magnetic 2D forward modelling the point data were imported to the modelling software ModelVision (v. 10.00, Encom) and stacked profile maps were constructed. By the use of Profile Analyst (v. 9, Encom) an ER-Mapper grid was interpolated with 5 m cell-size and subsequently imported into ModelVision. Twelve profiles across the chosen linked lineaments were then extracted from the grid (Figures 4-1 and 4-2). The lineaments to be modelled were selected by Peter Hultgren (SKB) and Carl-Henric Wahlgren (SGU), and the exact location, orientation and length of each profile was decided by Håkan Mattsson (GeoVista), see Table 4-1 and Figures 4-1 and 4-2.
The 2D magnetic forward models are not meant to constitute exact and very accurately detailed rock models, but the aim is to support the deformation zone modelling with indications mainly regarding the dip and width of low magnetic zones. The NRM (Natural Remanent Magnetization) was not regarded in the modelling. The average Q-values of the rock samples in KAS02 is Q = 0.3 SI (122 samples), which indicates that the susceptibility plays the dominant role of the total magnetization. For rocks with higher Q-values we know from earlier investigations during the site investigations that the orientation of the NRM vector is generally subparallel with the present earth magnetic field /Mattsson et al. 2004/, and this will mainly affect the amplitude of the modelled anomalies, and it will not significantly affect their shape.
With reference to the magnetic susceptibility data measured on 122 rock samples from KAS02 the model bodies were divided into four groups:
1. Suscept≥0.3SI;dioritoid-gabbroidrock(greenbodycolour).
2. 0.3SI≥suscept≥0.2SI;“normal”Ävrögranite-granodioriteandÄspödiorite(redbodycolour).
3. 0.2SI≥suscept≥0.1SI;rockswithpartlydecreasedmagneticsusceptibility,e.g.alteredorpartly deformed (light blue body colour).
4. Suscept≤0.1SI;rockswithsignificantlydecreasedmagneticsusceptibility,e.g.strongalteration,deformation zone centre or possibly fine-grained granite (dark blue body colour).

14 P-11-19
Table 4‑1. List of lineaments modelled with 2D forward magnetic modelling together with the model profile number.
Priority Lineament Profile number Comment
1 XASNE0028 3 Profile 3 also covers XASNE00262 XASNE0026 3 and 103 XSANE0029 10 Profile 10 also covers XASNE0026 and 284 XASNS027A 85 XASNS027B 26 XASNW0017 117 XASNS0030 98 XASEW033B 79 XASNW013B 610 XASNE0023 1 Profile 1 also covers XASNE002411 XASNS0031 412 XASNS0032 5
In addition to the above models, a long “semi-regional” northwest-southeast trending profile (profile No 12) across the entire Island of Äspö was also subjected to modelling.
Figure 4‑1. Aerial map of Äspö showing the location and id-code of the linked lineaments (black lines) presented by /Mattsson and Wahlgren 2010/.

P-11-19 15
4.2.2 Magnetic 3D inversion modellingThe magnetic total field point data were used as indata for the 3D inversion without any pre-processing other than the co-ordinate transformation from ÄSPÖ 96 to RT90 2.5 gon west, standard. The magnetic data the inversion was carried out with reference to the surface topography. The elevation data were extracted to an ascii-file (5×5 m point distance) from the elevation grid.
Two inversions were carried out. One over the entire Island of Äspö with a voxel cell-size of 10×10×5 m (east-west, north-south and depth), in the top 50 m. Below 50 m depth and down to 250 m depth the cell size is 10×10×10 m. In the depth section 250 m to 750 m the vertical cell-size is 20 m.
The second inversion was focused on the southern part of Äspö in which the Hard Rock Laboratory and the approach tunnel are located (Figure 4-3). This volume was modelled with cells half the size compared to the model of the entire Island.
Figure 4‑2. Total magnetic anomaly map with linked lineaments (thin black lines) and profiles (with individual numbers) extracted for magnetic forward modelling (thick red-brown lines).

16 P-11-19
4.3 Resistivity dataThe resistivity survey was conducted with a fixed dipole-dipole configuration (5-10-5 m), which means one pair of current electrodes (5 m spacing) and one pair of potential electrodes (5 m spacing), with 10 m separation between the adjacent electrodes (see Figure 4-4). This means, theoretically, that the resistivity data only cover a certain depth level below the ground surface. The data are presented as simple diagrams along the profile lines and consequently it is very difficult to make interpretations of the dip of the structure (target) that causes an anomaly.
However, a test was performed in order to investigate the possibilities of estimating dip variations of low resistivity zones based on the anomaly shape of the resistivity data. For this test 5 model bodies were created with the software ModelVision. Body dimensions of length×width×depth = 200 m×5 m×150 m. The body are all oriented with a north-south strike and various dips towards east of 90° (vertical), 75°, 60°, 45° and 30°. The bodies were transformed to 3D-voxel models and given aresistivityof500Ωmwithasurroundingresistivityof10,000Ωm.ByuseoftheDCIP3Dsoftwarean east-west trending dipole-dipole (configuration 5-10-5 m) resistivity survey was simulated across the model bodies.
Figure 4‑4. Principle sketch of dipole-dipole electrode configuration.
Figure 4‑3. 3D-view towards northeast showing a coloured map of the elevation model and the 3D voxel mesh for the detailed magnetic inversion modelling of the southern part of Äspö Island.

P-11-19 17
5 Modelling results
5.1 2D forward magnetic modellingThe result of the 2D forward magnetic modelling work is presented in Figure 5-1 below, one figure for each modelled profile. The profile locations are shown in the Figure 4-2. Body colours and properties are explained in section 4.2.1.
Profile 1Across XASNE0023 (dark blue body) and across XASNE0024 (right most light blue body). The steep southeasterly dip of XASNE0023 is mainly governed by the positive anomaly caused by the high magnetic body (green body) at its left. The true width of XASNE0023 is estimated at c. 40 m.
Profile 2Across XASNS027B (dark blue body). The negative anomaly related to XASNS027B is distinct and well defined and indicates a steep dip of c. 60° towards northwest. The true width of this possible deformation zones is estimated at c. 50 m (regional field indicated by the blue line).
Figure 5‑1. Vertical sections of 2D forward magnetic models along profiles across linked lineaments at Äspö. See the text for explanation.

18 P-11-19
Profile 3Across XASNE0026 and XASNE0028. The model indicates a c. 180 m wide zone of partly decreased magnetization. It is not possible to “magnetically” differ between the two lineaments; hence geometry and dip are poorly defined.
Profile 4Across XASNS0031. The negative anomaly related to XASNS0031 is distinct and well defined and indicates a steep dip of c. 83° towards west. The true width of this possible deformation zones is estimated at c. 45 m.
Figure 5‑1. Continued.

P-11-19 19
Profile 5Across XASNS0032. The geometry and width is mainly governed by the two surrounding high magnetic bodies (green colour). The model indicates a core (dark blue) with an estimated width of c. 15 m at the ground surface. According to the model the width of the possible zone decreases with depth. The estimated dip is sub vertical.
Profile 6Across XASNW013B. The negative anomaly related to XASNW013B is fairly distinct and well defined and indicates a steep dip of c. 84° towards northeast. The true width of this possible deformation zones is estimated at c. 50 m.
Figure 5‑1. Continued.
20 P-11-19
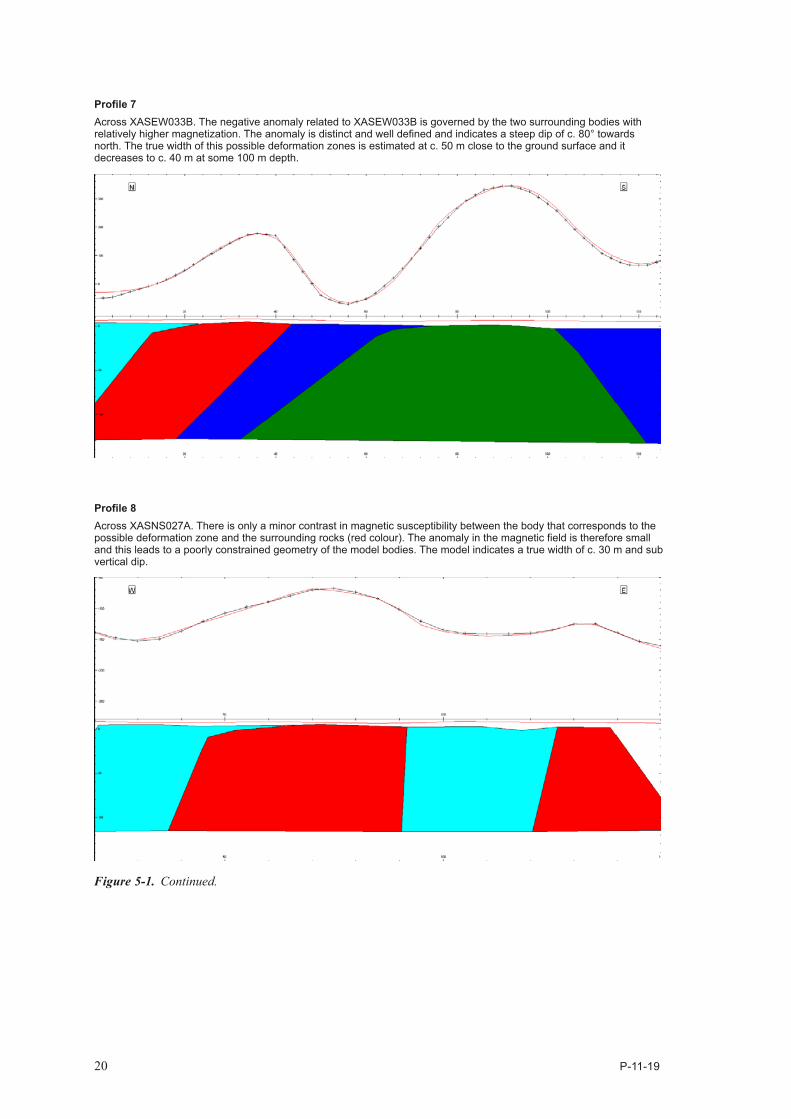
Profile 7Across XASEW033B. The negative anomaly related to XASEW033B is governed by the two surrounding bodies with relatively higher magnetization. The anomaly is distinct and well defined and indicates a steep dip of c. 80° towards north. The true width of this possible deformation zones is estimated at c. 50 m close to the ground surface and it decreases to c. 40 m at some 100 m depth.
Profile 8Across XASNS027A. There is only a minor contrast in magnetic susceptibility between the body that corresponds to the possible deformation zone and the surrounding rocks (red colour). The anomaly in the magnetic field is therefore small and this leads to a poorly constrained geometry of the model bodies. The model indicates a true width of c. 30 m and sub vertical dip.
Figure 5‑1. Continued.

P-11-19 21
Profile 9Across XASNS0030. The negative anomaly related to XASNS0030 is fairly distinct and well defined and indicates a steep dip of c. 85° towards southeast. The true width of this possible deformation zones is estimated at c. 45 m.
Profile 10Across XASNE0029. The profile also cross cuts the lineaments XASNE0026 and XASNE0028. The three lineaments cannot be separated in the model. The model indicates a steep dip towards southeast along the north-western boundary and towards northwest along the south-eastern boundary. The large width of the negative magnetic anomaly in combination with the rather small amplitude of the surrounding positive anomalies makes the geometry of this model uncertain.
Figure 5‑1. Continued.

22 P-11-19
Profile 11Across XASNW0017. The model indicates a c. 50 m wide possible deformation zone at the ground surface, which decreases significantly in width with increasing depth. The existence of the negative anomaly of XASNW0017 is clear but its shape is not distinct and the amplitude is fairly small. The geometry of the model is therefore uncertain.
Profile 12Profile across the entire Island of Äspö. The profile does not cover any specific lineament(s) but crosscuts the entire low magnetic region that transects the Island of Äspö in a northeast-southwest orientation. The low magnetic region defines a distinct negative anomaly in the profile data. The boundaries to the surrounding high magnetic bodies are indicated to be sub vertical. The north-western boundary is indicated to dip steeply towards southeast.
Figure 5‑1. Continued.

P-11-19 23
5.2 3D inversion of magnetic dataThe results of the 3D inversion of the magnetic data are two voxel-models showing the distribution of the magnetic susceptibility in the two modelling volumes. One model comprises the entire Island of Äspö and the other model is more detailed, mainly comprising the south-eastern peninsula of the Island of Äspö (Figures 5-2 and 5-3). 3D-models are generally difficult to display on paper, in 2D, but in the figures below we present some examples of the results, print outs from the 3D visualiza-tion software Profile Analyst (Encom). The models are delivered to SKB as 3D-dxf (Micro Stn) iso-surfaces for different values of the magnetic susceptibility.
In the two figures we can see that it is possible to use the models as a supportive tool for estimating width and orientation of low magnetic zones (possible deformation zones), and also to estimate the 3D distribution of different magnetized rock types. The latter may be of great help in, for example, rock modelling in volumes where there is a lack of borehole or tunnel data.
Figure 5‑2. Perspective view towards northeast showing the two 3D susceptibility models generated by inversion of the ground magnetic data. Linked lineaments are shown by red lines.

24 P-11-19
Figure 5‑3. Same view and scale as in Figure 5-2. The green volumes show an iso-surface of the magnetic susceptibility value 0.025 SI.
5.3 2D forward modelling of resistivity dataThe simulated (modelled) dipole-dipole survey across the low resistivity bodies, as described in paragraph 4.3, basically generates point data of the apparent resistivity along the “survey” profiles. In Figure 5-4 we present response curves from the modelling. The curves represent five simulated measurements across a low resistivity zone with dip of 90°, 75°, 60°, 45° and 30°, all dips towards east. From the diagram in Figure 5-4 the low resistivity zone appears as a distinct low resistivity anomaly in the data. The shape of the anomaly clearly varies with different dips, with an increased easterly flank with increasing dip. The flank is distinctly pronounced for the dip of 30°, but is not so well-defined for the steeper dips. When taking geological noise into consideration, and keeping in mind that the model constitutes a “perfect” geometry, it seems evident that it would be practically impossible to estimate the dip of a low resistivity zone based on this type of data. A reliable dip estimation would most likely require 2D pseudo section data from new electric measurements with multi electrode configuration.

P-11-19 25
5.4 UncertaintiesThe modelling of geophysical data is always impaired by uncertainties. The forward modelling of magnetic (and resistivity data) data has many degrees of freedom. The strength of the magnetic field decreases significantly with distance from the source, so the spatial resolution decreases with depth and the majority of the information supporting the models inherits from the uppermost part of the bed-rock. In the magnetic forward modelling presented in this report it is basically assumed that we know the magnetic susceptibility distribution of the different rock types. By applying more or less constant values of the magnetic susceptibility, this parameter is held fixed, and the modelling is mainly carried out by varying the geometry of the model bodies. Forward modelling will never result in a unique or true geological solution. However, from sample measurements of the magnetic susceptibility we have a fair knowledge of the susceptibility distribution. From field observations and drillings we have a general knowledge of rock type distribution on the surface and other supportive information, such as soil cover thickness. Thus, it is fair to say that the models presented indicate geologically reliable information of the near surface geometry of the targeted possible deformation zones.
The 3D inversion modelling generally aims at creating a 3D model of the susceptibility distribution in the ground. The technique assumes that no remanent magnetization is present, which in the real case is wrong. Remanent magnetization is generally present in most rock types, especially in rocks carrying magnetite, which the rocks at the Island of Äspö generally do. However, measurements on rock samples from KAS02 show an average Q-value of 0.3, and this indicates a clear dominance of the induced magnetization over the remanent magnetization. The orientation of the natural remanent magnetization (NRM) vector is generally sub-parallel to the present earth magnetic field /Mattsson et al. 2004/, which means that the NRM will mainly affect the amplitude of the anomalous magnetic field, and to a lesser extent the shape of the anomalies. Thus, errors in the inverted 3D susceptibility model caused by the NRM will most likely be of less significance, but there may be significant errors in those areas where the rocks have increased Q-value. Just as for the 2D forward modelling the spatial resolution of the 3D inversion model decreases with depth, which is directly related to the increasing distance to the magnetic sources at depth, as the survey was conducted at the ground surface.
Figure 5‑4. Response curves of the log10 of the apparent resistivity across a low resistivity (assumed deformation) zone with varying dips, from vertical to 30° towards east.
3,5
3,6
3,7
3,8
3,9
4
4,1
4,2
4,3
4,4
4,5
1551400 1551420 1551440 1551460 1551480 1551500 1551520 1551540 1551560 1551580 1551600
DZ dip 30DZ dip 45DZ dip 60DZ dip 75DZ dip 90
Log1
0 (r
esis
tivity
)
Easting coordinate (m)

P-11-19 27
6 Delivered data
With this report the following data were delivered:
• Magnetic2Dmodels(3Ddxffiles).
• Magnetic3Diso-surfaces(3Ddxffiles).
• Allreportfigures.

P-11-19 29
References
SKB’s (Svensk Kärnbränslehantering AB) publications can be found at www.skb.se/publications.
Mattsson H, Thunehed H, Triumf C-A, 2004. Oskarshamn site investigation. Compilation of petrophysical data from rock samples and in situ gamma-ray spectrometry measurements. Stage 2 – 2004 (including 2002). SKB P-04-294, Svensk Kärnbränslehantering AB.
Mattsson H, Wahlgren C-H, 2010. Interpretation of detailed ground magnetic data, resistivity and topographic data from Äspö. SKB P-10-49, Svensk Kärnbränslehantering AB.
Nisca D H, Triumf C-A, 1989. Detailed geomagnetic and geoelectric mapping of Äspö. SKB HRL Progress Report 25-89-01, Svensk Kärnbränslehantering AB.