2d- and 3d-qsar study of acyl homoserine lactone...
TRANSCRIPT

INT. J. BIOAUTOMATION, 2016, 20(4), 441-456
441
2D- and 3D-QSAR Study of Acyl Homoserine Lactone
Derivatives as Potent Inhibitors of Quorum Sensor,
SdiA in Salmonella typhimurium
Gnanendra Shanmugam1,3, Syed Mohamed2, Jeyakumar Natarajan3*
1Bioinformatics Division, Center for Research and Development
Mahendra Educational Institutions, Mallasamudram
Tiruchengode, Tamil Nadu, India
E-mail: [email protected]
2Department of Molecular Modeling
Sadakathullah Appa Collegе
Tirunelveli, Tamil Nadu, India
E-mail: [email protected]
3Department of Bioinformatics
Bharathiar University
Coimbatore, Tamil Nadu, India.
E-mail: [email protected]
*Corresponding author
Received: February 12, 2016 Accepted: November 10, 2016
Published: December 31, 2016
Abstract: A series of Acyl homoserine lactone derivatives against quorum sensing (QS)
enhanced transcriptional regulator SdiA of S. typhimurium were used to establish the
physicochemical and structural requirements for the inhibition of QS using 2D- and
3D-QSAR methods. The QSAR model was developed by employing 35 compounds as a training
set and the predictive ability was assessed by a test set of 12 compounds.
The best 2D-QSAR model for the prediction of SdiA, quorum sensor inhibitory activity has
been developed using Multiple Linear Regression (MLR) method (giving r2 = 0.8012 and
q2 = 0.657), Principal Component Regression (PCR) method (giving r2 = 0.8104 and
q2 = 0.625), and Partial Least Squares Regression (PLS) method (giving r2 = 0.8023 and
q2 = 0.648). The best model for 3D-QSAR has been obtained using Comparative Molecular
Field Analysis (CoMFA) method, giving r2 = 0.896 and q2 = 0.772. The 2D-QSAR results
revealed that the most important descriptors for predicting the anti-quorum sensing activity
were alignment-independent descriptors and the topology index descriptors. The 3D-QSAR
results of CoMFA contour maps impart some important structural features-like
electronegative substituent (Br, Cl, F) on lactone ring favors the strong inhibitory activity.
These results will be further useful for development of new quorum sensing inhibitors with
structural diversity.
Keywords: Salmonella typhimurium, 2D-QSAR, 3D-QSAR, CoMFA, QS inhibitors.
Introduction Salmonella typhimurium is an enteric bacterium causing gastroenteritis, a life threatening
disease in human beings. In recent years problems related to Salmonella have increased both in
terms of prevalence and severe cases of human salmonellosis and millions of human cases are
reported worldwide every year resulting in thousands of mortality [26]. Worldwide, nearly
21.6 million cases of typhoid fever resulting in 200,000 deaths are estimated every year [3].
In Asia, the rate of incidence of typhoid fever is estimated to be 900 per 100,000 people per
annum [17]. In contrast, human gastroenteritis is increasing because of food contamination.

INT. J. BIOAUTOMATION, 2016, 20(4), 441-456
442
The Ernest surveillance program reported S. typhimurium on gastrointestinal disorders
characterized by high morbidity but low mortality [27]. Globally, the incidence of
gastroenteritis is estimated at 1.7 billion cases per year resulting about 3 million deaths.
In United States, there are an estimated 1.5 million new cases of non-typhoidal Salmonella
infections every year [24]. Computational techniques are commonly applied for structure
determination and functional elucidation of specific proteins of S. typhimurium [20, 31].
In general, gram-negative bacteria including S. typhimurium communicate with each other by
producing chemical signal molecules that are released into the surrounding environment.
These signal molecules upon reaching the quorum, activate certain target genes to respond to
the population density which is termed as quorum sensing (QS) [9, 33]. Most of the gram-
negative bacteria encodes LuxR/LuxI QS system of Vibrio fischeri, where the N-(3-oxo)
homoserine lactone (AHLs) are produced by signal synthase, LuxI and reaches LuxR, a signal
receptor to modulate the gene expression of various genes and virulence factors [8, 22].
The species of our interest S. typhimurium encodes only LuxR homologue, termed as SdiA
(Suppressor of cell division inhibition A). Due to the absence of LuxI homologs [25],
S. typhimurium sense the AHLs produced by Yersinia enterocolitica [12] which activates two
Salmonella-specific loci, srgE (SdiA regulated gene E) and the rck (resistance to complement
killing) operon and also the Salmonella’s colonization in the intestine [28].
In gram-negative bacteria including S. typhimurium, brominated furanones were reported to
have inhibitory activity against SdiA, the LuxR homologue [4, 29]. Gnanendra et al. [12] earlier
studied and reported the binding interactions of SdiA and the four AHLs of Y. enterocolitica.
Their studies revealed that the lactone ring and alkyl chains of AHL molecules are crucial in
forming the interactions with in the active site of SdiA. The importance of crucial active site
residues favoring the interaction with ligands suggested that the compounds substituted with
suitable groups on the lactone ring and alkyl chain might be the best inhibitors
of Salmonella SdiA [23].
Since there were only a few reports concerning the activity of halogenated furanones on
Salmonella [15], here we present our quantitative structure-activity relationship (QSAR)
analysis of the series of brominated furanones and N-Acyl homoserine lactone derivatives by
2D- and 3D-QSAR models, which may guide rational synthesis of potent novel compounds.
The 2D-QSAR model was derived from various regression methods such as Multiple Linear
Regression (MLR), Principle Component Regression (PCR), Partial Least Squares (PLS) and
the development of 3D-QSAR models was derived from the most widely used computational
3D-CoMFA method [1]. The study was performed by using structurally diverse sets of
N-Acyl homoserine lactone QS inhibitors from the literature with reported IC50 values.
In total 47 compounds were used for the study and the 2D- and 3D-QSAR models were
developed using a training set of 35 compounds, and the predictive ability of the QSAR models
was assessed by using a test set of 12 compounds.
Materials and methods
Biological activities and dataset for 2D-QSAR Reported quorum sensing inhibitors ex-vivo dataset of 47 brominated furanones and N-Aryl
homoserine lactone derivatives with the experimental biological activities, in the form of IC50
(µM) values (Fig. 1) were selected from the literature [11, 19, 30]. The IC values spanning a
range of 0.21 µM to 1000 µM provide a broad spectrum data set for 2D-QSAR study.
The biological activities were converted into pIC50 to correlate the linear data to the free energy

INT. J. BIOAUTOMATION, 2016, 20(4), 441-456
443
change and to use as a dependant variable for the development of a valid 2D- and
3D-QSAR models. For all these compounds 2D structures were sketched using
ACD-chemsketch and converted to 3D structures using their SMILES notation at
“Online SMILES convertor and Structure file generator” [16]. Merck molecular force field and
charge were used for Energy minimization and geometry optimization running at maximum
number of 1000 cycles and RMS gradient at 0.01 using “small molecule” module at Discovery
Studio [6].
Fig. 1 Dataset of 47 brominated furanones and N-Aryl homoserine lactone derivatives
Molecular descriptors As the 2D-QSAR studies require the molecular descriptors, the optimized geometries of the
molecules were used to calculate the 4 different types of descriptors namely topological,
electronic, geometrical and constitutional descriptors. These descriptors encode different
aspects of molecular structure and consist of electronic, element counts, molecular weight,
molecular refractivity, logP and topological descriptors (Table 1). The invariable (constant)
columns of independent variables (i.e., descriptors) were removed and later used for QSAR
analysis. The 2D-QSAR and molecular descriptors calculations were done using “QSAR
module” at Discovery Studio [6] and Molecular descriptor calculation server [14].
Selection of training and test set The dataset of 47 molecules was divided into training set (35 compounds, Table 2) and test set
(12 compounds, Table 3) by Sphere Exclusion (SE) method [16]. The unicolumn statistics

INT. J. BIOAUTOMATION, 2016, 20(4), 441-456
444
(Table 4) reveals the perfect selection test and training sets. A total of 178 descriptors were
calculated using Molecular descriptor calculation server [14]. The calculated molecular
descriptors with same value and highly correlating with other descriptors were excluded.
The remaining 9 significant descriptors were calculated for all the 47 molecules. The top five
significant descriptors were considered for generating the 2D-QSAR using regression analysis.
Table 1. Types of descriptors used in the study
Sl.
No.
Type of
descriptor
Descriptor
used Symbol Description
1. Topological
Eccentric
connectivity
index
ECCEN
A descriptor combining distance
and adjacency information.
2. Topological Zagreb index Zagreb The sum of the squared atom
degrees of all heavy atoms
3. Topological WHIM Weta3.unity Holistic descriptors described
by Todeschini et al.
4. Topological Autocorrelation
charge ATSc1
The Moreau-Broto
autocorrelation descriptors
using partial charges.
5. Topological Wiener numbers WPOL Calculates Wiener path number
and Wiener polarity number.
6. Electronic Charged partial
surface area RNCS
Descriptors combining surface
area and partial charge
information.
7. Constitutional HBond donor
count nHBon
Calculates the number of
hydrogen bond donors.
8. Geometrical Gravitational
index GRAV-1
Descriptor characterizing
the mass distribution
of the molecule.
9. Geometrical Moment of
inertia MOMI-R
Calculates the principal moments
of inertia and ratios
of the principal moments. Als
calculates the radius of gyration.
Regression analysis The regression analysis of dataset comprising of 35 training set molecules was carried out by
MLR, PCR, and PLS as model building methods. The pIC50 values of the 35 molecules were
used as dependent variable and various descriptors as independent variables to generate the
QSAR models with the parameters of cross-correlation limit of 0.5 [32]. The models were
evaluated by means of statistical measures such as number of data points n, multiple correlation
co-efficient r, standard error of estimate s, Fisher ratio between the variances of observed and
predicted activities F, cross-validated r2 obtained by the Leave-One-Out (LOO) method q2.
Multiple linear regression (MLR) analysis The linear relationship between a dependent variable Y (pIC50) and independent variable X
(2D descriptors) is established by Multiple Linear regression. The method least square curve
fitting is used in MLR to estimate the regression coefficients (r2) values as the MLR is based
on least squares. A relationship in the form of linear straight line that estimates all the individual
data points is created by the model.

INT. J. BIOAUTOMATION, 2016, 20(4), 441-456
445
Table 2. Training set molecules with IC50 and pIC50 values
Sl. No. Compound number IC50 value pIC50 value
1. Comp 1 17 4.76 2. Comp 3 11 4.95 3. Comp 4 45 4.34 4. Comp 6 50 4.3 5. Comp 7 17.9 4.74 6. Comp 8 199.9 3.699 7. Comp 10 23.12 4.63 8. Comp 11 10.74 4.96 9. Comp 13 1000 3 10. Comp 14 19.42 4.71 11. Comp 16 65.89 4.18 12. Comp 17 1.25 5.9 13. Comp 18 4.63 5.33 14. Comp 20 0.61 6.21 15. Comp 21 0.81 6.09 16. Comp 22 0.92 6.036 17. Comp 24 4.7 5.32 18. Comp 25 2.4 5.61 19. Comp 27 1.8 5.74 20. Comp 28 1.1 5.98 21. Comp 29 4.3 5.36 22. Comp 30 2.7 5.56 23. Comp 31 0.62 6.2 24. Comp 33 0.44 6.35 25. Comp 34 1.6 5.79 26. Comp 35 0.29 6.53 27. Comp 36 4.3 5.36 28. Comp 38 6.8 5.16 29. Comp 39 12 4.92 30. Comp 40 3.3 5.48 31. Comp 42 2.1 5.67 32. Comp 43 1.8 5.74 33. Comp 44 1.1 5.95 34. Comp 46 1.6 5.79 35. Comp 47 3.4 5.46
Table 3. Test set molecules with IC50 and pIC50 values
Sl. No. Compound number IC50 value pIC50 value
1. Comp 2 13 4.88 2. Comp 5 90 4.04 3. Comp 9 57.46 4.24 4. Comp 12 160.1 3.79 5. Comp 15 1000 3 6. Comp 19 2.25 5.64 7. Comp 23 8.4 5.07 8. Comp 26 4.2 5.37 9. Comp 32 0.51 6.29 10. Comp 37 8.9 5.05 11. Comp 41 3.3 5.48 12. Comp 45 0.21 6.67

INT. J. BIOAUTOMATION, 2016, 20(4), 441-456
446
Table 4. Uni-column statistics of the training and test sets for QSAR models
Data set Column name Average Max Min SD Sum
2D-QSAR
Training set pIC50 5.30 6.53 3.00 0.7808 185.80
Test set pIC50 4.96 6.67 4.88 1.0529 59.52
3D-QSAR
Training set pIC50 5.30 6.53 3.00 0.7808 185.80
Test set pIC50 4.96 6.67 4.88 1.0529 59.52
MLR analysis includes more than one independent variable based on the regression analysis
where the conditional mean of dependant variable (pIC50) Y depends on independent variable
(descriptors) X. Regression equation has the form
1 1 2 2 3 3Y b x b x b x c ,
where Y is dependent variable; bi are regression coefficients; xi are independent variables and;
c is regression constant [2, 5].
Principal component regression (PCR) method Principal component regression is a data compression method for finding the structures in
datasets and aims to group correlated variables and replace the original descriptors by new set
termed as principal components (PCs). The PC value at each point is obtained by rotating the
data into a new set of axes such that most of the variations within the data reflect the first few
axes. The data in the decreasing order of variance is selected by PCA as a new set of axes to
estimate the dependent variable value based on the selected Principle Components of
independent variables [7].
Partial least squares regression (PLSR) method The relationship of one or more dependent variable (Y) with several independent (X) variables
can be established by PLS. This popular regression method is used when the number of
independent variables exceeds the number of observations. PLSR aims to describe the common
structure by predicting the activity (Y) from X [15].
Validation of QSAR model The generated models were evaluated by using following statistical measures: correlation
coefficient r, which accounts for variance in activity. The internal consistency of equation
predictive powers is cross-validated by LOO method expressed as the cross-validated squared
correlation coefficient (q2). The q2 is defined as
2 22
pred act act mean1 /q Y Y Y Y ,
where Ypred, Yact, Ymean are predicted, actual and mean values of the target property (pIC50)
respectively; 2
pred actY Y is the predictive residual error sum of squares (PRESS), an
important cross-validation parameter as is a good approximation of the real predictive error of
the model [21].

INT. J. BIOAUTOMATION, 2016, 20(4), 441-456
447
3D-QSAR studies and dataset The same dataset of 47 molecules used in 2D-SQAR studies were again used for 3D-QSAR
analysis. For the 3D-QSAR analysis we used CoMFA model [1]. This method enables to predict
biological activity of specific molecules by deriving a relationship between electrostatic⁄steric
properties and biochemical activities, which can be plotted on contour maps. Comparative
molecular field analysis calculates steric fields using Lennard-Jones potential and electrostatic
fields using a Coulombic potential. For this CoMFA model, the IC50 values were converted to
the corresponding logpIC50 and used as dependent variables. The 3D-QSAR analyses were
carried out using “3D-QSAR module” of Discovery Studio [6].
Alignment procedure Molecular alignment is an important method in 3D-QSAR, related to the conformational
flexibility of molecules. Using Systemic conformational search method (grid search) all
possible conformations were generated with varying torsion angles and the lowest energy
conformers were selected. The template-based alignment method was used to align all the
35 compounds by defining template structure as a basis [18] in the create QSAR option from
small molecule module of Discovery studio [6]. To generate the predictive QSAR model, the
most active compound’s lactone ring was used a template to align all the compounds.
Descriptors calculation The Tripos force field and Gasteiger and Marsili charge types are used to calculate the
electrostatic, steric and hydrophobic field descriptors [10]. The distance-dependent dielectric
function probe as carbon atom with charge 1.0 and dielectric constant of 1.0 are considered to
calculate the field descriptors (electrostatic and steric).
Comparative molecular field analysis (CoMFA) The regular space grid of 2.0 Å in all the three dimensions is used to calculate the CoMFA steric
and electrostatic potential fields at each lattice intersection within the defined region [1].
The sp3 carbon atom with a radius of 1.52 Å and +1.0 charge was used to calculate the steric
and electrostatic fields representing the van der Waals potential (Lennard-Jones 6-12) and
columbic terms. The contributions of steric and electrostatic interactions are terminated at
±30 kcal/mol and the electrostatic contributions are ignored with the maximum steric
interactions of lattice intersections.
Partial least squares (PLS) analysis The CoMFA interaction energies pertaining to structural parameters and biological activities
relationship is quantified by PLS analysis. The PLS regression takes advantages of greater
number of descriptors (independent variables) comparable to number of compounds
(data points) [13]. LOO method is used for cross-validation analysis in which the activity is
predicted by leaving one compound from the dataset. The optimum number of components and
the cross-validated q2 value were obtained by using a minimum column filtering value (σ) of
2.00 kcal/mol to speed up the analysis with reduced noise [34]. The non-cross-validated r2 value
was obtained by employing the optimum number of previously identified components used to
analyse the CoMFA result.
Results and discussion Generation of 2D-QSAR models The detailed description of the descriptors used to generate the 2D-QSAR models were given
in Table 1. Several QSAR models were derived for the 2D-QSAR studies on a series of
INT. J. BIOAUTOMATION, 2016, 20(4), 441-456
448
Brominated Furanones and N-Aryl homoserine lactone and the statistically significant QSAR
models is discussed.
Multiple linear regression analysis pIC50 = + 0.0025 (± 0.0094) ECCEN 0.0180 (± 0.0436) Zagreb + 4.9151 (± 9.8709)
weta3.unity 0.0610 (± 0.0772) RNCS + 0.5308 (± 1.5955) nHBDon + 3.5910 (± 5.5780)
(n = 35; r = 0.937; r2 = 0.8012; s = 0.462; F = 21.611; p < 0.0001; q2 = 0.657;
SPress = 0.563; SDEP = 0.520)
Principle component regression method pIC50 = + 0.2863 (± 0.0758) MOMI + 0.3045 (± 0.2636) ECCEN 0.2580 (± 0.5120) Zagreb
+ 0.5124 (± 0.6640) GRAV-1 0.5533 (± 0.7446) Wpol + 5.3087 (± 0.1573)
(n = 35; r = 0.943; r2 = 0.8104; s = 0.455; F = 21.226; p < 0.0001; q2 = 0.625;
SPress = 0.582; SDEP = 0.538)
Partial least square method pIC50 = + 0.2965 (± 0.0776) weta3.unity + 0.2869 (± 0.2959) ECCEN 0.0367 (± 0.3149)
ATSc-1 + 0.4306 (± 0.5850) GARV-1 0.6770 (± 1.3104) Zagreb + 5.3087 (± 0.1595)
(n = 35; r = 0.938; r2 = 0.8023; s = 0.461; F = 20.683; p < 0.0001; q2 = 0.648;
SPress = 0.568; SDEP = 0.525)
The above QSAR equations explain the variance in biological activity by a correlation
coefficient r2 and the models predictability is evaluated by q2 using LOO method. In the model,
ratio of variance due to error in regression is reflected by high F value indicating statistically
significant.
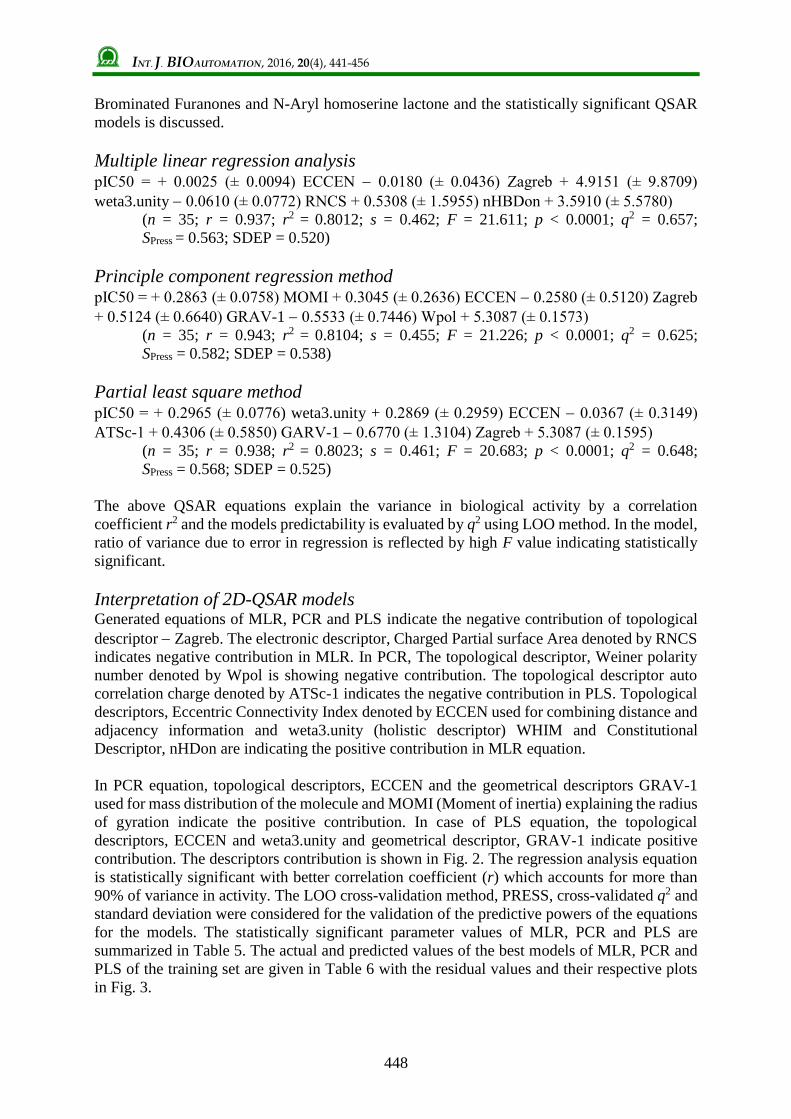
Interpretation of 2D-QSAR models Generated equations of MLR, PCR and PLS indicate the negative contribution of topological
descriptor Zagreb. The electronic descriptor, Charged Partial surface Area denoted by RNCS
indicates negative contribution in MLR. In PCR, The topological descriptor, Weiner polarity
number denoted by Wpol is showing negative contribution. The topological descriptor auto
correlation charge denoted by ATSc-1 indicates the negative contribution in PLS. Topological
descriptors, Eccentric Connectivity Index denoted by ECCEN used for combining distance and
adjacency information and weta3.unity (holistic descriptor) WHIM and Constitutional
Descriptor, nHDon are indicating the positive contribution in MLR equation.
In PCR equation, topological descriptors, ECCEN and the geometrical descriptors GRAV-1
used for mass distribution of the molecule and MOMI (Moment of inertia) explaining the radius
of gyration indicate the positive contribution. In case of PLS equation, the topological
descriptors, ECCEN and weta3.unity and geometrical descriptor, GRAV-1 indicate positive
contribution. The descriptors contribution is shown in Fig. 2. The regression analysis equation
is statistically significant with better correlation coefficient (r) which accounts for more than
90% of variance in activity. The LOO cross-validation method, PRESS, cross-validated q2 and
standard deviation were considered for the validation of the predictive powers of the equations
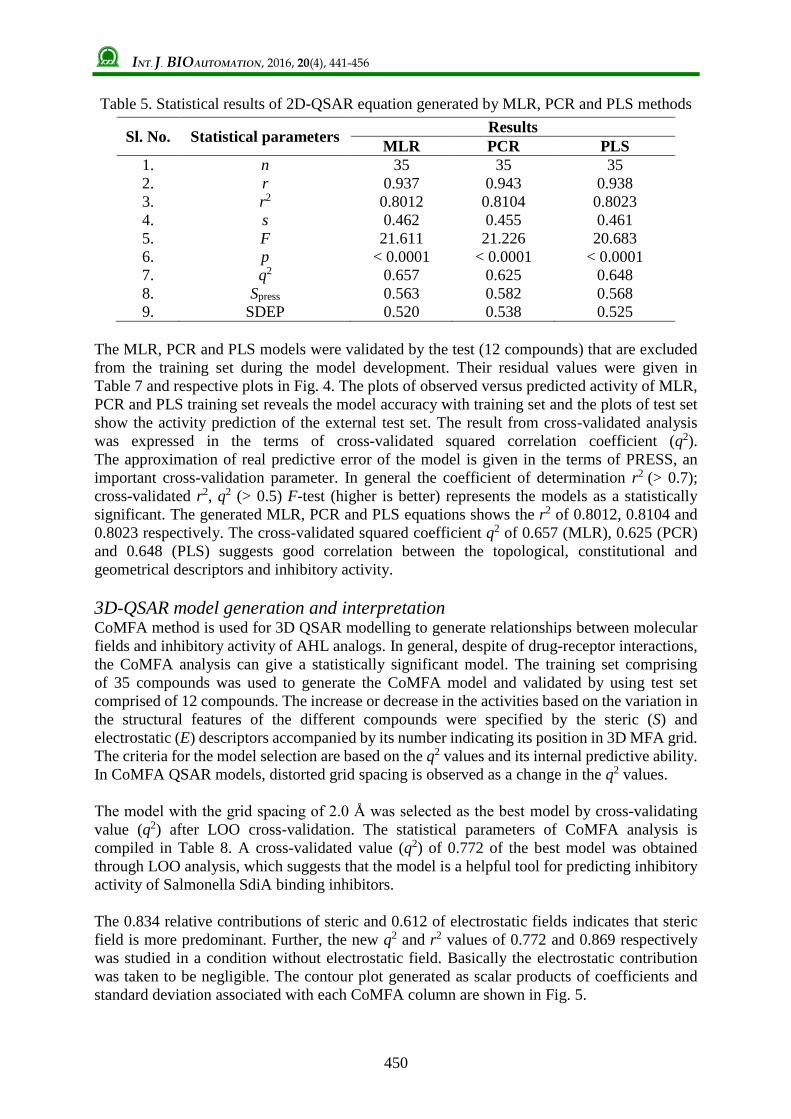
for the models. The statistically significant parameter values of MLR, PCR and PLS are
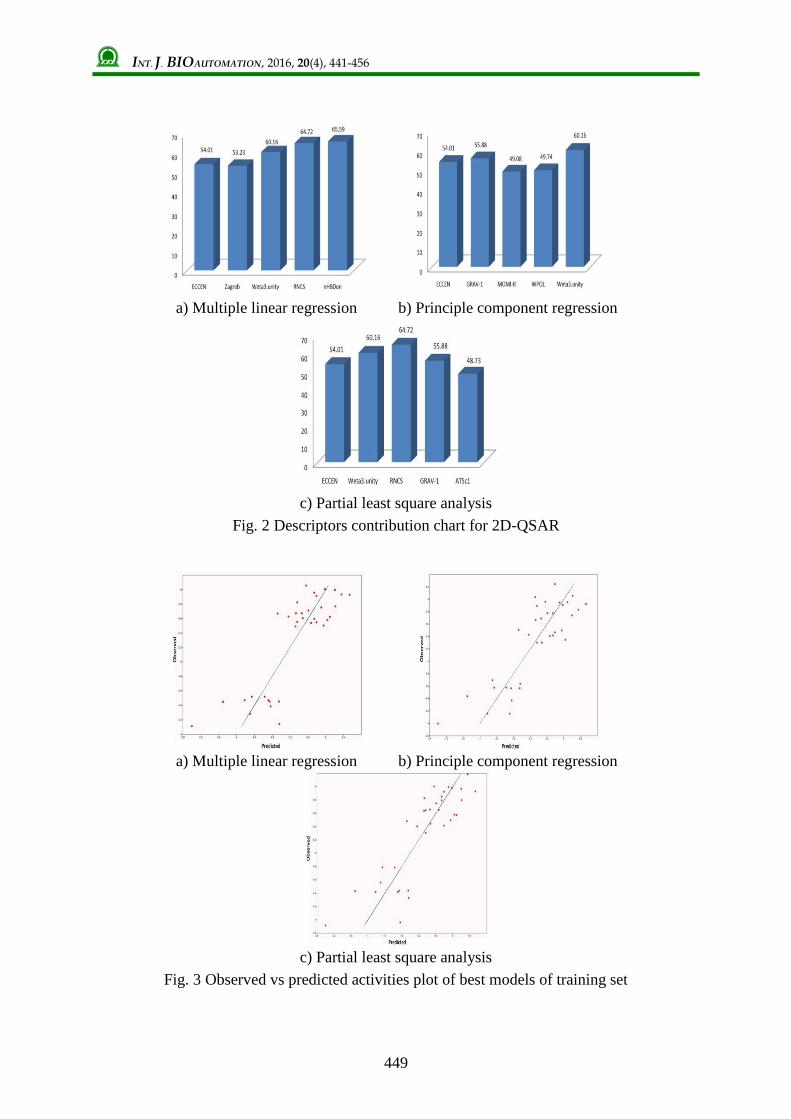
summarized in Table 5. The actual and predicted values of the best models of MLR, PCR and
PLS of the training set are given in Table 6 with the residual values and their respective plots
in Fig. 3.
INT. J. BIOAUTOMATION, 2016, 20(4), 441-456
449
a) Multiple linear regression b) Principle component regression
c) Partial least square analysis
Fig. 2 Descriptors contribution chart for 2D-QSAR
a) Multiple linear regression b) Principle component regression
c) Partial least square analysis
Fig. 3 Observed vs predicted activities plot of best models of training set
INT. J. BIOAUTOMATION, 2016, 20(4), 441-456
450
Table 5. Statistical results of 2D-QSAR equation generated by MLR, PCR and PLS methods
Sl. No. Statistical parameters Results
MLR PCR PLS
1. n 35 35 35
2. r 0.937 0.943 0.938
3. r2 0.8012 0.8104 0.8023
4. s 0.462 0.455 0.461
5. F 21.611 21.226 20.683
6. p < 0.0001 < 0.0001 < 0.0001
7. q2 0.657 0.625 0.648
8. Spress 0.563 0.582 0.568
9. SDEP 0.520 0.538 0.525
The MLR, PCR and PLS models were validated by the test (12 compounds) that are excluded
from the training set during the model development. Their residual values were given in
Table 7 and respective plots in Fig. 4. The plots of observed versus predicted activity of MLR,
PCR and PLS training set reveals the model accuracy with training set and the plots of test set
show the activity prediction of the external test set. The result from cross-validated analysis
was expressed in the terms of cross-validated squared correlation coefficient (q2).
The approximation of real predictive error of the model is given in the terms of PRESS, an
important cross-validation parameter. In general the coefficient of determination r2 (> 0.7);
cross-validated r2, q2 (> 0.5) F-test (higher is better) represents the models as a statistically
significant. The generated MLR, PCR and PLS equations shows the r2 of 0.8012, 0.8104 and
0.8023 respectively. The cross-validated squared coefficient q2 of 0.657 (MLR), 0.625 (PCR)
and 0.648 (PLS) suggests good correlation between the topological, constitutional and
geometrical descriptors and inhibitory activity.
3D-QSAR model generation and interpretation CoMFA method is used for 3D QSAR modelling to generate relationships between molecular
fields and inhibitory activity of AHL analogs. In general, despite of drug-receptor interactions,
the CoMFA analysis can give a statistically significant model. The training set comprising
of 35 compounds was used to generate the CoMFA model and validated by using test set
comprised of 12 compounds. The increase or decrease in the activities based on the variation in
the structural features of the different compounds were specified by the steric (S) and
electrostatic (E) descriptors accompanied by its number indicating its position in 3D MFA grid.
The criteria for the model selection are based on the q2 values and its internal predictive ability.
In CoMFA QSAR models, distorted grid spacing is observed as a change in the q2 values.
The model with the grid spacing of 2.0 Å was selected as the best model by cross-validating
value (q2) after LOO cross-validation. The statistical parameters of CoMFA analysis is
compiled in Table 8. A cross-validated value (q2) of 0.772 of the best model was obtained
through LOO analysis, which suggests that the model is a helpful tool for predicting inhibitory
activity of Salmonella SdiA binding inhibitors.
The 0.834 relative contributions of steric and 0.612 of electrostatic fields indicates that steric
field is more predominant. Further, the new q2 and r2 values of 0.772 and 0.869 respectively
was studied in a condition without electrostatic field. Basically the electrostatic contribution
was taken to be negligible. The contour plot generated as scalar products of coefficients and
standard deviation associated with each CoMFA column are shown in Fig. 5.

INT. J. BIOAUTOMATION, 2016, 20(4), 441-456
451
Table 6. Observed, predicted activities, and residual values of statistically significant models
obtained by MLR, PCR and PLS (2D-QSAR) of training set compounds
Sl.
No. Compound
Observed
pIC50
Predicted
pIC50 by
MLR
Residual
Predicted
pIC50 by
PCR
Residual
Predicted
pIC50 by
PLS
Residual
1. Comp 1 4.76 4.39 0.37 4.37 0.39 3.96 0.8
2. Comp 3 4.95 4.45 0.5 4.56 0.39 4.44 0.51
3. Comp 4 4.34 4.52 -0.18 4.58 -0.24 4.79 -0.45
4. Comp 6 4.3 4.29 0.01 4.70 -0.4 4.56 -0.26
5. Comp 7 4.74 4.45 0.29 4.56 0.18 4.44 0.3
6. Comp 8 3.699 4.45 -0.751 4.44 -0.741 4.43 -0.731
7. Comp 10 4.63 4.52 0.11 4.58 0.05 4.79 -0.16
8. Comp 11 4.96 4.14 0.82 4.64 0.32 4.33 0.63
9. Comp 13 3 4.11 -1.11 4.00 -1 3.92 -0.92
10. Comp 14 4.71 4.47 0.24 4.16 0.55 4.42 0.29
11. Comp 16 4.18 4.47 -0.29 4.16 0.02 4.42 -0.24
12. Comp 17 5.9 5.75 0.15 5.95 -0.05 5.99 -0.09
13. Comp 18 5.33 5.67 -0.34 5.67 -0.34 5.83 -0.5
14. Comp 20 6.21 5.77 0.44 6.05 0.16 5.80 0.41
15. Comp 21 6.09 5.62 0.47 5.95 0.14 5.57 0.52
16. Comp 22 6.036 5.58 0.456 5.34 0.696 5.58 0.456
17. Comp 24 5.32 5.49 -0.17 6.03 -0.71 5.64 -0.32
18. Comp 25 5.61 5.71 -0.1 5.78 -0.17 5.75 -0.14
19. Comp 27 5.74 5.96 -0.22 5.77 -0.03 5.85 -0.11
20. Comp 28 5.98 6.01 -0.03 5.91 0.07 5.98 0
21. Comp 29 5.36 5.82 -0.46 5.89 -0.53 5.64 -0.28
22. Comp 30 5.56 6.06 -0.5 5.96 -0.4 6.00 -0.44
23. Comp 31 6.2 6.00 0.2 5.74 0.46 5.97 0.23
24. Comp 33 6.35 5.93 0.42 5.83 0.52 6.19 0.16
25. Comp 34 5.79 5.91 -0.12 6.24 -0.45 5.93 -0.14
26. Comp 35 6.53 5.93 0.6 5.92 0.61 5.93 0.6
27. Comp 36 5.36 5.55 -0.19 5.30 0.06 5.31 0.05
28. Comp 38 5.16 5.63 -0.47 5.43 -0.27 5.41 -0.25
29. Comp 39 4.92 5.67 -0.75 5.51 -0.59 5.48 -0.56
30. Comp 40 5.48 5.61 -0.13 5.30 0.18 5.44 0.04
31. Comp 42 5.67 5.54 0.13 5.41 0.26 5.65 0.02
32. Comp 43 5.74 5.60 0.14 5.42 0.32 5.79 -0.05
33. Comp 44 5.95 5.50 0.45 5.50 0.45 5.50 0.45
34. Comp 46 5.79 5.55 0.24 5.47 0.32 5.42 0.37
35. Comp 47 5.46 5.67 -0.21 5.69 -0.23 5.66 -0.2
In Fig. 5a green contours indicate steric bulk groups needed to increase activity, while yellow
contours are unfavourable regions that can decrease the activity. In Fig. 5c blue contours
indicate electro positive charges correlating with activity and the H-bond donor regions and the
red contour indicates the relationship between negative charge and activity and also the H-bond
acceptor regions. The green and yellow colored contours represent steric interactions whereas
red and blue colored contours represent electrostatic interactions. The green colour indicates
the favourable region for bulky substituents and yellow showing unfavourable regions.

INT. J. BIOAUTOMATION, 2016, 20(4), 441-456
452
a) Multiple linear regression b) Principle component regression
c) Partial least square analysis
Fig. 4 Observed vs predicted activities plot of best models of test set
Table 7. Observed, predicted activities, and residual values of statistically significant models
obtained by MLR, PCR and PLS (2D-QSAR) of training set compounds
Sl.
No. Compound
Observed
pIC50
Predicted
pIC50 by
MLR
Residual
Predicted
pIC50 by
PCR
Residual
Predicted
pIC50 by
PLS
Residual
1. Comp 2 4.88 4.50 0.38 4.44 0.44 4.14 0.74
2. Comp 5 4.04 3.84 0.20 3.75 0.29 4.15 -0.11
3. Comp 9 4.24 4.34 -0.10 4.52 -0.28 4.78 -0.54
4. Comp 12 3.79 3.48 0.31 3.87 -0.08 3.63 0.16
5. Comp 15 3.00 3.79 -0.79 3.19 -0.19 3.30 -0.30
6. Comp 19 5.64 5.80 -0.16 5.43 0.21 5.44 0.20
7. Comp 23 5.07 5.16 -0.09 5.78 -0.71 5.15 -0.08
8. Comp 26 5.37 5.56 -0.19 5.57 -0.2 5.33 0.04
9. Comp 32 6.29 6.43 -0.14 6.29 0 6.35 -0.06
10. Comp 37 5.05 5.01 0.04 5.13 -0.08 5.13 -0.08
11. Comp 41 5.48 5.13 0.35 5.37 0.11 5.57 -0.09
12. Comp 45 6.67 6.49 0.18 6.18 0.49 6.55 0.12
Table 8. PLS statistics of CoMFA 3D-QSAR
Sl. No. PLS statistics CoMFA values
1. q2 (LOO cross-validated predicted power of model) 0.772
2. r2 (correlation coefficient squared of PLS analysis) 0.896
3. N (optimum number of components obtained from
cross-validated PLS analysis) 3
4. Standard error of estimate (SEE) 0.036
5. F-test value 1598.65
6. R2 prediction 0.368
7. Steric field contribution from CoMFA 0.834
8. Electrostatic field contribution from CoMFA 0.612

INT. J. BIOAUTOMATION, 2016, 20(4), 441-456
453
a) The steric contour map b) The steric contour map
with most active training compound
c) The electrostatic contour map d) The electrostatic contour map
with most active training compound
Fig. 5 CoMFA contour maps
The increase in positive charge and H-bond donor regions are favored in blue region while
increase in negative charge and H-bond acceptor regions are favored in red region. The steric
bulk substituents at green color regions are required to increase the inhibitory activity, while
the substitution of steric bulk substituents at yellow color regions are unfavourable for the
inhibitory activity. The electropositive charged groups enhancing inhibitory activity are shown
in blue colored regions, whereas the electronegative charged groups to improve the activity
with the presence of H-bond acceptors are shown in red regions. Therefore, electron
withdrawing groups like Br, Cl and F substitutions on lactone ring may significantly increase
the inhibition activity of halogen substituted AHLs against SdiA, a potent quorum sensor
responsible for Salmonella typhimurium pathogenecity.
Conclusion The 2D-QSAR results revealed that the most important descriptors for predicting the anti-
quorum sensing activity were the topological and geometrical descriptors. Further, this QSAR
study provides a significant approach to understand the structural and electrostatic requirements
of the ligand and its derivative for efficient binding within the SdiA receptor. The 3D-QSAR
studies revealed that the steric bulk groups present on the preferred location of analogs plays a
crucial role to improve the activity and also the possible role of vander waals and electrostatic
interactions. The CoMFA contour maps impart some important structural features-like
electronegative substituent (Br and Cl) on lactone ring favors the strong inhibitory activity.
These results are helpful to design more potent and selective SdiA, quorum sensor inhibitors
and also provide hints for the design of new quorum sensing inhibitors with structural diversity.

INT. J. BIOAUTOMATION, 2016, 20(4), 441-456
454
Acknowledgements The authors wish to thank S. Anusuya at Data Mining and Text Mining Research Group,
Department of Bioinformatics, Bharathiar University, Coimbatore, India for this invaluable
help and support.
References 1. Cramer R. D. III, D. E. Patterson, J. D. Bunce (2008). Comparative Molecular Field
Analysis (CoMFA): Effect of Shape on Binding Steroids to Carrier Proteins, J Am Chem
Soc, 110, 5959-5967.
2. Croux C., K. Joossens (2005). Influence of Observations on the Misclassification
Probability in Quadratic Discriminant Analysis, J Multivar Anal, 96, 348-403.
3. Curtis T., D. J. Wheeler (2006). Typhoid Fever, EMedicine Opthalmology,
http//emedicine.medscope.com/article/1204093-overview.
4. Defoirdt T., C. M. Miyamoto, T. K. Wood, E. A. Meighen, P. Sorgeloos, W. Verstraete,
P. Bossier (2007). The Natural Furanone (5Z)-4-bromo-5-(bromomethylene)-3-butyl-
2(5H)-furanone Disrupts Quorum Sensing-regulated Gene Expression in vibrio Harveyi by
Decreasing the DNA-binding Activity of the Transcriptional Regulator Protein luxR,
Environmental Microbiology, 9, 2486-2495.
5. Devillers J. (1996). Neuronal Network in QSAR and Drug Design, Academic Press,
London.
6. Discovery Studio Modeling Environment, Release 2.5 (2011). Accelrys Software Inc.,
San Diego.
7. Doucet J. P., F. Barbault, H. Xia, A. Panaye, B. Fan (2007). Nonlinear SVM Approaches
to QSPR/QSAR Studies and Drug Design, Currently Computationally Aided Drug
Designing 3, 263-289.
8. Eberhard A., A. L. Burlingame, C. Eberhard, G. L. Kenyon, H. K. Nealson,
N. J. Oppenheimer (1981). Structural Identification of Autoinducer of Photobacterium
fischeri Luciferase, Biochemistry, 20, 2444-2449.
9. Fuqua C., M. R. Parsek, E. P. Greenberg (2001). Regulation of Gene Expression by
Cell-to-cell Communication: Acyl-homoserine Lactone Quorum Sensing, Annual Review
Genetics, 5, 439-468.
10. Gasteiger J., M. Marsili (1980). Iterative Partial Equalization of Orbital Electronegativity
A Rapid Access to Atomic Charges, Tetrahedron, 36, 3219-3228.
11. Geske G. D., M. E. Mattmann, H. E. Blackwell (2008). Evaluation of a Focused Library of
N-Aryl L-homoserine Lactones Reveals a New Set of Potent Quorum Sensing Modulators,
Bioorganic & Medicinal Chemistry Letters, 18, 5978-5981.
12. Gnanendra S., S. Anusuya, J. Natarajan (2012). Molecular Modeling and Active Site
Analysis of SdiA Homolog, a Putative Quorum Sensor for Salmonella typhimurium
Pathogenecity Reveals Specific Binding Patterns of AHL Transcriptional Regulators, J Mol
Model, 18, 4709-4719.
13. Hokuldsson A. (1988). PLS Regression Methods, J Chemometrics, 2, 211-228.
14. http://crdd.osdd.net/descriptors.php (Web server for Molecular Descriptor Calculator,
Access date 01 December 2016).
15. Huberty C. J. (1994). Applied Discriminant Analysis, Willey, New York.
16. Hudson B. D., R. M. Hyde, E Rahr, J. Wood (1996). Parameter Based Methods for
Compounds Selection from Chemical Databases, Quant Struct Act Relat, 15, 285-289.
17. Ivanoff B. (1994). Typhoid Fever: Global Situation and WHO Recommendations,
Proceedings of the 2nd Asia Pacific Symposium on Typhoid Fever and other Salmonellosis,
Bangkok: Infectious Disease Association of Thailand, 39.

INT. J. BIOAUTOMATION, 2016, 20(4), 441-456
455
18. Jain S. V., M. Ghate, K. S. Bhadoriya, S. B. Bari, A. Chaudhari, J. S. Borse (2012).
2D, 3D-QSAR and Docking Studies of 1,2,3-thiadiazole Thioacetanilides Analogues as
Potent HIV-1 Non-nucleoside Reverse Transcriptase Inhibitors, Organic and Medicinal
Chemistry Letters, 2:22, doi: 10.1186/2191-2858-2-22.
19. Janssens J. C. A., H. Steenackers, S. Robijns, E. Gellens, J. Levin, H. Zhao, K. Hermans,
D. De Coster, T. L. Verhoeven, K. Marchal, J. Vanderleyden, D. E. De Vos,
S. C. J. De Keersmaecker (2008). Brominated Furanones Inhibit Biofilm Formation
by Salmonella enterica Serovar Typhimurium, Applied and Environmental Microbiology,
74, 6639-6648.
20. Khan A., H. Ahmed, N. Jahan, S. R. Ali, A. Amin, M. N. Morshed (2016). An in silico
Approach for Structural and Functional Annotation of Salmonella enterica Serovar
Typhimurium Hypothetical Protein R_27, Int J Bioautomation, 20(1), 5-18.
21. Kubyani H. (1994). Variable Selection in QSAR Studies: An Evolutionary Algorithm,
Quant Struct Act Relat, 13, 285-294.
22. Marketon M. M., M. R. Gronquist, A. Eberhard, J. E. Gonzalez (2002). Characterization of
the Sinorhizobium meliloti sinR/sinI Locus and the Production of Novel N-Acyl
Homoserine Lactones, J Bacteriol, 184, 5686-5695.
23. Michael B., J. N. Smith, S. Swift, F. Heffron, B. M. Ahmer (2001). SdiA of Salmonella
enterica is a LuxR Homolog that Detects Mixed Microbial Communities, J Bacteriol, 183,
5733-5742.
24. Pang T. Z., A. Bhutta, B. B. Finlay, M. Altwegg (1995). Typhoid Fever and Other
Salmonellosis: A Continuing Challenge, Trends Microbial, 3, 253-255.
25. Parsek M. R., E. P. Greenberg (2005). Sociomicrobiology, the Connections between
Quorum Sensing and Biofilms, Trends Microbiol, 13, 27-33.
26. Scherer C. A., S. I. Miller (2001). Molecular Pathogenesis of Salmonellae, In: Groisman E.
A. (Ed.), Principles of Bacterial Pathogenesis, Academic Publishers, New York, 266-333.
27. Singh S., R. K. Agarwal, C. S. Tiwari, H. Singh (2011). Antibiotic Resistance Pattern
among the Salmonella Isolated from Human, Animal and Meat in India, Tropical Animal
Health and Production, 44, 665-674.
28. Smith D., J. H. Wang, J. E. Swatton, P. Davenport, B. Price, H. Mikkelsen, H. Stickland,
K. Nishikawa, N. Gardio, D. R. Spring, M. Welch (2006). Variations on a Theme: Diverse
N-Acyl Homoserine Lactone-mediated Quorum Sensing Mechanisms in Gram-negative
Bacteria, Sci Prog, 89, 167-211.
29. Smith J. N., B. M. Ahmer (2003). Detection of Other Microbial Species by Salmonella:
Expression of the SdiA Regulon, J Bacteriol, 185, 1357-1366.
30. Steenackers H. P., J. Levin, J. C. Janssens, A. De Weerdt, J. Balzarini, J. Vanderleyden,
D. E. De Vos, C. S. De Keersmaecker (2010). Structure-activity Relationship of
Brominated 3-alkyl-5-methylene-2(5H)-furanones and Alkylmaleic Anhydrides as
Inhibitors of Salmonella Biofilm Formation and Quorum Sensing Regulated
Bioluminescence in vibrio Harveyi, Bioorganic & Medicinal Chemistry, 18, 5224-5233.
31. Tabassum R., M. Haseeb, S. Fazal (2016). Structure Prediction of Outer Membrane
Protease Protein of Salmonella typhimurium Using Computational Techniques,
Int J Bioautomation, 20(1), 31-42.
32. Vyas V. K., M. Ghate, H. Katariya (2011). 2D and 3D-QSAR Study on
4-anilinoquinozaline Derivatives as Potent Apoptosis Inducer and Efficacious Anticancer
Agent, Organic and Medicinal Chemistry Letters, 1-13.
33. Waters C. M., B. L. Bassler (2005). Quorum Sensing Cell-to-cell Communication in
Bacteria, Annual Review of Cell Developmental Biology, 21, 319-346.
34. Zhaoqi Y., S. Pinghua (2007). 3D-QSAR Study of Potent Inhibitors of Phosphodiesterase-
4 Using a CoMFA Approach, Int J Mol Sci, 8, 714-722.

INT. J. BIOAUTOMATION, 2016, 20(4), 441-456
456
Assist. Prof. Gnanendra Shumugam, Ph.D.
E-mail: [email protected]
Dr. G. Shanmugam was the Ph.D. research scholar in Department of
Bioinformatics, Bharathiar University, Coimbatore, India. He is
recently awarded with Ph.D. degree in Bioinformatics from the same
institute. He is currently working as an Assistant Professor at
Bioinformatics Division, Center for Research and Development,
Mahendra Educational Institutions, Tiruchengode, India.
His research interest includes structural bioinformatics and high
throughput bioinformatics data analysis.
Assist. Prof. Syed Mohamed, Ph.D.
E-mail: [email protected]
Dr. A. Syed Mohamed is an Assistant Professor in the Department
of Chemistry in Sadakathullah Appa College, Tirunelveli, India
since 2001. He completed two post graduate degrees, M.Sc.
Chemistry and M.Sc. Environmental Science. He also qualified in
CSIR-NET & GATE examination. He completed Ph.D. in the field
of theoretical & computational chemistry from University of
Madras. He has 15 years of teaching experience and 8 years research
experience. His research interest includes computational chemistry,
molecular modeling & drug design. At present is serving as Head,
Department of Molecular Modeling & Drug Design. He is also
serving as Coordinator of Career Oriented Program (COP) in water
and soil analysis.
Prof. Jeyakumar Natarajan, Ph.D.
E-mail: [email protected]
Dr. J. Natarajan is a Professor in Department of Bioinformatics,
Bharathiar University, Coimbatore, India. He obtained his Ph.D.
from University of Ulster, UK and post-doctorial training from
Northwestern Medical School, Northwestern University, Chicago,
USA. He holds research experience from reputed research institutes
like Jawaharlal Nehru University, New Delhi, and Madurai Kamaraj
University, Madurai. His area of research interest includes data
mining and text mining of biomedical data. He is currently working
on various research problems in this domain.