2d fibre reinforced concrete (frc) elements: from … material (1) fibre-reinforced concrete (frc)...
TRANSCRIPT
2D Fibre Reinforced Concrete (FRC) elements:
from material to structural design
Paolo Martinelli 📧 [email protected]
OUTLINE
• INTRODUCTION
• FRC CLASSIFICATION
• NOVEL INDIRECT TENSILE TESTS
• THE REDISTRIBUTION FACTOR
• REFERENCE TETS
• RESULTS AND DISCUSSION
• AN EXAMPLE OF FRC FLAT SLAB REALIZED IN ITALY
• CONCLUSIONS

FRC MATERIAL
(1) Fibre-Reinforced Concrete (FRC) is a composite material characterized by a cement matrix and discrete fibres (discontinuous). The matrix is made of either concrete or mortar. Fibres can be made of steel, polymers, carbon, glass or natural materials.

STRUCTURAL AND OTHER USES OF FRC IN MODEL CODE 2010
(2) Fibre materials with a Young’s Modulus which is significantly affected by time and/or thermo-hygrometrical phenomenon are not covered in Model Code for the structural use. (3) Mixtures of different types and/or sizes of fibres can also be used (called hybrid fibre reinforced concrete). (4) FRC for structural applications means the use of design constitutive laws to consider the post-cracking residual strength provided by fibre reinforcement. Other cases, like early age crack-control or fire resistance, are considered non structural use of FRC. (5) For structural use, a minimum mechanical performance of FRC must be guaranteed. (6) Fibres can be used to improve behaviour in SLS since they can reduce crack spacing and crack width, thereby improving durability.

STRUCTURAL APPLICATIONS
• industrial pavements
• harbour and airport pavements
• shotcrete linings
• tunnel segments
• precast sewer pipes
• retaining structures
• foundation slabs
• slabs on piles
• flat slabs (limited)

BEHAVIOUR IN COMPRESSION

TENSILE AND FLEXURAL BEHAVIOUR
0.00 0.10 0.20displacement w (mm)
0.0
1.0
2.0
3.0
4.0
5.0
ave
rag
e t
en
sio
n
t (M
Pa
)
zoom w = 0.20 mm
TRA0 med
TRA4 med
TRA8 med
0.00 2.50 5.00deflection f (mm)
0.0
4.0
8.0
12.0
loa
d P
(K
N)
zoom w = 5.00 mm
FLE0 med
FLE4 med
FLE8 med
P [kN]
N
[mm]
w[mm]
w We use residual tensile strength after cracking!
Vf [%]
0.0 0.4
0.8
0.8
0.4
0.0
0 5 1 0
6
3
0
P [kN]
P
30
60
0.8
0.0
[mm]
Vf [%]
Vf [%]

FRC Classification
A unique standard for both the behaviors
P
P P
PPcr crP
crack formation
crack
crack formation
localization
Depending on the fibre content the stable crack propagation progressively grows …
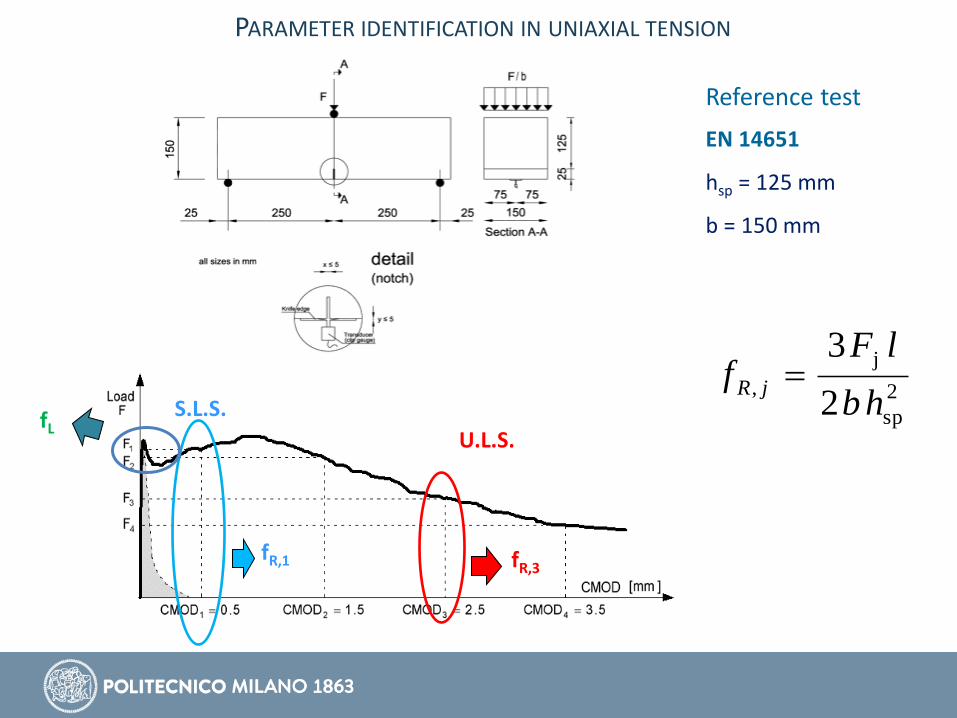
2
sp
j
,2
3
hb
lFf jR
EN 14651
hsp = 125 mm
b = 150 mm
fR,1 fR,3
U.L.S.
Reference test
fL S.L.S.
PARAMETER IDENTIFICATION IN UNIAXIAL TENSION

Classification according to Model Code 2010
Number / letter
Ex: 3c
a: 0.5< fR3,k/fR1,k < 0.7 b: 0.7 < fR3,k/fR1,k < 0.9 c: 0.9 < fR3,k/fR1,k < 1.1 d: 1.1 < fR3,k/fR1,k < 1.3 e: fR3,k/fR1,k >1.3
STANDARD TEST FOR CLASSIFICATION

CLASSIFICATION ACCORDING TO MODEL CODE 2010

(5) Fibre reinforcement can substitute (also partially) conventional reinforcement at ultimate limit state if the following relationships are fulfilled: fR1k/fLk > 0.4; fR3k/fR1k > 0.5
CMOD (mm)
N
fLK
0.5 2.5 0
fR1k fR3k
MINIMUM REQUIREMENT ACCORDING TO PERFORMANCE BASED DESIGN

mix-constituent Dosage (kg/m3) fresh state performance
Cement type 42.5 472 Slump flow diameter (mm) 680 (t = t0)
650 (t = t0 + 1h)
Fly ash 45 T50 (sec) 2.8
Water 216 (w/b = 0.42)
superplasticizer 6 (lt/m3)
V-funnel time TV (sec) 4.7 (t = t0)
8.0 (t = t0 + 1h)
Sand 0-4 mm 850 Cube compressive strength (N/mm2)
Gravel 4-8 mm 886 7 days 56.2
Steel fibers 65/35 50 28 days 71.0
13 beams cast: 9 from the center, 4 from the side!
EFFECT OF CASTING

0 1 2 3 4 5
CMOD (mm)
0
4
8
12
N (
N/m
m2)
center-cast specimens
side-cast specimens
0.5 mm
fR1
fR1k = 5 N/mm2
fR3
fR3k = 4.1 N/mm2
a
b
c
d
e
fR3k = 0.5 fR1k
fR3k = 0.7 fR1k
fR3k = 0.9 fR1k
fR3k = 1.1 fR1k
fR3k = 1.3 fR1k
2.5 mm
FRC
class 5b
EFFECT OF CASTING

fL = 6.3 fL = 5.5
fR1 = 8.3 fR1 = 6.0
fR3 = 7.2 fR3 = 4.9
nf = 280 nf = 209
EFFECT OF CASTING

fFtu = fR3/3
0)2.05.0( 13
3
RRFts
u
FtsFtu fffCMOD
wff
145.0 RFts ff
CONSTITUTIVE MODELS FOR UNIAXIAL TENSION

NON-STANDARDIZED TEST DOUBLE EDGE WEDGE SPLITTING TEST (DEWS) – POLITECNICO DI MILANO
INDIRECT TENSILE TEST
Compression of a cylindrical specimen in FRC,
notched on the side surface and loaded through
two steel cylinders. Crack opening measured via
two clip gauges.
𝐹𝑆𝑃 = 𝑃 ∙cos 𝜗 − 𝜇 sin 𝜗
sin 𝜗 + 𝜇 cos 𝜗
𝜎𝑁 =𝐹𝑆𝑃
𝑡 ℎ𝑠𝑝
Pure tensile stress compared to the Brazilian test
STEEL CYLINDER
CLIP GAUGE

NON-STANDARDIZED TEST DEWS TEST - STAGES
STAGE 1 Linear elastic behavior
STAGE 2 Cracking of the specimen
STAGE 3 Pull-out and activation of
the residual strength

NON-STANDARDIZED TEST BARCELONA TEST – UNIVERSIDAD POLITECNICA DE CATALUNYA
INDIRECT TENSILE TEST
Compression of a cylindrical specimen in FRC through
two steel punches in contact with the upper and
bottom faces of the specimen. A strain gauge to
measure the chain crack width.

NON-STANDARDIZED TEST BARCELONA TEST - STAGES
STAGE 1 Linear elastic behavior
STAGE 2 Cracking of the specimen
and cone formation
STAGE 3 Sinking of the cone and the mobilization of the
residual strength

The cylindrical specimens tested with DEWS and BCN tests were directly cored from the shallow beams
following different directions in order to have a complete representation of the beam.
Cylindrical cores cut in
specimens with dimensions of
100Ø100mm (BCN) and
100Ø50mm (DEWS)
BCN 56 tested specimens
DEWS 112 tested specimens
SHALLOW BEAM
Cylindrical core
SPECIMEN
48 cylindrical cores extracted
from 4 shallow beams
SHALLOW BEAM
DEWS AND BCN SPECIMENS

fcftl [MPa] fR0.5 [MPa] fR1.5 [MPa] fR2.5 [MPa]
Average tensile stress DEWS
2.92 0.82 0.62 0.49
Average tensile stress BCN
2.86 1.17 0.57 0.44
Percentage variation
2 % 29 % 8 % 10 %
• Peak points coincident
• Very similar trends in the pull-out
region
• At 0.5 mm, percentage difference of
~30%
BCN 56 tested specimens
DEWS 112 tested specimens
DEWS AND BCN COMPARISON RESPONSES

BCN TEST DEWS TEST
fcftl [MPa] fR0.5 [MPa] fR1.5 [MPa] fR2.5 [MPa]
COV – BCN 7 % 26 % 35 % 34 %
COV - DEWS 19 % 69 % 72 % 76 %
BCN DEWS
• COVBCN<< COVDEWS
DEWS & BCN MECHANICAL COMPARISON MEAND AND COV

DIFFERENT FRACTURED AREAS
ABCN = 42x3= 126 cm2
ADEWS = 5x6= 30 cm2
𝐴𝐵𝐶𝑁
𝐴𝐷𝐸𝑊𝑆≅ 4
DEWS & BCN MECHANICAL COMPARISON FRACTURED AREA

• Coring of the shallow beams in z direction
• Cored cylinders were subdivided into ‘’top’’ and
‘’bottom’’ specimens
• In total 64 and 32 specimens were obtained
from DEWS and BCN, respectively
In the phase of the fresh concrete, tendency of the fibers to move, by gravitational effect, to the lower regions of the formwork. Influenced by vibrating concrete and addition of superplasticizers.
DEWS & BCN MECHANICAL COMPARISON FIBER SEGREGATION
Inhomogeneities in the fiber concentrations

DEWS & BCN MECHANICAL COMPARISON FIBER SEGREGATION
BCN tests DEWS tests
fR0.5 [MPa] fR1.5 [MPa] fR2.5 [MPa]
BOTTOM DEWS 1.01 0.81 0.67
TOP DEWS 0.73 0.63 0.59
Percentage variation
28 % 22 % 12 %
fR0.5 [MPa] fR1.5 [MPa] fR2.5 [MPa]
BOTTOM BCN 1.23 0.62 0.44
TOP BCN 0.85 0.43 0.33
Percentage variation
30 % 30 % 25 %
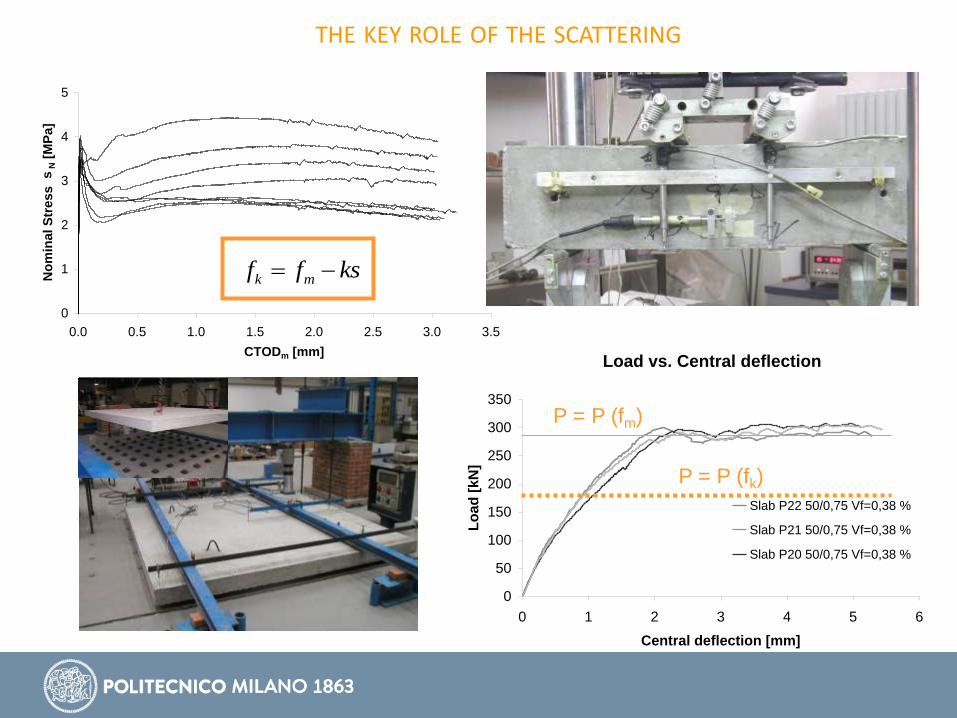
k mf f ks
0
1
2
3
4
5
0.0 0.5 1.0 1.5 2.0 2.5 3.0 3.5
CTODm [mm]
No
min
al S
tre
ss
sN [
MP
a]
Load vs. Central deflection
0
50
100
150
200
250
300
350
0 1 2 3 4 5 6
Central deflection [mm]
Lo
ad
[k
N]
Slab P22 50/0,75 Vf=0,38 %
Slab P21 50/0,75 Vf=0,38 %
Slab P20 50/0,75 Vf=0,38 %
P = P (fm)
P = P (fk)
THE KEY ROLE OF THE SCATTERING

FdRdRd fPKP
4.1
,
,
max,
max,
kFtu
mFtu
m
kMC
f
f
P
PK
Rd
The factor KRd, depends:
Model Code definition:
Resistant load amplified for structures able to significantly redistribute the applied
load:
2 5
V KRd = KRd (V/V0 , Pmax/Pcr)
V0
DEFINITION OF REDISTRIBUTION FACTOR (KRd)
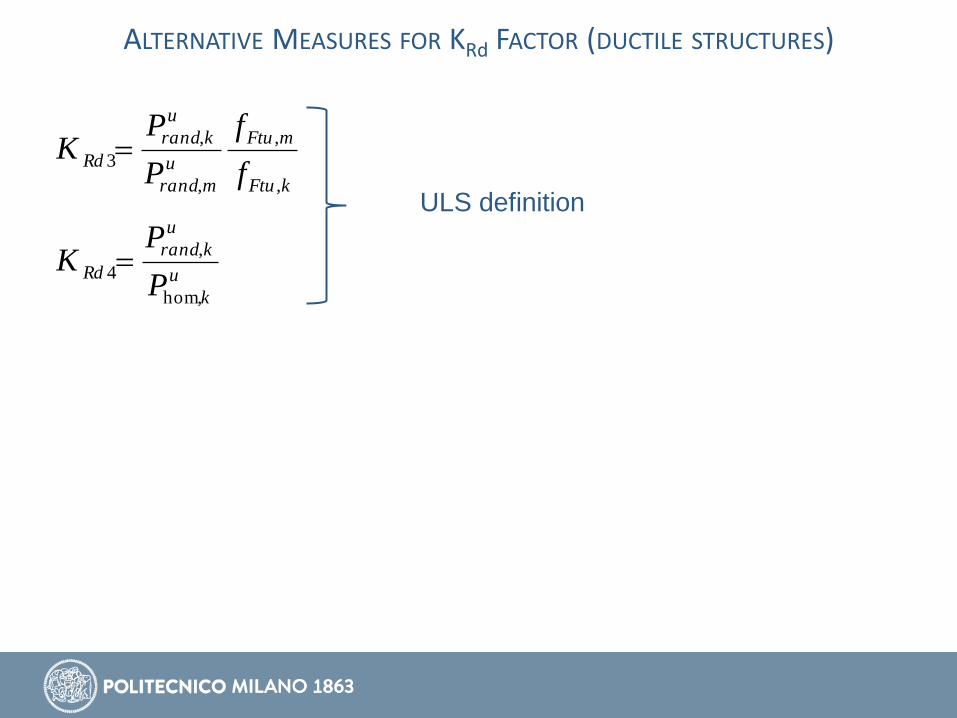
kFtu
mFtu
u
mrand
u
krand
Rdf
f
P
PK
,
,
,
,
3
u
k
u
krand
RdP
PK
hom,
,
4
ULS definition
ALTERNATIVE MEASURES FOR KRd FACTOR (DUCTILE STRUCTURES)

Effects of structural redundancy on the topological heterogeneities of FRC:
48.1,1,1
0.1112
1.0-1,5.0
10
1010
kV
V
V
V
V
V
u
uu
CNR DT 204/2006
fk = fm - k s
=
halV csu ,2.11
hallV cscs
u 21
1
,4.1
halV cs
u 2,3.11
Redistribution resources
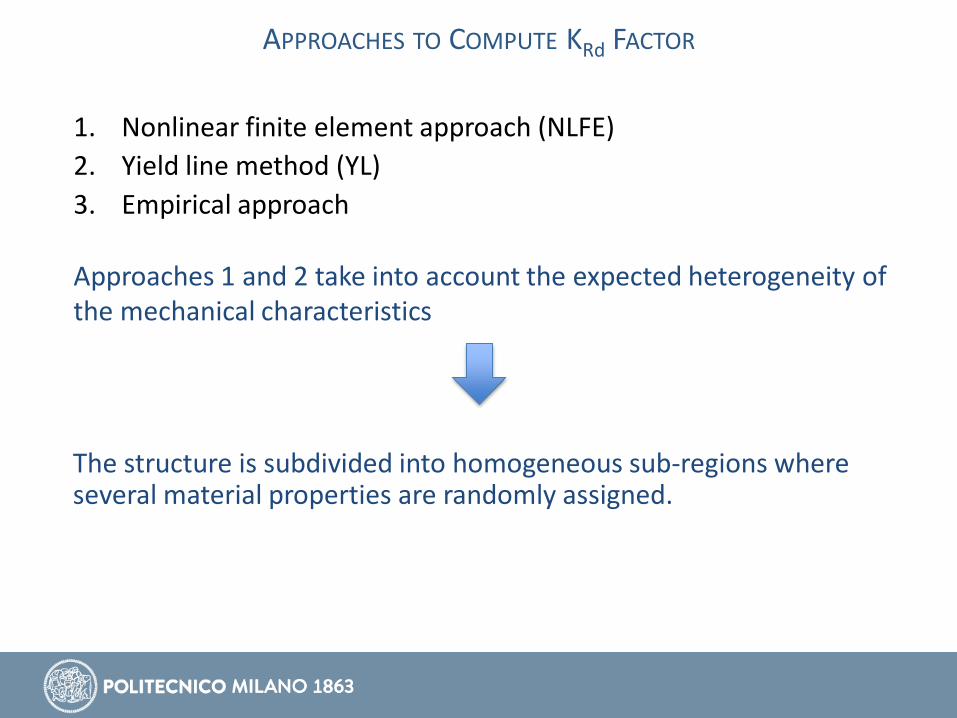
1. Nonlinear finite element approach (NLFE)
2. Yield line method (YL)
3. Empirical approach
Approaches 1 and 2 take into account the expected heterogeneity of the mechanical characteristics
The structure is subdivided into homogeneous sub-regions where several material properties are randomly assigned.
APPROACHES TO COMPUTE KRd FACTOR

• Only the parameters that identify the post-peak tensile constitutive law
(fR1, and fR3 or feq1 and feq2) are assumed as stochastic variables, whereas
the other quantities are assumed to be deterministic.
• A normal distribution of the stochastic variables is considered; mean and
standard deviation are calculated using bending test results on standard
notched specimens.
• The stochastic variables are used to build a set of linear elastic-
bilinear(linear) softening models, randomly assigned to the slab sub-
regions.
NLFE AND YL APPROACHES

1 XX FxxFxXP
1
, 1
2
2*1
n
XXS
n
XX
n
i i
X
n
i i
X
XmXU
Fractile definition x:
Normal distribution
• Characteristic value can be determined by
11
UXXU
X
X FmxFmx
• Mean mX and variance 2X are not known. Only their estimates can be
obtained by the samples.
[Approach proposed by Zupan et al. (2007)]
STATISTICAL APPROACH IN STRUCTURAL DESIGN

1ˆ, xXP
*
,ˆ
XSXX
• The approach adopted controls the probability of the characteristic value
estimate (confidence interval).
• Once prescribed the confidence interval , the characteristic value
estimate can be determined from:
• The estimate of the characteristic value is:
,X̂
• The characteristic value is distributed by non-central t distribution only in
the case of normally distributed X
n 3 4 5 7 10 20 50 100
-3.125 -2.681 -2.463 -2.250 -2.104 -1.932 -1.811 -1.758
STATISTICAL APPROACH IN STRUCTURAL DESIGN

Models construction by considering heterogeneous materials: discrete vs continuous
approach
Example of CDF discretization with a Heaviside step function: steps introduced at
percentiles = 0.025, 0.15, 0.5, 0.85, 0.975 5 material combinations
NLFE AND YL APPROACHES

Example of slab subdivision for the random heterogeneous material assignation
NLFE APPROACH

• NLFE: automatically includes both fractured volume involved in the failure process and the stability of the system
• YL: The ultimate moment per unit width mu is a function of the stochastic variables, as consequence the ultimate load Pu results to be a random quantity.
• YL is able to take into account only the fractured volume involved in the failure process and not the stability of the system for the evaluation of KRd.
• YL: can be used only if the bending response of the cross-section is ductile.
NLFE AND YL APPROACHES

7.15.01 f
ct
f
G AK
EMPIRICAL APPROACH

REFERENCE TESTS – GEOMETRY (i)

REFERENCE TESTS – GEOMETRY (ii)
Slabs on ground
[Tests carried out by Sorelli et al.
(2006)]
Elevated slab
[Tests carried out by
Parmentier et al. (2014)]

REFERENCE TESTS – MATERIALS
Mix design Component Dosage (kg/m3)
Slab on ground Elevated slab
Cement (type 1) 345 (42.5R) 200 (32.5N)
Cement (type 2) - 200 (52.5R)
Aggregate 1 621 (0-4 mm) 850 (0-4 mm)
Aggregate 2 450 (4-15 mm) 400 (4-8 mm)
Aggregate 3 450 (8-15 mm) 440 (6-14 mm)
Water 190 215
Hooked end fibres 30 70
Plasticizer 3.8 1.6
Slab on ground Elevated slab
df (mm) 0.6 1.0
lf (mm) 30 60
Aspect ratio (–) 50 60
Tensile strength (MPa) 1100 1450
Type Hooked–end Hooked–end
Steel fiber properties

Slab on ground* Elevated slab
(Casting C2)
Specimen # 7 11
fL,m [MPa] 4.06 (15.6%) 4.54 (11.0%)
fR1,m [MPa] 3.07 (19.8%) 6.39 (24.9%)
fR3,m [MPa] 2.73 (20.5%) 6.37 (20.3%)
fR1,m/fR1,k 1.70 1.89
fR3,m/fR3,k 1.74 1.62
fFts,m/fFts,k 1.70 1.89
fFtu,m/fFtu,k 1.78 1.48
kn 2.08 1.89
Class “1.5c” “3e”
SLAB FRACTURE PROPERTIES

Slabs on ground Elevated slab
EXPERIMENTAL CRACK PATTERNS

RESULTS AND DISCUSSION (i)
• NLFE: provide a P- (or P-COD) curves Pu,rand is then extracted
• YL: provide directly (and only) Pu,rand
Slab on ground numerical response for homogeneous and heterogeneous random material

RESULTS AND DISCUSSION (ii)
a) slab on ground (SoG) case with yield line method (YL);
b) slab on ground case with nonlinear finite element (NLFE);
c) elevated slab case with YL method
Material probability density function and ultimate load histogram

RESULTS AND DISCUSSION (iii)
Redistribution factors KRd
Slab on ground Elevated slab
KRd3 YL 1.66 (1.4) 1.47 (1.4)
NLFE 1.69 (1.4) -
KRd4 YL 1.58 (1.4) 1.57 (1.4)
NLFE 1.48 (1.4) -
KfG 1.45 1.7
kFtu
mFtu
u
mrand
u
krand
Rdf
f
P
PK
,
,
,
,
3
u
k
u
krand
RdP
PK
hom,
,
4

EXPERIMENTAL CAMPAIGN ON KRD FACTOR
Phase 1 (Rep. 2)- 20 slabs
Phase 2 (Rep. 12)
12φ12 in each direction

PRELIMINARY RESULTS
fct-fl = 5.24 (6%) fR1k = 4.25
(20%)
fR2k = 4.73 (22%) fR3k = 3.45
(17%) fR4k = 2.31 (20%)
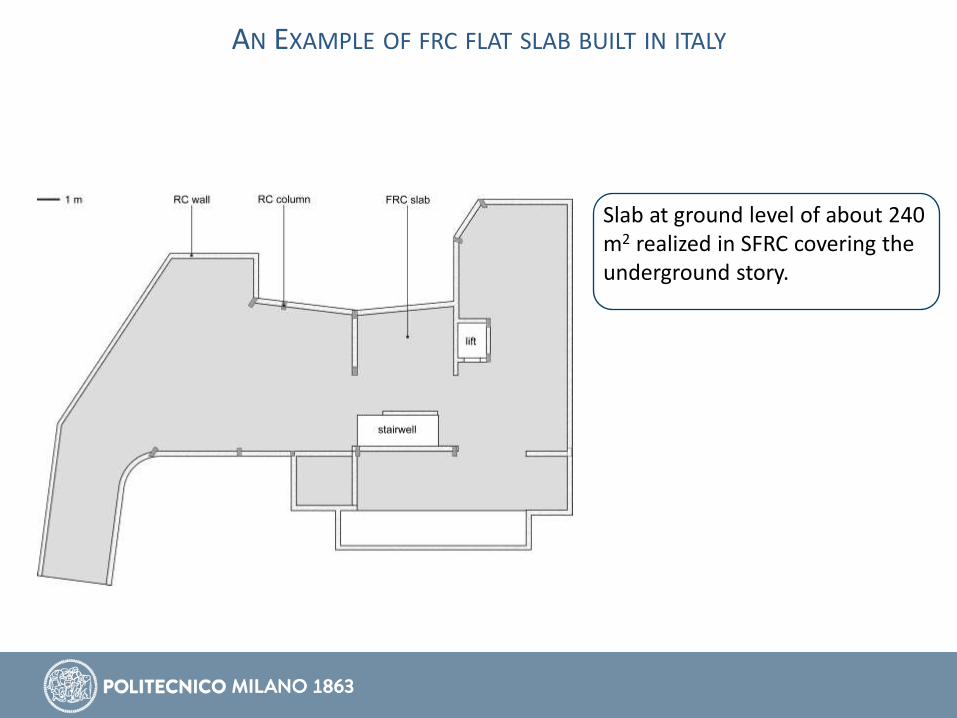
Slab at ground level of about 240 m2 realized in SFRC covering the underground story.
AN EXAMPLE OF FRC FLAT SLAB BUILT IN ITALY

SFRC particularly convenient because allows significant optimizations of the reinforcement in terms
of casting simplification, performance increase (like depth reduction), quality of the casting and
durability due to crack opening control.
In conjunction with steel fibers, traditional steel high bond
bars can be introduced in the critical regions to enhance the robustness of the structures and to activate
suitable ductile failure mechanisms at the onset of collapse.
AN EXAMPLE OF FRC FLAT SLAB BUILT IN ITALY

Fibers
Due to their random distribution, they act in
every direction inside the plate and this means
that they are able to limit the occurrence of
cracks or to limit the opening regardless of the
area in which the crack propagates and by its
orientation. Furthermore, even the fibers non-
orthogonal to the crack plane are able to limit
the occurrence of the crack.
Conventional steel rebar
The reinforcing bars are valuable in
regions where the stress concentrations
are elevated, localized and well oriented.
However, they are arranged according to
precise directions (they may not limit the
occurrence of cracks parallel to their
direction) and are arranged with a
discrete and not continuous spacing.
DESIGN PHILOSOPHY

SFRC mix design
Component Dosage (kg/m3)
Preliminary mix Final mix
Cement type CEM II
/A–LL 42.5R 340 370
Filler - 150
Gravel 565 409
Washed sand 1088 993
Sifted sand 184 244
Water 170 185
Super-plasticizer 2.72 5.6
Straight steel fiber 30 35
MATERIAL CHARACTERISTICS
• Check of the fiber content at the fresh state from 7 different truck mixers: 33 kg/m3 - COV = 20.7% (design
value 35 kg/m3)
• = 2358 kg/m3
• Rcm = 55.6 MPa on 7 cubes

Three-point bending test results
Final cast
MATERIAL CHARACTERISTICS
fL fR1 fR2 fR3 fR4
[MPa] [MPa] [MPa] [MPa] [MPa]
mean (mx) 5.518 4.784 4.629 4.063 3.649
st. dev. (sx) 0.300 1.018 1.013 0.777 0.668
fk (normal) 4.865 2.568 2.426 2.373 2.194
my 1.707 1.547 1.512 1.385 1.279
sy 0.056 0.208 0.223 0.205 0.196
fk (log–normal) 4.876 2.987 2.790 2.557 2.348
Final cast
The material was classified as “2.5c”
Three-point bending test results:
nominal strengths

Reinforcement disposal in the
elevated slab (10@30-35 cm)
Preliminary casting of the lift-core
compartment foundation base
EXECUTION MODALITIES
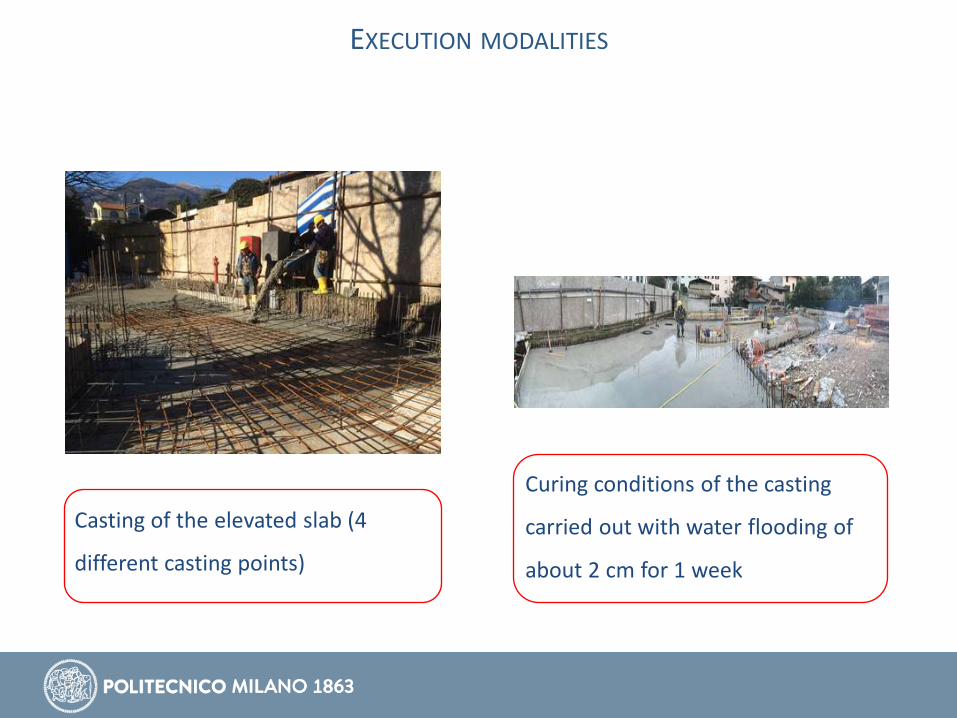
Casting of the elevated slab (4
different casting points)
Curing conditions of the casting
carried out with water flooding of
about 2 cm for 1 week
EXECUTION MODALITIES

Intrados (left) and extrados (below)
views of the SFRC elevated slab
EXECUTION MODALITIES

• Barcelona test confirms its reliability for production control and DEWS test
appears very effective to evaluate the effects of fiber orientation.
• The indirect tensile tests (BCN and DEWS tests) show similar results
(differences <10%) when the cracks are stabilized.
• Operational aspects: the BCN test has a rapid execution time (about 30 min.
for test). DEWS test is characterized by a slower procedure (about 1 hour
per test). RILEM test is similar to the BCN test for time execution but adopts
unwieldy specimens.
CONCLUSIONS (i)

• The load bearing capacity of a redundant structure is significantly higher
than that computable by means of the characteristic parameters obtained
with a notched bending test on a small specimen as that suggested by
Standard CEN. This experimental evidence can be justified by the
heterogeneity neglected in the computational approach.
• The approaches investigated confirmed the physical intuition that a FRC
redundant structure has a bearing capacity associated to the average
strength rather than to the characteristic one.
• Different proposals according to Model Code 2010 suggest that it is
necessary to take into account both the volume of fracture involved in the
collapse and the redistribution ability of the structure.
CONCLUSIONS (ii)
• Some variations could be expected with a 3D heterogeneous analysis.
• Although the simplified proposal of considering only the volume involved
in the failure process is an attracting solution, the dependency on the
redistribution ability appears also a not negligible parameter.
• A suitable calibration taking into account several boundary conditions and
reinforcement detailing of a redundant structure could be very helpful to
verify the reliability of the proposed approaches.
• The simple cases analysed highlight that the limit selected as upper bound
in the Model Code should be a choice in favour of safety.
CONCLUSIONS (iii)

• A 240 m2 SFRC elevated slab was designed and built in a two–stories family
house in Erba (first example in Italy). The experience has demonstrated
that the use of SFRC can simplify and keep faster the executive
procedures.
• Cost reduction of about 15%.
• Not negligible segregation effect was detected by coring the shallow
beams, and looking the results of two simplified tests based on indirect
tension (Barcelona test and DEWS test).
CONCLUSIONS (iv)

THANK YOU FOR YOUR ATTENTION!