2h 2018 ciscfo - deloitte us · 2020-05-15 · among manufacturing industry’s cfos increased...
TRANSCRIPT

#CISCFO
Deloitte CFO Survey of the Leading Companies in Russia2H 2018 Deloitte CIS Research Center

Overview 03
Key findings 04
Russia in figures 07
Outlook for leading companies in Russia 08
Uncertainty and risks 12
Business development strategies in 2018 18
Business drivers and barriers 22
Sources of business financing 23
Legal Department 24
HR strategies 27
Blockchain 28
Insights into CFO social media personality profiles 30
CFO expectations and personal experience 32
Our respondents 33
Contacts 34
Deloitte CFO Survey of the Leading Companies in Russia
03
OverviewWe are pleased to present the finding of the annual Deloitte CIS CFO Survey of Russia’s leading companies.
This is the eighth time we have conducted this survey in Russia as part of our global research efforts. The opinions provided by the respondents allowed us to identify major concerns, key drivers, and development priorities for the Russian economy, and to perform a comparative analysis of existing trends.
The survey was held in September 2018, with 80 experts providing their responses.This report was prepared by Deloitte CIS Research Centre.
Survey goals and objectives
Survey goalPerform a comprehensive analysis of Russian business trends
Survey objectives
• Describe business outlook for Russia in 2018
• Provide forecasts for key financial metrics in 2018
• Evaluate the level of uncertainty and key risks of doing business in Russia
• Identify key business strategies and areas for change
• Identify business development drivers and barriers faced by businesses in Russia
• Define the structure of the legal service
• Evaluate awareness of blockchain technology principles
• Analyze HR strategies of Russian companies
Research methodology
Target audienceCFOs of the leading companies across key Russian industries
Research methodologyData was collected through an online questionnaire and personal interviews.
Our comprehensive analysis was based on the following approaches:1. Identification and examination
of general market trends;2. Comparative analysis
of data in meaningful subgroups (analysis of data differing significantly by subgroup and/or from the overall population);
3. Multivariate data analysis (an in-depth analysis of the results to identify hidden differences and incorporate the findings).
SamplingThe Survey was performed on a random sample of respondents from a closed highly specialized population. The final sample included 80 respondents who were segregated into several industry groups.
Definitions
Industries
Consumer business
E&R (Energy and resources)
Manufacturing
Technology, media and telecommunications
Financial services and insurance
Life sciences and health care

Deloitte CFO Survey of the Leading Companies in Russia
04
Key findings
In 2H 2018, the expectations of CFOs regarding financial prospects of their companies became more pessimistic.
• 37 percent of CFOs negatively assess the situation. The share of pessimistic answers increased by 28 p.p.
The confidence in growth of operating costs increased by 8 points compared to the spring of 2018 while expectations of revenue and operating profit growth pace decreased by 8 points and 13 points, respectively.
• The majority of CFOs (69 percent) do not expect cost of capital to change much for their companies.
• 56 percent of the respondents do not anticipate significant changes in the number of employees in their companies.
• Two-thirds of CFOs (63 percent) expect salaries to grow. However, the share of such respondents decreased by 10 p.p. in the past six months.
Fifty-seven percent of the companies stated that they had decided to hike prices by the average of 7 percent in 1H 2018.
• The prices were raised mainly by manufacturing companies (92 percent); they have also stated their intention to increase prices again by end-2018 more often than others (by 14 p.p.).
According to 45 percent of the respondents, the demand for end products of their companies did not change in 1H 2018. Fourty-one percent of the companies indicated that demand grew (by 17 percent), while 14 percent stated that demand fell (by 11 percent).
• Consumer companies tend to forecast a reduction in demand twice as often, while life science and health care companies anticipate a growth in demand more frequently (23 p.p. above the average).
Financial climate in 2018
The net level of uncertainty (0.34) rose 36 point in the past six months reaching the positive zone of the balance. The reason is that the respondents believe that the current economic and political situation is rather uncertain.
• The share of CFOs citing the high degree of uncertainty in the market increased by 19 p.p.
Risk appetite decreased insignificantly due to higher uncertainty around adoption of strategic decisions (+7 points) and reached -0.56.
Risk factors with the most negative impact on business in Russia in 2018:
• Stagnation in the Russian economy
• The weakening of the ruble
• Weaker domestic demand
• Increased competition in the market
• Decrease in cash flow
• New trade barriers/protectionism
• Geopolitical risks
• Decrease in core business revenue
• Rising barriers to entry into new markets
• Lower consumer interest in new products
• Low transparency
Priority business strategies to recover the market position in Russia in 2018:
• Ongoing cost control
• Cost cutting
• Business development through organic growth
Seventy-one percent of the surveyed companies cooperate with foreign partners. However, the share of such respondents decreased by 7 p.p. in the last six months.
• The share of companies willing to expand the geography of business ties decreased by 5 p.p.
Uncertainties, risks and development strategies in 2018

Deloitte CFO Survey of the Leading Companies in Russia
05
Business drivers:
• Production costs
• Digitalization
Barriers for business:
• Focus on core business
Attractive financing sources:
• Internal sources
• Borrowing from Russian banks
Business drivers and barriers
Search for employees with specific job experience is the most important and complicated part. This was indicated by two-thirds (67 percent) of the respondents.
• The respondents cited education level as the least important skill implying that there is a sufficient number of candidates in the market that have required education level but lack practical skills.
According to CFOs, the most attractive strategy that can mitigate the lack of competences in the market is personnel training (0.76).
• Other popular strategies mentioned by respondents include implementing/increasing automation (0.69) and creating appealing work environment (0.62).
HR strategies of Russian companies
Seventy-four percent of the surveyed companies have a dedicated legal department (or in-house specialists) responsible for legal matters.
Eight employees – the average number of employees in a legal department.
• The key function of the in-house legal is to verify contracts and develop contract templates.
• 78 percent of companies with in-house legal departments handling legal matters use third-party legal services.
• Companies tend to outsource legal functions in order to achieve specific objectives that are otherwise difficult to complete due to their technical complexity (45 percent).
• Only 21 percent of the companies apply automation technologies and implement robotization in in-house legal departments.
Legal department operations
No surveyed companies have implemented blockchain yet and only 2 percent of the respondents plan to introduce this technology in the short term.
• Blockchain awareness of Russian companies is seen as low. Most respondents from the largest Russian companies are not or are only partially informed about blockchain technology principles (38 percent and 35 percent, respectively).
• According to the respondents, the most positive impact of blockchain may be seen in automation of contract relations (62 percent) and digital identification (59 percent), as well as in the departments involved in administrative activities and document exchange (58 percent).
Blockchain applicability

Deloitte CFO Survey of the Leading Companies in Russia
0606

Deloitte CFO Survey of the Leading Companies in Russia
07
Key macroeconomic indicators
Indicator Value (2017) Change, 2016 vs 2017
Note
GDP
RUB 92,082 billion
1.5 percent increase on 2016 (in physical terms)
Forecast for 2018
Inflation 2.5 % 2.9 p.p. decrease on 2016
Forecast for 2018
Bank of Russia’s key interest rate
7.5% as at 25 October 2018
25 b.p. increase versus the spring of 2018
On 14 September 2018, the CBR made a decision to hike the interest rate by 25 basis points. to 7.5%. The rationale behind this decision was that a change in the external market environment led to a significant increase in inflation risks. According to the Bank of Russia, in 2019 annual inflation rate will reach 5–5.5 percent and retreat to 4 percent in 2020. This forecast accounts for already taken interest rate decisions and a moratorium on purchase of foreign currency based on the budget rule. The CBR will evaluate the relevance of further rate hikes based on the inflation rate and economy, as well as external risks and the response of the financial markets.
Fixed investment
RUB 15,967 billion
8% increase on 2016
According to the Economic Development Ministry’s forecast, investment growth would resume in 2018. In 2018-2019, investment CAGR will reach 1.3 percent and will depend on private investment potential on the back of lower government investment expenditures.
Bank of Russia
IEF RAS
Standard & Poor’s
The European Commission
The World Bank
The International Monetary Fund
OECD
+1.5–2.0% +1.8% +1.8% +1.7% +1.5% +1.7% +1.8%
Bank of Russia
Economist Intelligence Unit
The International Monetary Fund
Vnesheconombank Interfax (consensus forecast)
Bloomberg
3.8%–4.2% 3.9% 3.5% 3.5% 4.0% 2.8%
Russia in figures
Source: The Economic Development Ministry, CBR, Russian Statistical Agency

Deloitte CFO Survey of the Leading Companies in Russia
08
Outlook for leading companies in RussiaFinancial outlook
The respondents were asked to assess financial outlook and compare it with the situation six months prior (1H 2018):
Trends:
• In 2H 2018, CFO expectations regarding financial prospects of their companies became more pessimistic. The share of pessimistic responses increased almost four-fold and reached 37 percent.
• The balance value indicator sharply fell by 33 points in the past six months, going negative (-0.06), or hitting the 1H 2016 level.
Highlights:
• Representatives of the TMT industry and the companies with RUB 5–25 billion in revenue are the most optimistic about the current situation (7 and 16 p.p. above the average, respectively).
• At the same time, the share of pessimists among manufacturing industry’s CFOs increased significantly (by 40 p.p.) and reached 50 percent.
• Representatives of companies with less than RUB 5 billion in revenue and with less than 100 employees tend to be pessimistic, too (the share of pessimists is higher than average by 13 p.p. and 18 p.p., respectively).
• Representatives of Russian companies tend to be more pessimistic than those of foreign companies with localized production in Russia (by 9 p.p.).
The index: the weighted balance of respondents on a scale of -1 to 1 where 1 percentage point equals 0.01
Optimistic
Pessimistic
No change
Balance
0.05
0.440.270.23
0.10
0.47
-0.04
37%
26%
51%
27%
36%
53%
36%
27%
30%
4%
22%
13%
9% 9%
36% 44
%
45%
51%
51%
38%
55%
2015
H2
2016
H2
2017
H2
2016
H1
2017
H1
2018
H1
2015
H1
2018
H2
31%
37%
32%
-0.06

Deloitte CFO Survey of the Leading Companies in Russia
09
Financial performance
Trends:
• A significant part of CFOs expect both corporate revenue and operating profit to decrease in 2H 2018 (by 6 p.p. and 7 p.p., respectively).
Highlights:
• Manufacturing industry’s representatives tend to expect a growth in revenue more often than others (by 9 p.p.). On the other hand, they expect a decrease in operating profit more often than the rest (10 p.p. above the average).
• Foreign companies tend to anticipate revenue growth more often than Russian companies (by 19 p.p.).
• The companies with less than 100 employees expect revenue to decrease twice as often compared to others.
Trends:
• The companies expect operating cost growth to accelerate next year (by 8 points y-o-y), with revenue and operating profit growth slowing down (by 8 points and 13 points, respectively).
Revenue
Operating profit
Operating costs
Cost of capital
Changes in key corporate financial metrics in 2018
Changes in expected revenue and operating profit, 2015–2018
The index: the weighted balance of respondents on a scale of -1 to 1 where 1 percentage point equals 0.01
0.17 0.29
0.060.00 0.060.04
2015
H2
2016
H2
2017
H2
2016
H1
2017
H1
2018
H1
2015
H1
0.27
0.21
0.26
0.20
0.39
0.29
0.23
0.28
0.31
0.38
0.42
0.07
0.42
0.22
0.12
0.280.270.30
0.12
0.30
2018
H2
0.06
0.15
0.34
0.30
Growth Decrease No change
Revenue Operating profit
36%
31%
23%
18% 18
%
20%
11%
33% 27
%24%
30% 24
%
2015
H2
2017
H2
2016
H2
2016
H1
2018
H1
2017
H1
2016
H2
201
5 H
2
2017
H2
2017
H1
2016
H1
2018
H1
53% 60
%
61%
60% 71
%
66%78
%
42%
60%73
%
45%
60%
11%
9% 16%
22%
11%
14%
11%
25%
13%
3% 25%
16%
2018
H2
2018
H2
17%
29%
66%
48%
17%
23%

Deloitte CFO Survey of the Leading Companies in Russia
10
The scope of expected changes in key corporate financial metrics
Trends:
• CFOs of largest Russian companies told us about their expectations with respect to each reviewed indicator.
• In their responses, they stated that expect the number of employees to increase by 13 percent and the operating profit to grow by 4 percent. They also expect the operating costs and the cost of capital to fall (by 2 percent).
Revenue
Opex
Operating profit
Cost of capital
Number of staff
Average salary
0%
-2%
4%
-2%
13%
3%
Expectations relating to changes in operating costs and cost of capital, 2015–2018
Trends:
• The share of the respondents expecting operating costs to grow by fall 2018 increased insignificantly (by 5 p.p.).
• The majority of CFOs (69 percent) do not expect cost of capital to change much for their companies.
Highlights:
• Consumer companies expect operating costs to grow more often (21 p.p. above the average).
• TMT and manufacturing companies are expecting operating costs to fall more than average (by 15 p.p. and 7 p.p., respectively).
• Russian companies tend to expect revenue growth more often than foreign companies (by 14 p.p.).
2015
H2
2017
H2
2016
H2
2016
H1
2018
H1
2017
H1
2016
H2
201
5 H
2
2017
H2
2017
H1
2016
H1
2018
H1
2018
H2
2018
H2
23%
69%
67%
21%
10%
10%
Operating costs Cost of capital
40%
29%
72%
25%
24%
62%
37% 58
%
64%
19% 68
%
65%
51%
53%
14%
60%
62%
21%
47%
33%
18%
64%
21%
22%
9% 18%
14%
15%
14%
17%
16%
9% 18%
17%
11%
13%
Growth Decrease No change

Deloitte CFO Survey of the Leading Companies in Russia
11
Number of staff Salary
Expected headcount and payroll changes
Trends:
• In 2H 2018, the balance of expectations regarding salary increases did not change and remained at 0.36. However, the balance of headcount indicator decreased significantly to 0.01. The strategy aimed at reducing hiring pace correlates with high uncertainty both domestically and on the external markets.
Expected changes in the headcount and salaries in 2015–2018
Trends:
• More than half of the respondents (56 percent) do not anticipate significant changes in the number of employees in their companies.
• Two-thirds of CFOs (63 percent) expect salaries to grow. However, the share of such respondents decreased by 10 p.p. in the past six months.
Highlights:
• Consumer companies, companies with RUB 5–25 billion in revenue and more than 1,000 employees tend to expect the number of staff to increase more often (6, 14, and 7 p.p., respectively).
• Respondents from TMT companies more often than others expect salaries to grow (15 p.p. above the average). Respondents from the North Western and Southern Federal districts also expect salaries to grow (10 and 7 p.p., respectively, too).
• Companies with less than RUB 5 billion in revenue and less than 100 employees expect reduction in the number of staff more often than average (by 9 p.p. and 15 p.p., respectively).
2015
H2
2017
H2
2016
H2
2016
H1
2018
H1
2017
H1
2016
H2
201
5 H
2
2017
H2
2017
H1
2016
H1
2018
H1
2018
H2
2018
H2
Growth Decrease No change
Number of employees Salaries and wages
69%
49%
49%
47% 45
%
29%
58%
62%
38%
50% 39
% 27%
25% 29
%
49%
25% 35
%
70%
24% 34
%
58%
30%
53%
73%
6% 22%
2%28%
20%
1%18%
4% 4%20%
8% 0%
56%
35%
23%
63%
21%
2%
2016
H1
2017
H1
2018
H1
2016
H2
2017
H2
2015
H2
-0.04
0.090.04
0.120.060.04
0.21
0.360.36
0.16
0.270.24
2018
H2
0.01
0.36

Deloitte CFO Survey of the Leading Companies in Russia
12
Uncertainty and risksMeasuring uncertainty in strategic decision making
The index: the weighted balance of respondents on a scale of -1 to 1 where 1 percentage point equals 0.01
Trends:
• The net level of uncertainty (0.34) rose 36 points in the past six months and going positive for the first time since 2H 2016. The reason was that the respondents believe that the current economic and political situation is rather uncertain.
• The share of CFOs seeing the current economic and political situation as uncertain increased by 18 p.p.
Highlights:
• The share of respondents from the consumer industry and TMT who pointed to high uncertainty in strategic decision making has significantly increased in the past six months (up 32 p.p. and 35 p.p., respectively).
• Companies with RUB 5–25 billion in revenue indicated higher levels of uncertainty (12 p.p. above the average).
Respondents were asked to assess the political and economic environment from a standpoint of uncertainty in strategic decision making.
0.46
-0.12 -0.020.020.32
-0.28
0.44
34%
28%
64%
27%
49%
56%
51%
66% 72
%
36%
73%
51%
44% 49
%
High uncertainty
Low uncertainty
Net level of uncertainty
2015
H2
2016
H2
2017
H2
2016
H1
2017
H1
2018
H1
2015
H1
2018
H2
33%
67%
0.34

Deloitte CFO Survey of the Leading Companies in Russia
13
Measuring the risk appetite
Trends:
• The risk appetite insignificantly decreased following higher uncertainty around strategic decision making (+7 points) and reached -0.56.
Highlights:
• Respondents from the consumer segment and the TMT industry appeared to be more prepared to take risky decisions (33 percent and 38 percent, respectively). At the same time, the share of risk-prone respondents from the TMT sector increased almost 1.5 times while the risk appetite of CFOs in the consumer industry did not change.
• Compared to representatives of foreign companies with localized production in Russia, representatives of Russian companies note twice as often that now is the time to take risky decisions.
• It also should be noted that the higher the revenue, the stronger the risk appetite (in such companies the balance value indicator increases from -0.7 to -0.4) and, oppositely, decreases in companies with larger staff (from -0.45 to -0.62).
The index: the weighted balance of respondents on a scale of -1 to 1 where 1 percentage point equals 0.01
Time is not appropriate now
Time is appropriate now
Risk tolerance
-0.42-0.20
-0.49
-0.06
-0.72
-0.06-0.40
86%
70%
53%
71%
53%
60%
75%
14%
30%
47%
29%
47%
40%
25%
2015
H2
2016
H2
2017
H2
2016
H1
2017
H1
2018
H1
2015
H1
2018
H2
78%
22%
-0.56

Deloitte CFO Survey of the Leading Companies in Russia
14
Based on the eighth series of our survey we defined the list of top risks which affect business the most.
Top three risks:
1. Weaker domestic demand
2. Stagnation in the Russian economy
3. The weakening of the ruble
• The risk of a decrease in domestic demand remains a major concern for large businesses and is undoubtedly related to the latest events such as the VAT rate hike, a pension age increase, trade embargo and their possible impact on consumers.
• Stagnation in the Russian economy is seen as the second biggest risk. It worries foreign companies more than the Russian ones (by 10 p.p.). Companies with less than RUB 5 billion in revenue are concerned
about stagnation more than companies with revenue exceeding RUB 25 billion (by 15 p.p.).
• In late 2018, the weakening of the ruble reappeared on the list of key risks that are of major concern for CFOs. Last time this risk was among top concerns in 1H 2017 (when it ranked first). This risk is of the highest concern for representatives of the manufacturing industry and TMT (92 percent and 88 percent, respectively), as well as for foreign companies (95 percent).
The key risk factors in 2H 2018
The risk factors in the unfavorable risk zone as at 2H 2018
1. Stagnation in the Russian economy2. The weakening of the ruble 3. Weaker domestic demand5. Increased competition in the market8. Decrease in cash flow11. New trade barriers/more protectionism14. Decrease in core business revenue16. Lower consumer interest in new products17. Lower transparency
Company concerns about business regulation and external policy resurfaced in 2H 2018 after a temporary economic revival and focus on innovation risks in 2017.The key risks highlighted in the previous year continue to have a negative impact. The concerns relevant back in 2015 reappeared among top risks which may indicate that the respondents see signs of a slowing in consumer demand growth to 2015 levels.
All the considered risk factors
Risk factors with a stronger negative effect
2015 2016 2017 2018
№ 1 Stagnation in the Russian economy
№ 2 The weakening of the ruble
№ 3 Weaker domestic demand
№ 4 Weaker external demand
№ 5 Increased competition in the market
№ 6 Higher production costs in Russia
№ 7 Higher production costs abroad
№ 8 Decrease in cash flow
№ 9 Increase in the cost of capital
№ 10 Shortage of capital
№ 11 New trade barriers/more protectionism
№ 12 Increased business regulation in Russia
All the considered risk factors
Risk factors with a stronger negative effect
2015 2016 2017 2018
№ 13 Geopolitical risks
№ 14 Decrease in core business revenue
№ 15 Rising barriers to entry into new markets
№ 16 Lower consumer interest in new products
№ 17 Lower transparency
№ 18Social risks, consequences of business process automation (e.g. personnel cuts)
№ 19Risks inherent with implementation of innovative projects
№ 20Risks inherent with launch of innovative and competitive products in the market
№ 21 Cyber threats

Deloitte CFO Survey of the Leading Companies in Russia
15
The detailed analysis of the survey data allowed us to map the risks and enabled the assessment of the effect and nature of each factor with respect to two corporate performance metrics, i.e., the expected and actual profits in 2018 and the general financial outlook.
The risk map is instrumental to identifying the hidden risk factors that, according to CFOs, significantly affect the development of business in Russia.
Risk factor map
The medium risk zone
Unfavorable zone
Favorable zone
The medium risk zone
–0.5
–0,5
1.0
1.0
–1.0
–1.0
0,5
Unfavorable zone companies expect the operating profit to fall, pointing to a deteriorating financial outlook
The medium risk zonecompanies expect operating profits to fall, albeit pointing to an improving financial outlook
The medium risk zone companies expect operating profits to grow and point a deteriorating financial outlook
Favorable zone companies expect operating profit to grow and note that the financial outlook is improving
21
12
18
4
19
9
20
10
13
6
14
2
5
83
11
1
715
1716
0.5

Deloitte CFO Survey of the Leading Companies in Russia
16
Significant events and the extent of their perceived: negative impact on company operations
Trends:
• An expected increase in the VAT rate in 2019 could be highlighted as the most negative event that will have an impact on company operations. Total level of negative impact is 80%, companies of TMT have the highest share of negative replies (8 p. p. high than average).
• Total level of negative impact of sanction is 70%. Representatives of the health care and medicine sector take the most negative attitude towards this move (20 p.p. above the average).
• Seventy-five percent of the respondents from the TMT industry (twice that of the average) negatively assess the consequences of the Yarovaya Law.
26% 26% 18%
Pension reform
The trade embargo imposed
on the US/EU by Russia
Yarovaya Law (Russian anti-terrorist
legislative package)
80%
VAT rate hike
70%
Sanctions against Russia
61%
63%
75%
90%
81%
88%
75%
70%
*Total negative impact – weighted balance of respondents (-1 to 1), 1 point equals 1%.

Deloitte CFO Survey of the Leading Companies in Russia
17
Currency risk management
Trends:
• The most relevant risk management practice is financing/lending in rubles, the relevance of this practice has increased by 5 p.p. in the past six months.
• The significance of adding an exchange clause to contracts (fixing prices for finished goods in a currency other than the contract currency) increased the most noticeably (by 9 p.p.).
Highlights:
• Manufacturing companies tend add an exchange clause in contracts and introduce currency diversification for the portfolio of transactions more often (14 and 25 p.p. above the average, respectively).
• Russian companies use the practice of increasing the capital reserves in order to manage currency risks more often than foreign companies (by 18 p.p.). Funding/lending in RUB only
Inclusion of currency clause in contracts (fixing end product prices in currencies other than the contract currency)
Portfolio currency diversification
Hedging
Working capital increase
Capital increase
Refinancing currency loans in Russian banks
2016
H1
2017
H1
2018
H1
2016
H2
2017
H2
2015
H2
40%
23%
39%
35%36%
57%
40%
21%
48%
27%
36%
29%
36%
20%
55%
24%
66%
37%
22%
7%
24%
20%
16%13%
18%7%
21%
15%
18%16%
4%3%
18%
2%
16%
9%
49%
20%
42%
49%
30%
47%
2018
H2
44%
33%
27%
15%
15%
8%
54%

Deloitte CFO Survey of the Leading Companies in Russia
18
Business development strategies in 2018Appeal of various business strategies
Top-3 strategies
1. Continuous cost control
2. Cost cutting
3. Business development through organic growth
Based on the results of the surveys held by our Research Center since 2015, the opinions of our respondents regarding the most attractive strategies have changed only slightly. Continuous cost control remains the most attractive strategy. The majority of our experts pointed to the importance of this strategy (71 percent).
The importance of the cost cutting strategy increased slightly. Sixty three percent of the respondents pointed out to the relevance of this strategy. Oppositely, the relevance of the organic growth strategy somewhat decreased and was ranked the third.
Having performed an in-depth data analysis, we prepared a strategy map that presents strategic areas of corporate development in 2018. This method helps to identify strategies that are most appealing to companies based on their financial position and business outlook.
Business strategy map
The medium risk zone
Unfavorable zone
Favorable zone
The medium risk zone
–0.5
–0.5
1.0
1.0
–1.0
–1.0
0.5
Unfavorable zone companies expect operating profit to fall, pointing to a deteriorating financial outlook
The medium risk zonecompanies expect operating profits to fall, albeit pointing to an improving financial outlook
The medium risk zone companies expect operating profits to fall, albeit pointing to an improving financial outlook
Favorable zone companies expect the operating profit to grow and note that the financial outlook is improving
0.5
19
16
18
21
8
4
13
5
1420
10
3
9
12
2
7
11
6
1517
1

Deloitte CFO Survey of the Leading Companies in Russia
19
Zone 4 comprises the following strategies selected by companies facing financial or operational difficulties:
2 Acquisitions in Russia
3 Acquisitions abroad
8 Continuous cost control
9 Cost cutting
10 Debt reduction
11 Asset sale
12 Cash flow increase
13 Reduction in currency risks
All strategies that are considered
Strategies with higher negative effect
2015 2016 2017 2018
№ 1 CAPEX growth
№ 2 Acquisitions in Russia
№ 3 Acquisitions abroad
№ 4 Business development through organic growth
№ 5 Expansion into new markets
№ 6 Launch of new products/ services to the market
№ 7 Dividend increase or share buyback
№ 8 Continuous cost control
№ 9 Cost cutting
№ 10 Debt reduction
№ 11 Asset sale
All strategies that are considered
Strategies with higher negative effect
2015 2016 2017 2018
№ 12 Cash flow increase
№ 13 Currency risk mitigation
№ 14 Increase in marketing research and PR costs
№ 15 Increase in production abroad
№ 16 Increase in domestic production
№ 17 Financial risk mitigation (interest rates, derivatives, etc.)
№ 18 Investment in personnel
№ 19 Raising capital from external sources
№ 20 Digitalization of business functions
№ 21 Investing in startups (internal and external accelerators)

Deloitte CFO Survey of the Leading Companies in Russia
20
Trends in demand: the 1H 2018 results and expectations till end-2018
Trends:
• According to 45 percent of the respondents, the demand for end-products of their companies did not change in 1H 2018. Forty one percent of the companies indicated that the demand increased (by 17 percent), while 14 percent stated that the demand fell (by 11 percent).
• One in two respondents does not expect significant changes in the demand performance until end-2018. Thirty seven percent of companies expect the demand to increase (by 14 percent), while 14 percent believe that demand would fall (by 13%).
• Consumer companies tend to forecast a reduction in demand twice as often, while life science and health care companies tend to anticipate the demand growth more frequently (23 p.p. above the average).
Increase in demand
No change
Decrease in demand
41%
45%
14%
37%
49%
14%-11% -13%
+17% +14%
Expected changes in demand until end-2018
Changes in demand in 1H 2018
Pricing policy: the 1H 2018 results and expectations till end-2018
Trends:
• Nearly half of the surveyed companies (57 percent) stated that they had decided to hike prices by an average of 7 percent in 1H 2018. Thirty seven percent of the respondents reported no changes in the pricing policy and only 6 percent reported price cuts in their companies (by 5 percent).
• Approximately two-thirds of the companies (61 percent) plan to hike prices (by 5 percent on average) by end-2018. Approximately one third of the companies (33 percent) will keep prices unchanged while 6 percent of the companies plan to cut prices by 1 percent.
• The prices were raised mainly by manufacturing companies (92 percent); they also more often than others (by 14 p.p.) stated their intention to increase prices again by end-2018.
Price increase
No change
Price decrease
57%
37%
6%
61%
33%
6%-5% -1%
+7% +5%
Pricing policy by end-2018
Pricing policy implemented in 1H 2018

Deloitte CFO Survey of the Leading Companies in Russia
21
Trends:
• The share of companies with foreign partners decreased by 7 p.p. to 71 percent. At the same time, the number of companies that plan to expand the geography of business ties has significantly decreased in the past six months (by 5 p.p.).
• None of the surveyed companies plans to expand cooperation with counterparts from South and North America. In addition, there is a decrease in the share of companies willing to strengthen business ties with partners from Asia and Europe (by 18 p.p. and by 16 p.p., respectively). Oppositely, the share of companies willing to expand cooperation with partners from the CIS increased by 7 p.p. in the past six months.
Prospects of developing business abroad
The current geography of ties
Geography of future ties
ASIA
SOU
TH A
MER
ICA
EURO
PE
CIS
NO
RTH
AM
ERIC
A
72%60%
39%37%67%
86%
0%11%
0%17%
of the companies surveyed cooperate with foreign partners.
of companies surveyed do not cooperate with foreign partners.
plan to expand their business relations into other regions.
do not plan to expand their business relations into other regions.
71 % 29 %
37 % 63 %

Deloitte CFO Survey of the Leading Companies in Russia
22
Business drivers and barriersDrivers and barriers rating
Business drivers:
• Production costs
• Digitalization
Barriers for business:
• Focus on core business
Key business drivers include production costs (the balance indicator is 0.88) and digitalization (the balance indicator is 0.55).
The focus on core business is a top barrier for business. The balance value indicator is -0.33.
In 2H 2018, the respondents assessed the outlook for production abroad more negatively than for production in Russia.
Drivers Barriers Balance
0.89
0.59
0.38
0.96
0.73
0.69
0.83
0.39
0.15
1.28
0.58
0.63
0.28
Prod
uctio
n co
sts
Entr
y in
to n
ew m
arke
ts
Prod
uctio
n in
Rus
sia
Focu
s on
cor
e bu
sine
ss
Dig
italiz
atio
n
Cost
of c
apita
l
Exte
rnal
sou
rces
fin
anci
ng
Liqu
idit
y
Fina
ncia
l pos
ition
Curr
ency
ris
ks
New
pro
duct
s/se
rvic
es
Inno
vatio
ns
Prod
uctio
n ab
road
-0.3
4
-0.4
1
-0.4
2
-0.5
6
-0.6
6
-0.7
8
-0.4
4
-0.3
7
-0.3
1
-0.3
9
-0.3
7
-0.6
5
-0.6
1
0.55
0.18
-0.0
4
0.39
0.07
-0.0
9
0.38
0.02
-0.1
5
0.88
0.21
-0.0
2
-0.3
3
Prevailing effect of barriers
Prevailing effect of drivers

Deloitte CFO Survey of the Leading Companies in Russia
23
Sources of business financingAttractiveness analysis of financing sources
*Crowdfunding is the practice of financing ventures through raising money from a large number of people who each contribute a relatively small amount
Attractive financing sources:
• Internal sources
• Borrowing from Russian banks
Trends:
• The list of attractive sources of financing based on the respondents’ opinion has not changed since early 2017.
• The internal sources of financing remain the most attractive. The significance of this indicator increased by 27 points in the past six months. The balance value indicator is 0.53.
Highlights:
• Compared to other industries, consumer companies believe that a loan from a Russian bank is an attractive source of financing more often (by 15 p.p.).
• The respondents from the TMT industry believe that the state financing option is more attractive twice as often (38 percent). Compared to the rest of the respondents, they indicate that the share issuance is the most attractive source of financing twice as often.
Attractive Not attractive Balance
0.29
0.10
0.08
0.09
0.15
0.08
0.61
0.07
0.03
Loan
s fr
om R
ussi
an b
anks
Loan
s fr
om fo
reig
n co
mpa
nies
and
indi
vidu
als
Shar
e is
suan
ce
Loan
s fr
om fo
reig
n ba
nks
Gov
ernm
ent f
inan
cing
Loan
s fr
om R
ussi
an
com
pani
es a
nd in
divi
dual
s
Inte
rnal
sou
rces
of
fina
ncin
g
Bon
d is
suan
ce
Crow
dfun
ding
*, IC
O
-0.2
3
-0.4
4
-0.3
2
-0.4
3
-0.4
1
-0.4
6
-0.0
8
-0.3
6
-0.4
4
-0.2
3
-0.3
4 -0.2
6
-0.3
8
0.53
-0.2
9
-0.4
1
0.05
-0.3
4

Deloitte CFO Survey of the Leading Companies in Russia
24
Legal DepartmentThe department is responsible for handling of legal matters in the company
The number of staff in the company’s legal department
Highlights:
• Consumer companies tend to seek third-party legal support more often (by 4 p.p.) than on average. The respondents from the TMT industry stated that they did not ask for third-party legal support.
• Legal services are most frequently outsourced by companies with relatively low earnings (up to RUB 5 billion) and with less than 100 employees (40 percent and 55 percent, respectively). A similar trend is observed among companies of the Volga Federal District (where the average is exceeded by 12 p.p.).
Highlights:
• The departments with more than 20 employees can be more often found in manufacturing and high tech companies (11 and 19 p.p. above the average, respectively)
• In more than half of consumer companies (58 percent), legal departments consist of five to 10 specialists.
• The higher is the company’s revenue, the more specialists are employed in the company’s legal department. Thus, legal departments in 80 percent of companies with revenue of less than RUB 5 billion employ up to 5 specialists. At the same time, almost half of companies with revenue of more than RUB 25 (40 percent) employ over 20 in-house lawyers.
Trends:
• The majority of the surveyed companies (74 percent) have a dedicated legal department (or in-house specialists) responsible for handling legal matters. Some companies (18 percent) stated that they outsource legal matters to third-party legal consultants. Six percent of the companies assign legal matters to a dedicated employee who works in a different department.
Trends:
• According to the survey results, the number of employees in the legal department is relatively small, up to 10 people. Almost half of companies (44 percent) state that their legal department employs up to five people. In one-third of companies (31 percent), the number of employees in the legal service ranges from five to 10 people.
• The shares of companies with 11–20 and over 20 employees per department are approximately the same at 11–14 percent.
Legal department
Outsourcing (third-party legal consultants)
Dedicated employee from other division
Other
74%
18%
6%
2%
Up to 5 employees
5–10 employees
11–20 employees
Over 20 employees
44%
14%
31%
11%
Eight employees – the average number of employees in a legal department

Deloitte CFO Survey of the Leading Companies in Russia
25
Matters handled by in-house legal departments
Legal service outsourcing
Highlights:
• The in-house legal services of TMT, Life Sciences, and Health Care companies tend to deal with verification of agreements and contract template development more often than other market players (16 and 21 p.p. above the average, respectively).
• Legal services of foreign companies with production localized in Russia are more often interested in resolving labor compliance matters (by 5 p.p.).
Highlights:
• Manufacturing companies tend to use third-party legal support more often (by 12 p.p.), similarly to the companies operating in the South Federal District (by 10 p.p.)
Trends:
• According to the respondents, the key function of the in-house legal is to verify contracts and develop contract templates (59 percent).
• Another important function of the in-house legal service is participation in litigations. This function was named by 23 percent of the companies.
• Fourteen percent of the respondents noted that their legal departments handle all the aforementioned matters.
Trends:
• Eight in ten companies (78 percent) where in-house legal department is responsible for legal matters use third-party legal services.
• None of the companies that have never outsourced legal services (22 percent) does not plan to do so in the future.
Verification of contracts, development of contract templates
Litigations
Labor code compliance
All of the above
59%
23%
4%
14%
Used outsoursing
Haven’t used but plan to use
Haven’t used and do not plan to use
78%
22%
• Litigations make it to the top of the agenda of legal departments in larger companies with revenue over RUB 25 billion and more than 1,000 employees (18 and 16 p.p. above the average, respectively).
Deloitte CFO Survey of the Leading Companies in Russia
26
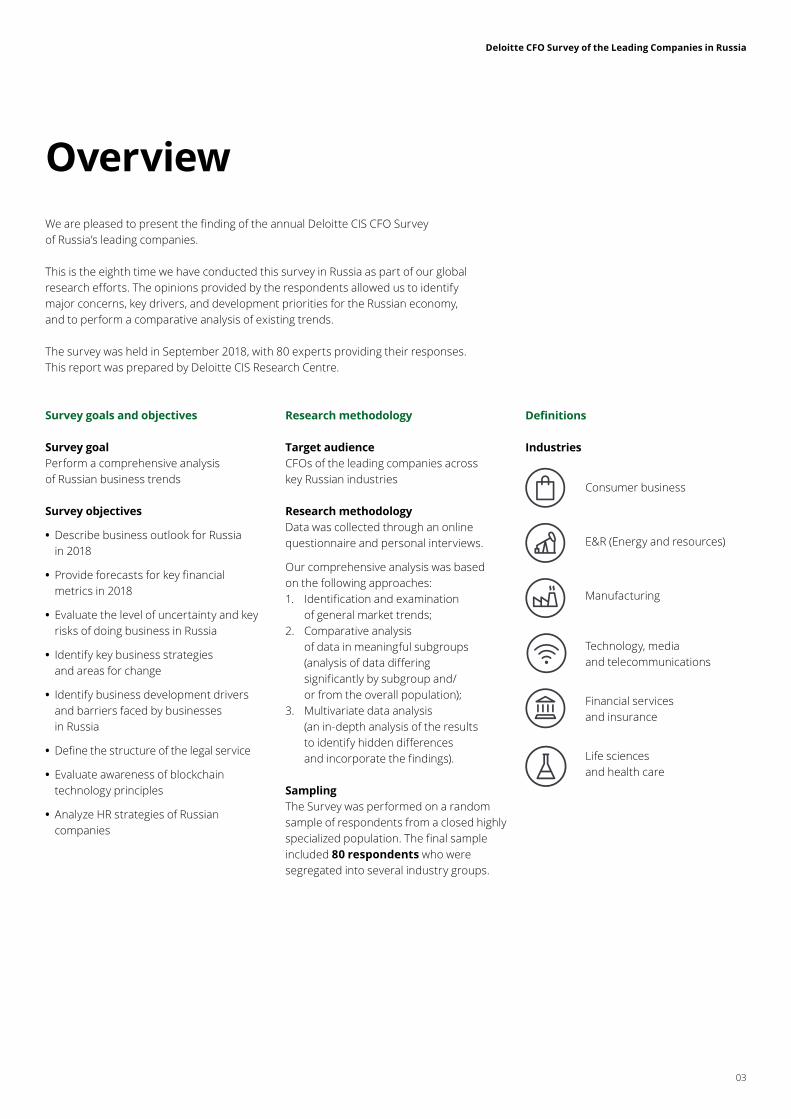
Matters outsourced by the survey participants
Highlights:
• The shortage/lack of internal resources is more often cited by manufacturing and TMT companies (compared to other industries) as a reason for using third-party legal support (11 p.p. and 6 p.p., respectively).
• Foreign companies with production localized in Russia outsource legal services more often than Russian companies (by 18 p.p.) due to their technical complexity, while Russian companies
Trends:
• Most often (45 percent), companies tend to outsource legal functions in order to achieve specific objectives that are otherwise difficult to complete due to their technical complexity.
• Another important reason for using legal services of third-party providers is the shortage/lack of internal resources (27 percent).
• Budget optimization is not the most important reason for contracting third-party legal service providers, as mere six percent of the respondents cited this reason as important.
Technical complexity
Lack/absence of domestic resources
High labor intensity
Budget optimization
45%
27%
10%
6%
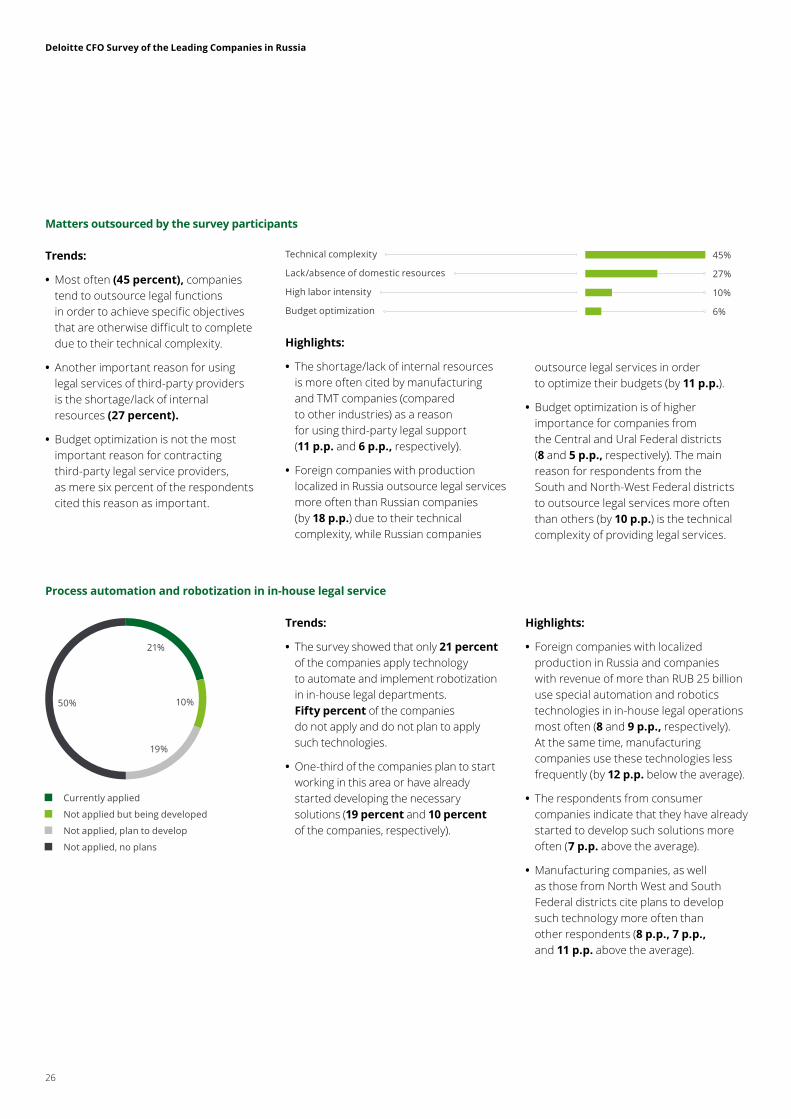
Process automation and robotization in in-house legal service
Highlights:
• Foreign companies with localized production in Russia and companies with revenue of more than RUB 25 billion use special automation and robotics technologies in in-house legal operations most often (8 and 9 p.p., respectively). At the same time, manufacturing companies use these technologies less frequently (by 12 p.p. below the average).
• The respondents from consumer companies indicate that they have already started to develop such solutions more often (7 p.p. above the average).
• Manufacturing companies, as well as those from North West and South Federal districts cite plans to develop such technology more often than other respondents (8 p.p., 7 p.p., and 11 p.p. above the average).
Trends:
• The survey showed that only 21 percent of the companies apply technology to automate and implement robotization in in-house legal departments. Fifty percent of the companies do not apply and do not plan to apply such technologies.
• One-third of the companies plan to start working in this area or have already started developing the necessary solutions (19 percent and 10 percent of the companies, respectively).
Currently applied
Not applied but being developed
Not applied, plan to develop
Not applied, no plans
21%
50% 10%
19%
outsource legal services in order to optimize their budgets (by 11 p.p.).
• Budget optimization is of higher importance for companies from the Central and Ural Federal districts (8 and 5 p.p., respectively). The main reason for respondents from the South and North-West Federal districts to outsource legal services more often than others (by 10 p.p.) is the technical complexity of providing legal services.

Deloitte CFO Survey of the Leading Companies in Russia
27
HR strategies
Analysis of the key competences of employees
Certain work experience
Problem solving
Special technical expertise
General skills (communication skills, time management)
Labor ethics
Certain education level
67%
53%
38%
33%
22%
18%
Highlights:
• Problem solving is the most sought after skill for consumer companies (22 p.p. above the average).
• Respondents from the TMT industry look for employees with certain work experience and with good general and time management skills (63 percent each).
• Respondents from the manufacturing industry look for employees with special technical skills (64 percent).
Strategies to address the lack of required competences in the labor market
• In contrast to other companies, the strategy of implementing/increasing automation appears more attractive to manufacturing companies (by 20 p.p.).
Trends:
• According to CFOs, the most viable strategy is the training of the existing personnel (0.76).
• Similarly attractive for the respondents are strategies aimed at implementing/increasing automation (0.69) and creating an appealing work environment (0.62).
Training of existing personnel
Implementation/increase of automation levels
Appealing work environment
Use of part-time resources (remote specialists, interns)
Outsourcing
Extended remuneration system
Hiring remote employeesHiring specialists from various segments of labor market (young/aged, military retirees)Lowering requirements for reviewed candidates
Use of foreign labor force
0.76
0.69
0.62
0.51
0.48
0.44
0.31
0.25
0.24
0.16
of the respondents. Problem solving was cited as the next skill by importance. It was indicated by 53 percent of CFOs.
• The respondents cited the education level as the least important skill implying that there is a sufficient number of employees with required education level in the market that lack practical skills.
Trends:
We asked our respondents about competences that are the most sought and considered the most ‘difficult’ from a standpoint of HR search in their companies.
• A search for employees with specific job experience is both the most important and complicated part. This was indicated by two-thirds (67 percent)
Highlights:
• According to TMT companies, the problem can be solved by hiring part-time employees or outsourcing some tasks (50 percent and 63 percent, respectively).

Deloitte CFO Survey of the Leading Companies in Russia
28
Blockchain
Application of blockchain in companies
Awareness of blockchain technology principles Are you interested in learning about blockchain technology principles?
Highlights:
• Respondents from the TMT companies have heard of examples of blockchain technology implementation in other companies twice as often, compared to other respondents.
Highlights:
• Compared to other companies, respondents from TMT companies state that they are well aware of blockchain technology principles more frequently.
• Respondents from manufacturing companies, life sciences and health care sciences, as well as companies with 100–1,000 employees state that they are not aware of blockchain technology principles more frequently (24 p.p., 19 p.p., and 20 p.p., respectively).
Trends:
• None of the surveyed companies has implemented blockchain as of yet. Only 2 percent of the respondents plan to introduce this technology in the short term.
• At the same time, 81 percent of the respondents noted that they have not implemented blockchain in their companies and have not heard of blockchain implementation in other companies. Only 17 percent of the respondents know such examples.
Trends:
• The awareness of Russian companies of blockchain principles is seen as low. Most respondents from the largest Russian companies are not or are only partially informed about blockchain technology principles (38 percent and 35 percent, respectively).
• Only 6 percent of the respondents said that they were well aware of blockchain principles.
Trends:
• Despite the relatively low awareness of blockchain technology principles, the majority of the respondents (81 percent) are interested in studying the basics of the blockchain technology.
Already implemented
Implementation planned in short term
Aware of blockchain application in other companies
Not implemented, not aware
Yes
No
2%17%
81%
19%
81%
Barely aware about blockchain
Partially aware about blockchain
Completely unaware about blockchain
Well aware about blockchain
38%
35%
21%
6%

Deloitte CFO Survey of the Leading Companies in Russia
29
Areas in which blockchain may have the most positive impact
Trends:
• According to the respondents, the most positive impact of blockchain may be seen in automation of contract relations (62 percent) and digital identification (59 percent).
• The positive impact is also expected in such areas as data storage (49 percent), supply chain (46 percent), and settlements with counterparties (46 percent).
• According to the respondents, blockchain impact on medical and educational services will be not as significant as in other areas. Most likely, it is related to the specific features of the market and fixation on the object of their activities.
Automation of contract relationships
Digital ID
Data storage
Supply chain
Settlements with counterparties
Internal document exchange
Implementation/application of loyalty programs
Government services
Title transfer
Raising finance
Clearing services
Insurance services
Medical services
Education services
62%
59%
49%
46%
46%
30%
30%
24%
22%
19%
19%
14%
5%
5%
Administration, document exchange
Finance
Marketing, sales
HR
Production
Other
58%
42%
25%
19%
14%
8%
Areas in which blockchain may have the most positive impact
Trends:
• According to the respondents, the blockchain technology may have the most positive effect on divisions engaged in administrative work and document exchange. This option was chosen by more than half of the companies (58 percent).
• In addition, the positive effect of blockchain would be felt in finance departments (42 percent).
Highlights:
• Respondents from the TMT companies state three times as often compared to the average (57 percent) that blockchain may have a positive effect on their ability to raise financing.
Highlights:
• Manufacturing companies more often state that blockchain may have a positive impact on production divisions (three times above the average).
• Companies with 100–1,000 employees acknowledge that blockchain may have a positive impact on their financial departments (28 p.p. above the average).

Deloitte CFO Survey of the Leading Companies in Russia
30
Insights into CFO social media personality profilesMethodology
CFO: Average profile on Facebook
CFO Top 10 interests (ranked from 0 to 1)
Interests
Finance 0.35
Business 0.16
Services 0.08
News 0.06
Real estate 0.06
Career 0.05
Books 0.04
Education 0.03
Health 0.02
Food 0.02
Top 5 groups/pages popular with CFOs
Subscribers Percentage of subscribers to groups/pages
NES (New Economic School) 38
FinExecutive 29
SKOLKOVO - Moscow School of Management 27
Deloitte CIS 18
Association of Banks of Russia 18
Our social media profile analysis relies on data from public groups on Facebook.
After filtering public groups to only include those with at least 1,000 likes and those aimed at Russian users, we have searched for “CFO” and “Chief Financial Officer” to narrow down the list to the following: “Finansoviy Director” (Financial Officer Magazine), CFO-Russia and CFO-Cafe.
Due to limitations on Facebook where data downloads are only allowed for public pages, we captured data from 400 profiles owned by users who have specified their current or previous job positions as a CFO, a Chief Financial Officer or a Financial Director.
Our methodology is based on automated data analytics. We have used semantic and psychometric analysis.
Gender
39 years 42 years
Average age
63% 37%
Moscow
St. Petersburg8%59%
7% Yekaterinburg
Geography

Deloitte CFO Survey of the Leading Companies in Russia
31
CFO personality profile based on open data from Facebook
Personality traits based on the Big Five model
Personality profile based on the MBTI model (ranked from 0 to 1)
Based on the Big Five model, we have identified that CFO social media profiles and general user profiles have some significant differences, with CFOs having higher scores for conscientiousness (+16 points) and emotional volatility (+22 points) above the average.
INTP CriticCritics can think many steps ahead, down to the smallest detail. Their personality is defined by broad mindedness and intellectual keenness for things that seem interesting, with the result that their behaviour and ideas are known for unpredictability. Critics work hard. While they are prudent, diligent, meticulous and thrifty, empathy is not their strong point; they are not quite good at emotional thinking when it comes to other people; they can be impolite and can easily set other people against themselves.
ISTP ExpertExperts like comfort while staying focused on practical outcome. Avoiding discomfort is what they are particularly good at. Experts are resourceful, logical and objective. Even though they tend to hide their emotions, they can hold a grudge for a long time, which can result in an outburst. They can be unpredictable and inconsistent. However, this is only so in the eyes of others. Experts will always rationalise their behaviour to themselves.
ISTJ InspectorInspector is passionate about logical and rational thinking. With a practical and, often, business-like mindset, Inspector is keen on classifying and analysing things to put them where they belong. Down to earth, realistic, strong-willed, harsh, demanding, in-control and keen on order and discipline – these are the key personality traits of Inspector. At the same time, intuition is the weakest spot, with a lack of holistic view of things and poor ability to see opportunities and what comes next. Wary and suspicious. Rather impassive, with a lack of care for feelings and interests of others. Suppresses own emotions.
* The average score is based on the personality analysis of 70,000 social media profiles selected at random.
INTP
ISTP
ISTJ
INFJ
ESTJ
INFP
ENFP
ENTJ
ENFJ
INTJ
ISFJ
ISFP
0.26
0.22
0.21
0.09
0.07
0.04
0.03
0.03
0.02
0.01
0.01
0.01
0.59
0.35
0.51
0.29
0.46
Ope
nnes
s to
exp
erie
nce
Emot
iona
l vol
atili
ty
Cons
cien
tious
ness
Extr
aver
sion
Agr
eeab
lene
ss
0.49
0.40
0.65
0.510.
62
CFOs
Average*

Deloitte CFO Survey of the Leading Companies in Russia
32
82 USD
USD/RUB
Oil price
CBR interest rate
EUR/RUB BTC/USD
Gold price
Inflation
70%
24%
6%
35%
43%
22%
41%
57%
2%
70%
26%
4%
4%
55%
41%
48%
39%
13%
78%
22%
0%
72 RUB
7.5 %
83 RUB
6,079 USD
3.5 %
1,249 USD
Increase
No change
Decrease
Increase
No change
Decrease
Increase
No change
Decrease
Anticipated market dynamics
CFO expectations and personal experience
We asked our respondents about their expectations regarding changes in the reviewed rates by the spring of 2019.

Deloitte CFO Survey of the Leading Companies in Russia
33
Our respondents
Representatives of foreign companies with localized production in Russia
representatives of Russian companies
2017 revenue IndustriesNumber of staff
Geography of operations
45 % 55 %
22%
35%
41%
39%
20%
43%
Below RUB 5 billion
RUB 5 billion – 25 billion
Above RUB 25 billion
Consumer business
Technology, media and telecommunications
Manufacturing industry
Life sciences and health care
Financial services and insurance
Energy and resource industry
Less than 100 employees
100–1,000 employees
More than 1,000 employees
37%
25%
16%
10%
8%4%
Nor
th C
auca
sian
Fe
dera
l Dis
tric
t
Far E
ast F
eder
al D
istr
ict
Cent
ral F
eder
al D
istr
ict
Volg
a Fe
dera
l Dis
tric
t
All
regi
ons
Nor
th W
est
Fede
ral D
istr
ict
Ura
l Fed
eral
Dis
tric
t
Sout
h Fe
dera
l Dis
tric
t
Sibe
ria
Fede
ral D
istr
ict
4% 2%43%
20%
39%
31%
18%
20%
8%

Deloitte CFO Survey of the Leading Companies in Russia
34
Ian ColebourneCEODeloitte CIS
Lora NakoryakovaManagerResearch Centre Leader,Deloitte [email protected]
Vladimir ElizarovPartnerCFO Programme,Deloitte CIS
Dmitriy KasatkinSenior SpecialistResearch Centre,Deloitte [email protected]
Joe PacelliPartnerHead of Business Development,Deloitte CIS
Authors:If you have any questions regarding the survey,please do not hesitate to contact us.
Contacts
Yulia Afanasyeva AnalystResearch Centre,Deloitte [email protected]

deloitte.ruAbout Deloitte
Deloitte refers to one or more of Deloitte Touche Tohmatsu Limited, a UK private company limited by guarantee (“DTTL”), its network of member firms, and their related entities. DTTL and each of its member firms are legally separate and independent entities. DTTL (also referred to as “Deloitte Global”) does not provide services to clients. Please see www.deloitte.com/about for a more detailed description of DTTL and its member firms.
Deloitte provides audit, consulting, financial advisory, risk management, tax and related services to public and private clients spanning multiple industries. Deloitte serves four out of five Fortune Global 500® companies through a globally connected network of member firms in more than 150 countries bringing world-class capabilities, insights, and high-quality service to address clients’ most complex business challenges. To learn more about how Deloitte’s approximately 286,000 professionals make an impact that matters, please connect with us on Facebook, LinkedIn, or Twitter.
This communication contains general information only, and none of Deloitte Touche Tohmatsu Limited, its member firms, or their related entities (collectively, the “Deloitte Network”) is, by means of this communication, rendering professional advice or services. Before making any decision or taking any action that may affect your finances or your business, you should consult a qualified professional adviser. No entity in the Deloitte Network shall be responsible for any loss whatsoever sustained by any person who relies on this communication.
© 2018 AO Deloitte & Touche CIS. All rights reserved.