2mq chemical sector v2 2012
TRANSCRIPT
20 April 2012

Intellisys 2MQ – UK Chemical Sector 20 April 2012
©Intelligent Analysis Limited www.intellisys.uk.com 2 of 48

Intellisys 2MQ – UK Chemical Sector 20 April 2012
©Intelligent Analysis Limited www.intellisys.uk.com 3 of 48
Contents
Introduction ............................................................................................................................................................ 4
Measuring Management Quality - Conclusions ...................................................................................................... 6
Measuring Management Quality - Methodology .................................................................................................... 7
Measuring Management Quality - Results ............................................................................................................. 9
Company Performances ........................................................................................................................................ 12
AZ Electronic Materials SA ☺☺☺☺
.................................................................................................. 13
Byotrol plc ���� ........................................................................................................................ 15
Carclo plc �
........................................................................................................................ 17
Croda International plc ☺☺☺☺ ...................................................................................................... 19
Elementis plc ☺☺☺☺ ..................................................................................................................... 21
Hardide plc ☺☺☺☺ .................................................................................................................... 23
Inditherm plc �
.................................................................................................................... 25
Johnson Matthey plc ☺☺☺☺ .......................................................................................................... 27
Oxford Advanced Surfaces Group plc �
................................................................................... 29
Plant Healthcare plc ☺☺☺☺ ........................................................................................................... 31
Plastics Capital plc ☺☺☺☺ ............................................................................................................. 33
Porvair plc ☺☺☺☺ ........................................................................................................................ 35
Scapa Group plc ☺☺☺☺ ................................................................................................................ 37
Victrex plc ☺☺☺☺ ........................................................................................................................ 39
Yule Catto & Co plc �
............................................................................................................ 41
Zotefoams plc ☺☺☺☺ .................................................................................................................... 43
Appendices ............................................................................................................................................................ 45
DISCLAIMER ......................................................................................................................................................... 46
RISK WARNING .................................................................................................................................................... 47

Intellisys 2MQ – UK Chemical Sector 20 April 2012
©Intelligent Analysis Limited www.intellisys.uk.com 4 of 48
Introduction
Intellisys
Intellisys is an independent equity research business that provides investors from ALL backgrounds with an
expanding range of tools to make better informed equity investment decisions. Intellisys’ products, which are
analysing around 1,000 UK quoted companies on a daily basis, are derived from the application of proven proprietary models that have been developed by Philip Morrish and successfully applied over 20 years to the
institutional market.
Intellisys’ service offerings include
• Day Trader
o Day Trader – AIM is published daily and provides the user with potential trading indications
for some 700 companies listed on The London Stock Exchange's AIM market. It is generally available from the Intellisys website (www.intellisys.uk.com) from 7am (GMT). It is the largest
available single source of potential daily trading indications for this market.
o Day Trader – UK Main market is published daily and provides the user with potential trading indications for some 300 companies listed on The London Stock Exchange's Official List or
Main market. It is generally available from the Intellisys website (www.intellisys.uk.com) from 7am (GMT). It is the largest available single source of potential daily trading indications for this
market.
• Value Indicator
o Value Indicator – UK Main market is a ‘fusion and clustering analysis’ that is published daily and generally available from the Intellisys website (www.intellisys.uk.com) from 7am
(GMT). It builds upon the results of the Day Trader analysis by providing the user with longer-term value indications for some 300 companies listed on The London Stock Exchange’s
Official List or Main market.
o Value Indicator – AIM (in development) will be the AIM market equivalent to ‘Value Indicator – Main market’ by providing ‘fusion and clustering analysis’ for the 700 AIM
companies currently being followed by Intellisys. • 2MQ
o 2MQ – Chemicals is the first of a unique and expanding range of sector focused analyses that
quantitatively measure management quality for an identified peer group listed on The London Exchange's Main and AIM markets that links the results to share price performances. This
product is particularly useful for those investors building or managing structured portfolios
because it helps identify core or long-term investments as well as potential rising and falling stars.
• Company Research (contracted) for small/mid cap companies listed on London’s AIM and Main
markets.
Intellisys’ medium-term aspirations include further service offering extensions, such as abnormal activity and
arbitrage indications, real-time pricing for the Value Indicators suite of products and extending the number of geographic markets covered.
Philip Morrish
Philip Morrish began his equity capital markets career in the City some 30 years ago, in the research department of leading stockjobber Pinchin Denny & Co (now part of Deutsche Bank), where he learned the
basics of company analysis as well as market-making. Philip also managed the company’s ‘risk arbitrage’ analysis, which included cross border takeovers and currency risk analysis. One of Philip’s earliest and most
notable company research successes was forecasting not only ICI’s (one of the world’s largest chemical groups
but the UK’s ‘bell weather’ company) first recorded pre-tax loss but also the cutting of its dividend, which came as a major shock to the City.
Philip then moved to the stockbroker Grenfell & Colegrave (now part of CIBC) as a Chemical & Pharmaceutical
sector analyst, where he repeated his ICI success by correctly identifying the group’s strong cyclical recovery,
and was quickly head-hunted in 1984 to join the Chemical & Pharmaceutical sector team of the progressive stockbroker, Buckmaster & Moore (now part of Credit Suisse) as a chemical analyst and specialist salesperson.

Intellisys 2MQ – UK Chemical Sector 20 April 2012
©Intelligent Analysis Limited www.intellisys.uk.com 5 of 48
It was here that Philip recognised the analytical potential and competitive advantage for building a sector
database and structured company models as well the importance of effective mass communication of
investment ideas to clients.
In 1987, the Buckmaster & Moore chemical team was head-hunted by Smith New Court (now part of Bank of America Merrill Lynch), which had aspirations to build a global investment bank. Smith New Court’s
entrepreneurial environment together with Philip’s enthusiasm for IT encouraged him to further develop and
fully leverage the potential of the financial company models and sector database by combining these with then cutting edge PC technology, such as Lotus Organiser and PC fax cards to develop a rudimentary CRM system
and mass communications platform. By 1992, the team’s success (universally ranked as the UK’s number 1 chemical sector team) based on thoughtful and incisive research, and the disciplined application of technology,
encouraged Smith New Court’s management to second Philip to a transformational group IT project – LION, a bespoke integrated research production and distribution platform - that was successfully implemented across
the group’s research departments.
Philip, due to his passion for financial analysis together with a growing interest for the environment and
sustainability, additionally took on the researching of the Waste Management sector and, within a year, was the number one ranked analyst. Moreover, Smith New Court had been asked to pitch for the global IPOs of Waste
Management International and Browning Ferris International, two of the world’s largest waste management
groups. At the same time, the chemical team’s growing international reputation resulted in Philip being appointed the lead analyst for the successful global IPO of the Chinese ‘blue chip’ Shanghai Chlor-Alkali.
Following Merrill Lynch’s takeover of Smith New Court in 1995, Philip was head-hunted to join Nikko Europe
(Japan’s second largest global investment bank, which is now part of Citi Group) as Co-Head of European Equity
Research. Here Philip restructured Nikko Europe’s research layout and repositioned the content to focus more clearly upon a rapidly growing institutional demand for objective and forthright value creation analysis. Philip
extended his UK chemical sector research coverage to include the key European chemical companies. At the same time, he developed a cross-border valuation model and published a series of Financial Benchmarking
books for the UK, pan-European and Japanese (1st Section of Tokyo Stock Exchange) quoted chemical
companies. Philip also worked closely with Nikko’s UK commercial banking team and Nikko Principal Finance, which provided him with an insight into the rapidly growing private equity market.
In 1999, Philip was head-hunted to join Paribas (now BNP Paribas) where he successfully identified the
consolidation potential of the industrial gases segment of the chemical sector as well as BP’s takeover of
Burmah Castrol. Old Mutual Securities capitalised upon BNP’s unfortunately disruptive acquisition of Paribas and Philip joined in 2000 as a Director, providing chemical sector research and later assumed the roles of
supervisory analyst and ‘shadow’ Head of Research. Philip also mentored the junior analysts with a focus upon accounting, valuation and report writing. Additionally, Philip developed a model that correctly identified all the
takeovers within the chemical sector.
Philip left Old Mutual in early 2002 and teamed up with three chemical industry friends and jointly established
Cogency Chemical Consultants Limited (www.cogency.biz), a specialist commercial due diligence provider for the private equity market. Initially, Cogency provided advice on the UK fine chemicals segment but rapidly
increased the breadth of its capabilities, which now extend from biopharma and agrochemical intermediates all
the way through to bulk chemicals. In addition, Cogency extended its geographic service coverage into mainland Europe.
Upon joining the financial conglomerate, Rivington Street Holdings in 2008 as the Director of Business
Development for its PLUS Markets and AIM focused corporate finance unit, Philip took a progressively less
active role within Cogency, and in June 2009 was appointed Head of Research for Rivington Street’s underperforming contracted small cap company research business, Growth Equities & Company Research. Philip
recognised the unit’s issues and progressively set about correcting them while building upon its strengths, such that by late 2011 the business was increasingly profitable and had grown its client base to become the UK’s
second largest provider. Philip, despite his demanding management commitments, continued to write company research that extended across sectors as diverse as biopharma, chemicals, property, industrials and TMT
(Telecoms/Media/Technology).
In the closing weeks of 2011, Philip decided that it was time to move on and start the next chapter in his career
with Intellisys.

Intellisys 2MQ – UK Chemical Sector 20 April 2012
©Intelligent Analysis Limited www.intellisys.uk.com 6 of 48
Measuring Management Quality - Conclusions
This unique annual report has one key objective: to quantitatively measure the management quality of the
diverse UK quoted chemical sector.
The report is unique because it is analysing and rigorously scoring the financial performances of the chemical
companies listed on BOTH of The London Stock Exchange’s UK markets – Main (or Official List) and AIM (its junior market).
Its prime objective should chime with most investors because an often cited key investment criterion is to ‘back good management teams’ in order to meet their fundamental investment objectives of maximising both capital appreciation and income growth. These are long term objectives and share price performances should be viewed in a similar context.
The outcome of this rigorous financial analysis may surprise, because the AIM quoted companies performed at least as well as their more mature Main market peers, and were broadly spread across all the quartiles. For
example, Plastics Capital (AIM listed) was not only a first quartile company but ranked third overall in the analysis, while long-established Johnson Matthey was a surprising fourth quartile member.
The analysis showed that there is a good correlation between the Main market company’s rankings and their share prices. Overall, first quartile ranked companies recorded a consistently strong performance compared to
their respective benchmark market index and as such are likely to be core sector holdings within a structured portfolio. Generally, stronger share price performances were demonstrated by those companies consistently
moving up through quartiles (e.g. Croda International) because they are delivering against their strategic business plans and the shares are being appropriately re-rated, while the converse is true for companies
steadily moving down through the quartiles. Finally, companies that consistently rank in the fourth quartile are
more likely to underperform their respective market’s benchmark index. However, these companies should be watched because they could become takeover candidates or the next rising star that is led by a new and
previously successful management team.
Interestingly, the analysis revealed a striking disconnect between the quartile rankings and share price
performances of the AIM listed companies. The primary reason behind these share price outcomes is that Main market listed shares typically have better company research coverage from investment banks and stockbrokers
that actively encourages ‘Institutional’ engagement for the market. The same, however, cannot be said for the AIM market, where good quality company research coverage is frequently limited, intermittent or in most cases
non-existent, which substantially increases Institutional investors’ perceptions of investment risk and provides a
reason not to invest.
To overcome this, we believe AIM companies should be actively investing in improving the depth and quality of their company research coverage in order to capture the attention of, and engage with, both Institutional and
retail investors. This process will reduce misplaced perceptions of investment risk while stimulating market
liquidity and ultimately resulting in share prices more accurately reflecting management quality.

Intellisys 2MQ – UK Chemical Sector 20 April 2012
©Intelligent Analysis Limited www.intellisys.uk.com 7 of 48
Measuring Management Quality - Methodology
The objective of this annual financial benchmarking analysis of the quoted UK chemical sector is to
quantitatively measure management quality.
The report is unique, in that it analyses company performance across London’s stock markets, Main (Official
List) and AIM (Alternative Investment Market), presenting a complete picture of the sector.
Its objective should chime with investors across the entire investing spectrum, from private investors and venture capitalists through to fund managers. Most would claim that a key investment criterion is backing good
management teams in order to deliver their fundamental investment objectives, which are
• Capital appreciation, and
• Income growth.
These are long term objectives and share price performances should consequently be reviewed with that perspective.
Through our analysis, investors should be able to identify the best managers within the sector, and maximise
structured portfolio returns by investing in consistent performers and identifying rising and fading stars as well
as capitalising upon other anomalies.
The companies’ financial performances have been studied across the following 6 categories:
• Performance
• Development
• Financial Strength
• Productivity
• Capital Efficiency
• Strength of Returns
and through this approach, all the statutory financial accounts have been analysed.
The Performance category examines the overall financial results of the businesses analysed starting with basic growth indicator of turnover (or sales revenues) before digging down into the different levels of ‘headline’
profitability measures - e.g., EBITDA (earnings before interest, taxation, depreciation and amortisation), Operating Profit, etc. – to explore not only the direct impact of a management’s chosen growth strategy but
their ability to manage the business, successfully or otherwise, through changing economic environments and
competitive markets. In addition, the analysis reviews the impact of equity issuance upno these performance metrics.
The Development section examines how each of the companies within the sector fund their growth strategy.
Corporate growth, whether through organic development, acquisition or a combination of both, is of particular
interest to investors but there is no right or wrong strategy. However, it IS critically important that a management team clearly and openly conveys to the owners of the business (i.e., shareholders) the “how’s and
why’s” of their growth strategy, together with the anticipated delivery milestones.
Management teams must also recognise that investors have limited funding tolerance no matter how exciting
their growth strategy may appear. This can have long term implications for a company’s share price, i.e., a successful company is one that does not constantly come back to its shareholders with the begging bowl
outstretched!
Financial Strength examines the relative financial position of the sector from a capital and income
perspective. Investors and stakeholders have learned to their cost that capital and income gearing ratios should

Intellisys 2MQ – UK Chemical Sector 20 April 2012
©Intelligent Analysis Limited www.intellisys.uk.com 8 of 48
always be looked at in conjunction and never in isolation, regardless of what any company’s management or its
advisers might say to the contrary. And in all cases, it is the trend that is important, and it should be viewed
against what is happening to cash flow.
The Productivity category analyses the effective use of the business’ core assets, its people. These measures are not necessarily a guide to identifying overall success given the diversity of the sector and the companies’
respective end markets but management ought to be striving for a consistently improving trend. This can only
be achieved by constantly reviewing business costs, product development, seeking new market opportunities at home and abroad as well analysing their competitors’ strengths and weaknesses.
The Capital Efficiency category examines how effectively each management team utilise their capital base.
The final category, Rates of Return, analyses the financial returns (both capital and income) generated by the companies within the sector and their relative robustness. The most striking observation is that profit margins
have recovered from their cyclical lows and, generally, are greater than for the cyclical peak years immediately before what turned out to be the deepest global synchronised recession since the Second World War. This is
also true for the returns being generated upon the capital deployed by the companies to generate their
revenues.
Obviously, the past is not necessarily a reliable guide to the future, but management teams do not change annually and neither does a company’s strategic business plan. Moreover, the company performances are being
measured over similar time frames (last 6 financial years), which means economic circumstances are similar.
The individual company performances (see Company Section) are, therefore, a testament to the responsiveness of the respective management teams to those changing circumstances and the robustness of their strategic
business plan.

Intellisys 2MQ – UK Chemical Sector 20 April 2012
©Intelligent Analysis Limited www.intellisys.uk.com 9 of 48
Measuring Management Quality - Results
We have used a rigorous scoring system to rank the companies into quartiles, looking at performance in all key
indicators over the last six years. This means that companies with less than six years’ audited results, e.g., AZ Electronic Materials and Oxford Advanced Surfaces, might have been somewhat penalised due to a lack of
sufficient financial history. Nevertheless, both companies scored well, although it is still too early to determine
whether they will do better over time – company-specific research should provide that answer.
Table: Benchmarking Results
Quartile Total Sector Main AIM
1 Elementis ●Victrex ●Plastics Capital ●
2 Croda International ●Hardide ●AZ Electronic Materials ●Porvair ●
3 Inditherm ●Scapa Group ●Zotefoams ●Yule Catto ●
4 Byotrol ●Carclo ●Oxford Advanced Surfaces ●Johnson Matthey ●Plant Healthcare ●
Market
© Intelligent Analysis Limited
The overall results of this analysis may surprise, not least because the AIM quoted companies generally
performed as well as their more mature Main market peers. For example, Plastics Capital (AIM listed) was not only a first quartile company but ranked third overall in the analysis! In fact, the AIM companies were broadly
spread across all the quartiles. Meanwhile, Johnson Matthey was a surprising fourth quartile member, due most probably to its exposure to precious metals (gold and platinum) and a leading position within the global
automotive market (auto catalysts) depressing its overall performance relative to its sector peers.
A key objective of this analysis was to link the quantitative results to individual company share price
performance. All things being equal, a rational expectation would be for the first quartile companies to exhibit consistently strong share price performances, even when measured against their respective market benchmark
index and as such these companies ought to be core holdings within a structured portfolio.
Companies that are steadily moving up through the third and second quartiles (e.g., Croda International and
Scapa Group) should generate significantly stronger share price performances than the first quartile companies because they are delivering against their articulated strategic business plans and are in the process of being
appropriately re-rated. The converse should be true for those companies moving down through the quartiles.
Finally, those companies that persistently rank in the fourth quartile should consistently underperform,
particularly against their respective market’s benchmark index until they complete the devaluation process and become increasingly investor friendless. However, these fourth quartile companies should be watched closely
because they could become takeover candidates or the next rising star following a change of management.
Intellisys 2MQ – UK Chemical Sector 20 April 2012
©Intelligent Analysis Limited www.intellisys.uk.com 10 of 48
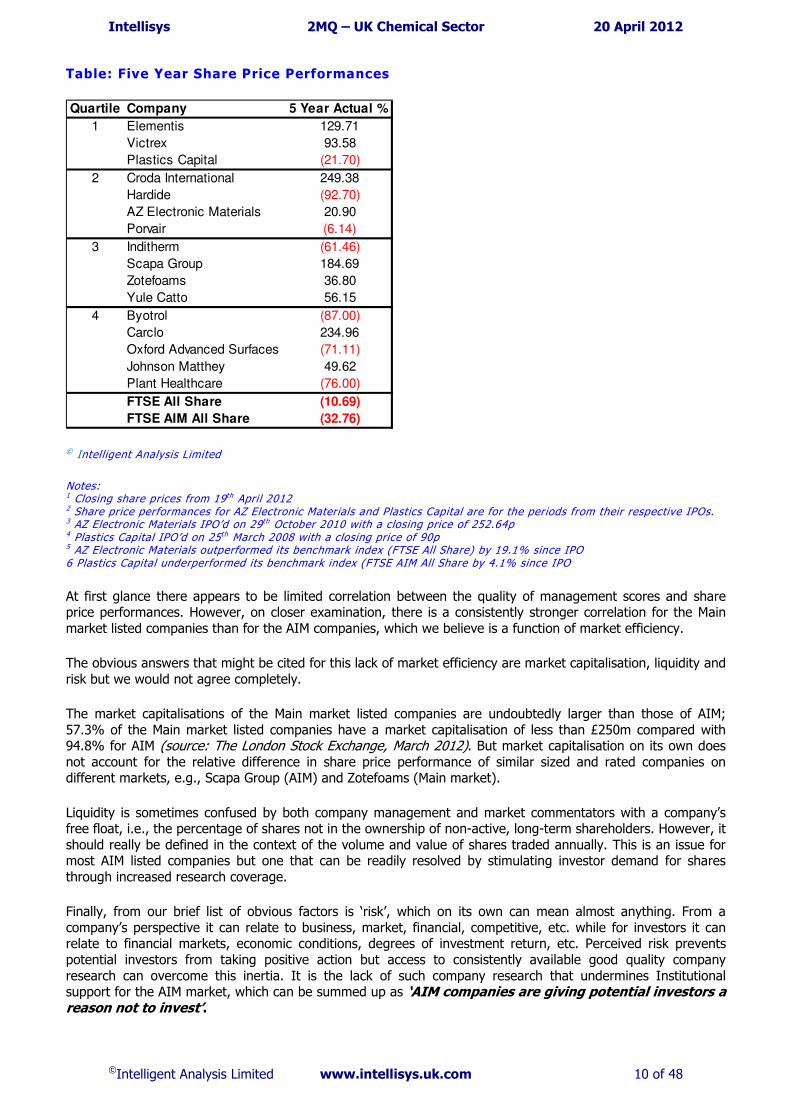
Table: Five Year Share Price Performances
Quartile Company 5 Year Actual %
1 Elementis 129.71
Victrex 93.58
Plastics Capital (21.70)
2 Croda International 249.38
Hardide (92.70)
AZ Electronic Materials 20.90
Porvair (6.14)
3 Inditherm (61.46)
Scapa Group 184.69
Zotefoams 36.80
Yule Catto 56.15
4 Byotrol (87.00)
Carclo 234.96
Oxford Advanced Surfaces (71.11)
Johnson Matthey 49.62
Plant Healthcare (76.00)
FTSE All Share (10.69)
FTSE AIM All Share (32.76)
© Intelligent Analysis Limited
Notes: 1 Closing share prices from 19 th April 2012 2 Share price performances for AZ Electronic Materials and Plastics Capital are for the periods from their respective IPOs. 3 AZ Electronic Materials IPO’d on 29th October 2010 with a closing price of 252.64p 4 Plastics Capital IPO’d on 25th March 2008 with a closing price of 90p 5 AZ Electronic Materials outperformed its benchmark index (FTSE All Share) by 19.1% since IPO 6 Plastics Capital underperformed its benchmark index (FTSE AIM All Share by 4.1% since IPO
At first glance there appears to be limited correlation between the quality of management scores and share price performances. However, on closer examination, there is a consistently stronger correlation for the Main
market listed companies than for the AIM companies, which we believe is a function of market efficiency.
The obvious answers that might be cited for this lack of market efficiency are market capitalisation, liquidity and
risk but we would not agree completely.
The market capitalisations of the Main market listed companies are undoubtedly larger than those of AIM;
57.3% of the Main market listed companies have a market capitalisation of less than £250m compared with 94.8% for AIM (source: The London Stock Exchange, March 2012). But market capitalisation on its own does not account for the relative difference in share price performance of similar sized and rated companies on different markets, e.g., Scapa Group (AIM) and Zotefoams (Main market).
Liquidity is sometimes confused by both company management and market commentators with a company’s free float, i.e., the percentage of shares not in the ownership of non-active, long-term shareholders. However, it
should really be defined in the context of the volume and value of shares traded annually. This is an issue for most AIM listed companies but one that can be readily resolved by stimulating investor demand for shares
through increased research coverage.
Finally, from our brief list of obvious factors is ‘risk’, which on its own can mean almost anything. From a
company’s perspective it can relate to business, market, financial, competitive, etc. while for investors it can relate to financial markets, economic conditions, degrees of investment return, etc. Perceived risk prevents
potential investors from taking positive action but access to consistently available good quality company
research can overcome this inertia. It is the lack of such company research that undermines Institutional support for the AIM market, which can be summed up as ‘AIM companies are giving potential investors a reason not to invest’.

Intellisys 2MQ – UK Chemical Sector 20 April 2012
©Intelligent Analysis Limited www.intellisys.uk.com 11 of 48
Table: Market Efficiency
Main market AIM
Perceived high liquidity Perceived low liquidity
+ + Perceived lower risk Perceived higher risk
+ + Abundant company research Limited company research
= =
Investor activity Investor inertia
Efficient Share Valuation Inefficient Share Valuation
© Intelligent Analysis Limited
Most AIM and small cap companies are ambitious and aspiring to be the next AstraZeneca, Google, etc. Therefore, it is incongruous that their adopted investor relations strategies are structured to undermine interest
in their shares by minimising visibility. Moreover, those policies are actively shrinking the investor pool thereby
reducing market liquidity and unnecessarily and disproportionately raising the cost of capital.
In our view, AIM listed and other small cap companies should be establishing investor relations strategies that reverse the above vicious circle by actively increasing the sources of consistently good quality research
coverage. Scapa Group is the exception that proves this rule because, as a former Main market listed company
now on AIM, it has broad research coverage and high liquidity, which has contributed to its exceptional share price performance relative to its AIM peers.

Intellisys 2MQ – UK Chemical Sector 20 April 2012
©Intelligent Analysis Limited www.intellisys.uk.com 12 of 48
Company Performances

Intellisys 2MQ – UK Chemical Sector 20 April 2012
©Intelligent Analysis Limited www.intellisys.uk.com 13 of 48
AZ Electronic Materials SA ☺☺☺☺
AZ Electronic Materials produce high quality, high-purity speciality chemicals and materials for use in integrated circuits and devices, flat panel displays, LEDs and photolithographic printing. AZ enables innovation throughout
the “digital world” where there is increasing global demand and a drive towards smaller, faster, more powerful and less expensive technology.
Overall Company Score
Category 2011 2010 2009
Performance ☺☺☺☺ ☺☺☺☺ �
Development ☺☺☺☺ ☺☺☺☺ ☺☺☺☺
Financial Strength ☺☺☺☺ � ����
Productivity � ☺☺☺☺ ����
Capital Efficiency � ☺☺☺☺ ☺☺☺☺
Rates of Return ☺☺☺☺ ☺☺☺☺ �
Overall ☺☺☺☺ ☺☺☺☺ �
Score
Growth Strategy
2011 2010 2009 2008
Acquisitive Organic Organic Organic
Business Profile
Divisional Geographic
IC Materials Optronics Printing & Other
Europe USA Asia
Share Performance

Intellisys 2MQ – UK Chemical Sector 20 April 2012
©Intelligent Analysis Limited www.intellisys.uk.com 14 of 48
Company Scores
Year ended 31 December 2011 2010 2009
Performance Turnover (£m) ���� ���� ����
Turnover per share (p) ���� ���� ����
EBITDA (£m) ���� ���� ����
EBITDA per share (p) ���� ���� ����
EBIT (£m) ���� ���� ����
EBIT per share (p) ���� ���� ����
Operating Profit (£m) ���� ���� ����
Operating Profit per share (p) ���� ���� ����
Pre-tax Profit (£m) ���� ���� ����
EPS (p) ���� ���� ����
Dividend (p) ���� � �
Dividend Cover (x) ���� � �
Development Asset Expenditure (%) � ���� ����
Capex/Depreciation (x) ���� ���� ����
NAV (p) ���� ���� ����
Shares Issued �������� ���� ��������
Financial Strength Total Debt/Shareholders' Funds (%) ���� ���� ����
Net Debt/Shareholders' Funds (%) ���� ���� ����
Total Debt/Total Capital Employed (%) ���� ���� ����
Net Debt/Total Capital Employed (%) ���� ���� ����
Interest Cover (x) ���� ���� ����
Productivity Turnover per Employee (£000) ���� ���� ����
YoY % change ���� ���� ����
Operating Profit per Employee (£000) ���� ���� ����
YoY % change ���� ���� ����
No. of Employees ���� ���� ����
YoY % change ���� ���� ����
Capital Efficiency Working Capital/Turnover (%) � � �
Turnover/Total Fixed Assets (x) ���� ���� ����
Turnover/Total Capital Employed (x) ���� ���� ����
Depreciation/Total Fixed Assets (%) ���� ���� ����
Rates of Return EBITDA Margin (%) ���� ���� ����
EBIT Margin (%) ���� ���� ����
Operating Profit Margin (%) ���� ���� ����
ROACE (%) ���� ���� ����
ROANA (%) ���� ���� ����
Trend

Intellisys 2MQ – UK Chemical Sector 20 April 2012
©Intelligent Analysis Limited www.intellisys.uk.com 15 of 48
Byotrol plc ����
Byotrol is a leading developer and provider of anti-microbial technologies for the global industrial, household and person care markets. Its products are used in the high need hygiene environments of healthcare, food
production, animal welfare and many other environments including the home because they are fast acting with long lasting protection (hours to months depending upon formulation); highly potent germ killers (99.99999%
effective) and; have broad-based efficacy across all the microbial classes of bacteria, viruses, fungi, moulds, micro bacteria and algae.
Overall Company Score
Category 2011 2010 2009 2008 2007
Performance ���� ☺☺☺☺ � ���� �
Development � ☺☺☺☺ ☺☺☺☺ � �
Financial Strength � � ☺☺☺☺ ���� ����
Productivity ���� ☺☺☺☺ ���� � ☺☺☺☺
Capital Efficiency ���� ☺☺☺☺ ���� ☺☺☺☺ ☺☺☺☺
Rates of Return ���� ☺☺☺☺ � ���� ☺☺☺☺
Overall ���� ☺☺☺☺ � � �
Score
Growth Strategy
2011 2010 2009 2008 2007
Acquisitive Acquisitive Acquisitive Acquisitive Organic
Business Profile
Divisional Geographic
Products Licence Fees Royalties
UK North America Rest of World
Share Performance

Intellisys 2MQ – UK Chemical Sector 20 April 2012
©Intelligent Analysis Limited www.intellisys.uk.com 16 of 48
Company Scores
Year ended 31 March 2011 2010 2009 2008 2007
Performance Turnover (£m) ���� ���� ���� ���� ����
Turnover per share (p) ���� ���� ���� ���� ����
EBITDA (£m) ���� ���� ���� ���� ����
EBITDA per share (p) ���� ���� ���� ���� ����
EBIT (£m) ���� ���� ���� ���� ����
EBIT per share (p) ���� ���� ���� ���� ����
Operating Profit (£m) ���� ���� ���� ���� ����
Operating Profit per share (p) ���� ���� ���� ���� ����
Pre-tax Profit (£m) ���� ���� ���� ���� ����
EPS (p) ���� ���� ���� ���� ����
Dividend (p) � � � � �
Dividend Cover (x) � � � � �
Development Asset Expenditure (%) � ���� ���� � �
Capex/Depreciation (x) ���� ���� ���� ���� ����
NAV (p) ���� ���� ���� ���� ����
Shares Issued ���� ���� ���� ���� ����
Financial Strength Total Debt/Shareholders' Funds (%) ���� � � � �
Net Debt/Shareholders' Funds (%) ���� ���� ���� ���� ����
Total Debt/Total Capital Employed (%) ���� � � � �
Net Debt/Total Capital Employed (%) ���� ���� ���� ���� ����
Interest Cover (x) ���� ���� ���� ���� ����
Productivity Turnover per Employee (£000) ���� ���� ���� ���� ����
YoY % change ���� ���� ���� ���� ����
Operating Profit per Employee (£000) ���� ���� ���� ���� ����
YoY % change ���� ���� ���� ���� ����
No. of Employees � ���� ���� ���� ����
YoY % change ���� ���� ���� ���� ����
Capital Efficiency Working Capital/Turnover (%) ���� � ���� � ����
Turnover/Total Fixed Assets (x) ���� ���� ���� ���� ����
Turnover/Total Capital Employed (x) ���� ���� ���� ���� ����
Depreciation/Total Fixed Assets (%) ���� ���� ���� ���� ����
Rates of Return EBITDA Margin (%) ���� ���� ���� ���� ����
EBIT Margin (%) ���� ���� ���� ���� ����
Operating Profit Margin (%) ���� ���� ���� ���� ����
ROACE (%) ���� ���� ���� ���� ����
ROANA (%) ���� ���� ���� ���� ����
Trend

Intellisys 2MQ – UK Chemical Sector 20 April 2012
©Intelligent Analysis Limited www.intellisys.uk.com 17 of 48
Carclo plc �
Carclo is a technology-led plastics business. Carclo Technical Plastics manufactures fine tolerance moulded plastic components used in medical, telecom and electronics products. Precision Products designs and
manufactures a range of lighting and control systems for the automotive and aerospace industries. Conductive Inkjet Technology produces UV curable inks and technology for the direct write of conductive metals onto non-
porous substrates, e.g., RFID tags, smart packaging, medical sensors, touch screens, etc.
Overall Company Score
Category 2011 2010 2009 2008 2007
Performance ☺☺☺☺ ☺☺☺☺ � � ☺☺☺☺
Development � ���� � � ☺☺☺☺
Financial Strength � ☺☺☺☺ ���� � ☺☺☺☺
Productivity ���� � ☺☺☺☺ � ☺☺☺☺
Capital Efficiency ���� ���� � ☺☺☺☺ ☺☺☺☺
Rates of Return � � � ���� �
Overall � � � � ☺☺☺☺
Score
Growth Strategy
2011 2010 2009 2008 2007
Organic Organic Acquisitive Organic Divesting
Business Profile
Divisional Geographic
Technical Products Precision Products Conductive Inkjet Technology
UK North America Rest of World
Share Performance

Intellisys 2MQ – UK Chemical Sector 20 April 2012
©Intelligent Analysis Limited www.intellisys.uk.com 18 of 48
Company Scores
Year ended 31 March 2011 2010 2009 2008 2007
Performance Turnover (£m) ���� ���� ���� ���� ����
Turnover per share (p) ���� ���� ���� ���� ����
EBITDA (£m) ���� ���� ���� ���� ����
EBITDA per share (p) ���� ���� ���� ���� ����
EBIT (£m) ���� ���� ���� ���� ����
EBIT per share (p) ���� ���� ���� ���� ����
Operating Profit (£m) ���� ���� ���� ���� ����
Operating Profit per share (p) ���� ���� ���� ���� ����
Pre-tax Profit (£m) ���� ���� ���� ���� ����
EPS (p) ���� ���� ���� ���� ����
Dividend (p) ���� � ���� ���� ����
Dividend Cover (x) ���� ���� ���� ���� ����
Development Asset Expenditure (%) � � � � ����
Capex/Depreciation (x) ���� ���� ���� ���� ����
NAV (p) ���� ���� ���� ���� ����
Shares Issued ���� ���� �������� ���� ����
Financial Strength Total Debt/Shareholders' Funds (%) ���� ���� ���� ���� ����
Net Debt/Shareholders' Funds (%) ���� ���� ���� ���� ����
Total Debt/Total Capital Employed (%) ���� ���� ���� ���� ����
Net Debt/Total Capital Employed (%) ���� ���� ���� ���� ����
Interest Cover (x) ���� ���� ���� ���� ����
Productivity Turnover per Employee (£000) ���� ���� ���� ���� ����
YoY % change ���� ���� ���� ���� ����
Operating Profit per Employee (£000) ���� ���� ���� ���� ����
YoY % change ���� ���� ���� ���� ����
No. of Employees ���� ���� ���� ���� ����
YoY % change ���� ���� ���� ���� ����
Capital Efficiency Working Capital/Turnover (%) � ���� ���� � ����
Turnover/Total Fixed Assets (x) ���� ���� ���� ���� ����
Turnover/Total Capital Employed (x) ���� ���� ���� ���� ����
Depreciation/Total Fixed Assets (%) ���� ���� ���� ���� ����
Rates of Return EBITDA Margin (%) ���� ���� ���� ���� ����
EBIT Margin (%) ���� ���� ���� ���� ����
Operating Profit Margin (%) ���� ���� ���� ���� ����
ROACE (%) ���� ���� ���� ���� ����
ROANA (%) ���� ���� ���� ���� ����
Trend

Intellisys 2MQ – UK Chemical Sector 20 April 2012
©Intelligent Analysis Limited www.intellisys.uk.com 19 of 48
Croda International plc ☺☺☺☺
Croda is a global leader in natural based speciality chemicals that are sold to virtually every type of industry. Consumer Care is a global business servicing the growing personal care, health care and crop care markets with
innovative solutions and sustainable ingredients. Industrial Specialities comprises home care, base oleochemicals, additives for polymers, polymers and coatings, lubricants and lubricant additives, and processed
vegetable oils.
Overall Company Score
Category 2011 2010 2009 2008 2007
Performance ☺☺☺☺ ☺☺☺☺ � ☺☺☺☺ ☺☺☺☺
Development � ☺☺☺☺ ☺☺☺☺ ☺☺☺☺ ☺☺☺☺
Financial Strength � ☺☺☺☺ ���� ☺☺☺☺ ☺☺☺☺
Productivity � ☺☺☺☺ � ☺☺☺☺ �
Capital Efficiency ☺☺☺☺ ☺☺☺☺ ☺☺☺☺ ���� ☺☺☺☺
Rates of Return ☺☺☺☺ ☺☺☺☺ ☺☺☺☺ � �
Overall ☺☺☺☺ ☺☺☺☺ ☺☺☺☺ ☺☺☺☺ ☺☺☺☺
Score
Growth Strategy
2011 2010 2009 2008 2007
Organic Organic Organic Organic Divesting
Business Profile
Divisional Geographic
Consumer Care Industrial Specialities
Europe Americas Asia Rest of World
Share Performance

Intellisys 2MQ – UK Chemical Sector 20 April 2012
©Intelligent Analysis Limited www.intellisys.uk.com 20 of 48
Company Scores
Year ended 31 December 2011 2010 2009 2008 2007
Performance Turnover (£m) ���� ���� ���� ���� ����
Turnover per share (p) ���� ���� ���� ���� ����
EBITDA (£m) ���� ���� ���� ���� ����
EBITDA per share (p) ���� ���� ���� ���� ����
EBIT (£m) ���� ���� ���� ���� ����
EBIT per share (p) ���� ���� ���� ���� ����
Operating Profit (£m) ���� ���� ���� ���� ����
Operating Profit per share (p) ���� ���� ���� ���� ����
Pre-tax Profit (£m) ���� ���� ���� ���� ����
EPS (p) ���� ���� ���� ���� ����
Dividend (p) ���� ���� ���� ���� ����
Dividend Cover (x) ���� ���� ���� ���� ����
Development Asset Expenditure (%) ���� � ���� � ����
Capex/Depreciation (x) ���� ���� ���� ���� ����
NAV (p) ���� ���� ���� ���� ����
Shares Issued �������� �������� �������� �������� ����
Financial Strength Total Debt/Shareholders' Funds (%) ���� ���� ���� ���� ����
Net Debt/Shareholders' Funds (%) ���� ���� ���� ���� ����
Total Debt/Total Capital Employed (%) ���� ���� ���� ���� ����
Net Debt/Total Capital Employed (%) ���� ���� ���� ���� ����
Interest Cover (x) ���� ���� ���� ���� ����
Productivity Turnover per Employee (£000) ���� ���� ���� ���� ����
YoY % change ���� ���� ���� ���� ����
Operating Profit per Employee (£000) ���� ���� ���� ���� ����
YoY % change ���� ���� ���� ���� ����
No. of Employees ���� ���� ���� ���� ����
YoY % change ���� ���� ���� ���� ����
Capital Efficiency Working Capital/Turnover (%) � � � ���� �
Turnover/Total Fixed Assets (x) ���� ���� ���� ���� ����
Turnover/Total Capital Employed (x) ���� ���� ���� ���� ����
Depreciation/Total Fixed Assets (%) ���� ���� ���� ���� ����
Rates of Return EBITDA Margin (%) ���� ���� ���� ���� ����
EBIT Margin (%) ���� ���� ���� ���� ����
Operating Profit Margin (%) ���� ���� ���� ���� ����
ROACE (%) ���� ���� ���� ���� ����
ROANA (%) ���� ���� ���� ���� ����
Trend

Intellisys 2MQ – UK Chemical Sector 20 April 2012
©Intelligent Analysis Limited www.intellisys.uk.com 21 of 48
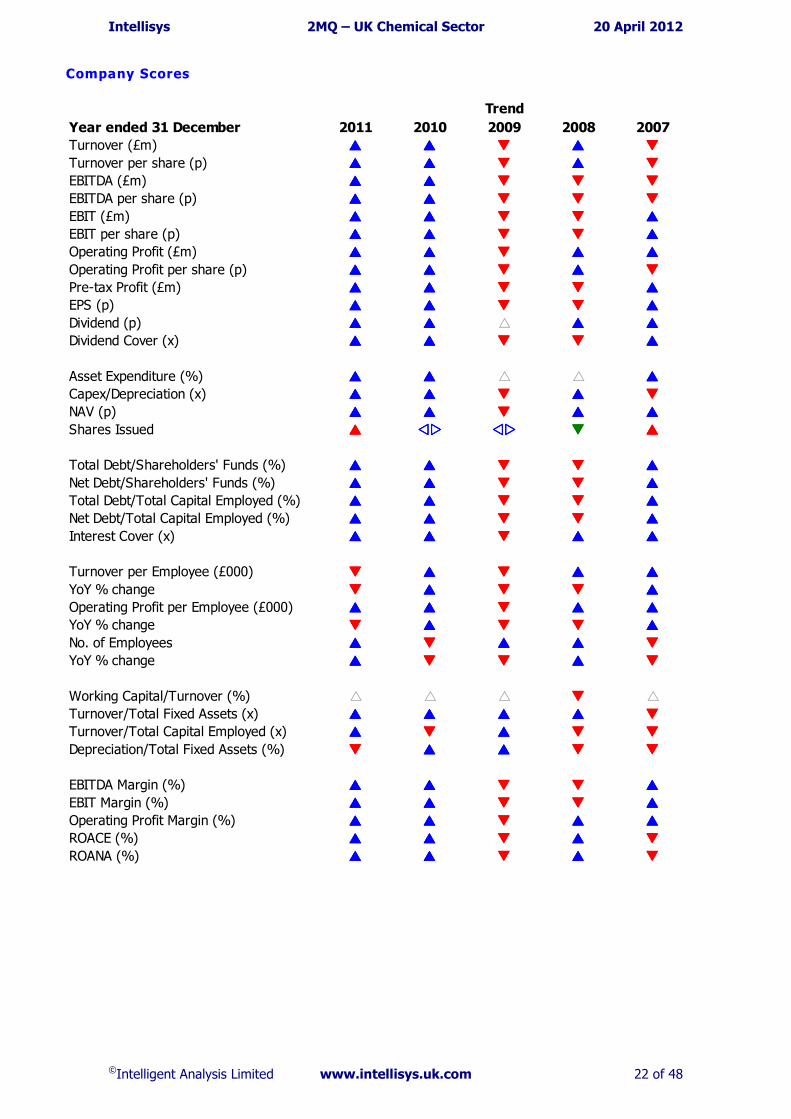
Elementis plc ☺☺☺☺
Elementis is a global specialty chemicals group. Specialty Products provides high value functional additives to the architectural and industrial coatings, personal care and oilfield drilling markets. Surfactants division
manufactures a wide range of intermediates for use in the production of chemical components for the oilfield services, household, textiles and leather, and pulp and paper industries. The Chromium division is a leading
producer of chromium chemicals for use in metal finishing and wood treatment, leather tanning, construction, refractory and metal production.
Overall Company Score
Category 2011 2010 2009 2008 2007
Performance ☺☺☺☺ ☺☺☺☺ ���� � �
Development ☺☺☺☺ ☺☺☺☺ ���� � ☺☺☺☺
Financial Strength ☺☺☺☺ ☺☺☺☺ ���� ���� ☺☺☺☺
Productivity ���� ☺☺☺☺ ���� � ☺☺☺☺
Capital Efficiency ☺☺☺☺ ☺☺☺☺ ☺☺☺☺ ���� ����
Rates of Return ☺☺☺☺ ☺☺☺☺ ���� � �
Overall ☺☺☺☺ ☺☺☺☺ ���� � ☺☺☺☺
Score
Growth Strategy
2011 2010 2009 2008 2007
Organic Organic Organic Acquisitive Divesting
Business Profile
Divisional Geographic
Specialty Products Surfactants Chromium
UK Rest of Europe North America Rest of World
Share Performance
Intellisys 2MQ – UK Chemical Sector 20 April 2012
©Intelligent Analysis Limited www.intellisys.uk.com 22 of 48
Company Scores
Year ended 31 December 2011 2010 2009 2008 2007
Turnover (£m) ���� ���� ���� ���� ����
Turnover per share (p) ���� ���� ���� ���� ����
EBITDA (£m) ���� ���� ���� ���� ����
EBITDA per share (p) ���� ���� ���� ���� ����
EBIT (£m) ���� ���� ���� ���� ����
EBIT per share (p) ���� ���� ���� ���� ����
Operating Profit (£m) ���� ���� ���� ���� ����
Operating Profit per share (p) ���� ���� ���� ���� ����
Pre-tax Profit (£m) ���� ���� ���� ���� ����
EPS (p) ���� ���� ���� ���� ����
Dividend (p) ���� ���� � ���� ����
Dividend Cover (x) ���� ���� ���� ���� ����
Asset Expenditure (%) ���� ���� � � ����
Capex/Depreciation (x) ���� ���� ���� ���� ����
NAV (p) ���� ���� ���� ���� ����
Shares Issued ���� �������� �������� ���� ����
Total Debt/Shareholders' Funds (%) ���� ���� ���� ���� ����
Net Debt/Shareholders' Funds (%) ���� ���� ���� ���� ����
Total Debt/Total Capital Employed (%) ���� ���� ���� ���� ����
Net Debt/Total Capital Employed (%) ���� ���� ���� ���� ����
Interest Cover (x) ���� ���� ���� ���� ����
Turnover per Employee (£000) ���� ���� ���� ���� ����
YoY % change ���� ���� ���� ���� ����
Operating Profit per Employee (£000) ���� ���� ���� ���� ����
YoY % change ���� ���� ���� ���� ����
No. of Employees ���� ���� ���� ���� ����
YoY % change ���� ���� ���� ���� ����
Working Capital/Turnover (%) � � � ���� �
Turnover/Total Fixed Assets (x) ���� ���� ���� ���� ����
Turnover/Total Capital Employed (x) ���� ���� ���� ���� ����
Depreciation/Total Fixed Assets (%) ���� ���� ���� ���� ����
EBITDA Margin (%) ���� ���� ���� ���� ����
EBIT Margin (%) ���� ���� ���� ���� ����
Operating Profit Margin (%) ���� ���� ���� ���� ����
ROACE (%) ���� ���� ���� ���� ����
ROANA (%) ���� ���� ���� ���� ����
Trend

Intellisys 2MQ – UK Chemical Sector 20 April 2012
©Intelligent Analysis Limited www.intellisys.uk.com 23 of 48
Hardide plc ☺☺☺☺
Hardide is the leading global innovator and developer of advanced Tungsten Carbide based metal coatings for internal and external surfaces to extend the life and optimise performance of components in a wide range of
demanding industrial applications. Some of the industrial markets served include oil & gas, aerospace, pharmaceuticals, pulp & paper, food processing and industrial gas turbines.
Overall Company Score
Category 2011 2010 2009 2008 2007
Performance ☺☺☺☺ ☺☺☺☺ � ☺☺☺☺ ����
Development ☺☺☺☺ ☺☺☺☺ ���� ���� �
Financial Strength ���� � � ���� ����
Productivity � ☺☺☺☺ ���� ���� ☺☺☺☺
Capital Efficiency ☺☺☺☺ � � ☺☺☺☺ ☺☺☺☺
Rates of Return � ☺☺☺☺ ���� � ����
Overall ☺☺☺☺ ☺☺☺☺ ���� � �
Score
Growth Strategy
2011 2010 2009 2008 2007
Organic Organic Organic Organic Divesting
Business Profile
Divisional Geographic
UK Europe North America Rest of World
Share Performance

Intellisys 2MQ – UK Chemical Sector 20 April 2012
©Intelligent Analysis Limited www.intellisys.uk.com 24 of 48
Company Scores
Year ended 31 September 2011 2010 2009 2008 2007
Turnover (£m) ���� ���� ���� ���� ����
Turnover per share (p) ���� ���� ���� ���� ����
EBITDA (£m) ���� ���� ���� ���� ����
EBITDA per share (p) ���� ���� ���� ���� ����
EBIT (£m) ���� ���� ���� ���� ����
EBIT per share (p) ���� ���� ���� ���� ����
Operating Profit (£m) ���� ���� ���� ���� ����
Operating Profit per share (p) ���� ���� ���� ���� ����
Pre-tax Profit (£m) ���� ���� ���� ���� ����
EPS (p) ���� ���� ���� ���� ����
Dividend (p) � � � � �
Dividend Cover (x) � � � � �
Asset Expenditure (%) ���� ���� � � �
Capex/Depreciation (x) ���� ���� ���� ���� ����
NAV (p) ���� ���� ���� ���� ����
Shares Issued �������� ���� ���� ���� ��������
Total Debt/Shareholders' Funds (%) ���� ���� ���� ���� ����
Net Debt/Shareholders' Funds (%) ���� ���� ���� ���� ����
Total Debt/Total Capital Employed (%) ���� ���� ���� ���� ����
Net Debt/Total Capital Employed (%) ���� ���� ���� ���� ����
Interest Cover (x) ���� ���� ���� ���� ����
Turnover per Employee (£000) ���� ���� ���� ���� ����
YoY % change ���� ���� ���� ���� ����
Operating Profit per Employee (£000) ���� ���� ���� ���� ����
YoY % change ���� ���� ���� ���� ����
No. of Employees ���� ���� ���� � ����
YoY % change ���� ���� ���� ���� ����
Working Capital/Turnover (%) � ���� � � ����
Turnover/Total Fixed Assets (x) ���� ���� ���� ���� ����
Turnover/Total Capital Employed (x) ���� ���� ���� ���� ����
Depreciation/Total Fixed Assets (%) ���� ���� ���� ���� ����
EBITDA Margin (%) ���� ���� ���� ���� ����
EBIT Margin (%) ���� ���� ���� ���� ����
Operating Profit Margin (%) ���� ���� ���� ���� ����
ROACE (%) ���� ���� ���� ���� ����
ROANA (%) ���� ���� ���� ���� ����
Trend

Intellisys 2MQ – UK Chemical Sector 20 April 2012
©Intelligent Analysis Limited www.intellisys.uk.com 25 of 48
Inditherm plc �
Inditherm is a provider of innovative solutions for difficult heating problems through the application of its unique, carbon-based polymer technology for the confectionary and food processing, chemicals,
pharmaceuticals, oil & gas, medical, utilities, construction and sport markets. Other applications include patient warming and heat therapy within the medical sector, critical temperature management for industrial processes,
accelerated concrete curing in construction and pitch heating within sports stadia and training grounds.
Overall Company Score
Category 2011 2010 2009 2008 2007
Performance ☺☺☺☺ ☺☺☺☺ ���� ☺☺☺☺ ☺☺☺☺
Development ☺☺☺☺ ☺☺☺☺ � � ☺☺☺☺
Financial Strength � ☺☺☺☺ � ���� ����
Productivity � ☺☺☺☺ ���� ☺☺☺☺ ☺☺☺☺
Capital Efficiency ☺☺☺☺ ☺☺☺☺ � ☺☺☺☺ �
Rates of Return ☺☺☺☺ ☺☺☺☺ ���� ☺☺☺☺ ☺☺☺☺
Overall ☺☺☺☺ ☺☺☺☺ ���� ☺☺☺☺ ☺☺☺☺
Score
Growth Strategy
2011 2010 2009 2008 2007
Acquisitive Organic Acquisitive Acquisitive Organic
Business Profile
Divisional Geographic
Industrial Standard Products Medical
NA
Share Performance

Intellisys 2MQ – UK Chemical Sector 20 April 2012
©Intelligent Analysis Limited www.intellisys.uk.com 26 of 48
Company Scores
Year ended 31 December 2011 2010 2009 2008 2007
Performance Turnover (£m) ���� ���� ���� ���� ����
Turnover per share (p) ���� ���� ���� ���� ����
EBITDA (£m) ���� ���� ���� ���� ����
EBITDA per share (p) ���� ���� ���� ���� ����
EBIT (£m) � ���� ���� ���� ����
EBIT per share (p) ���� ���� ���� ���� ����
Operating Profit (£m) ���� ���� ���� ���� ����
Operating Profit per share (p) ���� ���� ���� ���� ����
Pre-tax Profit (£m) ���� ���� ���� ���� ����
EPS (p) ���� ���� ���� ���� ����
Dividend (p) � � � � �
Dividend Cover (x) � � � � �
Development Asset Expenditure (%) ���� ���� � ���� ����
Capex/Depreciation (x) ���� ���� ���� ���� ����
NAV (p) ���� ���� ���� ���� ����
Shares Issued �������� �������� �������� ���� ��������
Financial Strength Total Debt/Shareholders' Funds (%) � � � � �
Net Debt/Shareholders' Funds (%) ���� ���� ���� ���� ����
Total Debt/Total Capital Employed (%) � � � � �
Net Debt/Total Capital Employed (%) ���� ���� ���� ���� ����
Interest Cover (x) ���� ���� ���� ���� ����
Productivity Turnover per Employee (£000) ���� ���� ���� ���� ����
YoY % change ���� ���� ���� ���� ����
Operating Profit per Employee (£000) ���� ���� ���� ���� ����
YoY % change ���� ���� ���� ���� ����
No. of Employees ���� ���� ���� ���� ����
YoY % change ���� ���� ���� ���� ����
Capital Efficiency Working Capital/Turnover (%) � � ���� � ����
Turnover/Total Fixed Assets (x) ���� ���� ���� ���� ����
Turnover/Total Capital Employed (x) ���� ���� ���� ���� ����
Depreciation/Total Fixed Assets (%) ���� ���� ���� ���� ����
Rates of Return EBITDA Margin (%) ���� ���� ���� ���� ����
EBIT Margin (%) ���� ���� ���� ���� ����
Operating Profit Margin (%) ���� ���� ���� ���� ����
ROACE (%) ���� ���� ���� ���� ����
ROANA (%) ���� ���� ���� ���� ����
Trend
Intellisys 2MQ – UK Chemical Sector 20 April 2012
©Intelligent Analysis Limited www.intellisys.uk.com 27 of 48
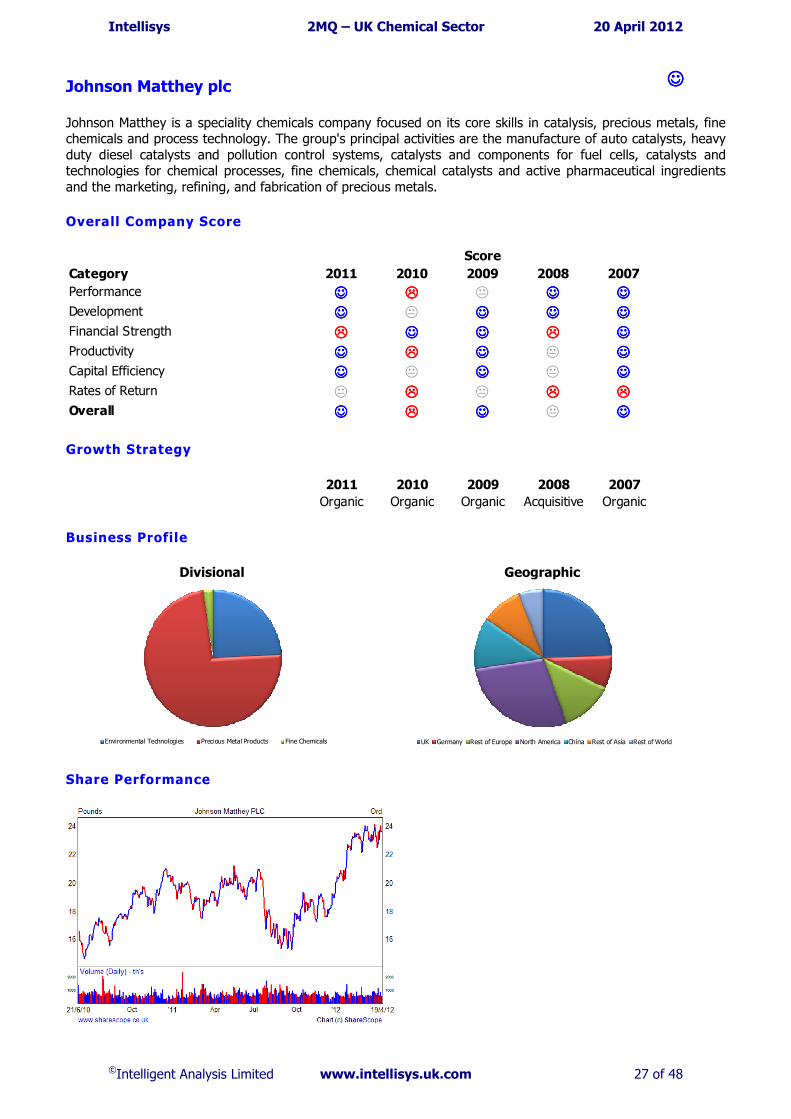
Johnson Matthey plc ☺☺☺☺
Johnson Matthey is a speciality chemicals company focused on its core skills in catalysis, precious metals, fine chemicals and process technology. The group's principal activities are the manufacture of auto catalysts, heavy
duty diesel catalysts and pollution control systems, catalysts and components for fuel cells, catalysts and technologies for chemical processes, fine chemicals, chemical catalysts and active pharmaceutical ingredients
and the marketing, refining, and fabrication of precious metals.
Overall Company Score
Category 2011 2010 2009 2008 2007
Performance ☺☺☺☺ ���� � ☺☺☺☺ ☺☺☺☺
Development ☺☺☺☺ � ☺☺☺☺ ☺☺☺☺ ☺☺☺☺
Financial Strength ���� ☺☺☺☺ ☺☺☺☺ ���� ☺☺☺☺
Productivity ☺☺☺☺ ���� ☺☺☺☺ � ☺☺☺☺
Capital Efficiency ☺☺☺☺ � ☺☺☺☺ � ☺☺☺☺
Rates of Return � ���� � ���� ����
Overall ☺☺☺☺ ���� ☺☺☺☺ � ☺☺☺☺
Score
Growth Strategy
2011 2010 2009 2008 2007
Organic Organic Organic Acquisitive Organic
Business Profile
Divisional Geographic
Environmental Technologies Precious Metal Products Fine Chemicals
UK Germany Rest of Europe North America China Rest of Asia Rest of World
Share Performance

Intellisys 2MQ – UK Chemical Sector 20 April 2012
©Intelligent Analysis Limited www.intellisys.uk.com 28 of 48
Company Scores
Year ended 31 March 2011 2010 2009 2008 2007
Performance Turnover (£m) ���� ���� ���� ���� ����
Turnover per share (p) ���� ���� ���� ���� ����
EBITDA (£m) ���� ���� ���� ���� ����
EBITDA per share (p) ���� ���� ���� ���� ����
EBIT (£m) ���� ���� ���� ���� ����
EBIT per share (p) ���� ���� ���� ���� ����
Operating Profit (£m) ���� ���� ���� ���� ����
Operating Profit per share (p) ���� ���� ���� ���� ����
Pre-tax Profit (£m) ���� ���� ���� ���� ����
EPS (p) ���� ���� ���� ���� ����
Dividend (p) ���� ���� ���� ���� ����
Dividend Cover (x) ���� ���� ���� ���� ����
Development Asset Expenditure (%) � ���� ���� � ����
Capex/Depreciation (x) ���� ���� ���� ���� ����
NAV (p) ���� ���� ���� ���� ����
Shares Issued �������� �������� ���� �������� ����
Financial Strength Total Debt/Shareholders' Funds (%) ���� ���� ���� ���� ����
Net Debt/Shareholders' Funds (%) ���� ���� ���� ���� ����
Total Debt/Total Capital Employed (%) ���� ���� ���� ���� ����
Net Debt/Total Capital Employed (%) ���� ���� ���� ���� ����
Interest Cover (x) ���� ���� ���� ���� ����
Productivity Turnover per Employee (£000) ���� ���� ���� ���� ����
YoY % change ���� ���� ���� ���� ����
Operating Profit per Employee (£000) ���� ���� ���� ���� ����
YoY % change ���� ���� ���� ���� ����
No. of Employees ���� ���� ���� ���� ����
YoY % change ���� ���� ���� ���� ����
Capital Efficiency Working Capital/Turnover (%) ���� ���� � ���� �
Turnover/Total Fixed Assets (x) ���� ���� ���� ���� ����
Turnover/Total Capital Employed (x) ���� ���� ���� ���� ����
Depreciation/Total Fixed Assets (%) ���� ���� ���� ���� ����
Rates of Return EBITDA Margin (%) ���� ���� ���� ���� ����
EBIT Margin (%) ���� ���� ���� ���� ����
Operating Profit Margin (%) ���� ���� ���� ���� ����
ROACE (%) ���� ���� ���� ���� ����
ROANA (%) ���� ���� ���� ���� ����
Trend

Intellisys 2MQ – UK Chemical Sector 20 April 2012
©Intelligent Analysis Limited www.intellisys.uk.com 29 of 48
Oxford Advanced Surfaces Group plc �
A research company that develops and licenses intellectual property in the areas of highly reactive chemistry and anti-reflective coatings for a range of applications including LCD/OLED displays, electronics processing
(including printed/plastic and organic electronics, batteries and PV/solar), advanced materials processing (membranes & composites) and eyewear (including ophthalmic). Its activities are focused only on those
applications where technical proof of concept has been established but deliver dramatic performance improvement and significantly improved economics for our customers.
Overall Company Score
Category 2010 2009 2008
Performance ☺☺☺☺ ☺☺☺☺ ����
Development ���� � ☺☺☺☺
Financial Strength � ���� ☺☺☺☺
Productivity � ���� ☺☺☺☺
Capital Efficiency ���� ☺☺☺☺ ☺☺☺☺
Rates of Return � ☺☺☺☺ �
Overall � ☺☺☺☺ ☺☺☺☺
Score
Growth Strategy
2010 2009 2008
Divesting Acquisitive Organic
Business Profile
Divisional Geographic
Reactive Chemistry Particle Technologies
NA
Share Performance

Intellisys 2MQ – UK Chemical Sector 20 April 2012
©Intelligent Analysis Limited www.intellisys.uk.com 30 of 48
Company Scores
Year ended 31 December 2010 2009 2008
Performance Turnover (£m) ���� ���� ����
Turnover per share (p) ���� ���� ����
EBITDA (£m) ���� ���� ����
EBITDA per share (p) ���� ���� ����
EBIT (£m) ���� ���� ����
EBIT per share (p) ���� ���� ����
Operating Profit (£m) ���� ���� ����
Operating Profit per share (p) ���� ���� ����
Pre-tax Profit (£m) ���� ���� ����
EPS (p) ���� ���� ����
Dividend (p) � � �
Dividend Cover (x) � � �
Development Asset Expenditure (%) � ���� ����
Capex/Depreciation (x) ���� ���� ����
NAV (p) ���� ���� ����
Shares Issued ���� ���� ��������
Financial Strength Total Debt/Shareholders' Funds (%) � � ����
Net Debt/Shareholders' Funds (%) ���� ���� ����
Total Debt/Total Capital Employed (%) � � ����
Net Debt/Total Capital Employed (%) ���� ���� ����
Interest Cover (x) ���� ���� ����
Productivity Turnover per Employee (£000) ���� ���� ����
YoY % change ���� ���� ����
Operating Profit per Employee (£000) ���� ���� ����
YoY % change ���� ���� ����
No. of Employees ���� ���� ����
YoY % change ���� ���� ����
Capital Efficiency Working Capital/Turnover (%) ���� � ����
Turnover/Total Fixed Assets (x) ���� ���� ����
Turnover/Total Capital Employed (x) ���� ���� ����
Depreciation/Total Fixed Assets (%) ���� ���� ����
Rates of Return EBITDA Margin (%) ���� ���� ����
EBIT Margin (%) ���� ���� ����
Operating Profit Margin (%) ���� ���� ����
ROACE (%) ���� ���� ����
ROANA (%) ���� ���� ����
Trend

Intellisys 2MQ – UK Chemical Sector 20 April 2012
©Intelligent Analysis Limited www.intellisys.uk.com 31 of 48
Plant Healthcare plc ☺☺☺☺
Plant Health Care is a leading provider of naturally based products for the agriculture and commercial landscaping industries. The company's innovative line of products creates both environmental and economic
benefits for its customers that include the major global agrochemical groups, and which capitalise upon long-term trends towards natural systems and biological solutions to promote plant health and growth.
Overall Company Score
Category 2011 2010 2009 2008 2007
Performance ☺☺☺☺ ���� ☺☺☺☺ ☺☺☺☺ ����
Development ���� � ☺☺☺☺ � �
Financial Strength ☺☺☺☺ ☺☺☺☺ ☺☺☺☺ � ☺☺☺☺
Productivity � ���� ☺☺☺☺ ☺☺☺☺ ☺☺☺☺
Capital Efficiency ☺☺☺☺ ���� � � ☺☺☺☺
Rates of Return ☺☺☺☺ ���� ☺☺☺☺ ☺☺☺☺ ����
Overall ☺☺☺☺ ���� ☺☺☺☺ ☺☺☺☺ �
Score
Growth Strategy
2011 2010 2009 2008 2007
Divesting Acquisitive Acquisitive Divesting Acquisitive
Business Profile
Divisional Geographic
NA
USA Mexico Europe
Share Performance
Intellisys 2MQ – UK Chemical Sector 20 April 2012
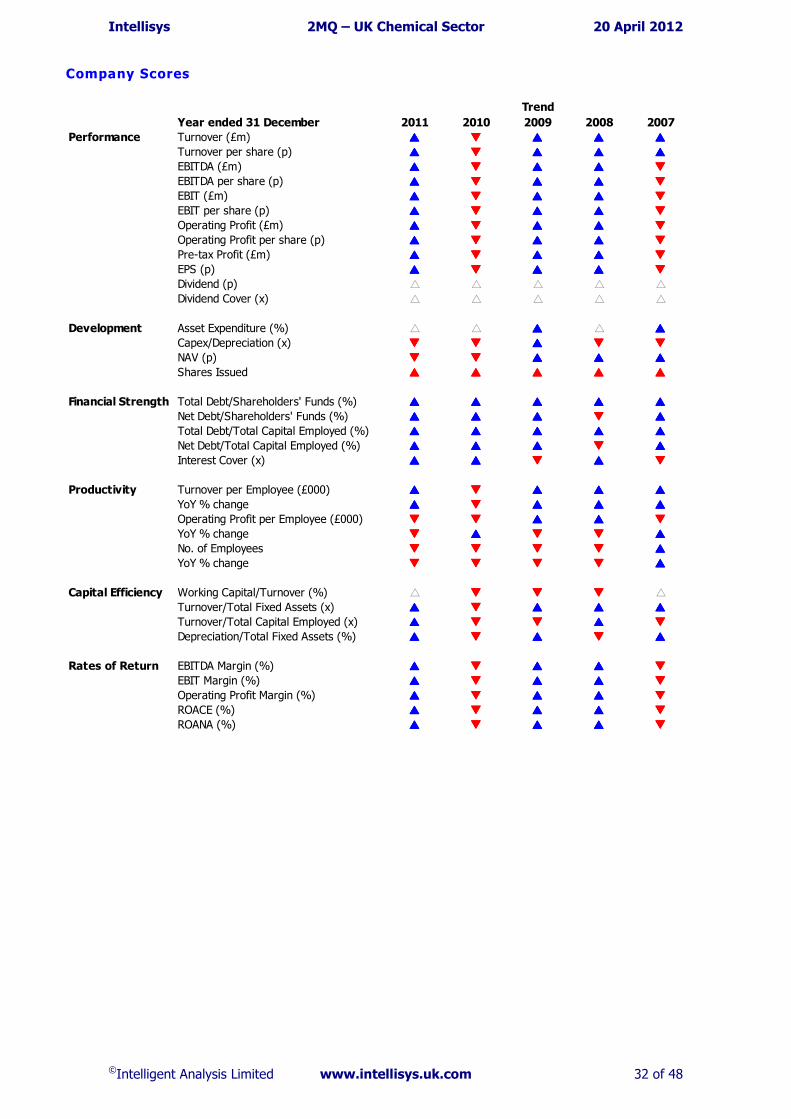
©Intelligent Analysis Limited www.intellisys.uk.com 32 of 48
Company Scores
Year ended 31 December 2011 2010 2009 2008 2007
Performance Turnover (£m) ���� ���� ���� ���� ����
Turnover per share (p) ���� ���� ���� ���� ����
EBITDA (£m) ���� ���� ���� ���� ����
EBITDA per share (p) ���� ���� ���� ���� ����
EBIT (£m) ���� ���� ���� ���� ����
EBIT per share (p) ���� ���� ���� ���� ����
Operating Profit (£m) ���� ���� ���� ���� ����
Operating Profit per share (p) ���� ���� ���� ���� ����
Pre-tax Profit (£m) ���� ���� ���� ���� ����
EPS (p) ���� ���� ���� ���� ����
Dividend (p) � � � � �
Dividend Cover (x) � � � � �
Development Asset Expenditure (%) � � ���� � ����
Capex/Depreciation (x) ���� ���� ���� ���� ����
NAV (p) ���� ���� ���� ���� ����
Shares Issued ���� ���� ���� ���� ����
Financial Strength Total Debt/Shareholders' Funds (%) ���� ���� ���� ���� ����
Net Debt/Shareholders' Funds (%) ���� ���� ���� ���� ����
Total Debt/Total Capital Employed (%) ���� ���� ���� ���� ����
Net Debt/Total Capital Employed (%) ���� ���� ���� ���� ����
Interest Cover (x) ���� ���� ���� ���� ����
Productivity Turnover per Employee (£000) ���� ���� ���� ���� ����
YoY % change ���� ���� ���� ���� ����
Operating Profit per Employee (£000) ���� ���� ���� ���� ����
YoY % change ���� ���� ���� ���� ����
No. of Employees ���� ���� ���� ���� ����
YoY % change ���� ���� ���� ���� ����
Capital Efficiency Working Capital/Turnover (%) � ���� ���� ���� �
Turnover/Total Fixed Assets (x) ���� ���� ���� ���� ����
Turnover/Total Capital Employed (x) ���� ���� ���� ���� ����
Depreciation/Total Fixed Assets (%) ���� ���� ���� ���� ����
Rates of Return EBITDA Margin (%) ���� ���� ���� ���� ����
EBIT Margin (%) ���� ���� ���� ���� ����
Operating Profit Margin (%) ���� ���� ���� ���� ����
ROACE (%) ���� ���� ���� ���� ����
ROANA (%) ���� ���� ���� ���� ����
Trend

Intellisys 2MQ – UK Chemical Sector 20 April 2012
©Intelligent Analysis Limited www.intellisys.uk.com 33 of 48
Plastics Capital plc ☺☺☺☺
Plastics Capital is an international specialist plastics products manufacturer focused on proprietary products for niche markets. The Power Transmission division through Bell Plastics is a global leader in the manufacture of
highly specialised plastic mandrels while BNL is a leading designer and manufacturer of plastic bearing products. The Paper& Packaging division manufactures creasing matrix and high performance blown PE films.
Overall Company Score
Category 2011 2010 2009 2008 2007
Performance ☺☺☺☺ � � � �
Development ☺☺☺☺ ☺☺☺☺ ���� ☺☺☺☺ ☺☺☺☺
Financial Strength ☺☺☺☺ ☺☺☺☺ ���� ☺☺☺☺ ☺☺☺☺
Productivity ☺☺☺☺ ���� ☺☺☺☺ ���� ☺☺☺☺
Capital Efficiency ☺☺☺☺ ���� ☺☺☺☺ ���� ☺☺☺☺
Rates of Return ☺☺☺☺ � � ���� �
Overall ☺☺☺☺ � � � ☺☺☺☺
Score
Growth Strategy
2011 2010 2009 2008 2007
Divesting Organic Organic Acquisitive Divesting
Business Profile
Divisional Geographic
Power Transmission Printing & Packaging
UK Europe USA Asia Rest of World
Share Performance

Intellisys 2MQ – UK Chemical Sector 20 April 2012
©Intelligent Analysis Limited www.intellisys.uk.com 34 of 48
Company Scores
Year ended 31 March 2011 2010 2009 2008 2007
Performance Turnover (£m) ���� ���� ���� ���� ����
Turnover per share (p) ���� ���� ���� ���� ����
EBITDA (£m) ���� ���� ���� ���� ����
EBITDA per share (p) ���� ���� ���� ���� ����
EBIT (£m) ���� ���� ���� ���� ����
EBIT per share (p) ���� ���� ���� ���� ����
Operating Profit (£m) ���� ���� ���� ���� ����
Operating Profit per share (p) ���� ���� ���� ���� ����
Pre-tax Profit (£m) ���� ���� ���� ���� ����
EPS (p) ���� ���� ���� ���� ����
Dividend (p) � � � � �
Dividend Cover (x) � � � � �
Development Asset Expenditure (%) ���� ���� � ���� ����
Capex/Depreciation (x) ���� ���� ���� ���� ����
NAV (p) ���� ���� ���� ���� ����
Shares Issued ���� ���� ���� ���� ��������
Financial Strength Total Debt/Shareholders' Funds (%) ���� ���� ���� ���� ����
Net Debt/Shareholders' Funds (%) ���� ���� ���� ���� ����
Total Debt/Total Capital Employed (%) ���� ���� ���� ���� ����
Net Debt/Total Capital Employed (%) ���� ���� ���� ���� ����
Interest Cover (x) ���� ���� ���� ���� ����
Productivity Turnover per Employee (£000) ���� ���� ���� ���� ����
YoY % change ���� ���� ���� ���� ����
Operating Profit per Employee (£000) ���� ���� ���� ���� ����
YoY % change ���� ���� ���� ���� ����
No. of Employees ���� ���� ���� ���� ����
YoY % change ���� ���� ���� ���� ����
Capital Efficiency Working Capital/Turnover (%) � � � ���� �
Turnover/Total Fixed Assets (x) ���� ���� ���� ���� ����
Turnover/Total Capital Employed (x) ���� ���� ���� ���� ����
Depreciation/Total Fixed Assets (%) ���� ���� ���� ���� ����
Rates of Return EBITDA Margin (%) ���� ���� ���� ���� ����
EBIT Margin (%) ���� ���� ���� ���� ����
Operating Profit Margin (%) ���� ���� ���� ���� ����
ROACE (%) ���� ���� ���� ���� ����
ROANA (%) ���� ���� ���� ���� ����
Trend

Intellisys 2MQ – UK Chemical Sector 20 April 2012
©Intelligent Analysis Limited www.intellisys.uk.com 35 of 48
Porvair plc ☺☺☺☺
Porvair is a specialist filtration and environmental technology group that serves a range of market segments of which aviation, energy and industrial process, environmental laboratories and non-ferrous metals are the most
important. The group is managed through two divisions: Metals Filtration division, which designs and manufactures porous ceramic filters for the filtration of molten metals; and the Microfiltration Division, which
designs and manufactures a broad range of specialist filtration equipment for application in aerospace, energy, bioscience, water and industrial applications.
Overall Company Score
Category 2011 2010 2009 2008 2007
Performance ☺☺☺☺ ☺☺☺☺ ���� ☺☺☺☺ ☺☺☺☺
Development ☺☺☺☺ ☺☺☺☺ ☺☺☺☺ � ☺☺☺☺
Financial Strength ☺☺☺☺ ☺☺☺☺ � ���� ☺☺☺☺
Productivity � ☺☺☺☺ � ☺☺☺☺ �
Capital Efficiency ☺☺☺☺ ☺☺☺☺ ☺☺☺☺ ���� ����
Rates of Return ☺☺☺☺ ☺☺☺☺ ���� � �
Overall ☺☺☺☺ ☺☺☺☺ � � ☺☺☺☺
Score
Growth Strategy
2011 2010 2009 2008 2007
Organic Organic Organic Acquisitive Organic
Business Profile
Divisional Geographic
Metals Filtration Microfiltration
UK Rest of Europe USA Rest of World
Share Performance

Intellisys 2MQ – UK Chemical Sector 20 April 2012
©Intelligent Analysis Limited www.intellisys.uk.com 36 of 48
Company Scores
Year ended 31 November 2011 2010 2009 2008 2007
Performance Turnover (£m) ���� ���� ���� ���� ����
Turnover per share (p) ���� ���� ���� ���� ����
EBITDA (£m) ���� ���� ���� ���� ����
EBITDA per share (p) ���� ���� ���� ���� ����
EBIT (£m) ���� ���� ���� ���� ����
EBIT per share (p) ���� ���� ���� ���� ����
Operating Profit (£m) ���� ���� ���� ���� ����
Operating Profit per share (p) ���� ���� ���� ���� ����
Pre-tax Profit (£m) ���� ���� ���� ���� ����
EPS (p) ���� ���� ���� ���� ����
Dividend (p) ���� ���� � ���� ����
Dividend Cover (x) ���� ���� ���� ���� ����
Development Asset Expenditure (%) � ���� ���� � ����
Capex/Depreciation (x) ���� ���� ���� ���� ����
NAV (p) ���� ���� ���� ���� ����
Shares Issued ���� �������� �������� ���� ����
Financial Strength Total Debt/Shareholders' Funds (%) ���� ���� ���� ���� ����
Net Debt/Shareholders' Funds (%) ���� ���� ���� ���� ����
Total Debt/Total Capital Employed (%) ���� ���� ���� ���� ����
Net Debt/Total Capital Employed (%) ���� ���� ���� ���� ����
Interest Cover (x) ���� ���� ���� ���� ����
Productivity Turnover per Employee (£000) ���� ���� ���� ���� ����
YoY % change ���� ���� ���� ���� ����
Operating Profit per Employee (£000) ���� ���� ���� ���� ����
YoY % change ���� ���� ���� ���� ����
No. of Employees ���� ���� ���� ���� ����
YoY % change ���� ���� ���� ���� ����
Capital Efficiency Working Capital/Turnover (%) ���� � � ���� �
Turnover/Total Fixed Assets (x) ���� ���� ���� ���� ����
Turnover/Total Capital Employed (x) ���� ���� ���� ���� ����
Depreciation/Total Fixed Assets (%) ���� ���� ���� ���� ����
Rates of Return EBITDA Margin (%) ���� ���� ���� ���� ����
EBIT Margin (%) ���� ���� ���� ���� ����
Operating Profit Margin (%) ���� ���� ���� ���� ����
ROACE (%) ���� ���� ���� ���� ����
ROANA (%) ���� ���� ���� ���� ����
Trend

Intellisys 2MQ – UK Chemical Sector 20 April 2012
©Intelligent Analysis Limited www.intellisys.uk.com 37 of 48
Scapa Group plc ☺☺☺☺
Scapa is one of the world's leading technical adhesive tapes manufacturers in the world whose products are used in many industries, especially the electronics, healthcare, industrial and transportation markets.
Overall Company Score
Category 2011 2010 2009 2008 2007
Performance ☺☺☺☺ ☺☺☺☺ ���� ���� ☺☺☺☺
Development ☺☺☺☺ ☺☺☺☺ ☺☺☺☺ ☺☺☺☺ ☺☺☺☺
Financial Strength ☺☺☺☺ ���� � � ☺☺☺☺
Productivity ☺☺☺☺ � � ☺☺☺☺ ☺☺☺☺
Capital Efficiency ☺☺☺☺ ☺☺☺☺ ���� ���� ☺☺☺☺
Rates of Return ☺☺☺☺ ☺☺☺☺ ���� ���� �
Overall ☺☺☺☺ ☺☺☺☺ � � ☺☺☺☺
Score
Growth Strategy
2011 2010 2009 2008 2007
Organic Organic Organic Organic Divesting
Business Profile
Divisional Geographic
Medical Industrial Electronics Transportation
Europe North America Asia
Share Performance

Intellisys 2MQ – UK Chemical Sector 20 April 2012
©Intelligent Analysis Limited www.intellisys.uk.com 38 of 48
Company Scores
Year ended 31 March 2011 2010 2009 2008 2007
Performance Turnover (£m) ���� ���� ���� ���� ����
Turnover per share (p) ���� ���� ���� ���� ����
EBITDA (£m) ���� ���� ���� ���� ����
EBITDA per share (p) ���� ���� ���� ���� ����
EBIT (£m) ���� ���� ���� ���� ����
EBIT per share (p) ���� ���� ���� ���� ����
Operating Profit (£m) ���� ���� ���� ���� ����
Operating Profit per share (p) ���� ���� ���� ���� ����
Pre-tax Profit (£m) ���� ���� ���� ���� ����
EPS (p) ���� ���� ���� ���� ����
Dividend (p) � � ���� ���� �
Dividend Cover (x) � � ���� ���� �
Development Asset Expenditure (%) ���� � � � �
Capex/Depreciation (x) ���� ���� ���� ���� ����
NAV (p) ���� ���� ���� ���� ����
Shares Issued ���� �������� �������� �������� ��������
Financial Strength Total Debt/Shareholders' Funds (%) ���� ���� ���� ���� ����
Net Debt/Shareholders' Funds (%) ���� ���� ���� ���� ����
Total Debt/Total Capital Employed (%) ���� ���� ���� ���� ����
Net Debt/Total Capital Employed (%) ���� ���� ���� ���� ����
Interest Cover (x) ���� ���� ���� ���� ����
Productivity Turnover per Employee (£000) ���� ���� ���� ���� ����
YoY % change ���� ���� ���� ���� ����
Operating Profit per Employee (£000) ���� ���� ���� ���� ����
YoY % change ���� ���� ���� ���� ����
No. of Employees ���� ���� ���� ���� ����
YoY % change ���� ���� ���� ���� ����
Capital Efficiency Working Capital/Turnover (%) � � � ���� �
Turnover/Total Fixed Assets (x) ���� ���� ���� ���� ����
Turnover/Total Capital Employed (x) ���� ���� ���� ���� ����
Depreciation/Total Fixed Assets (%) ���� ���� ���� ���� ����
Rates of Return EBITDA Margin (%) ���� ���� ���� ���� ����
EBIT Margin (%) ���� ���� ���� ���� ����
Operating Profit Margin (%) ���� ���� ���� ���� ����
ROACE (%) ���� ���� ���� ���� ����
ROANA (%) ���� ���� ���� ���� ����
Trend

Intellisys 2MQ – UK Chemical Sector 20 April 2012
©Intelligent Analysis Limited www.intellisys.uk.com 39 of 48
Victrex plc ☺☺☺☺
Victrex plc, a leading global manufacturer of high performance polymers and comprises two divisions: Victrex Polymer Solutions that focuses on transport, industrial and the electronics markets and Invibio Biomaterial
Solutions that focuses on providing highly specialised biocompatible PEEK-based materials for medical device manufacturers.
Overall Company Score
Category 2011 2010 2009 2008 2007
Performance ☺☺☺☺ ☺☺☺☺ ���� ☺☺☺☺ ☺☺☺☺
Development ☺☺☺☺ ☺☺☺☺ � ☺☺☺☺ �
Financial Strength � � ���� ☺☺☺☺ ����
Productivity � ☺☺☺☺ ���� � ����
Capital Efficiency ☺☺☺☺ ☺☺☺☺ ���� ���� ����
Rates of Return ☺☺☺☺ ☺☺☺☺ ���� ���� �
Overall ☺☺☺☺ ☺☺☺☺ ���� � ����
Score
Growth Strategy
2011 2010 2009 2008 2007
Organic Organic Organic Organic Organic
Business Profile
Divisional Geographic
Victrex Polymer Solutions Invibio Biomaterial Solutions
UK EMEA Americas Asia-Pacific
Share Performance

Intellisys 2MQ – UK Chemical Sector 20 April 2012
©Intelligent Analysis Limited www.intellisys.uk.com 40 of 48
Company Scores
Year ended 30 September 2011 2010 2009 2008 2007
Performance Turnover (£m) ���� ���� ���� ���� ����
Turnover per share (p) ���� ���� ���� ���� ����
EBITDA (£m) ���� ���� ���� ���� ����
EBITDA per share (p) ���� ���� ���� ���� ����
EBIT (£m) ���� ���� ���� ���� ����
EBIT per share (p) ���� ���� ���� ���� ����
Operating Profit (£m) ���� ���� ���� ���� ����
Operating Profit per share (p) ���� ���� ���� ���� ����
Pre-tax Profit (£m) ���� ���� ���� ���� ����
EPS (p) ���� ���� ���� ���� ����
Dividend (p) ���� ���� ���� ���� ����
Dividend Cover (x) ���� ���� ���� ���� ����
Development Asset Expenditure (%) � ���� � � �
Capex/Depreciation (x) ���� ���� ���� ���� ����
NAV (p) ���� ���� ���� ���� ����
Shares Issued ���� ���� ���� ���� ����
Financial Strength Total Debt/Shareholders' Funds (%) � � � ���� ����
Net Debt/Shareholders' Funds (%) ���� ���� ���� ���� ����
Total Debt/Total Capital Employed (%) � � � ���� ����
Net Debt/Total Capital Employed (%) ���� ���� ���� ���� ����
Interest Cover (x) ���� ���� ���� ���� ����
Productivity Turnover per Employee (£000) ���� ���� ���� ���� ����
YoY % change ���� ���� ���� ���� ����
Operating Profit per Employee (£000) ���� ���� ���� ���� ����
YoY % change ���� ���� ���� ���� ����
No. of Employees ���� ���� ���� ���� ����
YoY % change ���� ���� ���� ���� ����
Capital Efficiency Working Capital/Turnover (%) ���� � ���� ���� ����
Turnover/Total Fixed Assets (x) ���� ���� ���� ���� ����
Turnover/Total Capital Employed (x) ���� ���� ���� ���� ����
Depreciation/Total Fixed Assets (%) ���� ���� ���� ���� ����
Rates of Return EBITDA Margin (%) ���� ���� ���� ���� ����
EBIT Margin (%) ���� ���� ���� ���� ����
Operating Profit Margin (%) ���� ���� ���� ���� ����
ROACE (%) ���� ���� ���� ���� ����
ROANA (%) ���� ���� ���� ���� ����
Trend
Intellisys 2MQ – UK Chemical Sector 20 April 2012
©Intelligent Analysis Limited www.intellisys.uk.com 41 of 48
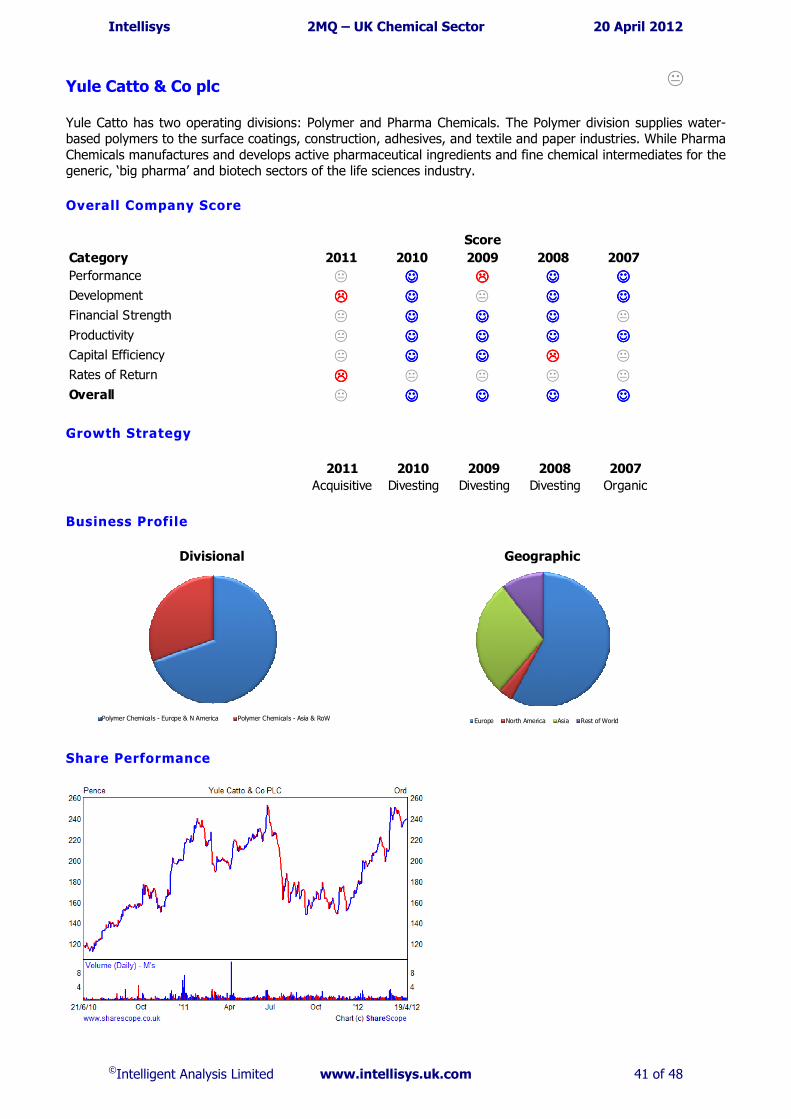
Yule Catto & Co plc �
Yule Catto has two operating divisions: Polymer and Pharma Chemicals. The Polymer division supplies water-based polymers to the surface coatings, construction, adhesives, and textile and paper industries. While Pharma
Chemicals manufactures and develops active pharmaceutical ingredients and fine chemical intermediates for the generic, ‘big pharma’ and biotech sectors of the life sciences industry.
Overall Company Score
Category 2011 2010 2009 2008 2007
Performance � ☺☺☺☺ ���� ☺☺☺☺ ☺☺☺☺
Development ���� ☺☺☺☺ � ☺☺☺☺ ☺☺☺☺
Financial Strength � ☺☺☺☺ ☺☺☺☺ ☺☺☺☺ �
Productivity � ☺☺☺☺ ☺☺☺☺ ☺☺☺☺ ☺☺☺☺
Capital Efficiency � ☺☺☺☺ ☺☺☺☺ ���� �
Rates of Return ���� � � � �
Overall � ☺☺☺☺ ☺☺☺☺ ☺☺☺☺ ☺☺☺☺
Score
Growth Strategy
2011 2010 2009 2008 2007
Acquisitive Divesting Divesting Divesting Organic
Business Profile
Divisional Geographic
Polymer Chemicals - Europe & N America Polymer Chemicals - Asia & RoW
Europe North America Asia Rest of World
Share Performance

Intellisys 2MQ – UK Chemical Sector 20 April 2012
©Intelligent Analysis Limited www.intellisys.uk.com 42 of 48
Company Scores
Year ended 31 December 2011 2010 2009 2008 2007
Performance Turnover (£m) ���� ���� ���� ���� ����
Turnover per share (p) ���� ���� ���� ���� ����
EBITDA (£m) ���� ���� ���� ���� ����
EBITDA per share (p) ���� ���� ���� ���� ����
EBIT (£m) ���� ���� ���� ���� ����
EBIT per share (p) ���� ���� ���� ���� ����
Operating Profit (£m) ���� ���� ���� ���� ����
Operating Profit per share (p) ���� ���� ���� ���� ����
Pre-tax Profit (£m) ���� ���� ���� ���� ����
EPS (p) ���� ���� ���� ���� ����
Dividend (p) ���� ���� ���� ���� ����
Dividend Cover (x) ���� ���� ���� ���� ����
Development Asset Expenditure (%) � � � ���� �
Capex/Depreciation (x) ���� ���� ���� ���� ����
NAV (p) ���� ���� ���� ���� ����
Shares Issued ���� �������� �������� �������� ��������
Financial Strength Total Debt/Shareholders' Funds (%) ���� ���� ���� ���� ����
Net Debt/Shareholders' Funds (%) ���� ���� ���� ���� ����
Total Debt/Total Capital Employed (%) ���� ���� ���� ���� ����
Net Debt/Total Capital Employed (%) ���� ���� ���� ���� ����
Interest Cover (x) ���� ���� ���� ���� ����
Productivity Turnover per Employee (£000) ���� ���� ���� ���� ����
YoY % change ���� ���� ���� ���� ����
Operating Profit per Employee (£000) ���� ���� ���� ���� ����
YoY % change ���� ���� ���� ���� ����
No. of Employees ���� ���� ���� ���� ����
YoY % change ���� ���� ���� ���� ����
Capital Efficiency Working Capital/Turnover (%) � � � � ����
Turnover/Total Fixed Assets (x) ���� ���� ���� ���� ����
Turnover/Total Capital Employed (x) ���� ���� ���� ���� ����
Depreciation/Total Fixed Assets (%) ���� ���� ���� ���� ����
Rates of Return EBITDA Margin (%) ���� ���� ���� ���� ����
EBIT Margin (%) ���� ���� ���� ���� ����
Operating Profit Margin (%) ���� ���� ���� ���� ����
ROACE (%) ���� ���� ���� ���� ����
ROANA (%) ���� ���� ���� ���� ����
Trend

Intellisys 2MQ – UK Chemical Sector 20 April 2012
©Intelligent Analysis Limited www.intellisys.uk.com 43 of 48
Zotefoams plc ☺☺☺☺
Zotefoams is the world's leading manufacturer of cross-linked block foams, which through a unique production process produces foams that have controlled properties and are of a strength, consistency, quality and purity
superior to foams produced by other methods. Its products are used in a wide range of markets including sports and leisure, packaging, transport, healthcare, toys, building, marine and the military.
Overall Company Score
Category 2011 2010 2009 2008 2007
Performance ☺☺☺☺ ☺☺☺☺ ���� ☺☺☺☺ ☺☺☺☺
Development � ☺☺☺☺ ☺☺☺☺ ☺☺☺☺ ☺☺☺☺
Financial Strength ☺☺☺☺ ☺☺☺☺ � ☺☺☺☺ ����
Productivity ���� ☺☺☺☺ � ☺☺☺☺ ☺☺☺☺
Capital Efficiency � � ���� ☺☺☺☺ ����
Rates of Return ☺☺☺☺ ☺☺☺☺ ���� � �
Overall ☺☺☺☺ ☺☺☺☺ ���� ☺☺☺☺ ☺☺☺☺
Score
Growth Strategy
2011 2010 2009 2008 2007
Organic Organic Organic Acquisitive Organic
Business Profile
Divisional Geographic
Polyolefins HPP MEL
UK & Eire Rest of Europe North America Rest of World
Share Performance

Intellisys 2MQ – UK Chemical Sector 20 April 2012
©Intelligent Analysis Limited www.intellisys.uk.com 44 of 48
Company Scores
Year ended 31 December 2011 2010 2009 2008 2007
Performance Turnover (£m) ���� ���� ���� ���� ����
Turnover per share (p) ���� ���� ���� ���� ����
EBITDA (£m) ���� ���� ���� ���� ����
EBITDA per share (p) ���� ���� ���� ���� ����
EBIT (£m) ���� ���� ���� ���� ����
EBIT per share (p) ���� ���� ���� ���� ����
Operating Profit (£m) ���� ���� ���� ���� ����
Operating Profit per share (p) ���� ���� ���� ���� ����
Pre-tax Profit (£m) ���� ���� ���� ���� ����
EPS (p) � ���� ���� ���� ����
Dividend (p) ���� ���� � � �
Dividend Cover (x) ���� ���� ���� ���� ����
Development Asset Expenditure (%) � ���� � � �
Capex/Depreciation (x) ���� ���� ���� ���� ����
NAV (p) ���� ���� ���� ���� ����
Shares Issued ���� �������� ���� ���� ����
Financial Strength Total Debt/Shareholders' Funds (%) ���� ���� ���� ���� ����
Net Debt/Shareholders' Funds (%) ���� ���� ���� ���� ����
Total Debt/Total Capital Employed (%) ���� ���� ���� ���� ����
Net Debt/Total Capital Employed (%) ���� ���� ���� ���� ����
Interest Cover (x) ���� ���� ���� ���� ����
Productivity Turnover per Employee (£000) ���� ���� ���� ���� ����
YoY % change ���� ���� ���� ���� ����
Operating Profit per Employee (£000) ���� ���� ���� ���� ����
YoY % change ���� ���� ���� ���� ����
No. of Employees ���� ���� ���� ���� ����
YoY % change ���� ���� ���� ���� ����
Capital Efficiency Working Capital/Turnover (%) ���� � ���� � ����
Turnover/Total Fixed Assets (x) ���� ���� ���� ���� ����
Turnover/Total Capital Employed (x) ���� ���� ���� ���� ����
Depreciation/Total Fixed Assets (%) ���� ���� ���� ���� ����
Rates of Return EBITDA Margin (%) ���� ���� ���� ���� ����
EBIT Margin (%) ���� ���� ���� ���� ����
Operating Profit Margin (%) ���� ���� ���� ���� ����
ROACE (%) ���� ���� ���� ���� ����
ROANA (%) ���� ���� ���� ���� ����
Trend
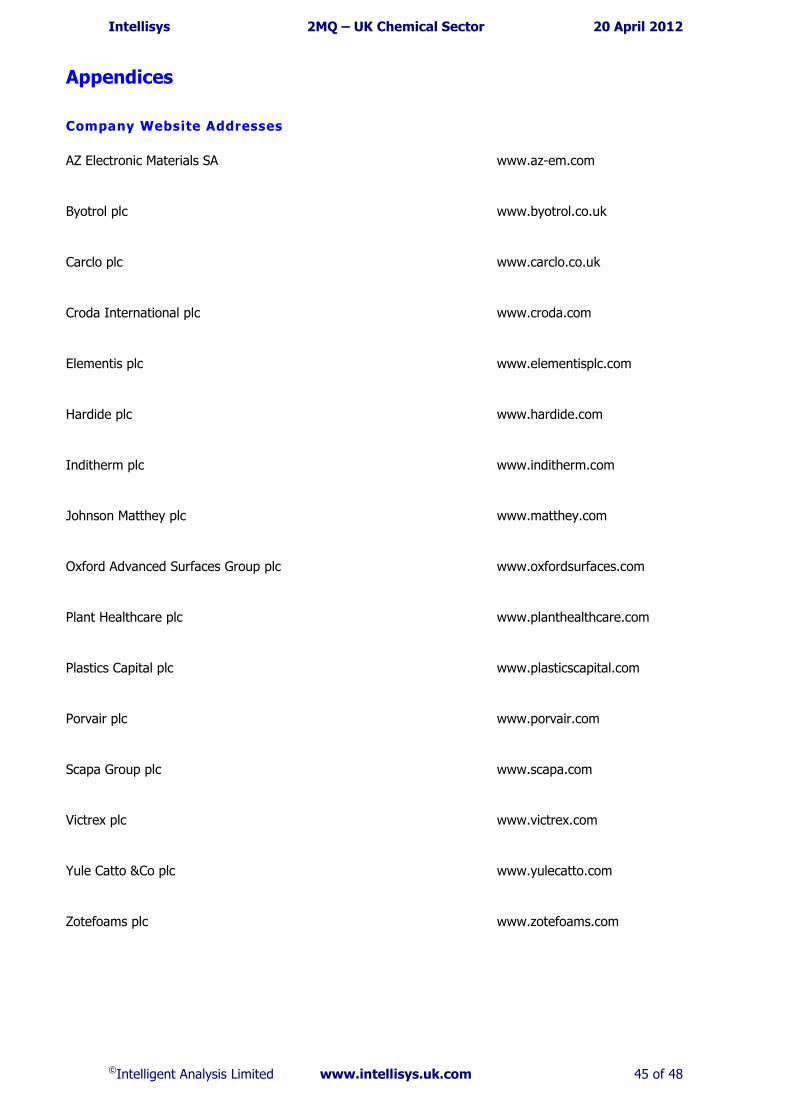
Intellisys 2MQ – UK Chemical Sector 20 April 2012
©Intelligent Analysis Limited www.intellisys.uk.com 45 of 48
Appendices
Company Website Addresses
AZ Electronic Materials SA www.az-em.com
Byotrol plc www.byotrol.co.uk
Carclo plc www.carclo.co.uk
Croda International plc www.croda.com
Elementis plc www.elementisplc.com
Hardide plc www.hardide.com
Inditherm plc www.inditherm.com
Johnson Matthey plc www.matthey.com
Oxford Advanced Surfaces Group plc www.oxfordsurfaces.com
Plant Healthcare plc www.planthealthcare.com
Plastics Capital plc www.plasticscapital.com
Porvair plc www.porvair.com
Scapa Group plc www.scapa.com
Victrex plc www.victrex.com
Yule Catto &Co plc www.yulecatto.com
Zotefoams plc www.zotefoams.com

Intellisys 2MQ – UK Chemical Sector 20 April 2012
©Intelligent Analysis Limited www.intellisys.uk.com 46 of 48
DISCLAIMER
Intelligent Analysis Limited has prepared this report. Intellisys (“Intellisys”) is the trading name of Intelligent
Analysis Limited.
Intelligent Analysis Limited is a provider of financial research reports that indicate the possible value of quoted
company shares. The information contained within any and all of Intellisys’ reports are designed to present an objective assessment of the possible value or relative value of a company and/or an actuarial sector or stock
market index. Intellisys utilises as extensive as possible range of valuation tools and proprietary systems to derive its outputs. The base data for the models are derived from sources believed to be accurate but
Intelligent Analysis Limited does not warrant or guarantee the accuracy or reliability of the source data or its
models and proprietary systems. Subscribers, and casual readers, should not rely upon the Intellisys’ research outputs when forming specific investment decisions but should seek advice specific to their situation and
investment requirements from a person authorized under the Financial Services and Markets Act 2000, before entering into any investment agreement.
Intelligent Analysis Limited has used reasonable care and skill in compiling the content of this report. No representation or warranty, expressed or implied, is given by any person as to the accuracy or completeness or
accuracy of the information and no responsibility or liability is accepted to the accuracy or sufficiency of any of the information, for any errors, omissions or misstatements, negligent or otherwise. In no event will Intelligent
Analysis Limited, Intellisys or any of its officers, employees or agents be liable to any other party for any direct,
indirect, special or other consequential damages arising from the use of this report.
The Intelligent Analysis Limited and/or Intellisys reports are not directed to any person in any jurisdiction where (by reason of that person’s nationality, residence or otherwise) the publication or availability of the Intelligent
Analysis Limited and/or Intellisys information may be prohibited. Persons in respect of whom such prohibitions
apply must not access the Intelligent Analysis Limited and/or Intellisys reports. Neither this document, nor any copy in whatever form of media, may be taken or transmitted into the United States, Canada, Australia, Ireland,
South Africa or Japan or into any jurisdiction where it would be unlawful to do so. Any failure to comply with this restriction may constitute a violation of relevant local securities laws. Recipients of Intelligent Analysis
Limited and/or Intellisys reports outside the UK are not covered by the rules and regulations made for the protection of investors in the UK.
Any user distributing information taken from any Intelligent Analysis Limited or Intellisys report and/or the Intellisys website, in whatever form, to any other person, agrees to attach a copy of this Disclaimer and the
Terms and Conditions of Use pages and obtain the agreement of such other person to comply with the terms set forth.
Intellisys' published reports are published for information purposes and only available to market counterparties, high net-worth and sophisticated individual investors.
No Intellisys report constitutes an offer or invitation to trade, sell, purchase or acquire any shares or other financial instruments in any company or any interest therein, nor shall it form the basis of any contract entered
into for the sale of shares or any other financial instrument in any company.
Intelligent Analysis Limited believes that the information within each and any of its reports to be correct, but its
accuracy or completeness cannot be guaranteed. No representation or warranty, expressed or implied, is given by any person as to the accuracy or completeness of the information and no responsibility or liability is accepted
for the accuracy or sufficiency of any of the information, for any errors, omissions or mis-statements, negligent or otherwise.
Intelligent Analysis Limited (including its Directors, employees and representatives) or a connected person may have positions in or options or other financial instruments on any of the securities mentioned within a report,
and may buy, sell or offer to purchase or sell such securities from time to time, subject to restrictions imposed by internal rules.
Subscribers, and casual reader(s), are reminded that the value of shares in any company may go up or down and that past performance is not necessarily a guide to future performance.

Intellisys 2MQ – UK Chemical Sector 20 April 2012
©Intelligent Analysis Limited www.intellisys.uk.com 47 of 48
Intelligent Analysis Limited is not registered with or regulated by any financial regulatory authority and does not
offer, provide or purport to provide or offer investment advice.
RISK WARNING
Intellisys does not make personal recommendations. The information in this publication is provided solely to enable you to make your own investment decisions but only after taking suitable advice from a qualified and
regulated person.
If you are unsure about dealing in shares and other equity investments, you should contact your financial
adviser as these types of investments may not be suitable for everyone.
The value of stocks and shares, and any income derived from them, can fall as well as rise and you may not get
back the full amount you originally invested. If denominated in a foreign currency, fluctuations in the exchange rate will also affect the value of stocks and shares and the income from them. Past performance is not
necessarily a guide to future performance.

Intellisys 2MQ – UK Chemical Sector 20 April 2012
©Intelligent Analysis Limited www.intellisys.uk.com 48 of 48
Cover photos (press photo BASF) have been reproduced by kind permission of the copyright holder BASF SE.
£200.00