2nd report on the world nutrition situation - volume i ... report on the world nutrition situation...
TRANSCRIPT

2nd Report on the World Nutrition Situation − Volume I: Global andregional results


Table of Contents2nd Report on the World Nutrition Situation − Volume I: Global and regional results...............................1
UNITED NATIONS − ADMINISTRATIVE COMMITTEE ON COORDINATION − SUBCOMMITTEE ON NUTRITION (ACC/SCN).................................................................................................................1ACKNOWLEDGEMENTS.......................................................................................................................2FOREWORD..........................................................................................................................................3Chapter 1: Overview...............................................................................................................................4
Highlights.........................................................................................................................................4Introduction......................................................................................................................................6Concepts and Indicators................................................................................................................10Overview of Trends in Malnutrition.................................................................................................14
Chapter 2: Regional Trends in Nutrition...............................................................................................21Sub−Saharan Africa.......................................................................................................................21Near East and North Africa............................................................................................................28South Asia......................................................................................................................................34South East Asia..............................................................................................................................41China..............................................................................................................................................47Middle America and Caribbean......................................................................................................53South America................................................................................................................................58
Chapter 3: Micronutrients.....................................................................................................................63Vitamin A Deficiency......................................................................................................................64Iron Deficiency...............................................................................................................................66Iodine Deficiency Disorders...........................................................................................................76Deficiencies in Vitamin C, Thiamine and Niacin.............................................................................78
Chapter 4: Women’s Nutritional Status.................................................................................................78Chapter 5: Non−Communicable Chronic Diseases..............................................................................88Chapter 6: Projections of Malnutrition in Children..............................................................................102Chapter 7: Technical Notes................................................................................................................105
Background papers prepared for ACC/SCN used in the Second Report on the World Nutrition Situation.................................................................................................................111
References.........................................................................................................................................112
i

ii

2nd Report on the World Nutrition Situation − Volume I: Global andregional results
UNITED NATIONS NATIONS UNIES
ADMINISTRATIVE COMMITTEE ON COORDINATION − SUBCOMMITTEE ON NUTRITION
A report compiled from information available to the United Nations agencies of the ACC/SCN
October 1992
Prepared in collaboration with the International Food Policy Research Institute (IFPRI), WashingtonD.C.
Funding support for the preparation of this report is gratefully acknowledged from:
Swedish International Development Agency (SIDA)International Development Research Center (IDRC, Canada)
Food and Agriculture Organization of the United Nations (FAO)
reprinted October 1993 with assistance from the Government of the Netherlands
ACC/SCN documents may be reproduced without prior permission, but please attribute to ACC/SCN
The designations employed and the presentation of material in this publication do not imply the expressionof any opinion whatsoever on the part of the ACC/SCN or its UN member agencies concerning the legalstatus of any country, territory, city or area or of its authorities, or concerning the delimitation of its frontiersor boundaries.
Information on other ACC/SCN publications, as well as additional copies of papers, can be obtained from theACC/SCN Secretariat. Inquiries should be addressed to:
Dr John B MasonTechnical Secretary, ACC/SCNc/o World Health Organization20, Avenue AppiaCH−1211 Geneva 27SwitzerlandFacsimile No: (41−22) 798 88 91
UNITED NATIONS − ADMINISTRATIVE COMMITTEE ON COORDINATION −SUBCOMMITTEE ON NUTRITION (ACC/SCN)
The ACC/SCN is the focal point for harmonizing the policies and activities in nutrition of the United Nationssystem. The Administrative Committee on Coordination (ACC), which is comprised of the heads of the UNAgencies, recommended the establishment of the Sub−Committee on Nutrition in 1977, following the WorldFood Conference (with particular reference to Resolution V on food and nutrition). This was approved by theEconomic and Social Council of the UN (ECOSOC). The role of the SCN is to serve as a coordinatingmechanism, for exchange of information and technical guidance, and to act dynamically to help the UNrespond to nutritional problems.
The UN members of the SCN are FAO, IAEA, IFAD, ILO, UN, UNDP, UNEP, UNESCO, UNFPA, UNHCR,UNICEF, UNRISD, UNU, WFC, WFP, WHO and the World Bank. From the outset, representatives of bilateraldonor agencies have participated actively in SCN activities. The SCN is assisted by the Advisory Group onNutrition (AGN), with six to eight experienced individuals drawn from relevant disciplines and with widegeographical representation. The Secretariat is hosted by WHO in Geneva.
1

The SCN undertakes a range of activities to meet its mandate. Annual meetings have representation from theconcerned UN agencies, from 10 to 20 donor agencies, the AGN, as well as invitees on specific topics; thesemeetings begin with symposia on subjects of current importance for policy. The SCN brings certain suchmatters to the attention of the ACC. The SCN sponsors working groups on inter−sectoral and sector−specifictopics.
The SCN compiles and disseminates information on nutrition, reflecting the shared views of the agenciesconcerned. Regular reports on the world nutrition situation are issued, and flows of external resources toaddress nutrition problems are assessed. State−of−the−Art papers are produced to summarize currentknowledge on selected topics. SCN News is normally published twice per year. As decided by theSub−Committee, initiatives are taken to promote coordinated activities − inter−agency programmes, meetings,publications − aimed at reducing malnutrition, primarily in developing countries.
ACKNOWLEDGEMENTS
This Second Report on the World Nutrition Situation benefitted from contributions and advice from a largenumber of people. Contributions on specific topics, and a list of background papers, are noted in Chapter 7.
Throughout the planning and preparation of this report, the ACC/SCN’s Advisory Group on Nutrition (AGN)provided ideas and detailed comments on drafts, and responded generously to our many queries. Under thechairmanship of Prof Reynaldo Martorell, the members during this time were: Ken Bailey, Marcia Griffiths,Richard Heyward, Jak Jervell, John Kevany, Abdel Khattab, Simon Maxwell, Julia Tagwireyi, and GaborZajkas; George Beaton was special advisor to the SCN during the period.
The compilation, analysis and interpretation of data used in the report benefitted from advice, sharing of data,and experience of many people in the member agencies of the ACC/SCN. Special thanks are due toindividuals in these institutions particularly: in WHO − Mercedes de Onis, Graeme Clugston, Alan Lopez,Barbara Underwood, Carla Abou−Zahr, Elizabeth Aahman, Doris Mafat, Djamil Benbouzid, Rhonda Saadeh,Nicholas Cohen, and to George Quincke and Alberto Pradilla for facilitating the preparation of the report; inFAO − Logan Naiken, Robert Weisell, Piyamarn Lewschalermwongs, Janos Ay, and to Paul Lunven and JohnLupien for assisting in funding support; in UNICEF − Tessa Wardlaw, Gareth Jones, Urban Jonsson, andPeter Greaves; in SIDA (Sweden) − Ted Greiner for advice and assistance in securing funding; in IDRC(Canada) − Richard Young for assistance in funding; in IFPRI − Eileen Kennedy, Howdy Bouis, AkhterAhmed, Maarten Immink and Lawrence Haddad; in the World Bank − Judy McGuire, Sonia Rahardjo andHarold Alderman.
For the present report, background papers were prepared by country and institutional collaborators: in Brazil −Carlos Monteiro and R. Iunes of University of Sao Paulo; in Egypt − Heba Nassar of University of Cairo, AminKaml Said, Wafaa Moussa of the Institute of Nutrition, and Ahmed Elminiawy of Aishams University; in India −Vinodini Reddy of the National Institute on Nutrition in Hyderabad and Meera Shekar; in Mexico − AdolfoChavez, Abelardo Avila, Salvador Bermejo, Jose Roldan and Herlinda Madrigal of the Instituto Nacional de laNutricion; in Pakistan − N. Malik and S. Malik of Quaid−e−Azam University; in Nigeria − Timiebi Agary of theMinistry of Science and Technology. The country level analysis also made use of the ACC/SCN CountryProgramme Review studies led by Stuart Gillespie, and include: in Indonesia − Soekirman, G.Soemondinigrat, F. Jalal, and I. Jus’at of BAPPENAS; in Thailand − Yongyout Kachondham, PattaneeWichinagoon and Kraisid Tontisirin of Mahidol University; in Tanzania − Festo Kavishe of the Tanzanian Foodand Nutrition Centre and S. Mushi of University of Dar es Salaam; in Zimbabwe − Julia Tagwireyi of Ministryof Health along with T. Jayne, M. Rukuni and N. Lenneiye; in India − Prahlad Rao of the National Institute ofNutrition in Hyderabad. We also much appreciate information and comments from Ruth Oniang’o (Kenya),Shea Rutstein of DHS/IRD, Jose Mora of ISTI, Demie Bongga and Adelisa Ramos (Philippines), and ChenChunming (China).
Particular thanks to Joachim von Braun for his ideas and for facilitating the research; and to Stuart Gillespie,Barry Edmonston and Rudo Niemeijer. We acknowledge the comments from participants in seminars anddiscussions for this report at IFPRI, at the 19th ACC/SCN session in Rome, and at the meeting of the authorsof the country papers in Geneva.
Research assistance in various stages of study were provided by Rita Aggarwal, Mahshid Lotfi, VirginiaCompere, Alberto Torres, Denise Vogel, Alexander Marin, Karen Mason, Nicole Anker, and Maria Paz EmiliaLorenzo. The production of the report benefitted from help of Jane Hedley, Viki Elliot, Jay Willis, Tamarra
2

Engers, and the expert work of Ding Dizon.
Marito GarciaJohn Mason
October 1992
FOREWORD
This Second Report on the World Nutrition Situation comes at an important time. In the near future humanwell−being, to which nutrition is fundamental, could improve more rapidly throughout the world; but economicadjustments and mass migration are continuing threats. The results here show steady, if slow, progress inmany countries in the last few years. The future may see the needed acceleration in these. But the picture forSub−Saharan Africa is of great concern, where a deteriorating nutritional trend needs to be turned around.
Following publication by the SCN of the First Report on the World Nutrition Situation in 1987, and the Updateon the Nutrition Situation in 1989 which gave country level data, support was secured for a five−yearprogramme, beginning in December 1990. This allowed continued monitoring of the world’s nutritionalproblems, thus helping the SCN to meet an important part of its mandate. We must emphasize our gratitudeto SIDA (Sweden), IDRC (Canada), and FAO, who provided funding to supplement the SCN budget leading toproduction of this report. The programme for reporting on the world nutrition situation envisaged increasingemphasis on country level data, and for the present report detailed studies have been carried out byinstitutions in a number of countries. Some of these have been funded by UNICEF as part of SCN’s CountryProgramme Review, for which we are most grateful; and results will be published in 1993. We decided toissue this Second Report in two volumes. In this first volume, global and regional results are given, withhighlights on certain specific important issues. This allows more space in a second volume to do justice to thedetailed information at country level. The Supplement on Methods and Statistics to the First Report on theWorld Nutrition Situation contained most of the data that was presented in the report itself, which provided aresource for further research, widely used, and the practice will be continued here by including details of dataand methods in the second volume.
As for previous reports, me main intention is to integrate data from a variety of sources. The report dependsheavily therefore on the statistical and analytical work of SCN member agencies. In particular, the methoddevelopment, data compilation and analysis carried out by FAO, for its forthcoming Sixth World Food Surveyand for preparing for the International Conference on Nutrition, provided fundamental data on food availabilityand the extent of inadequate food consumption. FAO data have also been analyzed for trends in availability ofcertain micronutrients. Data on child growth and women’s health are compiled by WHO and UNICEF,providing direct measures of nutritional outcome, and the SCN through this project has contributed to thesecompilations. Sharing the analytical results has ensured that the same outputs and conclusions are availableon nutrition throughout the UN system. As previously, we have also depended upon data compiled, analyzedand made available by the World Bank, by the UN Population Division, ILO and, through these, from otheragencies such as UNESCO.
The audience for the SCN’s reports is intended to be those who have a professional concern for nutrition indeveloping countries, as well as in donor governments and international agencies. They aim to giveup−to−date and carefully−checked information, to provide the basis for determining future action, andmonitoring current progress. At the same time, experience shows that the reports are used extensively forteaching and research purposes related to nutrition, and it is hoped that this will continue.
In preparing this Second Report, recent developments in understanding of nutrition and its causes are takeninto account. The concept first emphasized by UNICEF, and central to the structure of the InternationalConference on Nutrition as prepared by FAO and WHO, is that nutrition is an outcome of three groups offactors: household food security, health environment and health services, and care. In other words, peopleshould be well−fed, healthy, and well−cared for. This has guided the selection of indicators. In the regionalresults (this volume) and country data (Volume II) the indicators are clustered into food, health, and women’srole and caring capacity, treating nutrition − indicated primarily by child growth − as an outcome.
The Advisory Group on Nutrition (AGN) of the Sub−Committee has guided the process of preparing reports onthe world nutrition situation. Following the First Report, it was proposed that emerging issues should receiveparticular attention in the future. Thus a substantial part of this first volume covers four specific and important
3

topics: micronutrients, women’s nutritional status, diet−related non−communicable chronic diseases, and apreliminary look at projections of nutrition into the future. We would hope to continue the process ofhighlighting special issues, and to begin to incorporate indicators of these − for example women’s nutrition −into the regular reports.
As before, this report represents a shared concern of the UN member agencies of the ACC/SCN. The last twoyears have seen considerable consultation, not only with UN members, but with other agencies andnon−governmental organizations concerned. The preliminary results of this report were discussed at the SCN19th Session in February 1992 as well as by the Advisory Group on Nutrition, and with those in memberagencies concerned with the specific aspects of the data. We are particularly pleased to have been able tocarry out this work in close collaboration with the International Food Policy Research Institute, and the manyinformal discussions with IFPRI have been much appreciated.
The aim of the SCN’s member agencies is to promote the necessary action such that trends in nutritionimprove. A particular focus for this effort is the International Conference on Nutrition (ICN), of December 1992.The indicators given in this report, while somewhat encouraging, need to show more rapid improvement in thefuture. They can provide a baseline, and a yardstick against which future progress can be measured.Nutritional goals have been proposed by the World Summit for Children in 1990, endorsed by the ICN,including reduction in malnutrition among under five children by half, reduction of low birth weight, virtualelimination of iodine and vitamin A deficiencies, and others; indicators of these and other such goals areincluded here. The report will be useful if it contributes to the planning and implementation of the necessarymeasures to meet such goals, and to monitoring progress along the way.
A HorwitzChairman, ACC/SCN
Chapter 1: Overview
Highlights
Summary results for developing countries, given in Table 1.1, show that protein−energy andmicro−nutrient malnutrition continue to affect large numbers of people. An estimated 20% of the populationhas inadequate food consumption. Growth failure affects one−third of children, and over 40% of women areunderweight and/or anaemic. At least one billion people worldwide are probably affected by one or morenutritional deficiency.
The current period (1990−1992) may mark one of the most severe famines in Africa. Drought and war arecausing famine, often beyond control by external assistance, in Ethiopia, Somalia, and Sudan in the Horn ofAfrica, and in Mozambique and Liberia. These are causing massive movements of refugees into neighbouringcountries. Severe drought is affecting large parts of southern and eastern Africa.
Overall, the percentage of children underweight fell in the 1980s, from around 38% in 1980 to 34% in1990. The improvement was more rapid from 1975 to 1980, from 42% to 38%. This rate of improvement in thelate 1970s was just enough to reduce the total numbers of pre−school children underweight, but these areestimated to have risen again in the 1980s, from around 164 million in 1980 to 184 million in 1990.
The proportion of the population in developing countries underfed − consuming dietary energy inadequateto sustain more than light activity on average − was estimated to have fallen substantially over the last 15years, from around one in three people in 1975, to one in five in 1989. This implies a considerable reduction inthe numbers so affected, from nearly 1,000 million to just below 800 mil lion. These calculations from FAO usea new indicator of low consumption, and revised methods of estimation, now including China. By thiscalculation, less people today are underfed than at any time in the recent past.
Nutritional trends have generally deteriorated or remained static in Sub−Saharan Africa during the 1980s,in contrast to all other regions. There are indications that some African countries with extensivecommunity−level programmes may have achieved nutritional improvement, against the trend.
4

South Asia is estimated to be improving slowly, accordingly to recent results from India and elsewhere, ataround a reduction of half a percentage point prevalence of underweight children per year. Nonetheless, theunderweight prevalence in South Asia remains the highest in the world, and over half the world’s underweightchildren are in this region. Indications are that calorie consumption remained low throughout the 1980s, withlittle change, although this may have improved slightly for some poorer groups such as the landless.
Nutrition in South East Asia is improving rapidly in many countries, at around one percentage point ofunderweight prevalence reduction per year; this is in line both with considerable economic development, andwith vigorous and widespread health and nutrition programmes at village level. Food consumption is relativelygood, and has risen during the 1980s, along with marked success in food production to the point that anumber of countries changed from net food importing to exporting.
Table 1.1 Malnutrition in Developing Countries, 1975−1990
Percent affected Number (millions)
1974−76 1988−90 1974−76 1988−90
GENERAL MALNUTRITION
1. Population (all ages) with energy intake (kcals/caput/day) onaverage below 1.54 BMR over one year
33% 20% 976 786
1975 1990 1975 1990
2. Children (under five years) with weight below −2 S.D. ofreference
42% 34% 168 184
1980s 1980s
3. Women (15−49 years old) with weight below 45 kg. 45% 400
MICRONUTRIENT MALNUTRITION
4. Anaemia: women (15−49 years old) haemoglobin < 12 g/dl(non pregnant) or < 11 g/dl (pregnant)
42% 370
5. Iodine deficiency disorders (IDD) Goiter (all ages) 5.6% 211
6. Vitamin A deficiency: children (under five years) withxerophthalmia
2.8% 13.8
Sources: See Chapter 7.
Notes:
1. Data on population with low energy intake (underfed) were calculated byFAO. The estimates are averages for 1974 to 1976 and 1988 to 1990.
2. Underweight children results are estimated by ACC/SCN, for children aged0 through 60 months, using a cut−off of −2 S.D. of the median NCHSreference.
3. The estimate of underweight adult women is calculated from ACC/SCN’sdatabase on women’s nutrition. The 45 kg cut−off is used as a basis forcomparison, as that commonly reported. The prevalence estimates excludepregnant and lactating women but these are included in the calculation ofnumbers.
4. Anaemia estimates are based on ACC/SCN’s database on women’snutrition. The cut−off points for anaemia use the WHO reference for pregnantand non−pregnant women. See Chapters 3 and 4.
5. IDD estimates are based on WHO and ICCIDD data. See Chapter 3.
5

6. Vitamin A deficiency estimates are based on WHO data. See Chapter 3.
Middle America and the Caribbean, and South America, saw some improvement in nutritional indicatorsduring the 1980s, but little change in the latter part of the decade. Reductions in underweight prevalence (e.g.in Brazil, Chile), helped by such factors as improved education and lowered birth rates, as well as directnutrition interventions, seemed surprisingly resilient to economic stress.
Deficiency of vitamin A affects at least 40 countries, and blinds up to half a million preschool children eachyear, out of an estimated 14 million with resulting eye damage. Important recent research shows thatimproving vitamin A status in children in deficient populations reduces mortality among young children byaround one third. Vitamin A supply in some parts of South Asia and Eastern and Southern Africa is so low thatdeficiency is almost inevitable. In most regions the trend in availability is upwards, except in East Africa.Trends in the deficiency itself cannot be assessed at present.
Iron deficiency, one result of which is anaemia, is the only nutrition problem showing a generaldeterioration in many parts of the world. Prevalence is especially high in South Asia, where more than 60% ofwomen are anaemic. In general, trends in dietary iron supply are downwards, for example in South Asia dueto reduced production of legumes with the green revolution, in line with the worsening of anaemia. The mainexception is Near East and North Africa, where iron supply is up and anaemia is down.
Iodine deficiency remains the most common preventable cause of mental retardation, and there areestimated to be six million people with overt cretinism worldwide, and up to one billion at risk of some degreeof deficiency. Programmes to control iodine deficiency are starting in many countries, and expanding inothers, through fortification of salt and distribution of iodized oil.
Outbreaks of scurvy, pellagra and beri−beri have occurred among populations of refugees and displacedpeople. These deficiency diseases (of vitamin C, niacin and thiamine respectively) had not been seen fordecades. They afflict people in camps whose diets are severely restricted in variety.
The extent of stunting, underweight, and wasting in women in developing countries was assessed for thefirst time for this report. The results show that these problems are very extensive in developing countries,particularly low body weight and thinness in Asia. Malnutrition in women is generally in line with estimates oflow birth weight, and the intergenerational effects, of malnourished women having small babies who grow upto be small mothers, can readily be seen. Trends in anaemia can only be roughly estimated. Indications arethat anaemia prevalences, already high, may be rising in South Asia and Sub−Saharan Africa. Maternalmortality rates are also feared to be increasing in Sub−Saharan Africa, in contrast to other regions.
Assessments of premature mortality rates from chronic diseases possibly linked to diet indicate these to befalling slightly in the developing countries for which data are available, and to be generally below rates fordeveloped countries. Dietary trends show increases in fat consumption with rising incomes in many countries.In general, the differences in fat intake between countries are explained more by food habits than by changesin incomes. However, because morbidity has not been assessed in developing countries in transition, and inthe light of widespread reports of increased incidences of, for example, cardiovascular disease, it is urgent tobegin to monitor the situation more closely, and to consider steps to reverse undesirable dietary trends.
Projections of possible nutritional trends (using the indicator of percent underweight children) point tocontinued improvement in most regions except Africa; however, the rate of improvement is generally far belowthat needed to meet internationally accepted goals, such as those for the World Summit for Children (1990),or for the International Conference on Nutrition (1992). Nutrition in Africa is projected to possibly deteriorate.For South Asia, where the underweight prevalence is by far the highest in the world, although improvementshould continue, the rate is such that many decades would pass before the problem was solved at the presentrate. Southeast Asia, although improving more rapidly, would still need to have an accelerated rate ofimprovement to meet proposed goals. South America, if the rate returns to that of the late 1970s, might meetthe goals by the year 2000.
Introduction
This Second Report on the World Nutrition Situation, five years after the first, describes trends in nutrition andrelated indicators from 1975 to the most recent year available, usually 1990. It thus updates by five years theinformation in the First Report. The report is compiled from existing data, generally as available to the UN
6

member agencies of the ACC/SCN. Methods and definitions in current use are adopted.
Since the publication of First Report in 1987, there has been a rapid rise in available national data, particularlyof anthropometry. The data on underweight in children − which provide a fundamental indicator − are nowcalculated from around 100 national surveys carried out since 1975; this is about double the number that wereavailable in 1987, in other words around 50 or so have been done in the last five years. Moreover, directestimates of levels of underweight children are available for all the most populous countries, and of trends inmost of these. Particular emphasis in preparing this report has been on understanding the situation in thecountries with large populations not included in the previous reports, and a set of case studies on nutrition inBrazil, Egypt, India, Mexico, Nigeria, and Pakistan have been prepared for this purpose. These will bepublished in 1993, and the results are used in this report.
Following the First Report, the Update on the Nutrition Situation was published by the ACC/SCN in 1989,which gave assessment of nutritional trends in 33 countries. In preparing this Second Report, the major efforthas again been to compile country−level data − including the six countries mentioned above − both as a basisfor the estimates at regional and global level, and to continue to track country trends themselves.
Data are presented in the first instance as regional averages, primarily as a means of summarization. Theregional groups used in this report are shown in Figure 1.1, in line with the groupings in common use by theUN. Country level data are given in Volume II of this report, which includes detailed information on 14countries, these countries also being indicated in Figure 1.1.
The focus is on nutrition in developing countries, and within this considerable stress is placed on malnutritionas it affects young children. In Chapter 2, trends and possible causal factors are presented, at regional level.Deficiencies of specific micronutrients − micronutrient malnutrition − are of increasing importance, not leastbecause of the growing prospects of effective intervention, and Chapter 3 summarizes recent information onthe major deficiencies, where possible with indications of trends. The nutrition of women has been perhapsunder−recognized as a problem, and recently the ACC/SCN has given regular attention to this topic. A firstattempt at assembling information on what is known about malnutrition in women in developing countries ledto the results given in Chapter 4.
An issue attracting increasing attention concerns the role of diet in causing chronic disease, particularly incountries in transition − nutritional, health, or demographic − from conditions of deprivation to risks of dietaryimbalances or excessive consumption. In Chapter 5, preliminary information to investigate this issue indeveloping countries is put forward.
In the last few years, a number of specific proposals have been put forward for goals for improved nutrition inthe 1990s, notably those of the World Summit for Children (UN, 1990), and the International Conference onNutrition (FAO/WHO, 1992b). For example, the World Summit for Children proposed a halving of theprevalence of mild/moderate malnutrition in children by the year 2000. It is instructive to see how trends in thelast 15 years, if projected into the future, compare with such goals. This is explored briefly in Chapter 6, which,it is hoped, will be a first step in more detailed consideration of scenarios of future nutrition situations.
Following the publication of the First Report on the World Nutrition Situation, a supplement providing fulldetails of methods, data and statistics used was published. This seems to have provided a basic compilationof disaggregated data that has been found useful. For the Second Report, a similar process is followed,including an extensive technical section on methods and statistics in Volume II. This second volume, to bepublished at the end of 1992, therefore contains a first section on nutrition trends in 14 countries, and asecond technical section on methods and statistics. In this first volume, Chapter 7 is included to contain anoutline of methods, data sources, bibliographic references, and other details to allow the volume to beself−contained. Methods for micronutrients, assessing women’s nutrition, chronic diseases, and projectionsare also introduced in their respective chapters.
This first overview chapter itself first lays out some of the underlying concepts concerning measurement ofnutrition and its underlying causes, in part addressing questions that are commonly raised in connection withinterpreting nutritional data, and introducing indicators used in Chapter 2. It then gives an overview of trendsin general malnutrition, comparing and contrasting the regional data in Chapter 2.
The sources of data are given in Chapter 7, and full details are in the technical section in Volume II. It shouldbe emphasized that the information here is derived from member agencies of the ACC/SCN, notably FAO(partly from AGROSTAT), ILO, WHO, UNICEF, UN Population Division, and the World Bank; some of thechild anthropometric results, and indicators of women’s nutrition, were initially compiled by the SCN and have
7

been shared with member agencies.
Figure 1.1 Map and listing of developing countries by country group included in this report
SUB SAHARAN AFRICA
AngolaBeninBotswanaBurkina FasoBurundiCameroonCentral AfricanRepublicChadCongoCote d’IvoireEthiopiaGabonThe GambiaGhanaGuineaKenyac
LesothoLiberiaMadagascarMalawiMaliMauritiusMauritaniaMozambiqueNigerNigeriaa,c
RwandaSenegalSierra LeoneSomaliaSudan
8

SwazilandTanzaniab,c
TogoUgandaZaireZambiaZimbabweb,c
MIDDLE AMERICA AND CARIBBEAN
Costa RicaCubaDominican RepublicEl SalvadorGuatemalaHaitiHondurasJamaicaMexicoa,c
NicaraguaPanamaTrinidad and Tobago
SOUTH AMERICA
ArgentinaBoliviaBrazila,b,c
ChileColombiac
EcuadorGuyanaParaguayPeruUruguayVenezuela
SOUTH ASIA
AfghanistanBangladeshc
Indiaa,b,c
Iran, Islamic Republic ofNepalPakistana,c
Sri Lanka
NEAR EAST AND NORTH AFRICA
AlgeriaCyprusEgypta,c
IraqJordanKuwaitLebanonLibyan Arab JamahiriyaMoroccoSaudi Arabia, Kingdom ofSyrian Arab RepublicTunisiaTurkey
9

United Arab EmiratesYemen
SOUTH EAST ASIA
Indonesiab,c
Kampuchea, DemocraticLaosMalaysiaMyanmarPapua New GuineaPhilippinesc
Thailand.b,c
Vietnam
CHINA
Note: The countries not listed in this report have been omitted mainlybecause of small population and/or missing data.
a Part of the ACC/SCN Six−Country Study of Nutrition Trends.
b Part of the ACC/SCN Country Programme Review.
c Countries with detailed trend analysis in Vol. II.
As will be seen, the report relies heavily on graphical presentations. Where possible, these are intended to becomparable across subjects or regions. Thus in Chapter 2 the panels show the same indicators in the sameplace on the page, with the same scales; a similar practice is followed in Volume II for countries. Also, mapsare intended to be comparable, and the shading is intended to generally go from light (good) to dark (bad).
Concepts and Indicators
Tracking the evolution of nutrition problems in the world − the aim of the Reports on the World NutritionSituation − relies on indicators which are comparable across countries and through time. Concepts ofnutrition, causal factors, and relevant indicators are briefly introduced here.
Nutrition itself refers to physiological processes, influenced by diet and exposure to infection. For children, theoutcomes are physical growth, activity, morbidity and mortality (related to immune competence, tissueintegrity), and psychological development. The most readily measurable of these is child growth, thusestimating growth failure by anthropometry gives a fundamental measure. In adults, effects of inadequatenutrition are similar to those for children except for growth and psychological development, physical activityperhaps being the most affected by undernutrition. In women, reproductive success is also importantlyaffected.
The reasons for concern about nutrition are many. Aside from health and physical well−being, freedom fromhunger is regarded as an important human right. Hunger itself is less easily and less widely measured, butapproximates to the estimates of low consumption discussed later.
GROWTH FAILURE AND UNDERWEIGHT IN CHILDREN. Growth failure parallels other nutritionaloutcomes, such as physical activity and psychological development. It is thus an indicator of these. Growthfailure itself is usually more pronounced between around six months and three years of age, and can result inboth stunting (low height) and wasting (or thinness). The age band used here is up to five years, deliberatelywide to capture the range of possible influences on growth failure. Using a wider age band, which errs of thesafe side, does not greatly affect prevalence levels − since much of the growth failure has taken place bythree years of age, an age range of up to two or three years would give roughly the same prevalences.Equally, because much of the underweight reported is due to stunting, which generally is irreversible, it shouldnot be taken that the estimates imply that underweight children all require immediate intervention (although
10

many would probably benefit). It is also important to note that improved anthropometry is not necessarily themost important objective of intervention, nor indeed the best measure of its success.
Anthropometric measurements do not distinguish specific causes of malnutrition. This, however, makes themparticularly useful as a general measure of nutritional outcome. They indicate whether or not there may be aproblem, but not why, nor what to do about it. For this reason a number of other indicators are required.
For the purposes of this report, the specific index used is prevalence of underweight preschool children (onethrough 60 months of age). A child is defined as underweight when the individual’s weight falls below −2 SDsof the expected weight at that age for healthy children. This index is used partly because it is the most readilyavailable, and data are compiled by WHO from available government reports and surveys.
In sum, measures of underweight in children are given prominence for two reasons. First, they measure aproblem in its own right − that of deprived children − which needs to be addressed in many ways. Second,they are an indicator of more general developmental and environmental problems in society. Moreover, childgrowth and welfare are intuitively well understood, independently of culture: when children are growing well,the situation cannot be too bad; when children are thin and stunted, something needs to be done. The positionas described in the SCN’s publication on Appropriate Uses of Anthropometric Indices in Children is given inbox 1−1.
LOW DIETARY ENERGY CONSUMPTION. Direct measurement of individual food intake is difficult andexpensive, and only limited amounts of such data are available. Added to this, the actual interpretation ofadequacy − adequate for what? − complicates the issue still further. If they could be measured, estimateswould be useful of the extent of hunger, of variations in physical activity (both productive and discretionary),as well as household food security in both the short−term (similar to consumption), and longer−term, whichmoves into me area of sustainability of livelihoods.
Further, at least some data are needed which are available for all countries, and suitable for assessing trends.The FAO Food Balance Sheet data give estimates of average dietary energy availability per caput, averagedover each year, by country. These provide one useful summary measure for assessing changes in foodavailability. While they can be approximately compared with average requirement for a country, and this isinformative, there are particular problems of interpretation. First and better known is the issue of distribution,as some people will be consuming above the mean, others below. Second, and of considerable importancealthough difficult to assess, is the fact that people choose their level of calorie intake according to their needs,controlled mainly by appetite when food availability is not constraining. This means that there is an importantcorrelation between food intake and food needs, a correlation that is exact in people who have access toadequate food (and maintain weight). This correlation breaks down as food becomes a constraint. The abilityto acquire adequate food depends upon income, hence effective demand for food. The match between needand intake depends on this, and determines adequacy.
Box 1−1. Uses of anthropometry in children
The most extensive public health problem among children in many developing countries is developmentalimpairment. It arises from the complex of nutritional, biological and social deprivation and is manifest as illhealth, wasting, and growth retardation resulting in stunting, functional disadvantages, and high mortalityrates. Rates of physical growth and achieved body size mark the process of failing to grow and the stateof having failed to grow respectively, and have been accepted as nonspecific markers of this syndrome ofdeprivation. Anthropometry is useful because it provides:
• a practical way of describing the problem;
• the best general proxy for constraints to human welfare of the poorest, including dietaryinadequacies, infectious diseases and other environmental health risks;
• strong and feasible predictors, at individual and population levels, of subsequent illhealth, functional impairment and/or mortality;
• under some circumstances, an appropriate indicator of me success or failure ofinterventions directed toward the many economic and environmental factors underlyingthe deprivation syndrome.
11

Anthropometric information per se is non−specific and does not identify the causes of growth failure.Anthropometry’s usefulness stems from its close correlation with the multiple dimensions of individualhealth and development and their socio−economic and environmental determinants. In poor communitiesdietary inadequacies and infection are often major environmental determinants of growth failure. Fromthese considerations it follows that interventions intended to avoid growth failure or to promote healthmay have to be directed at a number of points on the causal chain. While anthropometry may index theproblem1, it does not, by itself, identify the specific cause or indicate the specific solution. It is also truethat while anthropometry may index the existence of a problem, it is not always a satisfactory index ofresponse.
1 Growth failure, and indeed the deprivation syndrome, have commonly been equatedwith “malnutrition”. This has caused some misunderstanding since it has implied dietaryinadequacy as necessarily a primary cause. Results of anthropometry are commonly andappropriately used as indicative of “nutritional status”. It would be more accurate in thiscontext (though perhaps less compelling) to refer to anthropometric status. The followingterms are considered accurate and appropriate: underweight or overweight − fordeviations of body weight from expected weight−for−age; wasted or obese − fordeviations of body weight from expected weight−for−height; and stunted − for deviationsof height below expected height−for−age.
Source: ACC/SCN (1990a).
Such considerations make it complicated to estimate the proportion of the population with inadequateconsumption from knowledge only of the mean and distribution of consumption. However, some suchestimates have been made by FAO, and with due provisos (given in more detail in the technical section inVolume II) can be used to compare regions and assess trends over time.
The population “underfed” (as referred to here for brevity) is defined as: those people whose foodconsumption averaged over one year is inadequate to support more than light activity, defined as 1.54 x BMR,and maintain body weight. It should be noted that this definition, and its associated calculation methods, issignificantly different from that used previously, for example in the FAO’s Fifth World Survey of 1987. Theresults, which will be given in FAO’s Sixth World Food Survey, and are in ICN documents, are thus not directlycomparable with earlier estimates. They have been adopted because they are considered to be moremeaningful, and more readily understood, than those previously used. A major difference is that the referencetime period is now one year. The results are generally in line with the relatively few estimates made by directmeasurement on households, repeated over time to give yearly averages − for example the studies carriedout in a number of countries in collaboration with IFPRI.
The definition of low consumption approximates to concepts of hunger, and household food insecurity, whereaccess to food acts as a major constraint on livelihoods, productive activity, and well−being.
FOOD, HEALTH, AND CARE. Individual dietary intake and exposure to infection are two proximal causes ofmalnutrition, for which growth failure in children is a marker. As noted above, anthropometry is non−specific tocause, and does not distinguish these. Dietary intake is affected by food available to the household, andexposure to infection depends partly on the health environment. Both these are importantly modified by careof the individual, and there has been increasing realization of the importance of caring capacity, especially asrelated to women’s role and status. Thus the underlying causes of malnutrition are now grouped as:household food security; maternal and child care; and health services and the health environment. It isimportant to identify and use indicators of these three underlying causes. Food consumption has beendiscussed above; here indicators of health, and women’s status and caring capacity, are introduced. Again,data that are widely available, comparable, and showing trends over time are needed.
The indicators chosen to monitor health services and environment, based primarily on those available toWHO, were: immunization coverage, access to health services (defined as within one hour’s travel) and tosafe water, and incidence of low birth weight. For all these three, reasonable estimates were available formany countries at more than one point in time, allowing aggregation to the level of the region. Immunizationitself has implications both of preventing the specific disease (measles or tetanus here) and as a measure ofoutreach of health services. While low birth weight incidences are somewhat unreliable because onlycollected from attended births, they nonetheless provide some indicator both of maternal nutrition and health,and prospects for survival of the infant.
12

Assessments of women’s status and caring capacity, included for the first time in this report, have onlyrelatively recently become recognized. The indicators here are less specific than would be desirable, butnonetheless give some sense of changes and differentials of the situation. Thus enrollment in secondaryeducation (primary education is less revealing as enrollments are much higher), maternal mortality rates, andfertility rates give useable indicators.
ECONOMICS. Poverty is clearly a major determinant of nutritional outcome, and rapid economic growth hasbeen a major solution to malnutrition for example in Southeast Asia. However, comparison of China with Indiashows (for example) that the former has a far lower level of malnutrition although a similar average income(although allowing for prices puts China considerably ahead); within India, the relatively low level ofmalnutrition in Kerala, nonetheless one of the poorer states, is parallel. Other examples include the relativelygood nutrition in Zimbabwe, compared to much of the rest of Africa. The relationship between GNP andunderweight is discussed in Box 1−2.
Important underlying influences drive long−term changes in nutrition, albeit interacting with economic factors,such as education levels, health infrastructure, fertility rates, and the like. These seem to provide momentumto nutritional change, which economic trends can accelerate or hold back, but may take some time tofundamentally alter.
One conclusion from this is that while economic growth is essential, it is not necessary to wait fordevelopment in order to try to improve nutrition. For example, community programmes in countries such asTanzania and Zimbabwe in Africa seem likely to have had an effect; in China, a range of explanations existsfor the better nutrition, including community organization, and the relatively high level of food availability.These factors are discussed further in the country reports in Volume II, and are the main objective of aseparate study undertaken by the SCN due to be published in mid−1993. For the present purposes, theseconsiderations stress that indicators should be examined in combination, in understanding nutritional trends.
INTERPRETING INDICATORS. The indicators shown in this report, especially those for regional level inChapter 2, are primarily intended to be descriptive, mat is to give an assessment of trends in nutritionalproblems, and of possible causal factors, but not extensively to link these. The presentation is intended foreasy comparison between regions in Chapter 2 (the same indicator is shown in the same place in each panel,with the same scales), and a similar approach will be taken in Volume II at country level. The text aims toprovide some interpretation, but it is left also to the reader to draw conclusions. In the chapters onmicronutrients, women’s nutritional status, and non−communicable diseases, the approach is more selective,in part because of less extensive availability of data.
Box 1−2. GNP, malnutrition and public action
The general relationship between the prevalence of underweight children and GNP per capita is clearly illustrated in thegraph. Anthropometric data based on surveys in the 1980s indicate a strong relationship in the range betweenUS$200−900 per capita. A regression analysis (details given in Vol. II Methods and Statistics) indicates that the incomeeffect is strongest at the lower end of the range. Increasing GNP per capita from around $300 to $600 is associated witha decline in the prevalence of underweight children from around 34% to 17%, or a reduction of about 50%. Beyond the$900 income per capita level, the effect of increasing incomes on malnutrition diminishes. Countries in South Asia (India,Nepal, Bangladesh and Pakistan) generally have higher prevalence of underweight children. However, the causes ofchild malnutrition in that region and its interpretation may have some differences from elsewhere.
As seen from the fitted regression line, there were countries which performed better than expected given their level ofincome. One of the explanations is the significant role of public expenditures for social support. In Chile, Jamaica, CostaRica, Zimbabwe and Egypt, social support expenditures (health, education and social welfare budget) as a proportion ofthe GNP in 1987 ranged from 13% to 19%, which contrast to Mexico or Indonesia which had much lower social supportexpenditures of 4% and 3% of GNP respectively.
13

Percent underweight preschool children (Below −2 S.D. weight−for−age)
Notes: Data on prevalence of underweight children are based on actual surveys (latest available). GNPper capita is given for the same year that each country’s anthropometric survey was undertaken.
Overview of Trends in Malnutrition
Between 1975 and 1990, the total prevalence of underweight children (percent below −2 standard deviationsfrom the mean weight−for−age, zero through five years) for developing countries is estimated to have fallenby 7.3 percentage points, approximately from 42% to 34%. Data by region are plotted in Figure 1.2, and givenin Table 1.2. The rate of improvement overall was higher in the late 1970s than during the 1980s, and this wasgenerally true for most regions. In China and the Americas, the improvements in the late 1980s were less thanthe early 1980s. Nutrition in Sub−Saharan Africa probably deteriorated on average during the 1980s.
The relative prevalences of underweight children estimated in 1990 by country are mapped in Figure 1.3.Changes in the prevalence between 1985 and 1990 have been estimated, and results are shown in Figure1.4. A rate of improvement of two percentage points in five years (i.e. about 0.4 percentage points per year)seems to represent significant improvement − for example India had around this level during the 1980s. Thus,arbitrarily, “no change” is scored as +/−0.4 percentage points per year, and increasing or decreasingprevalences on either side of this. The map shows the relatively static situation in the Americas during 1985 to1990, and the improvement in South Asia and Southeast Asia. It also shows countries in the Sahel recoveringfrom the droughts in the early 1980s. Ethiopia, Sudan, and Mozambique are highlighted as relativelyunchanged, but with acute problems.
14

Figure 1.2 Trends in prevalence of underweight children, 1975−1990
The general trend of improving prevalences in most parts of the world, calculated partly by indirect methodsas shown in Figure 1.4, is confirmed by direct comparisons between surveys where these have been repeatedin the same countries. A listing of those countries with repeated national anthropometric surveys is given inTable 1.3, and scanning the right−hand column indicates the general trend by region. It can be seen that mostsurveys show an improving prevalence, except in Africa.
Prevalences and numbers of underweight children by region, for 1980 and 1990, are also illustrated as shownin Figure 1.5. This display puts the percentage underweight of the vertical axis, and the horizontal axis is thetotal child population. Prevalences can be directly compared across regions for 1980 and 1990 (the samedata shown in Figure 1.2). The area of the box for each region then represents the numbers of childrenunderweight, being the product of the proportion underweight and the total child population. Comparing theupper and lower parts of the figure gives an impression of how the relative numbers are changing. These canbe seen to be rising in South Asia, proportionally more so in Sub−Saharan Africa, and decreasing in SouthEast Asia. Numbers are also rising in China, although the prevalence is decreasing. The relatively fewerunderweight children in the Americas and Near East/North Africa can be seen to be due to both lowerprevalences and smaller populations.
Table 1.2 Regional prevalence and numbers of underweight preschool children1 in developingcountries, 1975−1990
Percent underweight Numbers underweight
Region 1975 1980 1985 1990 1975 1980 1985 7990
percent in millions
Sub−Saharan Africa 31.4 28.9 29.9 29.9 18.5 19.9 24.1 28.2
Near East/North Africa 19.8 17.2 15.1 13.4 5.2 5.0 5.0 4.8
South Asia 67.7 63.7 61.1 58.5 90.6 89.9 100.1 101.2
South East Asia 43.6 39.1 34.7 31.3 24.3 22.8 21.7 19.9
China 26.1 23.8 21.3 21.8 20.8 20.5 21.1 23.6
Middle America/Caribbean 19.3 17.7 15.2 15.4 3.4 3.1 2.8 3.0
South America 15.7 9.3 8.2 7.7 4.8 3.1 2.9 2.8
Global Total 41.6 37.8 36.1 34.3 168 164 178 184
402 434 493 536
15

Total 0−4 Child Population in DevelopingCountries
1 Includes all children 0 through 60 months.
Table 1.3 Countries with repeated national anthropometric surveys
Country Year Most recent estimate (Percentbelow −2 s.d. weight−for−age)
Apparent trend inprevalence of underweight
children
Sub−Saharan Africa
Kenya 1977,1979, 1982,1987
17.0 Falling
Lesotho 1976,1981 13.3 Falling
Rwanda 1976,1985 27.5 Static
Sierra Leone 1975,1978 23.2 Falling
Togo 1977,1988 24.4 Rising
Zambia 1985,1988 25.8 Rising
Zimbabwe 1984,1988 10.0 Falling
Near East/NorthAfrica
Egypt 1978,1988 10.0 Falling
Tunisia 1975,1988 7.8 Falling
South Asia
Bangladesh 1981,1985,1990 66.5 Same, then falling
India 1977,1989 63.0 Falling
Pakistan 1977,1987,1990 40.4 Falling
Sri Lanka 1976,1980,1987 36.6 Falling
South East Asia
Indonesia 1978,1987 39.9 Falling
Malaysia 1983,1986 17.6 Falling
Myanmar 1982,1987,1990 33.0 Same, then falling
Philippines 1978, 1982,1987,1990
33.5 Falling, then static
Thailand 1981,1987,1990 13.0 Falling
Vietnam 1987,1990 41.9 Falling
MiddleAmerica/Caribbean
Costa Rica 1978,1982 6.0 Falling
El Salvador 1975,1988 15.5 Falling
Jamaica 1978,1985, 1989 7.2 Falling
16

Trinidad/Tobago 1976,1987 5.9 Falling
South America
Bolivia 1981,1989 11.4 Falling
Brazil 1975,1989 7.1 Falling
Chile 1978,1982,1986 2.5 Static
Colombia 1980,1986, 1989 10.1 Falling, then static
Peru 1975,1984 13.4 Falling
Venezuela 1982,1987 5.9 Falling
Notes: Specific country sources are given in Vol. II: Methods and Statistics.
Figure 1.3 Prevalence of underweight preschool children in developing countries (1990)
17

Figure 1.4 Changes in the prevalence of underweight preschool children from 1985 to 1990
Figure 1.5 Prevalences and numbers of underweight children by region, 1980 vs. 1990
Figure − 1980
18

Figure − 1990
Note: The vertical axis is the prevalence; the horizontal axis is the total child population; the area thusrepresents the number of underweight children. This figure displays relative numbers and prevalences ateach time, and population growth between 1980 and 1990. Changes over time can be seen by comparingupper and lower charts.
In terms of both prevalences and numbers, South Asia dominates the picture. This group of countries, ofwhich India forms the major part, appeared to be less affected by recession, and results recently published byIndia’s National Institute of Nutrition in Hyderabad are extremely important in showing that in most states therewas a steady reduction in the prevalence of underweight children during the last ten years. However,comparison of South Asia with other regions presents some problems. As noted in the First Report on theWorld Nutrition Situation, South Asia has about twice the prevalence of underweight children compared withother regions such as Africa, although these have similar levels of food availability, IMR, etc. This is discussedfurther in the section on South Asia in Chapter 2, but the conclusion remains the same as in the First Report,that in terms of causes and consequences, interpretation of underweight child prevalences in South Asia mayhave some differences compared to elsewhere. This is not, however, to minimize (the problem: prevalencesare still the highest in the world, and there are more deprived children in that region than anywhere else.
The calculation that the rates of improving prevalence in Southeast Asia and South America have been justsufficient to reduce the numbers of underweight children marks something of a watershed. This point mayalso almost be reached in South Asia, with hardly any increase calculated between 1985 and 1990, see Table1.2. Indeed, it is possible that the global total of numbers of underweight children could begin to decline in thenext five years, which really would be a turning point in world history.
Results from FAO’s assessment of the dietary energy supply (DES) expressed in kcals per caput per dayindicate that overall food available for human consumption has increased to a global average of 2,470kcal/caput/day in 1988/90 for developing countries, from a level of 2,330 in 1980 and 2,120 in 1970. While theDES measure has limitations, it does give a useful picture of national level trends in food energy availability.Trends in DES by region are shown in Figure 1.6.
19

Figure 1.6 Dietary energy supply, 1970−1989
Source: FAO. see Chapter 7.
Note: East Asia is mainly China.
The rate of increase in DES per capita has been generally slow in the 1980s compared to the 1970s. The foodsituation in Africa is most serious, experiencing some declines in the mid−1980s as a result of drought,recovering later but remaining flat since then. In South America, the estimated average calorie supply in 1990was slightly lower than in 1980, although still relatively high.
The dietary energy supply in China (East Asia in Figure 1.6) increased from around 2,000 kcals in 1970 −then about the lowest in the world − to more than 2,500 in 1990, similar to South America. Southeast Asiaalso showed important increases, although slightly less than China. In South Asia, which is strongly influencedby India, kcal availability remains very low, although increasing slightly during the last 15 years, and is nowsomewhat greater than Sub−Saharan Africa.
Data on dietary energy supply can be used to estimate proportions and numbers of people with inadequatedietary intake. Methods for these estimates have evolved in the last few years, since those put forward inFAO’s Fifth World Survey in 1987 (as included in the First Report on the World Nutrition Situation). Thecurrent estimates, as noted above, are of the population with energy intake inadequate for more than lightactivity on average over the course of a year. They are thus closely related to DES values, but distributionscan vary over time and between regions. The recent estimates are shown by region in Figure 1.7, calculatedfor this report by FAO. They are based on the same data as in the documentation for the InternationalConference on Nutrition, and will form the basis of FAO’s Sixth World Food Survey.
20

Figure 1.7 Population with dietary energy supply < 1.54 BMR, 1970−1989
Source: FAO, see Chapter 7.
Note: These estimates were provided by FAO based on DES and distributions described inChapter 7. These results are from the same database given in the ICN document “Nutritionand Development: A Global Assessment” (FAO/WHO, 1992c) and FAO’s Sixth World FoodSurvey (forthcoming).
The results show a substantial reduction in the proportions of people underfed, particularly in Asia, and also inthe Near East/North Africa. The proportion is estimated to have risen slightly in Sub−Saharan Africa, hencethe numbers here increased substantially. Overall, the decrease in proportion underfed led to a considerabledrop in the numbers so affected, from nearly 1,000 million in 1974/76 to about 800 million in 1988/90 (seeTable 1.1).
This estimate is considerably influenced by the improving situation in China. Excluding China (and certainother East Asian countries, such as Korea and Vietnam), a slight increase in numbers underfed is stillestimated by FAO, from around 540 million in 1979/81 to about 580 million in 1988/90.
Other indicators are shown by region in Chapter 2, and can be contrasted between these by comparingpanels.
Perhaps a global summary view would be that the nutrition situation − except in Sub−Saharan Africa − ismaking a fragile recovery from me slowdown in the early 1980s. The situation is poised for significantprogress in the years to come in much of the developing world, if economies strengthen, and programmes areextended and focussed on the most vulnerable. But in Africa, me trend needs to be reversed.
Chapter 2: Regional Trends in Nutrition
Sub−Saharan Africa
(Panel 1)
Sub−Saharan Africa’s nutrition situation is fundamentally different from other regions of the developing world:the underlying trend is deteriorating in many countries. The basic reason is the failure to develop. This isclearly true economically (see Panel ID), but also applies in contrast to most other regions in terms of health
21

infrastructure and education. These have shown some progress over the last 15 years − for example, theyhelp explain the decrease in infant mortality rates − but the trend is discouraging. Compounding thedifficulties, population is growing faster than anywhere else in the world, at nearly 4% per year in a number ofcountries − double the rate in Asia, for example. Coupled with slow development, this means that per caputindicators of production are declining significantly.
On these underlying problems are superimposed persistent or repeated crises: drought, civil wars, andeconomic recession and adjustment. These periodically lead to famines that still affect millions. This too isnow unique to Africa, as famine has been virtually eradicated elsewhere in the world.
The long−run failure of development and short−run crises reinforce each other. The results can be seen inmost of the indicators discussed here, and (as will be seen in Chapter 6) most projections into the future forAfrica envisage a deteriorating or only slightly improving trend. This is in contrast to other regions, and starklydifferent from the goals put forward at the World Summit for Children, the International Conference onNutrition, and every other forum that has addressed the issue.
The average prevalence of underweight children in Sub−Saharan Africa has been static at around 30%between 1980 and 1990. The results shown in Figure 2.1 attempt to capture year−to−year fluctuations, sinceAfrican conditions change fast, giving more detail than Panel 1B. Results from individual countries tend toconfirm by direct observation the generally static or deteriorating trend. Details of nutritional trends in fourcountries, Kenya, Nigeria, Tanzania, and Zimbabwe, are given in Volume II, and these will be referred to inthis section. One conclusion is that where there are vigorous community−level programmes, such as inTanzania and Zimbabwe, malnutrition in children can be contained and indeed improved. Thus, for example, itis estimated that the prevalence of underweight children in Zimbabwe came down from around 23% to around12% between 1985 and 1990. On the other hand, indications are that the prevalence of underweight childrenin Nigeria is high, greater than 35%, and may well be increasing.
The overall prevalence of underweight children remaining static implies a substantial increase in the numbers,because of the population expansion. Estimates of the preschool population underweight thus rose fromaround 18 million in 1975 to 30 million in 1990. These levels are estimated from direct results from 24countries in the region, and the static or deteriorating trend is generally observed in repeated surveys in six ofthese (see Table 1.3). For example, national surveys in Togo and Zambia showed increasing prevalence,while this probably stayed much the same in Rwanda. Improving trends were, however, observed in Lesothoand Zimbabwe, and on average in Kenya.
Figure 2.1 Sub−Saharan Africa: Underweight preschool children, 1975−1990 (Below −2 s.d.weight−for−age)
Famine now worsens these problems. The horrors of Somalia vividly demonstrate that the poor and childrensuffer most during anarchy. Civil wars have devastated large areas in the Horn of Africa, including Ethiopiaand Sudan, as well as Somalia, for several years. Nobody knows the extent of malnutrition and death, but itmust be enormous. At the same time, population movements lead to heightened malnutrition amongstrefugees, notably in northern Kenya from the troubles in the Horn. As if nature were conspiring with man,
22

much of this region has suffered recently from an unusual drought. A somewhat parallel situation exists insouthern Africa, particularly in Mozambique. Here, drought has added to the devastation of civil war and led tolarge numbers of refugees, many malnourished, in Malawi, Zimbabwe, and South Africa. In West Africa,fighting has caused large−scale destruction of resources and population movements, centered on Liberia,again exacerbating malnutrition.
The drought of 1983−84 was one of the worst for many years. That which is now affecting southern Africa andparts of East Africa is even more severe − in southern Africa, probably the worst in living memory. InZimbabwe and South Africa, for example, the issue is not only in providing food, but in supplying water itself tosustain life and prevent people dying of thirst. Nonetheless, although the import requirements are enormousand logistical problems appear insuperable − for example, the transport capability for grain cannot keep upwith need in Zimbabwe − there are some hopes that concerted action may reduce or even prevent the deathsfrom famine which would otherwise be inevitable.
Infant and child mortality rates have continued to fall during the period, although (in contrast to other regions)not rapidly enough to bring about a decline in the total number of infants and children dying. The IMR isestimated to have fallen from around 135 per 1,000 live births in 1975 to approximately 120 in the early1980s, and to 105 in 1990. Over this period, numbers of infants dying rose from approximately 1.5 million in1975 to 2 million in 1990. The fall in IMR may be ascribed to improved outreach of health services and,notably, immunization of mothers against tetanus which WHO reported to have covered 46% of mothers in1991 compared to 12% in 1983.
The average income as estimated by GNP per capita has also declined since 1981, and is now back toaround the levels experienced in the 1970s, of around US$300 per year. The improvement of the late 1970swas sharply reversed around the beginning of the 1980s, primarily due to the twin effects of drought andrecession. At the same time, the debt burden rose rapidly − for example, typical debt service was around 5%of export earnings in the 1970s, rising from 20% to 30% in the latter part of the 1980s. The averageindebtedness overall is around US$280 per caput, not far different from the average annual GNP per caput.Servicing this debt takes, on average, around 25% of export earnings.
Food production per caput has been declining during the last 20 years, especially in the drought years of 1984and 1991/92. At the same time, food consumption has increased in the first part of the period, the gap beingmade up by imports and food aid. With the current drought (1991/92), food production is no doubt showing acontinued fall, and, indeed, the calorie supply per caput will be hard pressed to maintain the relatively lowlevel of approximately 2,100 kcals per day. This usual level is, itself, no better than that experienced ten yearsago on average (see Panel IF).
The proportion and numbers of people estimated not to be eating adequate food, on average, to maintainproductive activity parallel the estimates of calorie availability, since the distribution is not thought to havechanged. It is now estimated that around one−third of the population of Sub−Saharan Africa is not consumingadequate calories, so mat the numbers of people underfed rose rapidly in the last 15 years, from around 130million in 1980 to around 170 million in 1990 (Panel 1G). This proportion of “food insecure” people is now byfar the highest in the world, and indeed the rapidly rising trend in numbers so affected is in contrast to otherregions.
One factor that importantly protects child nutrition in most of Africa is the almost universal practice ofbreastfeeding, certainly in rural areas, although this is under threat with urbanization. Moreover, there is someevidence that promotional campaigns may be having an effect. For example, in Kenya, the mean duration ofbreastfeeding amongst educated women has actually increased over the last 15 years. Similar results havebeen observed in Ghana. It is obviously of enormous importance to protect the practice of breastfeeding,which is as extensive in African countries, or more so, than anywhere else. At the same time, as will bediscussed further in Chapter 4, there is a relatively low incidence of low birth weight in Africa, probably related,in turn, to the fact that African mothers are relatively well−built, compared with women of similar poverty in, forexample, Asia.
The economic crisis in many African countries has led to rapid increases in consumer prices. As examples,the consumer price index tripled in Zimbabwe between 1980 and 1987; it rose by nearly ten rimes during asimilar period in Tanzania; and around six times in Nigeria. Fortunately, the food price index did not rise anyfaster than the consumer price index in most countries (Tanzania is an exception), as it is generally observedthat the ratio of FPI/CPI is more closely related to underconsumption and malnutrition than the consumer priceindex itself. In other words, at least food did not preferentially become more expensive.
23

Panel 1 SUB−SAHARAN AFRICA
POPULATION
A. Million, log scale
CHILD GROWTH AND SURVIVAL
B. Underweight preschool children
24

C. Infant mortality rate
ECONOMICS
D. GNP per capita
E. Debt service ratio
FOOD
F. Dietary energy supply
25

G. Underfed population
HEALTH
H. Immunization coverage
I. Access to health services and potable water
J. Low birth weight
WOMEN’S STATUS AND CARING CAPACITY
26

K. School−age females in secondary school
L. Maternal mortality rate
M. Total fertility rate
The economic crisis in most countries led to programmes of structural adjustment, with significant cutbacks inpublic expenditure in the social sectors, such as health and education. Indicators such as enrollment insecondary school, which, on average, declined slightly during the latter part of the 1980s, reflect this.Individual country data (see Volume II) will show that expenditures on health and education tended to declinefrom the mid−1980s, both as a percentage of the government budget and in absolute terms − this wascertainly the case in Nigeria and Tanzania, and for health in Kenya; Zimbabwe managed to protect itsexpenditures, as did Kenya, on education, up to 1988.
On the positive side, improvements in infant and child mortality rates (if not numbers) are linked to effectivecampaigns for immunization, notably for neonatal tetanus and measles, and some improvements in access tohealth services and sanitation overall. For example, it is now estimated that nearly 60% of the population havesome access to local health care (defined as access to treatment within one hour’s walk or travel), and that30% to 40% of the population have access to sanitation and/or clean water, up by around 10 percentagepoints between 1984 and 1990 (Panel II).
Indicators of the situation of women are scarce, but not encouraging. For example, the enrollment of girls insecondary school increased significantly between around 1975 and 1985, but appears to have declined sincethen, from 20% in 1985 to 16% in 1990 (Panel 1K). While this may reflect the rapidly increasing population ofthis age, it also shows that the facilities have not kept up. Maternal mortality remains among the highest in the
27

world − and the latest statistics from WHO show evidence of deterioration (Panel 1C). Between 1983 and1988, maternal mortality rates per 100,000 live births increased to 680 from 660 in East African countries, to710 from 690 in Middle African countries, and to 760 from 710 in West Africa. The incidence of low birthweight is difficult to estimate because of low coverage of attended births, but such evidence as there is tendsto demonstrate virtually no improvement in the last decade.
The nutrition situation in Africa is expected to become increasingly serious as the end of the centuryapproaches. Projections to the year 2000 suggest that filling the projected gap in basic staples in the regionwould require more than twice the 1.7% annual growth in production which occurred from the 1960s to 1980s.Among the sub−regions, the major concern in this respect is West Africa, where growth in food output is stillvery slow and the population is expected to increase by more than 3% annually in the 1990s. Africa’sagricultural production potentials are far from being fully utilized. Roots and tubers, for example, have yet tobenefit from technological breakthroughs. The concern of governments for food self−sufficiency, however,should not deviate attention from the primary objective of household food security, which is mainly a questionof household income.
Unless a great deal of change occurs and soon, the people of the continent could suffer even more chronicand acute hunger. It is important to distinguish the situation in war areas, from those where there is a chanceof stability. It is absolutely essential that the civil wars, such as in the Horn of Africa, cease, as is vividlydemonstrated by the situation in Somalia. All that follows depends on peace.
Refugees and displaced people, when they reach an area where relief can be provided, must have theirneeds for food and health, at a minimum, met − and usually this will require external assistance. Nutritionalneeds must be better borne in mind in the future, not the least ensuring adequate quality of diet, preventingepidemics of micronutrient deficiency diseases.
But the underlying situation throughout most of the continent has to be of grave concern. If economiescontinue to decline, population continues to increase, and the health situation (including AIDS) deterioratesfurther, much of Africa could become a disaster area. On the other hand, with stability established, there arereal prospects for technological change in rural and urban areas beginning to turn the situation around.Pressure on cultivatable land is high, but still less than many other parts of the world, and if “green revolution”technologies can be developed and adapted, these could begin to transform rural areas and help economicgrowth. Equally, the tradition of community organization could be built on, and the successes already seen incommunity−level programmes could become more widespread. Sub−Saharan Africa has a long way to go indeveloping health and education infrastructure, but the positive side of this is that there is clear potential forwidespread improvement. There are basic resources of land and people, but time is running out to reversedeteriorating trends.
Near East and North Africa
(Panel 2)
The region has three different groups of countries: the high−income oil−exporting countries of Kuwait, SaudiArabia, United Arab Emirates, and Libya; the middle−income group of Iraq, Cyprus, and Algeria; and thelow−income countries with per capita GNP below US$2,000, including Egypt, Jordan, Morocco, Syria, Tunisia,Turkey, and Yemen.
In the last five years, nutrition in the region as a whole improved. Prevalence of underweight preschoolchildren was estimated at around 15% in 1985, declining to around 13% in 1990 (Panel 2B). The numbers ofunderweight children also fell marginally over the period − from 5 million to around 4.8 million. Directassessments from surveys in Egypt and Tunisia showed improving trends (see Table 1.3). Data for the periodsince the Gulf War (early 1991) are scarce. However, it is likely that receipts from workers’ remittances havebeen affected (e.g., for Egypt, Syria, and Turkey) hence possibly consumption. From Iraq, there have beenseveral reports indicating deteriorating health, food availability, and nutrition.
The incidence of low birth weight, anyway reasonably low in the region, is estimated by WHO/UNICEF to havefallen slightly on average during the 1980s, from around 12% to around 11% (Panel 2J). Specific countryresults are, for example, 7% in 1985 in Saudi Arabia, and about 12% in Algeria, with most countries falling inbetween these values. Contributing to the relatively adequate birth weight is the high percentage of womenreceiving antenatal care. Nearly universal coverage has been achieved in, for example, Cyprus and Kuwait; it
28

is estimated to be above 75% for Jordan, Libya, and Saudi Arabia, although lower in countries such as Egyptand Morocco.
Breastfeeding, fortunately, remains the almost universal practice in most countries. The percentage everbreastfed is 90−95%, for example, in Egypt, Morocco, and Tunisia, slightly higher in rural than urban areas.This proportion has held fairly steady over the last ten years. According to World Fertility Survey (1970s) andDemographic and Health Survey (1980s) results in Egypt and Morocco, breastfeeding initiation is now higherin educated women than earlier, and the median duration of breastfeeding slightly longer. This encouragingfinding indicates that promotional programmes may succeed; moreover, as the proportion educated increasesanyway, breastfeeding may be further supported.
The trends in the price of oil dictated, to a large degree, the movement in the economies of the region,including those countries which were not net exporters of petroleum products such as Egypt, which,nonetheless, benefitted from workers’ remittances from the oil exporting countries. The regional GNP percaput rose from around US$1,100 in 1975 at the start of the first oil crisis to around US$2,600 in 1982, butfalling sharply thereafter with the decline in the price of oil. The 1990 regional weighted GNP per capita figureis estimated at US$1,900, back to where it was in 1980 (see Panel 2E). However, other indicators show someimprovement through the 1980s, and since so much of GNP is from oil here, the indicator may not well reflectchanges in actual income for much of the population. Egypt, the most populous country, had rising per caputGNP in the 1980s (see Volume II).
With very little arable land and largely dependent on rainfed agriculture, nearly half the food supply in the1980s came from imports, as well as from food aid for the less well−off countries. In Egypt, Morocco, Tunisia,and Algeria in 1990, for example, out of the 39 million metric tons of cereal supply, 18 million metric tons werefrom external sources (15.8 million from commercial imports and 2.2 million from food aid receipts). At thesame time, food consumption patterns are changing, particularly in the middle income class. Meatconsumption per capita has increased, resulting in increased demand for grains for livestock. In 1981, 17% ofthe total cereal supply was used for animal feed, increasing to 34% in 1990, which accounted for much of theincrease in total cereal supply.
Consumer food subsidies are very important in several countries. Egypt has one of the largest food subsidyschemes in the world, covering 93% of the population; per capita food availability is above 3,000 kcal − similarto developed countries. Overall, the trends of per capita calorie availability in the region have been upward,from around 2,650 in the mid−1970s to 3,100 in 1990 (Panel 2F). Marked increases occurred in Algeria, SaudiArabia, and Tunisia, but at a lesser rate in Cyprus, Yemen, Turkey, and Jordan. Egypt, while not the richestcountry in the region, achieved the highest level of calorie availability per capita of 3,336 by deliberate policy,although at a high foreign exchange cost. Imports of cereals in Egypt for the 1990−91 crop year reached 6.7million metric tons while 1.7 million tons of food aid (mainly wheat from the United States) were received.Such policies of subsidies and imports did lead to fiscal problems, for instance, in Egypt and Morocco.
FAO data show that the proportion of the population considered to be “underfed” fell from 8% in 1980 to 5% in1990. In absolute numbers, this implies 15 million people in 1980 compared to 12 million in 1990 (Panel 2G).
Many countries in the region adopted stabilization and adjustment programmes designed to correct theirexternal imbalances and credit worthiness. Morocco, Algeria, and Tunisia, in particular, pursued aggressivereforms aimed at strengthening the balance of payments and promoting economic efficiency. Egypt’s totaldebt increased nearly tenfold over a 15−year period − from US$4.7 billion in 1975 to US$40 billion in 1990,implying a per capita debt of about US$800 in 1990. Rapid increases in debt were also experienced byTurkey, Morocco, and Algeria. The debt service ratio in the region hit a maximum of around 35% in 1986 to1989. In 1992, substantial debt relief was provided to Egypt following the Gulf War of 1991.
Future food security is closely tied to the ability to import cereals. Domestic production capability is limited bythe scarcity of arable land and irrigation. Agricultural production, mainly rainfed, has been unstable due toerratic rainfall patterns. Egypt’s irrigation capability has been threatened recently by the unstable supply ofupstream water from the Nile − including drought in Ethiopia, reducing water in the Aswan Dam.
On the positive side, reforms in agriculture in Egypt, Morocco, and Tunisia in the second half of the 1980shelped to increase overall agricultural output to record levels in 1990−91. Agricultural policies in Egypt haveaimed to increase production of cotton to generate foreign exchange and thus help to pay for food imports.
The improvements in nutrition in the region are also tied to developments in the health situation. In mostcountries, local health care coverage has been very high compared to other regions of the developing world.
29

The proportion of the population with access to health care (defined as being within one hour’s travel)increased from 83% in 1983−85 to 89% in 1988−91 (Panel 21). Access to clean water supply increased from75% to 86% over the same period, although the proportions of those with sanitary facilities remained ataround 75%. Immunization coverage against measles has increased, doubling between 1983 and 1991, toaround 80% (Panel 2H). The proportion of pregnant women immunized against tetanus increased from only5% in 1983 to 56% in 1991. Programmes such as diarrhoea control were successfully implemented − and inEgypt, in particular, where access to ORT reached 83% of the population in 1989. These developments inhealth care coverage no doubt contributed to the decline in IMR.
Female literacy is on the rise, although the levels in various countries vary widely. Cyprus, Lebanon, Libya,and Kuwait, for instance, report over two−thirds of school−aged females are enrolled in schools, and with arising trend. Saudi Arabia, Morocco, Yemen, and Tunisia, on the other hand, have female literacy rates below40%, which are half the rates of males in the same countries. For the region as a whole, female enrollment inthe secondary level increased from 32% to 52% between 1975 and 1990. Recent surveys in Egypt andMorocco have re−emphasized the relevance to nutrition: they found that women with at least primaryschooling are only half as likely to have underweight children as those women without schooling at all.
Maternal mortality rates overall are estimated by WHO to have dropped to 360 per 100,000 live births in 1991from a high of 500 per 1,000 in 1983. Improvements were observed particularly in Egypt and Morocco. Notrends in coverage in antenatal care and delivery by trained personnel are available. However, the levelsreported in 1988 of proportions of deliveries by trained personnel were relatively high − for example 75% inJordan and 83% in Turkey.
The child underweight prevalence is expected to drop further from 13% in 1990 to less than 10% by 2000.The rate of improvement will, however, be somewhat dampened by the increasing food import bill. This will befelt more seriously by the non−oil producing countries in the region. As population increases, total demand forfood will rise. The increasing fiscal cost of food subsidies (particularly for the non−oil producing countries inthe region) will put a strain on the government budget. Reliance on domestic sources for food is limited by thelack of arable lands, and the fragile situation of irrigation in Egypt. The impact of re−targeting subsidies to thepoorest would be cost−effective, but involves political risks. Rising incomes and changing food habits in theregion have tended to shift the focus of the debate to diet−related chronic diseases. In Egypt, several regionalstudies indicate a rising trend in obesity among school children − 11% were above 120% of weight−forage in1962, and around 23% in 1987.
The prospects are for continued improvement of nutrition, particularly if economic recovery continues, and percaput incomes increase again. A number of trends are in the right direction. Fertility rates are falling, andaccess to health and potable water are improving, to the point where they will soon be universal.Immunization is equally going to reach complete coverage before long. The trend in malnutrition isdownwards, although indicators such as IMR still have a considerable distance to go. Food availability isrelatively high, and provided imports can be maintained, is likely to remain so.
Threats to the continuation of these encouraging prospects include rising population density and urbanization,linked to increased strain on productive and social resources. Nonetheless, as discussed further in Chapter 6,with accelerated programmatic efforts, there are prospects that nutrition in the Near East and North Africa willcontinue to improve, and could even begin to meet internationally agreed goals.
Panel 2 NEAR EAST AND NORTH AFRICA
30

POPULATION
A. Million, log scale
CHILD GROWTH AND SURVIVAL
B. Underweight preschool children
31

C. Infant mortality rate
ECONOMICS
D. GNP per capita
E. Debt service ratio
FOOD
F. Dietary energy supply
32

G. Underfed population
HEALTH
H. Immunization coverage
I. Access to health services and potable water
J. Low birth weight
WOMEN’S STATUS AND CARING CAPACITY
33

K. School−age females in secondary school
L. Maternal mortality rate
M. Total fertility rate
South Asia
(Panel 3)
In South Asia, the proportion of underweight children is nearly double that of elsewhere in the world. This is inline with some related indicators, such as low birth weight; however, others, such as infant mortality rate, onthe one hand, or income, on the other, are similar to Africa where the underweight prevalence is substantiallylower. That healthy well−fed children from South Asia grow at the same rate as children everywhere else iswell established; the growth failure is undoubtedly environmental and preventable.
Although it is uncertain how far the causes and consequences are directly comparable with other populations,the high underweight prevalence levels undoubtedly indicate an extensive problem, and the huge numbers soaffected constitute probably the biggest nutritional problem in the world. The trends over time can beinterpreted more straightforwardly and compared with those in other regions.
Direct estimates of levels and trends in the prevalences of underweight preschool children are available fromIndia (eight states), Pakistan, Sri Lanka, and Bangladesh. Regional averages are obviously dependent largelyon India, because of its population size. During the 1980s, the prevalence fell overall for the region, from an
34

estimated 64% to 59% (Panel 3B). This change, only recently established notably from results in India, is ofgreat importance in assessing world nutrition. The rate of improvement in India, of around one−halfpercentage point per year, probably occurred also in Pakistan and Bangladesh.
The rates of improvement were, however, lower than the population growth rate and consequently the totalnumber of underweight preschool children increased, from 90 to 101 million children in the last ten years.South Asia has the highest prevalence of underweight young children in the world, while the absolute numberaccounts for over half of the entire world total.
Substantial differences exist in prevalences between countries, although all are high. In the 1980s, India,Bangladesh, and Nepal had underweight prevalences above 60%, with Pakistan and Sri Lanka around 40%.Within India, there is only limited variation on average between states, aside from Kerala. Using the NationalInstitution of Nutrition’s indicator (75% of NCHS standards) for 1988−90, Kerala had 35% underweight one tofive−year−olds; Tamil Nadu was next lowest at 50%, Gujarat being the highest at 59%. Improvements variedby state − for example, in Kerala and Maharasthra, the underweight prevalence dropped significantly morethan in Madhya Pradesh and Gujarat.
In Pakistan, the national survey by DHS in 1990/91 confirmed that the rates declined from the previousdecade. As discussed in the Vol. II, the correction of early survey data for age−misreporting was necessaryfor this conclusion. In Bangladesh, the proportion of underweight children was reduced to 65% in 1990 from alevel of 70% in 1985 and 84% in 1975 − but Bangladesh continues to have the highest rate in the world.
The infant mortality rate, estimated as 112 per 1,000 live births for the region in 1983, fell to 91 in 1990. Theseimprovements are estimated to have taken place in all countries in the region, except Afghanistan, where theIMR is not thought to have changed from the extremely high value of 182 per 1,000 live births in 1983, up tothe present.
The incidence of low birth weight is extremely high in the region, averaging around 30% of live births (Panel3J). There is some evidence that this has fallen slightly, on average, according to available information. Ingeneral, during the last five years, the rates were around 33% in India, and 25% in Pakistan and Sri Lanka.
GNP per caput for the region grew at a moderate pace of 3.2% on average in the 1980s, faster than the 1.7%in the previous decade. Economic growth was more pronounced in the first half of the 1980s, slowingsomewhat in the second half. South Asia was less affected by economic recession and structural adjustmentthan other regions. Poverty estimates point to some continuing improvements. In India, the proportion belowthe poverty line was estimated at 48% in 1977−78, falling to 37% in 1983−84, and further to 29% in 1987−89.National household surveys in Pakistan in 1979 and 1984−85 showed mat the proportion in poverty haddeclined from 34 to 28%.
Major gains in food production were achieved over the last two decades, although these were offset by highpopulation growth rates. The trend in the per capita food production was nonetheless upwards, particularlybetween 1987 and 1989, following the drought in western India. In Bangladesh, the food production hit a lowin 1988, but recovered in 1989−90 to the levels of the early 1980s. Agricultural production was accelerated bytechnological change, through the “green revolution” package of high yielding wheat and rice varieties.National cereal self−sufficiency was achieved in India, Pakistan, and Bangladesh as a result of such policies,although the gains differed regionally.
Thus, despite intermittent natural disasters such as drought in India in 1987, and intermittent flooding andcyclones that devastated many parts of Bangladesh in the late 1980s, the long−term trend in per capitacalorie availability in the region was slightly upwards − from about 2,070 kcals per caput per day in 1975 tonearly 2,250 in 1990 (Panel 3F). FAO calculated that for the region as a whole, the proportion of underfed inthe population declined from 30% in 1980 to 24% in 1990 (Panel 3G).
Panel 3 SOUTH ASIA
35

POPULATION
A. Million, log scale
CHILD GROWTH AND SURVIVAL
B. Underweight preschool children
36

C. Infant mortality rate
ECONOMICS
D. GNP per capita
E. Debt service ratio
FOOD
F. Dietary energy supply
37

G. Underfed population
HEALTH
H. Immunization coverage
I. Access to health services and potable water
J. Low birth weight
WOMEN’S STATUS AND CARING CAPACITY
38

K. School−age females in secondary school
L. Maternal mortality rate
M. Total fertility rate
Famine was largely prevented throughout the region, partly through better food stock management. Forexample, Pakistan’s food security management mechanism, using a demand/supply forecasting capability,enabled crises to be mitigated through timely actions in farm procurements, interannual price stabilization, andimport and distribution in the case of deficits. In India, the Public Food Distribution System − involving thedistribution of subsidized food grains via a network of fair−price food shops to the eligible poor holding rationcards − while varying by state in terms of coverage, has played a vital role in tackling food crises. Incomesupport was provided through poverty alleviation schemes (India), and food for work and public worksprogrammes in Bangladesh, among others. Together with price stabilization, such measures contributed toimproving household food security among the poor in the region.
Fiscal pressures have led to cuts in direct public food distribution systems. Sri Lanka cut back its food stampprogramme by default, by fixing the value of the food stamps while prices increased. In 1987, Pakistaneliminated the food radon shop system (principally of wheat flour) which had been in place for the past 40years. In early 1992, Bangladesh virtually dismantled its rural food rationing system, largely as a result of theconfirmation by studies of large leakages. In some cases, e.g., Pakistan, general consumer welfare may havebenefitted from such policy changes. However, in Sri Lanka, the food consumption of the poor probablysuffered.
39

Consumption surveys in India, Pakistan, and Bangladesh showed that over the last two decades, foodconsumption on average changed very little. Indeed, the National Nutrition Monitoring Bureau of Indiaconsidered that average consumption of calories may have fallen slightly in eight states between 1975−79and 1988−90. Per capita calorie consumption in Pakistan is also not thought to have changed much betweenthe 1977 and 1988 survey periods. These results from direct food consumption surveys are only slightlydifferent from conclusions from food balance sheet data and it probably is indeed the case that averageconsumption has largely been unchanged. However, there is evidence that the food consumption of the poor,for example, the landless, may have increased − results from India show this. This would be consistent withthe steady, if slow, reduction in underweight in preschool children, of around half a percentage point per year.
Health conditions in much of the region remain severe, for example, the incidence of diarrhoea is particularlyhigh, and there is little evidence for much change over the last two decades. Government expenditures onhealth care as a percentage of the national budget in Pakistan and India remain very low − 1.0% and 2.1% in1986, respectively, compared to the average of 5.3% for the developing world. The lower health budgets inthe two countries is evident even after accounting for the state and provincial health budgets in thecalculations. There is, however, evidence of improvement in efficiency in health delivery systems, in terms ofincreased coverage of local health services in India and Pakistan, although not in Bangladesh and Nepal. InSri Lanka, the proportion of the population having access to health care within one hour’s travel remains highat 90%. Access to health services, and to safe water, are estimated by WHO to have improved during the1980s, as shown in Panel 31.
Utilization of health services is a separate issue which needs to be addressed in the provision of health care.In Pakistan, a study in rural communities observed that while 90% of households reported access togovernment clinics, only 25% chose to use them, due to the irregular supply of medicines. The public healthsystems in these countries are also disproportionately urban − whereas the majority of people live in the ruralareas. In Pakistan, for instance, almost 90% of all doctors serve the 30% of the population living in urbanareas.
Large−scale direct actions in primary health care (including immunization (Panel 3H)) have been emphasizedin most countries, along with nutrition and health interventions such as the Integrated Child DevelopmentServices (ICDS) and the Tamil Nadu Integrated Nutrition Project (TINP) in India, and the Triposha and schoolmeal programmes in Sri Lanka, etc.
Sanitation is still a major problem in South Asia, with only 28% households in 1988−91 having access toadequate sanitation facilities. On the other hand, WHO reported that 70% households had access to a cleanwater supply in 1988−91, up significantly from 52% in 1983−85 (Panel 31).
Long−term nutrition improvements in the region are strongly associated with female educational levels.Research in Pakistan has shown that the likelihood of having an underweight child in the household where themother has no education is three times that of the household where the mother has primary education; andthis remains the case when me effect of income is removed analytically. However, only 11% of adult femalesin Pakistan are literate, compared with 37% for males (in 1988), which no doubt contributes to growth failurein children. The trend in the female enrollment ratio at secondary level for the whole region is upwards (24% in1975 to 35% in 1990) but the improvement is slow.
Recent statistics from WHO indicate that maternal mortality rates in the region have fallen from 650 per100,000 live births in 1983 to 570 in 1988. Increasing coverage of antenatal care as well as delivery by trainedhealth personnel is likely to account for some of these improvements. Antenatal care by trained healthpersonnel increased from 45% in 1983 to 70% in 1991 in India, 26% to 70% in Pakistan, but was still low inNepal at 17%. The success in training traditional birth attendants has improved the proportion of deliveries bytrained health workers from 60% to 70% in Pakistan, and from 32% to 60% in India. But only 7% of births inBangladesh were delivered by trained health personnel in 1991.
The prospects for future nutrition in South Asia are mixed. On the one hand, food availability remainsrelatively low and has not shown much improvement in the last several years. Moreover, there are no reallyclear prospects for increasing food availability comparable to the green revolution − yield limits are beginningto be reached, as is me availability of land suitable for irrigation. The proportion of landless people is high andincreasing. It is likely that the important prospects for future improvement lie with industrialization. Underlyingthis is a continuing race between population growth and economic growth. Fertility is decreasing, but not yetnearly enough to reduce population growth as much as is needed,
40

Thus a key question, outside the scope of this report, remains how economic development can beaccelerated. Nonetheless, there are a number of programmes in place mat protect nutrition mat seemwell−founded. These include poverty alleviation and public works programmes, as well as food supply andprice stabilization measures. Direct nutrition and health programmes, such as the Integrated ChildDevelopment Services in India, are most probably benefitting large numbers of women and children. Moreeffective targeting of such programmes is important, and potentially could be achieved. One particularconstraint which could be more energetically addressed concerns discrimination against women, commonparticularly in the northern part of the subcontinent.
Given the very high numbers of underweight children, and widespread inadequate consumption among ahuge population, what happens to nutrition in Asia profoundly affects the overall world nutrition situation.Although the trend is in the right direction, it is far too slow to see a resolution of the problem in theforeseeable future. Both intensification of existing programmes, and new investments and ideas, are neededto accelerate improvement.
South East Asia
(Panel 4)
Among the regions of the world, South East Asia achieved the fastest rate of economic expansion in the lasttwo decades, with annual growth rates in GDP per caput averaging 6 to 8%. GNP per capita for the ninecountries included in this region more than doubled from around US$350 in 1975 to US$800 in 1990. Thegrowth rates in farm and industrial production outstripped population expansion in the region as a whole, andthis translated into improvements in real incomes and reduction in poverty in most of the countries.
Overall nutrition in the region improved at a rapid pace. The prevalence of underweight children fell rathersteadily, at close to one percentage point per year, from 1975 to 1990 (Panel 4B) (Table 1.2). This rate ofdecrease was sufficient to bring numbers of underweight down, from 24 million in 1975, to 22 million in 1985,and to 20 million in 1990.
Rates of improvement were not the same in all countries, but direct estimates from national surveys confirmedimprovements in Thailand, Myanmar, Malaysia, Vietnam, and Indonesia (Table 1.3). The largestimprovements in the 1985−90 period were noted in Thailand (20% to 13%), which benefitted from a surgingeconomic growth (above 10% annually) in the second half of the 1980s, coupled with a highly successfuldirect nutrition and health programme begun at the start of the decade. Consistent improvements were alsoseen in Indonesia, the largest country in the region, but in the Philippines, the proportion of underweightchildren stood at around 33% in 1990, slightly lower than 1986 at the height of the economic and politicalcrisis. Surveys in Myanmar showed that for the under−three−year−old children, prevalence declined from 38%in 1987 to 32% in 1990.
Available data (Panel 4J) point to a marked drop in the percentage of low birth weight babies in the region asa whole, from 18% in 1983−85 to 15% in 1988−91. Marked declines were reported by WHO/UNICEF in Laos,Vietnam, Indonesia, and Thailand.
Nutritional improvements were no doubt influenced by the overall strong performance of the economies in theregion. Oil exporting countries such as Indonesia and Malaysia enjoyed rapid growth rates in the 1970sfollowed by weaker but still high growth rates in the 1980s when the price of oil began to fall. Growthperformance in the oil importing countries − such as Thailand and Vietnam − was generally robust particularlyin the second half of the 1980s, but faced the adverse effects of the Gulf crisis which increased the import billfor oil. Countries with large numbers of migrant workers abroad, such as the Philippines, suffered from largedeclines in remittances − a significant portion of the dollar earnings. Added to these were pressures of debtservicing which were rapidly increasing in the mid−1980s, up to more than 40% average for the region by1986 (see Panel 4E) but men falling towards the end of the decade. In 1986, debt service ratios in Myanmarreached 80%, 39% in Indonesia, 35% in the Philippines, and 30% in Thailand.
Structural adjustments were necessary in Indonesia (1983), the Philippines (1987), Malaysia (1986), andThailand (1986). Most countries responded quite well to the shocks, although at varying degrees. Growth inthe economies resumed and debt service payments were reduced in 1990 to 17% in Thailand, 21% in thePhilippines, and 30% in Indonesia.
41

Many of the countries in the region made substantial progress in reducing poverty − in Indonesia, for example,the estimated level of absolute poverty declined from 33% in 1978 to around 17% by 1987. The far reachingeconomic and institutional reforms in Vietnam beginning in late 1987, where the economic system wascompletely restructured, provided impetus to the strong agricultural performance − increasing agriculturalGDP at a rate of 4.5% in 1989. In Malaysia, poverty declined from 27% in 1980 to 15% in 1987; in thePhilippines, a recovery from deteriorating poverty conditions was seen from studies comparing conditionsbetween 1985 and 1988.
Food production gained momentum in the last five years of the 1980s, growing at an annual pace of 4.5% in1988−89 and 3.1% in 1989−90 crop years as regional averages; generally continuing from the “greenrevolution” which started in the 1970s with the wide dissemination of IRRI high yielding rice varieties. Mostcountries achieved food self−sufficiency in the 1980s. Indonesia, one of the largest importers of rice in thepost−war period, achieved self−sufficiency in 1984. Thailand, Vietnam, Myanmar, and Indonesia accountedfor 43% of the global exports of rice in 1991. Thailand exported 4 million metric tons of milled rice (out of theworld total exports of 12.2 million metric tons). Vietnam’s liberalization in agriculture in late 1987 resulted inrecord harvests in 1988−90, making the country the third largest exporter of rice in the world − a bigachievement for the once net importer, just a decade earlier.
Food production in the region is still vulnerable − from population growth, natural calamities such as tropicalstorms which are common in the region, as well as drought. Yields in rice have remained largely unchanged inthe latter 1980s following the prior growth rate gains fueled by the high yielding varieties; and the expansion incultivated land has now about covered most of the more fertile areas.
The availability of calories for the region has increased steadily, generally in line with food production (seePanel 4F). The per capita calorie supply increased from 2,400 to 2,500 from 1985 to 1990. In 1975, this figurewas 2,150 per capita. These trends reflect not only growth in supply, but in demand, mainly throughincreasing incomes and stable prices. As a result, FAO calculated that the number of people consideredunderfed, or not eating adequate food to maintain light activity, fell from 101 million in 1970 to 74 million in1990 (Panel 4G).
Improvements in overall nutrition could be traced partly to deliberate actions in health and nutritionprogrammes in the 1980s. Primary health care was emphasized in virtually all countries. The success of menationwide nutrition and health programmes were seen clearly in Thailand and Indonesia. Here, awarenessand public opinion moved policy towards nutrition goals, making these explicit in national development plans;and community intervention programmes had a big impact on malnutrition.
The proportion of the population having treatment for common diseases available within one hour’s travel(according to WHO, see Panel 4I) increased from 57% to 84% between 1983 and 1991 for the region as awhole. Over mat period, the population covered by safe water supply rose from 44% to 53%. The coverage inMalaysia, the Philippines, and Thailand was over 70%. The proportion of households in the region withadequate sanitary facilities is estimated to have increased from 41% to 51% between 1983 and 1991.
Infant mortality rates declined by nearly half − from 92 to 55 per 1,000 live births from the mid−1970s to 1990(Panel 4C). Some of me countries have achieved remarkable improvements − Malaysia and South Korea, forexample, had IMRs in the low 20s per 1,000 at the end of the 1990s (equivalent to the levels in the UnitedStates and France in 1965). This meant that in the 15−year period, the absolute number of children dyingannually before their first birthday declined in the region from about 946,000 to 635,000. Many factors accountfor such improvements, one of which is the likely synergy of health status with the positive nutritional trend. Agood part is attributed to the increase in direct actions by governments in local health services.
Compared to other developing regions of the world, South East Asian women enjoy a better overall position,in general. Female literacy has been rising − females enrolled at the secondary level rose from 29% to 46% in1990 (71% in the Philippines, equal to the levels for males). In general, women are finding fewer barriers totheir participation in the labour force, in education, and in public life.
Panel 4 SOUTHEAST ASIA
42

POPULATION
A. Million, log scale
CHILD GROWTH AND SURVIVAL
B. Underweight preschool children
43

C. Infant mortality rate
ECONOMICS
D. GNP per capita
E. Debt service ratio
FOOD
F. Dietary energy supply
44

G. Underfed population
HEALTH
H. Immunization coverage
I. Access to health services and potable water
J. Low birth weight
WOMEN’S STATUS AND CARING CAPACITY
45

K. School−age females in secondary school
L. Maternal mortality rate
M. Total fertility rate
Maternal mortality rates have been estimated at 420 per 100,000 live births in 1983, and WHO estimated thatthis declined to 340 in 1988 for the region as a whole (Panel 4L). Direct estimates show improvements inmaternal mortality in the Philippines and Malaysia, and declining but still at a high level in Indonesia and Laos.Both the proportions of women receiving antenatal care (e.g., from 66% in 1985 to 84% in 1991 in Malaysia,26% to 47% in Indonesia) improved, as did the proportion who delivered babies attended by trained personnel(e.g., from 33% to 71% in Thailand in the same period).
The prospects for nutrition for the rest of the decade for the region as a whole are clearly positive. Thetransition into market economies in Vietnam, Laos, and Kampuchea which started in late 1980s is gainingmomentum. Reforms in the agriculture sector in these countries are now reflected in increasing agricultureoutputs. The Philippines and Indonesia are gearing up to become export−led economies following thesuccess of Thailand and Malaysia in the 1980s. Increasing pressures of population and rising incomes willgenerally fuel increasing demand for food. If the trends in the last decade continue, the proportion ofunderweight (currently at 31%) and underfed populations in the region is likely to continue to decline to theyear 2000.
Rapid economic growth together with vigorous community−level health and nutrition programmes havebrought malnutrition down rapidly in countries such as Thailand and Indonesia. Where there is less growth,there has been less resources and organization for programmes, and less progress, such as in the
46

Philippines. If such programmes can be intensified, the rate of improvement may speed up. In favour of this isthe health service infrastructure and high levels of education in most countries in the region. Whetherimprovement can be accelerated even further, for example as needed to meet the goals of the World Summitfor Children, is not clear − but sustaining and intensifying existing programmes would clearly play a role.Threats to the generally positive prospects would include, obviously, economic slowdown, possibly related tohitting up against the technological limits of agricultural production, and increasing pressure from populationgrowth. But in general, if growth and stability can be maintained, future prospects for nutrition in the region aregood.
China
(Panel 5)
Survey data of anthropometry in young children, covering much of the country, were collected in 1987, givinga first assessment reasonably comparable to other countries. The results gave an estimate of around 21% ofchildren under six as underweight. As previous anthropometric surveys were not national in scope, it is notpossible to compare this result directly with earlier surveys. However, results from surveys over many years inBeijing (as given in the SCN’s Update Report) showed rapid improvement in the 1970s, leveling off during the1980s. Estimates have been made of likely trends from 1975, as shown in Panel 5B, using methods similar tothose for other countries based on data such as calorie availability, education, etc. From these, the proportionof underweight children is estimated to have fallen from around 26% in 1975 to the present level of 21%; thecalculations indicate a more rapid fall in 1975−85, and, in fact, a slight increase in the prevalence in the late1980s. These results imply that total numbers underweight were roughly stable at 21 million between 1975and 1985, increasing slightly to around 24 million by 1990.
The prevalence of underweight children varied greatly by location − for example, in data from 1987, between6% and 27% in urban areas, and 12% to 47% in rural areas. The provinces of Zheijang and Shandongseemed to have the lowest prevalence rates, while Guandong Province had the highest. In general, theproblems are greater in the northern and inland provinces. The southern and coastal provinces, particularly inthe Shanghai and Shandong areas, have lower prevalence rates, associated with higher income levels.
Nonetheless, the overall levels of underweight are remarkably low, considering that China remains one of thepoorest countries. The per caput GNP is fairly similar to South Asia (compare Panels 3F and 5F), but Chinahas about one−third of South Asia’s prevalence of underweight children.
The National Survey on Child Growth indicated that China’s percentage of low birth weight babies, which was9% in 1987, is also among the lowest in the developing world.
Infant mortality rates are low in China, in line with nutritional indicators. Moreover, they have continued to fallin recent years, from around 40 per 1,000 live births in 1980 to 30 in 1989. These values are indicative of thesuccessful deliberate actions in the social sector in China, and no doubt benefit from the adequacy of birthweights. Countries of similar GNP per capita as China in 1990 (around US$370), such as Pakistan, Kenya,Haiti, Ghana, and India, have infant mortality rates ranging from 67 to 103 per 1,000 live births. China’s IMR isequivalent to that found in Argentina and Venezuela − countries that have incomes which are six times that ofChina. A reasonable comparison may be with the state of Kerala in India, which has similar low income butexcellent IMR figures, and a much lower child underweight prevalence than other Indian states.
Panel 5 CHINA
47

POPULATION
A. Million, log scale
CHILD GROWTH AND SURVIVAL
B. Underweight preschool children
48

C. Infant mortality rate
ECONOMICS
D. GNP per capita
E. Debt service ratio
FOOD
F. Dietary energy supply
49

G. Underfed population
HEALTH
H. Immunization coverage
I. Access to health services and potable water
J. Low birth weight
WOMEN’S STATUS AND CARING CAPACITY
50

K. School−age females in secondary school
L. Maternal mortality rate
M. Total fertility rate
The overall trend in nutrition in China in the last two decades is linked positively to overall improvements in theeconomy, which grew by 5.3% in real per capita terms between 1975−77, and with accelerated growthbetween 1978−84. Administrative and fiscal decentralization, as well as external trade and exchange ratereforms, had a positive impact on economic growth. After such dramatic growth, the economy slowed downconsiderably, growing 2.47% annually between 1985−89. The industrial sector’s output growth rate fell to8.3% in 1989 as compared to 20.8% in 1988.
The slowing of economic growth, especially in 1988−89, resulted from a conscious attempt by the governmentto remove excess liquidity in the economy and thus lower the inflation rate, which was averaging 20% in 1988− at one point reaching 30% in urban areas. A combination of restrictive monetary policies, increased interestrates to encourage savings as well as reduced public sector investments, were successful in reducing urbaninflation to 3.3% in 1990.
With the significant economic expansion, per capita household income rose considerably during the 1980s.The average Chinese household saw an increase in its nominal income of 240% during the 1978−88 period;in real terms, rural incomes increased by 116%, and urban incomes by 87%. Poverty studies also indicate thatthe proportion of the population considered to be below the poverty line declined to 13% in rural households in1988 compared to 17% in 1981.
51

Food production in the last half of the 1980s increased, but not as fast as during the 1978−84 boom period. Inthe late 1970s, the government initiated a series of reforms, including increasing fertilizer accessibility, andraising the quota price (at which farmers sold output to the government) by 20%. Households rather thancommunes once again became the central unit of production and, under a new system of contractresponsibility, households had to meet certain production quotas before being able to sell any surplus in localmarkets under market−determined prices. These agricultural reforms were highly successful and the grossvalue of agricultural output increased as much in 1978−84, as in the 21 years prior to this. Increase inproduction in the 1980s was built on earlier investment in irrigation, soil quality maintenance through fertilizerapplication, and the use of high−yielding varieties of wheat, rice and maize.
Overall per capita calorie availability is estimated by FAO at 2,700 in 1990, up from 2,600 in 1985, and 2,100in 1975 (see Panel 5F). The proportion of the population estimated to be consuming inadequate energyassociated with these kcal availabilities roughly halved between 1975 and 1990, from about 40% to 20%(Panel 5G).
The government spends a considerable amount of money on food subsidies for the urban population througha rationing system which has been in operation since 1953. Under this system, most households receiveration coupons for grain and certain other basic foodstuffs, which are heavily subsidized. In rural areas, thereis no formal ration system, but the government does intervene in transferring grain from surplus to deficitareas.
China has given high priority to programmes in health and sanitation. Compared to other countries with similarlevels of income, China has implemented far more direct actions to provide social services to its population.Access rates were achieved of 71% for safe water supply and 96% for sanitary facilities in the home orimmediate vicinity in 1991. Likewise, immunization campaigns have been very successfully implemented.Reports by WHO indicate that the proportion of infants immunized against measles increased from 75% in1985 to above 90% in 1991, while one−third of pregnant women in 1985 were immunized against tetanus. In1991, 74% of infants received BCG shots, 98% were immunized against polio, and 97% with DPT.
Priority for health care in China has strong historical roots. In the Mao period, China implemented a massivehealth care delivery system linked to the brigades in the rural areas. The ratio of Western−style doctors per100,000 population is two−and−a−half times that in India, while the number of village−level health workers is4.5 times. Financing for health care comes from three main sources: private outlays (32%), labour insurance(31%), and state budget expenditures (30%). In 1981, about 70% of the population had complete healthinsurance. There are, however, significant urban/rural differences: urban expenditures on health are aboutUS$16 per person, about three times the amount spent for the rural areas. State subsidies for health in urbanareas are almost ten times those of the rural areas − about US$13 per capita annually compared to US$1.50per capita.
Indicators of women’s situation in China show a moderately visible role in the economic life of the country.Female labour force participation has been very high (42% of all women in 1975) and has remained at thatlevel for most of me 1980s. This high rate of economic participation of women has put a stress on child care,and this has become a major issue, especially in the urban areas where women have generally worked infactories. Female enrollment in primary education has been increasing. Largely as a result of the effects ofincreasing labour participation and of the family planning programme which aimed at one child per family, thecountry has reduced its population growth to an average of 1.5% from the early 1970s to 1990, and totalfertility to just over two births per woman on average, see Panel 5M.
Diet−related chronic diseases, dietary patterns, and life styles, especially for more affluent segments of thesociety, are an emerging concern. Coronary heart diseases, stroke, and cancer are rising as causes ofmortality, proportions becoming similar to those of the United States. In 1986, reported deaths fromcerebrovascular diseases were four times what they were in 1957, and from heart disease, three times.
China has thus been through a major transition, from large−scale food insecurity, including periods of famine,to widespread dietary adequacy, with even the risk of overconsumption among some people. This wasachieved largely as a result of the government’s high − priority to ensuring adequate caloric intakes throughrapid production increases of staple crops. The overall trend in food supply, coupled with the high priority thegovernment attaches to direct social actions in sanitation, immunization, and health care, have contributed agood deal to the achievements in nutrition.
China has remarkably good nutritional status and related indicators such as infant mortality rate, consideringthe low GNP per caput. Food availability is relatively better than might be expected from GNP, as are access
52

to health services and literacy, all of which no doubt contribute to the favourable nutritional situation.Improvements in underweight children ceased in the latter 1980s, in line with slowdown in growth of GNP andfood consumption, and restoring economic growth would clearly be important for continued improvement innutrition.
Middle America and Caribbean
(Panel 6)
In the last Five years, nutritional indicators in the region were rather static, after improvements from themid−1970s to the mid−1980s. In the decade prior to 1985, improvements in prevalences of underweightpreschool children from 19% to 15% were enough to negate the growth in zero to four−year−old population;the number of underweight children fell from 3.4 to 2.8 million. Then, between 1985 and 1990, the absolutenumber of underweight children rose slightly (from 2.8 million to 3.0 million) based on prevalence rates of15.2% and 15.4% respectively. Direct survey estimates showed improvements in Costa Rica and Jamaica.
Between 1983−85 and 1988−91, the incidence of low birth weight declined from 15% to 12% according toWHO/UNICEF figures, partly as a result of the increasing coverage of antenatal care. As examples, theproportion of pregnant women receiving antenatal care in Costa Rica increased from 1984 to 1989 from 54%to 91%, 26% to 69% in El Salvador, and 66% to 83% in Panama, although, in Haiti, this indicator fell.
The average GNP per capita of the region fell to a 1990 level of US$1,700 per capita from a peak ofUS$2,300 in 1982. In the earlier decade, dramatic increases in economic output were noted, very strongly inMexico and many other Central American countries. The sharp swings in income over the 15−year periodwere brought about by the immediate effects of structural adjustments in Mexico, in particular. Also, generallyadverse developments in the world economy in the early 1980s had an impact via reductions in externaldemand, terms of trade, and the supply of external finance − all crucial elements in the rapid economic growthof the 1970s. Debt in practically all countries in the region rose dramatically − from around US$240 per capitain 1975 to US$1,000 in 1990 − more than one−half of the per capita incomes of the region. Mexico’s total debtrose from US$15 billion in 1975 to USS85 billion in 1990 − one of the largest in the world. The debt serviceratios were very high (see Panel 6E), reaching 50% in the late 1970s, and still above 30% by 1990. Thiscurtailed available capital for domestic investments, and stalled economic growth in the last few years.
The impact of the structural adjustments and external debt in the 1983−87 period negatively affected foodavailability and consumption. Calorie availability per capita, which increased before the adjustment period,from a 2,600 per capita level to around 2,900 in 1982/83, declined to a level of 2,800 by 1987 (Panel 6F).Food consumption declined in the 1984 to 1988 period, but remained unchanged for the rest of the decade.Overall, the proportion of the population with inadequate access to food was estimated by FAO to beunchanged between 1980 to 1990, at around 14−15%. The slide was somewhat stemmed by the end of thedecade, particularly in Mexico, which registered a significant rebound in per caput food production in 1990.
Hyperinflation in the mid−to−late 1980s badly hit standards of living − for example, in Mexico, the consumerprice index in 1990 was 120 times that of 1980. Food prices were equally affected, but at least not worse thangeneral inflation − the FPI/CPI ratio actually fell during the 1980s in Mexico (see Volume II).
Measures to protect the well−being of the poor (particularly children and pregnant women) from the severeeconomic shocks differed among countries in the region. In Mexico, general food subsidies were replacedwith targeted interventions such as the Tortibonos (tortilla) programme introduced in 1986, which was targetedto low−income households based on minimum wages, and the Liconsa subsidized milk programme in urbanneighborhoods. In Jamaica, food stamps were issued to draw cornmeal, rice, and dry milk. Direct maternaland child health and food programmes were also in place in Costa Rica, Honduras, Guatemala, El Salvador,and Panama. However, in Haiti and the Dominican Republic, direct MCH and food programmes were verysmall in relation to the magnitude of the nutrition problems.
Coverage of such direct programmes was quite high. In Mexico and Jamaica, feeding programmes covered44% and 57% of all preschoolers, respectively − a far higher proportion than the estimated preschoolunderweight prevalences of 14% and 13% in 1980, respectively. Coverage in the school−aged population iseven higher − averaging 68% in Honduras, 82% in Guatemala, and 96% in Costa Rica in the mid−1980s.Other countries, by contrast, have low levels of direct feeding programme coverage of preschoolers, e.g., 2%in Haiti, 14% in El Salvador, and 10% in the Dominican Republic.
53

Government expenditures on health fell in absolute terms in the 1980s, generally in line with the totalgovernment budget. The most severe decline was in Mexico, where the 1988 total budget for health careinstitutions was only 47% of the level in 1981. These cutbacks generated a movement towards making healthcare more cost−effective. WHO estimated that the coverage of people with health care increased from 51% to91% in Mexico between 1982 and 1987, and 52% to 86% in the region as a whole for the period 1983−85 to1988−91. Specific programmes such as immunization of infants against measles increased on average from34% in 1983 to 77% in 1991 (Panel 6C), and had nearly universal coverage in Cuba, the Dominican Republic,Panama, and Costa Rica by 1991. Immunization of pregnant mothers against tetanus covered 38% in 1991,up from only 14% in 1983. These programmes partly explain the general decline in the regional IMR, which isestimated to have fallen to a 1990 level of 47 per 1,000 live births, down from 68 in 1975.
There were other positive developments in the health sector. The high coverage of deliveries by trainedpersonnel in the region contributed to the relatively lower levels of maternal mortality, estimated at around 237per 100,000 live births in 1983 (220 in Caribbean and 240 in Central America) (Panel 6L). In the latestestimates by WHO, the overall regional maternal mortality fell to around 180 per 1,000 by 1988, with dramaticdeclines, particularly in Mexico. These are levels which are about one−half those seen in Asia and onlyone−third of those in Sub−Saharan Africa.
Generally, initiation and duration of breastfeeding probably improved during the 1980s − this wasdemonstrated in Mexico.
Another factor associated with the relatively better nutrition of children in the region is the high literacy levelsof women − above 90% in Costa Rica and Mexico, and about 75% in the Dominican Republic, Guatemala,and El Salvador. The average female enrollment in the secondary schools was 49% in 1990, up from 34% in1975. The female literacy rates are very high. One striking characteristic of education in the region is thatthere are virtually no differences between male and female literacy rates in most of the countries.
Recent statistics indicate that the proportion of female−headed households is rising in some parts of theregion. In Cuba, statistics available for the mid−1980s indicate that 28% of households are female−headed,44% in Barbados, 25% in Trinidad and Tobago, 18% in Costa Rica, and 15% in Guatemala. In the DominicanRepublic, it was shown from recent studies that children in female−headed households tend to be more at riskof malnutrition compared to male−headed households; but the opposite has been indicated in Jamaica.
Improvements in nutrition slowed down in the latter 1980s, in line with economic problems. Future prospectsdepend heavily on restarting economic growth. At the same time, the extensive outreach of health care, andrelatively good access to food, as well as falling fertility rates, are factors in favour of renewed improvementsin nutritional status. On the other hand, levels of malnutrition as measured by underweight children arealready relatively low, and bringing these down to the levels of developed countries may require moreeffective targeting of existing programmes, and special efforts of outreach to the remote and the poor.
Panel 6 MIDDLE AMERICA AND CARIBBEAN
POPULATION
54

A. Million, log scale
CHILD GROWTH AND SURVIVAL
B. Underweight preschool children
C. Infant mortality rate
ECONOMICS
D. GNP per capita
55

E. Debt service ratio
FOOD
F. Dietary energy supply
G. Underfed population
HEALTH
H. Immunization coverage
56

I. Access to health services and potable water
J. Low birth weight
WOMEN’S STATUS AND CARING CAPACITY
K. School−age females in secondary school
L. Maternal mortality rate
57

M. Total fertility rate
South America
(Panel 7)
The underlying trend in nutrition in South America was for definite improvement in me late 1970s, slowingsubstantially in the 1980s, or even becoming static in some countries. Direct assessments from nationalsurveys in Brazil, 1975 and 1989, were of considerable importance in identifying long−term improving trendsin child growth in the region. The likelihood is that much of the improvement was in the first part of this period,and in fact recent economic problems may threaten to reverse some of the gains (Panel 7B). Fallingunderweight prevalences were directly observed in Bolivia, Colombia, and Venezuela, and in Chile there wasa steady reduction in IMRs; these generally occurred in the face of economic hardship, and are in line with theBrazil results. Thus despite severe economic shocks in the 1980s, the region showed remarkable resilience interms of nutrition. Part of the reason may be that underlying trends in literacy, in health infrastructure, and infalling fertility rates (Panel 7M) protected nutrition. Certainly, the nutrition results are in line with observationsof infant mortality rates (Panel 7C).
The level of underweight prevalence is the lowest of the developing world, around 8%. Noting that 2.5%prevalence is expected in developed countries and in the standards, there is not far to go in the region, onaverage, before child growth failure as a widespread problem is a thing of the past. On the other hand, thereare large areas and populations, such as North East Brazil, which remain highly vulnerable, and events in thenext several years will determine what happens. Absolute numbers of underweight children remainedpractically the same at around three million during the 1980s.
Overall, regional rates of low birth weight were estimated at 12% in 1983 and declined to 10% in 1990.Estimates by WHO/UNICEF indicate some improvements in Bolivia between 1983−85 to 1988−91, andremain unchanged in Chile, Paraguay, and Venezuela.
Infant mortality rates in the region in 1990 were estimated at 55 per 1,000 live births, compared to 61 in 1983and 75 in 1975. Although the levels attained in Chile (20 per 1,000 in 1989) parallel those in many developedcountries, other countries in the region have very much higher rates. Bolivia, for example, is reported at 110per 1,000 in 1989, the highest in the South American region. Peru’s IMR is also high at 88 per 1,000.
The economic shocks in the early 1980s, brought about by the debt crisis and international recession, deeplyaffected the economic well−being of many South American countries. Brazil, Bolivia, Chile, and Colombiafaced crises before 1985, followed by Argentina, Ecuador, and Uruguay. Brazil, for example, had a falling realper caput GDP between 1980 and 1984, which recovered to the level of 1980 by 1988; hyperinflation began in1987, although food prices, if anything, fell as a proportion of the consumer price index. Structural adjustmentprogrammes were introduced in many countries, aimed at reducing imports and government expenditures, inorder to stabilize economic conditions and restructure the economies to higher growth paths. Most countrieshad extremely high debt service ratios − the regional average rising as high as 65% in 1982, andsubsequently falling. This peak of 65% debt service ratio was substantially higher than any other region, thenearest being Middle America in the late 1970s, reaching nearly 55%.
With national incomes fluctuating throughout the 1980s, and hardly increasing on average, the population inpoverty also varied. Studies by me World Bank indicate that the level of incidence of poverty in Brazil rosefrom 17% in 1980 to 30% in 1983 at the start of the structural adjustments, then fell later to around 24% in
58

1987. Other studies (e.g., ECLAC, 1990), using a different cutoff, indicated, however, that there was virtuallyno change comparing 1979 and 1987 in Brazil, nor in Colombia, but rising poverty in Peru, Venezuela, andUruguay in the same period. Rural areas appear to have been disproportionately affected by the rise inpoverty in the latter countries.
FAO’s recent estimates indicate mat the proportion of underfed populations increased slightly in the 1980s −averaging 12% to 13%. Overall, regional food supply per capita recovered from a severe slump in 1985. Thecalorie availability estimated by FAO indicates a regional level of calorie per capita of 2,670 in 1990, upslightly from 2,600 calories in 1985. These averages hide considerable variations of consumption patternsamong and within countries. While Brazil, Ecuador, and Colombia had higher calorie availability in 1989compared to 1980, Chile, Paraguay, and Venezuela suffered slight declines. For the first time in 20 years,Bolivia’s calorie availability per capita fell below 2,000 per day in 1989.
The structural adjustments also had the effect of contracting total social spending of the public sector,although most recovered. Central government expenditures on health (as a percentage of total expenditures)were protected in some countries, while in others, the levels were restored following cutbacks in the earlyyears of the crisis. PAHO (1990) reported that public health services were not curtailed during me crisis, andscarce resources did not generally translate into fewer consultations or admissions.
Panel 7 SOUTH AMERICA
POPULATION
A. Million, log scale
CHILD GROWTH AND SURVIVAL
59

B. Underweight preschool children
C. Infant mortality rate
ECONOMICS
D. GNP per capita
E. Debt service ratio
FOOD
60

F. Dietary energy supply
G. Underfed population
HEALTH
H. Immunization coverage
I. Access to health services and potable water
61

J. Low birth weight
WOMEN’S STATUS AND CARING CAPACITY
K. School−age females in secondary school
L. Maternal mortality rate
M. Total fertility rate
For many countries, it was reported that governments faced with serious cutbacks in available resources wereable to increase the efficiency of public services, such as those of health and nutrition. In Peru, for example,84% of preschool children and 77% of primary school children were covered by some form of food aid or
62

supplementary feeding programmes in mid−1980s, while only 13% of preschool children were underweight.Overall regional coverage by supplementary feeding for preschoolers was about 50%, and 64% for primaryschool children, in the 1980s. This implies a large scope existed for re−targeting in the face of fiscalconstraints without necessarily jeopardizing the outreach to the 8% of underweight preschoolers in the regionas a whole.
Health care coverage also was reported to have been relatively protected during the economic difficulties ofthe 1980s. From a survey of several countries in the region, WHO reported that most did not curtail coveragebetween 1984 and 1990. Levels of coverage remained high, around 95% in Chile, 88% in Colombia, and 80%in Ecuador. Immunization against measles actually increased overall for the region (Panel 7H), from 54% in1983 to 77% in 1991 − reaching near universal coverage levels for Argentina and Chile and above 80% forColombia and Uruguay, but lower in Bolivia, Peru, and Ecuador. The number of pregnant women immunizedagainst tetanus increased by nearly threefold between 1983 and 1991. Immunization against polio, BCG, andDPT improved in coverage.
Maternal mortality rates declined from 290 per 100,000 live births in 1983 to 220 in 1988, according to recentdata from WHO. This trend can be partly explained by the increase in the proportion of women receivingantenatal care by trained personnel (for example 49% in 1983 compared to 71% in 1991 in Ecuador, 46% to60% in Peru) and the proportion of women receiving delivery care by trained personnel, which rose from 69%to 82% in Paraguay, and was maintained at 93% level in Chile, and 73% in Brazil, in the same period. Fertilityrates continued to fall during the 1980s, from around four births per women to just over three. This hadmultiple benefits for women themselves, and, as dependency ratios declined, for households, with thepossibility of channelling more resources to each child.
Breastfeeding initiation and duration tended to increase between the 1970s and the 1980s (comparing WFSand DHS). Moreover, the positive benefit of education was again seen, the improving trends in breastfeedingbeing greater in the better educated groups. For example, in Peru, the median duration of breastfeedingremained at around 11 months in urban areas and 19 months in rural areas, but this measure increased from12 to 16 months in those mothers with four to six years education, and from six to ten months in those withseven plus years. Similar patterns were seen elsewhere.
Female literacy in the region is among the highest in the developing world (above 75%), and the trendsappear to be improving, given the increasing percent of female enrollment in the secondary schools, e.g., inChile 74% in 1990 compared to 55% in 1980, in Uruguay from 60% to 74% in the same period. There is aslight difference in literacy between males and females, but not as high as most other developing regions inthe world.
If the trend of improvement in the 1970s were restarted in the 1990s, the problem of underweight childrenwould be solved before the end of the century. Already, countries such as Chile, Venezuela, and Paraguayhave virtually contained the problem. The prospects are likely to be determined by the strength of the recoveryfrom the debt crisis. Perhaps, too, the benefit from the decline in fertility has bottomed out already.Adjustments “with a human face” comprise much of the restructuring that continues in the region. The WB andIMF have encouraged governments to put aside a substantial portion of budgets from other sectors (forexample, proceeds from the privatization schemes) into “social funds” to be used to protect vulnerable groups.Brazil, Bolivia, and Venezuela are examples of such countries. For the most part, the response ofgovernments in the region to economic crisis were responsible for the protection of nutrition.
This region would then become the first among developing countries to have effectively dealt with its problemsof undernutrition. Much depends upon continued stability and economic growth. Underlying conditions aregood, in terms of health infrastructure, falling fertility rates, and high immunization rates, as well as a relativelygood food availability. On the other hand, many countries in South America were badly affected by economicrecession in the 1980s, and it is important that the recovery of the late 1980s continues. Better targeting ofavailable resources will be important. The concern is that there are large areas, such as North East Brazil andthe Andean altiplano, that are relatively much poorer and less accessible than the rest of the region. Thesemay lag behind the development elsewhere, with continuing nutritional problems.
Chapter 3: Micronutrients
Deficiencies in the intake or absorption of vitamin A, iron, and iodine have serious consequences for healthand mental and physical function. The clinical manifestations of these nutritional deficiencies − such as
63
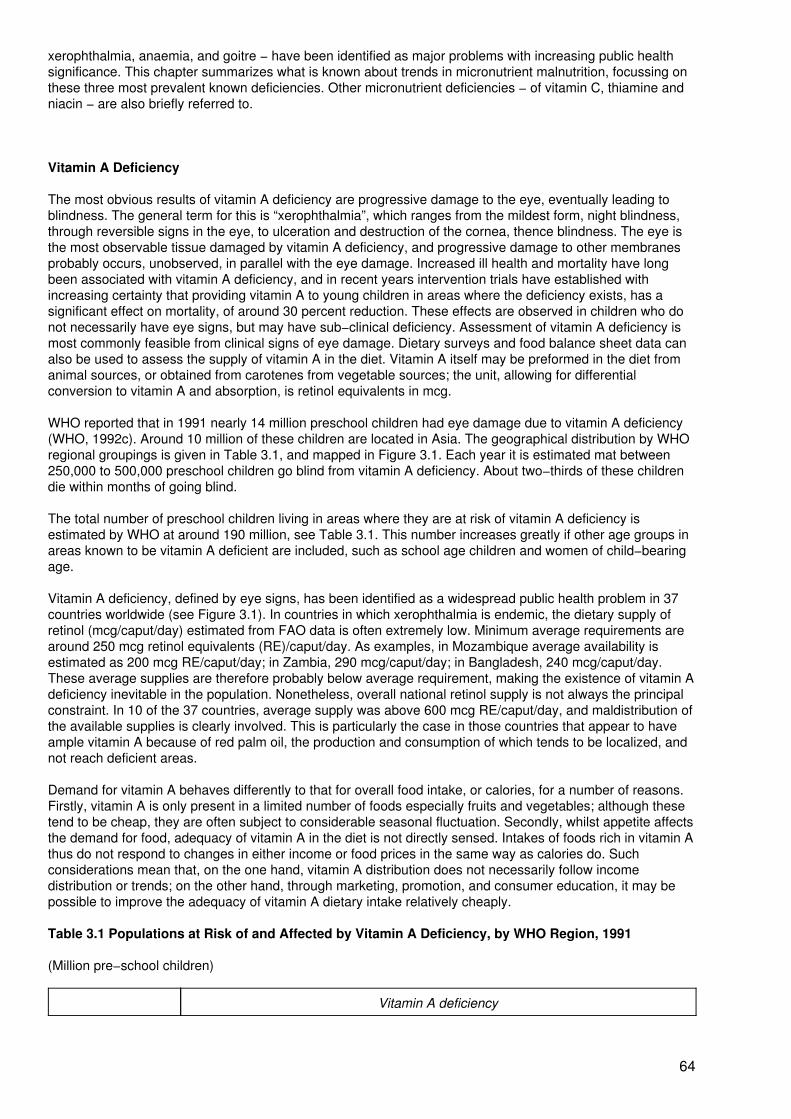
xerophthalmia, anaemia, and goitre − have been identified as major problems with increasing public healthsignificance. This chapter summarizes what is known about trends in micronutrient malnutrition, focussing onthese three most prevalent known deficiencies. Other micronutrient deficiencies − of vitamin C, thiamine andniacin − are also briefly referred to.
Vitamin A Deficiency
The most obvious results of vitamin A deficiency are progressive damage to the eye, eventually leading toblindness. The general term for this is “xerophthalmia”, which ranges from the mildest form, night blindness,through reversible signs in the eye, to ulceration and destruction of the cornea, thence blindness. The eye isthe most observable tissue damaged by vitamin A deficiency, and progressive damage to other membranesprobably occurs, unobserved, in parallel with the eye damage. Increased ill health and mortality have longbeen associated with vitamin A deficiency, and in recent years intervention trials have established withincreasing certainty that providing vitamin A to young children in areas where the deficiency exists, has asignificant effect on mortality, of around 30 percent reduction. These effects are observed in children who donot necessarily have eye signs, but may have sub−clinical deficiency. Assessment of vitamin A deficiency ismost commonly feasible from clinical signs of eye damage. Dietary surveys and food balance sheet data canalso be used to assess the supply of vitamin A in the diet. Vitamin A itself may be preformed in the diet fromanimal sources, or obtained from carotenes from vegetable sources; the unit, allowing for differentialconversion to vitamin A and absorption, is retinol equivalents in mcg.
WHO reported that in 1991 nearly 14 million preschool children had eye damage due to vitamin A deficiency(WHO, 1992c). Around 10 million of these children are located in Asia. The geographical distribution by WHOregional groupings is given in Table 3.1, and mapped in Figure 3.1. Each year it is estimated mat between250,000 to 500,000 preschool children go blind from vitamin A deficiency. About two−thirds of these childrendie within months of going blind.
The total number of preschool children living in areas where they are at risk of vitamin A deficiency isestimated by WHO at around 190 million, see Table 3.1. This number increases greatly if other age groups inareas known to be vitamin A deficient are included, such as school age children and women of child−bearingage.
Vitamin A deficiency, defined by eye signs, has been identified as a widespread public health problem in 37countries worldwide (see Figure 3.1). In countries in which xerophthalmia is endemic, the dietary supply ofretinol (mcg/caput/day) estimated from FAO data is often extremely low. Minimum average requirements arearound 250 mcg retinol equivalents (RE)/caput/day. As examples, in Mozambique average availability isestimated as 200 mcg RE/caput/day; in Zambia, 290 mcg/caput/day; in Bangladesh, 240 mcg/caput/day.These average supplies are therefore probably below average requirement, making the existence of vitamin Adeficiency inevitable in the population. Nonetheless, overall national retinol supply is not always the principalconstraint. In 10 of the 37 countries, average supply was above 600 mcg RE/caput/day, and maldistribution ofthe available supplies is clearly involved. This is particularly the case in those countries that appear to haveample vitamin A because of red palm oil, the production and consumption of which tends to be localized, andnot reach deficient areas.
Demand for vitamin A behaves differently to that for overall food intake, or calories, for a number of reasons.Firstly, vitamin A is only present in a limited number of foods especially fruits and vegetables; although thesetend to be cheap, they are often subject to considerable seasonal fluctuation. Secondly, whilst appetite affectsthe demand for food, adequacy of vitamin A in the diet is not directly sensed. Intakes of foods rich in vitamin Athus do not respond to changes in either income or food prices in the same way as calories do. Suchconsiderations mean that, on the one hand, vitamin A distribution does not necessarily follow incomedistribution or trends; on the other hand, through marketing, promotion, and consumer education, it may bepossible to improve the adequacy of vitamin A dietary intake relatively cheaply.
Table 3.1 Populations at Risk of and Affected by Vitamin A Deficiency, by WHO Region, 1991
(Million pre−school children)
Vitamin A deficiency
64

WHO region Total pre−school child population in countries wherexerophthalmia exists
Estimated number withxerophthalmia
Africa 18 1.3
Americas 2 0.1
Southeast Asia 138 10.0
Europe − −
EasternMediterranean
13 1.0
Western Pacific 19 1.4
Total 190 13.8
Source: WHO 1992c.
The supply of vitamin A estimated from FAO’s food balance sheets indicates an improving trend for mostdeveloping countries in the last 20 years, with the notable exception of Sub−Saharan Africa. The data areshown in Figure 3.2. Countries in the Middle East and North Africa, Middle America and Caribbean, and SouthAmerica, achieved levels likely to be substantially above average requirements, by the late 1980s. Vitamin Asupply is increasing quite rapidly in South East Asia, to the point where it now exceeds average requirements.Vitamin A deficiency persists in this region, but the increase in supply should give potential for redistribution tobegin to eliminate the deficiency. In South Asia overall supplies are particularly low, and not rising very fast.This is in line with the observation of quite extensive deficiency in this region, and the slow rate ofimprovement indicates particular urgency for dietary modification and promotion of consumption of higherretinol−containing diets.
The vitamin A situation in Africa requires closer examination. First, it is essential to distinguish between thosecountries where red palm oil is produced − in West Africa − and the other countries. This is shown in thebottom part of Figure 3.2. When this is done, it becomes clear that East and Southern Africa have very lowavailabilities of vitamin A, in Southern Africa probably on average below requirement, so that here vitamin Adeficiency is likely to be widespread. Added to this, there are some indications that the overall supply isactually decreasing in East Africa, which would exacerbate the problem. In West Africa and the Sahel theapparently high availability does not preclude the co−existence of deficiency, as is indicated in the map inFigure 3.1. As noted above, this is related to the fact that red palm oil is not marketed all that widely in anumber of these countries.
The retinol supply assessed from food balance sheets should, however, be treated only as potential supply.Effective levels of physiological intake are determined by many factors including the state of maturation ofcertain fruits and vegetables, effects of dietary fats on the intestinal absorption of Vitamin A, and intake ofenriched foods. In 1986−88, the developing regions of the world derived more than 70 percent of vitamin Afrom plant sources. These include green leafy vegetables, carrots, various fruits, sweet potatoes, and palm oil.In contrast, developed countries got only 45 percent of vitamin A from food of vegetable origin. The proportioncoming from animal products tends to be more in higher income countries. Countries in Middle and SouthAmerica which have incomes above $2000 per capita derive about half of the total retinol supply fromanimals, compared to only 14 percent in Southeast Asia, a region with a per capita income of $850 onaverage in 1988. As countries develop, diet diversifies, mostly into consumption of more meat and fish, milkproducts, eggs and butter.
Growth in vitamin A availability in South Asia, South East Asia and Middle East/North Africa was explainedlargely by the increases in vegetable sources of the vitamin (e.g. palm oil in Malaysia), whereas the increasesin China and Middle America were due primarily to increases in availability from animal sources. Theelimination of Vitamin A deficiency problems has recently been adopted as one of the goals for the 1990s bythe World Summit for Children (1990) and the Montreal Conference on Micronutrient Malnutrition (1991).WHO reported that programmes were in operation in 44 countries in 1991, while another 49 countries weremaking plans for implementing action programmes. This is markedly higher in terms of number of countriesand in coverage than 1987, when only eight such countries had programmes in place.
65

Iron Deficiency
Iron deficiency is the commonest nutritional disorder in the world and affects over one billion people,particularly reproductive−aged women and preschool children in tropical and sub−tropical zones; it also has aserious impact on school children and working males. If uncorrected it leads to anaemia of increasing severity,reduced work capacity, diminished learning ability, increased susceptibility to infection and greater risk ofdeath associated with pregnancy and childbirth. It results from consuming diets with insufficient iron, reduceddietary iron availability, increased iron requirements to meet reproductive demands, and losses due toparasitic infections; these factors often operate concurrently.
Figure 3.1 Geographical distribution of xerophthalmia, 1987
Source: WHO (1987)
Figure 3.2. Vitamin A supply, 1961 −1989 (Retinol equivalent per caput per day) − A. South Asia
66

Figure 3.2. Vitamin A supply, 1961 −1989 (Retinol equivalent per caput per day) − B. Near East andNorth Africa
Figure 3.2. Vitamin A supply, 1961 −1989 (Retinol equivalent per caput per day) − C. South East Asia
Figure 3.2. Vitamin A supply, 1961 −1989 (Retinol equivalent per caput per day) − D. China
67

Figure 3.2. Vitamin A supply, 1961 −1989 (Retinol equivalent per caput per day) − E. Middle America &Caribbean
Figure 3.2. Vitamin A supply, 1961 −1989 (Retinol equivalent per caput per day) − F. South America
AFRICA SUB−REGIONS
Figure 3.2. Vitamin A supply, 1961 −1989 (Retinol equivalent per caput per day) − G. Sahelian Region
68

Figure 3.2. Vitamin A supply, 1961 −1989 (Retinol equivalent per caput per day) − H. West Africa
Figure 3.2. Vitamin A supply, 1961 −1989 (Retinol equivalent per caput per day) − I. East Africa
Figure 3.2. Vitamin A supply, 1961 −1989 (Retinol equivalent per caput per day) − J. Southern Africa
Source: Calculated from FAO data, see Chapter 7.
Note: The band shown, for guidance in interpretation, is from 250 to 550 mcg retinolequivalents/caput/day. This is based on Tables 4.1 and 4.4 of FAO/WHO, 1988. 250 mcgapproximates to the “base requirement” weighted by a typical age−sex distribution in thepopulation. The upper bound of 550 mcg is approximately the population−weighted “safelevel” of intake, usually applied to individuals and likely to be above the mean populationrequirements. For further discussion, see technical notes in Volume II.
Anaemia is thus a serious outcome of iron deficiency. Since there are multiple causes of anaemia, and sinceiron deficiency can exist without haemoglobin levels being lowered, there are potentially four differentsituations, or populations: those anaemic and iron deficient; those iron deficient but not (yet) anaemic; thoseanaemic not due to iron deficiency; and those iron replete and with normal haemoglobin. Causes of anaemia
69

other than iron deficiency often include malaria, intestinal parasites, other nutrient deficiencies such as folateand vitamin B12, and genetically determined haemoglobinopathies such as thalassemia. It is generally heldthat at least half of the anaemia worldwide is directly due to dietary iron deficiency. On the other hand, there isemerging evidence that low iron stores, even in the absence of anaemia, are also related to functionaldisadvantages, in cognitive development, learning and behaviour. The extent of this problem has not beenwidely determined. However, anaemia prevalences are reasonably well established, and can generally betaken as an indicator of the extent and trends of iron deficiency. These distinctions are further discussed in thetechnical notes, but here we concentrate on anaemia as assessed by low haemoglobin, with cutoffsdetermined by WHO (bearing in mind that much of this is due to iron deficiency, although the precise amountis unknown); and the dietary supply of iron taken from FAO food balance sheet data.
Estimates of the extent of anaemia are shown in Table 3.2. These are taken from the database compiled byACC/SCN to assess the nutritional status of women, described more extensively in Chapter 4. Results hereare given by the same regions as used elsewhere in this report, and refer to anaemia in women ofreproductive age (15−49 years old). The overall prevalence for women in developing countries is estimated at42 percent, equivalent to just over 370 million women; in pregnant women (with a cut off of 11g/dlhaemoglobin) the prevalence is estimated at 51 percent, and in non−pregnant women at 41 percent (cut off12g/dl). These results are almost identical to those calculated by WHO (WHO, 1992d; with different regionalgroupings), which estimate 44 percent prevalence for all women in developing countries, with 56 percentprevalence for pregnant women and 43 percent for non−pregnant. While there is considerable variation inprevalence by region − from around 64 percent in South Asia to 23 percent in South America, by the SCNresults − it is striking that anaemia is prevalent throughout the developing world. The geographical distributionis shown in Figure 3.3, from WHO data. Nearly half the total number of anaemic women are in South Asia.
These new estimates now also cover China, updating the figures in the First Report on the World NutritionSituation (ACC/SCN, 1987). The current figures confirm that levels of anaemia worldwide are very high, butindicate little global change (excluding China) since the previous assessment. This may partly be because ofscarcity of data. In the two regions where survey results extend across the last 15 years, Sub−Saharan Africaand South Asia, there are some indications that the prevalence of anaemia is, if anything, increasing, asdiscussed in Chapter 4 (see Figure 4.8). Relating trends in anaemia to estimates of iron availability does givea consistent picture, as will be indicated in Table 3.3.
Table 3.2 Prevalence of Anaemia in Women (15−49 years old) by Region, in 1980s
Pregnanta Non−pregnantb All
Percent Millionc Percent Millionc Percent Millionc
Sub−Saharan Africa 50 6 40 35 42 41
Near East/North Africa 44 2 31 13 33 15
South Asia 64 19 64 139 64 158
South East Asia 56 8 47 49 48 57
China 34 11 26 64 26 75
Middle America/Caribbean 34 1 27 8 28 9
South America 31 3 21 12 23 15
Total (all regions above) 51 50 41 320 42 370
a. Proportion and numbers with haemoglobin below 11 g/dl.
b. Proportion and numbers with haemoglobin below 12 g/dl.
c. Numbers are based on population estimates for 1985 (UN. 1991) in developing countries.
70
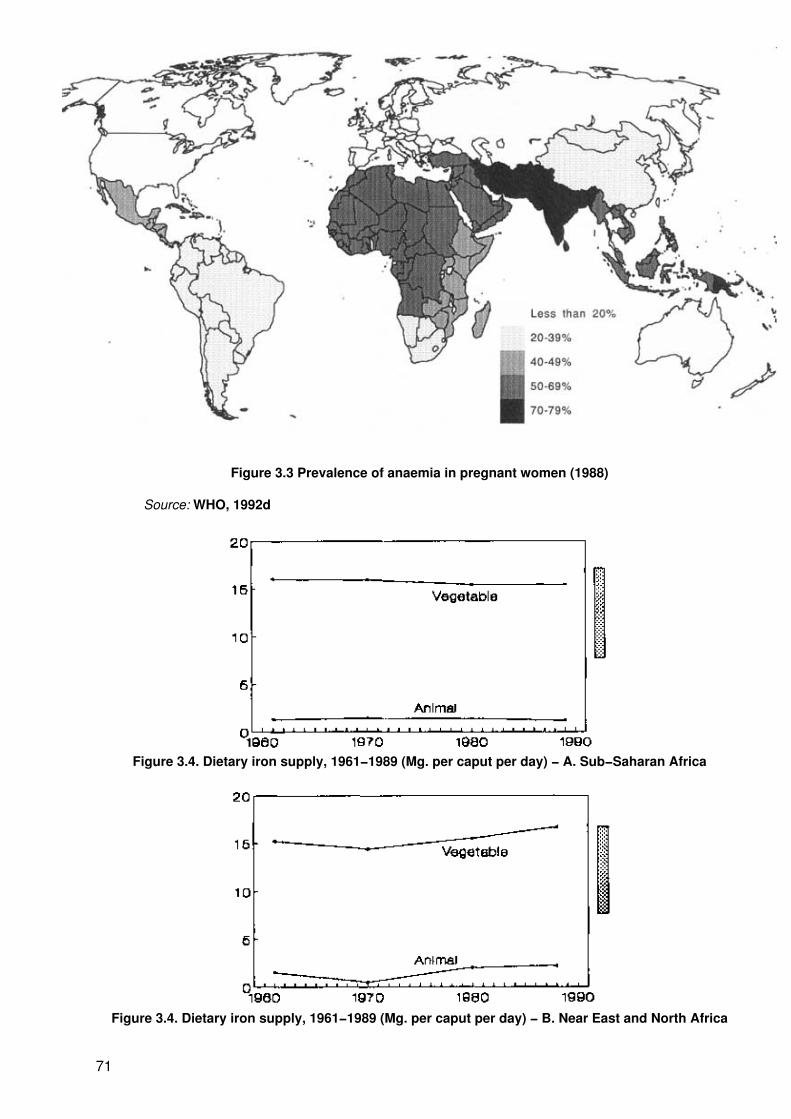
Figure 3.3 Prevalence of anaemia in pregnant women (1988)
Source: WHO, 1992d
Figure 3.4. Dietary iron supply, 1961−1989 (Mg. per caput per day) − A. Sub−Saharan Africa
Figure 3.4. Dietary iron supply, 1961−1989 (Mg. per caput per day) − B. Near East and North Africa
71

Figure 3.4. Dietary iron supply, 1961−1989 (Mg. per caput per day) − C. South Asia
Figure 3.4. Dietary iron supply, 1961−1989 (Mg. per caput per day) − D. South East Asia
Figure 3.4. Dietary iron supply, 1961−1989 (Mg. per caput per day) − E. China
72

Figure 3.4. Dietary iron supply, 1961−1989 (Mg. per caput per day) − F. Middle America and Caribbean
Figure 3.4. Dietary iron supply, 1961−1989 (Mg. per caput per day) − G. South America
Source: Calculated from FAO data, see Chapter 7.
Note: The band is the range of iron intake needed to prevent anaemia in women ofreproductive age on low and intermediate bioavailability diets (5% bioavailability. 17 mg. perday; 10% bioavailability, 8 mg. per day). This is taken from FAO/WHO (1988), Table 5.6. Theestimated dietary requirements for iron in mg. per day, taking the lowest values, which are themedian requirements to prevent anaemia, by age and physiological group areas follows:
Median requirements to prevent anaemia (Mg. iron per day)
Infants Children Boys Girls Men Women
Age group(years)
(0−1) (1−2) (2−6) (6−12) (12−16) (12−16) (16+) Menstruating Post−menopausal
Lactating
Lowbioavailability
11.0 6.5 7.5 12.5 19.0 22.0 12.0 17.0 10.0 16.0
Intermediatebioavailability
5.5 3.5 3.5 6.0 9.5 11.0 6.0 8.0 6.5 7.0
The main types of iron available in foods are: haem iron which is present in meat and its products and iswell−absorbed; and non−haem iron which is present from food of vegetable sources, generally of lowbioavailability. Iron is also provided by other animal products, such as milk, with intermediate absorption.Isotopic methods of measuring iron absorption from complete meals have increased the knowledge of howthese foods are absorbed by the body. Haem iron from meat is highly bioavailable − around 20 to 30 percentbeing absorbed; whereas non−haem iron from cereals, pulses, fruits, vegetables, etc. has much lowerbioavailability − ranging from 1 to 8 percent. The absorption of non−haem iron is highly variable and dependson the nature of the meal. Vitamin C importantly enhances iron absorption. A large number of substancesinhibit the absorption particularly of non−haem iron − for example tea, coffee, egg yolk, and bran. Hence it isdifficult to interpret the actual availability of iron from overall dietary data. This depends not only on the dietary
73

pattern itself, but also on food habits concerning composition of meals − for example drinking tea with a mealwill inhibit iron absorption more than if tea follows the meal.
Dietary iron sources are distinguished between vegetable and animal in the supply data shown in Figure 3.4.Moreover, these are not added together in the figures, since with the large variations in bioavailability thismight be misleading. It can be seen that in developing countries the predominant source of dietary iron is fromvegetable sources, and the diets are likely to be usually of low bioavailability. In Figure 3.4 an indication ofrough levels of adequacy is given, for guidance; but with the added uncertainty of distributional effects,relative levels between regions and trends are more informative.
Figure 3.5 Iron density in the diet, 1970−1989 (Mg iron per 1,000 calories)
Source: Calculated from FAO (1990a).
The iron intake patterns in the various regions of the developing world (in Figure 3.4) show the dominance ofnon−haem iron (plant/vegetable). In China for example, out of the 11.7 mg iron consumed per day, around10.3 mg comes from plant sources, mainly rice, wheat and vegetables. In most developing countries, the diettypically contains cereal, roots and/or tubers and only small quantities of meat, fish or ascorbic acid−richfoods. Thus, cereals and roots/tubers account for a large proportion of iron in the diet − ranging from 25percent for those primarily dependent on roots and tubers to around 40 percent for rice, and 60 percent forthose consuming millet and sorghum. The rest of the vegetable sources of iron comes from pulses, and greenleafy vegetables. In Sub−Saharan Africa, and South Asia, iron supplies from animal sources are extremelylow − typically accounting for about 1 mg or less per caput compared with a total of around 13−15 mg fromplant sources. Such a combination of foods in the diet is conducive to very low absorption of iron.
The overall iron supply is particularly limiting in Sub−Saharan Africa, South Asia, and South East Asia. Inthese three regions animal sources are low, the average diet is likely to be of low bioavailability, and for manypeople the supply probably does not reach even the minimum average requirement. This is in line with theseregions having the highest estimated prevalence of anaemia, as shown in Table 3.2. Results from China areinconsistent, and few anaemia estimates are available. In the other regions, the iron supply, particularly takinginto account the higher level of animal iron sources, may on average be just adequate; this gives a potentialfor improvement with redistribution.
More important, perhaps, is the observation that the overall per caput supply of iron appears to be static orperhaps decreasing in all regions except Near East and North Africa. In South Asia this is at least partly dueto a major decrease in the production and availability of pulses (lentils, beans, etc.), which have beensqueezed out in many areas by the green revolution emphasis on cereal crops. In Sub−Saharan Africa, thedecrease may be partly related to a shift away from millets and sorghums; in South East Asia these plus otherfactors may apply. Thus, the diet quality in terms of iron seems to be deteriorating, and this can be assessedby the iron concentration in me diet, expressed mg iron/1,000 calories. The trends in this indicator are shown
74

in Figure 3.5. These results demonstrate the deterioration (or lack of improvement) in the diet quality in termsof iron over the last two decades in all regions except Near East/North Africa.
Table 3.3 Regional Trends in Iron Availability and Anaemia (1970−1990)
Region Trends in Dietary Iron Supply(see Figure 3.4)
Trends in Anaemia (non−pregnantWomen)
Sub−Saharan Africa Down slightly, especially from animalsources
Up, see Fig. 4.6
Near East/North Africa Up, from both animal and vegetablesources
Probably down (est. 36% 1975/80,28% 1985/90)
South Asia Down, due to reduced pulse production(?)
High and increasing, see Fig. 4.6
South East Asia Down slightly, especially vegetablesources from 1980
Probably up (est. 40% 1970−80, 57%1980−90)
MiddleAmerica/Caribbean
Down vegetable sources, but animalsources up
Probably up (est. 20% 1970−80, 30%1980−90)
South America Down, but animal sources relativelyhigh
Probably down (est. 24% 1970−80,20% 1980−90)
Putting together the results on trends in anaemia (although these are based on rather scanty results) with thedietary iron supply from food balance sheet data, does give a consistent picture, as summarized in Table 3.3.Dietary iron supply trends are deteriorating in most regions except the Near East/North Africa, although theaverage availability may be relatively good in South America because of higher levels of iron from animalsources. The exception, Near East/North Africa, is the one region where indications are that anaemiaprevalences are not rising, or possibly even improving. In South America the prevalence of anaemia isprobably fairly stable. However, in the other regions, and in particular in Sub−Saharan Africa and South Asia,there are signs that the prevalence of anaemia may be increasing, and this is consistent with the decline inthe dietary supply of iron. For regions other than Sub−Saharan Africa this is the one nutrition problem thatseems to be getting worse. These results, which no doubt require further investigation, should raise warningflags and shift attention further towards dealing with iron deficiency. At the same time, control of malaria andintestinal parasites must be stressed.
Average iron consumption based on national figures generally hide the distribution across various locationsand socioeconomic groups. Recent research on micronutrients indicate that iron consumption behavesdifferently from other nutrients. It is more income elastic (perhaps the most of major nutrients), owing to thefact that as income increases consumers will purchase more meat and fish. In the Philippines for example, thehighest income quintile consumed three to four times more meat and pulses than households in the lowestincome quintile. This means that iron consumption overall is likely to be inadequate for poorer households.
Within households, a number of studies show highly disproportionate distribution of iron relative to individualrequirements. In the Philippines, adequacy ratios for mothers in three provinces was estimated at 0.65compared to 1.05 percent for fathers, 0.77 for adolescent girls compared to 0.91 for adolescent boys. While asubstantial part of iron adequacy reflects the higher dietary requirements for pregnant mothers and adolescentgirls, it is evident that given similar intakes, these sub−groups are likely to suffer most from low availability ofiron in the diet due to their different physiological needs. An NNMB 1979 study in India showed that averageiron intakes of children 1 to 4 years was 10.2 mg per day, compared to 34.5 mg for adult men, althoughchildren have more than half the requirements of adults.
There are in principle two strategies used in controlling iron deficiency − (a) through dietary improvement and(b) by food supplementation and fortification. In clinical practice, those suspected of being anaemic aretreated with medicinal iron supplements. In a public health setting, however, it is impossible to test eachpatient and therefore the approach is to give supplements to entire high−risk groups − mainly pregnantwomen. There are well defined delivery mechanisms which have been tried for supplementation (ACC/SCN,199 la). A number of these programmes are now in operation in developing countries. However, manyprogrammes limit effectiveness and sustainability partly because of the need for frequent administration (e.g.daily) in contrast to vitamin A and iodine. WHO reported that in 1991, a total of 102 countries have beenpreparing plans for the implementation of anaemia control programmes, and 11 countries have so far set up
75

comprehensive control programmes within the health ministries. Another 65 countries have reported toestablish monitoring and evaluation systems.
The longer term solution to the problem of iron deficiency is dietary modification. This includes increasing theuptake of haem iron from animal products and vitamin C which enhances absorption in iron, and increasinghousehold level availability of iron rich fruits and vegetables. The latter will mainly be in the realm of policies toencourage the availability of iron rich foods.
The indication here that dietary iron supplies maybe decreasing in many places has important implications forfood policy. While the substantial reduction in production of pulses has been of concern for some time, theeffect on iron status is only now being indicated on a wide scale. Reduced iron availability in other areas needfurther study. However, steps will be needed to reverse the trend.
Iodine Deficiency Disorders
Iodine deficiency exists in most regions of the world, resulting from a low intake of iodine in the diet. Theconsequences of iodine deficiency include goitre, reduced mental function, increased rates of still births andabortions, and infant deaths. Severe mental and neurological impairment known as cretinism occurs in babieswith severely iodine deficient mothers. Deficiencies in iodine later in infancy and childhood cause mentalretardation, delayed motor development, growth failure and stunting, neuromuscular disorders and speechand hearing defects. Mild deficiency can cause lethargy, and this is reversible when iodine status improves,as is goitre.
The commonest measure of iodine deficiency is from observation of goitre, enlargement of the thyroid gland,usually obtained by specific surveys in iodine deficient regions. Since goitre tends to be localized in suchregions, most data are not nationally representative, and thus prevalence estimates are somewhat tentative;trends have not yet been assessed.
WHO estimates that in 1990 around 1,000 million people lived in iodine deficient environments around theworld (see Table 3.4). These tend to be regions where the iodine, normally supplied from soil and water, hasbeen leached from the topsoil by rain, flooding, glaciation, and snow. These regions tend therefore to bemountainous and remote, as well as flood plains. In Figure 3.6 areas in which iodine deficiency controlmeasures have been implemented are shown; since these tend to be quite effective, it can be taken that inmost of these regions the extent of iodine deficiency is likely to be improving.
The extent of goitre has been estimated (by WHO and ICCIDD) as more than 200 million people, added towhich should be around 6 million with overt cretinism. These figures are shown by WHO region in Table 3.4.Around half of these are in South East Asia, including India. It is further estimated (WHO, 1992c) that some 20million people worldwide are mentally defective as a result of the deficiency.
Table 3.4 Estimated Prevalence of Iodine Deficiency Disorders in Developing Countries, by Region,and Numbers of Persons at Risk
(in millions)
At Risk With Goitre Overt Cretinism
Africa 227 39 0.5
Latin America 60 30 0.3
South East Asia 280 100 4.0
Asia (other countries including China) 400 30 0.9
Eastern Mediterranean 33 12 −
Total 1,000 211 5.7
Source: WHO 1990c.
76

Growing international awareness of the problem has led to increased programme and surveillance activities.The problem is largely preventable, and cost−effective methods of eliminating the problem are well known.WHO/UNICEF has declared the goal of eliminating IDD by year 2000, and activities now on−going incollaboration with ICCIDD (International Council for the Control of Iodine Deficiency Disorders).
Control of IDD is mainly through fortification of salt with iodine (salt iodination), and/or periodic distribution ofiodized oil, either administered orally or by injection (every three to six months orally, up to two year intervalby injection). The coverage of control programmes is shown in Figure 3.6. Further extension of iodinedeficiency control is likely, and preparations are under way in many countries. For example, in the Africanregion, 36 countries have data on the magnitude of problems of which 14 carried out surveys since 1987.National control programmes are now operational in Algeria, Congo, Ethiopia, Kenya, Malawi, Mali, Tanzania,and Zaire. National programmes are being drawn up and ready to be implemented in 10 more countries.
In Asia, where the largest global concentration of population affected by IDD is located, intensification of saltfortification and iodized oil distribution, training and education have produced improvements in Indonesia,Bhutan, Nepal and Thailand. As of 1990, about 10 million injections of iodized oil were administered inIndonesia, successfully preventing cretinism. National programmes are in place in Bangladesh, India,Myanmar, Nepal, and new initiatives started in Korea and Sri Lanka.
The problem of IDD in South America is highest in the Andean region, mostly in rural areas where iodized saltis not available. In Ecuador, a national programme which includes the distribution of iodized salt through asingle private company has been successful. Some assessments of the problem have been done in CostaRica, El Salvador, Guatemala, Honduras, Nicaragua, and Panama. Targeted programmes in Bolivia and Peruhave been intensified.
Figure 3.6 Iodine deficiency disorders: Areas affected and control programmes, 1991
Source: Map drawn with data from Table 4 in WHO, 1990c
The ICCIDD has summarized the increases in programmes to control IDD. As of 1991, 22 countries wereimplementing control programmes and another 40 countries were planning to implement action plans. Fiveyears earlier only around six developing countries had IDD programmes in place. Intensified and accurateassessments of the problem, public awareness followed by monitoring and evaluation are essential forreaching the objective of complete elimination of the problem by the end of the century.
77

Deficiencies in Vitamin C, Thiamine and Niacin
In recent years, outbreaks of micronutrient deficiency diseases among populations in refugee camps haveoccurred. Scurvy (vitamin C deficiency) has been reported among refugees and displaced persons especiallyin Somalia and Ethiopia. Pellagra (niacin deficiency) has affected Mozambican refugees in Malawi whengroundnut supplies were interrupted. Beri−beri (thiamine deficiency) was reported among Cambodianrefugees in Thailand. In principle, these diseases are preventable and methods of diagnosis and treatmentare well known.
Deficiencies in vitamin C, niacin and thiamine generally occur in long−stay refugee camp populations whenthere is total or near−total dependence on rations provided, or when rations are of very limited variety andwhen trading of fresh foods is for various reasons not possible. Pellagra occurs in maize eating populations.When maize is not complemented with either legumes or fish in the diet, the risk of pellagra increases.Beri−beri on the other hand occurs among rice eating populations − when these diet are undiversified andbased on milled (polished) rice. Including other foods such as whole cereals, legumes, and fresh vegetablesin the diet reduces the risk of beri−beri. These micronutrient deficiency problems had previously been virtuallyeliminated, and their re−appearance in refugee camps is an indication of food management constraints in thecamps.
Chapter 4: Women’s Nutritional Status
Women are vulnerable to malnutrition, for social and biological reasons, throughout their life−cycle. Aschildren, in some parts of the world, girls are discriminated against in access to health care, to food andeducation, and in other ways. As teenagers, they risk early pregnancy and suffer more risk from retardedgrowth than boys. Reproductive−aged women are subject to numerous stresses affecting their health andwell−being. Elderly women in many societies are deprived. Malnutrition in women may be a probleminsufficiently recognized and inadequately documented. Here, we focus on reproductive−aged women andmake a first attempt to describe the problems. To date, much of the emphasis has been on women asmothers. Indeed risks of motherhood including mortality are severe, and intergenerational effects perpetuategrowth and developmental failure. But women’s malnutrition is also an issue of human rights in itself (see Box4−1).
In some societies, preference for boys can start even before birth, leading to selective abortion uponascertaining the sex of the foetus. Beyond that, infant and child mortality amongst girls may be higher. Forexample, the sex ratio of females to males is nearly as low as 900 females per 1,000 males in parts of Indiaand Pakistan. Many reasons have been described, for example the less likelihood of girls being brought toclinics when a cost is involved. Thus in some societies girls leave childhood with more growth retardation thanboys.
Box 4−1 Women’s nutrition through the life cycle
“She’s 35 years old. When she was born her mother was malnourished and overworked. She was verysmall and low−weight at birth. She grew slowly. During childhood she had little good food to eat − evenless than her brothers. She could not go to school as her brothers did, but remained at home with hermother to help with the housework and child−minding.
“By adolescence, her pelvic bones were misshapen and she was shorter than she should have been. Aswas the tradition, she was married and had her first baby when she was only 14, even before she hadfully developed. It was a difficult birth, but she survived it and many more, though once she had so muchbleeding that everyone was afraid she would never recover. She’s been anaemic ever since, a conditionaggravated by the hookworm she carries. During another pregnancy she suffered a malarial fever andmiscarried.
“Like her mother before her, she never went to a health centre when she was pregnant. It was too faraway and too foreign. She used the same traditional midwife who delivered her and who helped hersisters. The midwife had no training in cleanliness, and she suffered serious infections after childbirth.
78

“She had little time between pregnancies to regain her strength, and little enough food at any time. Duringlater pregnancies her fatigue was draining her.
“She had so much work in the house and the local brick factory she could not bear the thought of anotherpregnancy. When it came she went to a woman in the village for something to end it. She was very sick,but it worked.
“Today she still feels dull pains and soreness in her belly which flare up from time to time. Also after somany pregnancies she probably has a partially prolapsed uterus, which often causes her discomfort,especially after a hard day’s work carrying bricks.”
“She is a woman who cares desperately about her family and wants to limit her pregnancies. She heardabout family planning from her sisters, but was always too afraid of her husband, who would never allowit. She once got some contraceptive pills, but she felt so nauseated and had so many headaches that shethought it must surely be a punishment for disobedience, and she stopped taking them...” (UNFPA,1989).
Source: Hammer (1981).
The major social vulnerability of girls during adolescence is the potential for beginning reproduction too soonafter maturity. In many societies early marriage is still a common phenomenon. Although legislation oftenexists prohibiting it, the practice is still widespread. Strikingly, the World Fertility Survey found “that 25% of14−year−old girls in Bangladesh, and 34% of 15−year−old girls in Nepal were married, although the legalminimum age for marriage is 16 in both countries” (WHO/UNFPA/UNICEF, 1989). Formal education for thegirl usually ends with marriage and there is pressure to conceive to gain status through fecundity. Earlymarriage is not the only social contributor to early pregnancy, “in certain societies... adolescent pregnancy andchildbirth are common outside marriage and regarded as a means of improving status, demonstratingfecundity, and attracting a new partner to provide support for each successive child”. Although growth beginsslowing for girls by the age of approximately 14, linear growth particularly of the long bones is not completeuntil the age of 18, and peak bone mass is not achieved until the age of 25 (FNB/NAS/NRC, 1989). In termsof pregnancy risk, it is important to note that “the development of the birth canal is slower than that of heightduring the early teenage period and does not reach mature size until about 2 − 3 years after growth in heighthas ceased” (Harrison et al., 1985). Early pregnancy thus not only stunts height, leads to low birth weight, butalso increases risk of obstetric complications. Nonetheless, this work (in Nigeria) also showed thatsupplementation and anti−malarials can support continued growth in young mothers, even during pregnancy.
The magnitude of the problem can be partially described with the following figures: the percentage of womengiving birth by age 18 is in Africa 28%, in Asia 18%, and Latin America 21%, and the percent of first births thatare to women of 15 to 19 years in illustrative countries is: Costa Rica 44%, Mexico 41%, Jordan 18%,Malaysia 19%, Philippines 24%, and USA 29% (UN, 1986).
Even if early pregnancy is avoided, the stresses on women in poor societies during their reproductive yearsare extensive. Most women have multiple roles to fill within their family and community. They have the majorbiological role in reproduction through pregnancy and lactation. Independent of this, the social roles of womenoften result in very heavy work loads. The frequent combination of these roles creates a major challenge forwomen to cope with. The social roles of women generally include major responsibility within the household ofcare for the other members, involving household management, food preparation, cleaning duties, obtaininghealth care, education and supervision of children. In addition to this family role, they frequently have kin andcommunity roles and finally, “productive” income−producing as well as non−income producing roles inagriculture, the marketplace, home production, factory or other work activities. The extent and nature of thespecific set of roles for any given woman at any particular point in her life is highly variable, but in all casesbiological reproductive roles are undeniable (although in rare circumstances they can be avoided) and in theoverwhelming number of cases the household responsibilities lie within the woman’s basal set of tasks. Timeallocation studies have shown repeatedly that the woman’s work day is longer than a man’s. Women haveless “leisure” or “discretionary” time available than men. Girls frequently spend more time in householdmaintenance activities than boys. The long hours and multiple roles of women create a “social vulnerability” toproblems of malnutrition particularly during the reproductive years. Time constraints may lead to infrequentmeals and exhaustion may lead to a reduced appetite, and lower overall intake results in lower intake ofindividual nutrients. Given the long hours worked and multiple roles frequently fulfilled by women in settings ofpoverty, they are at risk for general undernutrition.
79

Data that are available to assess level and trends in women’s nutritional status are mainly: anthropometry;anaemia; incidences of low birth weight; and maternal mortality. The latter is particularly striking. Maternalmortality is a tragedy that shows one of the sharpest contrasts between developing and developed countries.The lifetime chance of maternal death in North America, for example, is better than 1:6,000; and in Africa it isaround 1:20. Nutrition problems in fact play an important role in causing or aggravating dangerous situationsof childbirth. Although problems of delivery are considered to be in the realm of medical/health care providers,it is in fact increasingly clear that many problems could be reduced in severity by prevention through adequatenutrition at earlier stages. There are four major causes of maternal mortality, and for three of these(haemorrhage, infection, and obstructed labour) nutrition is involved; in eclampsia the causality is less clear.Given the high prevalence of anaemia among women in developing countries, the severity of haemorrhaging(the top cause of maternal mortality) could be reduced through reduction of anaemia. “Around 50% ofmaternal deaths in Indonesia and in Egypt and over 30% of deaths in India are due to postpartumhaemorrhage” (UNFPA, 1989).
Malnutrition and infection are interrelated, as has been discussed elsewhere. This relates both toprotein−energy malnutrition, and to even mild deficiencies of micronutrients, in this context particularly irondeficiency related to immunocompetence. Finally, small stature is a well−known risk factor for obstructedlabour, in turn related to previous malnutrition. In addition, perception of this risk can lead to deliberatelyreduced dietary intake amongst pregnant women in some cultures.
This much has been established by research over many years. We now aim to bring together availableevidence on the extent, and where possible trends, of malnutrition in women of reproductive age in developingcountries. The reproductive years are chosen partly because the biological role of reproduction introducesadditional risks. These data have been assembled from published studies from developing regions, but thesediffer from the results used for child anthropometry in that most of the surveys are not nationallyrepresentative, but are parts of smaller−scale studies published in the scientific literature. The data base wascompiled from around 340 studies carried out since the late 1970s. The methods of analysis, particularlyaggregation, are described in the technical notes, and the results in terms of levels, and certainly trends, areless secure than those for child anthropometry. Nonetheless, with these provisos, it is considered that theygive a reasonable estimate of the extent of the problem.
The first four results concern anthropometry − the stature, weight and thinness of women by region indeveloping countries. These results while indicating women’s health and well−being, use cutoff points whichare determined more by pregnancy outcome than by other criteria of welfare. This is due both to practice anddata availability, and also to the logic that adequate health is probably reasonably indicated by satisfactorypregnancy outcomee.
In Figure 4.1, the prevalence of short stature in developing regions of the world, averaged over the period1977 to 1990, is shown. The cutoff point of 145 cm. has been chosen partly as that most widely reported, itselffrequently used to indicate obstetric risk. Bearing uncertainties in the data in mind, it seems likely that thisproblem is particularly extensive in Asia, and also in Latin America. In contrast, women in the Africancontinent are considerably taller. Mean values of attained height are estimated as around 158 cm. forSub−Saharan Africa, 157 cm. for Near East and North Africa, 154 cm. for Middle America/Caribbean, 152 cm.for South America, and 150−151 cm. for women in Asia. The estimates for China are of 158 cm. on average.For comparison, European standards give a mean height of 161 cm., with virtually zero prevalence below 145cm. These comparisons emphasize that women are particularly stunted in Asia, but, in contrast, showrelatively little deficit in height in Africa.
80

Figure 4.1 Stunting in adult women, 1980s (Women, 15−49 years old)
Figure 4.2 Underweight adult women, 1980s (Women, 15−49 years old)
Figure 4.3 Low body mass index, 1980s (Women, 15−49 years old)
81

Figure 4.4 Arm circumference, 1980s (Women, 15−49 years old)
The prevalences of underweight (< 45 kg) women are shown in Figure 4.2. These follow roughly the samerelative distributions as stunting, but the overall proportion of underweight women is very much higher − up toabout 60% in South Asia, around 45% in South East Asia, and about 20% in Sub−Saharan Africa.Considering that the cutoffs of height and weight are those commonly considered to indicate both obstetricrisk and higher probability of low birth weight, these results do indicate a substantial problem of women’snutrition itself, moreover very probably linked to maternal mortality; and go a considerable way towardsaccounting for the extent and distribution of low birth weight.
The deficit in weight and height can be due to both stunting and thinness, thus it is useful to look at directindicators of weight deficit in relation to height. For this, the body mass index (weight/height2) can be used,and here the cutoff point indicating moderate thinness of 18.5 has been used, the results being shown inFigure 4.3 for the regions where enough data were obtained to make reasonable estimates. These resultsshow substantial prevalence of thinness in South and South East Asia (around 40%), and a significantprevalence also in Africa, of around 20%; thus the underweight among women in Africa is mostly thinness, inline with the low prevalence of stunting, and the similarity in the prevalences of underweight and low BMI. InMiddle America, the problem as estimated is more one of stunting than thinness.
Estimates were also obtained of low arm circumference, as an alternative measure of thinness. Dataavailability was reasonable only for Sub−Saharan Africa and South Asia (12 and 17 studies respectively) andthese gave prevalences below 22.5 cm. (a cutoff in the range commonly taken to be predictive of low birthweight, thus also likely to be related to moderate malnutrition) of 13% Sub−Saharan Africa and 54% in SouthAsia. These estimates given in Figure 4.4 generally support the conclusions drawn from the BMI data.
Figure 4.5 Anaemia, 1980s (Adult women, 15−49 years old)
82

The data available do not allow for much disaggregation between socioeconomic classes, or other suchfactors. Partly this is because there is a strong effect of region, thus the small sample size is a particularconstraint. In general, the expected relations with socioeconomic status exist. The data available are fairlybalanced between urban and rural location, and the indications are that, for example, stunting is considerablymore prevalent in rural than in urban areas (e.g. overall approximately 25% in rural areas versus 10% inurban).
Prevalences of anaemia were also assessed from the database, and some results have already been given inthe previous chapter. To recap, the relative prevalences of anaemia by region, distinguishing pregnant andnon−pregnant women, are shown in Figure 4.5, which plots the prevalence data given in Table 3.3. Thisemphasizes the extremely high prevalence of anaemia throughout the developing world, particularly amongwomen in Asian countries. The cutoff points used here are those recommended by WHO, and include mildanaemia. On the one hand, it may be useful in the future to examine distributions of more severe anaemia,using lower cutoff points, since in clinical terms a haemoglobin level of just below 12 g/dl is not regarded asparticularly serious. Using lower cutoffs would provide for this and indicate targeting priorities. On the otherhand, with the emerging evidence of functional effects of iron deficiency even in the absence of anaemia, onemust be careful not to understate the overall problem of iron deficiency.
Figure 4.6 Trends in Anaemia, 1977−1987 (Nonpregnant adult women, 15−49 years old)
Using the relatively high cutoff points for anaemia probably does capture better the extent and distribution ofiron deficiency than using lower cutoffs.
Again, knowing the relationship of anaemia to both maternal mortality and to low birth weight, these findingsare in line with other observations. For example, it has been noted that significant loss of blood throughhaemorrhaging is the leading cause of maternal death; it is known that the risk is much more serious foranaemic women; and maternal mortality is higher where anaemia is more prevalent.
The database does not allow extensive comparisons of anaemia prevalences over time. However, data fornon−pregnant women in Sub−Saharan Africa and South Asia show that the prevalence of anaemia may, ifanything, be getting worse over time. These results are very tentative, and should be treated with caution.Data from the late 1970s, 1981 through 1984, and 1985 onwards, indicate that the prevalence of anaemia inSub−Saharan Africa increased from around 37% in the first period to around 46% in the last; for South Asia,the estimates are around 57% in the first period, 67% in the second period, and 72% most recently. Theseresults are plotted in Figure 4.6 for clarity, but do require further investigation. As noted in Chapter 3, this is inline with trends in dietary iron supply; since these supply data are from a completely different source, thiscongruence could be quite significant. In general, the data are not adequate to assess trends over time inother nutritional status indicators. However, secular trends have been observed in individual countries, suchas Brazil and China, generally showing an increase in women’s heights over periods of decades in these twocountries.
83

Figure 4.7 Maternal mortality rate (Per 100,000 live births)
Source: WHO (1991b).
Maternal mortality estimates compiled by WHO are shown in Figure 4.7. The much higher risk of maternaldeath in developing countries has already been noted. The average rate for developed countries, to comparewith those shown in Figure 4.7, is around 30/100,000 live births. This is one tenth of the world average,developing countries having, on average, 15 times the rate of developed countries. The trend, is, however,improving in all regions of the world except Sub−Saharan Africa where there are indications that maternalmortality may actually be increasing. Nonetheless, there is clearly a very long way to go, particularly in SouthAsia, before the problem is brought under control.
Incidences of low birth weight, also compiled by WHO, are shown in Figure 4.8. South Asian women havetwice the low birth weight incidence of any other region, no doubt related to the high prevalence of anaemia,underweight, and early pregnancy. The incidence in Sub−Saharan Africa is much lower, in line with the largerbody size of mothers, but there are signs that the incidence is creeping up. In other regions, the incidence isgradually declining, but again there is some way to go before this reaches the levels of developed countries.
Finally, we can look at the relationship between the different indicators so far discussed. Some of theserelationships are well established − for example that low maternal anthropometry and anaemia predispose tolow birth weight and maternal mortality. One way of illustrating these effects is to look at the intergenerationallinks: small maternal size, low birth weight, growth failure in children, leading back to small adults. This viciouscycle of malnutrition between the generations can be illustrated as shown in Figure 4.9.
84

Figure 4.8 Low birth weight: Percent births below 2.5 kg
Source: WHO/UNICEF (1992).
Figure 4.9 Intergenerational cycle of growth failure
This diagram also illustrates the effects of early pregnancy, both in terms of low birth weight and inducingpremature cessation of growth in the mother.
The data go back nearly far enough in time to allow examination of this sequence over the last 20 years. Infact, birth weight and underweight child data are available for the mid 1970s, and if only limited change isassumed over the previous five year period, which is reasonable, then the associations can be viewed asshown in Figure 4.10(a) through (c). In the first of these (a) the data for prevalences of underweight childrenby region as given in Chapter 1 are plotted with the estimates of underweight in adult women for the 1980sfrom this chapter. The association is seen to be fairly close, illustrating that where there is a high proportion ofunderweight children, this may lead to higher levels of underweight adults. In the second plot (b) the mostrecent estimates available of low birth weight, around 1988, are shown scatter plotted against percentunderweight women. This illustrates, again as is reasonably well known, that high incidences of low birthweight occur in areas where there is much underweight in women. Finally, the linkage of underweight childrento low birth weight is shown in figure (c), for late 1980s. This display is intended to illustrate the effect acrossgenerations, small mothers having small babies who grow into small mothers again.
However, in many parts of the world progress is being made. The trends in low birth weight, as were given inFigure 4.8, in a sense, complete the cycle. These show that low birth weight incidences are decreasing;earlier it was also shown that prevalences of underweight children were decreasing. One means ofsummarizing this is to reproduce Figure 4.10(c) superimposing the values for around 1980 and around 1990.This is shown in Figure 4.11.
85

Figure 4.10 Intergenerational effects: Children, adults, next generation children, 1970−1990 − A.Prevalence of underweight children (1970s)
Figure 4.10 Intergenerational effects: Children, adults, next generation children, 1970−1990 − B.Prevalence of underweight adult women (1980s)
86

Figure 4.10 Intergenerational effects: Children, adults, next generation children, 1970−1990 − C.Prevalence of low birth weight (1988) and underweight children (1990) by region
The lack of change on either variable in Sub−Saharan Africa over approximately the last 15 years is striking.
Figure 4.11 Changes in prevalence of low birth weight and underweight children, approx. 1980−1990
In general, linked improvement is seen in both measures over the last ten years. In the Americas, proportionsof low birth weights and underweight preschool children are similar, and going down in parallel. In South Asia,preschool child underweight is falling more rapidly than low birth weight. But overall, the two indicators aretending to improve together, not surprisingly, perhaps, in view of their interdependence, but encouraging toconfirm. In China, low birth weight incidence appears static, but, at around 9%, is already low. On the otherhand, South East Asia appears on a trajectory towards 20% underweight and 10% low birth weight in the next15 years or so.
The results presented here are only a first step in assessing women’s nutrition. In particular, it would beimportant to assess trends, similarly to the estimates on children. Equally, it is important to assess who is
87

malnourished, and the correlates of their malnutrition. It seems clear, however, that malnutrition amongwomen is a problem that has perhaps been under−recognized, and should now take greater priority. Thefocus here is only on reproductive−age women, and future assessments should consider both the elderly, andthe adolescent girl. It is hoped to include such results in future reports.
Chapter 5: Non−Communicable Chronic Diseases
While malnutrition and infection persist as the major nutritional problems, affecting especially children, chronicdiseases are the main cause of premature death in adults, probably even in the poorest countries.Immunizations and antibiotics are having a major impact on infectious diseases, but progress is much slowerin combatting non−communicable chronic diseases (NCCDs). As always, the burden is heaviest for the poor,not least because treatment is complicated and often relatively ineffective.
“Over the past forty years, life expectancy has unproved by 20 years in the less developed regions and by 10years in the developed regions of the world. Although the current rate of improvement is greater in lessdeveloped regions, the process has gone further in developed countries, such as Britain... where only 3% nowexpect to die before 40, still almost 30% do so before 70. Thus, in Britain death before middle age has beenlargely avoided, but death in middle age is still common, though it is largely avoidable: 80% of such deathsinvolve vascular or neoplastic diseases, for many of which better treatments and more effective preventivemeasures can be foreseen.” This is from a recent comment by R. Peto, of the Cancer Studies Unit in Oxford(Peto, 1992). Later in the article he continues: “Although the growing importance of chronic disease controlhas been stressed, the chief global health priority in the 1990s remains control of the main infectiousdiseases. In 1980 there were about 50 million deaths in the world, half in people under 35 years of age.Indeed, 15 million were under five... in early childhood about four million deaths a year were due to diarrhoea,about four million to acute respiratory infections, and about four million to diseases that can largely beprevented by vaccination... so, although easy control of infective disease remains the most important priority,the more successful it is the more people will survive to middle age, and the more important will become thecontrol of the large avoidable causes of premature death from chronic disease, such as hepatitis B, bloodpressure, blood cholesterol, and, particularly, tobacco.”
Environmental factors contribute importantly to the causality of non−communicable chronic diseases. Indeed,it was estimated some ten years ago that of the avoidable causes of cancers around 35% wereenvironmental, such as diet − Peto again (Doll and Peto, 1981). Since then, a number of authoritative reviewshave further documented the evidence for dietary contributions to chronic disease: in the US the SurgeonGeneral’s Report in 1988 (US/DHHS, 1988); the National Research Council (NRC, 1989); in Europe (fromWHO) James et al. (1988a); and in the UN, WHO published me report of a WHO Study Group, entitled “Diet,Nutrition, and the Prevention of Chronic Diseases” (WHO, 1990b).
Four classes of disease are considered particularly, likely to be associated with diet: cardiovascular (includinghypertension and stroke); certain cancers; diabetes; and liver cirrhosis. In line with the increasing prioritygiven to diet−related NCCDs, it was decided to begin to include information on this topic in the series ofReports on me World Nutrition Situation. This chapter results from a first look at the subject. A major issue incompiling it has been to identify suitable data from developing countries, since these remain the focus of thereport. As for other nutrition problems, the first step was to try to identify outcome data. An important source ofthis has been the age− and cause−specific mortality data compiled by WHO. Data with adequate coverage toallow estimation of levels and trends are relatively scarce. Here, a coverage of at least 80% was used.
The data that would ideally be used are illustrated in Table 5.1. This shows, on the right−hand side, thediseases that need to be monitored − either by mortality, which in practice is all that is widely available, orpreferably from morbidity information, which is very scarce from developing countries. The dietary risk factorsthat are postulated to be contributing to these NCCDs are shown in the left−hand column of the table, andindicators of these can be more readily obtained, from food balance sheet data (as used here) and fromdietary surveys, to be identified for future research. The linkage between possible dietary causes anddiseases, while no doubt very lagged, probably involves some intermediate health indicators which could bepicked up from surveys, clinic records, etc. − examples are obesity, serum cholesterol and lipids, bloodpressure, and blood glucose. Such data are not available widely, but again it is worth noting the data thatwould be the next priority for better tracking of the situation and for early warning of future problems.
Table 5.1 Important dietary risk factors, intermediate health indicators, and diseases1
88

Dietary risk factors/indicators
Total energy (kcals)Total fat (% total energy)Animal fat (% total energy)Complex carbohydrate (% total energy)FibreFree sugarAntioxidants (vitamins A, C E; betacarotene)Salt
Intermediate health indicators
ObesitySerum cholesterol, lipidsBlood pressureBlood glucose
Diseases
Cardiovascular diseases (CVD); especially coronary heart disease (CHD))HypertensionStroke (cerebrovascular disease)Cancer (esp. breast and gastrointestinal tract)DiabetesDental caries
1 Dietary risk factors may relate to more than one disease, and to several intermediate healthindicators. These intermediate health indicators themselves may predict several diseases.Associations between individual risk factors, intermediate indicators, and diseases are notshown here, for simplicity. The table is not meant to be read across for associations (it is notimplied, for example, that animal fat is necessarily related to blood pressure, nor bloodglucose to hypertension).
Source: Mason (1992); FAO/WHO (1992a).
The relative impact of infectious and chronic disease on mortality at different ages gives one indication ofpriorities. This can be displayed as shown in Figure 5.1, where the percentage of deaths from these causes,and the actual rates, are shown for the Netherlands, Egypt, and Guatemala. It is clear that in the Netherlands,infectious disease is no longer a major cause of death; Egypt is in transition, where up to the age of ten yearsinfectious disease dominates, and there is still a significant infant and child mortality. In Guatemala infectiousdisease clearly remains an important priority. Results such as these, even if low coverage had to be accepted,seem quite useful for assessing relative priorities when considering the nutrition and health situation indifferent countries.
Assessing trends in chronic diseases, necessarily from mortality data in developing countries, runs up againstthe problem of data availability and quality. Only from certain Latin American countries are there dataavailable over time, with adequate coverage (> 80%) and repeated within periods where the classification ofdiseases is reasonably comparable (the International Classification of Disease is revised periodically, whichcomplicates trend assessment). The indicators require some care. First, because infectious disease mortalityis dropping rapidly, it is important to examine mortality rates, from chronic diseases, not proportions − thelatter will inevitably show an increase because infectious diseases are coming under control more rapidly thanchronic diseases. Secondly, it is essential to use premature mortality rates; using total mortality gives aconfusing picture as everyone dies eventually of some cause, generally chronic disease, but the objective isusually to prevent these deaths at earlier ages. Mortality rates prior to age 75 are used here. In some casesfor assessing trends and comparing countries, me rate in the age group 65 through 74 years is the indicatorchosen.
One developing country for which reasonably adequate data on age− and cause−specific mortality rates areavailable, from the 1970s (1976) and the 1980s (1986) is Mexico, which is fairly typical of Latin Americancountries (see later in discussion of Figure 5.3). These data have been taken from WHO’S World HealthStatistics Annual (e.g. WHO 1992a), and aggregated into the categories shown in Figure 5.2. These are: totalpremature mortality (Figure 5.2A); infectious and parasitic diseases (Figure 5.2B), and then total chronic
89

diseases possibly related to diet (Figure 5.2C). This is disaggregated into diseases of me circulatory system(Figure 5.2D), malignant neoplasms (Figure 5.2E), diabetes (Figure 5.2F), and cirrhosis of the liver (Figure5.2G). For comparative purposes, the estimated mortality from these different causes is shown from theNetherlands, as an example from a highly industrialized country with good statistics. Mexico is equivalentroughly to Egypt in Figure 5.1, that is in transition from high infectious disease mortality to chronic disease.
Figure 5.1 Percentage of deaths from infectious and chronic diseases1 − A. Netherlands (1988)
Figure 5.1 Percentage of deaths from infectious and chronic diseases1 − B. Netherlands (1988)
90

Figure 5.1 Percentage of deaths from infectious and chronic diseases1 − C. Egypt (1987)
Figure 5.1 Percentage of deaths from infectious and chronic diseases1 − D. Egypt (1987)
91

Figure 5.1 Percentage of deaths from infectious and chronic diseases1 − E. Guatemala (1984)
Figure 5.1 Percentage of deaths from infectious and chronic diseases1 − F. Guatemala (1984)
1 Ill defined causes of death: Netherlands (1988) 6%; Egypt (1987): 1 to 13%; Guatemala(1984): 9%.
Source: Calculated from WHO data, see Chapter 7.
92

Figure 5.2 Age and Cause Specific Mortality Rates in Mexico, 1976−19861 − A. All causes
Figure 5.2 Age and Cause Specific Mortality Rates in Mexico, 1976−19861 − B. Infectious and parasiticdiseases
Figure 5.2 Age and Cause Specific Mortality Rates in Mexico, 1976−19861 − C. Chronic diseases
93

Figure 5.2 Age and Cause Specific Mortality Rates in Mexico, 1976−19861 − D. Diseases of thecirculatory system
Figure 5.2 Age and Cause Specific Mortality Rates in Mexico, 1976−19861 − E. Malignant neoplasms
Figure 5.2 Age and Cause Specific Mortality Rates in Mexico, 1976−19861 − F. Diabetes
94

Figure 5.2 Age and Cause Specific Mortality Rates in Mexico, 1976−19861 − G. Cirrhosis
1 Ill−defined causes of death:
Mexico (1976): 7%Mexico (1986): 2%
Source: Calculated from WHO data, see Chapter 7.
The data in Figure 5.2A show the fall in premature adult mortality between 1976 and 1986, nearing but not yetquite reaching the low levels of the Netherlands. The rapid fall in mortality from infectious and parasiticdiseases is clear in Figure 5.2B; nonetheless the rates remain higher than in the Netherlands, and there is stillsome way to go in control of infectious diseases. In Figure 5.2C the total mortality from the four types ofchronic disease possibly related to diet shows little change between 1976 and 1986, but does indicate thatthis mortality is if anything slightly less than that seen in the Netherlands. The mortality from diseases of thecirculatory system (Figure 5.2D) may have fallen somewhat in Mexico, and be slightly below that from theNetherlands. In fact, the experience of the industrialized countries where cardiovascular disease mortalityincreased rapidly for men until the 1970s, and then decreased, may be as likely a pattern for developingcountries as that of Eastern Europe where cardiovascular disease premature mortality is now rising. Countriesthat are industrializing may not necessarily go through the disease patterns that the West saw.
Mortality due to cancers is currently reported as lower in Mexico than in me Netherlands, as indicated byFigure 5.2E, and appears to be relatively stable. While some of this difference may be due to diagnosis andreporting, at least part may be real, and indicates that it would be important to guard against environmentaland behavioural influences that would change such a pattern towards that of the industrialized West.
The one cause of premature mortality that appears to be on the increase in a number of developing countriesis diabetes, so the pattern shown in Figure 5.2F for Mexico is probably common. This shows an increase inthe diabetes mortality in the 1970s to the 1980s, and a much higher rate than in the Netherlands. As yet, thetotal mortality reported from diabetes is certainly less than that from the other major causes discussed so far,but the increase is of considerable concern. While the causes are not fully understood, it is likely thatincreased obesity is at least a risk factor involved. Finally, in Figure 5.2G the mortality from liver cirrhosis isshown. Not a great deal of change is in evidence, and the rate is less, reportedly, than in the Netherlands.
Changes in chronic disease mortality in other countries are compared with Mexico in Figure 5.3. Here theindicator is the mortality from the various causes in the age group of 65 through 74−year−olds. The resultsfrom Colombia, Chile, and Costa Rica, compared with Mexico, show the common pattern of falling mortalityoverall, partly due to control of infectious disease. Overall mortality from chronic disease is falling in all fourcountries, mainly due to a decrease in mortality from diseases of the circulatory system. Cancer mortalityappears to be falling also in Chile and Costa Rica, and stable or rising slightly in the other two countries.
Results such as these based on published mortality data are in line with other specific studies, one of whichwas recently prepared for the World Bank (Murray and Feacham, 1990), based on data from Cuba, CostaRica, Sri Lanka, Singapore, Chile, and China. These authors concluded “... this fall in the non−communicabledisease mortality runs counter to many widely quoted statements about the ‘rise of non−communicable
95

diseases’ with development. The evidence for a decline in non−communicable disease mortality rates inadults, however, in unequivocal”.
Nonetheless, there are enough reports from various sources of serious concern for increased morbidity andmortality from chronic diseases in developing countries that the prospect has to be examined carefully. Giventhe likely long lags between environmental causal factors, here notably diet, and disease, there is a risk thatdeterioration has not yet shown up. On the other hand, this long latent period may also give opportunity forpreemptive action to head−off undesirable dietary changes, to possibly correct early pathology, and topromote future health. The conclusion from the mortality data could be, at least, mat increasing incidence ofchronic disease may not yet have occurred; and indeed the situation may even be improving. However, it isclearly important to keep track of both likely causal factors in the diet, and the intermediate health indicatorssuch as those put forward in Table 5.1. Here, we have assessed the evidence from FAO Food Balance Sheetdata for trends likely to predispose to chronic disease, in line with me recommendations of the WHO StudyGroup (WHO, 1990b), which drew attention to a number of dietary characteristics that could threaten orpromote health. Risk factors and indicators are given in the first column of Table 5.1. Priority is given totracking total fat, as a percentage of energy intake; animal fat (as a proxy for saturated fat) as a percentage oftotal calories; and intakes of complex carbohydrates, a decrease in which is likely to be a risk to health. Oneof the questions examined was how far dietary changes are inevitable over time, particularly with increasedincome, here displayed as log GNP per caput. Finally we have used the WHO mortality data (for thosecountries in which at least one estimate was available) to classify countries into three approximately equalcategories of chronic disease mortality, and then chosen the Food Balance Sheet data for these countries.
Figure 5.3 Mortality rates of 65−74 year olds: Change from 1970s to 1980s − A. Colombia: 1972−1974
Figure 5.3 Mortality rates of 65−74 year olds: Change from 1970s to 1980s − B. Mexico: 1976−1986
96

Figure 5.3 Mortality rates of 65−74 year olds: Change from 1970s to 1980s − C. Chile: 1970−1987
Figure 5.3 Mortality rates of 65−74 year olds: Change from 1970s to 1980s − D. Costa Rica: 1971−1988
Source: Calculated from WHO data, see Chapter 7.
In Figures 5.4 and 5.5, dietary indicators from FAO Food Balance Sheets are plotted against log GNP, forthree points in time, 1965, 1980, and 1989. This presentation shows the effects of both GNP changes andsecular trends. Further, comparing vertically between the three charts in each figure gives some idea as topossible relationships between dietary indicators and chronic diseases, taking out the effect of GNP.
Examination of Figure 5.4, which shows total fat intake as a percentage of energy, against time and GNP,gives the impression that although there are some increases in total fat percentage with GNP and time, thereare also important differences between countries. In other words, to take an example from Figure 5.4(a),Thailand is not necessarily headed to the same high level of fat intake as seen in Spain, say; and givennational income (e.g. GNP = US$1,000), there are substantial differences, in this case, between Thailand,Peru, Costa Rica, Portugal and Spain. This can be examined more formally, and it can be shown analyticallythat different regions are significantly different in their fat consumption from each other, and particularly fromWestern countries, controlling for GNP and year. In fact, the secular trend itself is not very significant whenthese variables are in the equation. The tentative conclusion would be that there is a significant and importanteffect of different food habits (or cuisines) between regions, and it is not inevitable that, for example, Thailandwill end up because of increased income with 30 to 40% fat in the diet. At least, the changes are nothappening so rapidly that it is too late to embark upon consumer education in an attempt to maintain healthydiets where these are the current practice. For guidance, WHO (1990b) suggested an upper limit forpopulation average intakes of 30% of total energy from fat.
Somewhat similar conclusions come from examining the animal fat intake as shown in Figure 5.5. There isindeed a trend upwards in animal fat consumption, in line with increased consumption of animal productsoverall with income. Again, there are important differences between different parts of the world; countries
97

known for high animal production such as New Zealand and Argentina are indeed shown to have rather highanimal fat percentages, and also have among the higher mortality rates from NCCDs. In New Zealand and theUS there are signs that this percentage is coming down, perhaps in response to public education. Forguidance, WHO (1990b) suggested an upper limit on a population basis of 10% of energy as saturated fat.
Figure 5.4 Changes in dietary supply of total fats (as percentage of total energy), with log GNP percapita (1965, 1980, 1989) − A. Low NCCD mortality
Figure 5.4 Changes in dietary supply of total fats (as percentage of total energy), with log GNP percapita (1965, 1980, 1989) − B. Medium NCCD mortality
98
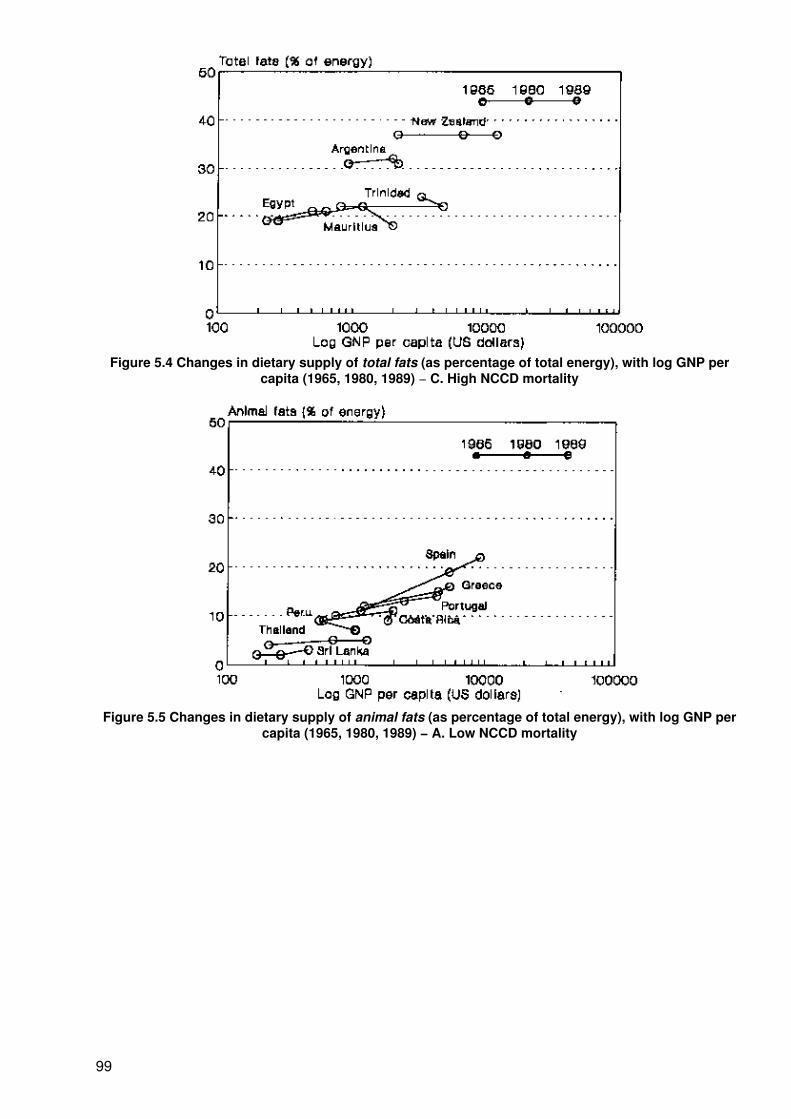
Figure 5.4 Changes in dietary supply of total fats (as percentage of total energy), with log GNP percapita (1965, 1980, 1989) − C. High NCCD mortality
Figure 5.5 Changes in dietary supply of animal fats (as percentage of total energy), with log GNP percapita (1965, 1980, 1989) − A. Low NCCD mortality
99

Figure 5.5 Changes in dietary supply of animal fats (as percentage of total energy), with log GNP percapita (1965, 1980, 1989) − B. Medium NCCD mortality
Figure 5.5 Changes in dietary supply of animal fats (as percentage of total energy), with log GNP percapita (1965, 1980, 1989) − C. High NCCD mortality
Source: Calculated from FAO data, see Chapter 7.
Note: The graphs combine data on GNP and year. The points represent log GNP and fats aspercent of total energy from 1965 (left hand dot), 1980 and 1989, generally from left to right.Where the GNP fell (1980 to 1989 in some countries), but fat percent still increased, the plotbends backward − as in Costa Rica in (A), and Chile, Mexico and Venezuela in (B) andTrinidad in (C). Classification into low, medium and high premature mortality rates fromNCCD (non−communicable chronic diseases) is based on data calculated from WHO (seeChapter 7).
100

Figure 5.6 Changes in dietary supply of complex carbohydrates (as percentage of total energy), withlog GNP per capita (1965, 1980, 1989)
Source: Calculated from FAO data, see Chapter 7.
In a number of countries GNP fell during the 1980s, which gives rise to a somewhat unfamiliar plot in Figures5.4 and 5.5, where the line bends back on itself − Mexico, Venezuela and Chile are examples in Figure 5.4B.The fact that they bend upwards means that fat percentage still increased in 1980 to 1989, even though GNPper caput fell. This is some evidence that once a certain level of fat intake is adopted, even if this is inresponse to increased income, if income declines the food habits do not change very rapidly; in fact the fatproportion continues to increase somewhat over time. The pattern is a combination of dietary habits evolvingover time, and responses to increased income.
Associations of these indicators with NCCD mortality are, however, not very striking. Drawing a vertical line inFigure 5.5 and comparing percentage animal fat intakes for charts (a), (b), and (c) controls for income, anddoes indicate some possible association of mortality with animal fats, which is indeed in line with theory. Butthe more general conclusion is that while diets in almost all cases are on a trajectory towards higher fat, andthat at a certain level this will become undesirably high, the rate of change at least on average is not so rapidthat it is too late to take preventive measures.
The other side of the picture of dietary change concerns consumption of complex carbohydrates, which tendto get displaced by increasing fat intakes, and consumption of free sugars. These intakes are shown in Figure5.6, which does indeed indicate a somewhat concerning general trend downwards. The range of consumptionis also striking, from 60 to 70% in Thailand, down to around 25% in the US. The WHO Study Group (WHO,1990b) suggested that population average intakes should be of the order of 50 to 70% and it is clear that thericher countries are well below this, and that others are heading in the wrong direction.
101

Figure 5.7 Prevalence of obesity of women in Brazil by income group, 1974/75−1989
Source: Coitinho et al. (1991).
It will be important in the future to track intermediate indicators, of which the most widely available is likely tobe obesity. There is some evidence for increasing prevalences of obesity in many parts of the world,particularly among the poor in better off countries, and the middle income groups in some developingcountries. The risk of obesity is probably related to increasing urbanization, and there are reports from LatinAmerica of a rapid transition from undernutrition to overnutrition, and indeed of the coexistence of obesity andunderweight in me same households. Finally, dietary and other factors, such as tobacco use, may interact toproduce particular risks with changing life styles (Peto et al., 1992).
An example of both the increase in the prevalence of obesity, and its shift towards lower income groups withdevelopment, is shown in Figure 5.7, which takes data from studies of nutrition in Brazilian adults. In the firstsurvey, in 1974/75, around 10% obesity was observed towards the upper part of the income distributionamong adult women. By 1989 both the level had increased, to a maximum of around 13% and the peakprevalence had shifted down to the middle of the income distribution. In other words obesity had increased,and had begun to preferentially affect the poorer population. It is likely that this evolution will be seen in anumber of other countries, and is a warning sign for future problems of chronic disease.
Chapter 6: Projections of Malnutrition in Children
Projections of likely trends in underweight prevalences seem important as background consideration for futureactions, for example, in the International Conference of Nutrition of 1992, and in relation to the goals of theWorld Summit for Children of 1990 (UN 1990). It may be useful to have a view of the probable evolution of thesituation, when existing policies and conditions continue, to see what may happen, and to add to this the likelyeffects of changed policies and resource availabilities.
There are several approaches to projecting future trends. All are uncertain and require making explicit theassumptions. Given the uncertainty, simplicity has some value. One generally reasonable way is to bound theprojections on the basis of historical trends. Another is to use econometric modelling techniques − through aseries of structural equations which contain certain variables affected by policy − to look at the effects of thelikely changes in these (for example, calorie availability, education levels, government funding support). Inpreparing this report, not too much time was assigned to the latter approach; results may be somewhatsuperficial, but are interesting as background for considering future policies. A more detailed approach wastaken by Kelly (1992), with largely comparable results
102

Figure 6.1 Projections: Trends in prevalence of underweight children: Year 2000.
The approach giving the results illustrated in Figures 6.1 and 6.2 is based on the historical trends − that is tosay: an optimistic trend (called scenario B) would be to apply the best observed rate of change over afive−year interval during 1975 to 1990 to the regional grouping of countries. A pessimistic trend (calledscenario A) is to take the worst five−year rate. Thus, for example, we could say that “if the trends in 1990 to2000 are like the period from 1975 to 1980, we will see....; if like 1980 to 1985, we will see.... (or variations onthis)”. The projections based on historical trends do not account for possible positive breakthroughs in thefuture, e.g., new uses of biotechnology; nor of possible negative shocks and disasters, like uncontrolledspread of AIDS.
The results, shown in Figures 6.1 and 6.2 and summarized in Table 6.1, are also compared with the trendrequired to meet the goals set at the World Summit for Children (UN 1990) of “halving the prevalence ofmalnutrition by the year 2000” as shown by the dotted lines.
Figure 6.2 Projections: Trends in prevalence of underweight children: Year 2000
Table 6.1 Projections: Trends in Prevalence and Numbers of Underweight Children (1990−2000)
Percent Underweight Numbers Underweight
103

Year1990
Year 2000 Year1990
Year 2000
Based on HistoricalTrends
Based on HistoricalTrends
Region Scenario APessimistic
ScenarioB
Optimistic
WSCGoals
Scenario APessimistic
ScenarioB
Optimistic
WSCGoals1
(Percent) (Millions)
Sub−Saharan Africa 29.9 32 27 15 28.2 38 30 18
Near East/NorthAfrica
13.4 11 8 6 4.8 5 3 2
South Asia 58.5 54 49 29 101.0 110 100 59
South East Asia 31.3 24 22 16 19.9 17 15 11
China 21.8 22 16 11 23.6 30 24 15
MiddleAmerica/Caribbean
15.4 16 10 8 3.0 4 2 2
South America 7.7 6 2.5 4 2.8 2 1 1
All DevelopingCountries
34.3 32 27.5 17 184.0 206 175 108
1 Goals of 1990 World Summit for Children (UN 1990).
This emphasizes that for most countries, a great deal of deliberate action, much more than ever before, wouldbe needed to shift the trend line downwards to the extent of meeting the goals.
In South Asia. if the trend followed the 1970s (scenario B), an improvement of about 10 percentage pointswould be achieved − from 59% underweight in 1990 to 50% in the year 2000. The Summit goal for South Asiafor the year 2000 is 29%. In terms of numbers, the percentage reductions under the more optimistic scenario(B) imply that the number of underweight children will remain static at around 100 million due to populationincrease. The size of the under−five population is likely to change, too, because fertility rates and IMR arealso expected to decline, under the assumptions by the UN. Using scenario A (pessimistic assumption basedon the 1980s trend), the improvement in South Asia is estimated at only 3.5 percentage points in prevalence −leading to an increase in the numbers of children underweight from 101 million in 1990 to 110 million in theyear 2000, as a result of population increase which would be greater than the decline in percentageunderweight.
In the case of South East Asia, scenario B (using the optimistic trends that occurred in the 1980−85 period) islikely to be closer to the Summit goals with a prevalence of 22% underweight in the year 2000, compared tothe Summit target of 16% prevalence. In both scenarios for South East Asia, the numbers of underweightshould decline by the year 2000, continuing the favorable trends observed in the last 15 years.
In contrast, the results of projections for Sub−Saharan Africa, even on scenario B, are pessimistic (see Figure6.2). If the relatively good situation in the 1970s in this region were reestablished, a minor improvement inprevalence of 3 percentage points (1990 to the year 2000) would be achieved. In the pessimistic scenario (A),the prevalence would rise from 30% to 32%, and there would be 38 million underweight children in the year2000 compared to 30 million in 1990. These projections are very far from the Summit goals of 15%prevalence and implied 18 million underweight by 2000. Using the econometric approach of projecting trends(the only region tried for the present report) − does not change the picture much. A simulation in which thepolicy influenceable variables were allowed to vary substantially does not greatly alter the overall conclusions.For instance, the year 2000 simulation that allowed a 200 kcal per capita increase, supplemented by anincrease in the social support government expenditures by 20% and an increase in female secondaryschooling by 20% produced a 4 percentage point improvement in prevalence, similar to scenario B. And this iswithout allowing for the potentially devastating effects of AIDS.
104

In North Africa and the Near East, prevalence of underweight would likely decline by anywhere between 8 to11 percentage points from the 1990 rate of 13.4%, In China, if the 1970s trend were reestablished, theprevalence would fall to 16%, from 21% in 1990.
It is worth noting that, on present trends, South America will reach a prevalence by the year 2000 of roughly2.5% − a figure comparable to the expected underweight prevalence in the NCHS growth standard. In otherwords, the nutrition situation as assessed by the indicator of underweight children would be comparable toindustrialized countries.
There are a number of implications from the various scenarios of the future of malnutrition. First, even theoptimistic scenarios fall way outside the World Summit for Children’s goals. Secondly, the projected trends donot give a reasonable nutrition situation, at least in South Asia and Sub−Saharan Africa, in the foreseeablefuture − not for perhaps 100 years at the present rate will malnutrition (as evidenced by underweight children)cease to be a problem in South Asia.
There is increasing evidence, however, that direct interventions can have a short gestation period forimproving nutrition (see ACC/SCN, 1991b). For example, results of the Tamil Nadu Integrated NutritionProgramme indicate substantial impact, by a combination of targeted health/food/education interventions.Rapid declines in child underweight prevalences were achieved in Thailand, related to many years ofcommunity−level programmes. As noted earlier, there is evidence that energetic community−levelprogrammes in some African countries − such as Tanzania and Zimbabwe − have had a real effect. Widerapplication of such programmes could contribute to accelerating improving trends.
These results are preliminary, and intended at this stage to give an order−of−magnitude view of how thepresent rate of progress seems. The goals of the World Summit for Children provide an important basis forcomparison. A next step now would be to assess what options there are for accelerating improvement. Thisshould be at national level, in turn requiring assessments of national trends. Some of these are given inVolume II of this report. Analysis of why nutrition improves is needed as a guide to future actions. Onecompilation of relevant case studies will be in the forthcoming results of the SCN’s Country ProgrammeReview. However, most of the action is required within countries, to get updated assessment of trends,analyze current experiences, and determine future policies and programmes to improve nutrition. Even crudeprojections as shown in this chapter could usefully be attempted nationally or, indeed, for population groupswithin countries, to help guide decisions on future actions.
Chapter 7: Technical Notes
T he following notes are intended to give information on data used, sources, estimation procedures as well aslimitations of this edition of the Report on the World Nutrition Situation. A more comprehensive description ofthe data, methods, and statistics will be given in Volume II (Methods and Statistics).
The First Report on the World Nutrition Situation (ACC/SCN 1987) and a companion volume entitledSupplement on Methods and Statistics (ACC/SCN 1988) give details of methods and data available at thattime and provide the basis for concepts and approaches used in the present report. Previous country−levelinformation is given in the Update on the Nutrition Situation (ACC/SCN 1989). Preparation of the presentreport included a study of nutrition trends in six countries, which gained detailed information in Brazil, Egypt,India, Mexico, Nigeria, and Pakistan. Summary results will be in Volume II, and full reports will be published in1993. A related ACC/SCN study (“Country Programme Review”), which aims to examine the determinants ofthe observed nutrition trends in Brazil, India, Indonesia, Nigeria, Tanzania, Thailand, and Zimbabwe providedadditional information for the present report. The latter study will be published in parallel in 1993.
Notes on Chapter 1
Prevalence and numbers of children underweight. Estimates at regional level were calculated using as a firststep data from nationally representative surveys as compiled by ACC/SCN, WHO (e.g., WHO 1989), andUNICEF, from national surveys conducted by governments and through several international surveyprogrammes such as the Demographic and Health Surveys (DHS/IRD 1992) financed by USAID; the LivingStandards Measurement Surveys (LSMS), sponsored by the World Bank; and the PAPCHILD surveys in theNear East and North Africa region sponsored by the Pan−Arab League and UNFPA. A total of 100 nationallyrepresentative surveys between 1975 to 1991 in 66 countries are included in the analysis.
105

In estimating the prevalence of underweight children, a regression model was used, which derived theprevalence level for each country for each of the reference time points: 1975, 1980, 1985, and 1990. Directestimates from surveys were used where available, corrected to the reference year. Each country’s predictedprevalence rate was multiplied by the preschool child population, then aggregated to the regional level. Thisgave the number of children aged 0 through 60 months underweight in the region; and dividing this by thetotal child population of the region gave the estimates of the prevalence of underweight children for the region.
Sources of data and standardization procedures. Only nationally representative underweight prevalence datasets were used for the analysis. Underweight is defined as less than 2 standard deviations of the medianvalue of weight−for−age, using the NCHS standards. This is the cutoff used by WHO (1983) to designate lowanthropometric values. National data which were previously reported using other cutoffs (such as the Gomezcategories, or 80 percent median) and using local standards − such as those in India, the Philippines, andThailand − were standardized in terms of 2 S.D. cutoffs using NCHS. Most surveys reported coverage ofchildren in age groups from 0 through 60 months; but in a number of cases, the range reported started at 3 to6 months and in other cases extended only up to 36 months. Most of the early DHS surveys (1986 to 1989)(see DHS/IRD 1992), for example, covered children from 6 to 36 months. In view of the observed differencesin underweight prevalence across age groups, it was necessary to standardize the reported prevalences intotheir equivalent in terms of the 0−to−60 months prevalence. This procedure is described in Volume II −Methods and Statistics.
Model to predict underweight prevalence. Two models were used: one for Sub−Saharan Africa and anotherfor the rest of the developing world; this was done because the global models were not fitting very well forAfrica. Estimation procedures are described in detail in Volume II Methods and Statistics. It should beemphasized that the procedure is intended to produce the best estimates of the prevalence of underweightchildren where weight−for−age data are missing; and has no reference to causality or structural relationships.The models were explored not only on the basis of goodness−of−fit (R2) but also by looking carefully at thedifferences between estimated and actual values (residuals), with emphasis on reducing the residuals oncountries with large populations. For the 20 data points for Africa, the model used has an R2 of 0.82 and astandard deviation of the residuals of 3.3 percentage points. The final model included the following variables:female enrollment in secondary education, kcal availability per capita for the previous year, proportion ofcalories provided by animal products, proportion from roots; and population. The model fitted for the entiredata set of 100 data points has an R2 of 0.90 and a standard deviation of residuals of 4.6. Variables includedwere: percentage of females enrolled in secondary education; kcal availability per capita for the previous year;child population; proportion of government expenditures on health, education and social security; dummyvariables for South Asia, South East Asia, and South America; interaction between South Asia dummy andkcal availability.
In countries where direct estimates from surveys existed, notably in Asia and South America, where dataavailability was extensive, it was possible to use actual data corrected to the reference year.
Data for the independent variables used in the model were obtained from various sources. Kcals, proportionof calories from root crops and from animal sources were retrieved from FAO’s AGROSTAT (FAO, 1992a),while data on government expenditures from health, education, and social security were calculated from IMF’sGovernment Financial Statistics (1991a). GNP per capita females enrolled in secondary education werederived from the World Bank’s World Tables (World Bank, 199 la) and Social Development Indicators (WorldBank, 1991b).
Calculation of population with inadequate energy intake (underfed). The results shown in Table 1.1, row 1,and Figure 1.7 of the estimated number of people with inadequate energy intake were calculated by FAO, andare the same results as used in the documentation for the International Conference on Nutrition (FAO/WHO,1992c). They will also be the basis of FAO’s Sixth World Food Survey report due in 1994. The method isdescribed in detail in Volume II of this report, and an outline is given here. The method itself is a refinement ofthat used in previous World Food Surveys (e.g., FAO, 1987), and revised in the light of new information andconsiderations (FAO, 1990b; 199 la). Two estimates are required for the calculations: the average kcal supplyavailable for consumption, and the coefficient of variation (cv) of the distribution of consumption.
The average kcal availability is calculated from FAO Food Balance Sheets, which themselves are based oncountry reports of production and utilization of food commodities, calculated through a “supply−utilizationaccount”, described in FAO (1984). These data, given on a kcal per caput per day basis and averaged over acalendar year are calculated for each country. Averaging across countries within a region by year gives thedata shown in the panels, section G in Chapter 2. The distribution of food consumed is taken to belog−normal. The coefficient of variation (cv) of household per caput calorie consumption now excludes
106

short−term random and seasonal variations, and is intended to measure the between−household variation inaverage food availability during the course of a year. The range of cv is expected to be from 0.2 to 0.35, andindividual country estimates are made as far as possible on the basis of existing information from thosecountries, including household budget surveys where available. The recent methods, and their results, havebeen described in FAO (1992c). From these two parameters, the mean and the cv, it is possible to estimatethe numbers of people falling below a given cutoff point. In using the method, two issues arise: the first is theinterpretation of cutoffs, and the second is concerned with correlations between food available to individualsor households, and their requirements or need.
The reference time period has now been defined as one year, and the definition of inadequacy refers to thisperiod. It was decided by FAO that the definition should now be: “those people with food energy consumptionaveraged over a year inadequate to support more than light activity and maintain body weight”. This meansthat the cutoff point is set at an average level for light activity, meaning excluding productive manual labour,for which a value of 1.54 BMR (basal metabolic rate) was calculated as typical, based on previous estimatesin James and Schofield (1990). Having established the cutoff point, the numbers of people falling below thiscutoff can be calculated for each country, given the mean and cv. These are then summed and prevalencescalculated in the usual way. It should be noted that the practice is to average these results over three−yearperiods, hence, the estimates refer for example to 1974/76 or 1979/81.
A particular complication, discussed in FAO (1992c) and other literature to be given in detail in Volume II,concerns the extent to which individuals are able to respond to increased need. In well−fed populations, thiscorrespondence is almost exact, but when food is constrained, people needing to eat more do not haveaccess to it. In other words, the correlation between consumption and requirement breaks down when food isconstrained. Clearly, if some people below the 1.54 BMR cutoff did not require as much as 1.54 BMR, theirintake could still be correlated with their need, and they should not be counted as low consumption orunderfed. The cutoff of 1.54 BMR is considered to be low enough that this degree of misclassification is notvery great; moreover, it is somewhat balanced by those above 1.54 BMR who are still not obtaining adequatefood for their activity level. The effect of the size of this correlation has been a matter of considerablediscussion, but, intuitively, it can be seen that when the correlation is inexact, that is, people are not able tomeet their need, particularly over the period of a year, they can reasonably be defined as having inadequateconsumption; the converse also applies, when needs are exceeded. The proportion below the cutoff of 1.54BMR is considered to be a reasonable estimate of the numbers with inadequate consumption, and, certainly,trends in this number are likely to reflect real changes.
Estimates related to DES benefitted from many useful discussions with L. Naiken (FAO) and Dennis Casley.
Other sources for Chapter 1. Micronutrient malnutrition was assessed through food supply data from FAO’sFood Production Yearbook (1990a) and from WHO data on micronutrient deficiency diseases (WHO, 1992c).Publications on women and nutrition included Holmboe−Ottesen et al. (1989) and ACC/SCN (1990b). Thelatter included a compilation of data on women given in the article by McGuire and Popkin (1990). The“nutrition transition” discussions have been presented in Popkin (1991), and provided a theoretical basis forconsidering diseases related to unbalanced and/or excessive consumption.
Nutritional goals for the 1990s were agreed at the World Summit for Children (UN, 1990). These includedhalving mild and moderate malnutrition by the year 2000, and was endorsed by the ICN’s world declaration onnutrition (FAO/WHO, 1992b).
Detailed discussions of anthropometry relating to “Concepts and Indicators” are taken from Uses ofAnthropometry (ACC/SCN, 1990a). Box 1−1 on anthropometry is also taken from ACC/SCN (1990a).Assessment methods and interpretation are reviewed in Mason (1992), and FAO/WHO (1992a).
The regression model used in Box 1−2 is given in Volume II, “Methods and Statistics” A quadratic incomespecification had the best fit, indicating strong nonlinear relationships between GNP per capita andprevalence of underweight children. The effect of government social expenditures (health, education, andsocial security) is significant after controlling for GNP per capita and other variables. This implies that thecontribution of public action in reducing the levels of malnutrition could be significant. The dummy for SouthAsia shows that countries in that region have higher levels of underweight prevalence than most of thedeveloping world, allowing for GNP. Discussions on relationships of social support expenditures to GNP aretaken from Gillespie and Mason (1991). Reviews of malnutrition and income relationships are also given invon Braun and Pandya−Lorch (1991).
107

Concepts of household food security have been widely discussed and summarized in ACC/SCN (1991c),Jonsson and Toole (1991), Maxwell (1990), von Braun, Kumar, Bouis, and Pandya Lorch (1992), Gillespieand Mason (1991), and Frankenberger (1992). Issues of estimating numbers underfed are discussed in FAO(1992c).
Underlying causes of malnutrition − household food security, health, and care − are discussed in UNICEF(1990). Human rights in relation to nutrition are the focus of the World Alliance for Nutrition and HumanRights, recently formed in Oslo, Norway, at a meeting convened by Norwegian Institute of Human Rights andUNICEF in 1992.
Country−level prevalence estimates mapped in Figure 1.3 are derived from the regression model. Changes inprevalence of underweight from 1985 to 1990 mapped in Figure 1.4 indicates the trends for developingcountries. A change of +/0.4 percentage point change per year was used as cutoff for defining “improving”,“deteriorating”, or “no−change”. Certain countries with acute problems in 1992 (including Sudan,Mozambique, and Ethiopia) were also identified in the map.
Notes on Chapter 2
Panels one to seven include graphical presentations of the trends between 1975 and 1990 for 15 variablesmat describe nutrition, population, health, economy, food, and women’s status. Panels are comparable acrossregions, and designed after principles put forward by Tufte (1983), as are other graphics. Data wereaggregated at the regional level, weighted by population of countries in each region. Methods for four of theindicators − underweight, DES below 1.54 BMR prevalence, DES, and GNP per capita − have already beendescribed in the previous section and will not be repeated here.
Population data were obtained from the United Nations Population Division (1991) estimates. The data arepresented on a log scale for comparability in growth rates across the different regional groupings. Trend dataon infant mortality rates per 1,000 live births were obtained from the United Nations (1991). IMR is defined asthe number of deaths of infants up to the age of one year per 1,000 live births. The regional IMR estimaterepresents the total of all infant deaths in the countries comprising each region divided by the total number oflive births. The total fertility rates expressed in terms of births per woman were obtained from the UN (1991).
GNP per capita figures are given in constant US dollars and are obtained from World Bank’s World Tables(World Bank, 1992a). The regional GNP per capita is derived by aggregating the GNP of all countries in aparticular regional group divided by the population of the region. The debt service ratio estimates, which wereobtained from IMF Financial Statistics (1991b), are defined as total debt service as a percentage of theexports of goods and services. Debts here include public and private nonguaranteed debt.
Immunization coverage is reported for immunization against measles in children and tetanus for pregnantmothers. Data were obtained from diskette files of the WHO (1992b) Database on Health For All. Regionalestimates were weighted by the child population and the pregnant women population of the countriescomprising the regions. Data on access to health services and potable water supply were also drawn from thesame data base. Access to local health services is defined as the proportion of the population havingtreatment for common diseases and injuries and a regular supply of at least 20 essential drugs availablewithin one hour’s walk or travel. Access to potable water supply, on the other hand, is the proportion of thepopulation having access to safe water supply in the home or within 15 minutes’ walking distance. Bothindicators were averaged at the regional level, weighted by the population of the countries in the region.
Low birth weight data were obtained from estimates by WHO/UNICEF (1992). A low birth weight is defined asa birth weight which is less than 2,500 grams, the measurement being taken preferably within the first hours oflife, before significant postnatal weight loss occurs, expressed as a percentage of all live births. The mainsources of birth weight information are from hospitals, health facilities, and attended births. Coverage is amajor issue; therefore, the trends reported should be interpreted with caution. The regional averages wereweighted by the countries’ live births.
Maternal mortality rate figures were obtained from WHO (1991b). This is expressed in terms of number ofdeaths per 100,000 live births. Like low birth weight data, information on maternal mortality rates is scanty andunevenly reported. Coverage is also a major issue; therefore, the trend estimates should be interpreted withcaution.
Breastfeeding trends were drawn from Sharma, Rutstein, Labbok, and Ramos (1991). Useful breastfeedingdata are also available from the WHO Data Bank on BreastFeeding (WHO, 1990a), see also WHO (199 la).
108

Data on education of females were taken from UNESCO estimates and retrieved from the World Bank SocialIndicators Database (WB, 1991b). The variable plotted is the percentage of school−age females enrolled insecondary schools, expressed in terms of percent.
A number of materials for this chapter were drawn from results of the ACC/SCN work on nutrition trends in sixcountries and a related study, “Country Programme Review”. Food trends were also drawn from Food Outlook(FAO, 1992b) and the State of Food and Agriculture (FAO, 1991b), FEWS (1992). Trends in incomedistribution and poverty were obtained from a compilation by Tabatabai and Fouad (1992).
Background information on countries was compiled from various sources − general sources included Europa(1992), the Economist Book of Vital World Statistics (Economist, 1990), The Economist Yearbook (Economist,1992). Country−specific sources included UNICEF Situation Analyses, FAO Country Profiles, World BankSurveys and Sector Reviews. Background information was initially compiled by Nicole Anker, Mahshid Lotfi,Alexander Marin, and Rita Aggarwal.
The Near East/North Africa section draws from the ACC/SCN study on nutrition trends in Egypt (by Nassar,Kaml, Elminiawy, and Moussa 1992). Materials on food subsidies also drew from Pinstrup−Andersen (1989),Alderman and von Braun (1984), Galal et al. (1987), Gabr (1991), and FAO (1991b).
The South Asia section draws heavily on the ACC/SCN trends/country review studies in India by Reddy,Shekar, and Gillespie (1992), and Pakistan by Malik and Malik (1992). Analysis of determinants of levels ofundernutrition were drawn from Garcia and Alderman (1989), Alderman and Garcia (1992). The sections onfood security were drawn from Alderman, Chaudhry, and Garcia (1988), Subbarao (1989), Sarma and Gandhi(1990), Pinckney (1989), Edirisinghe (1988), Dorosh and Valdez (1990) and Lipton and Longhurst (1989).Discussions on health care availability and utilization draw from Garcia and Aggarwal (1991).
The South East Asia section draws extensively from the ACC/SCN country review in Indonesia (bySoekirman, Tarwotjo, Soemodiningrat, Jalal, and Jus’at 1992) and Thailand (Kachondham, Winichagoon, andTontisirin 1992). Studies on nutritional status determinants from Senauer and Garcia (1991) and Garcia(1990) were also used in the analysis.
The analysis of trends for China draws from Chen Chunming (1990) and from reviews by Stone (1990), TongZhong et al. (1991), and Pinstrup−Andersen, Dongni, Zu De, and Yang Ye (1990).
The Middle America and the Caribbean and South America sections draws on ACC/SCN study on theanalysis of the trends in Mexico (Chavez, Avila, Bermeo, Roldan and Madrigal 1992), and in Brazil (Monteiro,Benecio, Iunes, Gouveia, Taddei, and Cardoso 1992). Results from PAHO’s volumes on Health in theAmericas (PAHO, 1990) were also extensively used in the analysis. Studies by the World Bank onsupplementary feeding programmes (Musgrove, 1991) and on the social funds (Selowsky, 1991) alsoprovided useful information.
Notes on Chapter 3
Much of the data and definitions on micronutrient deficiencies are taken from WHO, summarized in WHO(1992c). Food supply data on micronutrients are taken from FAO’s Production Yearbook (FAO, 1990a). Datawere also available in the material for the Montreal Conference on Micronutrient Malnutrition, and given in itsreport (WHO/UNICEF et al., 1991). Goals adopted by the World Summit for Children, which included virtualelimination of iodine and vitamin A deficiencies, and reduction of iron deficiency anaemia in women byone−third of 1990 levels, are given in UN (1990).
Indicators and methods are reviewed in FAO/WHO (1992a) and Mason (1992).
Information on iron deficiency is available in WHO (1992c). Requirements and other details are in FAO/WHO(1988). Programmes for preventing iron deficiency are reviewed in ACC/SCN (1991a). The NNMB study fromIndia on iron is from NNMB (1980). Consumer behaviour and food choice relating to micronutrientconsumption is discussed in Bouis (1991). Data on programmes for control of iodine deficiency are providedby WHO (1992c) and ICCIDD.
Micronutrient deficiency diseases among populations in refugee camps have been reported in the literature,for example, Toole and Waldman (1990). A comprehensive review is in the proceedings of an internationalsymposium held in Oxford in 1991, Refugee Studies Programme (1991).
109

Figure 3.5 provides estimates of iron density in the diet − a measure of diet quality trends − averaged for theregional country groups, weighted by population. The ratio is defined as total iron in mg. per caput per day per1,000 calories.
Anaemia trends in Figure 3.6 use cutoff haemoglobin levels of 11 g/dl for pregnant and 12 g/dl fornonpregnant women. The trends in anaemia were calculated from ACC/SCN’s data base on women’snutrition.
The global map in Figure 3.6 was plotted from WHO data on IDD assessments and control programmes givenin WHO (1992c). The regional estimates of population at risk and affected by vitamin A deficiency was takenfrom WHO (1992c) and given by WHO regions. The xerophthalmia map, Figure 3.1 is taken from WHO(1987). The map on anaemia in Figure 3.3 was taken from WHO (1992d).
Table 3.3 estimates the prevalence of anaemia by country groups. The estimates were calculated fromACC/SCN data base on women’s nutrition. Pregnant women were separated in all analyses and includewomen 15 to 49 years of age. Results from studies that used other cutoffs were recalculated into the 11 g/dland 12 g/dl cutoffs, using the means and standard deviations of haemoglobin concentration given in thesestudies.
Table 3.4 gives estimates of the prevalence of IDD in developing countries according to WHO regions. Theseare obtained from WHO (1992c). The map in Figure 3.6 was plotted from country data on IDD assessmentsand control programme given in WHO (1992c).
Chapter 3 benefited from review and comments by E. Aahman and C. Abou−Zahr (on anaemia), J. Kevany(on anaemia), and G. Clugston and B. Underwood.
Notes on Chapter 4
The database for this chapter was compiled from the literature with a publication date of 1980 or later. Thedata are different from child anthropometry in that they generally do not come from nationally representativesurveys. Interpretation, therefore, requires caution. Overall, some 330 different studies from 87 developingcountries were included. The nutritional outcome data on women were coded by factors such as: physiologicalgroup (pregnant, lactating, and nonpregnant), age, parity, location, and income group; each group was treatedas a separate record, thus the the had some 1,500 records. The five main indicators chosen for this analysisare: (1) anaemia (2) proportion of adult women below 145 centimeters in height, (3) the proportion below 45kg. in body weight, (4) wasting as indicated by percentage of adult women falling below 18.5 body mass index(BMI), and (5) percentage of adult women with a mid−upper arm circumference below 22.5 cm. The cutoffsare those which are most commonly reported in the literature. Standardization procedures were applied tostudies which did not report the above−mentioned cutoffs.
Stunting estimates in adult women (15 to 49 years of age), which is given in Figure 4.1, used 145 cm. heightcutoff for drawing comparisons of stature across the regional groupings of countries. More than half of thestudies reported the 145 cm. height cutoff. For the rest of the cases, prevalences below the 145 cm. cutoffwere calculated using the implied distribution given from the mean and standard deviations of heightsreported in the studies.
The estimated prevalences of underweight adult women in Figure 4.2 use an arbitrary cutoff of 45 kg. Thiscutoff is used for making comparisons across regions, and is often used to indicate obstetric risk. Prevalencebelow the cutoff of 45 kg. can be calculated from the mean and standard deviations of weights.
The 18.5 cutoff in BMI in Figure 4.3 has been suggested by James, Ferro−Luzzi, and Waterlow (1988b) foridentifying potential chronic energy deficiency in adults. This BMI cutoff is not necessarily the referencestandard and is used here for purposes of making the regional comparisons. The mid−upper armcircumference cutoff of 22.5 cm. is used in this report for comparison across regions; this has also beensuggested in the literature as the cutoff for identifying risk.
Data to estimate trends in anaemia are only adequate for South Asia and Sub−Saharan Africa, given in Figure4.6. Data definitions and sources for low birth weight and maternal mortality rates have been given in earliersections.
Box 4−1 is taken from Hammer (1981) and quoted from UNFPA (1989). Other references in the text are givenin the reference section.
110

This chapter benefited substantially from a background paper written for the ACC/SCN by Kathleen Merchant(1990). Much of the first two pages of text are taken directly from this paper, which was reviewed by theACC/SCN’s Advisory Group (AGN) in February 1990. Compilation of the data presented and descriptiveanalysis was done by Mahshid Lotfi (Garcia and Lotfi, 1992) and final analysis by Karen Mason (Mason andLotfi, 1992).
Notes on Chapter 5
Compilation of data on chronic diseases from WHO publications was started by Virginia Compere. The workwas continued by Denise Vogel and Alberto Torres, who began the comparisons with dietary data. Abackground paper by Torres (1992) provided some material for the Chapter. Useful comments during thiswork, and a review of the final draft, were provided by Alan Lopez (WHO).
Mortality data were extracted from World Health Statistics Annuals (WHO, 1992a), various issues between1975 and 1991. Data were classified into the causes of death categories discussed in the Chapter, andaggregated. Rates are given per 100,000 population in the WHO statistics, so could be directly added by agegroup. One problem encountered is that the International Classification of Diseases (WHO, 1980) has beenperiodically revised, although the categories for the 1970s are usually reasonably comparable with those ofthe 1980s. In contrast, the classification in the 1960s was less easy to compare, so generally was excluded.The estimated completeness and reliability of death registration importantly influenced the choice of countriesfor analysis. These estimates are now given in WHO Statistics Annuals, for 1990 and 1991 (WHO, 1992a,Table I, page xiv). For analytical purposes here, coverage of 80% or more of deaths was used. The coveragedata provided by WHO include: estimated percentage for deaths registered; percentage of registered deathsmedically certified; and percentage of registered deaths with ill−defined causes. The statistics, which are onlyavailable for the Americas, for countries quoted in Chapter 5, are as follows: Mexico, percentage of deathsregistered 85%; percentage of registered deaths medically certified 90%; percentage of registered deaths withill−defined causes 4%; Colombia: 80%, N.A., 6%; Chile: 92%, 91%, 8%; Costa Rica: 95%, 71%, 2%; andGuatemala: 90%, 50%, 10%. In Figure 5.4, countries were classified approximately into terciles of mortalityrates, and here it was necessary to include countries where the coverage was unknown; thus, thesedistinctions into low, medium, and high premature mortality from NCCDs are approximations; the classificationwas taken from the most recent years for which cause of death data were available.
Trends in dietary supply of total fats, animal fats, and complex carbohydrates were obtained from FAO’s FoodProduction Yearbook (1990a). These were calculated for 1965, 1980, and 1989 as percent of total energy forthe respective years for selected countries. Like the kcal data, these were derived from FAO’s food balancesheets from which food supply available for human consumption at national level during one year wereobtained. Data from national food balance sheets have known limitations when used to describe the levelsand trends in fats/carbohydrates intakes because of their inability to reflect changes at the household−levelfood processing patterns, for example, extent by which households remove or reduce fat intake. Food balancesheet data thus tend to overestimate consumption of fat as proportion of energy. When countries andsub−population groups consciously remove fats, this overestimation could be an important factor in maskingfat consumption trends. Thus, it should be borne in mind that the levels of fats implied in Figures 5.4, 5.5, and5.7 may be an overestimate of the actual levels.
Notes on Chapter 6
Calculations and data in this Chapter are based on those in previous chapters, and explained in the text. TheWorld Summit for Children goal referred to, given in UN 1990 (and reported in SCN News No. 6, p. 27,1990)is expressed as “B. Nutrition (i) reduction in severe as well as moderate malnutrition among under−fivechildren by half of 1990 levels”. The indicator generally used to measure this is the same as in this report, thatis, prevalence of underweight children.
Projection methods benefitted from discussions with B. Edmonston, J. Haaga, and A. Kelly. An approachusing econometric models was adopted by A. Kelly and published as Kelly (1992). These results were givenalso in FAO/WHO (1992c). Results are essentially similar to those used here, but more detailed.
Background papers prepared for ACC/SCN used in the Second Report on the World NutritionSituation
Agary, T. (1992) Trends in Nutrition in Nigeria. Ministry of Science and Technology, Nigeria.
111

Chavez, A., A. Avila, S. Bermejo, J. Roldan, H. Madrigal. (1992) The Food and Nutrition Situation of Mexico: AReport of Trends in Food Consumption, Nutritional Status and Applied Programs, 1960−1990. InstitutoNacional de la Nutricion.
Garcia, M. and M. Lotfi. (1992) Trends in Women’s Nutritional Status: Some Implications for Public Policy.ACC/SCN and IFPRI: Washington, D. C.
Kachondham, Y. P. Winichagoon, and K. Tontisirin. (1992) Trend, Policies, and Programs Affecting Nutritionand Health in Thailand. Institute of Nutrition−Mahidol University.
Kavishe, F. and S. Mushi. (1992) Review of Nutrition Relevant Actions in Tanzania. Tanzania Food andNutrition Centre.
Malik, N. and S. Malik. (1992) Reporting on the World Nutrition Situation: Case Study on Pakistan(1976−1991). Quaid−e−Azam University.
Mason, K. and M. Lotfi. (1992) Regional Estimates of Women’s Nutritional Status: Methods and Results.ACC/SCN: Geneva.
Merchant, K. (1990) Women’s Nutrition Through the Life Cycle: Social and Biological Vulnerabilities.
Monteiro, C., M. Benecio, R. Iunes, N. Gouveia, J. Taddei, and M. Cardoso. (1992) Nutritional Status ofBrazilian Children: Trends from 1975 to 1989. University of Sao Paulo and WHO.
Nassar, H., W. Moussa, A. Kaml, and A. Elminiawy. (1992) Review of Trends, Policies, and ProgramsAffecting Nutrition and Health in Egypt. University of Cairo/Institute of Nutrition. Aishams University.
Niemeijer, R. (1992) Methodology for Diagnosing and Correcting Age Reporting Errors in surveys in Children.ACC/SCN: University of Leiden: Leiden/Geneva.
Reddy, V., M. Shekar, and S. Gillespie. (1992) Nutrition Trends in India. National Institute of Nutrition.
Soekirman, I. Tarwotjo, G. Soemodinigrat, F. Jala, and I. Jusat. (1992) Economic Growth, Equity and NutritionImprovement in Indonesia.
Tagwireyi, J., T. Jayne, M. Rukoni, N. Lenneiye. (1992) Trends, Policies and Programs on Nutrition inZimbabwe. Ministry of Health/University of Zimbabwe.
Torres, A. (1992) Trends in Diet and Non−Communicable Chronic Diseases. ACC/SCN: Geneva.
References
ACC/SCN, (1987). First Report on the World Nutrition Situation. ACC/SCN, Geneva.
ACC/SCN, (1988). Supplement on Methods and Statistics to the First Report on the World Nutrition Situation.ACC/SCN, Geneva.
ACC/SCN, (1989). Update on the World Nutrition Situation: Recent Trends in Nutrition in 33 Countries.ACC/SCN, Geneva.
ACC/SCN, (1990a). Appropriate Uses of Anthropometric Indices in Children. ACC/SCN State−of−the−ArtSeries, Nutrition Policy Discussion Paper No.7. ACC/SCN, Geneva.
ACC/SCN, (1990b). Women and Nutrition. ACC/SCN State−of−the−Art Series, Nutrition Policy DiscussionPaper No.6. ACC/SCN, Geneva.
ACC/SCN, (1991a). Controlling Iron Deficiency. ACC/SCN State−of−the−Art Series, Nutrition PolicyDiscussion Paper No.9. ACC/SCN, Geneva.
112

ACC/SCN, (1991b). Managing Successful Nutrition Programmes. ACC/SCN State−of−the−Art Series,Nutrition Policy Discussion Paper No.8. ACC/SCN, Geneva.
ACC/SCN, (1991c). Some Options for Improving Nutrition in the 1990s. Supplement to SCN News No.7.ACC/SCN, Geneva.
Alderman, H., Garcia, M., (1992). Poverty, Household Food Security and Nutrition in Rural Pakistan. IFPRIResearch Report (forthcoming). IFPRI, Washington, D. C.
Alderman, H., von Braun, J., (1984). The Effects of the Egyptian Food Ration and Subsidy System on IncomeDistribution and Consumption. Research Report 45. IFPRI, Washington, D. C.
Alderman, H., Chaudhry, G., Garcia, M., (1988). Household Food Security in Pakistan: The Ration ShopSystem. Working Paper Series on Food Subsidies. IFPRI, Washington, D. C.
Bouis, H. E., (1991). Dietary Patterns, Income and Food Prices: An Analysis of Micronutrient Intakes forPhilippine Farm Households, In: SCN News No.7. ACC/SCN, Geneva.
Chavez, A., Avila, A., Bermejo, S., Roldan, J., Madrigal, H., (1992). The Food and Nutrition Situation ofMexico: A Report of Trends in Food Consumption, Nutritional Status and Applied Programs, 1960−1990.Instituto Nacional de la Nutricion and ACC/SCN, Geneva/Mexico.
Chunming, Chen., (1990). Food, Nutrition and Related Policy Considerations in China. PEW/Cornell LectureSeries on Food and Nutrition Policy, CFNPP. Cornell University, New York.
Coitinho, D.C., Sichieri, R., Mendonca Leao, M., Recine, E., (1991). Trends in Nutritional Status of BrazilianAdults. Mimeo. NUPENS/USP, Sao Paulo University.
DHS/IRD, (1992). Demographic and Health Surveys. Country Publications Series. Institute of ResourceDevelopment. Columbia, MD
Doll, R., Peto, R., (1981). The Causes of Cancer. Oxford Medical Publications. Oxford, U. K. Reprint ofJournal of the National Cancer Institute, 66, 1191−1308.
Dorosh, P., Valdez, A., (1990). Effects of Exchange Rate and Trade Policies on Agriculture in Pakistan.Research report 84. IFPRI, Washington, D. C.
ECLAC, (1990). Changing Production Patterns with Social Equity. ECLAC, Santiago de Chile.
Economist, (1990). The Economist 1990 Book of Vital World Statistics. London.
Economist, (1992). The Economist Yearbook: 1991 in Review. London.
Edirisinghe, N., (1988). The Food Stamp Scheme in Sri Lanka: Costs, Benefits, and Options for Modification.Research Report 58. IFPRI, Washington, D. C.
Europa, (1992). The Europa World Yearbook. Vol. 1 and 2. Europa Publications Ltd, London.
FAO, (1984). Food Balance Sheets, 1979−1981. FAO, Rome. FAO, (1987). The Fifth World Food Survey.
FAO, Rome. FAO, (1990a). Food Production Yearbook. FAO, Rome.
FAO, (1990b). Report on the Informal Group Meeting on the Sixth World Food Survey. Held at FAOHeadquarters, 2−3 May 1990. FAO, Rome.
FAO, (1991a). Report of Working Group on Statistics for Sixth World Food Survey. FAO, Rome.
FAO, (1991b). The State of Food and Agriculture. FAO, Rome.
FAO, (1992a). AGROSTAT. Database including food balance sheet data available on diskette. ESS, FAO,Rome.
113

FAO, (1992b). Food Outlook. No. 4. April. FAO, Rome.
FAO, (1992c). World Food Supplies and Prevalence of Chronic Undernutrition in Developing Regions asAssessed in 1992. ESS/MISC/1/92. FAO, Rome.
FAO/WHO, (1988). Requirements of Vitamin A, Iron, Folate and Vitamin B12. Report of a Joint FAO/WHOExpert Consultation. FAO, Rome.
FAO/WHO, (1992a). Assessing, Analysing and Monitoring Nutrition Situations. International Conference onNutrition, Theme paper No.7. FAO, Rome and WHO, Geneva.
FAO/WHO, (1992b). International Conference on Nutrition. World Declaration and Plan of Action. FAO, Romeand WHO, Geneva.
FAO/WHO, (1992c). Nutrition and Development: A Global Assessment. International Conference on Nutrition.FAO, Rome.
FEWS Project, (1992). FEWS Bulletins 1992 Series: Famine Early Warning System for Africa. Tulane/PragmaGroup, Arlington, VA.
FNB/NAS/NRC, (1989). Osteoporosis. Chapter 23 in: Diet and Health: Implications for Reducing ChronicDisease Risk. National Academy Press, Washington, D.C.
Frankenberger, T. T., (1992). Indicators Used for Assessing Household Food Security. Draft paper for IFADand UNICEF.
Gabr, M., (1991). Better Nutrition for the World Poor: A Challenge for the Future. Dr. Srikantia SecondMemorial Lecture, Cairo.
Galal et al., (1987). The Collaborative Research Support Project (CRSP) on Food Intake and HumanFunction. USAID Final Report Grant No. DAN−1309−G−SS−1070. USAID.
Garcia, M., (1990). Resource Allocation and Household Welfare. Institute of Social Studies, The Hague.
Garcia, M., Alderman, H., (1989). Patterns and Determinants of Malnutrition in Children in Pakistan: Impact ofCommunity Health. The Pakistan Development Review, 28 (4), 891−902.
Garcia, M., Aggarwal, R., (1991). Availability and Utilization of Health Care Services in Rural Pakistan. WB,Washington, D. C.
Garcia, M., Lotfi, M., (1992). Trends in Women’s Nutritional Status: Some Implications for Public Policy.ACC/SCN and IFPRI, Washington, D. C.
Gillespie, S., Mason, J., (1991). Nutrition Relevant Actions. ACC/SCN State−of−the−Art Series, NutritionPolicy Discussion Paper No. 10. ACC/SCN, Geneva.
Hammer, V., (1981). So Many Like Her. World Health, February−March. WHO, Geneva.
Harrison, K., Fleming, A.F., Briggs, N.D., Rossiter, C.E., (1985). Growth during Pregnancy in NigerianTeenage Primigravidae. British Journal of Obstetrics and Gynecology. 92 (Suppl. 5), 32−39.
Holmboe−Ottesen, G., Mascarenhas, O., Wandel, M., (1989). Women’s Role in Food Chain Activities and theImplications for Nutrition. ACC/SCN State−of−the−Art Series, Nutrition Policy Discussion Paper No.4.ACC/SCN, Geneva.
IMF, (1991a). Government Financial Statistics Yearbook. Vol. 14, IMF, Washington, D. C.
IMF, (1991b). International Financial Statistics 1991. IMF, Washington, D. C.
James, W.P.T., Schofield, E.C., (1990). Human Energy Requirements − A Manual for Planners andNutritionists. FAO/Oxford University Press, Oxford.
114

James, W.P.T., Ferro−Luzzi, A., Isaksson, B., Szostak, W.B., (1988a). Healthy Nutrition: PreventingNutrition−Related Diseases in Europe. WHO Regional Publications, European Series No.24. WHO,Copenhagen.
James, W.P.T., Ferro−Luzzi, A., Waterlow, J.C., (1988b). Definition of Chronic Energy Deficiency in Adults.Report of a Working Party of IDECG. Eur J. Clin. Nutr., 42, 969−981.
Jonsson, U., Toole, D., (1991). Household Food Security and Nutrition: A Conceptual Analysis. UNICEF, NewYork.
Kachondham, Y., Winichagoon, P., Tontisirin, K., (1992). Trend, Policies and Programmes Affecting Nutritionand Health in Thailand. Institute of Nutrition−Mahidol University and ACC/SCN, Geneva/Bangkok.
Kelly, A., (1992). Medium− and Long−Range Forecasts of Prevalence of Malnourished Children, Global andRegional Estimates. WHO/NUT/92.1. WHO, Geneva.
Lipton, M., Longhurst, R., (1989). New Seeds and Poor People. Johns Hopkins University Press, Baltimore.
Malik, N., Malik, S., (1992). Reporting on the World Nutrition Situation: Case Study on Pakistan (1976−1991).Quaid−e−Azam University and ACC/SCN, Geneva/Islamabad.
Mason, J.B., (1992). Assessing, Analyzing and Monitoring Nutrition Situations. ACC/SCN, Geneva.
Mason, K., Lotfi, M., (1992). Regional Estimates of Women’s Nutritional Status: Methods and Results.ACC/SCN, Geneva.
Maxwell, S., (1990). Food Security in Developing Countries: Issues and Options for the 1990s, In: IDS Bulletin21 (3), 2−13.
McGuire, J., Popkin, B.M., (1990). Beating the Zero Sum Game: Women and Nutrition in the Third World, In:ACC/SCN State−of−the−An Series, Nutrition Policy Discussion Paper No. 6. ACC/SCN, Geneva.
Merchant, K., (1990). Women’s Nutrition Through the Life Cycle: Social and Biological Vulnerabilities.ACC/SCN, Geneva.
Monteiro, C., Benecio, M., Iunes, R., Gouveia, N., Taddei J., Cardoso, M., (1992). Nutritional Status ofBrazilian Children: Trends from 1975 to 1989. University of Sao Paulo/WHO, ACC/SCN, Geneva/Sao Paulo.
Murray, C., Feacham, R., (1990). Adult Mortality in Developing Countries. Transactions of the Royal Societyof Tropical Medicine and Hygiene, 84, 1−2.
Musgrove, P., (1991). Feeding Latin American’s Children: An Analytical Survey of Food Programs. WorldBank: Human Resources Division, Washington, D.C.
Nassar, H., Moussa, W., Kaml, A., Elminiawy, A., (1992). Review of Trends, Policies, and Programs AffectingNutrition and Health in Egypt. University of Cairo/Institute of Nutrition and ACC/SCN, Geneva/Cairo.
NNMB., (1980). Report for the Year 1979. National Institute of Nutrition, Hyderabad.
NRC., (1989). Diet and Health. Implications for Reducing Chronic Disease Risk. Food and Nutrition Board,National Research Council, National Academy Press, Washington, D. C.
PAHO., (1990). Health Conditions in the Americas. PAHO, Washington, D.C.
Peto, R., (1992). Statistics of Chronic Disease Control. Nature, 356, 557−558.
Peto, R., Lopez, A., Boreham, J., Thun, M., Heath, C., (1992). Mortality from Tobacco in DevelopedCountries: Indirect Estimation from National Vital Statistics. Lancet, 339, 1268−1278.
Pinckney, T., (1989). The Demand for Public Storage in Pakistan. Research Report 77. IFPRI, Washington, D.C.
115

Pinstrup−Andersen, P., (1989). Food Subsidies in Developing Countries: Costs, Benefits, and Policy Options.Johns Hopkins University Press: Baltimore, MD.
Pinstrup−Andersen, P., Dongni, Y., Xian Zu De, Yang Ye., (1990). Changes in Incomes, Expenditures, andFood Consumption Among Rural and Urban Households in China During the Period 1978−88. Symposium onFood, Nutrition, and Social/Economic Development, Beijing.
Popkin, B.M., (1991). The Nutrition Transition. Mimeo − publication forthcoming, Carolina Population Center,Chapel Hill, North Carolina.
Reddy, V., Shekar, M., Gillespie, S., (1992). Nutrition Trends in India. National Institute of Nutrition andACC/SCN, Geneva/Hyderabad.
Refugee Studies Programme., (1991). Responding to the Nutrition Crisis Among Refugees: The Need forNew Approaches. Report of the International Symposium, Oxford, 17−20 March 1991.
Sarma, Gandhi, (1990). Production and Consumption of Food Grains in India: Implications of AcceleratedEconomic Growth and Poverty Alleviation. IFPRI Research Report No.81, Washington, D.C.
Selowsky, M., (1991). Protecting Nutrition Status in Adjustment Programs. Paper prepared for the ACC/SCN18th Session in New York, 25 February 1 − March 1991.
Senauer, B., Garcia, M., (1991). Determinants of Nutrition Health Status of Preschool Children: An Analysiswith Longitudinal Data. Economic Development and Cultural Change, 39 (2).
Sharma, R., Rutstein, S., Labbok, M., Ramos, G., (1991). Trends and Differentials in Breastfeeding: Findingsfrom World Fertility Survey and the Demographic and Health Survey. Mimeo.
Soekirman, I., Tarwotjo, G., Soemodiningrat, F., Jalal, Jusat, I., (1992). Economic Growth, Equity, andNutrition Improvement in Indonesia. ACC/SCN, Geneva/Jakarta.
Stone, B., (1990). Evolution and Diffusion of Agricultural Technology in China. In: Sharing Innovation. Editedby N. Kotler, Smithsonian Institution Press, Washington D.C.
Subbarao, K., (1989). Improving Nutrition in India: Policies and Programs and Their Impact. World BankDiscussion Paper No.49. WB, Washington, D. C.
Tabatabai, H., Fouad, A., (1992). The Incidence of Poverty in Developing Countries. ILO, Geneva.
Tong Zhong, et. al., (1991). China’s Experience with Commercialization in Poor Areas. IFPRI, Washington,D.C.
Toole, M., Waldman, R., (1990). Prevention of Excess Mortality in Refugee and Displaced Populations inDeveloping Countries. JAMA, 263 (24), 3296−3302.
Torres, A., (1992). Trends in Diet and Non−Communicable Chronic Diseases. ACC/SCN, Geneva.
Tufte, E., (1983). The Visual Display of Quantitative Information. Graphics Press, Connecticut, U.S.
UN, (1986). Contraceptive Practice: Selected findings from the World Fertility Survey Data. UN PopulationDivision, New York.
UN, (1990). World Declaration and Plan of Action. World Summit for Children. United Nations, New York, 20Sept. 1990.
UN, (1991). Global Population Estimates 1990. UN Population Division, New York.
UNFPA, (1989). State of World Population Investing in Women: The Focus of the Nineties. UNFPA, NewYork.
UNICEF, (1990). Strategy for Improved Nutrition of Children and Women in Developing Countries. PolicyReview Paper E/ICEF/1990/1.6, UNICEF, New York; JC 27/UNICEF−WHO/89.4 review. UNICEF, New York.
116

US/DHHS., (1988). The Surgeon General’s Report on Nutrition and Health. DHHS (PHS) Publication No.88−50210.
von Braun, J., Pandya−Lorch, R., (1991). Income Sources of Malnourished People in Rural Areas: ASynthesis of Case Studies and Implications for Policy. In: Income Sources of Malnourished People in RuralAreas: Microlevel Information and Policy Implications (eds von Braun, J., Pandya−Lorch, R.). Working Paperson Commercialization of Agriculture and Nutrition 5. IFPRI, Washington, D.C.
von Braun, J., Bouis, H., Kumar, S., Pandya−Lorch, R., (1992). Improving Household Food Security. Themepaper for the International Conference on Nutrition (ICN). IFPRI, Washington, D. C.
WHO, (1980). International Classification of Diseases. Relationship of categories of seventh and eighthrevisions. WHO/HS/ICD/68.80. WHO, Geneva.
WHO, (1983). Measuring Change in Nutritional Status: Guidelines for Assessing the Nutritional Impact ofSupplementary Feeding Programmes for Vulnerable Groups. WHO, Geneva.
WHO, (1987). The Geographical Distribution of Xerophthalmia in 1987 − Map. Dr E M DeMaeyer. NUT/WHO,Geneva.
WHO, (1989). Global Nutritional Status: Anthropometric Indicators Update 1989. NUT/ANTREF/1/89. WHO,Geneva.
WHO, (1990a). Breastfeeding: Prevalence, Duration and Implications for Fertility and Child Spacing(1940−1989). WHO: Division of Family Health, Geneva.
WHO, (1990b). Diet, Nutrition, and the Prevention of Chronic Diseases: A Report of a WHO Study Group.Technical Report Series No. 797. WHO, Geneva.
WHO, (1990c). Infant and Young Child Nutrition, Progress and Evaluation Report. 43rd World HealthAssembly document A43/4, agenda item 17, 1 March 1990, page 14.
WHO, (1991a). Indicators for Assessing Breast−feeding Practices. Report of Informal Meeting 11−12 June1991. WHO/CDD/SER/91.4. WHO, Geneva.
WHO, (1991b). Maternal Mortality Ratios and Rates. Maternal Health and Safe Motherhood Programme.Third edition. WHO/MCH/MSM/91.6. WHO, Geneva.
WHO, (1992a). 1991 World Health Statistics Annual. WHO, Geneva. WHO, (1992b). Health for All Database:Files. WHO: HST. WHO, Geneva.
WHO, (1992c). National Strategies for Overcoming Micronutrient Malnutrition. 45th World Health Assembly,provisional agenda item 21; doc A45/17. WHO, Geneva.
WHO, (1992d). The Prevalence of Anaemia in Women: A Tabulation of Available Information. Second EditionWHO/MCH/MSM/92.2. WHO, Geneva.
WHO/UNFPA/UNICEF, (1989). The reproductive health of adolescents: A strategy for action. A jointWHO/UNFPA/UNICEF statement. WHO, Geneva.
WHO/UNICEF et al., (1991). Proceedings of “Ending Hidden Hunger” − A Policy Conference on MicronutrientMalnutrition, Montreal, 10−12 October 1991, WHO, UNICEF, World Bank, CIDA, USAID, FAO, UNDP.
WHO/UNICEF, (1992). Estimates of Low Birthweight as of 1990. WHO, Geneva.
World Bank, (199 la). World Debt Tables. World Bank, Washington, D.C.
World Bank, (1991b). Social Indicators of Development. Johns Hopkins University Press, Baltimore.
World Bank, (1992a). World Tables. World Bank, Washington, D. C.
World Bank, (1992b). World Development Report. Oxford University Press, Washington, D.C.
117

118