2o18 annual report energy forward. - ppl corporation · 2019-04-02 · ii ppl corporation 2018...
TRANSCRIPT

Energy forward.2O18 ANNUAL REPPOORTT

Cover: PPL Electric Utilities Support Engineer Devraj Banerjee explores a virtual substation.
PPL CORPORATION AT A GLANCE
Headquarters: Allentown, Pa.
$7.8 billion in annual revenue
Total assets of $43 billion
Market capitalization of $20 billion
Seven regulated utility companies
More than 10 million utility customers (electric and gas) in the U.S. and U.K.
Approximately 218,000 miles of electric lines
145 billion kilowatt-hours of electricity delivered
About 8,000 megawatts of generation capacity
Approximately 12,500 full-time employees
Recognized leader in customer satisfactionAs of December 31, 2018
MAJOR BUSINESS SEGMENTS
KEY INFORMATION
U.K. Regulated PPL's U.K. segment consists of the regulated electricity distribution operations of Western Power Distribution, which serves 7.9 million customers incentral and southwest England and south Wales.
Kentucky Regulated PPL's Kentucky segment consists primarily of the regulated electricity and natural gas operations of Louisville Gas and Electric Company and Kentucky Utilities Company, which serve 1.3 million customers in Kentucky and Virginia and operate about 8,000 megawatts of regulatedgenerating capacity.
Pennsylvania Regulated PPL's Pennsylvania segment consists of theregulated electricity delivery operations of PPLElectric Utilities Corporation, which serves approximately 1.4 million customers in easternand central Pennsylvania.
WPD South Wales
WPD South West
WPD East Midlands
WPD West Midlands
Western PowerDistribution
Louisville Gas and Electric
Kentucky Utilities
Virginia
Regulated Power Plants
PPL Electric Utilities

MESSAGE TO SHAREOWNERS
PPL Corporation 2018 Annual Report I
At PPL, our vision is to empower economic vitality and quality of life.
We take pride in delivering energy reliably to power ourcustomers’ homes and businesses – from providing electricity andnatural gas in the early morning hours when families areawakening to a new day to delivering it without fail at the peak of a manufacturing process.
At the same time, we're driven by the opportunity to shape our shared energy future for decades to come and to grow PPLresponsibly and sustainably for you, our shareowners.
As our world changes and technology opens new doors, ourenergy and our focus are forward. Every action we take andevery decision we make is focused on the future.
With that in mind, PPL's long-term strategy is to deliver best-in-sector operational performance, invest responsibly in a sustainable energy future, maintain a strong financial foundation, and engage and develop our people.
In 2018, we remained steadfast in pursuit of this strategy, and ourresults reflect continued progress on these commitments.
Operational excellence
We delivered energy safely, reliably and affordably to more than 10 million electricity customers in the U.S. and U.K. and more than 300,000 natural gas customers in Kentucky. No job we do is more important than that.
We provided award-winning customer service, ranking among the very best for customer satisfaction in each of the regions we serve and receiving our 46th and 47th J.D. Power awards in the U.S.
Our U.K. business, meanwhile, once again topped all other distribution network operating companies in a broad measure of customer satisfaction and received the U.K. government's Customer Service Excellence Award for the 26th consecutive year.
Focused on the future, we invested $3.3 billion in infrastructure improvements to benefit our customers and advance a cleanerenergy future. This included modernizing the grid, incorporating automation, replacing and building new power lines andsubstations, enhancing cyber and physical security to protect against a new generation of threats, installing advanced meters for our Pennsylvania customers, completing a modernization project at our Ohio Falls hydroelectric facility in Kentucky, replacing aging steel service gas lines, and making progress on a multi-year project to cap and close ash ponds at our Kentuckycoal-fired power plants.
In addition, we maintained top-quartile reliability performance across our U.S. utilities and executed well against ourperformance benchmarks in the U.K.
Strong financial results
As we built on PPL's long tradition of operational excellence, wealso added to our proven track record of delivering on our financial commitments to shareowners.
We posted strong financial results, achieving the high end of our earnings from ongoing operations forecast range. This marked the ninth consecutive year we exceeded the midpoint of our earningsguidance and the second straight year we achieved the high endof our guidance range.
DEAR SHAREOWNERS,
We delivered energy safely, reliably and affordably to more than 10 million electricity customers in the U.S. and U.K. and more than 300,000 natural gas customers in Kentucky. No job we do is more important than that.

II PPL Corporation 2018 Annual Report
We closed the year with reported earnings of $2.58 per share and ongoing earnings of $2.40 per share, the latter representinga 7 percent increase from 2017 results.
As we increased earnings, we took steps to bolster our balancesheet following U.S. tax reform, completing a $1.7 billion equityforward to mitigate tax reform impacts, strengthen future creditmetrics and support our solid investment-grade credit rating. In addition, we continued to control costs and to achieve allowed returns set by each regulatory jurisdiction in which we operate.
As planned, we also increased our dividend by 4 percent, our16th increase in 17 years, returning more than $1 billion toPPL shareowners and reflecting our continued commitmentto dividend growth as an important part of overall shareowner returns.
Stock performance
While we executed well in 2018, PPL's stock price continued to be pressured by U.K. political and regulatory uncertainty relativeto other U.S.-based utility investment options.
We continue to believe that this uncertainty will be short-term, and we remain focused as always on positioning Western Power Distribution (WPD) for long-term success. Our proven track record of superior customer service and reliability, coupledwith future investment related to U.K. decarbonization plans,is expected to provide significant opportunities for WPDthroughout the next decade.
On the political front, we do not expect Brexit to have a significant impact on our operations or financial condition,as the fundamentals of our business remain strong. Our currentU.K. business plan and revenues are agreed to with U.K. regulatorOfgem through March of 2023. We believe the greatest riskrelated to Brexit is a potential decline in the value of the Britishpound sterling compared to the U.S. dollar, and we have executedhedges to mitigate this currency translation risk throughmid-2020.
On the regulatory front, we continue to actively engage with Ofgem to advance a balanced regulatory framework that willprovide real value to customers and opportunities for strong returns to investors.
With four years remaining in the current price control, we are in the very early stages of the process to determine the next price control for electricity distribution networks. Based on our collaboration to date, we believe Ofgem will be focusedon differentiating returns among electricity distribution network operators while providing substantial opportunities for top performers like WPD when new price controls begin in April 2023.
In addition, our networks are critical in supporting the demands of the U.K.'s electrification and carbon-reduction initiatives, which Ofgem recognizes, and we expect significant investmentand growth opportunities for our U.K. business as a result.
Building momentum
As we look to the future, I remain very proud of our teamof 12,000 strong as we work to create additional value for shareowners, to deliver for our customers and to make apositive impact on society.
Across PPL, from the coast of Wales to the hills of Kentucky, weare embracing new technology and innovation. We're fostering a culture of inclusion that welcomes and engages employees of all backgrounds and beliefs. We're driving for continuous improve-ment. We're enhancing our focus on sustainability, aiming to cut our carbon dioxide emissions 70 percent from 2010 levels by 2050. We are investing in the future, with plans for nearly$15 billion in new infrastructure investment through 2023.And we're giving back to the communities we serve.
Your continued investment and support of PPL helps make all of this possible. On behalf of everyone here at PPL, thank you foryour trust and confidence as we continue to execute our strategy and grow your company moving forward.
Sincerely,
William H. SpenceWilliam H SpeChairman, President and Chief Executive Officer
FINANCIAL & OPERATING HIGHLIGHTS
PPL Corporation 2018 Annual Report III
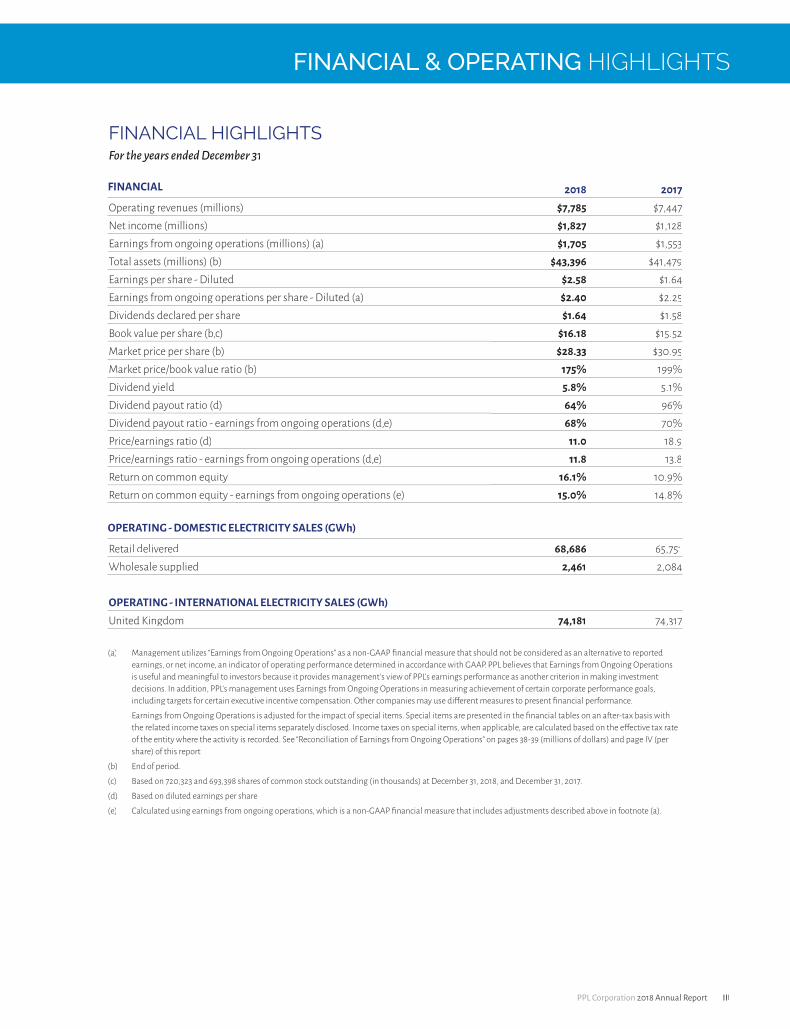
FINANCIAL HIGHLIGHTSFor the years ended December 31
FINANCIAL 2018 2017Operating revenues (millions) $7,785 $7,447Net income (millions) $1,827 $1,128Earnings from ongoing operations (millions) (a) $1,705 $1,553Total assets (millions) (b) $43,396 $41,479Earnings per share - Diluted $2.58 $1.64Earnings from ongoing operations per share - Diluted (a) $2.40 $2.25Dividends declared per share $1.64 $1.58Book value per share (b,c) $16.18 $15.52Market price per share (b) $28.33 $30.95Market price/book value ratio (b) 175% 199%Dividend yield 5.8% 5.1%Dividend payout ratio (d) 64% 96%Dividend payout ratio - earnings from ongoing operations (d,e) 68% 70%Price/earnings ratio (d) 11.0 18.9Price/earnings ratio - earnings from ongoing operations (d,e) 11.8 13.8Return on common equity 16.1% 10.9%Return on common equity - earnings from ongoing operations (e) 15.0% 14.8%
OPERATING - DOMESTIC ELECTRICITY SALES (GWh)
Retail delivered 68,686 65,751Wholesale supplied 2,461 2,084
OPERATING - INTERNATIONAL ELECTRICITY SALES (GWh)United Kingdom 74,181 74,317
(a) Management utilizes “Earnings from Ongoing Operations” as a non-GAAP financial measure that should not be considered as an alternative to reported earnings, or net income, an indicator of operating performance determined in accordance with GAAP. PPL believes that Earnings from Ongoing Operationsis useful and meaningful to investors because it provides management's view of PPL's earnings performance as another criterion in making investment decisions. In addition, PPL's management uses Earnings from Ongoing Operations in measuring achievement of certain corporate performance goals, including targets for certain executive incentive compensation. Other companies may use different measures to present financial performance.
Earnings from Ongoing Operations is adjusted for the impact of special items. Special items are presented in the financial tables on an after-tax basis withthe related income taxes on special items separately disclosed. Income taxes on special items, when applicable, are calculated based on the effective tax rateof the entity where the activity is recorded. See “Reconciliation of Earnings from Ongoing Operations” on pages 38-39 (millions of dollars) and page IV (per share) of this report.
(b) End of period.
(c) Based on 720,323 and 693,398 shares of common stock outstanding (in thousands) at December 31, 2018, and December 31, 2017.
(d) Based on diluted earnings per share.
(e) Calculated using earnings from ongoing operations, which is a non-GAAP financial measure that includes adjustments described above in footnote (a).
RECONCILIATION OF FINANCIAL MEASURES (UNAUDITED) AND 2019 EARNINGS FORECAST
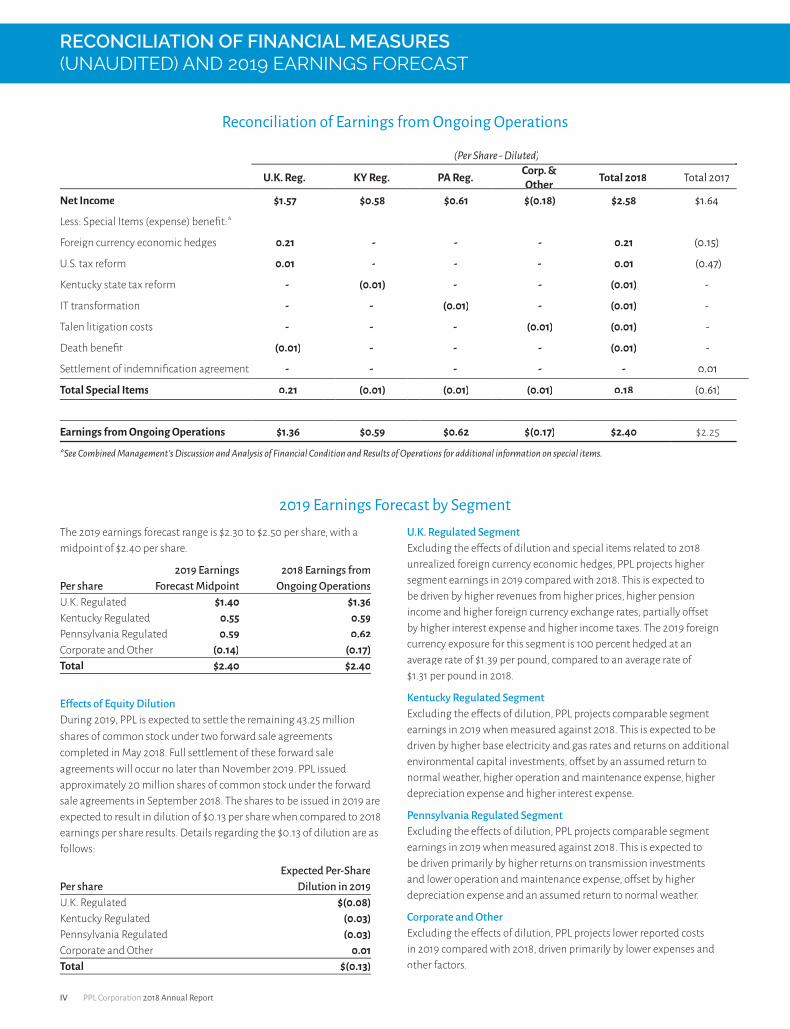
The 2019 earnings forecast range is $2.30 to $2.50 per share, with a midpoint of $2.40 per share.
2019 Earnings 2018 Earnings fromPer share Forecast Midpoint Ongoing OperationsU.K. Regulated $1.40 $1.36Kentucky Regulated 0.55 0.59Pennsylvania Regulated 0.59 0.62Corporate and Other (0.14) (0.17)Total $2.40 $2.40
Effects of Equity Dilution During 2019, PPL is expected to settle the remaining 43.25 million shares of common stock under two forward sale agreementscompleted in May 2018. Full settlement of these forward saleagreements will occur no later than November 2019. PPL issuedapproximately 20 million shares of common stock under the forwardsale agreements in September 2018. The shares to be issued in 2019 are expected to result in dilution of $0.13 per share when compared to 2018 earnings per share results. Details regarding the $0.13 of dilution are as follows:
Expected Per-SharePer share Dilution in 2019U.K. Regulated $(0.08)Kentucky Regulated (0.03)Pennsylvania Regulated (0.03)Corporate and Other 0.01Total $(0.13)
U.K. Regulated Segment Excluding the effects of dilution and special items related to 2018 unrealized foreign currency economic hedges, PPL projects higher segment earnings in 2019 compared with 2018. This is expected tobe driven by higher revenues from higher prices, higher pension income and higher foreign currency exchange rates, partially offsetby higher interest expense and higher income taxes. The 2019 foreign currency exposure for this segment is 100 percent hedged at an average rate of $1.39 per pound, compared to an average rate of $1.31 per pound in 2018.
Kentucky Regulated Segment Excluding the effects of dilution, PPL projects comparable segment earnings in 2019 when measured against 2018. This is expected to be driven by higher base electricity and gas rates and returns on additionalenvironmental capital investments, offset by an assumed return tonormal weather, higher operation and maintenance expense, higher depreciation expense and higher interest expense.
Pennsylvania Regulated Segment Excluding the effects of dilution, PPL projects comparable segment earnings in 2019 when measured against 2018. This is expected to be driven primarily by higher returns on transmission investmentsand lower operation and maintenance expense, offset by higher depreciation expense and an assumed return to normal weather.
Corporate and Other Excluding the effects of dilution, PPL projects lower reported costs in 2019 compared with 2018, driven primarily by lower expenses and other factors.
2019 Earnings Forecast by Segment
Reconciliation of Earnings from Ongoing Operations
(Per Share - Diluted)
U.K. Reg. KY Reg. PA Reg. Corp. &OtherOther Total 2018 Total 2017
Net Income $1.57 $0.58 $0.61 $(0.18) $2.58 $1.64
Less: Special Items (expense) benefit:*
Foreign currency economic hedges 0.21 - - - 0.21 (0.15)
U.S. tax reform 0.01 - - - 0.01 (0.47)
Kentucky state tax reform - (0.01) - - (0.01) -
IT transformation - - (0.01) - (0.01) -
Talen litigation costs - - - (0.01) (0.01) -
Death benefit (0.01) - - - (0.01) -
Settlement of indemnification agreement - - - - - 0.01
Total Special Items 0.21 (0.01) (0.01) (0.01) 0.18 (0.61)
Earnings from Ongoing Operations $1.36 $0.59 $0.62 $(0.17) $2.40 $2.25
*See Combined Management's Discussion and Analysis of Financial Condition and Results of Operations for additional information on special items.
IV PPL Corporation 2018 Annual Report

FINANCIAL TABLE OF CONTENTS
Business ........................................................................................................................................................... 1
Selected Financial and Operating Data ....................................................................................................... 20
Combined Management's Discussion and Analysis of Financial Condition and
Results of Operations .................................................................................................................................... 21
Reports of Independent Registered Public Accounting Firm .......................................................................70
Consolidated Statements of Income............................................................................................................. 73
Consolidated Statements of Comprehensive Income ..................................................................................74
Consolidated Statements of Cash Flows....................................................................................................... 75
Consolidated Balance Sheets ........................................................................................................................ 76
Consolidated Statements of Equity...............................................................................................................78
Combined Notes to Financial Statements
Note 1 Summary of Significant Accounting Policies ........................................................................ 79
Note 2 Segment and Related Information ........................................................................................ 93
Note 3 Revenue from Contracts with Customers ..............................................................................96
Note 4 Preferred Securities ................................................................................................................99
Note 5 Earnings Per Share..................................................................................................................99
Note 6 Income and Other Taxes ...................................................................................................... 101
Note 7 Utility Rate Regulation..........................................................................................................114
Note 8 Financing Activities .............................................................................................................. 124
Note 9 Leases ................................................................................................................................... 130
Note 10 Stock-Based Compensation .................................................................................................. 131
Note 11 Retirement and Postemployment Benefits ..........................................................................135
Note 12 Jointly Owned Facilities......................................................................................................... 151
Note 13 Commitments and Contingencies........................................................................................152
Note 14 Related Party Transactions................................................................................................... 163
Note 15 Other Income (Expense) - net .............................................................................................. 164
Note 16 Fair Value Measurements..................................................................................................... 165
Note 17 Derivative Instruments and Hedging Activities .................................................................. 167
Note 18 Goodwill and Other Intangible Assets................................................................................. 174
Note 19 Asset Retirement Obligations...............................................................................................177
Note 20 Accumulated Other Comprehensive Income (Loss).............................................................177
Note 21 New Accounting Guidance Pending Adoption ................................................................... 179
Quarterly Financial and Dividend Data (Unaudited) ................................................................................. 182
Comparison of 5-Year Cumulative Total Return.......................................................................................... 183
Management's Report on Internal Control over Financial Reporting ........................................................ 183
Glossary of Terms and Abbreviations.......................................................................................................... 184

Form 10-K for the year ended Dec. 31, 2018, was filed by PPL Corporation with the U.S. Securities and Exchange Commission on February 14, 2019. Please visit PPL Corporation's website, www.pplweb.com/investors, for the full text.

1
BUSINESS
General
(All Registrants)
PPL Corporation, headquartered in Allentown, Pennsylvania, is a utility holding company, incorporated in 1994, in connectionwith the deregulation of electricity generation in Pennsylvania, to serve as the parent company to the regulated utility, PPL Electric, and to generation and other unregulated business activities. PPL Electric was founded in 1920 as Pennsylvania Power & Light Company. PPL, through its regulated utility subsidiaries, delivers electricity tod customers in the U.K., Pennsylvania,Kentucky and Virginia; delivers natural gas to customers in Kentucky; and generates electricity from power plants in Kentucky.
PPL's principal subsidiaries at December 31, 2018 are shown below (* denotes a Registrant).
PPL Global is not a registrant. Unaudited annual consolidated financial statements for the U.K. Regulated Segment are furnished on a Form 8-K with the SEC.
In addition to PPL, the other Registrants included in this report are as follows.
PPL Electric Utilities Corporation, headquartered in Allentown, Pennsylvania, is a wholly owned subsidiary of PPL organized ain Pennsylvania in 1920 and a regulated public utility that is an electricity transmission and distribution service provider ineastern and central Pennsylvania. PPL Electric is subject to regulation as a public utility by the PUC, and certain of itstransmission activities are subject to the jurisdiction of the FERC under the Federal Power Act. PPL Electric delivers electricity in its Pennsylvania service area and provides electricity supply to retail customers in that area as a PLR under the Customer Choice Act.
LG&E and KU Energy LLC, headquartered in Louisville, Kentucky, is a wholly owned subsidiary of PPL and a holding company that owns regulated utility operations through its subsidiaries, LG&E and KU, whichu constitute substantially all of LKE's assets. LG&E and KU are engaged in the generation, transmission, distribution and sale of electricity. LG&E also engages in the distribution and sale of natural gas. LG&E and KU maintain separate corporate identities and serve customers in Kentucky under their respective names. KU also serves customers in Virginia under the Old Dominion Power name. LKE, formed in 2003, is the successor to a Kentucky entity incorporated in 1989.

2
Louisville Gas and Electric Company, headquartered in Louisville, Kentucky, is a wholly owned subsidiary of LKE and a regulated utility engaged in the generation, transmission, distribution and sale of electricity and distribution and sale of natural aagas in Kentucky. LG&E is subject to regulation as a public utility by the KPSC, and certain of its transmission activities aresubject to the jurisdiction of the FERC under the Federal Power Act. LG&E was incorporated in 1913.
Kentucky Utilities Company, headquartered in Lexington, Kentucky, is a wholly owned subsidiary of LKE and a regulated wutility engaged in the generation, transmission, distribution and sale of electricity in Kentucky and Virginia. KU is subject toregulation as a public utility by the KPSC and the VSCC, and certain of its transmission and wholesale power activities aresubject to the jurisdiction of the FERC under the Federal Power Act. KU serves its Kentucky customers under the KU nameand its Virginia customers under the Old Dominion Power name. KU was incorporated in Kentucky in 1912 and in Virginia in1991.
Segment Informationg
(PPL)
PPL is organized into three reportable segments as depicted in the chart above: U.K. Regud lated, Kentucky Regulated, and Pennsylvania Regulated. The U.K. Regulated segment has no related subsidiary Registrants. PPL's other reportable segments'results primarily represent the results of its related subsidiary Registrants, except that the reportable segments are also allf ocated certain corporate level financing costs that are not included in the results of the applicable subsidiary Registrants. PPL also hascorporate and other costs which primarily include financing costs incurred at the corporate level that have not been allocated or assigned to the segments, as well as certain other unallocated costs. The financial results of Safari Energy are also reported within Corporate and Other.
A comparison of PPL's three regulated segments is shown below.
Kentucky PennsylvaniaU.K. Regulated Regulated Regulated
For the year ended December 31, 2018: Operating Revenues (in billions) $ 2.3 $ 3.2 $ 2.3Net Income (in millions) $ 1,114 $ 411 $ 431Electricity delivered (GWh) 74,181 33,650 37,497
At December 31, 2018: Regulatory Asset Base (in billions) (a) $ 9.7 $ 9.8 $ 6.9Service area (in square miles) 21,600 9,400 10,000End-users (in millions) 7.9 1.3 1.4
(a) Represents RAV for U.K. Regulated, capitalization for Kentucky Regulated and rate base for Pennsylvania Regulated.
See Note 2 to the Financial Statements for additional financial information about the segments.
(PPL Electric, LKE, LG&E and KU)
PPL Electric has two operating segments that are aggregated into a single reportable segment. LKE, LG&E and KU are individually single operating and reportable segments.
• U.K. Regulated Segment (PPL)g g
Consists of PPL Global, which primarily includes WPD's regulated electricity distributioe n operations, the results of hedging the translation of WPD's earnings from British pound sterling into U.S. dollars, and certain costs, such asU.S. income taxes, administrative costs and acquisition-related d financing costs.
WPD operates four of the 14 Ofgem regulated DNOs providing electricity service in the U.K. through indirect wholly owned subsidiaries: WPD (South West), WPD (South Wales), WPD (East Midlands) and WPD (West Midlands). The number of network customers (end-users) served by WPD totals 7.9 million across 21,600 square miles in south Wales and southwest and central England.
Revenues, in millions, for the years ended December 31 are shown below.
3
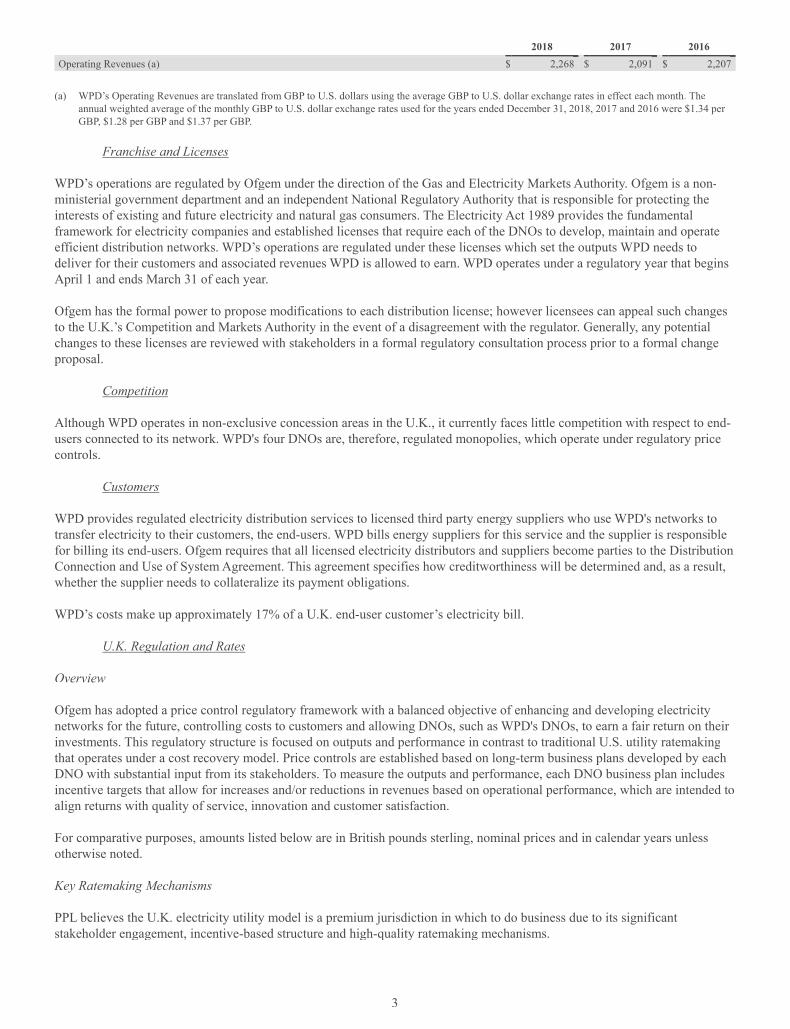
2018 2017 2016 Operating Revenues (a) $ 2,268 $ 2,091 $ 2,207
(a) WPD’s Operating Revenues are translated from GBP to U.S. dollars using the average GBP to U.S. dollar exchange rates in effect each month. The annual weighted average of the monthly GBP to U.S. dollar exchange rates used for the years ended December 31, 2018, 2017 and 2016 were $1.34 per GBP, $1.28 per GBP and $1.37 per GBP.
Franchise and Licenses
WPD’s operations are regulated by Ofgem under the direction of the Gas and Electricity Markets Authority. Ofgem is a non-fministerial government department and an independent National Regulatory Authority that is responsible for protecting the interests of existing and future electricity and natural gas consumers. The Electricity Act 1989 provides the fundamentalframework for electricity companies and established licenses that require each of the DNOs to develop, maintain and operateefficient distribution networks. WPD’s operations are regulated under these licenses which set the outputs WPD needs todeliver for their customers and associated revenues WPD is allowed to earn. WPD operates under a regulatory year that beginsApril 1 and ends March 31 of each year.
Ofgem has the formal power to propose modifications to each distribution license; however licensees can appeal such changes to the U.K.’s Competition and Markets Authority in the event of a disagreement with the regulator. Generally, any potential changes to these licenses are reviewed with stakeholders in a formal regulatory consultation process prior to a formal change proposal.
Competition p
Although WPD operates in non-exclusive concession areas in the U.K., it currently faces little competition with respect to end-users connected to its network. WPD's four DNOs are, therefore, regulated monopolies, which operate under regulatory price controls.
Customers
WPD provides regulated electricity distribution services to licensed third party energy suppliers who use WPD's networks to ytransfer electricity to their customers, the end-users. WPD bills energy suppliers for this service and the supplier is responsible for billing its end-users. Ofgem requires that all licensed electricity distributors and suppliers become parties to the DistributionConnection and Use of System Agreement. This agreement specifies how creditworthiness will be determined and, as a result, whether the supplier needs to collateralize its payment obligations.
WPD’s costs make up approximately 17% of a U.K. end-user customer’s electricity bill.
U.K. Regulation and Rates g
Overview
Ofgem has adopted a price control regulatory framework with a balanced objective of enhancing and developing electricity networks for the future, controlling costs to customers and allowing DNOs, such as WPD's DNOs, to earn a fair return on their investments. This regulatory structure is focused on outputs and performance in contrast to traditional U.S. utility ratemakingttthat operates under a cost recovery model. Price controls are established based on long-term business plans developed by eachDNO with substantial input from its stakeholders. To measure the outputs and performance, each DNO business plan includes incentive targets that allow for increases and/or reductions in revenues based on operational performance, which are intended to align returns with quality of service, innovation and customer satisfaction.
For comparative purposes, amounts listed below are in British pounds sterling, nominal prices and in calendar years unlessotherwise noted.
Key Ratemaking Mechanisms
PPL believes the U.K. electricity utility model is a premium jurisdiction in which to do business due to its significant stakeholder engagement, incentive-based structure and high-quality ratemaking mechanisms. tt

4
Current Price Control: RIIO-ED1
WPD is currently operating under an eight-year price control period called RIIO-ED1, which commenced for electricity distribution companies on April 1, 2015. The regulatory framework is based on an updated approach for sustainable network kregulation known as the "RIIO" model where Revenue = Incentives + Innovation + Outputs.
The RIIO framework allowed for an MPR. On April 30, 2018, Ofgem announced its decision not to conduct an MPR of theffRIIO-ED1 price control period.
In coordination with numerous stakeholders, WPD developed its business plans for RIIO-ED1 building off its historical track record and long-term strategy of delivering industry-leading levels of performance at an efficient level of cost. As a result, all four of WPD’s DNOs' business plans were accepted by Ofgem as "well justified" and were "fast-tracked" ahead of all of the other DNOs. WPD's DNOs were rewarded for being fast-tracked with preferential financial incentives, a higher return onequity and higher cost savings retention under their business plans as discussed further below. However, an unintended consequence of being fast-tracked resulted in WPD being disadvantaged from a cost of debt recovery stanf dpoint as further discussed within “(2) Real Return on capital from RAV” below.VV
WPD's combined RIIO-ED1 business plans as accepted by Ofgem included funding for total expenditures of approximately£12.8 billion (nominal) over the eight-year period, broken down as follows:
• Totex - £8.5 billion (£6.8 billion recovered as additions to RAV over time ("Slow pot"); £1.7 billionrecovered in the year spent in the plan ("Fast pot"));
• Pension deficit funding - £1.2 billion;• Cost of debt recovery - £1.0 billion;• Pass Through Charges - £1.6 billion (Property taxes, Ofgem fees and National Grid transmissions charges);
and • Corporate income taxes recovery - £0.5 billion.
The chart below illustrates the building blocks of allowed revenue and GAAP net income for the U.K. Regulated Segment. Therevenue components are shown in either 2012/13 prices or nominal prices, consistent with the formulas Ofgem established for RIIO-ED1. The reference numbers included in each block correspond with the descriptions that follow.
(a) Primarily pension deficit funding, pass through costs, profiling adjustments and legacy price control adjustments.(b) Primarily pass through true-ups and £5 per residential customer reduction completed in the regulatory year ended March 31, 2017. (c) Reference Form 8-K filed February 14, 2019 for U.K. Regulated Segment GAAP Statement of Income component values.(d) Includes the service cost component of GAAP pension costs/income. See “Defined Benefits, Net periodic defined benefit costs (credits)” in Note 11
to the Financial Statements. (e) Primarily property taxes.(f) Primarily includes the non-service cost (credit) components of GAAP pension costs/income and gains and losses on foreign currency hedges.(g) Includes WPD interest and $32 million of allocated interest expense to finance the acquisition of WPD Midlands.(h) GAAP income taxes represent an effective tax rate of 17% for 2018, 19% for 2017, 16% for 2016 and approximately 17% going forward.

5
(1) Base Revenue
The base revenue that a DNO can collect in each year of the current price control period is the sum of the following which are tdiscussed further below:
• a return on capital from RAV;• a return of capital from RAV (i.e., depreciation);• the Fast pot recovery, see discussion “(4) Expenditure efficiency mechanisms” below; • an allowance for cash taxes paid less a potential reduction for tax benefits from excess leverage if a DNO is
levered more than 65% Debt/RAV; • pension deficit funding;• certain pass-through costs over which the DNO has no control; • profiling adjustments, see discussion “(6) Other revenue included in base revenue” below;• certain legacy price control adjustments from preceding price control periods, including the information
quality incentive (also known as the rolling RAV incentive); and • fast-track incentive - because WPD's four DNOs were fast-tracked through the price control review process
for RIIO-ED1, their base revenue also includes the fast-track incentive.
(2) Real Return on capital from RAV
Real-time returns on cost of regulated equity (real) - Ofgem establishes an allowed return on regulated equity that DNOs earn g q y ( )in their base business plan revenues as a consideration of the financial parameters for each RIIO-ED1 business plan. For WPD,the base cost of equity collected in revenues was set at 6.4% (real). Base equity returns exclude inflation adjustments, allowances for incentive rewards/penalties and over/under collections driven by cost efficiencies. WPD’s base equity returnsffare calculated using an equity ratio of 35% of RAV at the DNO. The equity ratio was reviewed and set during the RIIO-ED1business plan process taking various stakeholder impacts into consideration such as costs to consumers, credit ratings and investor needs. The amounts of base real equity return for 2018, 2017 and 2016 were £160 million, £151 million and £144million.
Indexed cost of debt recovery (real) - As part of WPD’s fast-track agreement with Ofgem for RIIO-ED1, WPD collects iny ( )revenues an assumed real cost of debt that is derived from a historical 10-year bond index (iBoxx) and adjusted annually for inflation. This calculated real cost of debt is then applied to 65% of RAV at the DNOs to determine the cost of debt revenue recovery. The cost of debt was set at 2.55% in the original "well justified" business plans. The recovery amounts are trued up annually as a component of the MOD true-up mechanism described within "(9) MOD and Inflation True-Up (TRU)" below.
As discussed above, WPD’s cost of debt revenue allowances are derived from using a rolling 10-year trailing average of historical 10-year bond index (iBoxx); however, the cost of debt revenue allowances for all slow track companies are derived ausing an extending trailing average of the index. Under this approach, the trailing average period used is progressively extended from 10 to 20 years and consequently short-term fluctuations in the interesq t rate have a less pronounced effect on theregulatory cost of debt applied. Therefore, WPD’s cost of debt recovery is significantly lower than it would have been had it been derived under the approach used for the slow-track companies.
Over the 8-year RIIO-ED1 period WPD is expected to under-recover its cost of debt at the four DNOs, based upon the latest inflation assumptions and projected 10-year iBoxx bond indices rates, by approximately £175 million primarily driven by the previously discussed differing cost of debt recovery calculations. Under the terms of the fast track process, fast trackedcompanies were not supposed to be disadvantaged financially to slow track companies. It is uncertain, however, at this time, ifWPD will be able to recover any of this under-recovery in the next price control period, RIIO-ED2, beginning April 1, 2023.
Interest costs relating to long-term debt issued at WPD’s holding companies are not recovered in revenues and for 2018, 2017and 2016 were approximately £46 million, £49 million and £54 million.
(3) Recovery of depreciation in revenues - Recovery of depreciation in regulatory revenues is one of the key mechanismsOfgem uses to support financeable business plans that provide incentives to attract the continued substantial investment required in the U.K. Differences between GAAP and regulatory depreciation exist primarily due to differing assumptions onasset lives and because RAV is adjusted for inflation using RPI.
Compared to asset lives established for GAAP, asset lives established for ratemaking are set by Ofgem based on economic liveswhich results in improved near-term revenues and cash flows for DNOs during investment cycles. Under U.K. regulation prior to RIIO-ED1, electric distribution assets were depreciated on a 20-year asset life for the purpose of setting revenues. After

6
review and consultation, Ofgem decided to use 45-year asset lives for RAV additions after April 1, 2015, with transitional arrangements available for DNOs that fully demonstrated a need to ensure a financeable plan. WPD adopted a transition that has a linear increase in asset lives from 20 to 45 years for additions to RAV in each year of RIIO-ED1 (with additions averaginga life of approximately 35 years over this period), which adds support to its credit metrics. RAV additions prior to March 31, uu2015 continue to be recovered in revenues over 20 years.
The asset lives used to determine depreciation expense for GAAP purposes are not the same as those used for the depreciationof the RAV in setting revenues and, as such, vary by asset type and are based on the expected useful lives of the assets. Effective January 1, 2015, after completing a review of the useful lives of its distribution network assets, WPD set the weightf ed average useful lives to 69 years for GAAP depreciation expense.
Because Ofgem uses a real cost of capital, the RAV and recovery of depreciation are adjusted for inflation using RPI. The inflation revenues collected in this line item help recover the cost of equity and debt returns on a "nominal" basis, compared to the "real" rates used to set the return component of base revenues.
This regulatory construct, in combination with the different assets lives used for ratemaking and GAAP, results in amounts collected by WPD as recovery of depreciation in revenues being significantly higher than the amounts WPD recorded for depreciation expense under GAAP. For 2018, 2017 and 2016, this difference was £444 million, £424 million and £415 million (pre-tax) and positively impacted net income. The difference is expected to continue in the £400 million to £450 million (pre-tax) range at least through 2022 (the last full calendar year of RIIO-ED1), assuming RPI of approximately 3.0% per year from 2019 through 2022 and based on expected RAV additions of approximately £800 million per year to prepare the distributionsystem for future U.K. energy objectives while maintaining premier levels of reliability and customer service.
(4) Expenditure efficiency mechanisms - Ofgem introduced the concept of Totex in RIIO to ensure all DNOs face equal incentives in choosing between operating and capital solutions. Totex is split between immediate recovery (called "Fast pot") and deferred recovery as an addition to the RAV (called "Slow pot"). The ratio of Slow pot to Fast pot was determined by each DNO in their business plan development. WPD established a Totex split of 80% Slow pot and 20% Fast pot for RIIO-ED1 tobalance maximizing RAV growth with immediate cost recovery to support investment grade credit ratings. Comparatively,other DNOs on average used a ratio of approximately 70% Slow pot and 30% Fast pot for RIIO-ED1.
Ofgem also allows a Totex Incentive Mechanism that is intended to reward DNOs for cost efficiency. WPD's DNOs are able toretain 70% of any amounts not spent against its RIIO-ED1 plan and bear 70% of any over-spends. Any amounts to be returned to customers are trued up in the AIP discussed below. n
Because Fast pot cost recovery represents 20% of Totex expenditures and certain other costs are recovered in other components of revenue, Fast pot will not equal operation and maintenance expenses recorded for GAAP purposes.
(5) Income Tax Allowance - For price control purposes, WPD collects income tax based on Ofgem’s notional tax charge, which will not equal the amount of income tax expense recorded for GAAP purposes. The following table shows the amount of taxes collected in revenues and recorded under GAAP.
2018 2017 2016 Taxes collected in revenues £ 58 £ 57 £ 53Taxes recorded under GAAP 156 139 119
(6) Other revenue included in base revenue - Other revenue included in base revenue primarily consists of pension deficit funding, pass through costs, profiling adjustments and legacy price control adjustments.
Recovery of annual (normal) pension cost and pension deficit funding - Ofgem allows DNOs to recover annual (normal)y ( ) p p gpension costs through the Totex allocation, split between the previously described Fast pot (immediate recovery) and Slow pot recovery (as an addition to RAV). The amount of normal pension cost is computed by the pension trustees, using assumptions ythat differ from those used in calculating pension costs/income under GAAP. In addition, the timing of the revenue collectionmay not match the actual pension payment schedule, resulting in a timing difference of cash flows.
In addition, WPD recovers approximately 80% of pension deficit funding for certain of WPD's defined benefit pension plans in conjunction with actual costs similar to the Fast pot mechanism. r The pension deficit is determined by the pension trustees on atriennial basis in accordance with their funding requirements. Pension deficit fundinguu recovered in revenues was £147 million,£142 million and £139 million in 2018, 2017 and 2016. WPD expects similar amounts to be collected in revenues through

7
March 31, 2021, but cannot predict amounts that will be collected in revenues beyond then as the plans are approaching a fully funded status. The next triennial pension review will commence in March 2019 and is expected to conclude by the end of 2020. a
See Note 11 to the Financial Statements for additional information on pension costs/income recognized under GAAP.
Recovery of pass through costs - WPD recovers certain pass-through costs over which the DNO has no control such as property y p gtaxes, National Grid transmission charges and Ofgem fees. Although these items are intended to be pass-through charges therecould be timing differences, primarily related to property taxes, as to when amounts are collected in revenues and whenamounts are expensed in the Statements of Income. WPD over-collected property taxes by £38 million, £19 million and £8 million in 2018, 2017 and 2016. WPD expects to continue to over-recover property taxes until the end of RIIO-ED1. Amounts under-or over-recovered in revenues in a regulatory year are trued up through revenues two regulatory years later.
Profiling adjustments - Ofgem permitted DNOs the flexibility to make profiling adjustments to their base revenues within their g jbusiness plans. These adjustments do not affect the total base revenue in real terms over the eight-year price control period, but change the year in which the revenue is collected. In the first year of RIIO-ED1, WPD’s base revenue decreased by 11.8% compared to the final year of the prior price control period (DPCR5), primarily due to a change in profiling methodology and a lower weighted-average cost of capital. Base revenue then increases by approximately 2.5% per annum before inflation for regulatory years up to March 31, 2019 and by approximately 1% per annum before inflation for each regulatory year thereafter for the remainder of RIIO-ED1.
(7) Incentives for developing high-quality business plans (known as fast-tracking) - For RIIO-ED1, Ofgem incentivizedDNOs with certain financial rewards to develop "well justified" business plans that drive value to customers. WPD wasawarded the following incentives for being fast-tracked by Ofgem:
• an annual fast-track revenue incentive worth 2.5% of Totex (approximately £25 million annually for WPD);• a real cost of equity rate of 6.4% compared to 6.0% for slow-tracked DNOs; and, • cost savings retention was established at 70% for WPD compared to approximately 55% for slow-tracked
DNOs.
(8) Allowed Revenue - Allowed revenue is the amount that a DNO can collect from its customers in order to fund itsinvestment requirements.
Base revenues are adjusted annually during RIIO-ED1 to arrive at allowed revenues. These adjustments are discussed in sections (9) through (13) below.
(9) MOD and Inflation True-Up (TRU)
MOD - RIIO-ED1 includes an AIP that allows future base revenues, agreed with the regulator as part of the price control review, to be updated during the price control period for financial adjustments includitt ng taxes, pensions, cost of debt, legacyprice control adjustments from preceding price control periods and adjustments relating to actual and allowed total expendituretogether with the Totex Incentive Mechanism (TIM). The AIP calculates an incremental change to base revenue, known as the "MOD" adjustment.
• The MOD provided by Ofgem in November 2016 included the TIM for the 2015/16 regulatory year, as wellas the cost of debt calculation based on the 10-year trailing average to October r 2016. This MOD of £12million reduced base revenue in calendar years 2017 and 2018 by £8 million and £4 million.
• The MOD provided by Ofgem in November 2017 for the 2016/17 regulatory year is a £39 million reductionto revenue and reduced base revenue in calendar year 2018 by £26 million and will reduce base revenue in calendar year 2019 by £13 million.
• The MOD provided by Ofgem in November 2018 for the 2017/18 regulatory year is a £42 million reductionto revenue and will reduce base revenue in calendar years 2019 and 2020 by £28 million and £14 million.
• The projected MOD for the 2018/19 regulatory year is a £87 million reduction to revenue and is expected to reduce base revenue in calendar years 2020 and 2021 by £58 million and £29 million.
TRU - As discussed below in "(10) Inflation adjusted, multi-year rate cycle," the base revenue for the RIIO-ED1 period was set based on 2012/13 prices. Therefore an inflation factor as determined by forecasted RPI, provided by HM Treasury, is applied to base revenue. Forecasted RPI is trued up to actuals and affects future base revenue two regulatory years later. This revenue change is called the "TRU" adjustment.
8
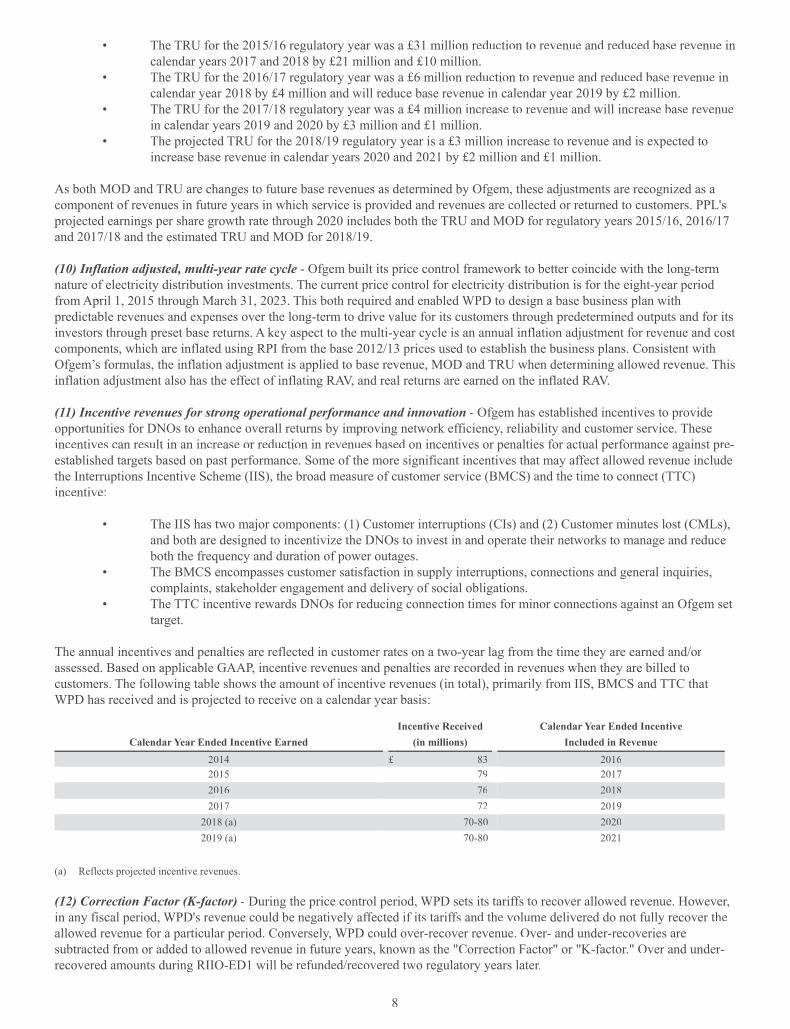
• The TRU for the 2015/16 regulatory year was a £31 million reduction to revenue and reduced base revenue in calendar years 2017 and 2018 by £21 million and £10 million.
• The TRU for the 2016/17 regulatory year was a £6 million reduction to revenue and reduced base revenue in calendar year 2018 by £4 million and will reduce base revenue in calendar year 2019 by £2 million.
• The TRU for the 2017/18 regulatory year was a £4 million increase to revenue and will increase base revenuein calendar years 2019 and 2020 by £3 million and £1 million.
• The projected TRU for the 2018/19 regulatory year is a £3 million increase to revenue and is expected toincrease base revenue in calendar years 2020 and 2021 by £2 million and £1 million.
As both MOD and TRU are changes to future base revenues as determined by Ofgem, these adjustments are recognized as a component of revenues in future years in which service is provided and revenues are collected or returned to customers. PPL'sprojected earnings per share growth rate through 2020 includes both the TRU and MOD for regulatory years 2015/16, 2016/17and 2017/18 and the estimated TRU and MOD for 2018/19.
(10) Inflation adjusted, multi-year rate cycle - Ofgem built its price control framework e to better coincide with the long-term nature of electricity distribution investments. The current price control for electricity distribution is for the eight-year period from April 1, 2015 through March 31, 2023. This both required and enabled WPD to design a base business plan withpredictable revenues and expenses over the long-term to drive value for its customers through predetermined outputs and for itsinvestors through preset base returns. A key aspect to the multi-year cycle is an annual inflation adjustment for revenue and cost components, which are inflated using RPI from the base 2012/13 prices used to establish the business plans. Consistent withOfgem’s formulas, the inflation adjustment is applied to base revenue, MOD and TRU when determining allowed revenue. Thisinflation adjustment also has the effect of inflating RAV, and real returns are earned on the inflated RAV.
(11) Incentive revenues for strong operational performance and innovation - Ofgem has established incentives to provideopportunities for DNOs to enhance overall returns by improving network efficiency, reliability and customer service. Theseincentives can result in an increase or reduction in revenues based on incentives or penalties for actual performance against pre-established targets based on past performance. Some of the more significant incentives that may affect allowed revenue includethe Interruptions Incentive Scheme (IIS), the broad measure of customer service (BMCS) and the time to connect (TTC)incentive:
• The IIS has two major components: (1) Customer interruptions (CIs) and (2) Customer minutes lost (CMLs),rrand both are designed to incentivize the DNOs to invest in and operate their networks to manage and reduceboth the frequency and duration of power outages.
• The BMCS encompasses customer satisfaction in supply interruptions, connections and general inquiries,complaints, stakeholder engagement and delivery of social obligations.
• The TTC incentive rewards DNOs for reducing connection times for minor connections against an Ofgem set target.
The annual incentives and penalties are reflected in customer rates on a two-year lag from the time they are earned and/or assessed. Based on applicable GAAP, incentive revenues and penalties are recorded in revenues when they are billed to customers. The following table shows the amount of incentive revenues (in total), primarily from IIS, BMCS and TTC that WPD has received and is projected to receive on a calendar year basis:
Incentive Received Calendar Year Ended IncentiveCalendar Year Ended Incentive Earned (in millions) Included in Revenue
2014 £ 83 2016 2015 79 2017 2016 76 2018 2017 72 2019
2018 (a) 70-80 2020 2019 (a) 70-80 2021
(a) Reflects projected incentive revenues.
(12) Correction Factor (K-factor) - During the price control period, WPD sets its tariffs to recover allowed revenue. However, in any fiscal period, WPD's revenue could be negatively affected if its tariffs and the volumed delivered do not fully recover the allowed revenue for a particular period. Conversely, WPD could over-recover revenue. Over- and under-recoveries aresubtracted from or added to allowed revenue in future years, known as the "Correction Factor" or "K-factor." Over and under-recovered amounts during RIIO-ED1 will be refunded/recovered two regulatory years later.

9
• The K-factor for the 2015/16 regulatory year was a £4 million under-recovery and increased allowed revenuein calendar years 2017 and 2018 by £3 million and £1 million.
• The K-factor for the 2016/17 regulatory year was a £23 million over-recovery and reduced allowed revenuein calendar year 2018 by £15 million and will reduce allowed revenue in calendar year 2019 by £8 million.
• The K-factor for the 2017/18 regulatory year was a £3 million over-recovery and will reduce allowed revenuein calendar years 2019 and 2020 by £2 million and £1 million.
• The projected K-factor for the 2018/19 regulatory year is a £31 million over-recovery and is expected to reduce allowed revenue in calendar years 2020 and 2021 by £21 million and £10 million.
Historically, tariffs have been set a minimum of three months prior to the beginning of the regulatory year (April 1). InFebruary 2015, Ofgem determined that, beginning with the 2017/18 regulatory year, tariffs would be established a minimum of fifteen months in advance. Therefore, in December 2015, WPD was required to establish tariffs for the 2016/17 and 2017/18regulatory years. This change will potentially increase volatility in future revenue forecasts due to the need to forecast components of allowed revenue including MOD, TRU, K-factor and incentive revenues.
(13) Other Allowed Revenue - Other Allowed Revenue primarily consists of pass through true-ups and £5 per residential customer reduction. For a discussion on property tax true-ups, see recovery of rr pass through costs in "(6) Other revenueincluded in base revenue" above.
In the 2016/17 regulatory year, WPD recovered a £5 per residential network customer reduction given through reduced tariffs in 2014/15. As a result, revenues were positively affected in calendar years 2017 and 2016 by £13 million and £25 million.
(14) GAAP Operating Revenue - Operating revenue under GAAP primarily consise ts of allowed revenue that has been collected in the calendar year converted to U.S. dollars. It also includes miscellaneous revenue primarily from engineering recharge workand ancillary activity revenue. Engineering recharge is work performed for a third party by WPD which is not for general network maintenance or to increase reliability. Examples are diversions and running new lines and equipment for a new housing complex. Ancillary activity revenue includes revenue primarily from WPD’s Telecoms and Property companies. For additional information on ancillary activity revenue, see footnote c in "Combined Management’s Discussion and Analysis of Financial Conditions and Results of Operation - Reconciliation of Adjusted Gross Margins." The amounts of miscellaneousrevenue for 2018, 2017 and 2016 were £115 million, £90 million and £84 million. The margin or profit on these activities; however, was not significant.
(15) Currency Hedging - Earnings generated by PPL's U.K. subsidiaries areg subject to foreign currency translation risk. Due to the significant earnings contributed from WPD, PPL enters into foreign currency contracts to economically hedge the value of the GBP versus the U.S. dollar. These hedges do not receive hedge accounting treatment under GAAP. See "Overview-Financial and Operational Developments - U.K. Membership in European Union" in "Combined Management's Discussion and Analysis of Financial Condition and Results of Operations" for a discussion of U.K. earnings hedging activity.
GAAP Accounting implications:
As the regulatory model in the U.K. is incentive based rather than a cost recovery model, WPD is not subject to accounting for the effects of certain types of regulation as prescribed by GAAP. Therefore, the accounting treatment for the differences in the amounts collected in revenues and the amounts recorded for expenses related to depreciation, pensions, cost of debt and income taxes, and the adjustments to base revenue and/or allowed revenue are evaluated primarily based on revenue recognition guidance.
See "Revenue Recognition" in Note 1 to the Financial Statements for additional information.
RIIO-2 Framework
On March 7, 2018, Ofgem issued its consultation document on the RIIO-2 framework, which covers all U.K. gas and electricity transmission and distribution price controls. The current electricity distribution price control, RIIO-ED1, continues through March 31, 2023 and will not be impacted by this RIIO-2 consultation process. Ofgem y consulted on a wide range of issues, including cost of debt and equity methodologies, the length of the price control period, indexation mettt hodologies, innovation, stakeholder engagement in the business planning process and performance incentive mechanisms. The purpose of the RIIO-2 framework consultation was to build on lessons learned from the current price controls while supporting low costs toconsumers, improved customer service and reliability, and the U.K.'s continued shift to a low-carbon future. Comments on the RIIO-2 framework were due in May 2018. On July 30, 2018, Ofgem published its decision following its RIIO-2 framework consultation after consideration of comments received. Ofgem confirmed the following points in the decision document:

10
• There will be a five-year default length for the price control period, compared to eight years in the current ttRIIO-ED1 price control.
• There is intent to shift the inflation index used for calculating RAV and allowed returns from RPI to CPIH.Ofgem stated overall, consumers and investors as a whole will be neither better nor worse off in net present value terms as a result of the shift to CPIH and a transition period may be required.
• There will be no change to the existing depreciation policy of using economic asset lives as the basis for depreciating RAV as part of base revenue calculations. WPD is currently transitioning to 45 year asset lives for new additions in RIIO-ED1 based on Ofgem’s extensive review of asset lives in RIIO-ED1.
• Ofgem will retain the option for fast-tracking for electricity distribution comptt anies only. Fast tracking will befurther considered as part of the electricity distribution sector specific consultation.
• A new enhanced engagement model will be introduced which will require distribution companies to set up acustomer engagement group to provide Ofgem with a public report of their views on the companies’ business plans from the perspective of local stakeholders. Ofgem will also establish an independent RIIO-2 challenge group comprised of consumer experts to provide Ofgem with a public report on companies’ business plans.
• Ofgem intends to expand the role of competition for projects that are new, separable and high value. WPD does not currently have any planned projects that would meet the high value threshold.
• A focus of RIIO-2 will be on whole-system outcomes. Ofgem envisions network companies and system operators working together to ensure the energy system as a whole is efficient and delivers best value toconsumers. Ofgem is undertaking further work to clarify the definition of whole-system and the appropriate roles of the network companies in supporting the energy transition.
Ofgem also indicated further work is needed on other price control principlest , including but not limited to, cost of equity, cost of debt, financeability and incentives with decisions on these items expected to be made in the sector specific consultations oroowithin the individual company business plan submissions.
In December 2018, the promulgation of sector specific price controls began with Ofgem publishing its consultation related toits RIIO-2 price controls for the gas distribution, gas transmission and electricity transmission operators that will be effectivefrom April 2021 to March 2026. This current consultation does not apply directly to electricity distribution network operatorsalthough some decisions will be precedent setting. The electricity distribution price control work is scheduled to begin in 2020, at which time Ofgem plans to publish its RIIO-ED2 strategy consultation document.
Although the electricity distribution consultation does not commence until 2020, WPD is engaged in the RIIO-2 process and will be responding to the December 2018 consultation document. PPL cannot predict the outcome of this process or the long-term impact it or the final RIIO-ED2 regulations will have on its financial condition or results of operations.
• Kentucky Regulated Segment (PPL)y g g
Consists of the operations of LKE, which owns and operates regulated public utilities engaged in the generation, transmission, distribution and sale of electricity and distribution and sale of natural gas, representing primarily therractivities of LG&E and KU. In addition, certain acquisition-related financing costs are allocated to the KentuckyRegulated segment.
(PPL, LKE, LG&E and KU)
LG&E and KU, direct subsidiaries of LKE, are engaged in the regulated generation, transmission, distribution and sale of electricity in Kentucky and, in KU's case, also Virginia. LG&E also engages in the distribution and sale of natural gas inKentucky. LG&E provides electric service to approximately 414,000 customers in Louisville and adjacent areas in Kentucky,covering approximately 700 square miles in nine counties and provides natural gas service to approximately 328,000 customersin its electric service area and eight additional counties in Kentucky. KU provides electric service to approximately 527,000customers in 77 counties in central, southeastern and western Kentucky and approximately 28,000 customers in five counties in southwestern Virginia, covering approximately 4,800 non-contiguous square miles. KU also sells wholesale electricity to 10 municipalities in Kentucky under load following contracts.

11
Details of operating revenues, in millions, by customer class for the years ended December 31 are shown below.
2018 2017 2016
Revenue % of
Revenue Revenue% of
Revenue Revenue % of
Revenue LKE Commercial $ 858 27 $ 854 27 $ 834 27Industrial 566 18 603 19 601 19Residential 1,313 41 1,259 40 1,261 40Other (a) 293 9 280 9 288 9Wholesale - municipal 105 3 112 4 116 4Wholesale - other (b) 79 2 48 1 41 1Total $ 3,214 100 $ 3,156 100 $ 3,141 100
(a) Primarily includes revenues from street lighting and other public authorities.(b) Includes wholesale power and transmission revenues.
2018 2017 2016
Revenue % of
Revenue Revenue% of
Revenue Revenue % of
Revenue LG&E Commercial $ 451 30 $ 453 31 $ 442 31Industrial 178 12 187 13 185 13Residential 661 44 637 44 627 44Other (a) 133 9 123 8 135 9Wholesale - other (b) 73 5 53 4 41 3Total $ 1,496 100 $ 1,453 100 $ 1,430 100
(a) Primarily includes revenues from street lighting and other public authorities.(b) Includes wholesale power and transmission revenues. Also includes intercompany power sales and transmission revenues, which are eliminated upon
consolidation at LKE.
2018 2017 2016
Revenue% of
Revenue Revenue % of
Revenue Revenue % of
Revenue KU Commercial $ 407 23 $ 401 23 $ 392 22Industrial 388 22 416 24 416 24Residential 652 37 622 36 634 36Other (a) 160 9 157 9 153 9Wholesale - municipal 105 6 112 6 116 7Wholesale - other (b) 48 3 36 2 38 2Total $ 1,760 100 $ 1,744 100 $ 1,749 100
(a) Primarily includes revenues from street lighting and other public authorities.(b) Includes wholesale power and transmission revenues. Also includes intercompany power sales and transmission revenues, which are eliminated upon
consolidation at LKE.
Franchises and Licenses
LG&E and KU provide electricity delivery service, and LG&E provides natural gas distribution service, in their respectiveservice territories pursuant to certain franchises, licenses, statutory service areas, easements and other rights or permissionsgranted by state legislatures, cities or municipalities or other entities.
Competition p
There are currently no other electric public utilities operating within the electric service areas of LKE. From time to time, bills are introduced into the Kentucky General Assembly which seek to authorize, promote or mandate increased distributed generation, customer choice or other developments. Neither the Kentucky General Assembly nor the KPSC has adopted or approved a plan or timetable for retail electric industry competition in Kentucky. The nature or timing of legislative or regulatory actions, if any, regarding industry restructuring and their impact on LKE, which may be significant, cannot currently

12
be predicted. Virginia, formerly a deregulated jurisdiction, has enacted legislation that implemented a hybrid model of cost-based regulation. KU's operations in Virginia have been and remain regulated.
Alternative energy sources such as electricity, oil, propane and other fuels indirectly impact LG&E's natural gas revenues.Marketers may also compete to sell natural gas to certain large end-users. LG&E's natural gas tariffs include gas price pass-through mechanisms relating to its sale of natural gas as a commodity. Therefore, customer natural gas purchases from alternative suppliers do not generally impact LG&E's profitability. Some large industrial and commercial customers, however, may physically bypass LG&E's facilities and seek delivery service directly from interstate pipelines or other natural gasdistribution systems.
Power Supply pp y
At December 31, 2018, LKE owned, controlled or had a minority ownership interest in generating capacity of 8,017 MW, of which 2,920 MW related to LG&E and 5,097 MW related to KU, in Kentucky, Indiana, and Ohio.
The system capacity of LKE's owned or controlled generation is based upon a number of factors, including the operatingnexperience and physical condition of the units, and may be revised periodically to reflect changes in circumstances.
During 2018, LKE's power plants generated the following amounts of electricity.
GWhFuel Source LKE LG&E KUCoal (a) 28,742 12,446 16,296Gas 6,301 1,584 4,717Hydro 344 191 153Solar 17 7 10Total (b) 35,404 14,228 21,176
(a) Includes 859 GWh of power generated by and purchased from OVEC for LKE, 594 GWh for LG&E and 265 GWh for KU.(b) This generation represents increases for LKE, LG&E and KU of 5.7%, 5% and 6.2% from 2017 output.
The majority of LG&E's and KU's generated electricity was used to supply their retail and KU's municipal customer base. d
LG&E and KU jointly dispatch their generation units with the lowest cost generation used to serve their retail and municipalcustomers. When LG&E has excess generation capacity after serving its own retail customers and its generation cost is lower than that of KU, KU purchases electricity from LG&E and vice versa.
As a result of environmental requirements and energy efficiency measures, KU anticipates retiring two older coal-fired units atthe E.W. Brown plant in 2019 with a combined summer rating capacity of 272 MW.
In 2016, LG&E and KU completed construction activities and placed into commercial operation a 10 MW solar generatingfacility at the E.W. Brown generating site. Additionally, LG&E and KU received approval from the KPSC to develop a 4 MW Solar Share facility to service a Solar Share program. The Solar Share program is an optional, voluntary program that allowscustomers to subscribe capacity in the Solar Share facility. Construction is expected to begin, in 500-kilowatt phases, when subscription is complete. The subscription for the first 500-kilowatt phase was completed in June 2018. Construction of the first section has begun and is expected to be operational in the summer of 2019. LG&E and KU continue to market the program and receive interest from customers for the second 500-kilowatt phase.
Fuel Supply pp y
Coal and natural gas will continue to be the predominant fuel used by LG&E and KU for generation for the foreseeable future.Natural gas used for generation is primarily purchased using contractual arrangements separate from LG&E's natural gasdistribution operations. Natural gas and oil are also used for intermediate and peaking capacity and flame stabilization in coal-fired boilers.
Fuel inventory is maintained at levels estimated to be necessary to avoid operational disruptions at coal-fired generating units. Reliability of coal deliveries can be affected from time to time by a number of factors including fluctuations in demand, coal mine production issues and other supplier or transporter r operating difficulties.
13
LG&E and KU have entered into coal supply agreements with various suppliers for coal deliveries through 2023 and augment their coal supply agreements with spot market purchases, as needed.
For their existing units, LG&E and KU expect for the foreseeable future to purchase most of their coal from western Kentucky, southern Indiana and southern Illinois. LG&E and KU continue to purchase certain quantities of ultra-low sulfur content coal from Wyoming for blending at Trimble County Unit 2. Coal is delivered to the generating plants primarily by barge and rail.
To enhance the reliability of natural gas supply, LG&E and KU have secured firm long-term pipeline transport capacity withcontracts of various durations from 2019 to 2024 on the interstate pipeline serving Cane Run Unit 7. This pipeline also servesthe six simple cycle combustion turbine units located at the Trimble County site as well as four other simple cycle units at the Cane Run and Paddy's Run sites. For the seven simple cycle combustion turbines at the E.W. Brown facility, no firm long-term mpipeline transport capacity has been purchased due to the facility being interconnected to two pipelines and some of the unitshaving dual fuel capability.
LG&E and KU have firm contracts for a portion of the natural gas fuel for Cane Run Unit 7 through December 2020. The bulk of the natural gas fuel remains purchased on the spot market.
(PPL, LKE and LG&E)
Natural Gas Distribution Supplypp y
Five underground natural gas storage fields, with a current working natural gas capacity of approximately 15 billion cubic feet(Bcf), are used in providing natural gas service to LG&E's firm sales customers. Natural gas is stored during the summer season for withdrawal during the following winter heating season. Without this storage capacity, LG&E would be required to purchase additional natural gas and pipeline transportation services during winter months when customer demand increases and the prices for natural gas supply and transportation services are expected to be higher. At December 31, 2018, LG&E had 12 Bcf of natural gas stored underground with a carrying value of $41 million.
LG&E has a portfolio of supply arrangements of varying durations and terms that provide competitively priced natural gas designed to meet its firm sales obligations. These natural gas supply arrangements include pricing provisions that are market-responsive. In tandem with pipeline transportation services, these natural gas supplies provide the reliability and flexibilitynecessary to serve LG&E's natural gas customers.
LG&E purchases natural gas supply transportation services from two pipelines. LG&E has contracts with one pipeline that aresubject to termination by LG&E between 2020 and 2023. Total winter season capacity under these contracts is 184,900MMBtu/day and summer season capacity is 60,000 MMBtu/day. With this same pipeline, LG&E also has another contract for hpipeline capacity through 2026 in the amount of 60,000 MMBtu/day during both the winter and summer seasons. LG&E has a single contract with a second pipeline with a total capacity of 20,000 MMBtu/day during both the winter and summer seasonsthat expires in 2023.
LG&E expects to purchase natural gas supplies for its gas distribution operations from onshortt e producing regions in South Texas, East Texas, North Louisiana and Arkansas, as well as gas originating in the Marcellus and Utica production areas.
(PPL, LKE, LG&E and KU)
Transmission
LG&E and KU contract with the Tennessee Valley Authority to act as their transmission reliability coordinator and contract with TranServ International, Inc. to act as their independent transmission organization.
Rates
LG&E is subject to the jurisdiction of the KPSC and the FERC, and KU is subject to the jurisdiction of the KPSC, the FERC and the VSCC. LG&E and KU operate under a FERC-approved open access transmission tariff.
LG&E's and KU's Kentucky base rates are calculated based on a return on capitalization (common equity, long-term debt and short-term debt) including adjustments for certain net investments and costs recovered separately through other means. As such, LG&E and KU generally earn a return on regulatory assets in Kentucky.

14
KU's Virginia base rates are calculated based on a return on rate base (net utility plant plus working capital less accumulateddeferred income taxes and miscellaneous deductions). As all regulatory assets and liabilities, except the levelized fuel factorand regulatory assets or liabilities recorded for pension and postretirement benefits and AROs related to certain CCR impoundments, are excluded from the return on rate base utilized in the calculation of Virginia base rates, no return is earned on the related assets.
KU's rates to 10 municipal customers for wholesale power requirements are calculated based on annual updates to a formula rate that utilizes a return on rate base (net utility plant plus working capital less accumulated deferred income taxes and miscellaneous deductions). As all regulatory assets and liabilities, except regulatory assets recorded for AROs related to CCR impoundments, are excluded from the return on rate base utilized in the development of municipal rates, no return is earned on the related assets. In April 2014, certain municipalities submitted notices of termination, under the notice period provisions, tocease taking power under the wholesale requirements contracts. KU's service to eight municipalities will terminate effective May 1, 2019.
Rate Case Proceedings g
(PPL, LKE, LG&E and KU)
On September 28, 2018, LG&E and KU filed requests with the KPSC for an increase in annual base electricity rates of approximately $112 million at KU and increases in annual base electricity and gas rates of approximately $35 million and $25million at LG&E. The proposed base rate increases would result in an electricity rate increase of 6.9% at KU and electricity andgas rate increases of 3% and 7.5% at LG&E. As discussed in the "TCJA Impact on LG&E and KU Rates" section below, LG&E's and KU's applications seek to include applicable changes associated with the TCJA in the calculation of the proposed base rates and to terminate the TCJA bill credit mechanism when the new base rates go into effect.
New rates are expected to become effective on May 1, 2019. The applications are based on a forecasted test year of May 1, 2019 through April 30, 2020 with a requested return-on-equity of 10.42%. A number of parties have been granted intervention requests in the proceeding. Data discovery and the filing of written testimony will continue through February 2019 and a hearing is scheduled in March 2019. LG&E and KU cannot predict the outcome of these proceedings.
(LKE and KU)
In September 2017, KU filed a request seeking approval from the VSCC to increase annual Virginia base electricity revenue by $7 million, representing an increase of 10.4%. On March 22, 2018, KU reached a settlement agreement regarding the case,including the impact of the TCJA on rates, resulting in an increase in annual Virginia base electricity revenue of $2 million.This represents an increase of 2.8% with rates effective June 1, 2018. On May 8, 2018, the VSCC issued an Order approving the settlement agreement.
TCJA Impact on LG&E and KU Rates p
(PPL, LKE, LG&E and KU)
On December 21, 2017, Kentucky Industrial Utility Customers, Inc. submitted a complaint with the KPSC against LG&E and KU, as well as other utility companies in Kentucky, alleging that their respective rates would no longer be fair, just and reasonable following the enactment of the TCJA, which reduced the federal corporate tax rate from 35% to 21%. The complaint requested the KPSC to issue an order requiring LG&E and KU to begin deferring, as of January 1, 2018, the revenuerequirement effect of all income tax expense savings resulting from the federal corporate income tax reduction, including theamortization of excess deferred income taxes by recording those savings in a regulatory liability account and establishing a process by which the federal corporate income tax savings will be passed back to customers.
On January 29, 2018, LG&E, KU, Kentucky Industrial Utility Customers, Inc. and the Office of the Attorney General reached a ffsettlement agreement to commence returning savings related to the TCJA to their customers through their ECR, DSM and LG&E's GLT rate mechanisms beginning in March 2018 and through a new bill credhh it mechanism from April 1, 2018 throughApril 30, 2019 and thereafter until tax-reform related savings are reflected in changes in base rates. The estimated impact of therate reduction represents approximately $91 million in KU electricity revenues ($70 million through the new bill credit and $21million through existing rate mechanisms), $69 million in LG&E electricity revenues ($49 million through the new bill credit and $20 million through existing rate mechanisms) and $17 million in LG&E gas revenues (substantially all through the newbill credit) for the period January 2018 through April 2019.

15
On March 20, 2018, the KPSC issued an Order approving, with certain modifications, the settlement agreement reachedbetween LG&E, KU, Kentucky Industrial Utility Customers, Inc. and the Office of the Attorney General. The KPSC estimates ythat, pursuant to its modifications, electricity revenues would incorporate reductions of approximately $108 million for KU($87 million through the new bill credit and $21 million through existing rate mechanisms) and $79 million for LG&E ($59 million through the new bill credit and $20 million through existing rate mechanisms). This represents $27 million ($17 millionat KU and $10 million at LG&E) in additional reductions from the amounts proposed by the settlement. The KPSC'smodifications to the settlement include certain changes in assumptions or inputs used in assessing tax reform or calculatingLG&E's and KU's electricity rates. LG&E gas rate reductions were not modified significantly from the amount included in thesettlement agreement.
On September 28, 2018, the KPSC issued an Order on reconsideration, pursuant to LG&E's and KU's petition, implementingrates reflecting electricity revenue reductions of $101 million for KU ($80 million through the new bill credit and $21 millionthrough existing rate mechanisms), $74 million for LG&E electricity revenues ($54 million through the new bill credit and $20million through existing rate mechanisms) and $16 million LG&E gas revenues (substantially all through the new bill credit) for the period January 2018 through April 2019. This represents lower revenue reduction amounts than the March 20, 2018Order of approximately $13 million ($7 million at KU and $6 million at LG&E).
In January 2018, the VSCC ordered KU, as well as other utilities in Virginia, to accrue regulatory liabilities reflecting the Virginia jurisdictional revenue requirement impacts of the reduced federal corporate tax rate. In March 2018, KU reached a settlement agreement regarding its rate case in Virginia. New rates, inclusive of TCJA impacts, were effective June 1, 2018. The settlement also stipulates that actual tax savings for the five month period prior to new rates taking effect would beaddressed through KU's annual information filing for calendar year 2018. In May 2018, the VSCC approved the settlement agreement. The TCJA and rate case are not expected to have a significant impact on KU's financial condition or results of aaoperations related to Virginia.
On November 15, 2018, the FERC issued a Policy Statement which stated that the appropriate ratemaking treatment for changes in accumulated deferred income taxes as a result of the TCJA will be addressed in a Notice of Proposed Rulemaking. Also on November 15, 2018, the FERC issued the Notice of Proposed Rulemaking which proposes that public utilitytransmission providers include mechanisms in their formula rates to deduct excess accumulated deferred income taxes from, or add deficient accumulated deferred income taxes to, rate base and adjust their income tax allowances by amortized excess or deficient accumulated deferred income taxes. The Notice of Proposed Rulemaking did not prescribe the mechanism companiesshould use to adjust their formula rates. LG&E and KU are currently assessing the Notice of Proposed Rulemaking and are continuing to monitor guidance issued by the FERC. On February 5, 2019, in connection with a separate element of federal and Kentucky state tax reform effects, LG&E and KU filed a request with the FERCff to amend their transmission formula rates,effective June 1, 2019, to incorporate reductions to corporate income tax rates as a result of the TCJA and HB 487. LG&E and KU do not anticipate the impact of the TCJA related to their FERC-jurisdictional rates to be significant. m
See Note 7 to the Financial Statements for additional information on rate mechanisms.
• Pennsylvania Regulated Segment (PPL)y g g
Consists of PPL Electric, a regulated public utility engaged in the distribution and transmission of electricity.
(PPL and PPL Electric)
PPL Electric delivers electricity to approximately 1.4 million customers in a 10,000-square mile territory in 29 counties of eastern and central Pennsylvania. PPL Electric also provides electricity to retail customers in this territory as a PLR under the ttCustomer Choice Act.

16
Details of revenues, in millions, by customer class for the years ended December 31 are shown below.
2018 2017 2016
Revenue % of
Revenue Revenue % of
Revenue Revenue% of
RevenueDistribution
Residential $ 1,379 61 $ 1,351 62 $ 1,327 61Industrial 54 2 44 2 42 2Commercial 368 16 349 16 338 16Other (a) (73) (3) (36) (2 ) (4) —
Transmission 549 24 487 22 453 21Total $ 2,277 100 $ 2,195 100 $ 2,156 100
(a) Includes regulatory over- or under-recovery reconciliation mechanisms, pole attachment revenues and street lighting, offset by contra revenue associated with the network integration transmission service expense.
Franchise, Licenses and Other Regulations , g
PPL Electric is authorized to provide electric public utility service throughout its service area as a result of grants by theCommonwealth of Pennsylvania in corporate charters to PPL Electric and companies, which it has succeeded and as a result of certification by the PUC. PPL Electric is granted the right to enter the streets and highways by the Commonwealthy subject tocertain conditions. In general, such conditions have been met by ordinance, resolution, permit, acquiescence or other action byyan appropriate local political subdivision or agency of the Commonwealth.
Competition p
Pursuant to authorizations from the Commonwealth of Pennsylvania and the PUC, PPL Electric operates a regulated distribution monopoly in its service area. Accordingly, PPL Electric does not face competition in its electricity distributionbusiness. Pursuant to the Customer Choice Act, generation of electricity is a competitive business in Pennsylvania, and PPL Electric does not own or operate any generation facilities.
The PPL Electric transmission business, operating under a FERC-approved PJM Open Access Transmission Tariff, is subject tocompetition pursuant to FERC Order 1000 from entities that are not incumbent PJM transmission owt ners with respect to theconstruction and ownership of transmission facilities within PJM.
Rates and Regulation g
Transmission
PPL Electric's transmission facilities are within PJM, which operates the electricity transmission network and electric energy market in the Mid-Atlantic and Midwest regions of the U.S.
PJM serves as a FERC-approved Regional Transmission Operator (RTO) to promote greater participation and competition in the region it serves. In addition to operating the electricity transmission network, PJM also administers regional markets for energy, capacity and ancillary services. A primary objective of any RTO is to separate the operation of, and access to, the transmission grid from market participants that buy or sell electricity in the same markets. Electric utilities continue to own the ntransmission assets and to receive their share of transmission revenues, but the RTO directs the control and operation of thetransmission facilities. Certain types of transmission investments are subject to competitive processes outlined in the PJM tariff.
As a transmission owner, PPL Electric's transmission revenues are recovered through PJM and billed in accordance with aFERC-approved Open Access Transmission Tariff that allows recovery of incurred transmission costs, a return on transmission-yrelated plant and an automatic annual update based on a formula-based rate recovery mechanism. Under this formula, rates areput into effect in June of each year based upon prior year actual expenditures and current year forecasted capital additions. Rates are then adjusted the following year to reflect actual annual expenses and capital additions, as reported in PPL Electric’sannual FERC Form 1, filed under the FERC’s Uniform System of Accounts. Any difference between the revenue requirement in effect for the prior year and actual expenditures incurred for that year is recorded as a regulatory asset or regulatory liability.aAny change in the prior year PPL zonal peak load billing factor applied on January 1st of each year, will result in an increase or decrease in revenue until the next annual rate update goes into effect on June 1st of that same year.

17
As a PLR, PPL Electric also purchases transmission services from PJM. See "PLR" below.
See Note 7 to the Financial Statements for additional information on rate mechanisms.
Distribution
PPL Electric's distribution base rates are calculated based on a return on rate base (net utility plant plus a cash working capital allowance less plant-related deferred taxes and other miscellaneous additions and deductions). All regulatory assets and liabilities are excluded from the return on rate base. Therefore, no return is earned on the related assets unless specificallyprovided for by the PUC. Currently, PPL Electric's Smart Meter rider and the DSIC are the only riders authorized to earn a return. Certain operating expenses are also included in PPL Electric's distribution base rates including wages and benefits, other ttoperation and maintenance expenses, depreciation and taxes.
Pennsylvania's Alternative Energy Portfolio Standard (AEPS) requires electricity distribution companies and electricitygeneration suppliers to obtain from alternative energy resources a portion of the electricity sold to retail customers inPennsylvania. Under the default service procurement plans approved by the PUC, PPL Electric purchases all of the alternativeenergy generation supply it needs to comply with the AEPS.
Act 129 created an energy efficiency and conservation program, a demand side management program, smart metering technology requirements, new PLR generation supply procurement rules, remedies for market misconduct and changes to theexisting AEPS.
Act 11 authorizes the PUC to approve two specific ratemaking mechanisms: the use of a fully projected future test year in baserate proceedings and, subject to certain conditions, the use of a DSIC. Such alternative ratemaking procedures and mechanismsprovide opportunity for accelerated cost-recovery and, therefore, are important to PPL Electric as it is in a period of significant capital investment to maintain and enhance the reliability of its delivery system, including the replacement of aging assets. PPL Electric has utilized the fully projected future test year mechanism in its 2015 base rate proceeding. PPL has had the ability to utilize the DSIC recovery mechanism since July 2013.
See Note 7 to the Financial Statements for additional information regarding Act 129 and other legislative and regulatoryimpacts.
PLR
The Customer Choice Act requires Electric Distribution Companies (EDCs), including PPL Electric, or an alternative supplier approved by the PUC to act as a PLR of electricity supply for customers who do not choose to shop for supply with acompetitive supplier and provides that electricity supply costs will be recovered by the PLR pursuant to PUC regulations. In 2018, the following average percentages of PPL Electric's customer load were provided by competitive suppliers: 47% of residential, 83% of small commercial and industrial and 98% of large commercial and industrial customers. The PUC continuesto favor expanding the competitive market for electricity.
PPL Electric's cost of electricity generation is based on a competitive solicitation process. The PUC approved PPL Electric's default service plan for the period June 2015 through May 2017, which included four solicitations for electricity supply held semiannually in April and October. The PUC approved PPL Electric's default service plan for the period June 2017 through May 2021, which includes a total of eight solicitations for electricity supply held semiannually in April and October. Pursuantto both the current and future plans, PPL Electric contracts for all of the electricity supply for residential customers and commercial and industrial customers who elect to take that service from PPL Electric. These solicitations include a mix of 6-and 12-month fixed-price load-following contracts for residential and small commercial and industrial customers, and 12-month real-time pricing contracts for large commercial and industrial customers to fulfill PPL Electric's obligation to providecustomer electricity supply as a PLR.
Numerous alternative suppliers have offered to provide generation supply in PPL Electric's service territory. As the cost of generation supply is a pass-through cost for PPL Electric, its financial results are not impacted if its customers purchaseelectricity supply from these alternative suppliers.
See Note 7 to the Financial Statements for additional information regarding Act 129 and other legislative and regulatory impacts.

18
TCJA Impact on PPL Electric Rates p
On February 12, 2018, the PUC issued a Secretarial Letter requesting certain information from regulated utilities and invitingcomment from interested parties on potential revision to customer rates as a result of enactment of the TCJA. PPL Electric submitted its response to the Secretarial Letter on March 9, 2018. On March 15, 2018, the PUC issued a Temporary RatesOrder to allow time to determine the manner in which rates could be adjusted in response to the TCJA. The PUC issued another Temporary Rates Order on May 17, 2018 to address the impact of the TCJA and indicated that utilities without a currently pending general rate proceeding would receive a utility specific order. The PUC issued an Order specific to PPL Electric onMay 17, 2018 that required PPL Electric to file a tariff or tariff supplement by June 15, 2018 to establish (a) temporary rates tobe effective July 1, 2018, and (b) to record a deferred regulatory liability to reflect the tax savings associated with the TCJA for JJthe period January 1 through June 30, 2018. On June 8, 2018, PPL Electric submitted a petition to the PUC to charge a negative surcharge of 7.05% to reflect the estimated 2018 tax savings associated with the TCJA. The PUC approved PPL Electric'spetition on June 14, 2018 and PPL Electric filed a tariff on June 15, 2018 reflecting the increased negative surcharge. PPL Electric recorded a $41 million noncurrent regulatory liability and a corresponding reduction of revenue to be distributed to customers pursuant to a future rate adjustment related to the period Janud ary 1, 2018 through June 30, 2018.
On March 15, 2018, the FERC issued a Notice of Inquiry seeking information on whether and how it should address changes toFERC-jurisdictional rates relating to accumulated deferred income taxes and bonus depreciation resulting from passage of theTCJA. On March 16, 2018, PPL Electric filed a waiver request, pursuant to Rule 207(a)(5) of the Rules of Practice and Procedure of the FERC, to accelerate incorporation of the changes to the federal corporate income tax rate in its transmissionformula rate commencing on June 1, 2018 rather than allowing the TCJA tax rate reduction to be initially incorporated in PPL Electric's June 1, 2019 transmission formula rate. The waiver was approved on April 23, 2018 and PPL Electric submitted itstransmission formula rate, reflecting the TCJA rate reduction, on April 27, 2018. In addition, on May 21, 2018, PPL Electric, as part of a PJM Transmission Owners joint filing, submitted comments in response to the FERC's March 15, 2018 Notice of Inquiry. The filing requested guidance on how the reduction in accumulated deferred income taxes, resulting from the TCJA reduced federal corporate income tax rate, should be treated for ratemaking purposes. On November 15, 2018, the FERC issued a Policy Statement which stated that the appropriate ratemaking treatment for changes in accumulated deferred income taxes asa result of the TCJA will be addressed in a Notice of Proposed Rulemaking. Also on November 15, 2018, the FERC issued the Notice of Proposed Rulemaking which proposes that public utility transmission providers should include mechanisms in their formula rates to deduct excess accumulated deferred income taxes from, or add deficient accumulated deferred income taxes to,rate base and adjust their income tax allowances by amortized excess or deficient accumulated deferred income taxes. TheNotice of Proposed Rulemaking did not prescribe the mechanism companies should use to adjust their formula rates. PPL Electric is currently assessing the Notice of Proposed Rulemaking and is continuing to monitor guidance issued by the FERC.The changes, related to accumulated deferred income taxes impacting the transmission formula rate revenues, have not beensignificant since the new rate went into effect on June 1, 2018.t
(PPL)
• Corporate and Other p
PPL Services provides PPL subsidiaries with administrative, management and support services. The costs of these services are charged directly to the respective recipients for the services provided or indirectly charged to applicable recipients based on annaverage of the recipients' relative invested capital, operation and maintenance expenses and number of employees or a ratio of overall direct and indirect costs.
PPL Capital Funding, PPL's financing subsidiary, provides financing for the operations of PPL and certain subsidiaries. PPL'sgrowth in rate-regulated businesses provides the organization with an enhanced corporate level financing alternative, throughPPL Capital Funding, that enables PPL to cost effectively support targeted credit profiles across all of PPL's rated companies.As a result, PPL plans to utilize PPL Capital Funding as a source of capital in future financings, in addition to continued direct financing by the operating companies.
Unlike PPL Services, PPL Capital Funding's costs are not generally charged to PPL subsidiaries. Costs are charged directly toPPL. However, PPL Capital Funding participated significantly in the finad ncing for the acquisitions aa of LKE and WPD Midlandsand certain associated financing costs were allocated to the Kentucky Regulated and U.K. Regulated segments. The associated financing costs, as well as the financing costs associated with prior issuances of certain other PPL Capital Funding securities,have been assigned to the appropriate segments for purposes of PPL management's assessment of segment performance. Thefinancing costs associated primarily with PPL Capital Funding's securities issuances beginning in 2013, with certainexceptions, have not been directly assigned or allocated to any segment.

19
During the second quarter of 2018, PPL completed the acquisition of all the outstanding membership interests of Safari Energy, a privately held provider of solar energy solutions for commercial customers in the U.S. The acquisition is not material to PPLand the financial results of Safari Energy are reported within Corporate and Other.
(All Registrants)
CYBERSECURITY MANAGEMENT
The Registrants and their subsidiaries are subject to risks from cyber-attacks that have the potential to cause significant interruptions to the operation of their businesses. The frequency of these attempted intrusions has increased in recent years att nd aathe sources, motivations and techniques of attack continue to evolve and change rapidly. PPL has undertaken a variety of actions to monitor and address cyber-related risks. Cybersecurity and the effectiveness of PPL’s cybersecurity strategy are regular topics of discussion at Board meetings. PPL's strategy for managing cyber-related risks is risk-based and, where appropriate, integrated within PPL's enterprise risk management processes. PPL’s Chief Information Security Officer (CISO),who reports directly to the Chief Executive Officer, leads a dedicated cybersecurity team and is responsible for the design,implementation, and execution of cyber-risk management strategy. Among other things, the CISO and the cybersecurity team actively monitor the Registrants' systems, regularly review policies, compliance, regulations and best practices, perform penetration testing, lead response exercises and internal campaigns, and provide training and communication across the organization to strengthen secure behavior. The cybersecurity team also routinely participates in industry-wide programs toyfurther information sharing, intelligence gathering, and unity of effort in responding to potential orff actual attacks. In additr ion, in 2018, PPL revised and formalized its internal policy and procedures for communicating cybersecurity incidents on anenterprise-wide basis.
In addition to these enterprise-wide initiatives, PPL’s Kentucky and Pennsylvania operations are subject to extensive and rigorous mandatory cybersecurity requirements that are developed and enforced by NERC and approved by FERC to protect grid security and reliability. Finally, PPL purchases insurance to protect against a wide range of costs that could be incurred indconnection with cyber-related incidents. There can be no assurance, however, that these efforts will be effective to prevent interruption of services or other damage to the Registrants' businesses or operations or that PPL's insurance coverage will cover all costs incurred in connection with any cyber-related incident.
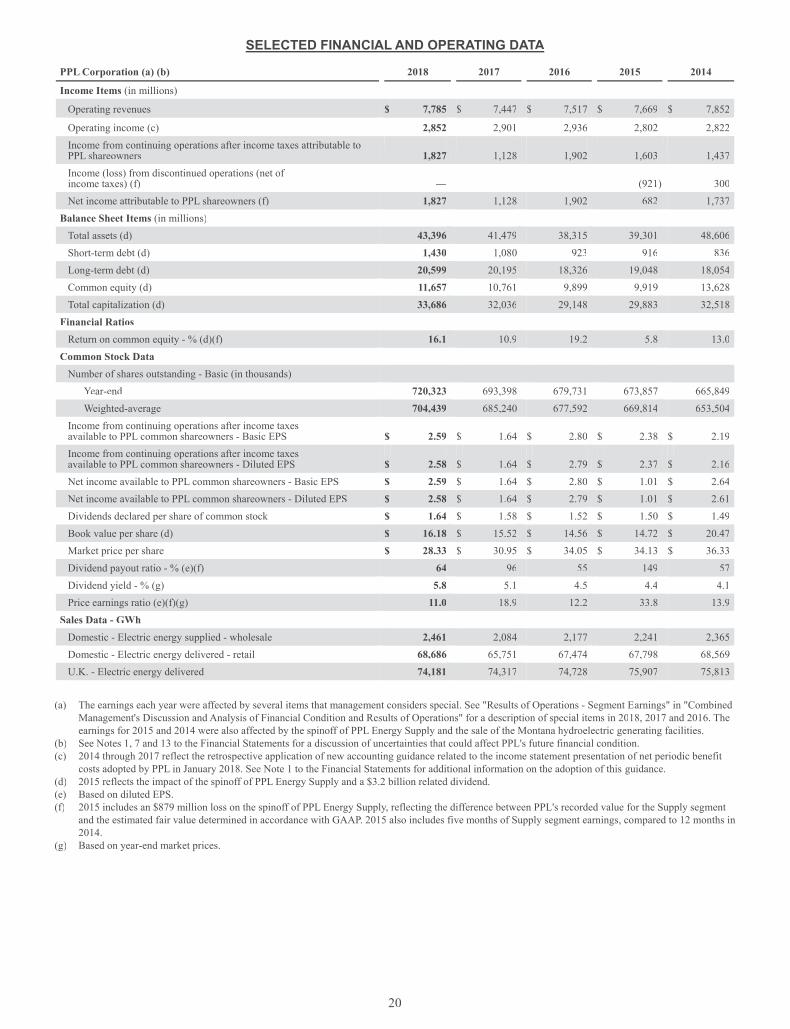
20
SELECTED FINANCIAL AND OPERATING DATA
PPL Corporation (a) (b) 2018 2017 2016 2015 2014
Income Items (in millions)
Operating revenues $ 7,785 $ 7,447 $ 7,517 $ 7,669 $ 7,852
Operating income (c) 2,852 2,901 2,936 2,802 2,822Income from continuing operations after income taxes attributable toPPL shareowners 1,827 1,128 1,902 1,603 1,437Income (loss) from discontinued operations (net of income taxes) (f) — — — (921) 300NNet income attributable to PPL shareowners (f) 1,827 1,128 1,902 682 1,737
Balance Sheet Items (in millions) Total assets (d) 43,396 41,479 38,315 39,301 48,606Short-term debt (d) 1,430 1,080 923 916 836Long-term debt (d) 20,599 20,195 18,326 19,048 18,054Common equity (d) 11,657 10,761 9,899 9,919 13,628Total capitalization (d) 33,686 32,036 29,148 29,883 32,518
Financial Ratios Return on common equity - % (d)(f) 16.1 10.9 19.2 5.8 13.0
Common Stock Data NNumber of shares outstanding - Basic (in thousands)
Year-end 720,323 693,398 679,731 673,857 665,849Weighted-average 704,439 685,240 677,592 669,814 653,504
Income from continuing operations after income taxes available to PPL common shareowners - Basic EPS $ 2.59 $ 1.64 $ 2.80 $ 2.38 $ 2.19Income from continuing operations after income taxes available to PPL common shareowners - Diluted EPS $ 2.58 $ 1.64 $ 2.79 $ 2.37 $ 2.16Net income available to PPL common shareowners - Basic EPS $ 2.59 $ 1.64 $ 2.80 $ 1.01 $ 2.64NNet income available to PPL common shareowners - Diluted EPS $ 2.58 $ 1.64 $ 2.79 $ 1.01 $ 2.61Dividends declared per share of common stock $ 1.64 $ 1.58 $ 1.52 $ 1.50 $ 1.49Book value per share (d) $ 16.18 $ 15.52 $ 14.56 $ 14.72 $ 20.47Market price per share $ 28.33 $ 30.95 $ 34.05 $ 34.13 $ 36.33Dividend payout ratio - % (e)(f) 64 96 55 149 57Dividend yield - % (g) 5.8 5.1 4.5 4.4 4.1Price earnings ratio (e)(f)(g) 11.0 18.9 12.2 33.8 13.9
Sales Data - GWh Domestic - Electric energy supplied - wholesale 2,461 2,084 2,177 2,241 2,365Domestic - Electric energy delivered - retail 68,686 65,751 67,474 67,798 68,569U.K. - Electric energy delivered 74,181 74,317 74,728 75,907 75,813
(a) The earnings each year were affected by several items that management considers special. See "Results of Operations - Segment Earnings" in "Combined Management's Discussion and Analysis of Financial Condition and Results of Operations" for a description of special items in 2018, 2017 and 2016. The earnings for 2015 and 2014 were also affected by the spinoff of PPL Energy Supply and the sale of the Montana hydroelectric generating facilities.
(b) See Notes 1, 7 and 13 to the Financial Statements for a discussion of uncertainties that could affect PPL's future financial condition.(c) 2014 through 2017 reflect the retrospective application of new accounting guidance related to the income statement presentation of net periodic benefit
costs adopted by PPL in January 2018. See Note 1 to the Financial Statements for additional information on the adoption of this guidance. (d) 2015 reflects the impact of the spinoff of PPL Energy Supply and a $3.2 billion related dividend.(e) Based on diluted EPS. (f) 2015 includes an $879 million loss on the spinoff of PPL Energy Supply, reflecting the difference between PPL's recorded value for the Supply segment
and the estimated fair value determined in accordance with GAAP. 2015 also includes five months of Supply segment earnings, compared to 12 months in2014.
(g) Based on year-end market prices.

21
Combined Management's Discussion and Analysis of Financial Condition and Results of Operations g y p
(All Registrants)
The following should be read in conjunction with the Registrants' Consolidated Financial Statements and the accompanyingNotes. Capitalized terms and abbreviations are defined in the glossary. Dollars are in millions, except per share data, unlessotherwise noted.
"Management's Discussion and Analysis of Financial Condition and Results of Operations" includes the following information:
• "Overview" provides a description of each Registrant's business strategy and a discussion of important financial and operational developments.
• "Results of Operations" for all Registrants includes a "Statement of Income Analysis," which discusses significant changes in principal line items on the Statements of Income, comparing 2018 with 2017 and 2017 with 2016. For PPL,"Results of Operations" also includes "Segment Earnings" and "Adjusted Gross Margins" which provide a detailed analysis of earnings by reportable segment. These discussions include non-GAAP financial measures, including "Earnings from Ongoing Operations" and "Adjusted Gross Margins" and provide explanations of the non-GAAP financial measures and a reconciliation of the non-GAAP financial measures to the most comparable GAAP measure. The "2019 Outlook" discussion identifies key factors expected to impact 2019 earnings. ff
• "Financial Condition - Liquidity and Capital Resources" provides an analysis of the Registrants' liquidity positions and credit profiles. This section also includes a discussion of forecasted sources and uses of cash and rating agency actions.
• "Financial Condition - Risk Management" provides an explanation of the Registrants' risk management programs relating to market and credit risk.
• "Application of Critical Accounting Policies" provides an overview of the accounting policies that are particularly important to the results of operations and financial condition of the Registrants and that require their management to make significant estimates, assumptions and other judgments of inherently uncertain matters.
Overview
For a description of the Registrants and their businesses, see "Business."
Business Strategy
(All Registrants)
PPL operates seven fully regulated high-performing utilities. These utilities are located in the U.K., Pennsylvania and Kentucky, constructive regulatory jurisdictions with distinct regulatory structures and customer classes. PPL believes this business portfolio positions the company well for continued success and provides earnings and dividend growth potential.
PPL's strategy, and that of the other Registrants, is to deliver best-in-sector operational perfr ormance, invest in a sustainablff e energy future, maintain a strong financial foundation, and engage and develop its people. PPL's business plan is designed toachieve growth by providing efficient, reliable and safe operations and strong customer service, maintaining constructive regulatory relationships and achieving timely recovery of costs. These businesses are expected to achieve strong, long-term growth in rate base in the U.S. and RAV in the U.K. Rate base growth is being driven by planned significant capital expenditures to maintain existing assets and improve system reliability and, for LKE, LG&E and KU, to comply with federal and state environmental regulations related to coal-fired electricity generation facilities.
For the U.S. businesses, central to PPL's strategy is recovering capital project costs efficiently through various rate-making mechanisms, including periodic base rate case proceedings using forward test years, annual FERC formula rate mechanisms and other regulatory agency-approved recovery mechanisms designed to limit regulatory lag. In Kentucky, the KPSC hasadopted a series of regulatory mechanisms (ECR, DSM, GLT, fuel adjustment clause, gas supply clause and recovery onconstruction work-in-progress) that reduce regulatory lag and provide timely recovery of and return on, as appropriate, prudently incurred costs. In addition, the KPSC requires a utility to obtain a CPCN prior to constructing a facility, unless the construction is an ordinary extension of existing facilities in the usual coursef of business or does not involve sufficient capital
22
expenditures to materially affect the utility's financial condition. Although such KPSC proceedings do not directly address cost recovery issues, the KPSC, in awarding a CPCN, concludes that the public convenience and necessity require the constructionof the facility on the basis that the facility is the lowest reasonable cost alternative to address the need. In Pennsylvania, theFERC transmission formula rate, DSIC mechanism, Smart Meter Rider and other recovery mechanisms are in place to reduceregulatory lag and provide for timely recovery of and a return on, as appropriate, prudently incurred costs.
To manage financing costs and access to credit markets, and to fund capital expenditures, a key objective of the Registrants isto maintain their investment grade credit ratings and adequate liquidity positions. In addition, the Registrants have financialn and operational risk management programs that, among other things, are designed to monitor and manage exposure to earnings and cash flow volatility, as applicable, related to changes in interest rates, foreign currency exchange rates and counterparty credit quality. To manage these risks, PPL generally uses contracts such as forwards, options and swaps. See "Financial Condition -Risk Management" below for further information.
Earnings generated by PPL's U.K. subsidiaries are subject to foreign currency translation risk. Because WPD's earnings represent such a significant portion of PPL's consolidated earnings, PPL enters into foreign currency contracts to economicallyhedge the value of the GBP versus the U.S. dollar. These hedges do not receive hedge accounting treatment under GAAP. See "Financial and Operational Developments - U.K. Membership in European Union" for additional discussion of the U.K. earnings hedging activity.
The U.K. subsidiaries also have currency exposure to the U.S. dollar to the extent of their U.S. dollar denominated debt. Tomanage these risks, PPL generally uses contracts such as forwards, options and cross-currency swaps that contain characteristics of both interest rate and foreign currency exchange contracts.
As discussed above, a key component of this strategy is to maintain constructive relationships with regulators in all jurisdictions in which the Registrants operate (U.K., U.S. federal and state). This is supported by a strong culture of integrity and delivering on commitments to customers, regulators and shareowners, and a commitment to continue to improve customer service, reliability and operational efficiency.
Financial and Operational Developments
Equity Forward Contracts (PPL)
In May 2018, PPL completed a registered underwritten public offering of 55 million shares of its common stock. In conjunction with that offering, the underwriters exercised an option to purchase 8.25 million additional shares of PPL common stock solely to cover over-allotments.
In connection with the registered public offering, PPL entered into forward sale agreements with two counterparties covering the 63.25 million shares of PPL common stock. Full settlement of these forward sale agreements will occur no later than November 2019. The forward sale agreements are classified as equity transactions. PPL only receives proceeds and issues shares of common stock upon any settlements of the forward sale agreements. PPL intends to use net proceeds that it receives upon any settlements for general corporate purposes.
In September 2018, PPL settled a portion of the initial forward sale agreements by if ssuing 20 million shares of PPL common stock, and received net cash proceeds of $520 million. For the unsettled portion of the agreements, the only impact to thefinancial statements is the inclusion of incremental shares within the calculation of diluted EPS using the Treasury Stock Method.
See Note 8 to the Financial Statements for additional information.
U.S. Tax Reform (All Registrants)
The Registrants recognized certain provisional amounts relating to the impact of the enactment of the TCJA in their December f31, 2017 financial statements, in accordance with SEC guidance. Included in those provisional amounts were estimates of: taxdepreciation, deductible executive compensation, accumulated foreign earnings, foreign tax credits, and deemed dividends from foreign subsidiaries, all of which were based on the interpretation and application of various provisions of the TCJA.
In the third quarter of 2018, PPL filed its consolidated federal income tax return, which was prepared using guidance issued bythe U.S. Treasury Department and the IRS since the filing of each Registrant's 2017 Form 10-K. Accordingly, the Registrants

23
have updated the following provisional amounts and now consider them to be complete: (1) the amount of the deemed dividend and associated foreign tax credits relating to the transition tax imposed on accumulated foreign earnings as of December 31, 2017; (2) the amount of accelerated 100% "bonus" depreciation PPL was eligible to claim in its 2017 federal income tax return;and (3) the related impacts on PPL's 2017 consolidated federal net operating loss to be carried forward to future periods. Inaddition, the Registrants recorded the tax impact of the U.S. federal corporate income tax rate reduction from 35% to 21% on the changes to deferred tax assets and liabilities resulting from the completed provisional amounts. The completed provisionalamounts related to the tax rate reduction had an insignificant impact on the net regulatory liabilities of PPL's U.S. regulatedoperations. In the fourth quarter of 2018, PPL completed its analysis of the deductibility of executive compensation awarded asof November 2, 2017 and concluded that no material change to the provisional amounts is required. See Note 6 to the Financial Statements for the final amounts reported in PPL's 2017 federal income tax return, provisional adjustment amounts for the year ended December 31, 2017, the related measurement period adjustments and the resulting tax impact for 2018.
The Registrants' accounting related to the effects of the TCJA on financial results for the period ended December 31, 2017 is complete as of December 31, 2018 with respect to all provisional amounts.
In 2018, the IRS issued proposed regulations for certain provisions of the TCJA, including interest deductibility, Base ErosionAnti-Avoidance Tax (BEAT), and Global Intangible Low-Taxed Income (GILTI). PPL has determined that the proposed regulations related to BEAT and GILTI do not materially change PPL's current interpretation of the statutory impact of theserules on the company. Proposed regulations relating to the limitation on the deductibility of interest expense were issued in November 2018 and such regulations provide detailed rules implementing the broader statutorymm provisions. These proposedyregulations should not apply to the Registrants until the year in which the regulations are issued in final form, which is expected to be 2019. It is uncertain what form the final regulations will take and, therefore, the Registrants cannot predict wt hat impact the final regulations will have on the tax deductibility of interest expense. However, if the proposed regulations were issued as final in their current form, the Registrants could have a limitation on a portion of their interest expense deduction for ntax purposes and such limitation could be significant.
Kentucky State Tax Reform (All Registrants)
HB 487, which became law on April 27, 2018, provides for significant changes to the Kentucky tax code including (1) adoptingmandatory combined reporting for corporate members of unitary business groups for taxable years beginning on or after yJanuary 1, 2019 (members of a unitary business group may make an eight-year binding election to file consolidated corporate income tax returns with all members of their federal affiliated group) and (2) a reduction in the Kentucky corporate income taxrate from 6% to 5% for taxable years beginning after December 31, 2017. LKE recognized a deferred tax charge of $9 millionin the second quarter of 2018 primarily associated with the remeasurement of non-regulated accumulated deferred income taxbalances.
As indicated in Note 1 to the Financial Statements, LG&E's and KU's accounting for income taxes is impacted by rate regulation. Therefore, reductions in regulated accumulated deferred income tax balances due to the reduction in the Kentuckycorporate income tax rate to 5% under the provisions of HB 487 will result in amounts previously collected from utility customers for these deferred taxes to be refundable to such customers in future periods. In the second quarter of 2018, LG&E and KU recorded the impact of the reduced tax rate, related to the remeasurementf of deferred income taxes, as an increase intregulatory liabilities of $16 million and $19 million. In a separate regulatory proceeding, LG&E and KU have requested to begin returning state excess deferred income taxes to customers in conjunction with the 2018 Kentucky base rate case, which was filed on September 28, 2018. See Note 7 to the Financial Statements for additional information related to the rate caseproceedings. PPL is evaluating the impact, if any, of unitary or elective consolidated income tax reporting on all its Registrants. aa
U.K. Membership in European Union (PPL)
The U.K. formally began the process of leaving the European Union (EU) on March 29, 2017 by triggering Article 50 of the Lisbon Treaty. The U.K. has two years from that date to negotiate a withdrawal agreement governing its exit from the EU(Brexit). The U.K. and EU also agreed to a transition period lasting until the end of 2020, during which both parties will negotiate a future trade relationship. The final withdrawal agreement and future trade relationship are subject to ratification bynboth the U.K. and EU parliaments.
In November 2018, U.K. Prime Minister Theresa May and the EU decided on a withdrawal agreement covering a broad range of issues. On January 15, 2019, the U.K. Parliament voted overwhelmingly to reject this withdrawal agreement. On January 29,2019, the U.K. Parliament voted on a series of non-binding amendments to influence future Brexit negotiations, directing May to conduct further negotiations with the EU. The EU has said that it is not prepared to renegotiate the existing deal.

24
Significant uncertainty surrounds the status of negotiations and next steps in the Brexit process. If an agreement is not reached, the default position is that the U.K. will have a disorderly exit from the EU on March 29, 2019. The U.K. may also request an extension of the Article 50 process, subject to approval from the EU’s 27 remaining members. The U.K. could also choose to revoke Article 50 and remain in the EU.
PPL believes that its greatest risk related to Brexit is the potential decline in the value of the GBP compared to the U.S. dollar.A decline in the value of the GBP compared to the U.S. dollar will reduce the value of WPD's earnings to PPL.
PPL has executed hedges to mitigate the foreign exchange risk to its U.K. earnings. As of February 6, 2019, PPL's foreignexchange exposure related to budgeted earnings is 100% hedged for the remainder of 2019 at an average rate of $1.39 per GBP and 49% hedged for 2020 at an average rate of $1.49 per GBP.
PPL cannot predict the impact, in either the short-term or long-term, on foreign exchange rates or PPL's financial condition that may be experienced as a result of the actions taken by the U.K. government to withdraw from the EU, although such impactscould be material.
PPL does not expect the financial condition and results of operations of WPD itself to change significantly as a result of Brexit,with or without an approved plan of withdrawal. The regulatory environment and operation of WPD's businesses are not expected to change. WPD is less than halfway through RIIO-ED1, the current price control period, with allowed revenues agreed with Ofgem through March 2023. The impact of a slower economy or recession on WPD r would be mitigated in part because U.K. regulation provides that any reduction in the volume of electricity delivered will be recovered in allowed revenues in future periods through the K-factor adjustment. See "Business - Segment Information - U.K. Regulated Segment"for additional information on the current price control and K-factor adjustment. In addition, an increase in inflation would have aaa positive effect on revenues and RAV as annual inflation adjustments are applied to both revenues and RAV (and real returns are earned on inflated RAV). This impact, however, would be partially offset by higher O&M and interest expense on index-linked debt. With respect to access to financing, WPD has substantial borrowing capacity under existing credit facilities and expects to continue to have access to all major financial markets. With respect to access to and cost of equipment and other materials, WPD management continues to review U.K. government issued advice on preparations for Brexit without an approved plan of withdrawal and has taken actions to mitigate potential increasing costs and disruption to its critical sources of supply. Additionally, less than 1% of WPD's employees are non-U.K. EU nationals and no change in their domicile is expected.
Regulatory Requirements
(All Registrants)((
The Registrants cannot predict the impact that future regulatory requirements may have on their financial condition or results of operations.
TCJA Impact on LG&E and KU Rates (PPL, LKE, LG&E and KU)
On December 21, 2017, Kentucky Industrial Utility Customers, Inc. submitted a complaint with the KPSC against LG&E and KU, as well as other utility companies in Kentucky, alleging that their respective rates would no longer be fair, just and reasonable following the enactment of the TCJA, which reduced the federal corporate tax rate from 35% to 21%. The complaint requested the KPSC to issue an order requiring LG&E and KU to begin deferring, as of January 1, 2018, the revenuerequirement effect of all income tax expense savings resulting from the federal corporate income tax reduction, including the amortization of excess deferred income taxes by recording those savings in a regulatory liability account and establishing a process by which the federal corporate income tax savings will be passed back to customers.
On January 29, 2018, LG&E, KU, Kentucky Industrial Utility Customers, Inc. and the Office of the Attorney General reached affsettlement agreement to commence returning savings related to the TCJA to their customers through their ECR, DSM and LG&E's GLT rate mechanisms beginning in March 2018 and through a new bill credhh it mechanism from April 1, 2018 throughApril 30, 2019 and thereafter until tax-reform related savings are reflected in changes in base rates. The estimated impact of therate reduction represents approximately $91 million in KU electricity revenues ($70 million through the new bill credit and $21million through existing rate mechanisms), $69 million in LG&E electricity revenues ($49 million through the new bill credit and $20 million through existing rate mechanisms) and $17 million in LG&E gas revenues (substantially all through the new bill credit) for the period January 2018 through April 2019.

25
On March 20, 2018, the KPSC issued an Order approving, with certain modifications, the settlement agreement reachedbetween LG&E, KU, Kentucky Industrial Utility Customers, Inc. and the Office of the Attorney General. The KPSC estimates ythat, pursuant to its modifications, electricity revenues would incorporate reductions of approximately $108 million for KU($87 million through the new bill credit and $21 million through existing rate mechanisms) and $79 million for LG&E ($59 million through the new bill credit and $20 million through existing rate mechanisms). This represents $27 million ($17 millionat KU and $10 million at LG&E) in additional reductions from the amounts proposed by the settlement. The KPSC'smodifications to the settlement include certain changes in assumptions or inputs used in assessing tax reform or calculatingLG&E's and KU's electricity rates. LG&E gas rate reductions were not modified significantly from the amount included in thesettlement agreement.
On September 28, 2018, the KPSC issued an Order on reconsideration, pursuant to LG&E's and KU's petition, implementingrates reflecting electricity revenue reductions of $101 million for KU ($80 million through the new bill credit and $21 millionthrough existing rate mechanisms), $74 million for LG&E electricity revenues ($54 million through the new bill credit and $20million through existing rate mechanisms) and $16 million LG&E gas revenues (substantially all through the new bill credit) for the period January 2018 through April 2019. This represents lower revenue reduction amounts than the March 20, 2018Order of approximately $13 million ($7 million at KU and $6 million at LG&E).
In January 2018, the VSCC ordered KU, as well as other utilities in Virginia, to accrue regulatory liabilities reflecting the Virginia jurisdictional revenue requirement impacts of the reduced federal corporate tax rate. In March 2018, KU reached a settlement agreement regarding its rate case in Virginia. New rates, inclusive of TCJA impacts, were effective June 1, 2018. The settlement also stipulates that actual tax savings for the five month period prior to new rates taking effect would beaddressed through KU's annual information filing for calendar year 2018. In May 2018, the VSCC approved the settlement agreement. The TCJA and rate case are not expected to have a significant impact on KU's financial condition or results of aaoperations related to Virginia.
On November 15, 2018, the FERC issued a Policy Statement which stated that the appropriate ratemaking treatment for changes in accumulated deferred income taxes as a result of the TCJA will be addressed in a Notice of Proposed Rulemaking. Also on November 15, 2018, the FERC issued the Notice of Proposed Rulemaking which proposes that public utilitytransmission providers include mechanisms in their formula rates to deduct excess accumulated deferred income taxes from, or add deficient accumulated deferred income taxes to, rate base and adjust their income tax allowances by amortized excess or deficient accumulated deferred income taxes. The Notice of Proposed Rulemaking did not prescribe the mechanism companiesshould use to adjust their formula rates. LG&E and KU are currently assessing the Notice of Proposed Rulemaking and are continuing to monitor guidance issued by the FERC. On February 5, 2019, in connection with a separate element of federal and Kentucky state tax reform effects, LG&E and KU filed a request with the FERCff to amend their transmission formula rates,effective June 1, 2019, to incorporate reductions to corporate income tax rates as a result of the TCJA and HB 487. LG&E and KU do not anticipate the impact of the TCJA related to their FERC-jurisdictional rates to be significant. m
(PPL and PPL Electric)
TCJA Impact on PPL Electric Rates
On February 12, 2018, the PUC issued a Secretarial Letter requesting certain information from regulated utilities and inviting comment from interested parties on potential revision to customer rates as a result of enactment of the TCJA. PPL Electric submitted its response to the Secretarial Letter on March 9, 2018. On March 15, 2018, the PUC issued a Temporary RatesOrder to allow time to determine the manner in which rates could be adjusted in response to the TCJA. The PUC issued another Temporary Rates Order on May 17, 2018 to address the impact of the TCJA and indicated that utilities without a currentlypending general rate proceeding would receive a utility specific order. The PUC issued an Order specific to PPL Electric onMay 17, 2018 that required PPL Electric to file a tariff or tariff supplement by June 15, 2018 to establish (a) temporary rates to be effective July 1, 2018, and (b) to record a deferred regulatory liability to reflect the tax savings associated with the TCJA for JJthe period January 1 through June 30, 2018. On June 8, 2018, PPL Electric submitted a petition to the PUC to charge a negativesurcharge of 7.05% to reflect the estimated 2018 tax savings associated with the TCJA. The PUC approved PPL Electric's petition on June 14, 2018 and PPL Electric filed a tariff on June 15, 2018 reflecting the increased negative surcharge. PPL Electric recorded a $41 million noncurrent regulatory liability and a corresponding reduction of revenue to be distributed to customers pursuant to a future rate adjustment related to the period January 1, 2018 through June 30, 2018.
On March 15, 2018, the FERC issued a Notice of Inquiry seeking information on whether and how it should address changes toFERC-jurisdictional rates relating to accumulated deferred income taxes and bonus depreciation resulting from passage of theTCJA. On March 16, 2018, PPL Electric filed a waiver request, pursuant to Rule 207(a)(5) of the Rules of Practice and Procedure of the FERC, to accelerate incorporation of the changes to the federal corporate income tax rate in its transmission

26
formula rate commencing on June 1, 2018 rather than allowing the TCJA tax rate reduction to be initially incorporated in PPL Electric's June 1, 2019 transmission formula rate. The waiver was approved on April 23, 2018 and PPL Electric submitted itstransmission formula rate, reflecting the TCJA rate reduction, on April 27, 2018. In addition, on May 21, 2018, PPL Electric, as part of a PJM Transmission Owners joint filing, submitted comments in response to the FERC's March 15, 2018 Notice of Inquiry. The filing requested guidance on how the reduction in accumulated deferred income taxes, resulting from the TCJA reduced federal corporate income tax rate, should be treated for ratemaking purposes. On November 15, 2018, the FERC issued a Policy Statement which stated that the appropriate ratemaking treatment for changes in accumulated deferred income taxes asa result of the TCJA will be addressed in a Notice of Proposed Rulemaking. Also on November 15, 2018, the FEr RC issued the Notice of Proposed Rulemaking which proposes that public utility transmission providers should include mechanisms in their formula rates to deduct excess accumulated deferred income taxes from, or add deficient accumulated deferred income taxes to, rate base and adjust their income tax allowances by amortized excess or deficient accumulated deferred income taxes. TheNotice of Proposed Rulemaking did not prescribe the mechanism companies should use to adjust their formula rates. PPL Electric is currently assessing the Notice of Proposed Rulemaking and is continuing to monitor guidance issued by the FERC. The changes, related to accumulated deferred income taxes impacting the transmission formula rate revenues, have not been significant since the new rate went into effect on June 1, 2018.t
Pennsylvania Alternative Ratemaking
In June 2018, Governor Tom Wolf signed House Bill 1782 (now known as Act 58 of 2018, and to be codified at 66 Pa. C.S. § 1330) authorizing public utilities to implement alternative rates and rate mechanisms in base rate proceedings before thePUC. The effective date of Act 58 was August 27, 2018.
Under the new law, a public utility may file an application to establish alternative rates and rate mechanisms in a base rateproceeding. These alternative rates and rate mechanisms include, but are not limited to, the following: decoupling mechanisms, performance-based rates, formula rates, multi-year rate plans, or a combination of those or other mechanisms.
The alternative rate mechanisms may include reconcilable surcharges and rates established under current law, including returns on and return of capital investments. Act 58 explicitly provides that it does not invalidate or void any rate mechanismsapproved by the PUC prior to the legislation's effective date. Act 58 also specifies customer notice requirements concerning theutility's application for alternative rates or rate mechanisms.
On August 23, 2018, the PUC issued a Tentative Implementation Order seeking comments on its proposed interpretation and implementation of Act 58, Section 1330 of the Public Utility Code, 66 Pa. C.S. 1330. PPL Electric and various other parties filed comments on October 8, 2018. This matter remains pending before the PUC.
PPL Electric views the passage of Act 58 to be a favorable regulatory development that is expected to expand the rate-makingmechanisms available to Pennsylvania regulated uaa tility companies.
(PPL)
RIIO-ED1 Mid-period Review
The RIIO framework allowed for an MPR. On April 30, 2018, Ofgem announced its decision not to conduct an MPR of the ffRIIO-ED1 price control period.
RIIO-2 Framework Review
On March 7, 2018, Ofgem issued its consultation document on the RIIO-2 framework, which covers all U.K. gas and electricity transmission and distribution price controls. The current electricity distribution price control, RIIO-ED1, continues through March 31, 2023 and will not be impacted by this RIIO-2 consultation process. Ofgem consulted on a wide range of issues, ffincluding cost of debt and equity methodologies, the length of the price control period, indexation mettt hodologies, innovation, stakeholder engagement in the business planning process and performance incentive mechanisms. The purpose of the RIIO-2 framework consultation was to build on lessons learned from the current price controls while supporting low costs to consumers, improved customer service and reliability, and the U.K.'s continued shift to a low-carbon future. Comments on theRIIO-2 framework were due in May 2018. On July 30, 2018, Ofgem published its decision following its RIIO-2 framework consultation after consideration of comments received. Ofgem confirmed the following points in the decision document:
• There will be a five-year default length for the price control period, compared to eight years in the current ttRIIO-ED1 price control.

27
• There is intent to shift the inflation index used for calculating RAV and allowed returns from RPI to CPIH.Ofgem stated overall, consumers and investors as a whole will be neither better nor worse off in net present value terms as a result of the shift to CPIH and a transition period may be required.
• There will be no change to the existing depreciation policy of using economic asset lives as the basis for depreciating RAV as part of base revenue calculations. WPD is currently transitioning to 45 year asset lives for new additions in RIIO-ED1 based on Ofgem’s extensive review of asset lives in RIIO-ED1.
• Ofgem will retain the option for fast-tracking for electricity distribution comptt anies only. Fast tracking will befurther considered as part of the electricity distribution sector specific consultation.
• A new enhanced engagement model will be introduced which will require distribution companies to set up acustomer engagement group to provide Ofgem with a public report of their views on the companies’ business plans from the perspective of local stakeholders. Ofgem will also establish an independent RIIO-2 challenge group comprised of consumer experts to provide Ofgem with a public report on companies’ business plans.
• Ofgem intends to expand the role of competition for projects that are new, separable and high value. WPD does not currently have any planned projects that would meet the high value threshold.
• A focus of RIIO-2 will be on whole-system outcomes. Ofgem envisions network companies and system operators working together to ensure the energy system as a whole is efficient and delivers best value toconsumers. Ofgem is undertaking further work to clarify the definition of whole-system and the appropriate roles of the network companies in supporting the energy transition.
Ofgem also indicated further work is needed on other price control principlest , including but not limited to, cost of equity, cost of debt, financeability and incentives with decisions on these items expected to be made in the sector specific consultations or oowithin the individual company business plan submissions.
In December 2018, the promulgation of sector specific price controls began with Ofgem publishing its consultation related toits RIIO-2 price controls for the gas distribution, gas transmission and electricity transmission operators that will be effectivefrom April 2021 to March 2026. This current consultation does not apply directly to electricity distribution network operatorsalthough some decisions will be precedent setting. The electricity distribution price control work is scheduled to begin in 2020, at which time Ofgem plans to publish its RIIO-ED2 strategy consultation document.
Although the electricity distribution consultation does not commence until 2020, WPD is engaged in the RIIO-2 process and will be responding to the December 2018 consultation document. PPL cannot predict the outcome of this process or the long-term impact it or the final RIIO-ED2 regulations will have on its financial condition or results of operations.
(PPL, LKE, LG&E and KU)
FERC Transmission Rate Filing
On August 3, 2018, LG&E and KU submitted an application to the FERC requesting elimination of certain on-going credits to a sub-set of transmission customers relating to the 1998 merger of LG&E's and KU's parent entities and the 2006 withdrawal of LG&E and KU from the Midcontinent Independent System Operator, Inc. (MISO), a regional transmission operator and energy market. The application seeks termination of LG&E's and KU's commitment to provide mitigation for certain horizontal market power concerns arising out of the 1998 merger for certain transmission service between MISO and LG&E and KU. The affected transmission customers are a limited number of municipal entities in Kentucky. The amounts at issue are generally waivers or credits for either LG&E and KU or for MISO transmission charges depending upon the direction of transmissionservice incurred by the municipalities. LG&E and KU estimate that such charges may average approximately $22 millionannually, depending upon actual transmission customer and market volumes, structures and prices, with such charges allocated according to LG&E's and KU's respective transmission system ownership ratio. Due to the development of robust accessible energy markets over time, LG&E and KU believe the mitigation commitments are no longer relevant or appropriate. LG&Eand KU currently receive recovery of such expenses in other rate mechanisms. LG&E and KU cannot predict the outcome of the proceeding, including any effects on their financial condition or results of operations.
The businesses of LKE, LG&E and KU are subject to extensive federal, state and local environmental laws, rules and regulations, including those pertaining to CCRs, GHG, and ELGs. See Note 7, Note 13 and Note 19 to the Financial Statements for a discussion of these significant environmental matters. These and other stringent environmental requirements led PPL, LKE, LG&E and KU to retire approximately 800 MW of coal-fired generating plants in Kentucky, primarily in 2015. Additionally, KU anticipates retiring two older coal-fired units at the E.W. Brown plant in 2019 with a combined summer rating capacity of 272 MW.

28
Also as a result of the environmental requirements discussed above, LKE projects $682 million ($261 million at LG&E and $421 million at KU) in environmental capital investment over the next five years. See PPL's "Financial Condition - Forecasted Uses of Cash - Capital Expenditures", Note 7 and Note 13 for additional information.
Rate Case Proceedings
(PPL, LKE, LG&E and KU)
On September 28, 2018, LG&E and KU filed requests with the KPSC for an increase in annual base electricity rates of approximately $112 million at KU and increases in annual base electricity and gas rates of approximately $35 million and $25million at LG&E. The proposed base rate increases would result in an electricity rate increase of 6.9% at KU and electricity andgas rate increases of 3% and 7.5% at LG&E. As discussed in the "TCJA Impact on LG&E and KU Rates" section above, LG&E's and KU's applications seek to include applicable changes associated with the TCJA in the calculation of the proposed base rates and to terminate the TCJA bill credit mechanism when the new base rates go into effect.
New rates are expected to become effective on May 1, 2019. The applications are based on a forecasted test year of May 1, 2019 through April 30, 2020 with a requested return-on-equity of 10.42%. A number of parties have been granted intervention requests in the proceeding. Data discovery and the filing of written testimony will continue through February 2019 and a hearing is scheduled in March 2019. LG&E and KU cannot predict the outcome of these proceedings.
(LKE and KU)
In September 2017, KU filed a request seeking approval from the VSCC to increase annual Virginia base electricity revenue by $7 million, representing an increase of 10.4%. On March 22, 2018, KU reached a settlement agreement regarding the case, including the impact of the TCJA on rates, resulting in an increase in annual Virginia base electricity revenue of $2 million. This represents an increase of 2.8% with rates effective June 1, 2018. On May 8, 2018, the VSCC issued an Order approving the settlement agreement.
Acquisition of Solar Energy Solution Provider (PPL)r
During the second quarter of 2018, PPL completed the acquisition of all the outstanding membership interests of Safari Energy,a privately held provider of solar energy solutions for commercial customers in the U.S. For its clients, Safari Energy develops highly structured turnkey solutions, managing projects through all phases of development, from inception to financing, design,engineering, permitting, construction, interconnection and asset management. Headquartered in New York City, Safari Energy has completed over 200 solar projects in 19 states, with over 70 projects underway as of December 31, 2018. The acquisition isnot material to PPL and the financial results of Safari Energy are reported within Corporate and Other.
Results of Operations p
(PPL)
The "Statement of Income Analysis" discussion below describes significant changes in principal line items on PPL's Statements of Income, comparing year-to-year changes. The "Segment Earnings" and "Adjusted Gross Margins" discussions for PPL provide a review of results by reportable segment. These discussions include non-GAAP financial measures, including "Earnings from Ongoing Operations" and "Adjusted Gross Margins," and provide explanations of the non-GAAP financialmeasures and a reconciliation of those measures to the most comparable GAAP measure. Tht e "2019 Outlook" discussionidentifies key factors expected to impact 2019 earnings.
Tables analyzing changes in amounts between periods within "Statement of Income Analysis," "Segment Earnings" and "Adjusted Gross Margins" are presented on a constant GBP to U.S. dollar exchange rate basis, where applicable, in order toisolate the impact of the change in the exchange rate on the item being explained. Results computed on a constant GBP to U.S. dollar exchange rate basis are calculated by translating current year results at the prior year weighted-average GBP to U.S.dollar exchange rate.
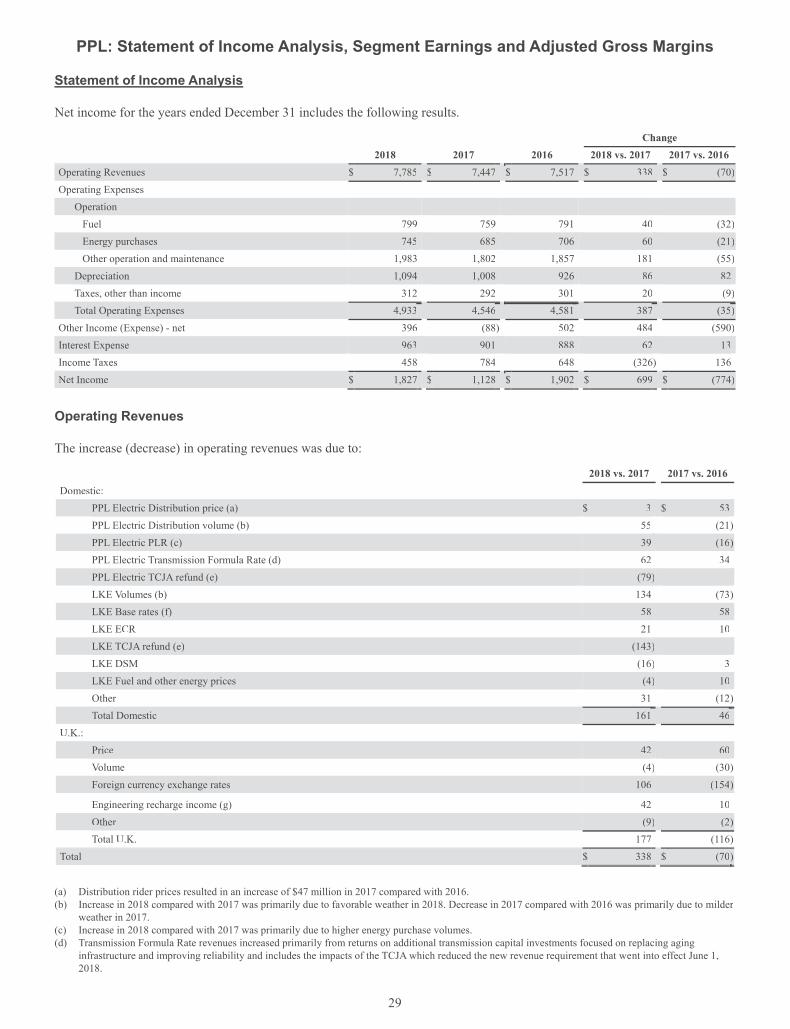
29
PPL: Statement of Income Analysis, Segment Earnings and Adjusted Gross Margins
Statement of Income Analysis y
Net income for the years ended December 31 includes the following results.
Change2018 2017 2016 2018 vs. 2017 2017 vs. 2016
Operating Revenues $ 7,785 $ 7,447 $ 7,517 $ 338 $ (70)Operating Expenses
Operation Fuel 799 759 791 40 (32)Energy purchases 745 685 706 60 (21)Other operation and maintenance 1,983 1,802 1,857 181 (55)
Depreciation 1,094 1,008 926 86 82Taxes, other than income 312 292 301 20 (9)Total Operating Expenses 4,933 4,546 4,581 387 (35)
Other Income (Expense) - net 396 (88) 502 484 (590)Interest Expense 963 901 888 62 13Income Taxes 458 784 648 (326) 136NNet Income $ 1,827 $ 1,128 $ 1,902 $ 699 $ (774)
Operating Revenues
The increase (decrease) in operating revenues was due to:
2018 vs. 2017 2017 vs. 2016 Domestic:
PPL Electric Distribution price (a) $ 3 $ 53PPL Electric Distribution volume (b) 55 (21)PPL Electric PLR (c) 39 (16)PPL Electric Transmission Formula Rate (d) 62 34PPL Electric TCJA refund (e) (79) ——LKE Volumes (b) 134 (73)LKE Base rates (f) 58 58LKE ECR 21 10LKE TCJA refund (e) (143) ——LKE DSM (16) 3LKE Fuel and other energy prices (4) 10Other 31 (12)Total Domestic 161 46
U.K.:Price 42 60Volume (4) (30)Foreign currency exchange rates 106 (154)
Engineering recharge income (g) 42 10Other (9) (2)Total U.K. 177 (116)
Total $ 338 $ (70)
(a) Distribution rider prices resulted in an increase of $47 million in 2017 compared with 2016. (b) Increase in 2018 compared with 2017 was primarily due to favorable weather in 2018. Decrease in 2017 compared with 2016 was primarily due to milder
weather in 2017.(c) Increase in 2018 compared with 2017 was primarily due to higher energy purchase volumes.(d) Transmission Formula Rate revenues increased primarily from returns on additional transmission capital investments focused on replacing aging
infrastructure and improving reliability and includes the impacts of the TCJA which reduced the new revenue requirement that went into effect June 1, 2018.

30
(e) Represents income tax savings owed to or already returned to customers related to the impact of the U.S. federal corporate income tax rate reduction from 35% to 21%, as enacted by the TCJA, effective January 1, 2018. See Note 7 to the Financial Statements for additional information.
(f) Increase primarily due to new base rates approved by the KPSC effective July 1, 2017.(g) These revenues are offset by costs reflected in "Other operation and maintenance" on the Statement of Income.
Fuel
Fuel increased $40 million in 2018 compared with 2017, primarily due to an increase in volumes at LKE driven by weather in 2018.
Fuel decreased $32 million in 2017 compared with 2016, primarily due to a decrease in volumes at LKE driven by weather in 2017.
Energy Purchases
Energy purchases increased $60 million in 2018 compared with 2017 primarily due to an increase of $37 million at PPL Electric primarily due to higher energy volumes and an increase of $23 million at LKE primarily due to higher gas volumes driven by weather in 2018.
Energy purchases decreased $21 million in 2017 compared with 2016 primarily due to a decrease in PLR prices at PPL Electric.
Other Operation and Maintenance
The increase (decrease) in other operation and maintenance was due to:
2018 vs. 2017 2017 vs. 2016 Domestic:
PPL Electric Act 129 $ 1 $ 9PPL Electric Payroll-related costs (5) (14)PPL Electric Bad debts 11 (17)PPL Electric Inventory reserve 8 (2)LKE timing and scope of generation maintenance outages 8 (1)LKE gas distribution maintenance and compliance 7 3LKE electricity distribution outage and repairs 7 —Storm costs 12 4Vegetation management 5 (15)Stock compensation expense (7) 5Other operation and maintenance of Safari Energy (a) 30 —Other 23 (10)
U.K.:Pension expense (2) 3Foreign currency exchange rates 20 (28)Third-party engineering (b) 35 6Engineering management 13 3Other 15 (1)
Total $ 181 $ (55)
(a) The increase in 2018 compared with 2017 primarily represents the other operation and maintenance expense of Safari Energy, which was acquired onJune 1, 2018.
(b) These costs are offset by revenues reflected in "Operating Revenues" on the Statement of Income.

31
Depreciation
The increase (decrease) in depreciation was due to:
2018 vs. 2017 2017 vs. 2016 Additions to PP&E, net $ 65 $ 93Foreign currency exchange rates 11 (16)Depreciation rates (a) 15 15Other (5) (10)Total $ 86 $ 82
(a) Higher depreciation rates were effective July 1, 2017 at LG&E and KU.
Taxes, Other Than Income
The increase (decrease) in taxes, other than income was due to:
2018 vs. 2017 2017 vs. 2016 State gross receipts tax $ — $ 3Domestic property tax expense 5 4Domestic capital stock tax 6 (6)Foreign currency exchange rates 7 (8)Other 2 (2)Total $ 20 $ (9)
Other Income (Expense) - net
The increase (decrease) in other income (expense) - net was due to:
2018 vs. 2017 2017 vs. 2016 Economic foreign currency exchange contracts (Note 17) $ 411 $ (645)Defined benefit plans - non-service credits (Note 11) 90 55Charitable contributions (16) 1Other (1) (1)Total $ 484 $ (590)
Interest Expense
The increase (decrease) in interest expense was due to:
2018 vs. 2017 2017 vs. 2016 Long-term debt interest expense (a) $ 36 $ 34Short-term debt interest 9 7Foreign currency exchange rates 17 (26)Other — (2)Total $ 62 $ 13
(a) Interest expense increased in 2018 compared with 2017, primarily due to debt issuances by PPL Electric in June 2018 and May 2017 and by PPL CapitalFunding in September 2017.
Interest expense increased in 2017 compared with 2016, primarily due to accretion on Index linked bonds at WPD and a debt issuance at PPL Electric in May 2017.
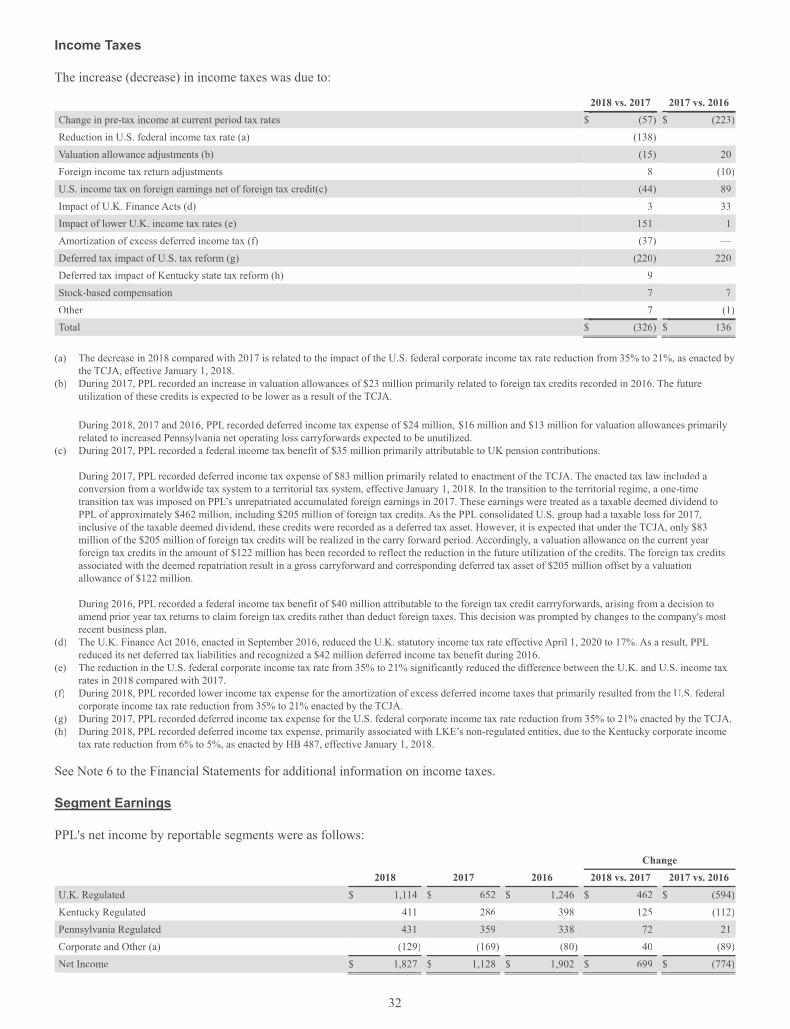
32
Income Taxes
The increase (decrease) in income taxes was due to:
2018 vs. 2017 2017 vs. 2016 Change in pre-tax income at current period tax rates $ (57) $ (223)Reduction in U.S. federal income tax rate (a) (138) —Valuation allowance adjustments (b) (15) 20Foreign income tax return adjustments 8 (10)U.S. income tax on foreign earnings net of foreign tax credit(c) (44) 89Impact of U.K. Finance Acts (d) 3 33Impact of lower U.K. income tax rates (e) 151 1Amortization of excess deferred income tax (f) (37) —Deferred tax impact of U.S. tax reform (g) (220) 220Deferred tax impact of Kentucky state tax reform (h) 9 —Stock-based compensation 7 7Other 7 (1)Total $ (326) $ 136
(a) The decrease in 2018 compared with 2017 is related to the impact of the U.S. federal corporate income tax rate reduction from 3f 5% to 21%, as enacted by the TCJA, effective January 1, 2018.
(b) During 2017, PPL recorded an increase in valuation allowances of $23 million primarily related to foreign tax credits recorded in 2016. The future utilization of these credits is expected to be lower as a result of the TCJA.
During 2018, 2017 and 2016, PPL recorded deferred income tax expense of $24 million, $16 million and $13 million for valuation allowances primarilyrelated to increased Pennsylvania net operating loss carryforwards expected to be unutilized.
(c) During 2017, PPL recorded a federal income tax benefit of $35 million primarily attributable to UK pension contributions.
During 2017, PPL recorded deferred income tax expense of $83 million primarily related to enactment of the TCJA. The enacted tax law included a conversion from a worldwide tax system to a territorial tax system, effective January 1, 2018. In the transition to the territorial regime, a one-timetransition tax was imposed on PPL’s unrepatriated accumulated foreign earnings in 2017. These earnings were treated as a taxable deemed dividend to PPL of approximately $462 million, including $205 million of foreign tax credits. As the PPL consolidated U.S. group had a taxable loss for 2017, ainclusive of the taxable deemed dividend, these credits were recorded as a deferred tax asset. However, it is expected that under the TCJA, only $83 million of the $205 million of foreign tax credits will be realized in the carry forward period. Accordingly, a valuation allowance on the current year foreign tax credits in the amount of $122 million has been recorded to reflect the reduction in the future utilization of the credits. The foreign tax credits associated with the deemed repatriation result in a gross carryforward and corresponding deferred tax asset of $205 million offset by a valuation allowance of $122 million.
During 2016, PPL recorded a federal income tax benefit of $40 million attributable to the foreign tax credit carrryforwards, arising from a decision toamend prior year tax returns to claim foreign tax credits rather than deduct foreign taxes. This decision was prompted by changes to the company's most recent business plan.
(d) The U.K. Finance Act 2016, enacted in September 2016, reduced the U.K. statutory income tax rate effective April 1, 2020 to 17%. As a result, PPL reduced its net deferred tax liabilities and recognized a $42 million deferred income tax benefit during 2016.
(e) The reduction in the U.S. federal corporate income tax rate from 35% to 21% significantly reduced the difference between the U.K. and U.S. income taxrates in 2018 compared with 2017.
(f) During 2018, PPL recorded lower income tax expense for the amortization of excess deferred income taxes that primarily resulted from the U.S. federaldcorporate income tax rate reduction from 35% to 21% enacted by the TCJA.
(g) During 2017, PPL recorded deferred income tax expense for the U.S. federal corporate income tax rate reduction from 35% to 21% enacted by the TCJA. (h) During 2018, PPL recorded deferred income tax expense, primarily associated with LKE’s non-regulated entities, due to the Kentucky corporate income
tax rate reduction from 6% to 5%, as enacted by HB 487, effective January 1, 2018.
See Note 6 to the Financial Statements for additional information on income taxes.
Segment Earningsg g
PPL's net income by reportable segments were as follows:
Change2018 2017 2016 2018 vs. 2017 2017 vs. 2016
U.K. Regulated $ 1,114 $ 652 $ 1,246 $ 462 $ (594)Kentucky Regulated 411 286 398 125 (112)Pennsylvania Regulated 431 359 338 72 21Corporate and Other (a) (129) (169) (80 ) 40 (89)NNet Income $ 1,827 $ 1,128 $ 1,902 $ 699 $ (774)
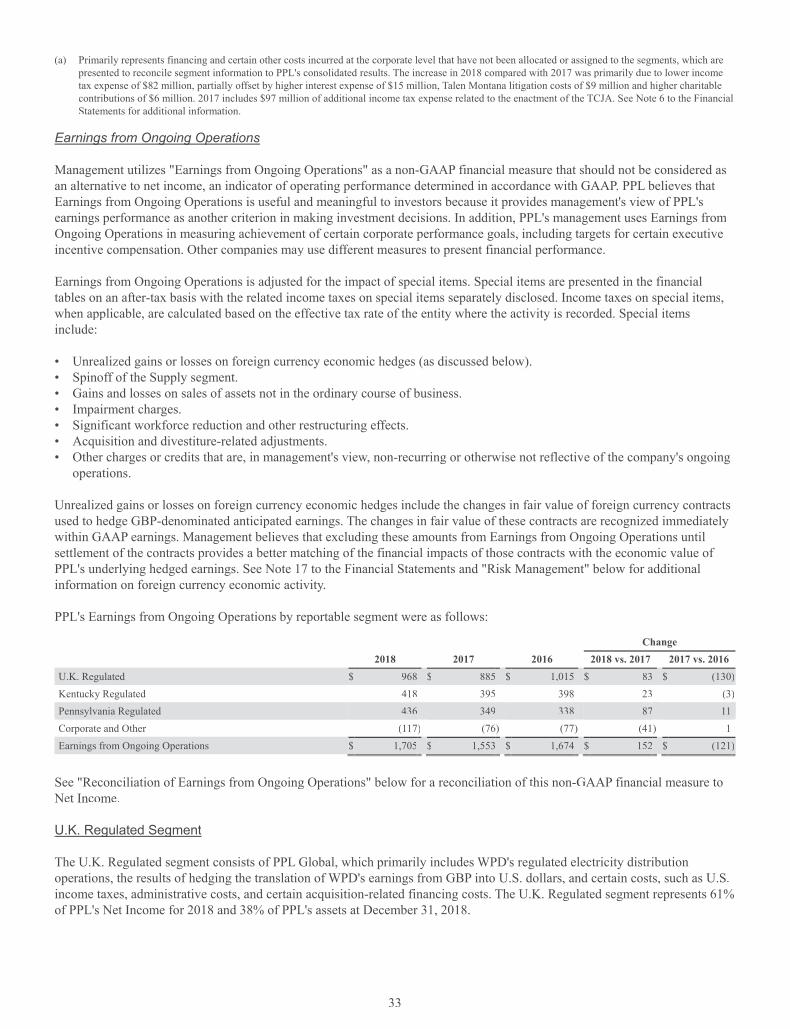
33
(a) Primarily represents financing and certain other costs incurred at the corporate level that have not been allocated or assigned to the segments, which are presented to reconcile segment information to PPL's consolidated results. The increase in 2018 compared with 2017 was primarily due to lower income ytax expense of $82 million, partially offset by higher interest expense of $15 million, Talen Montana litigation costs of $9 million and higher charitablecontributions of $6 million. 2017 includes $97 million of additional income tax expense related to the enactment of the TCJA. See Note 6 to the Financial Statements for additional information.
Earnings from Ongoing Operations g g g p
Management utilizes "Earnings from Ongoing Operations" as a non-GAAP financial measure that should not be considered as an alternative to net income, an indicator of operating performance determined in accordance with GAAP. PPL believes that Earnings from Ongoing Operations is useful and meaningful to investors because it provides management's view of PPL's earnings performance as another criterion in making investment decisions. In addition, PPL's management uses Earnings from Ongoing Operations in measuring achievement of certain corporate performance goals, including targets for certain executiveincentive compensation. Other companies may use different measures to present financial performance. ff
Earnings from Ongoing Operations is adjusted for the impact of special items. Special items are presented in the financial tables on an after-tax basis with the related income taxes on special items separately disclosed. Income taxes on special items,when applicable, are calculated based on the effective tax rate of the end tity where the activity is recorded. Special items include:
• Unrealized gains or losses on foreign currency economic hedges (as discussed below). • Spinoff of the Supply segment. • Gains and losses on sales of assets not in the ordinary course of business. • Impairment charges. • Significant workforce reduction and other restructuring effects.• Acquisition and divestiture-related adjustments. • Other charges or credits that are, in management's view, non-recurring or otherwise not reflectivuu e of the company's ongoing
operations.
Unrealized gains or losses on foreign currency economic hedges include the changes in fair value of foreign currency contracts used to hedge GBP-denominated anticipated earnings. The changes in fair value of these contracts are recognized immediatelywithin GAAP earnings. Management believes that excluding these amounts from Earnings from Ongoing Operations until settlement of the contracts provides a better matching of the financial impacts of those contracts with the economic value of PPL's underlying hedged earnings. See Note 17 to the Financial Statements and "Risk Management" below for additionalinformation on foreign currency economic activity.
PPL's Earnings from Ongoing Operations by reportable segment were as follows:
Change2018 2017 2016 2018 vs. 2017 2017 vs. 2016
U.K. Regulated $ 968 $ 885 $ 1,015 $ 83 $ (130)Kentucky Regulated 418 395 398 23 (3)Pennsylvania Regulated 436 349 338 87 11Corporate and Other (117) (76) (77 ) (41) 1Earnings from Ongoing Operations $ 1,705 $ 1,553 $ 1,674 $ 152 $ (121)
See "Reconciliation of Earnings from Ongoing Operations" below for a reconciliation of this non-GAAP financial measure toNet Income.
U.K. Regulated Segment g g
The U.K. Regulated segment consists of PPL Global, which primarily includes WPD's regulated electricity distributionoperations, the results of hedging the translation of WPD's earnings from GBP into U.S. dollars, and certain costs, such as U.S.income taxes, administrative costs, and certain acquisition-related financing costs. Thrr e U.K. Regulated segment represents 61%of PPL's Net Income for 2018 and 38% of PPL's assets at December 31, 2018.
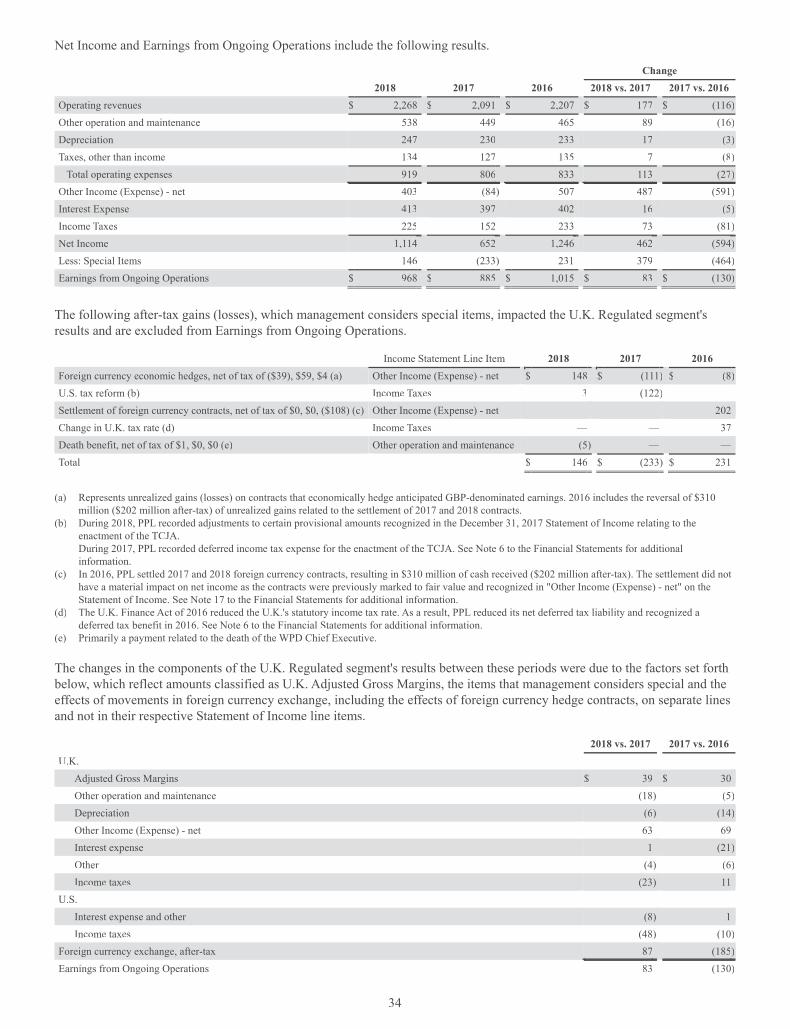
34
Net Income and Earnings from Ongoing Operations include the following results.
Change2018 2017 2016 2018 vs. 2017 2017 vs. 2016
Operating revenues $ 2,268 $ 2,091 $ 2,207 $ 177 $ (116)Other operation and maintenance 538 449 465 89 (16)Depreciation 247 230 233 17 (3)Taxes, other than income 134 127 135 7 (8)
Total operating expenses 919 806 833 113 (27)Other Income (Expense) - net 403 (84) 507 487 (591)Interest Expense 413 397 402 16 (5)Income Taxes 225 152 233 73 (81)NNet Income 1,114 652 1,246 462 (594)Less: Special Items 146 (233) 231 379 (464)Earnings from Ongoing Operations $ 968 $ 885 $ 1,015 $ 83 $ (130)
The following after-tax gains (losses), which management considers special items, impacted the U.K. Regulated segment's results and are excluded from Earnings from Ongoing Operations.
Income Statement Line Item 2018 2017 2016Foreign currency economic hedges, net of tax of ($39), $59, $4 (a) Other Income (Expense) - net $ 148 $ (111) $ (8)U.S. tax reform (b) Income Taxes 3 (122) —Settlement of foreign currency contracts, net of tax of $0, $0, ($108) (c) Other Income (Expense) - net — — 202Change in U.K. tax rate (d) Income Taxes — — 37Death benefit, net of tax of $1, $0, $0 (e) Other operation and maintenance (5) — —Total $ 146 $ (233) $ 231
(a) Represents unrealized gains (losses) on contracts that economically hedge anticipated GBP-denominated earnings. 2016 includes the reversal of $310million ($202 million after-tax) of unrealized gains related to the settlement of 2017 and 2018 contracts.
(b) During 2018, PPL recorded adjustments to certain provisional amounts recognized in the December 31, 2017 Statement of Income relating to the enactment of the TCJA. During 2017, PPL recorded deferred income tax expense for the enactment of the TCJA. See Note 6 to the Financial Statements for additional information.
(c) In 2016, PPL settled 2017 and 2018 foreign currency contracts, resulting in $310 million of cash received ($202 million after-tax). The settlement did not have a material impact on net income as the contracts were previously marked to fair value and recognized in "Other Income (Expense) - net" on the Statement of Income. See Note 17 to the Financial Statements for additional information.
(d) The U.K. Finance Act of 2016 reduced the U.K.'s statutory income tax rate. As a result, PPL reduced its net deferred tax liability and recognized adeferred tax benefit in 2016. See Note 6 to the Financial Statements for additional information.
(e) Primarily a payment related to the death of the WPD Chief Executive.
The changes in the components of the U.K. Regulated segment's results between these periods were due to the factors set forthbelow, which reflect amounts classified as U.K. Adjusted Gross Margins, the items that management considers special and the effects of movements in foreign currency exchange, including the effects of foreign currency hedge contracts, on separate linesuand not in their respective Statement of Income line items.
2018 vs. 2017 2017 vs. 2016 U.K.
Adjusted Gross Margins $ 39 $ 30Other operation and maintenance (18) (5)Depreciation (6) (14)Other Income (Expense) - net 63 69Interest expense 1 (21)Other (4) (6)Income taxes (23) 11
U.S. Interest expense and other (8) 1Income taxes (48) (10)
Foreign currency exchange, after-tax 87 (185)Earnings from Ongoing Operations 83 (130)

35
2018 vs. 2017 2017 vs. 2016
Special items, after-tax 379 (464)Net Income $ 462 $ (594)
U.K.
• See "Adjusted Gross Margins - Changes in Adjusted Gross Margins" for an explanation of U.K. Adjusted Gross Margins.
• Higher depreciation expense in 2017 compared with 2016 primarily due to additions to PP&E, net of retirements.
• Higher other income (expense) - net in 2018 compared with 2017 primarily due to higher pension income due to an increase in expected returns on higher asset balances.
• Higher other income (expense) - net in 2017 compared with 2016 primarily due to higher pension income due to an increase in expected returns on higher asset balances and lower interest costs due to a lower discount rate.
• Higher interest expense in 2017 compared with 2016 primarily due to higher interest expense on indexed linked bonds.
• Higher income taxes in 2018 compared with 2017 primarily due to higher pre-tax income.
• Lower income taxes in 2017 compared with 2016 primarily due to decreases of $10 million related to accelerated taxdeductions and $7 million from lower U.K. tax rates, partially offset by an increase of $11 million from higher pre-tax nincome.
U.S.
• Higher income taxes in 2018 compared with 2017 primarily due to a $35 million tax benefit on accelerated pensioncontributions in the first quarter of 2017 and a $16 million increase from a reduction in tax benefits on interest deductibility due to the U.S. federal corporate income tax rate reduction from 35% to 21%, as enacted by the TCJA,effective January 1, 2018.
• Higher income taxes in 2017 compared with 2016 primarily due to a $37 million benefit related to foreign tax credit carryforwards in 2016, partially offset by a $29 million tax benefit on accelerated pension contributions made in the first quarter of 2017.
Kentucky Regulated Segmenty g g
The Kentucky Regulated segment consists primarily of LKE's regulated electricity generation, transmission and distribution operations of LG&E and KU, as well as LG&E's regulated distribution and sale of natural gas. In addition, certain acquisition-related financing costs are allocated to the Kentucky Regulated segment. The Kentucky Regulated segment represents 22% of PPL's Net Income for 2018 and 35% of PPL's assets at December 31, 2018.

36
Net Income and Earnings from Ongoing Operations include the following results.
Change2018 2017 2016 2018 vs. 2017 2017 vs. 2016
Operating revenues $ 3,214 $ 3,156 $ 3,141 $ 58 $ 15Fuel 799 759 791 40 (32)Energy purchases 201 178 171 23 7Other operation and maintenance 848 801 798 47 3Depreciation 475 439 404 36 35Taxes, other than income 70 65 62 5 3
Total operating expenses 2,393 2,242 2,226 151 16Other Income (Expense) - net (16) (8) (15 ) (8) 7Interest Expense 274 261 260 13 1Income Taxes 120 359 242 (239) 117NNet Income 411 286 398 125 (112)Less: Special Items (7) (109) — 102 (109)Earnings from Ongoing Operations $ 418 $ 395 $ 398 $ 23 $ (3)
The following after-tax gains (losses), which management considers special items, impacted the Kentucky Regulated segment's mmresults and are excluded from Earnings from Ongoing Operations.
Income Statement Line Item 2018 2017 2016U.S. tax reform (a) Income Taxes $ 2 $ (112) $ —Kentucky state tax reform (b) Income Taxes (9 ) — —Adjustment to investment, net of tax of $0, $0, $0 (c) Other Income (Expense) - net — (1) —Settlement of indemnification agreement, net of tax of $0, ($2), $0 (d) Other Income (Expense) - net — 4 —Total $ (7) $ (109) $ —
(a) During 2018, LKE recorded adjustments to certain provisional amounts associated with LKE's non-regulated entities recognized in the December 31, 2017 Statement of Income relating to the enactment of the TCJA. During 2017, LKE recorded deferred income tax expense related to the enactment of the TCJA associated with LKE's non-regulated entities. See Note 6to the Financial Statements for additional information.
(b) During 2018, LKE recorded deferred income tax expense, primarily associated with LKE's non-regulated entities, due to the Kentucky corporate income tax rate reduction from 6% to 5%, as enacted by HB 487, effective January 1, 2018. See Note 6 to the Financial Statements for additional information.
(c) KU recorded a write-off of an equity method investment.(d) Recorded at LKE and represents the settlement of a WKE indemnification. See Note 13 to the financial statements for additional information.
The changes in the components of the Kentucky Regulated segment's results between these periods were due to the factors set nnforth below, which reflect amounts classified as Kentucky Aduu justed Gross Margins and the items that management considers dspecial on separate lines and not in their respective Statement of Income line item. r
2018 vs. 2017 2017 vs. 2016 Kentucky Adjusted Gross Margins $ 3 $ 29Other operation and maintenance (60) (1)Depreciation (30) (27)Taxes, other than income (6) (2)Other Income (Expense) - net (3) 2Interest Expense (13) (1)Income Taxes 132 (3)Earnings from Ongoing Operations 23 (3)Special Items, after-tax 102 (109)Net Income $ 125 $ (112)
• See "Adjusted Gross Margins - Changes in Adjusted Gross Margins" for an explanation of Kentucky Adjusted GrossMargins.
• Higher other operation and maintenance expense in 2018 compared with 2017 primarily due to an $8 million increase invegetation management, an $8 million increase in timing and scope of generation maintenance outages, a $7 million

37
increase in gas distribution maintenance and compliance, a $7 million increase in electricity distribution outage and repairsand increases in other costs that were not individually significant in comparison to the prior year.
• Higher depreciation expense in 2018 compared with 2017 primarily due to a $16 million increase related to additional assets placed into service, net of retirements, and a $12 million increase related to higher depreciation rates effective July 1, 2017.
• Higher depreciation expense in 2017 compared with 2016 primarily due to a $15 million increase related to additional assets placed into service, net of retirements, and a $12 million increase related to higher depreciation rates effective July 1, 2017.
• Higher interest expense in 2018 compared with 2017 primarily due to increased borrowings under LG&E's term loan credit facility and from affiliates.
• Lower income taxes in 2018 compared with 2017 primarily due to a $74 million decrease related to the impact of the U.S.federal corporate income tax rate reduction from 35% to 21%, as enacted by the TCJA, effective January 1, 2018, a $42 million decrease related to lower pre-tax income and an $18 million decrease primarily related to higher amortization of excess deferred income taxes as a result of the TCJA.
Pennsylvania Regulated Segment y g g
The Pennsylvania Regulated segment includes the regulated electricity transmission and distribution operations of PPL Electric. In addition, certain costs are allocated to the Pennsylvania Regulated segment. The Pennsylvania Regulated segment represents 24% of PPL's Net Income for 2018 and 26% of PPL's assets at December 31, 2018.
Net Income and Earnings from Ongoing Operations include the following results. Change
2018 2017 2016 2018 vs. 2017 2017 vs. 2016 Operating revenues $ 2,277 $ 2,195 $ 2,156 $ 82 $ 39Energy purchases 544 507 535 37 (28)Other operation and maintenance 578 572 604 6 (32)Depreciation 352 309 253 43 56Taxes, other than income 109 107 105 2 2
Total operating expenses 1,583 1,495 1,497 88 (2)Other Income (Expense) - net 32 17 20 15 (3)Interest Expense 159 142 129 17 13Income Taxes 136 216 212 (80) 4Net Income 431 359 338 72 21Less: Special Items (5) 10 — (15) 10Earnings from Ongoing Operations $ 436 $ 349 $ 338 $ 87 $ 11
The following after-tax gains (losses), which management considers special items, impacted the Pennsylvania Regulated segment's results and are excluded from Earnings from Ongoing Operations.
Income Statement Line Item 2018 2017 2016IT transformation, net of tax of $2, $0, $0 (a) Other operation and maintenance $ (5) $ — $ —U.S. tax reform (b) Income Taxes — 10 —Total $ (5) $ 10 $ —
(a) In June 2018, PPL EU Services' IT department announced an internal reorganization. As a result, $5 million of after-tax costs, which includes separationbenefits as well as outside services for strategic consulting to establish the new IT organization, were incurred. See Note 13 to the Financial Statementsfor additional information.
(b) During 2017, PPL recorded a deferred income tax benefit for the enactment of the TCJA. See Note 6 to the Financial Statements for additionalffinformation.
The changes in the components of the Pennsylvania Regulated segment's results between these periods were due to the factorsset forth below, which reflect amounts classified as Pennsylvania Adjusted Gross Margins and the items that management considers special on separate lines and not in their respective Statement of Income line items.

38
2018 vs. 2017 2017 vs. 2016 Pennsylvania Adjusted Gross Margins $ 28 $ 31Other operation and maintenance 3 44Depreciation (30) (35)Taxes, other than income — 1Other Income (Expense) - net 15 (3)Interest Expense (17) (13)Income Taxes 88 (14)Earnings from Ongoing Operations 87 11Special Items, after-tax (15) 10Net Income $ 72 $ 21
• See "Adjusted Gross Margins - Changes in Adjusted Gross Margins" for an explanation of Pennsylvania Adjusted Gross Margins.
• Lower other operation and maintenance expense in 2018 compared with 2017 primarily due to $36 million of lower corporate service costs allocated to PPL Electric, partially offset by $11 million of higher non-recoverable storm expensesand $11 million of higher bad debt expense.
• Lower other operation and maintenance expense in 2017 compared with 2016 primarily due to $17 million of lower bad debt expense, $17 million of lower vegetation management expenses and $14 million of lower payroll expenses, partially offset by $19 million of higher corporate service costs allocated to PPL Electric.
• Higher depreciation expense in 2018 compared with 2017 and 2017 compared with 2016 primarily due to additional assets placed into service, related to the ongoing efforts to ensure the reliability of the delivery system and the replacement of aging infrastructure, net of retirements.
• Higher interest expense in 2018 compared with 2017 primarily due to the May 2017 issuance of $475 million of 3.95%First Mortgage Bonds and the June 2018 issuance of $400 million of 4.15% First Mortgage Bonds.
• Higher interest expense in 2017 compared with 2016 primarily due to the issuance of $475 million of 3.95% First Mortgage Bonds in May 2017.
• Lower income taxes in 2018 compared with 2017 primarily due to the impact of the U.S federal corporate income tax rate reduction from 35% to 21%, as enacted by the TCJA, effective January 1, 2018 of $71 million and $18 million of lower income taxes due to amortization of excess deferred income taxes.
• Higher income taxes in 2017 compared with 2016 primarily due to higher pre-tax income at current period tax rates.
Reconciliation of Earnings from Ongoing Operations g g g p
The following tables contain after-tax gains (losses), in total, which management considers special items, that are excluded from Earnings from Ongoing Operations and a reconciliation to PPL's "Net Income" for the years ended December 31.
2018 U.K.
Regulated KY
Regulated PA
RegulatedCorporateand Other Total
Net Income $ 1,114 $ 411 $ 431 $ (129) $ 1,827Less: Special Items (expense) benefit: Foreign currency economic hedges, net of tax of ($39) 148 — — — 148U.S. tax reform (a) 3 2 — (5) —Kentucky state tax reform (b) — (9) — — (9)IT transformation, net of tax of $2 — — (5) — (5)Talen litigation costs, net of tax of $2 (c) — — — (7) (7)Death benefit, net of tax of $1 (5) — — — (5)Total Special Items 146 (7) (5) (12) 122Earnings from Ongoing Operations $ 968 $ 418 $ 436 $ (117) $ 1,705

39
(a) During 2018, PPL recorded adjustments to certain provisional amounts recognized in the December 31, 2017 Statement of Income relating to the enactment of the TCJA. See Note 6 to the Financial Statements for additional information.
(b) During 2018, LKE recorded deferred income tax expense, primarily associated with LKE's non-regulated entities, due to the Kentucky corporate income tax rate reduction from 6% to 5%, as enacted by HB 487, effective January 1, 2018. See Note 6 to the Financial Statements for additional information.
(c) During 2018, PPL incurred legal expenses related to litigation with its former affiliate, Talen Montana. See Note 13 to the Financial Statements for additional information.
2017 U.K.
Regulated KY
Regulated PA
Regulated Corporateand Other Total
Net Income $ 652 $ 286 $ 359 $ (169) $ 1,128Less: Special Items (expense) benefit: Foreign currency economic hedges, net of tax of $59 (111) — — — (111)Spinoff of the Supply segment, net of tax of ($1) — — — 4 4U.S. tax reform (a) (122) (112) 10 (97) (321)Settlement of indemnification agreement, net of tax ($2) — 4 — — 4Adjustment to investment, net of tax of $0 — (1) — — (1)Total Special Items (233) (109) 10 (93) (425)Earnings from Ongoing Operations $ 885 $ 395 $ 349 $ (76) $ 1,553
(a) During 2017, PPL recorded deferred income tax (expense) benefit related to the enactment of the TCJA. See Note 6 to the Financial Statements for additional information.
2016 U.K.
Regulated KY
Regulated PA
RegulatedCorporateand Other Total
Net Income $ 1,246 $ 398 $ 338 $ (80) $ 1,902Less: Special Items (expense) benefit: Foreign currency economic hedges, net of tax of $4 (8) — — — (8)Spinoff of the Supply segment, net of tax of $2 — — — (3) (3)Settlement of foreign currency contracts, net of tax of ($108) 202 — — — 202Change in U.K. tax rate 37 — — — 37Total Special Items 231 — — (3) 228Earnings from Ongoing Operations $ 1,015 $ 398 $ 338 $ (77) $ 1,674
Adjusted Gross Marginsj g
Management also utilizes the following non-GAAP financial measures as indicators of performance for its businesses.
• "U.K. Adjusted Gross Margins" is a single financial performance measure of the electricity distribution operations of the U.K. Regulated segment. In calculating this measure, direct costs such as connection charges from National Grid, whichowns and manages the electricity transmission network in England and Wales, and Ofgem license fees (recorded in "Other operation and maintenance" on the Statements of Income) are deducted from operating revenues, as they are costs passed through to customers. As a result, this measure represents the net revenues from the delivery of electricity across WPD's distribution network in the U.K. and directly related activities.
• "Kentucky Adjusted Gross Margins" is a single financial performance measure of the electricity generation, transmission and distribution operations of the Kentucky Regulated segment, LKE, LG&E and KU, as well as the Kentucky Regulated segment's, LKE's and LG&E's distribution and sale of natural gas. In calculating this measure, fuel, energy purchases and certain variable costs of production (recorded in "Other operation and maintenance" on the Statements of Income) are deducted from operating revenues. In addition, certain other expenses, recorded in "Other operation and maintenance","Depreciation" and "Taxes, other than income" on the Statements of Income, associated with approved cost recoverymechanisms are offset against the recovery of those expenses, which are included in revenues. These mechanisms allowfor direct recovery of these expenses and, in some cases, returns on capital investments and performance incentives. As a result, this measure represents the net revenues from electricity and gas operations.
• "Pennsylvania Adjusted Gross Margins" is a single financial performance measure of the electricity transmission and distribution operations of the Pennsylvania Regulated segment and PPL Electric. In calculating this measure, utilityrevenues and expenses associated with approved recovery mechanisms, including energy provided as a PLR, are offset

40
with minimal impact on earnings. Costs associated with these mechanisms are recorded in "Energy purchases," "Other operation and maintenance," (which are primarily Act 129, Storm Damage and Universal Service program costs), "Depreciation" (which is primarily related to the Act 129 Smart Meter program) and "Taxes, other than income," (which isprimarily gross receipts tax) on the Statements of Income. This measure represents the net revenues from the PennsylvaniaRegulated segment's and PPL Electric's electricity delivery operations.
These measures are not intended to replace "Operating Income," which is determined in accordance with GAAP, as an indicator of overall operating performance. Other companies may use different measures to analyze and report their results of operations.Management believes these measures provide additional useful criteria to make investment decisions. These performance measures are used, in conjunction with other information, by senior management and PPL's Board of Directors to manage operations and analyze actual results compared with budget.
Changes in Adjusted Gross Margins g j g
The following table shows Adjusted Gross Margins by PPL's reportable segments and by component, as applicable, for the year yended December 31 as well as the changes between periods. The factors that gave rise to the changes are described following the table.
Change
2018 2017 20162018 vs.
20172017 vs.
2016U.K. Regulated U.K. Adjusted Gross Margins $ 2,089 $ 1,952 $ 2,067 $ 137 $ (115)
Impact of changes in foreign currency exchange rates 98 (145)U.K. Adjusted Gross Margins excluding impact of foreign currency exchange rates $ 39 $ 30
Kentucky Regulated Kentucky Adjusted Gross Margins
LG&E $ 922 $ 910 $ 887 $ 12 $ 23KU 1,119 1,128 1,122 (9) 6
Total Kentucky Adjusted Gross Margins $ 2,041 $ 2,038 $ 2,009 $ 3 $ 29
Pennsylvania RegulatedPennsylvania Adjusted Gross Margins
Distribution $ 924 $ 958 $ 960 $ (34) $ (2)Transmission 549 487 454 62 33
Total Pennsylvania Adjusted Gross Margins $ 1,473 $ 1,445 $ 1,414 $ 28 $ 31
U.K. Adjusted Gross Margins
U.K. Adjusted Gross Margins, excluding the impact of changes in foreign currency exchange rates, increased in 2018 compared with 2017 primarily due to $52 million from the April 1, 2018 price increase, parm tially offset by $10 million from the April 1,2017 price decrease, driven by lower true-up mechanisms partially offset by higher base demand revenue.
U.K. Adjusted Gross Margins, excluding the impact of changes in foreign currency exchange rates, increased in 2017 compared with 2016 primarily due to $81 million from the April 1, 2016 price increase, partiam lly offset by $30 million from lower volumes and $21 million from the April 1, 2017 price decrease, which includes lower true-up mechanisms partially offset by higher base demand revenue.
Kentucky Adjusted Gross Margins
Kentucky Adjusted Gross Margins increased in 2018 compared with 2017 primarily due to $63 million of increased sales volumes related to favorable weather in 2018 ($23 million at LG&E and $40 million at KU), higher base rates of $58 million($32 million at LG&E and $26 million at KU) as new base rates were approved by the KPSC effective July 1, 2017ff , returns onadditional environmental capital investments of $19 million ($12 million at LG&E and $7 million at KU) and other factors that were not individually significant in comparison to the prior year, partially offset by $143 million of income tax savings owed to

41
customers ($67 million at LG&E and $76 million at KU) related to the impact of U.S. federal corporate income tax ratereduction from 35% to 21%, as enacted by the TCJA, effective January 1, 2018.
Kentucky Adjusted Gross Margins increased in 2017 compared with 2016 primarily due to higher base rates of $58 million ($32 million at LG&E and $26 million at KU) as new base rates were approved by the KPSC effective July 1, 2017 and gascost recoveries added to base rates of $5 million at LG&E, partially offset by $41 million of lower sales volumes due to milderrrweather in 2017 ($15 million at LG&E and $26 million at KU).
Pennsylvania Adjusted Gross Margins
Distribution
Distribution Adjusted Gross Margins decreased in 2018 compared with 2017 primarily due to a $37 million net of gross receipts tax impact of the estimated income tax savings owed to customers for the period January 1, 2018 through June 30,2018 and $38 million from the negative surcharge beginning on July 1, 2018, as a result of the impact of the U.S. federal corporate income tax rate reduction from 35% to 21%, as enacted by the TCJA. These decreases were partially offset by $43 million of higher electricity sales volumes primarily due to weather.
Distribution Adjusted Gross margins decreased in 2017 compared with 2016 primarily due to $10 million of lower electricity sales volumes due to milder weather in 2017, partially offset by $7 million of returns on additional Smart Meter capital tinvestments.
Transmission
Transmission Adjusted Gross Margins increased in 2018 compared with 2017 primarily due to increases of $78 million from returns on additional transmission capital investments focused on replacing aging infrastructure and improving reliability and $25 million as a result of a higher annual PPL zonal peak load billing factor in the first five months of 2018, partially offset by$38 million from the impact of the reduced federal income taxes as a result of the TCJA.
Transmission Adjusted Gross Margins increased in 2017 compared with 2016 primarily due to an increase of $51 million from returns on additional transmission capital investments focused on replacing aging infrastructure and improving reliability, partially offset by a $17 million decrease as a result of a lower annual PPL zonal peak load billing factor which affected transmission revenue in the first five months of 2017.
Reconciliation of Adjusted Gross Margins j g
The following tables contain the components from the Statement of Income that are included in the non-GAAP financialmeasures and a reconciliation to PPL's "Operating Income" for the years ended December 31.
2018 U.K.
AdjustedGross
Margins
Kentucky Adjusted
Gross Margins
PennsylvaniaAdjusted
Gross Margins Other (a)
OperatingIncome (b)
Operating Revenues $ 2,230 (c) $ 3,214 $ 2,277 $ 64 $ 7,785Operating Expenses
Fuel — 799 — — 799Energy purchases — 201 544 — 745Other operation and maintenance 141 98 121 1,623 1,983Depreciation — 70 35 989 1,094Taxes, other than income — 5 104 203 312
Total Operating Expenses 141 1,173 804 2,815 4,933Total $ 2,089 $ 2,041 $ 1,473 $ (2,751) $ 2,852

42
2017 U.K.
AdjustedGross
Margins
Kentucky Adjusted
Gross Margins
PennsylvaniaAdjusted
Gross Margins Other (a)
OperatingIncome (b)
Operating Revenues $ 2,050 (c) $ 3,156 $ 2,195 $ 46 $ 7,447Operating Expenses
Fuel — 759 — — 759Energy purchases — 178 507 — 685Other operation and maintenance 98 111 120 1,473 1,802Depreciation — 64 21 923 1,008Taxes, other than income — 6 102 184 292
Total Operating Expenses 98 1,118 750 2,580 4,546Total $ 1,952 $ 2,038 $ 1,445 $ (2,534) $ 2,901
2016 U.K.
AdjustedGross
Margins
Kentucky Adjusted
Gross Margins
PennsylvaniaAdjusted
Gross Margins Other (a)
OperatingIncome (b)
Operating Revenues $ 2,165 (c) $ 3,141 $ 2,156 $ 55 $ 7,517Operating Expenses
Fuel — 791 —— — 791Energy purchases — 171 535 — 706Other operation and maintenance 98 109 108 1,542 1,857Depreciation — 56 — 870 926Taxes, other than income — 5 99 197 301
Total Operating Expenses 98 1,132 742 2,609 4,581Total $ 2,067 $ 2,009 $ 1,414 $ (2,554) $ 2,936
(a) Represents amounts excluded from Adjusted Gross Margins.(b) As reported on the Statements of Income.(c) 2018, 2017 and 2016 exclude $38 million, $41 million and $42 million of ancillary revenues.
2019 Outlook
(PPL)
Lower net income is projected in 2019 compared with 2018. The decrease in net income primarily reflects the 2018 favorable impact of unrealized gains on foreign currency economic hedges. Excluding 2018 special items, net income is expected to increase primarily attributable to increases in the U.K. Regulated segment and the Corporate and Other category. The followingprojections and factors underlying these projections (on an after-tax basis) are provided for PPL's segments and the Corporateand Other category and the related Registrants.
(PPL's U.K. Regulated Segment)
Lower net income is projected in 2019 compared with 2018. The decrease in net income reflects the 2018 favorable impact of unrealized gains on foreign currency economic hedges. Excluding 2018 special items, net income is expected to increase driven primarily by higher revenues from higher prices, higher pension income and higher assumed GBP exchange rates, partially offset by higher interest expense and higher income taxes.
(PPL's Kentucky Regulated Segment and LKE, LG&E and KU)
Comparable net income is projected in 2019 compared with 2018, primarily driven by higher base electricity and gas rates and returns on additional environmental capital investments, offset by an assumed return to normal weather, higher operation and nmaintenance expense, higher depreciation expense and higher interest expense.

43
(PPL's Pennsylvania Regulated Segment and PPL Electric)
Comparable net income is projected in 2019 compared with 2018, driven primarily by higher returns on transmissioninvestments and lower operation and maintenance expense, offset by higher depreciation expense and an assumed return tonormal weather.
(PPL's Corporate and Other Category)
Lower costs are projected in 2019 compared with 2018, driven primarily by lower expenses and other factors.
(All Registrants)
Earnings in future periods are subject to various risks and uncertainties. See "Business," the rest of this section, and Notes 1, 7 and 13 to the Financial Statements (as applicable) for a discussion of the risks, uncertainties and factors that may impact future ttearnings.
Financial Condition
Liquidity and Capital Resources
(All Registrants)
The Registrants' cash flows from operations and access to cost effective bank and capital markets are subject to risks and uncertainties.
The Registrants had the following at:
PPL (a)PPL
Electric LKE LG&E KU December 31, 2018 Cash and cash equivalents $ 621 $ 267 $ 24 $ 10 $ 14Short-term debt 1,430 — 514 279 235Long-term debt due within one year 530 — 530 434 96Notes payable with affiliates — 113 — —
December 31, 2017 Cash and cash equivalents $ 485 $ 49 $ 30 $ 15 $ 15Short-term debt 1,080 — 244 199 45Long-term debt due within one year 348 — 98 98 —Notes payable with affiliates — 225 — —
December 31, 2016 Cash and cash equivalents $ 341 $ 13 $ 13 $ 5 $ 7Short-term debt 923 295 185 169 16Long-term debt due within one year 518 224 194 194 —Notes payables with affiliates — 163 — —
(a) At December 31, 2018, $3 million of cash and cash equivalents were denominated in GBP. If these amounts would be remitted as dividends, PPL would not anticipate an incremental U.S. tax cost. See Note 6 to the Financial Statements for additional information on undistributed earnings of WPD.d
(All Registrants)
Net cash provided by (used in) operating, investing and financing activities for the years ended December 31 and the changes between periods were as follows.
PPLPPL
Electric LKE LG&E KU 2018Operating activities $ 2,821 $ 978 $ 915 $ 443 $ 581Investing activities (3,361) (1,193) (1,116 ) (554) (561)Financing activities 690 433 195 106 (21)

44
PPLPPL
Electric LKE LG&E KU
2017Operating activities $ 2,461 $ 880 $ 1,099 $ 512 $ 634Investing activities (3,161) (1,252) (888) (458) (428)Financing activities 824 408 (194 ) (44) (198)
2016Operating activities $ 2,890 $ 872 $ 1,027 $ 482 $ 606Investing activities (2,926) (1,130) (790 ) (439) (349)Financing activities (439) 224 (254) (57) (261)
2018 vs. 2017 Change Operating activities $ 360 $ 98 $ (184 ) $ (69) $ (53)Investing activities (200) 59 (228) (96) (133)Financing activities (134) 25 389 150 177
2017 vs. 2016 Change Operating activities $ (429) $ 8 $ 72 $ 30 $ 28Investing activities (235) (122) (98 ) (19) (79)Financing activities 1,263 184 60 13 63
Operating Activities p g
The components of the change in cash provided by (used in) operating activities were as follows.
PPLPPL
Electric LKE LG&E KU 2018 vs. 2017Change - Cash Provided (Used):
NNet income $ 699 $ 68 $ 129 $ 20 $ 27Non-cash components (752) (106) (182 ) (59) (94)Working capital 199 134 34 51 89Defined benefit plan funding 204 (4) (96 ) (57) (31)Other operating activities 10 6 (69) (24) (44)
Total $ 360 $ 98 $ (184 ) $ (69) $ (53)
2017 vs. 2016 Change - Cash Provided (Used):
NNet income $ (774) $ 22 $ (113 ) $ 10 $ (6)Non-cash components 363 100 31 (8) 42Working capital 38 (87) 93 (33) (14)Defined benefit plan funding (138) (24) 50 42 (3)Other operating activities 82 (3) 11 19 9
Total $ (429) $ 8 $ 72 $ 30 $ 28
(PPL)
PPL had a $360 million increase in cash provided by operating activities in 2018 compared with 2017.• Net income increased $699 million between periods and included a decrease in net non-cash charges of $752 million.
The decrease in net non-cash charges was primarily due to an increase in unrealized gains on hedging activities, adecrease in deferred income taxes (primarily due to the unfavorable adjustments recorded in 2017 for the tax changesrelated to the enactment of TCJA) and an increase in the U.K. net periodic defined benefit credits (primarily due to an increase in expected returns on higher asset balances).
• The $199 million increase in cash from changes in working capital was primarily due to a decrease in unbilled revenue(primarily due to lower volumes due to milder temperatures in December 2018 versus December 2017), an increase in
45
accounts payable (primarily due to timing of payments), a decrease in accounts receivable (primarily due to timing of receipts) and a decrease in net regulatory assets and liabilities (primarily due to the impact of the TCJA and timing of rate recovery mechanisms), partially offset by a decrease in customer deposits and an increase in fuel, materials and supplies (primarily due to higher generation driven by weather in 2018 compared with 2017).
• Defined benefit plan funding was $204 million lower in 2018. The decrease was primarily due to the acceleration of WPD's contributions to its U.K. pension plans in 2017.
PPL had a $429 million decrease in cash provided by operating activities in 2017 compared with 2016.• Net income declined $774 million between periods and included net non-cash benefits of $363 million. The increase
in net non-cash benefits was primarily due to an increase in unrealized losses on hedging activities, an increase indeferred income taxes (primarily due to the impact of the TCJA) and an increase in depreciation expense (primarily due to additional assets placed into service, net of retirements, and higher depreciation rates at LG&E and KUeffective July 1, 2017, partially offset by the impact of foreign currency at WPD), partially offset by an increase in theU.K. net periodic defined benefit credits (primarily due to a decrease in the U.K. pension plan discount rates used to calculate the interest cost component of the net periodic defined benefit costs (credits) and increase in expected returns).
• The $38 million increase in cash from changes in working capital was primarily due a decrease in net regulatory assetsand liabilities (due to timing of rate recovery mechanisms), a decrease in fuel, materials and supplies (primarily due to a decrease in fuel purchases due to lower generation driven by milder weather in 2017 compared to 2016) and adecrease in unbilled revenue (primarily due to lower growth in volumes in 2017 compared to 2016), partially offset by a decrease in accounts payable (due to timing of payments), a decrease in taxes payable (primarily due to the timing of payments) and an increase in accounts receivable.
• Defined benefit plan funding was $138 million higher in 2017. The increase was primarily due to the acceleration of WPD's contributions to its U.K. pension plans.
(PPL Electric)
PPL Electric had a $98 million increase in cash provided by operating activities in 2018 compared with 2017.• Net income improved by $68 million between the periods. This included a decrease of $106 million of net non-cash
charges primarily due to a $133 million decrease in deferred income tax expense (primarily due to book versus taxdplant timing differences) partially offset by a $43 million increase in depreciation expense (primarily due to additional assets placed into service, net of retirements, related to the ongoing efforts to ensure the reliability of the delivery ysystem, the replacement of aging infrastructure as well as the roll-out of the Act 129 Smart Meter Program).
• The $134 million increase in cash from changes in working capital was primarily due to a decrease in accounts receivable (primarily due to the timing of receipts including the 2017 federal income tax benefit refund received in 2018) and a decrease in unbilled revenues (primarily due to colder weather in December 2017).
PPL Electric had an $8 million increase in cash provided by operating activities in d 2017 compared with 2016. • Net income improved by $22 million between the periods. This included an additional $100 million of net non-cash
benefits primarily due to a $56 million increase in depreciation expense (primarily due to additional assets placed intoservice, related to the ongoing efforts to ensure the reliability of the delivery system and the replacement of aginginfrastructure as well as the roll-out of the Act 129 Smart Meter program, net of retirements) and a $37 million increase in deferred income taxes (primarily due to book versus tax plant timing differences).
• The $87 million decrease in cash from changes in working capital was primarily due to an increase in accounts receivable (primarily due to a 2017 federal income tax benefit refund, not yet received), a decrease in accounts payable (primarily due to timing of payments) and an increase in prepayments (primarily due to an increase in the2017 gross receipts tax prepayment compared to 2016), partially offset by an decrease in net regulatory assets and liabilities (due to timing of rate recovery mechanisms) and a decrease in unbilled revenue (primarily due to lower growth in volumes in 2017 compared to 2016).
• Pension funding was $24 million higher in 2017 due to contributions made in 2017 to the PPL Retirement Plan.

46
(LKE)
LKE had a $184 million decrease in cash provided by operating activities in 2018y compared with 2017. • Net income increased $129 million between the periods and included a decrease in net non-cash charges of $182
million. The decrease in net non-cash charges was primarily driven by a decrease in deferred income tax expense (primarily due to book versus tax plant timing differences and the impacts of federal and state tax reform), partiallyoffset by an increase in depreciation expense (primarily due to higher depreciation rates effective July 1, 2017 and additional assets placed into service, net of retirements).
• The increase in cash from changes in working capital was primarily drivenn by a decrease in unbilled revenues n(primarily due to milder weather in December 2018 compared to 2017), an increase in accounts payable (primarily due to timing of payments) and a decrease in net regulatory assets and liabilities (primarily due to the impact of the TJCA and the timing of rate recovery mechanisms), partially offset by a decrease in other current liabilities and accrued taxes (primarily due to timing of payments) and an increase in fuel purchases (primarily due to higher generation driven by weather in 2018 compared with 2017).
• Defined benefit plan funding was $96 million higher in 2018.
• The decrease in cash from LKE's other operating activities was driven primarily by an increase in ARO expendituresand an increase in other assets (primarily due to non-current regulatory asset increases as a result of significant storm activity).
LKE had a $72 million increase in cash provided by operating activities in 2017 compared with 2016. • Net income decreased $113 million between the periods and included an increase in net non-cash charges of $31
million. The increase in net non-cash charges was primarily driven by increases in depreciation expense and deferred income taxes (primarily due to the impact of the TCJA).
• The increase in cash from changes in working capital was driven primarily by an increase in other current liabilities(due to customer advances and the timing of payments), a decrease in fuel purchases (primarily due to lower generation driven by milder weather in 2017 compared to 2016), an increase in taxes payable (primarily due to thetiming of payments), partially offset by a decrease in accounts payable (primarily due to the timing of payments).
• Defined benefit plan funding was $50 million lower in 2017.
(LG&E)
LG&E had a $69 million decrease in cash provided by operating activities in 201y 8 compared with 2017. • Net income increased $20 million between the periods and included a decrease in net non-cash charges of $59 million.
The decrease in net non-cash charges was primarily driven by a decrease in deferred income tax expense (primarilydue to book versus tax plant timing differences and the impacts of federal and state tax reform), partially offset by an increase in depreciation expense (primarily due to higher depreciation rates effective July 1, 2017 and additional assetsplaced into service, net of retirements).
• The increase in cash from changes in working capital was primarily drivenn by a decrease in unbilled revenues n(primarily due to milder weather in December 2018 compared to 2017), an increase in accounts payable and accrued taxes (primarily due to timing of payments) and a decrease in net regulatory assets and liabilities (primarily due to thenimpact of the TJCA and the timing of rate recovery mechanisms), partially offset by a decrease in other current liabilities (primarily due to timing of payments).
• Defined benefit plan funding was $57 million higher in 2018.
• The decrease in cash from LG&E’s other operating activities was driven primarily by an increase in other assets(primarily due to non-current regulatory asset increases as a result of significant storm activity).
LG&E had a $30 million increase in cash provided by operating activities in 201y 7 compared with 2016. • Net income increased $10 million between the periods and included a decrease in net non-cash charges of $8 million.
The decrease in net non-cash charges was primarily driven by a decrease in deferred income tax expense (primarilydue to book versus tax plant timing differences), partially offset by an increase in depreciation expense.
47
• The decrease in cash from changes in working capital was driven primarily by decreases in accounts payable and taxes payable (primarily due to the timing of payments), partially offset by a decrease in accounts receivable from affiliates(due to lower intercompany settlements associated with energy sales and inventory) and an increase in other current liabilities (primarily due to customer advances and the timing of payments).
• Defined benefit plan funding was $42 million lower in 2017.
• The increase in cash from LG&E's other operating activities was driven primarily by lower payments for the settlement of interest rate swaps.
(KU)
KU had a $53 million decrease in cash provided by operating activities in 2018 compared with 2017.• Net income increased $27 million between the periods and included a decrease in net non-cash charges of $94 million.
The decrease in net non-cash charges was primarily driven by a decrease in deferred income tax expense (primarilydue to book versus tax plant timing differences, differences in the utilization of net operating losses and the impacts of federal and state tax reform), partially offset by an increase in depreciation expense (primarily due to higher depreciation rates effective July 1, 2017 and additional assets placed into service, net of retirements).
• The increase in cash from changes in working capital was primarily drivenn by a decrease in unbilled revenues n(primarily due to milder weather in December 2018 compared to 2017), an increase in accrued taxes and accounts payable (primarily due to timing of payments), and a decrease in net regulatory assets and liabilities (primarily due to the impact of the TJCA and the timing of rate recovery mechanisms), partially offset by an increase in fuel purchases(primarily due to higher generation driven by weather in 2018 compared to 2017) and a decrease in other current liabilities (primarily due to timing of payments).
• Defined benefit plan funding was $31 million higher in 2018.
• The decrease in cash from KU’s other operating activities was driven primarily by an increase in ARO expendituresand an increase in other assets (primarily due to noncurrent regulatory asset increases as a result of significant storm activity).
KU had a $28 million increase in cash provided by operating activities in 2017 compared with 2016. • Net income decreased $6 million between the periods and included an increase in net non-cash charges of $42 million.
The increase in net non-cash charges was primarily driven by an increase in deferred income tax expense (primarilydue to the utilization of net operating losses) and an increase in depreciation expense.
• The decrease in cash from changes in working capital was driven primarily by a decrease in taxes payable (primarily due to the timing of payments) and a decrease in accounts payable to affiliates (due to lower intercompany settlementsassociated with energy purchases and inventory), partially offset by a decrease in fuel purchases (primarily due to lower generation driven by milder weather in 2017 compared to 2016) and an increase in accounts payable (primarilyddue to the timing of payments).
Investing Activitiesg
(All Registrants)
The components of the change in cash provided by (used in) investing activities were as follows.
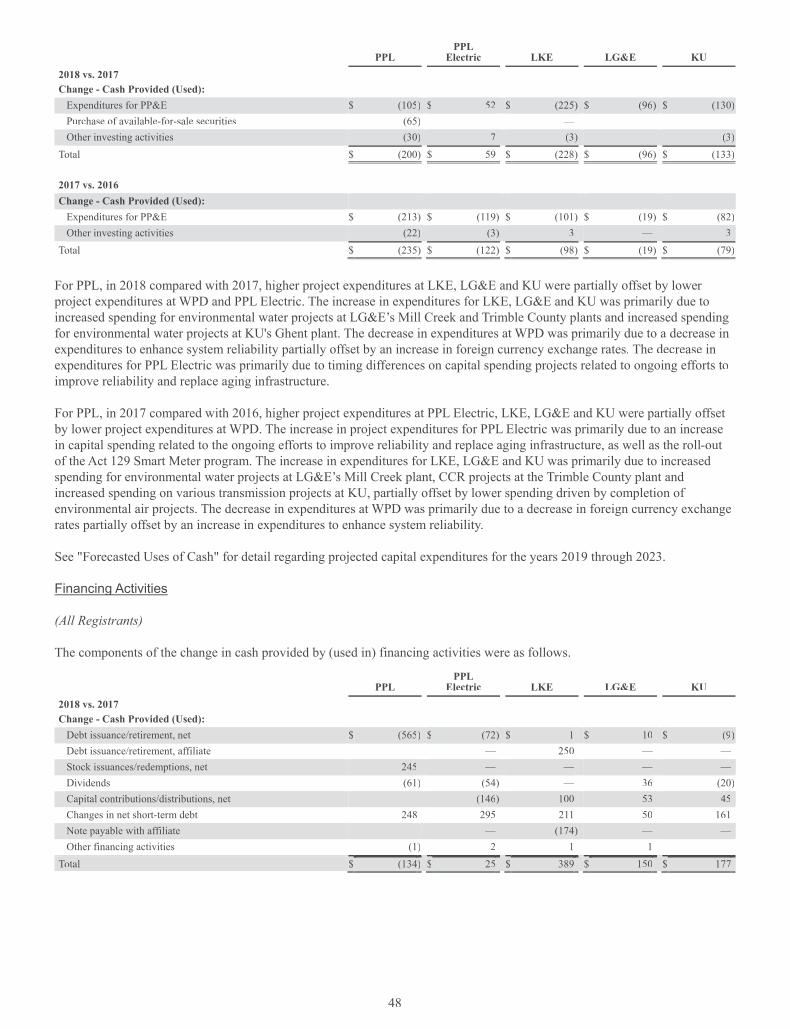
48
PPLPPL
Electric LKE LG&E KU 2018 vs. 2017Change - Cash Provided (Used):
Expenditures for PP&E $ (105) $ 52 $ (225) $ (96) $ (130)Purchase of available-for-sale securities (65) — — — —Other investing activities (30) 7 (3) — (3)
Total $ (200) $ 59 $ (228) $ (96) $ (133)
2017 vs. 2016Change - Cash Provided (Used):
Expenditures for PP&E $ (213) $ (119) $ (101 ) $ (19) $ (82)Other investing activities (22) (3) 3 — 3
Total $ (235) $ (122) $ (98) $ (19) $ (79)
For PPL, in 2018 compared with 2017, higher project expenditures at LKE, LG&E and KU were partially offset by lower project expenditures at WPD and PPL Electric. The increase in expenditures for LKE, LG&E and KU was primarily due toincreased spending for environmental water projects at LG&E’s Mill Creek and Trimble County plants and increased spendingfor environmental water projects at KU's Ghent plant. The decrease in expenditures at WPD was primarily due to a decrease in expenditures to enhance system reliability partially offset by an increase in foreign currency exchange rates. The decrease inexpenditures for PPL Electric was primarily due to timing differences on capital spending projects related to ongoing efforts to improve reliability and replace aging infrastructure.
For PPL, in 2017 compared with 2016, higher project expenditures at PPL Electric, LKE, LG&E and KU were partially offset by lower project expenditures at WPD. The increase in project expenditures for PPL Electric was primarily due to an increasein capital spending related to the ongoing efforts to improve reliability and replace aging infrastructure, as well as the roll-out of the Act 129 Smart Meter program. The increase in expenditures for LKE, LG&E and KU was primarily due to increased spending for environmental water projects at LG&E’s Mill Creek plant, CCR projects at the Trimble County plant and kincreased spending on various transmission projects at KU, partially offset by lower spending driven by completion of environmental air projects. The decrease in expenditures at WPD was primarily due to a decrease in foreign currency exchangerates partially offset by an increase in expenditures to enhance system reliability.x
See "Forecasted Uses of Cash" for detail regarding projected capital expenditures for the years 2019 through 2023.
Financing Activities g
(All Registrants)
The components of the change in cash provided by (used in) financing activities were as follows.
PPLPPL
Electric LKE LG&E KU 2018 vs. 2017Change - Cash Provided (Used):
Debt issuance/retirement, net $ (565) $ (72) $ 1 $ 10 $ (9)Debt issuance/retirement, affiliate — 250 — —Stock issuances/redemptions, net 245 — — — —Dividends (61) (54) — 36 (20)Capital contributions/distributions, net (146) 100 53 45Changes in net short-term debt 248 295 211 50 161NNote payable with affiliate — (174) — —Other financing activities (1) 2 1 1 —
Total $ (134) $ 25 $ 389 $ 150 $ 177

49
PPLPPL
Electric LKE LG&E KU 2017 vs. 2016Change - Cash Provided (Used):
Debt issuance/retirement, net $ 935 $ 470 $ 115 $ 115 $ ——Stock issuances/redemptions, net 309 — — — —Dividends (42) (48) — (64) 22Capital contributions/distributions, net 355 (147 ) (41) (20)Changes in net short-term debt 86 (590) 139 3 61Note payable with affiliate — (47 ) — —Other financing activities (25) (3) — — —
Total $ 1,263 $ 184 $ 60 $ 13 $ 63
(PPL)
For PPL, in 2018 compared with 2017, $134 million less cash from financing activities was required primarily due to improvements in cash from operations of $360 million.
For PPL, in 2017 compared with 2016, cash provided by financing activities increased primarily as a result of an increase incash required to fund capital and general corporate expenditures and a decrease in cash from operations of $429 million. n
(PPL Electric)
For PPL Electric, in 2018 compared with 2017 and 2017 compared with 2016, cash provided by financing activities increased primarily as a result of an increase in cash required to fund capital and general expenditures.
(LKE, LG&E and KU)
For LKE, LG&E and KU, in 2018 compared with 2017 and 2017 compared with 2016, cash provided by financing activities increased primarily as a result of an increase in cash required to fund capital and general corporate expenditures. (All Registrants)
See "Long-term Debt and Equity Securities" below for additional information on current year activity. See "Forecasted Sources of Cash" for a discussion of the Registrants' plans to issue debt and equity securities, as well as a discussion of credit facilitycapacity available to the Registrants. Also see "Forecasted Uses of Cash" for a discussion of PPL's plans to pay dividends oncommon securities in the future, as well as the Registrants' maturities of long-term debt.
Long-term Debt and Equity Securities
Long-term debt and equity securities activity for 2018 included:
Debt Net Stock Issuances (a) Retirements Issuances
Cash Flow Impact:PPL $ 1,059 $ 277 $ 698PPL Electric 398 —LKE 368 27LG&E 100 —KU 18 27
(a) Issuances are net of pricing discounts, where applicable, and exclude the impact of debt issuance costs. Includes debt issuances with affiliates.
See Note 8 to the Financial Statements for additional information about long-term debt.
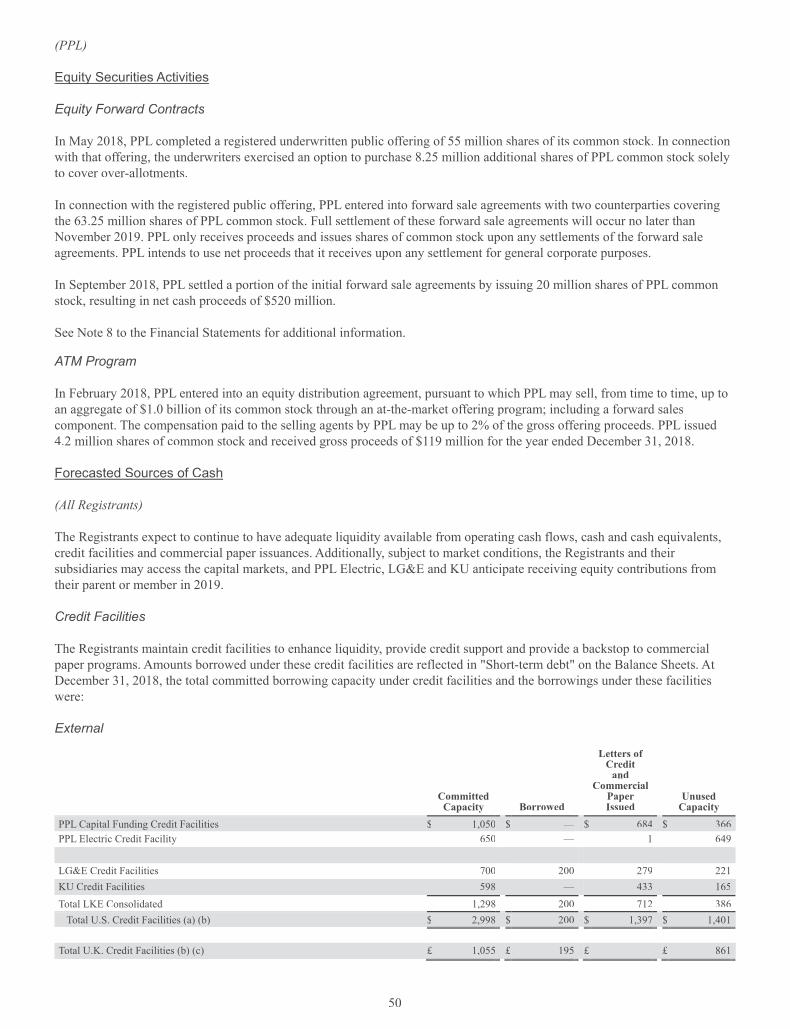
50
(PPL)
Equity Securities Activities q y
Equity Forward Contracts
In May 2018, PPL completed a registered underwritten public offering of 55 million shares of its common stock. In connectionwith that offering, the underwriters exercised an option to purchase 8.25 million additional shares of PPL common stock solelyto cover over-allotments.
In connection with the registered public offering, PPL entered into forward sale agreements with two counterparties coveringthe 63.25 million shares of PPL common stock. Full settlement of these forward sale agreements will occur no later than November 2019. PPL only receives proceeds and issues shares of common stock upon any settlements of the forward sale agreements. PPL intends to use net proceeds that it receives upon any settlement for general corporate purposes.
In September 2018, PPL settled a portion of the initial forward sale agreements by issuf ing 20 million shares of PPL commonstock, resulting in net cash proceeds of $520 million.
See Note 8 to the Financial Statements for additional information.
ATM Program
In February 2018, PPL entered into an equity distribution agreement, pursuant to which PPL may sell, from time to time, up toan aggregate of $1.0 billion of its common stock through an at-the-market offering program; including a forward salesffcomponent. The compensation paid to the selling agents by PPL may be up to 2% of the gross offering proceeds. PPL issued 4.2 million shares of common stock and received gross proceeds of $119 million for the year ended December 31, 2018.
Forecasted Sources of Cash
(All Registrants)
The Registrants expect to continue to have adequate liquidity available from operating cash flows, cash and cash equivalents, credit facilities and commercial paper issuances. Additionally, subject to market conditions, the Registrants and their subsidiaries may access the capital markets, and PPL Electric, LG&E and KU anticipate receiving equity contributions from their parent or member in 2019.
Credit Facilities
The Registrants maintain credit facilities to enhance liquidity, provide credit support and provide a bau ckstop to commercial paper programs. Amounts borrowed under these credit facilities are reflected in "Short-term debt" on the Balance Sheets. At December 31, 2018, the total committed borrowing capacity under credit facilities and the borrowings under these facilities were:
External
CommittedCapacity Borrowed
Letters of Credit
and Commercial
Paper Issued
UnusedCapacity
PPL Capital Funding Credit Facilities $ 1,050 $ — $ 684 $ 366PPL Electric Credit Facility 650 — 1 649
LG&E Credit Facilities 700 200 279 221KU Credit Facilities 598 — 433 165Total LKE Consolidated 1,298 200 712 386
Total U.S. Credit Facilities (a) (b) $ 2,998 $ 200 $ 1,397 $ 1,401
Total U.K. Credit Facilities (b) (c) £ 1,055 £ 195 £ — £ 861
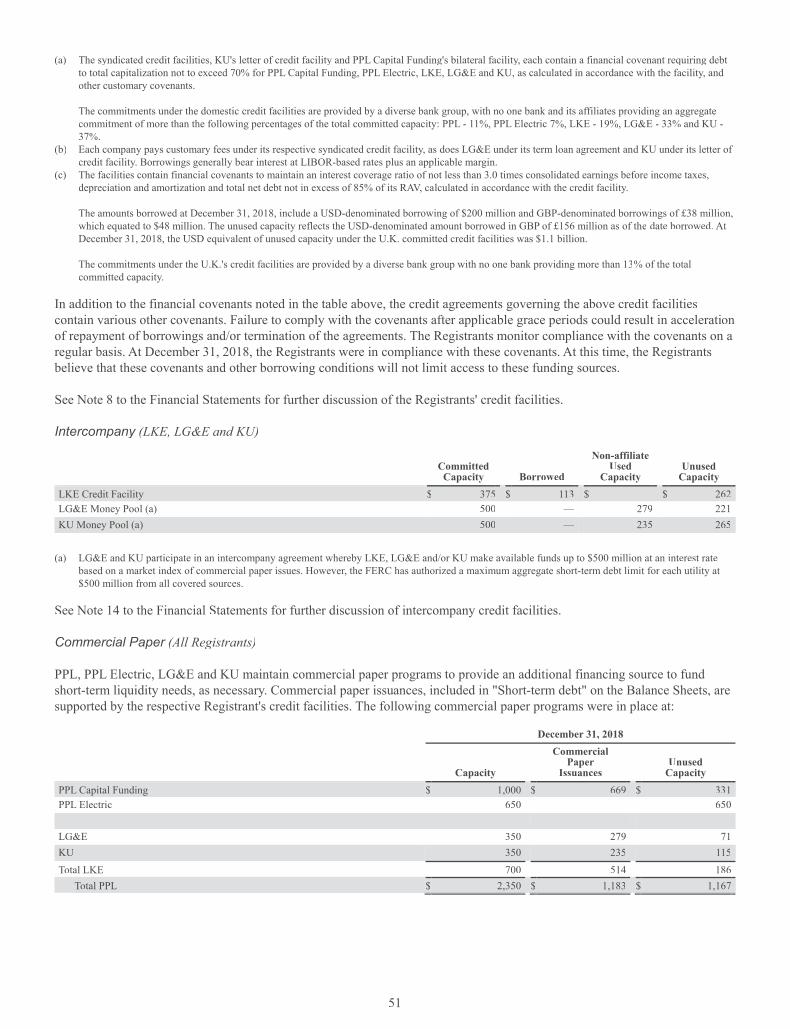
51
(a) The syndicated credit facilities, KU's letter of credit facility and PPL Capital Funding's bilateral facility, each contain a financial covenant requiring debt ffto total capitalization not to exceed 70% for PPL Capital Funding, PPL Electric, LKE, LG&E and KU, as calculated in accordance with the facility, and other customary covenants.
The commitments under the domestic credit facilities are provided by a diverse bank group, with no one bank and its affiliates providing an aggregatecommitment of more than the following percentages of the total committed capacity: PPL - 11%, PPL Electric 7%, LKE - 19%, LG&E - 33% and KU - 37%.
(b) Each company pays customary fees under its respective syndicated credit facility, as does LG&E under its term loan agreement and KU under its letter of credit facility. Borrowings generally bear interest at LIBOR-based rates plus an applicable margin.
(c) The facilities contain financial covenants to maintain an interest coverage ratio of not less than 3.0 times consolidated earnings before income taxes, depreciation and amortization and total net debt not in excess of 85% of its RAV, calculated in accordance with the credit facif lity.
The amounts borrowed at December 31, 2018, include a USD-denominated borrowing of $200 million and GBP-denominated borrowings of £38 million,which equated to $48 million. The unused capacity reflects the USD-denominated amount borrowed in GBP of £156 million as of the date borrowed. At December 31, 2018, the USD equivalent of unused capacity under the U.K. committed credit facilities was $1.1 billion.
The commitments under the U.K.'s credit facilities are provided by a diverse bank group with no one bank providing more than 13% of the total committed capacity.
In addition to the financial covenants noted in the table above, the credit agreements governing the above credit facilities contain various other covenants. Failure to comply with the covenants after applicable grace periods could result in accelerationof repayment of borrowings and/or termination of the agreements. The Registrants monitor compliance with the covenants on a regular basis. At December 31, 2018, the Registrants were in compliance with these covenants. At this time, the Registrants believe that these covenants and other borrowing conditions will not limit access to these funding sources.
See Note 8 to the Financial Statements for further discussion of the Registrants' credit facilities.
Intercompany (LKE, LG&E and KU)y
CommittedCapacity Borrowed
Non-affiliateUsed
CapacityUnused
Capacity LKE Credit Facility $ 375 $ 113 $ — $ 262LG&E Money Pool (a) 500 — 279 221KU Money Pool (a) 500 — 235 265
(a) LG&E and KU participate in an intercompany agreement whereby LKE, LG&E and/or KU make available funds up to $500 million at an interest rate based on a market index of commercial paper issues. However, the FERC has authorized a maximum aggregate short-term debt limit for each utility at $500 million from all covered sources.
See Note 14 to the Financial Statements for further discussion of intercompany credit facilities.
Commercial Paper (All Registrants)r
PPL, PPL Electric, LG&E and KU maintain commercial paper programs to provide an additional financing source to fund short-term liquidity needs, as necessary. Commercial paper issuances, included in "Short-term debt" on the Balance Sheets, are supported by the respective Registrant's credit facilities. The following commercial paper programs were in place at:
December 31, 2018
Capacity
CommercialPaper
IssuancesUnused
CapacityPPL Capital Funding $ 1,000 $ 669 $ 331PPL Electric 650 — 650
LG&E 350 279 71KU 350 235 115Total LKE 700 514 186
Total PPL $ 2,350 $ 1,183 $ 1,167

52
Long-term Debt and Equity Securities
(PPL)
PPL and its subsidiaries are authorized to incur, subject to market conditions, up to $4 billionrr of long-term indebtedness in2019, the proceeds of which would be used to fund capital expenditures and for general corporate purposes.
In 2018, PPL was authorized to issue, subject to market conditions, up to $3.5 billion of equity over three years.
(PPL Electric)
PPL Electric is authorized to incur, subject to market conditions, up to $650 million of long-term indebtedness in 2019, the proceeds of which would be used to fund capital expenditures and for general corporate purposes.
(LKE, LG&E and KU)
LG&E is authorized to incur, subject to market conditions and regulatory approvals, up to $700 million of long-term indebtedness in 2019. The proceeds would be used to pay down LG&E's short-term debt balance, fund capital expenditures and for general corporate purposes. LG&E currently plans to remarket, subject to market conditions, $234 million of its PollutionControl Bonds with put dates in 2019.
KU is authorized to incur, subject to market conditions and regulatory approvals, up to $500 million of long-term indebtedness in 2019, the proceeds of which would be used to pay down KU's short-term debt balances, fund capital expenditures and for general corporate purposes. KU currently plans to remarket, subject to market conditions, $96 million of its Pollution ControlBonds with put dates in 2019.
Contributions from Parent/Member (PPL Electric, LKE, LG&E and KU)
From time to time, LKE's member or the parents of PPL Electric, LG&E and KU make capital contributions to subsidiaries. The proceeds from these contributions are used to fund capital expenditures and for other general corporate purposes and, inthe case of LKE, to make contributions to its subsidiaries.
Forecasted Uses of Cash
(All Registrants)
In addition to expenditures required for normal operating activities, such as purchased power, payroll, fuel and taxes, theRegistrants currently expect to incur future cash outflows for capital expenditures, various contractual obligations, payment ott f dividends on its common stock, distributions by LKE to its member, and possibly the purchase or redemption of a portion of debt securities.
Capital Expenditures
The table below shows the Registrants' current capital expenditure projections for the years 2019 through 2023. Expendituresfor the domestic regulated utilities are expected to be recovered through rates, pending regulatory approval.
Projected Total 2019 (b) 2020 2021 2022 2023
PPL Construction expenditures (a)
Generating facilities $ 855 $ 268 $ 157 $ 193 $ 107 $ 130Distribution facilities 9,327 1,899 1,843 1,880 1,832 1,873Transmission facilities 3,238 867 892 630 482 367Environmental 682 198 112 109 148 115Other 449 101 109 104 72 63
Total Capital Expenditures $ 14,551 $ 3,333 $ 3,113 $ 2,916 $ 2,641 $ 2,548

53
Projected Total 2019 (b) 2020 2021 2022 2023
PPL Electric (a) Distribution facilities $ 1,946 $ 430 $ 408 $ 402 $ 403 $ 303Transmission facilities 2,415 698 702 406 362 247
Total Capital Expenditures $ 4,361 $ 1,128 $ 1,110 $ 808 $ 765 $ 550
LKE
$ 855 $ 268 $ 157 $ 193 $ 107 $ 130Distribution facilities 1,816 432 370 395 305 314Transmission facilities 823 169 190 224 120 120Environmental 682 198 112 109 148 115Other 425 97 101 97 70 60
Total Capital Expenditures $ 4,601 $ 1,164 $ 930 $ 1,018 $ 750 $ 739
LG&E
Generating facilities $ 381 $ 107 $ 62 $ 93 $ 58 $ 61Distribution facilities 1,165 287 239 262 187 190Transmission facilities 173 37 34 42 27 33Environmental 261 71 39 54 67 30Other 201 47 49 46 32 27
Total Capital Expenditures $ 2,181 $ 549 $ 423 $ 497 $ 371 $ 341
KU
Generating facilities $ 474 $ 161 $ 95 $ 100 $ 49 $ 69Distribution facilities 651 145 131 133 118 124Transmission facilities 650 132 156 182 93 87Environmental 421 127 73 55 81 85Other 200 45 48 47 33 27
Total Capital Expenditures $ 2,396 $ 610 $ 503 $ 517 $ 374 $ 392
(a) Construction expenditures include capitalized interest and AFUDC, which are expected to total approximately $81 million for PPL and $50 million for LPPL Electric.
(b) The 2019 total excludes amounts included in accounts payable as of December 31, 2018.
Capital expenditure plans are revised periodically to reflect changes in operational, market and regulatory conditions. For theyears presented, this table includes PPL Electric's asset optimization program to replace aging transmission and distribution assets.
In addition to cash on hand and cash from operations, the Registrants plan to fund capital expenditures in 2019 with proceedsfrom the sources noted below.
Source PPLPPL
Electric LKE LG&E KU Issuance of common stock X Issuance of long-term debt securities X X X X XEquity contributions from parent/member X X X X Short-term debt X X X X X
X = Expected funding source.
Contractual Obligations
The Registrants have assumed various financial obligations and commitments in the ordinary course of conducting business. At December 31, 2018, estimated contractual cash obligations were as follows:

54
Total 2019 2020 - 2021 2022 - 2023 After 2023
PPL Long-term Debt (a) $ 20,694 $ 530 $ 2,514 $ 3,507 $ 14,143Interest on Long-term Debt (b) 14,941 886 1,680 1,474 10,901Operating Leases (c) 116 26 36 21 33Purchase Obligations (d) 3,134 1,165 1,061 406 502Pension Benefit Plan Funding Obligations (e) 784 265 353 166 —Total Contractual Cash Obligations $ 39,669 $ 2,872 $ 5,644 $ 5,574 $ 25,579
PPL Electric Long-term Debt (a) $ 3,739 $ — $ 500 $ 564 $ 2,675Interest on Long-term Debt (b) 3,243 158 310 271 2,504Unconditional Power Purchase Obligations 53 22 31 — —Total Contractual Cash Obligations $ 7,035 $ 180 $ 841 $ 835 $ 5,179
LKE Long-term Debt (a) $ 5,541 $ 530 $ 1,323 $ 13 $ 3,675Interest on Long-term Debt (b) 3,023 212 369 307 2,135Operating Leases (c) 70 20 26 13 11Coal and Natural Gas Purchase Obligations (f) 1,733 614 811 283 25Unconditional Power Purchase Obligations (g) 564 27 53 54 430Construction Obligations (h) 385 291 81 13 —Pension Benefit Plan Obligations (e) 20 20 — — —Other Obligations 328 140 85 56 47Total Contractual Cash Obligations $ 11,664 $ 1,854 $ 2,748 $ 739 $ 6,323
LG&ELong-term Debt (a) $ 1,824 $ 434 $ 98 $ — $ 1,292Interest on Long-term Debt (b) 1,136 66 114 108 848Operating Leases (c) 30 10 10 6 4Coal and Natural Gas Purchase Obligations (f) 942 303 442 177 20Unconditional Power Purchase Obligations (g) 391 19 37 38 297Construction Obligations (h) 143 123 17 3 —Other Obligations 112 42 29 25 16Total Contractual Cash Obligations $ 4,578 $ 997 $ 747 $ 357 $ 2,477
KU Long-term Debt (a) $ 2,342 $ 96 $ 500 $ 13 $ 1,733Interest on Long-term Debt (b) 1,618 93 167 151 1,207Operating Leases (c) 39 10 16 7 6Coal and Natural Gas Purchase Obligations (f) 791 311 369 106 5Unconditional Power Purchase Obligations (g) 173 8 16 16 133Construction Obligations (h) 197 137 53 7 —Other Obligations 135 43 38 23 31Total Contractual Cash Obligations $ 5,295 $ 698 $ 1,159 $ 323 $ 3,115
(a) Reflects principal maturities based on stated maturity or earlier put dates. See Note 8 to the Financial Statements for a discussion of variable-rate remarketable bonds issued on behalf of LG&E and KU. The Registrants do not have any significant capital lease obligations.
(b) Assumes interest payments through stated maturity or earlier put dates. For PPL, LKE, LG&E and KU the payments herein are subject to change, aspayments for debt that is or becomes variable-rate debt have been estimated and for PPL, payments denominated in British pounds sterling have beentranslated to U.S. dollars at a current foreign currency exchange rate.
(c) See Note 9 to the Financial Statements for additional information. (d) The amounts include agreements to purchase goods or services that are enforceable and legally binding and specify all significant terms, including: fixed
or minimum quantities to be purchased; fixed, minimum or variable price provisions; and the approximate timing of the transaction. Primarily includes,as applicable, the purchase obligations of electricity, coal, natural gas and limestone, as well as certain construction expenditures, which are also included in the Capital Expenditures table presented above.
(e) The amounts for PPL include WPD's contractual deficit pension funding requirements arising from actuarial valuations performed in March 2016. The U.K. electricity regulator currently allows a recovery of a substantial portion of the contributions relating to the plan deficit. The amounts also include contributions made or committed to be made in 2019 for PPL's and LKE's U.S. pension plans (for PPL Electric, LG&E and KU includes their share of
55
these amounts). Based on the current funded status of these plans, except for WPD's plans, no cash contributions are required. See Note 11 to theFinancial Statements for a discussion of expected contributions.
(f) Represents contracts to purchase coal, natural gas and natural gas transportation. See Note 13 to the Financial Statements for additional information.(g) Represents future minimum payments under OVEC power purchase agreements through June 2040. See Note 13 to the Financial Statements for
additional information.(h) Represents construction commitments, including commitments for LG&E's and KU's Trimble County landfill construction, CCR Rule Closure and
Process Water Program along with Cane Run plant demolition, which are also reflected in the Capital Expenditures table presented above.
Dividends/Distributions
(PPL)
PPL views dividends as an integral component of shareowner return and expects to continue to pay dividends in amounts that are within the context of maintaining a capitalization structure that supports investment grade credit ratings. In November 201t 8,PPL declared its quarterly common stock dividend, payable January 2, 2019, at 41.0 cents per share (equivalent to $1.64 per annum). On February 14, 2019, PPL announced that the company is increasing its common stock dividend to 41.25 cents per share on a quarterly basis (equivalent to $1.65 per annum). Future dividends will be declared at the discretion of the Board ofDirectors and will depend upon future earnings, cash flows, financial and legal requirements and other relevant factors.
Subject to certain exceptions, PPL may not declare or pay any cash dividend or distribution on its capital stock during anyperiod in which PPL Capital Funding defers interest payments on its 2007 Series A Junior Subordinated Notes due 2067 or 2013 Series B Junior Subordinated Notes due 2073. At December 31, 2018, no interest payments were deferred.
(PPL Electric, LKE, LG&E and KU)
From time to time, as determined by their respective Board of Directors, the Registrants payf dividends or distributions, asapplicable, to their respective shareholders or members. Certain of the credit facilities of PPL Electric, LKE, LG&E and KU include minimum debt covenant ratios that could effectively restrict the payment of dividends or distributions.
(All Registrants)
See Note 8 to the Financial Statements for these and other restrictions related to distributions on capital interests for theRegistrants and their subsidiaries.
Purchase or Redemption of Debt Securities
The Registrants will continue to evaluate outstanding debt securities and may decide to purchaseuu or redeem these securities inopen market or privately negotiated transactions, in exchange transactions or otherwise, depending upon prevailing market conditions, available cash and other factors, and may be commenced or suspended at any time. The amounts involved may be material.
Rating Agency Actionsg g y
Moody's and S&P periodically review the credit ratings of the debt of the Registrants and their subsidiaries. Based on their respective independent reviews, the rating agencies may make certain ratings revisions or ratings affirmations.
A credit rating reflects an assessment by the rating agency of the creditworthiness associated with an issuer and particular securities that it issues. The credit ratings of the Registrants and their subsidiaries are based on information provided by the Registrants and other sources. The ratings of Moody's and S&P are not a recommendation to buy, sell or hold any securities of the Registrants or their subsidiaries. Such ratings may be subject to revisions or withdrawal by the agencies at any time and bshould be evaluated independently of each other and any other rating that may be assigned to the securities.
The credit ratings of the Registrants and their subsidiaries affect their liquidity, access to capital markets and cost of borrowingunder their credit facilities. A downgrade in the Registrants' or their subsidiaries' credit ratings could result in higher borrowingrrcosts and reduced access to capital markets. The Registrants and their subsidiaries have no credit rating triggers that would result in the reduction of access to capital markets or the acceleration of maturity dates of outstanding debt.
The following table sets forth the Registrants' and their subsidiaries' credit ratings for outstanding debt securities or commercial paper programs as of December 31, 2018.
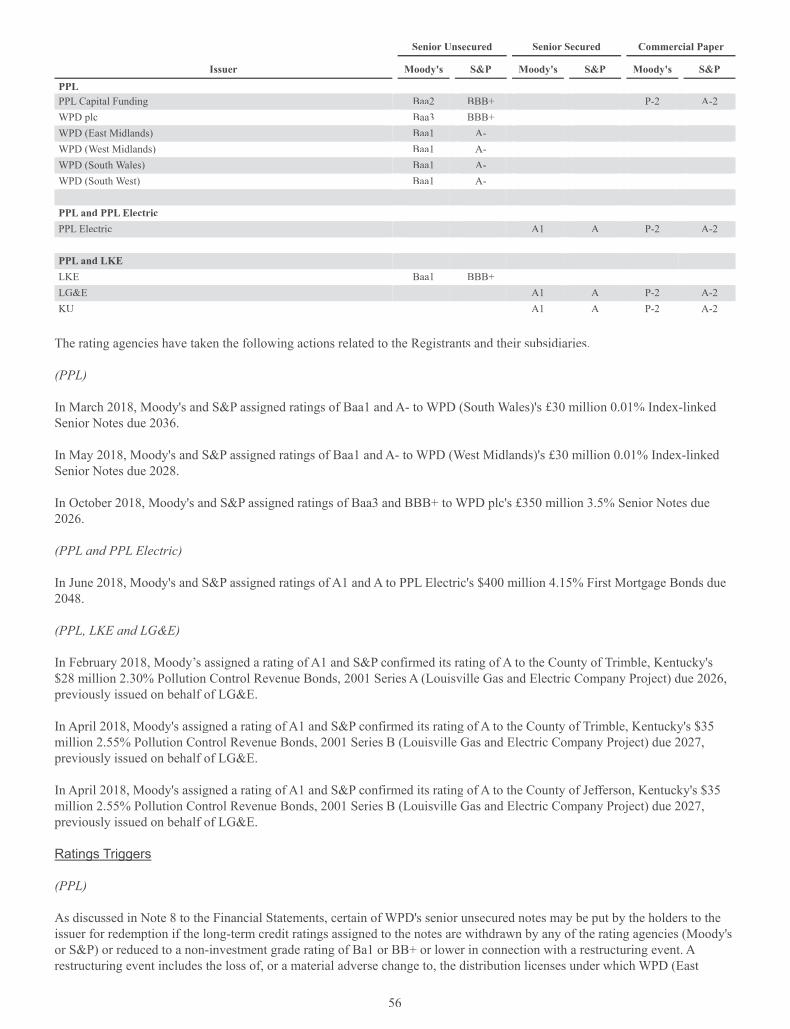
56
Senior Unsecured Senior Secured Commercial Paper
Issuer Moody's S&P Moody's S&P Moody's S&PPPL PPL Capital Funding Baa2 BBB+ P-2 A-2WPD plc Baa3 BBB+ WPD (East Midlands) Baa1 A-WPD (West Midlands) Baa1 A- WPD (South Wales) Baa1 A-WPD (South West) Baa1 A-
PPL and PPL Electric PPL Electric A1 A P-2 A-2
PPL and LKE LKE Baa1 BBB+ LG&E A1 A P-2 A-2KU A1 A P-2 A-2
The rating agencies have taken the following actions related to the Registrants and their subsidiaries.
(PPL)
In March 2018, Moody's and S&P assigned ratings of Baa1 and A- to WPD (South Wales)'s £30 million 0.01% Index-linked Senior Notes due 2036.
In May 2018, Moody's and S&P assigned ratings of Baa1 and A- to WPD (West Midlands)'s £30 million 0.01% Index-linked Senior Notes due 2028.
In October 2018, Moody's and S&P assigned ratings of Baa3 and BBB+ to WPD plc's £350 million 3.5% Senior Notes due 2026.
(PPL and PPL Electric)
In June 2018, Moody's and S&P assigned ratings of A1 and A to PPL Electric's $400 million 4.15% First Mortgage Bonds due 2048.
(PPL, LKE and LG&E)
In February 2018, Moody’s assigned a rating of A1 and S&P confirmed its rating of A to the County of Trimble, Kentucky's$28 million 2.30% Pollution Control Revenue Bonds, 2001 Series A (Louisville Gas and Electric Company Project) due 2026, previously issued on behalf of LG&E.
In April 2018, Moody's assigned a rating of A1 and S&P confirmed its rating d of A to the County of Trimble, Kentucky's $35 million 2.55% Pollution Control Revenue Bonds, 2001 Series B (Louisville Gas and Electric Company Project) due 2027,previously issued on behalf of LG&E.
In April 2018, Moody's assigned a rating of A1 and S&P confirmed its rating d of A to the County of Jefferson, Kentucky's $35million 2.55% Pollution Control Revenue Bonds, 2001 Series B (Louisville Gas and Electric Company Project) due 2027,previously issued on behalf of LG&E.
Ratings Triggers g gg
(PPL)
As discussed in Note 8 to the Financial Statements, certain of WPD's senior unsecured notes may be put by the holders to theissuer for redemption if the long-term credit ratings assigned to the notes are withdrawn by any of the rating agencies (Moody's or S&P) or reduced to a non-investment grade rating of Ba1 or BB+ or lower in connection with a restructuring event. A rrestructuring event includes the loss of, or a material adverse change to, the distribution licenses under which WPD (East

57
Midlands), WPD (South West), WPD (South Wales) and WPD (West Midlands) operate and would be a trigger event for eachcompany. These notes totaled £5.1 billion (approximately $6.5 billion) nominal value at December 31, 2018.
(PPL, LKE, LG&E and KU)
Various derivative and non-derivative contracts, including contracts for the sale and purchase of electricity and fuel, commoditt tytransportation and storage, interest rate and foreign currency instruments (for PPL), contain provisions that require the postingof additional collateral, or permit the counterparty to terminate the contract, if PPL's, LKE's, LG&E's or KU's or their subsidiaries' credit rating, as applicable, were to fall below investment grade. See Note 17 to the Financial Statements for adiscussion of "Credit Risk-Related Contingent Features," including a discussion of the potential additional collateralrequirements for PPL, LKE and LG&E for derivative contracts in a net liability position at December 31, 2018.
Guarantees for Subsidiaries (PPL)
PPL guarantees certain consolidated affiliate financing arrangements. Some of the guarantees contain financial and other covenants that, if not met, would limit or restrict the consolidated affiliates' access to funds under these financing arrangements,accelerate maturity of such arrangements or limit the consolidated affiliates' ability to enter into certain transactions. At thistttime, PPL believes that these covenants will not limit access to relevant funding sources. See Note 13 to the FinancialStatements for additional information about guarantees.
Off-Balance Sheet Arrangements (All Registrants)
The Registrants have entered into certain agreements that may contingently require payment aa to a guaranteed or indemnified party. See Note 13 to the Financial Statements for a discussion of these agreements.
Risk Management
Market Risk
(All Registrants)
See Notes 1, 16, and 17 to the Financial Statements for information about the Registrants' risk management objectives,valuation techniques and accounting designations.
The forward-looking information presented below provides estimates of what may occur in the future, assuming certain adversemarket conditions and model assumptions. Actual future results may differ materially from those presented. These are not precise indicators of expected future losses, but are rather only indicators of possible losses under normal market conditions at a given confidence level.
Interest Rate Risk
The Registrants and their subsidiaries issue debt to finance their operations, which exposes them to interest rate risk. The Registrants and their subsidiaries utilize various financial derivative instruments to adjust the mix of fixed and floating interest rates in their debt portfolios, adjust the duration of their debt portfolios and lock in benchmark interest rates in anticipation of future financing, when appropriate. Risk limits under the risk management program are designed to balance risk exposure tovolatility in interest expense and changes in the fair value of the debt portfolios due to changes in the absolute level of interest rates. In addition, the interest rate risk of certain subsidiaries is potentially mitigf ated as a result of the existing regulatory framework or the timing of rate cases.
The following interest rate hedges were outstanding at December 31.

58
2018 2017
ExposureHedged
Fair Value, Net - Asset (Liability)
(a)
Effect of a 10%
Adverse Movementin Rates (b)
Maturities Ranging Through
Exposure Hedged
Fair Value,Net - Asset (Liability)
(a)
Effect of a 10%
Adverse Movement in Rates (b)
PPL Cash flow hedges
Cross-currency swaps (c) $ 702 $ 137 $ (76) 2028 $ 702 $ 103 $ (84)Economic hedges
Interest rate swaps (d) 147 (20) (1) 2033 147 (27) (1)LKE Economic hedges
Interest rate swaps (d) 147 (20) (1) 2033 147 (27) (1)LG&EEconomic hedges
Interest rate swaps (d) 147 (20) (1) 2033 147 (27) (1)
(a) Includes accrued interest, if applicable. (b) Effects of adverse movements decrease assets or increase liabilities, as applicable, which could result in an asset becoming a liability. Sensitivities
represent a 10% adverse movement in interest rates, except for cross-currency swaps which also includes a 10% adverse movement in foreign currency exchange rates.
(c) Changes in the fair value of these instruments are recorded in equity and reclassified into earnings in the same period during which the item being hedged affects earnings.
(d) Realized changes in the fair value of such economic hedges are recoverable through regulated rates and any subsequent changes in the fair value of these derivatives are included in regulatory assets or regulatory liabilities.
The Registrants are exposed to a potential increase in interest expense and to changes in the fair value of their debt portfolios.The estimated impact of a 10% adverse movement in interest rates on interest expense at December 31, 2018 and 2017 was insignificant for PPL, PPL Electric, LKE, LG&E and KU. The estimated impact of a 10% adverse movement in interest rateson the fair value of debt at December 31 is shown below.
10% Adverse Movement in Rates
2018 2017 PPL $ 652 $ 620PPL Electric 188 162LKE 172 168LG&E 62 62KU 92 92
Foreign Currency Risk (PPL)k
PPL is exposed to foreign currency risk primarily through investments in and earnings of U.K. affiliates. Under its risk management program, PPL may enter into financial instruments to hedge certain foreign currency exposures, including translation risk of expected earnings, firm commitments, recognized assets or liabilities, anticipated transactions and net investments.
The following foreign currency hedges were outstanding at December 31.
2018 2017
ExposureHedged
Fair Value,Net - Asset(Liability)
Effect of a 10%Adverse
Movement in ForeignCurrencyExchangeRates (a)
MaturitiesRanging Through
Exposure Hedged
Fair Value,Net - Asset(Liability)
Effect of a 10%Adverse
Movement in Foreign CurrencyExchangeRates (a)
Economic hedges (b) £ 1,540 $ 201 $ (181) 2020 £ 2,563 $ 15 $ (323)
(a) Effects of adverse movements decrease assets or increase liabilities, as applicable, which could result in an asset becoming a liability. (b) To economically hedge the translation of expected earnings denominated in GBP.

59
(All Registrants)
Commodity Price Risk
PPL is exposed to commodity price risk through its domestic subsidiaries as described below.
• PPL Electric is required to purchase electricity to fulfill its obligation as a PLR. Potential commodity price risk isinsignificant and mitigated through its PUC-approved cost recovery mechanism and full-requirement supply agreements to serve its PLR customers which transfer the risk to energy suppliers. ff
• LG&E's and KU's rates include certain mechanisms for fuel, fuel-related expenses and energy purchases. In addition, yLG&E's rates include a mechanism for natural gas supply expenses. These mechanisms generally provide for timely recovery of market price fluctuations associated with these expenses.
Volumetric Risk
PPL is exposed to volumetric risk through its subsidiaries as described below.
• WPD is exposed to volumetric risk which is significantly mitigated as a result of the method of regulation in the U.K. dUnder the RIIO-ED1 price control regulations, recovery of such exposure occurs on a two year lag. See Note 1 to the Financial Statements for additional information on revenue recognition under RIIO-ED1. n
• PPL Electric, LG&E and KU are exposed to volumetric risk on retail sales, mainly due to weather and other economicconditions for which there is limited mitigation between rate cases.
Defined Benefit Plans - Equity Securities Price Risk
See "Application of Critical Accounting Policies - Defined Benefits" for additional information regarding the effect of equitysecurities price risk on plan assets.
Credit Risk
(All Registrants)
Credit risk is the risk that the Registrants would incur a loss as a result of nonperformance by counterparties of their contratt ctualobligations. The Registrants maintain credit policies and procedures with respect to counterparty credit (including requirements that counterparties maintain specified credit ratings) and require other assurances in the form of credit support or collateral in certain circumstances in order to limit counterparty credit risk. However, the Registrants, as applicable, have concentrations of suppliers and customers among electric utilities, financial institutions and energy marketing and trading companies. These concentrations may impact the Registrants' overall exposure to credit risk, positively or negatively, as counterparties may be similarly affected by changes in economic, regulatory or other conditions.
(PPL and PPL Electric)
In January 2017, the PUC issued a Final Order approving PPL Electric's PLR procurement plan for the period June 2017through May 2021, which includes a total of eight solicitations for electricity supply semi-annually in April and October. Todate, PPL Electric has conducted four of its planned eight competitive solicitations.
Under the standard Supply Master Agreement (the Agreement) for the competitive solicitation process, PPL Electric requires all suppliers to post collateral if their credit exposure exceeds an established credit limit. In the event a supplier defaults on itsobligation, PPL Electric would be required to seek replacement power in the market. All incremental costs incurred by PPL Electric would be recoverable from customers in future rates. At December 31, 2018, most of the successful bidders under allof the solicitations had an investment grade credit rating from S&P, and were not required to post collateral under the Agreement. A small portion of bidders were required to post an insignificant amount of collateral under the Agreement. There is no instance under the Agreement in which PPL Electric is required to post collateral to its suppliers.
See Note 17 to the Financial Statements for additional information on credit risk.
60
Foreign Currency Translation (PPL)
The value of the British pound sterling fluctuates in relation to the U.S. dollar. In 2018, changes in this exchange rate resulted in a foreign currency translation loss of $453 million, which primarily reflected a $754 million decrease to PP&E and $150 million decrease to goodwill partially offset by a $445 million decrease to long-term debt and a $6 million decrease to other nt et liabilities. In 2017, changes in this exchange rate resulted in a foreign currency translation gain of $537 million, whichprimarily reflected a $935 million increase to PP&E and $198 million increase to goodwill partially offset by a $549 millionincrease to long-term debt and an increase of $47 million to other net liabilities. In 2016, changes in this exchange rate resulted in a foreign currency translation loss of $1.1 billion, which primarily reflected a $2.1 billion decrease to PP&E and $490 million decrease to goodwill partially offset by a $1.3 billion decrease to long-term debt and a decrease of $208 million to other ttnet liabilities.
(All Registrants)
Related Party Transactions
The Registrants are not aware of any material ownership interests or operating responsibility by senior management in outsidepartnerships, including leasing transactions with variable interest entities, or other entities doing business with the Registrants.See Note 14 to the Financial Statements for additional information on related party transactions for PPL Electric, LKE, LG&E and KU.
Acquisitions, Development and Divestitures
The Registrants from time to time evaluate opportunities for potential acquisitions, divestitures and development projects.Development projects are reexamined based on market conditions and other factors to determine whether to proceed with, modify or terminate the projects. Any resulting transactions may impact future financial results.
Capacity Needs (PPL, LKE, LG&E and KU)p y
As a result of environmental requirements and energy efficiency measures, KU anticipates retiring two older coal-fired electricity generating units at the E.W. Brown plant in 2019 with a combined summer rating capacity of 272 MW.
(All Registrants)
Environmental Matters
Extensive federal, state and local environmental laws and regulations are applicable to PPL's, PPL Electric's, LKE's, LG&E'sand KU's air emissions, water discharges and the management of hazardous and solid waste, as well as other aspects of the Registrants' businesses. The cost of compliance or alleged non-compliance cannot be predicted with certainty but could be significant. In addition, costs may increase significantly if the requirements or scope of environmental laws or regulations, or similar rules, are expanded or changed. Costs may take the form of increased capital expenditures or operating and maintenance expenses, monetary fines, penalties or other restrictions. Many of these environmental law considerations are also applicable to the operations of key suppliers, or customers, such as coal producers and industrial power users, and may impact the cost for their products or their demand for the Registrants' services. Increased capital and operating costs are subject to rate recovery. PPL, PPL Electric, LKE, LG&E and KU can provide no assurances as to the ultimate outcome of futureenvironmental or rate proceedings before regulatory authorities.
See below for further discussion of the EPA's CCR Rule and Note 13 to the Financial Statements for a discussion of the moresignificant environmental matters including: Legal Matters, NAAQS, Climate Change and ELGs. See "Financial Condition - Liquidity and Capital Resources - Forecasted Uses of Cash - Capital Expenditures" in "Combined Management's Discussion and Analysis of Financial Condition and Results of Operations" for information on projected environmental capital expenditures for 2019 through 2023. See Note 19 to the Financial Statements for information related to the impacts of CCRs on AROs.
EPA's CCR Rule (PPL, LKE, LG&E and KU)
Over the next several years, LG&E and KU anticipate undertaking extensive measures, including significant capital expenditures, in complying with the provisions of the EPA's CCR Rule. Although LG&E and KU have identified compliance

61
strategies and are finalizing closure plans and schedules as required by the CCR Rule, remaining regulatory uncertainties couldsubstantially impact current plans. As a result of a judicial settlement, legislative amendments, and the EPA's review of thecurrent program, the EPA is in the process of undertaking significant revisions to the CCR Rule. On July 30, 2018, the EPA published certain amendments to the CCR Rule which include extending the deadline for commencement of closure of certain timpoundments from April 2019 to October 31, 2020. The EPA has announced that additional amendments to the rule will beproposed. On August 21, 2018, the D.C. Circuit Court of Appeals vacated and remanded portions of the CCR Rule, includingthe provisions allowing unlined impoundments to continue operating and provisions exempting certain inactive impoundmentsfrom regulation. The exact impact of the judicial decision will be highly dependf ent on the EPA's rulemaking actions on remand and any subsequent legal challenges. LG&E and KU are evaluating the specific plan impacts of developments to date and willcontinue to monitor the EPA's ongoing regulatory proceedings.
In connection with the CCR Rule, LG&E and KU have recorded adjustments to existing AROs beginning in 2015 and continueto record adjustments as required. See Note 19 to the Financial Statements for additional information on AROs. LG&E and KUcontinue to perform technical evaluations related to their plans to close impoundments at all of their generating plants.Although LG&E and KU believe their recorded liabilities appropriately reflect their obligations under current rules, changes tocurrent compliance strategies as a result of ongoing regulatory proceedings or other developments could result in additional closure costs. It is not currently possible to determine the magnitude of any potential cost increases related to changes incompliance strategies or plans, and the timing of future cash outflows are indeterminable at this time. As rules are revised,technical evaluations are completed, and the timing and details of impoundment closures develop further on a plant by-plant basis, LG&E and KU will updated their cost estimates and record any changes as necessary to their ARO liability, which could be material. These costs are subject to rate recovery.

62
Sustainability
Increasing attention has been focused on a broad range of corporate activities under the heading of “sustainability”, which hasresulted in a significant increase in the number of requests from interested parties for information on sustainability topics.These parties range from investor groups focused on environmental, social, governance and other matters to non-investorsconcerned with a variety of public policy matters. Often the scope of the information sought is very broad and not necessarily relevant to an issuer’s business or industry. As a result, a number of private groups have proposed to standardize the subject matter constituting sustainability, either generally or by industry. Those efforts remain ongoing. In addition, certain of thesyy e private groups have advocated that the SEC promulgate regulations requiring specific sustainability reporting under the Securities Exchange Act of 1934, as amended (the “’34 Act”), or that issuers voluntarily include certain sustainabilitydisclosure in their ’34 Act reports. To date, no new reporting requirements have been adopted or proposed by the SEC.
As has been PPL’s practice, to the extent sustainability issues have or may have a material impact on the Registrants’ financialcondition or results of operation, PPL discloses such matters in accordance with applicable securities law and SEC regulations.With respect to other sustainability topics that PPL deems relevant to investors but that are not required to be reported underapplicable securities law and SEC regulation, PPL will continue each spring to publish its annual sustainability report and post that report on its corporate website at www.pplweb.com and on www.pplsustainability.com. Neither the information in suchannual sustainability report nor the information at such websites is incorporated in this Form 10-K by reference, and it shouldnot be considered a part of this Form 10-K. In preparing its sustainability report, PPL is guided by the framework established by the Global Reporting Initiative, which identifies environmental, social, governance and other subject matter categories. PPLrralso participates in efforts by the Edison Electric Institute to provide the appropriate subset of sustainability information that ttcan be applied consistently across the electric utility industry and responds to the CDP climate survey.
Cybersecurity
See “Cybersecurity Management” in “Business” for a discussion of cybersecurity risks affecting the Registrants and the related strategies for managing these risks.
Competition
See "Competition" under each of PPL's reportable segments in "Business - General - Segment Information" for a discussion of competitive factors affecting the Registrants.
New Accounting Guidanceg
See Note 1 and 21 to the Financial Statements for a discussion of new accounting guidance adopted and pending adoption.
Application of Critical Accounting Policies pp g
Financial condition and results of operations are impacted by the methods, assumptions and estimates used in the application ofcritical accounting policies. The following accounting policies are particularly important to an understanding of the reported financial condition or results of operations and require management to make estimates or other judgments of matters that are inherently uncertain. Changes in the estimates or other judgments included within these accounting policies could result in a significant change to the information presented in the Financial Statements (these accounting policies are also discussed in Note 1 to the Financial Statements). Senior management has reviewed with PPL's Audit Committee these critical accounting policies, the following disclosures regarding their application, and the estimates and assumptions regarding them.
Defined Benefits
(All Registrants)
Certain of the Registrants and/or their subsidiaries sponsor or participate in, as applicable, certain qualified funded and nonaa -qualified unfunded defined benefit pension plans and both funded and unfunded other postretirement benefit plans. These plansare applicable to certain of the Registrants' employees (based on eligibility for their applicable plans). The Registrants and certain of their subsidiaries record an asset or liability to recognize the funded status of all defined benefit plans with an offsetting entry to AOCI or, in the case of PPL Electric, LG&E and KU, regulatory assets and liabilities for amounts that are expected to be recovered through regulated customer rates. Consequently, the funded status of all defined benefit plans is fully

63
recognized on the Balance Sheets. See Notes 7 and 11 to the Financial Statements for additional information about the plansand the accounting for defined benefits.
A summary of plan sponsors by Registrant and whether a Registrant or its subsidiaries sponsor (S) or participate in and receivesallocations (P) from those plans is shown in the table below.
Plan Sponsor PPL PPL Electric LKE LG&E KU PPL Services S P WPD (a) S LKE S P P LG&E S
(a) Does not sponsor or participate in other postretirement benefits plans.
Management makes certain assumptions regarding the valuation of benefit obligations and the performance of plan assets. As such, annual net periodic defined benefit costs are recorded in current earnings or regulatory assets and liabilities based on estimated results. Any differences between actual and estimated results are recorded in AOCI, or in the case of PPL Electric,LG&E and KU, regulatory assets and liabilities for amounts that are expected to be recovered through regulated customer rates. These amounts in AOCI or regulatory assets and liabilities are amortized to income over future periods. The delayed recognition allows for a smoothed recognition of costs over the working lives of the employees who benefit under the plans.The significant assumptions are:
• Discount Rate - The discount rate is used in calculating the present value of benefits, which is based on projections of benefit payments to be made in the future. The objective in selecting the discount rate is to measure the single amount that, if invested at the measurement date in a portfolio of high-quality debt instruments, would provide the necessary future cash flows to pay the accumulated benefits when due.
• Expected Return on Plan Assets - Management projects the long-term rates of return on plan assets that will be earned over the life of the plan. These projected returns reduce the net benefit costs the Registrants record currently.
• Rate of Compensation Increase - Management projects employees' annual pay increases, which are used to project employees' pension benefits at retirement.
(PPL)
In selecting the discount rate for its U.K. pension plans, WPD starts with a cash flow analysis of the expected benefit paymentstream for its plans. These plan-specific cash flows are matched against a spot-rate yield curve to determine the assumed discount rate. The spot-rate yield curve uses an iBoxx British pounds sterling denominated corporate bond index as its base. From this base, those bonds with the lowest and highest yields are eliminated to develop an appropriate subset of bonds.Historically, WPD used the single weighted-average discount rate derived from the spot rates used to discount the benefit obligation. Concurrent with the annual remeasurement of plan assets and obligations at December 31, 2015, WPD began using individual spot rates to measure service cost and interest cost beginning with thet calculation of 2016 net periodic defined benefit cost.
An individual bond matching approach, which is used for the U.S. pension plans as discussed below, is not used for the U.K.pension plans because the universe of bonds in the U.K. is not deep enough to adequately support such an approach.
(All Registrants)
In selecting the discount rates for U.S. defined benefit plans, the plan sponsors start with a cash flow analysis of the expected benefit payment stream for their plans. The plan-specific cash flows are matched against the coupons and expected maturityvalues of individually selected bonds. This bond matching process begins with the full universe of Aa-rated non-callable (or callable with make-whole provisions) bonds, serving as the base from which those with the lowest and highest yields are eliminated to develop an appropriate subset of bonds. Individual bonds are then selected based on the timing of each plan's cashflows and parameters are established as to the percentage of each individual bond issue that could be hypothetically purchased and the surplus reinvestment rates to be assumed.

64
To determine the expected return on plan assets, plan sponsors project the long-term rates of return on plan assets using a best-estimate of expected returns, volatilities and correlations for each asset class. Each plan's specific current and expected asset allocations are also considered in developing a reasonable return assumption.
In selecting a rate of compensation increase, plan sponsors consider past experience in light of movements in inflation rates.f
The following table provides the weighted-average assumptions selected for discount rate, expected return on plan assets and rate of compensation increase at December 31 used to measure current year obligations and subsequent year net periodicdefined benefit costs under GAAP, as applicable.
Assumption / Registrant 2018 2017 Discount rate
Pension - PPL (U.S.) 4.35% 3.70%Pension - PPL (U.K.) Obligations 2.98% 2.65%Pension - PPL (U.K.) Service Cost (a) 3.12% 2.73%Pension - PPL (U.K.) Interest Cost (a) 2.62% 2.31%Pension - LKE 4.35% 3.69%Pension - LG&E 4.33% 3.65%Other Postretirement - PPL 4.31% 3.64%Other Postretirement - LKE 4.32% 3.65%
Expected return on plan assetsPension - PPL (U.S.) 7.25% 7.25%Pension - PPL (U.K.) 7.21% 7.23%Pension - LKE 7.25% 7.25%Pension - LG&E 7.25% 7.25%Other Postretirement - PPL 6.46% 6.40%Other Postretirement - LKE 7.00% 7.15%
Rate of compensation increase Pension - PPL (U.S.) 3.79% 3.78%Pension - PPL (U.K.) 3.50% 3.50%Pension - LKE 3.50% 3.50%Other Postretirement - PPL 3.76% 3.75%Other Postretirement - LKE 3.50% 3.50%
(a) WPD uses individual spot rates from the yield curve used to discount the benefit obligation to measure service cost and interest cost for the calculation of net periodic defined benefit cost. PPL's U.S. plans use a single discount rate derived from an individual bond matching model to measure the benefit obligation, service cost and interest cost. See Note 1 to the Financial Statements for additional details.
A variance in the assumptions listed above could have a significant impact on accrued defined benefit liabilities or assets,reported annual net periodic defined benefit costs and AOCI or regulatory assets and liabilities. At December 31, 2018, the defined benefit plans were recorded in the Registrants' financial statements as follows.
PPL PPL Electric LKE LG&E KU Balance Sheet:
Regulatory assets (a) $ 963 $ 558 $ 405 $ 249 $ 156Regulatory liabilities 37 5 32 — 32Pension assets 535 — — — —Pension liabilities 783 285 286 11 1Other postretirement and postemploymentbbenefit liabilities 239 120 100 69 31AOCI (pre-tax) 3,209 — 121 — —
Statement of Income: Defined benefits expense $ (184) $ 3 $ 24 $ 6 $ 3Increase (decrease) from prior year (97) (9) (9 ) (5) (2)
(a) As a result of the 2014 Kentucky rate case settlement that became effective July 1, 2015, the difference between pension cost calculated in accordancewith LG&E's and KU's pension accounting policy and pension cost calculated using a 15 year amortization period for actuarial gains and losses is

65
recorded as a regulatory asset. At December 31, 2018, the balances were $45 million for PPL and LKE, $25 million for LG&E and $20 million for KU.See Note 7 to the Financial Statements for additional information.
The following tables reflect changes in certain assumptions based on the Registrants' primary defined benefit plans. The tablesreflect either an increase or decrease in each assumption. The inverse of this change would impact the accrued defined benefit liabilities or assets, reported annual net periodic defined benefit costs and AOCI or regulatory assets and liabilities by a siff milar amount in the opposite direction. The sensitivities below reflect an evaluation of the change based solely on a change in that assumption.
Actuarial assumptionDiscount Rate (0.25%)Expected Return on Plan Assets (0.25%)Rate of Compensation Increase 0.25 %
Increase (Decrease)
Increase(Decrease)
(Increase)Decrease
Increase (Decrease)
Increase (Decrease)
Actuarial assumption
Defined Benefit Asset
Defined Benefit
LiabilitiesAOCI
(pre-tax)
Net Regulatory
Assets
DefinedBenefit Costs
PPL Discount rates $ (296) $ 134 $ 342 $ 88 $ 43Expected return on plan assets n/a n/a n/a n/a 30Rate of compensation increase (44) 15 51 9 12
PPL Electric
55 — 55 7Expected return on plan assets n/a — n/a 4Rate of compensation increase 6 — 6 1
LKE Discount rates 57 24 33 8Expected return on plan assets n/a n/a n/a 4Rate of compensation increase 7 4 3 2
LG&E
18 n/a 18 2Expected return on plan assets n/a n/a n/a 1Rate of compensation increase 1 n/a 1 —
KU Discount rates 15 n/a 15 2Expected return on plan assets n/a n/a n/a 1Rate of compensation increase 2 n/a 2 —
Income Taxes (All Registrants)
The Registrants recognized certain provisional amounts relating to the impact of the enactment of the TCJA in their December f31, 2017 financial statements, in accordance with SEC guidance. Included in those provisional amounts were estimates of: tax depreciation, deductible executive compensation, accumulated foreign earnings, foreign tax credits, and deemed dividends from foreign subsidiaries, all of which were based on the interpretation and application of various provisions of the TCJA.
In the third quarter of 2018, PPL filed its consolidated federal income tax return, which was prepared using guidance issued bythe U.S. Treasury Department and the IRS since the filing of each Registrant's 2017 Form 10-K. Accordingly, the Registrants have updated the following provisional amounts and now consider them to be complete: (1) the amount of the deemed dividend and associated foreign tax credits relating to the transition tax imposed on accumulated foreign earnings as of December 31, 2017; (2) the amount of accelerated 100% "bonus" depreciation PPL was eligible to claim in its 2017 federal income tax return;and (3) the related impacts on PPL's 2017 consolidated federal net operating loss to be carried forward to future periods. In addition, the Registrants recorded the tax impact of the U.S. federal corporate income tax rate reduction from 35% to 21% on
66
the changes to deferred tax assets and liabilities resulting from the completed provisional amounts. The completed provisionalamounts related to the tax rate reduction had an insignificant impact on the net regulatory liabilities of PPL's U.S. regulatedoperations. In the fourth quarter of 2018, PPL completed its analysis of the deductibility of executive compensation awarded asof November 2, 2017 and concluded that no material change to the provisional amounts is required.
The Registrants' accounting related to the effects of the TCJA on financial results for the period ended December 31, 2017 is complete as of December 31, 2018 with respect to all provisional amounts.
In 2018, the IRS issued proposed regulations for certain provisions of the TCJA, including interest deductibility, Base ErosionAnti-Avoidance Tax (BEAT), and Global Intangible Low-Taxed Income (GILTI). PPL has determined that the proposed regulations related to BEAT and GILTI do not materially change PPL's current interpretation of the statutory impact of theserules on the company. Proposed regulations relating to the limitation on the deductibility of interest expense were issued in November 2018 and such regulations provide detailed rules implementing the broader statutorymm provisions. These proposedyregulations should not apply to the Registrants until the year in which the regulations are issued in final form, which is expected to be 2019. It is uncertain what form the final regulations will take and, therefore, the Registrants cannot predict what impact the final regulations will have on the tax deductibility of interest expense. However, if the proposed regulations wereissued as final in their current form, the Registrants could have a limitation on a portion of their interest expense deduction for ntax purposes and such limitation could be significant.
Significant management judgment is also required in developing the Registrants' provision for income taxes, primarily due to the uncertainty related to tax positions taken or expected to be taken in tax returns, valuation allowances on deferred tax assets and whether the undistributed earnings of WPD are considered indefinitely reinvested. d
Additionally, significant management judgment is required to determine the amount of benefit recognized related to an uncertain tax position. Tax positions are evaluated following a two-step process. The first step requires an entity to determine whether, based on the technical merits supporting a particular tax position, it is mou re likely than not (greater than a 50%chance) that the tax position will be sustained. This determination assumes that the relevant taxing authority will examine thetax position and is aware of all the relevant facts surrounding the tax position. The second step requires an entity to recognize inthe financial statements the benefit of a tax position that meets the more-likely-than-not recognition criterion. The benefit recognized is measured at the largest amount of benefit that has a likelihood of realization, upon settlement, that exceeds 50%.Management considers a number of factors in assessing the benefit to be recognized, including negotiation of a settlement.
On a quarterly basis, uncertain tax positions are reassessed by considering information known as of the reporting date. Based yon management's assessment of new information, a tax benefit may subsequently be recognized for a previously unrecognized tax position, a previously recognized tax position may be derecognized, or the benefit of a previously recognized tax positionmay be remeasured. The amounts ultimately paid upon resolution of issues raised by taxing authorities may differ materiallyfrom the amounts accrued and may materially impact the financial statements in the future. Unrecognized tax benefits areclassified as current to the extent management expects to settle an uncertain tax position by payment or receipt of cash withinone year of the reporting date.
At December 31, 2018, no significant changes in unrecognized tax benefits are projected over the next 12 months.
The need for valuation allowances to reduce deferred tax assets also requires significant management judgment. Valuation allowances are initially recorded and reevaluated each reporting period by assessing the likelihood of the ultimate realization of na deferred tax asset. Management considers a number of factors in assessing the realization of a deferred tax asset, including the reversal of temporary differences, future taxable income and ongoing prudent and feasible tax planning strategies. Any tax planning strategy utilized in this assessment must meet the recognition and measurement criteria utilized to account for anuncertain tax position. Management also considers the uncertainty posed by political risk and the effect of this uncertainty onffthe various factors that management takes into account in evaluating the need for valuation allowances. The amount of deferred tax assets ultimately realized may differ materially from the estimates utilized in the computation of valuation allowances andmay materially impact the financial statements in the future.
See Note 6 to the Financial Statements for income tax disclosures, including the impact of the TCJA and management's conclusion that the undistributed earnings of WPD are considered indefinitely reinvested. Based on this conclusion, PPL Global ndoes not record deferred U.S. federal income taxes on WPD's undistributed earnings.
67
Regulatory Assets and Liabilities
(All Registrants)
PPL Electric, LG&E and KU, are subject to cost-based rate regulation. As a result, the effects of regulatory actions are requiredto be reflected in the financial statements. Assets and liabilities are recorded that result from the regulated ratemaking procm essthat may not be recorded under GAAP for non-regulated entities. Regulatory assets generally represent incurred costs that have been deferred because such costs are probable of future recovery in regulated customer rates. Regulatory liabilities arerecognized for amounts expected to be returned through future regulated customer rates. In certain cases, regulatory liabilities are recorded based on an understanding or agreement with the regulator that rates have been set to recover costs that areexpected to be incurred in the future, and the regulated entity is accountable for any amounts charged pursuant to such rates and aanot yet expended for the intended purpose.
Management continually assesses whether the regulatory assets are probable of future recovery by considering factors such as ychanges in the applicable regulatory and political environments, the ability to recover costs through regulated rates, recent rate orders to the Registrants and other regulated entities, and the status of any pending or potential deregulation legislation. Based on this continual assessment, management believes the existing regulatory assets are probable of recovery. This assessment reflects the current political and regulatory climate at the state and federal levels, and is subject to change in the future. If future recovery of costs ceases to be probable, the regulatory asset would be written-off. Additionally, the regulatory agencies canprovide flexibility in the manner and timing of recovery of regulatory assets.
See Note 7 to the Financial Statements for regulatory assets and regulatory liabilities recorded at December 31, 2018 and 2017,as well as additional information on those regulatory assets and liabilities. All regulatory assets are either currently beingrecovered under specific rate orders, represent amounts that are expected to be recovered in future rates or benefit future periods based upon established regulatory practices.
(PPL)
WPD operates in an incentive-based regulatory structure under distribution licenses granted by Ofgem. As the regulatory modelis incentive-based rather than a cost recovery model, WPD is not subject to accounting for the effects of certain types of regulation as prescribed by GAAP for entities subject to cost-based rate regulation and does not record regulatory assets and liabilities. Therefore, the accounting treatment of adjustments to base revenue and/or allowed revenue is evaluated based on revenue recognition guidance. See Note 1 to the Financial Statements for additional information.
Price Risk Management (PPL)
See "Financial Condition - Risk Management" above, as well as "Price Risk Management" in Note 1 to the FinancialStatements.
Goodwill Impairment (PPL, LKE, LG&E and KU)
Goodwill is tested for impairment at the reporting unit level. PPL has determined its reporting units to be primarily at the sameaalevel as its reportable segments. LKE, LG&E and KU are individually single operating and reportable segments. A goodwillimpairment test is performed annually or more frequently if events or changes in circumstances indicate that the carryingamount of the reporting unit may be greater than the reporting unit's fair value. Additionally, goodwill is tested for impairment after a portion of goodwill has been allocated to a business to be disposed of.
PPL, LKE, LG&E and KU may elect either to initially make a qualitative evaluation about the likelihood of an impairment of goodwill or to bypass the qualitative evaluation and test goodwill for impairment using a two-step quantitative test. If the qualitative evaluation (referred to as "step zero") is elected and the assessment results in a determination that it is not more likely than not that the fair value of a reporting unit is less than the carrying amount, the two-step quantitative impairment test is not necessary.
When the two-step quantitative impairment test is elected or required as a result of the step zero assessment, in step one, PPLd ,LKE, LG&E and KU determine whether a potential impairment exists by comparing the estimated fair value of the reporting unit with its carrying amount, including goodwill, on the measurement date. If the estimated fair value exceeds its carryingamount, goodwill is not considered impaired. If the carrying amount exceeds the estimated fair value, the second step is performed to measure the amount of impairment loss, if any.

68
The second step of the quantitative test requires a calculation of the implied fair value of goodwill, which is determined in the same manner as the amount of goodwill in a business combination. That is, the estimated fair value of a reporting unit isallocated to all of the assets and liabilities of that reporting unit as if the reportinf g unit had been acquired in a business combination and the estimated fair value of the reporting unit was the price paid to acquire the reporting unit. The excess of theestimated fair value of a reporting unit over the amounts assigned to its assets and liabilities is the implied fair value of goodwill. The implied fair value of the reporting unit's goodwill is then compared with the carrying amount of that goodwill. If the carrying amount exceeds the implied fair value, an impairment loss is recognized in an amount equal to that excess. The tloss recognized cannot exceed the carrying amount of the reporting unit's goodwill.
PPL, LKE, LG&E and KU elected to perform the two-step quantitative impairment test of goodwill for all reporting units in the fourth quarter of 2018. Management used both discounted cash flows and markd et multiples, which required significant assumptions, to estimate the fair value of the reporting units. Significant assumptions used in the discounted cash flows include discount and growth rates, outcomes of future rate filings, and projected operating and capital cash flows. Projected operatingand capital cash flows is based on the Registrants' internal business plan, which assumes the occurrence of certain events in the ttfuture. Significant assumptions used in the market multiples include utility sector market performance and comparabletransactions.
PPL's goodwill was $3.2 billion at December 31, 2018, which primarily consists of $2.4 billion related to the acquisition of WPD and $662 million related to the acquisition of LKE. The goodwill balances of LKE, LG&E and KU at December 31, 2018were $996 million, $389 million and $607 million. Applying an appropriate weighting to both the discounted cash flow and market multiple valuations for the most recent impairment tests performed as of October 1, 2018 did not require the second-step assessment and did not result in any impairment.
A high degree of judgment is required in developing estimates related to fair value conclusions. A decrease in the forecasted cash flows of 10%, an increase in the discount rate by 0.25%, or a 10% decrease in the market multiples would not have resulted in an impairment of goodwill for these reporting units.
Asset Retirement Obligations (PPL, LKE, LG&E and KU)
ARO liabilities are required to be recognized for legal obligations associatedd with the retirement of long-lived assets. The initial obligation is measured at its estimated fair value. An ARO must be recognized when incurred if the fair value of the ARO canbe reasonably estimated. An equivalent amount is recorded as an increase in the value of the capitalized asset and amortized toexpense over the useful life of the asset. For LKE, LG&E and KU, all ARO accretion and depreciation expenses are reclassified as a regulatory asset. ARO regulatory assets associated with certain CCR projects are amortized to expense in accordance with regulatory approvals. For other AROs, at the time of retirement, the related ARO regulatory asset is offset against the associated aacost of removal regulatory liability, PP&E and ARO liability.
See Note 7 and Note 19 to the Financial Statements for additional information on AROs.
In determining AROs, management must make significant judgments and estimates to calculate fair value. Fair value isdeveloped using an expected present value technique based on assumptions of market participants that consider estimated retirement costs in current period dollars that are inflated to the anticipated retirement date and then discounted back to the date the ARO was incurred. Changes in assumptions and estimates included within the calculations of the fair value of AROs could result in significantly different results than those identified and recorded in the financial statements. Estimated ARO costs and settlement dates, which affect the carrying value of the ARO and the related capitalized asset, are reviewed periodically to ensure that any material changes are incorporated into the latest estimate of the ARO. Any change to the capitalized asset,positive or negative, is generally amortized over the remaining life of the associated long-lived asset.
At December 31, 2018, the total recorded balances and information on the most significant recorded AROs were as follows.
Most Significant AROs TotalARO
RecordedAmount
Recorded % of Total Description PPL $ 347 $ 245 71 Ponds, landfills and natural gas mainsLKE 296 245 83 Ponds, landfills and natural gas mains LG&E 103 81 79 Ponds, landfills and natural gas mainsKU 193 164 85 Ponds and landfills

69
The most significant assumptions surrounding AROs are the forecasted retirement costs (including the settlement dates and the timing of cash flows), the discount rates and the inflation rates. At December 31, 2018, a 10% increase to retirement cost wouldincrease these ARO liabilities by $33 million. A 0.25% decrease in the discount rate would increase these ARO liabilities by $4million and a 0.25% increase in the inflation rate would increase these ARO liabilities by $3 million. There would be nosignificant change to the annual depreciation expense of the ARO asset or the annual accretion expense of the ARO liability asa result of these changes in assumptions.
Revenue Recognition - Unbilled Revenues (LKE, LG&E and KU)
Revenues related to the sale of energy are recorded when service is rendered or when energy is delivered to customers. Becausecustomers are billed on cycles which vary based on the timing of the actual meter reads taken throughout the month, estimates are recorded for unbilled revenues at the end of each reporting period. For LG&E and KU, such unbilled revenue amounts reflect estimates of deliveries to customers since the date of the last reading of their meters. The unbilled revenue estimatesreflect consideration of factors including daily load models, estimated usage for each customer class, the effect of current anddifferent rate schedules, the meter read schedule, the billing schedule, actual weather data and where applicable, the impact of weather normalization or other regulatory provisions of rate structures. See "Unbilled revenues" on the Registrants' BalancettSheets for balances at December 31, 2018 and 2017.
Other Information (All Registrants)
PPL's Audit Committee has approved the independent auditor to provide audit and audit-related services, tax services and other services permitted by Sarbanes-Oxley and SEC rules. The audit and audit-related services include services in connection withstatutory and regulatory filings, reviews of offering documents and registration statements, and internal control reviews.

70
REPORT OF INDEPENDENT REGISTERED PUBLIC ACCOUNTING FIRM
To the Shareowners and the Board of Directors of PPL Corporation
Opinion on the Financial Statements
We have audited the accompanying consolidated balance sheets of PPL Corporation and subsidiaries (the"Company") as of December 31, 2018 and 2017, the related consolidated statements of income, comprehensive income, equity, and cash flows, for each of the three years in the period ended December 31, 2018, and the related notes (collectively referred to as the "financial statements"). In our opinion, the financial statements present fairly,in all material respects, the financial position of the Company as of December 31, 2018 and 2017, and the results of its operations and its cash flows for each of the three years in the period ended December 31, 2018, in conformitywith accounting principles generally accepted in the United States of America.
We have also audited, in accordance with the standards of the Public Company Accounting Oversight Board (United States) (PCAOB), the Company's internal control over financial reporting as of December 31, 2018, based on criteria established in Internal Control - Integrated Framework (2013) issued by the Committee of SponsoringOrganizations of the Treadway Commission and our report dated February 14, 2019, expressed an unqualified opinion on the Company's internal control over financial reporting.
Basis for Opinion
These financial statements are the responsibility of the Company's management. Our responsibility is to express anopinion on the Company's financial statements based on our audits. We are a public accounting firm registered with the PCAOB and are required to be independent with respect to the Company in accordance with the U.S. federal securities laws and the applicable rules and regulations of the Securities and Exchange Commission and the PCAOB.
We conducted our audits in accordance with the standards of the PCAOB. Those standards require that we plan and perform the audit to obtain reasonable assurance about whether the financial statements are free of material misstatement, whether due to error or fraud. Our audits included performing procedures to assess the risks of material misstatement of the financial statements, whether due to error or fraud, and performing procedures that respond to those risks. Such procedures included examining, on a test basis, evidence regarding the amounts and disclosures in the financial statements. Our audits also included evaluating the accounting principles used and significant estimates made by management, as well as evaluating the overall presentation of the financial statements. We believe that our audits provide a reasonable basis for our opinion.
/s/ Deloitte & Touche LLP
Parsippany, New JerseyFebruary 14, 2019
We have served as the Company's auditor since 2015.

71
REPORT OF INDEPENDENT REGISTERED PUBLIC ACCOUNTING FIRM
To the Shareowners and the Board of Directors of PPL Corporation
Opinion on Internal Control over Financial Reporting
We have audited the internal control over financial reporting of PPL Corporation anr d subsidiaries (the "Company") as of December 31, 2018, based on criteria established in Internal Control - Integrated Framework (2013) issued by the Committee of Sponsoring Organizations of the Treadway Commission (COSO). In our opinion, the Company maintained, in all material respects, effective internal control over financial reporting as of December 31, 2018, based on criteria established in Internal Control - Integrated Framework (2013) issued by COSO.
We have also audited, in accordance with the standards of the Public Company Accounting Oversight Board (United States) (PCAOB), the consolidated financial statements as of and for the year ended December 31, 2018, of the Company and our report dated February 14, 2019, expressed an unqualified opinion on those financial statements.
Basis for Opinion
The Company’s management is responsible for maintaining effective internal control over financial reporting and for itsassessment of the effectiveness of internal control over financial reporting, included in the accompanying Management’s Report on Internal Control over Financial Reporting. Our responsibility is to express an opinion on the Company’s internal control over financial reporting based on our audit. We are a publicn accounting firm registered with the PCAOB and are required to be independent with respect to the Company in accordance with the U.S. federal securities laws and the applicablerules and regulations of the Securities and Exchange Commission and the PCAOB.
We conducted our audit in accordance with the standards of the PCAOB. Those standards require that we plan and perform the audit to obtain reasonable assurance about whether effective internal control over financial reporting was maintained in allmaterial respects. Our audit included obtaining an understanding of internal control over financial reporting, assessing the risk that a material weakness exists, testing and evaluating the design and operating effectiveness of internal control based on thenassessed risk, and performing such other procedures as we considered necessary in the circumstances. We believe that our audit provides a reasonable basis for our opinion.
Definition and Limitations of Internal Control over Financial Reporting
A company's internal control over financial reporting is a process designed to provide reasonable assurance regarding thereliability of financial reporting and the preparation of financial statements for external purposes in accordance with generally accepted accounting principles. A company's internal control over financial reporting includes those policies and proceduresthat (1) pertain to the maintenance of records that, in reasonable detail, accurately and fairly reflect the transactions and dispositions of the assets of the company; (2) provide reasonable assurance that transactions are recorded as necessary topermit preparation of financial statements in accordance with generally accepted accounting principles, and that receipts and expenditures of the company are being made only in accordance with authorizations of management and directors of the company; and (3) provide reasonable assurance regarding prevention or timely detection of unauthorized acquisition, use, or disposition of the company's assets that could have a material effect on the financial statements.
Because of its inherent limitations, internal control over financial reporting may not prevent or detect misstatements. Also, projections of any evaluation of effectiveness to future periods are subject to the risk that controls may become inadequatebecause of changes in conditions, or that the degree of compliance with the policies or procedures may deteriorate.
/s/ Deloitte & Touche LLP
Parsippany, New Jersey February 14, 2019

[THIS PAGE INTENTIONALLY LEFT BLANK]
72
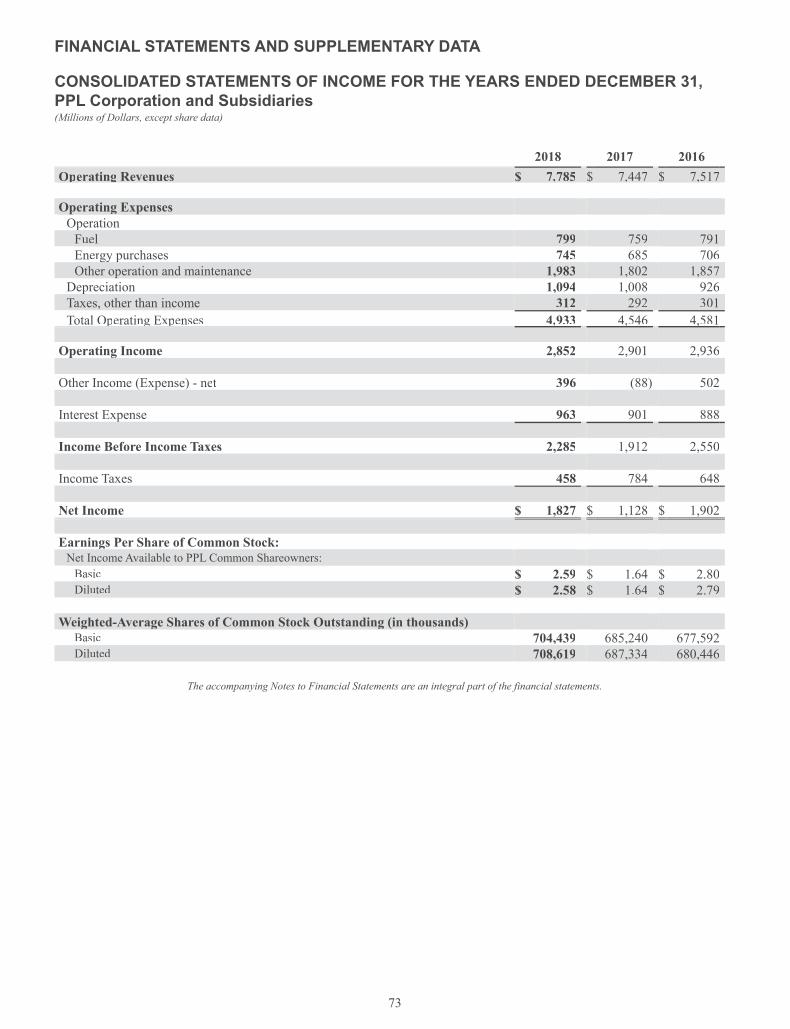
73
FINANCIAL STATEMENTS AND SUPPLEMENTARY DATA
CONSOLIDATED STATEMENTS OF INCOME FOR THE YEARS ENDED DECEMBER 31,PPL Corporation and Subsidiaries(Millions of Dollars, except share data)
2018 2017 2016 Operating Revenues $ 7,785 $ 7,447 $ 7,517
gOperating Expenses
Operation Fuel 799 759 791Energy purchases 745 685 706Other operation and maintenance 1,983 1,802 1,857
Depreciation 1,094 1,008 926Taxes, other than income 312 292 301Total Operating Expenses 4,933 4,546 4,581
Operating Income 2,852 2,901 2,936
Other Income (Expense) - net 396 (88) 502
Interest Expense 963 901 888
Income Before Income Taxes 2,285 1,912 2,550
Income Taxes 458 784 648
Net Income $ 1,827 $ 1,128 $ 1,902
Earnings Per Share of Common Stock: NNet Income Available to PPL Common Shareowners:
Basic $ 2.59 $ 1.64 $ 2.80Diluted $ 2.58 $ 1.64 $ 2.79
g g gWeighted-Average Shares of Common Stock Outstanding (in thousands)
Basic 704,439 685,240 677,592Diluted 708,619 687,334 680,446
The accompanying Notes to Financial Statements are an integral part of the financial statements.
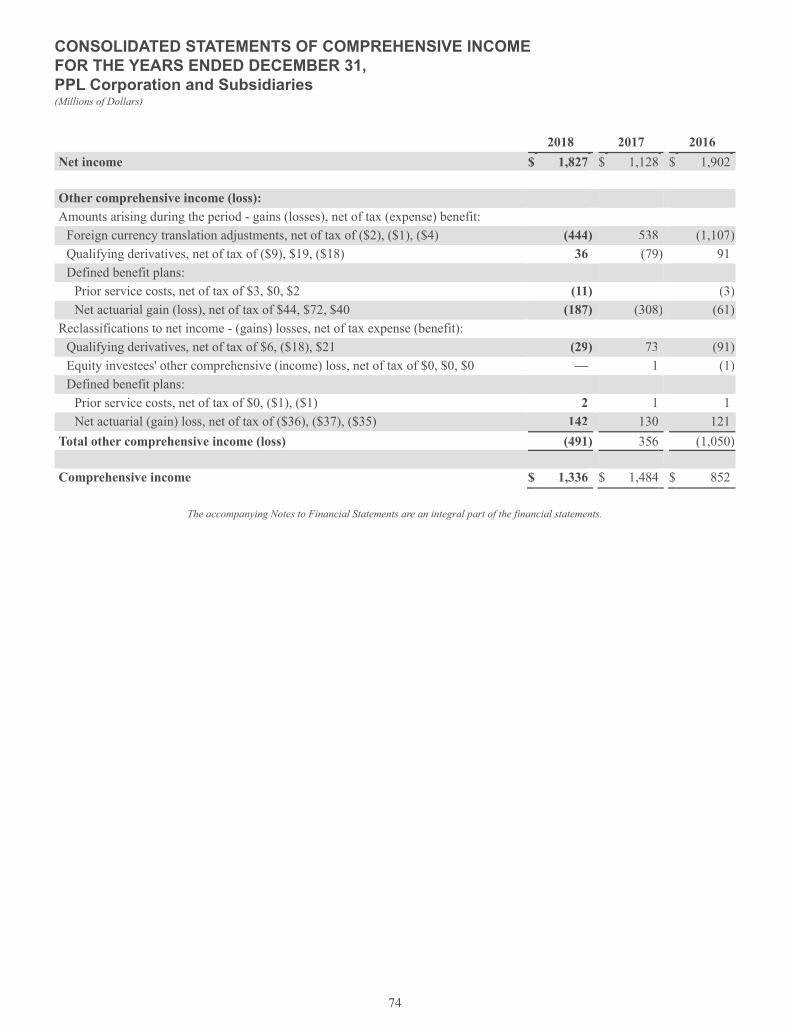
74
CONSOLIDATED STATEMENTS OF COMPREHENSIVE INCOMEFOR THE YEARS ENDED DECEMBER 31, PPL Corporation and Subsidiaries(Millions of Dollars)
2018 2017 2016 Net income $ 1,827 $ 1,128 $ 1,902
Other comprehensive income (loss):Amounts arising during the period - gains (losses), net of tax (expense) benefit:
Foreign currency translation adjustments, net of tax of ($2), ($1), ($4) (444) 538 (1,107)Qualifying derivatives, net of tax of ($9), $19, ($18) 36 (79) 91Defined benefit plans:
Prior service costs, net of tax of $3, $0, $2 (11) — (3)NNet actuarial gain (loss), net of tax of $44, $72, $40 (187) (308) (61)
Reclassifications to net income - (gains) losses, net of tax expense (benefit): Qualifying derivatives, net of tax of $6, ($18), $21 (29) 73 (91)Equity investees' other comprehensive (income) loss, net of tax of $0, $0, $0 — 1 (1)Defined benefit plans:
Prior service costs, net of tax of $0, ($1), ($1) 2 1 1NNet actuarial (gain) loss, net of tax of ($36), ($37), ($35) 142 130 121
Total other comprehensive income (loss) (491) 356 (1,050)
Comprehensive income $ 1,336 $ 1,484 $ 852
The accompanying Notes to Financial Statements are an integral part of the financial statements.
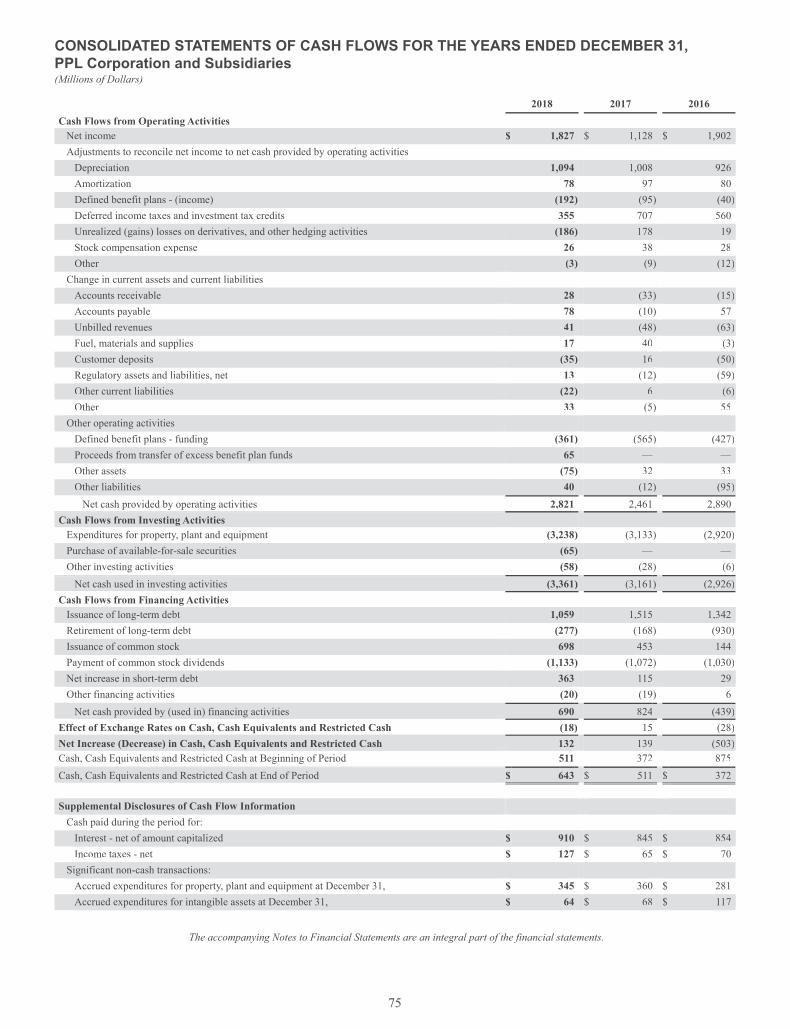
75
CONSOLIDATED STATEMENTS OF CASH FLOWS FOR THE YEARS ENDED DECEMBER 31, PPL Corporation and Subsidiaries(Millions of Dollars)
2018 2017 2016 Cash Flows from Operating Activities
NNet income $ 1,827 $ 1,128 $ 1,902Adjustments to reconcile net income to net cash provided by operating activities
Depreciation 1,094 1,008 926Amortization 78 97 80Defined benefit plans - (income) (192) (95) (40)Deferred income taxes and investment tax credits 355 707 560Unrealized (gains) losses on derivatives, and other hedging activities (186) 178 19Stock compensation expense 26 38 28Other (3) (9) (12)
Change in current assets and current liabilitiesAccounts receivable 28 (33) (15)Accounts payable 78 (10) 57Unbilled revenues 41 (48) (63)Fuel, materials and supplies 17 40 (3)Customer deposits (35) 16 (50)Regulatory assets and liabilities, net 13 (12) (59)Other current liabilities (22) 6 (6)Other 33 (5) 55
Other operating activities Defined benefit plans - funding (361 ) (565) (427)Proceeds from transfer of excess benefit plan funds 65 — ——Other assets (75 ) 32 33Other liabilities 40 (12) (95)
Net cash provided by operating activities 2,821 2,461 2,890Cash Flows from Investing Activities
Expenditures for property, plant and equipment (3,238 ) (3,133) (2,920)Purchase of available-for-sale securities (65) — ——Other investing activities (58 ) (28) (6)
NNet cash used in investing activities (3,361) (3,161) (2,926)Cash Flows from Financing Activities
Issuance of long-term debt 1,059 1,515 1,342Retirement of long-term debt (277 ) (168) (930)Issuance of common stock 698 453 144Payment of common stock dividends (1,133 ) (1,072) (1,030)NNet increase in short-term debt 363 115 29Other financing activities (20 ) (19) 6
NNet cash provided by (used in) financing activities 690 824 (439)Effect of Exchange Rates on Cash, Cash Equivalents and Restricted Cash (18 ) 15 (28)Net Increase (Decrease) in Cash, Cash Equivalents and Restricted Cash 132 139 (503)Cash, Cash Equivalents and Restricted Cash at Beginning of Period 511 372 875Cash, Cash Equivalents and Restricted Cash at End of Period $ 643 $ 511 $ 372
Supplemental Disclosures of Cash Flow Information
Cash paid during the period for:Interest - net of amount capitalized $ 910 $ 845 $ 854Income taxes - net $ 127 $ 65 $ 70
Significant non-cash transactions:Accrued expenditures for property, plant and equipment at December 31, $ 345 $ 360 $ 281Accrued expenditures for intangible assets at December 31, $ 64 $ 68 $ 117
The accompanying Notes to Financial Statements are an integral part of the financial statements.

76
CONSOLIDATED BALANCE SHEETS AT DECEMBER 31,PPL Corporation and Subsidiaries(Millions of Dollars, shares in thousands)
2018 2017
Assets Current Assets
Cash and cash equivalents $ 621 $ 485Accounts receivable (less reserve: 2018, $56; 2017, $51)
Customer 663 681Other 107 100
Unbilled revenues 496 543Fuel, materials and supplies 303 320Prepayments 70 66Price risk management assets 109 49Other current assets 63 50Total Current Assets 2,432 2,294
Property, Plant and Equipment Regulated utility plant 39,734 38,228Less: accumulated depreciation - regulated utility plant 7,310 6,785
Regulated utility plant, net 32,424 31,443Non-regulated property, plant and equipment 355 384Less: accumulated depreciation - non-regulated property, plant and equipment 101 110
Non-regulated property, plant and equipment, net 254 274Construction work in progress 1,780 1,375Property, Plant and Equipment, net 34,458 33,092
Other Noncurrent Assets Regulatory assets 1,673 1,504Goodwill 3,162 3,258Other intangibles 716 697Pension benefit asset 535 284Price risk management assets 228 215Other noncurrent assets 192 135Total Other Noncurrent Assets 6,506 6,093
Total Assets $ 43,396 $ 41,479
The accompanying Notes to Financial Statements are an integral part of the financial statements.

77
CONSOLIDATED BALANCE SHEETS AT DECEMBER 31,PPL Corporation and Subsidiaries(Millions of Dollars, shares in thousands)
2018 2017
Liabilities and Equity Current Liabilities
Short-term debt $ 1,430 $ 1,080Long-term debt due within one year 530 348Accounts payable 989 924Taxes 110 105Interest 278 282Dividends 296 273Customer deposits 257 292Regulatory liabilities 122 95Other current liabilities 551 624Total Current Liabilities 4,563 4,023
Long-term Debt 20,069 19,847
Deferred Credits and Other Noncurrent Liabilities Deferred income taxes 2,796 2,462Investment tax credits 126 129Accrued pension obligations 771 800Asset retirement obligations 264 312Regulatory liabilities 2,714 2,704Other deferred credits and noncurrent liabilities 436 441Total Deferred Credits and Other Noncurrent Liabilities 7,107 6,848
Commitments and Contingent Liabilities (Notes 7 and 13)
Equity
Common stock - $0.01 par value (a) 7 7Additional paid-in capital 11,021 10,305Earnings reinvested 4,593 3,871Accumulated other comprehensive loss (3,964) (3,422)Total Equityt 11,657 10,761
Total Liabilities and Equity $ 43,396 $ 41,479
(a) 1,560,000 shares authorized; 720,323 and 693,398 shares issued and outstanding at December 31, 2018 and December 31, 2017.
The accompanying Notes to Financial Statements are an integral part of the financial statements.

78
CONSOLIDATED STATEMENTS OF EQUITY PPL Corporation and Subsidiaries(Millions of Dollars)
PPL Shareowners Common
stock shares outstanding
(a)Common
stock
Additionalpaid-incapital
Earningsreinvested
Accumulatedother
comprehensiveloss Total
December 31, 2015 673,857 $ 7 $ 9,687 $ 2,953 $ (2,728) $ 9,919Common stock issued 5,874 185 185Stock-based compensation (31) (31)Net income 1,902 1,902Dividends and dividend equivalents (b) (1,033) (1,033)Other comprehensive income (loss) (1,050) (1,050)Adoption of stock-based compensation guidancedcumulative effect adjustment (Note 1) 7 7December 31, 2016 679,731 $ 7 $ 9,841 $ 3,829 $ (3,778) $ 9,899
Common stock issued 13,667 482 482Stock-based compensation (18) (18)Net income 1,128 1,128Dividends and dividend equivalents (b) (1,086) (1,086)Other comprehensive income (loss) 356 356December 31, 2017 693,398 $ 7 $ 10,305 $ 3,871 $ (3,422) $ 10,761 Common stock issued 26,925 718 718Stock-based compensation (2) (2)NNet income 1,827 1,827Dividends and dividend equivalents (b) (1,156) (1,156)Other comprehensive income (loss) ) (491)Adoption of reclassification of certain tax effectsfrom AOCI guidance cumulative effect adjustment (Note 1) 51 (51) —December 31, 2018 720,323 $ 7 $ 11,021 $ 4,593 $ (3,964) $ 11,657
(a) Shares in thousands. Each share entitles the holder to one vote on any question presented at any shareowners' meeting. (b) Dividends declared per share of common stock at December 31, 2018, 2017 and 2016:m $1.64, $1.58 and $1.52.
The accompanying Notes to Financial Statements are an integral part of the financial statements.

79
COMBINED NOTES TO FINANCIAL STATEMENTS
Index to Combined Notes to Consolidated Financial Statements
The notes to the consolidated financial statements that follow are a combined presentation. The following list indicates the Registrants to which the footnotes apply:
Registrant PPL PPL Electric LKE LG&E KU
1. Summary of Significant Accounting Policies x x x x x
2. Segment and Related Information x x x x x
3. Revenue from Contracts with Customers x x x x x
4. Preferred Securities x x x x
5. Earnings Per Share x
6. Income and Other Taxes x x x x x
7. Utility Rate Regulation x x x x x
8. Financing Activities x x x x x
9. Leases x x x x
10. Stock-Based Compensation x x x 11. Retirement and Postemployment Benefits x x x x x
12. Jointly Owned Facilities x x x x
13. Commitments and Contingencies x x x x x
14. Related Party Transactions x x x x
15. Other Income (Expense) - net x x
16. Fair Value Measurements x x x x x
17. Derivative Instruments and Hedging Activities x x x x x
18. Goodwill and Other Intangible Assets x x x x x
19. Asset Retirement Obligations x x x x
20. Accumulated Other Comprehensive Income (Loss) x x 21. New Accounting Guidance Pending Adoption x x x x x
1. Summary of Significant Accounting Policies
(All Registrants)
General
Capitalized terms and abbreviations appearing in the combined notes to financial statements are defined in the glossary. Dollars are in millions, except per share data, unless otherwise noted. The specific Registrant to which disclosures are applicable is identified in parenthetical headings in italics above the applicable disclosure or within the applicable disclosure for each Registrants' related activities and disclosures. Within combined disclosures, amounts are disclosed for any Registrant when significant.
Business and Consolidation
(PPL)
PPL is a utility holding company that, through its regulated subsidiaries, is primarily engaged in: 1) the distribution of electricity in the U.K.; 2) the generation, transmission, distribution and sale of electricity and the distribution and sale of naturalfgas, primarily in Kentucky; and 3) the transmission, distribution and sale of electricity in Pennsylvania. Headquartered in Allentown, PA, PPL's principal subsidiaries are PPL Global, LKE (including its principal subsidiaries, LG&E and KU) and PPL Electric. PPL's corporate level financing subsidiary is PPL Capital Funding.

80
WPD, a subsidiary of PPL Global, through indirect, wholly owned subsidiaries, operates distribution networks providing electricity service in the U.K. WPD serves end-users in South Wales and southwest and central England. Its principal subsidiaries are WPD (South Wales), WPD (South West), WPD (East Midlands) and WPD (West Midlands).
PPL consolidates WPD on a one-month lag. Material events, such as debt issuances that occur in the lag period, are recognized in the current period financial statements. Events that are significant but not material are disclosed.
(PPL and PPL Electric)
PPL Electric is a cost-based rate-regulated utility subsidiary of PPL. PPL Electric's principal busif ness is the transmission anddistribution of electricity to serve retail customers in its franchised territory in eastern and central Pennsylvania and the regulated supply of electricity to retail customers in that territory as a PLR.
(PPL, LKE, LG&E and KU)
LKE is a utility holding company with cost-based rate-regulated utility operations through its subsidiaries, LG&E and KU.LG&E and KU are engaged in the generation, transmission, distribution and sale of electricity. LG&E also engages in thedistribution and sale of natural gas. LG&E and KU maintain their separate identities and serve customers in Kentucky under their respective names. KU also serves customers in Virginia under the Old Dominion Power name.
(All Registrants)
The financial statements of the Registrants include each company's own accounts as well as the accounts of all entities in whichthe company has a controlling financial interest. Entities for which a controlling financial interest is not demonstrated throuaa ghvoting interests are evaluated based on accounting guidance for Variable Interest Entities (VIEs). The Registrants consolidate a VIE when they are determined to have a controlling interest in the VIE, and as a result are the primary beneficiary of the entity. The Registrants are not the primary beneficiary in any VIEs. Investments in entities in which a company has the ability toexercise significant influence but does not have a controlling fit nancial interest are accounted for under the equity method. All other investments are carried at cost or fair value. All significant intercompany transactions have been eliminated.
The financial statements of PPL, LKE, LG&E and KU include their share of any undivided interests in jointly owned facilities,as well as their share of the related operating costs of those facilities. See Note 12 for additional information.
Regulation g
(PPL)
WPD operates in an incentive-based regulatory structure under distribution licenses granted by Ofgem. Electricity distributionffrevenues are set by Ofgem for a given time period through price control reviews that are not directly based on cost recovery. The price control formula that governs WPD's allowed revenue is designed to provide economic incentives to minimizeoperating, capital and financing costs. As a result, WPD is not subject to accounting for the effects of certain types of regulationas prescribed by GAAP and does not record regulatory assets and liabilities.
(All Registrants)
PPL Electric, LG&E and KU are cost-based rate-regulated utilities for which rates are set by regulators to enable PPL Electric,LG&E and KU to recover the costs of providing electric or gas service, as applicable, and to provide a reasonable return toshareholders. Base rates are generally established based on a future test period. As a result, the financial statements are subject bto the accounting for certain types of regulation as prescribed by GAAP and reflect the effects of regulatory actions. Regulatory assets are recognized for the effect of transactions or events where future recovery of underlying costs is probable in regulated customer rates. The effect of such accounting is to defer certain or qualifying costs that would otherwise currently be charged todexpense. Regulatory liabilities are recognized for amounts expected to be returned through future regulated customer rates. In certain cases, regulatory liabilities are recorded based on an understanding or agreement with the regulator that rates have been set to recover costs that are expected to be incurred in the future, and the regulated entity is accountable for any amounts charged pursuant to such rates and not yet expended for the intended purpose. The accounting for regulatory assets and regulatory liabilities is based on specific ratemaking decisions or precedent for each transaction or event as prescribed by the FERC or the applicable state regulatory commissions. See Note 7 for additional details regarding regulatory matters.

81
Accounting Records g
The system of accounts for domestic regulated entities is maintained in accordance with the Uniform System of Accounts prescribed by the FERC and adopted by the applicable state regulatory commissions.
Use of Estimates
The preparation of financial statements in conformity with GAAP requires management to make estimates and assumptions Pthat affect the reported amounts of assets and liabilities, the disclosure of contingent liabilities at the date of the financialstatements and the reported amounts of revenues and expenses during the reporting period. Actual results could differ from those estimates.
Loss Accruals
Potential losses are accrued when (1) information is available that indicates it is "probable" that a loss has been incurred, given the likelihood of the uncertain future events and (2) the amount of the loss can be f reasonably estimated. Accounting guidancedefines "probable" as cases in which "the future event or events are likely to occur." The Registrants continuously assesspotential loss contingencies for environmental remediation, litigation claims, regulatory penalties and other events. Loss accruals for environmental remediation are discounted when appropriate.
The accrual of contingencies that might result in gains is not recorded, unless realization is assured.
Earnings Per Share (PPL)
EPS is computed using the two-class method, which is an earnings allocation method for computing EPS that treats a participating security as having rights to earnings that would otherwise have been available to common shareowners. Share-based payment awards that provide recipients a non-forfeitable right to dividends or dividend equivalents are considered participating securities.
Price Risk Management
(All Registrants)
Interest rate contracts are used to hedge exposure to changes in the fair value of debt instruments and to hedge exposure tovariability in expected cash flows associated with existing floating-rate debt instruments or forecasted fixed-rate issuances of debt. Foreign currency exchange contracts are used to hedge foreign currency exposures, primarily associated with PPL's investments in U.K. subsidiaries. Similar derivatives may receive different accounting treatment, depending on management's intended use and documentation.
Certain contracts may not meet the definition of a derivative because they lack a notional amount or a net settlement provision.In cases where there is no net settlement provision, markets are periodically assessed to determine whether market mechanismshave evolved that would facilitate net settlement. Certain derivative contracts may be excluded from the requirements of aaderivative accounting treatment because NPNS has been elected. These contracts are accounted for using accrual accounting.Contracts that have been classified as derivative contracts are reflected on the balance sheets at fair value. The portion of derivative positions that deliver within a year are included in "Current Assets" and "Current Liabilities," while the portion of derivative positions that deliver beyond a year are recorded in "Other Noncurrent Assets" and "Deferred Credits and Other tNoncurrent Liabilities."
Cash inflows and outflows related to derivative instruments are included as a component of operating, investing or financing activities on the Statements of Cash Flows, depending on the classification of the hedged items.
PPL and its subsidiaries have elected not to offset net derivative positions against the right to reclaim cash collateral (areceivable) or the obligation to return cash collateral (a payable) under master netting arrangements.
(PPL)
Processes exist that allow for subsequent review and validation of the contract information as it relates to interest rate and foreign currency derivatives. The accounting department provides the treasury department with guidelines on appropriate
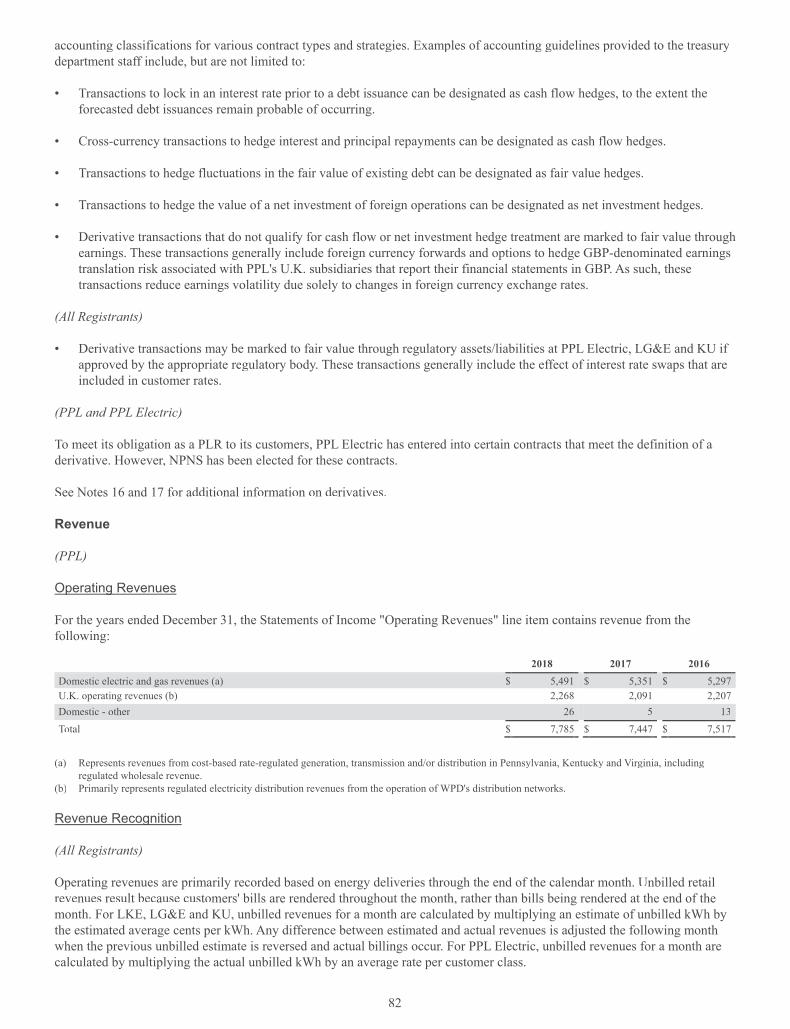
82
accounting classifications for various contract types and strategies. Examples of accounting guidelines provided to the treasury rrdepartment staff include, but are not limited to:
• Transactions to lock in an interest rate prior to a debt issuance can be designated as cash flow hedges, to the extent theforecasted debt issuances remain probable of occurring.
• Cross-currency transactions to hedge interest and principal repayments can be designated as cash flow hedges.
• Transactions to hedge fluctuations in the fair value of existing debt can be designated as fair value hedges. f
• Transactions to hedge the value of a net investment of foreign operations can be designated as net investment hedges.
• Derivative transactions that do not qualify for cash flow or net investment hedge trff eatment are marked to fair value through earnings. These transactions generally include foreign currency forwards and options to hedge GBP-denominated earningstranslation risk associated with PPL's U.K. subsidiaries that report their financial statements in GBP. As such, thesetransactions reduce earnings volatility due solely to changes in foreign currency exchange rates.
(All Registrants)
• Derivative transactions may be marked to fair value through regulatory assets/liabilities at PPL Electric, LG&E and KU if approved by the appropriate regulatory body. These transactions generally include the effect of interest rate swaps that are included in customer rates.
(PPL and PPL Electric)
To meet its obligation as a PLR to its customers, PPL Electric has entered into certain contracts that meet the definition of aderivative. However, NPNS has been elected for these contracts.
See Notes 16 and 17 for additional information on derivatives.
Revenue
(PPL)
Operating Revenuesp g
For the years ended December 31, the Statements of Income "Operating Revenues" line item contains revenue from thefollowing:
2018 2017 2016 Domestic electric and gas revenues (a) $ 5,491 $ 5,351 $ 5,297U.K. operating revenues (b) 2,268 2,091 2,207Domestic - other 26 5 13Total $ 7,785 $ 7,447 $ 7,517
(a) Represents revenues from cost-based rate-regulated generation, transmission and/or distribution in Pennsylvania, Kentucky and Virginia, includingVVregulated wholesale revenue.
(b) Primarily represents regulated electricity distribution revenues from the operation of WPD's distribution networks.
Revenue Recognition g
(All Registrants)
Operating revenues are primarily recorded based on energy deliveries through the end of the calendar month. Unbilled retailrevenues result because customers' bills are rendered throughout the month, rather than bills being rendered at the end of themonth. For LKE, LG&E and KU, unbilled revenues for a month are calculated by multiplying an estimate of unbilled kWh bythe estimated average cents per kWh. Any difference between estimated and actual revenues is adjusted the following monthwhen the previous unbilled estimate is reversed and actual billings occur. For PPL Electric, unbilled revenues for a month arecalculated by multiplying the actual unbilled kWh by an average rate per customer class.

83
PPL Electric's, LG&E's and KU's base rates are determined based on cost of service. Some regulators have also authorized the use of additional alternative revenue programs, which enable PPL Electric, LG&E and KU to adjust rates in the future as aresult of past activities or completed events. Revenues from alternative revenue programs are recognized when the specificevents permitting future billings have occurred. Revenues from alternative revenue programs are required to be presented separately from revenues from contracts with customers. These amounts are, however, presented as revenues from contractswith customers, with an offsetting adjustment to alternative revenue program revenue,tt when they are billed to customers in future periods. See Note 3 for additional information.
(PPL)
WPD is currently operating under the eight-year price control period of RIIO-ED1, which commenced for electric distribution companies on April 1, 2015. Ofgem has adopted a price control mechanism that establishes the amount of base demand revenueWPD can earn, subject to certain true-ups, and provides for an increase or reduction in revenues based on incentives or penalties for performance relative to pre-established targets. WPD's allowed revenue primarily includes base demand revenue(adjusted for inflation using RPI), performance incentive revenues/penalties and adjustments for over or under-recovery from prior periods.
As the regulatory model is incentive based rather than a cost recovery model, WPD is not subject to accounting for the effects of certain types of regulation as prescribed by GAAP. Therefore, the accounting treatment of adjustments to base demand revenue and/or allowed revenue is evaluated based on revenue recognition accounting guidance.
Unlike prior price control reviews, base demand revenue under RIIO-ED1 is adjusted during the price control period. The most significant of those adjustments are:
• Inflation True-Up - The base demand revenue for the RIIO-ED1 period was set based on 2012/13 prices. Therefore an inflation factor as determined by forecasted RPI, provided by HM Treasury, is applied to base demand revenue. Forecasted RPI is trued up to actuals and affects future base demand revenue two regulatory years later. This revenuechange is called the "TRU" adjustment.
• Annual Iteration Process (AIP) - The RIIO-ED1 price control period also includes an AIP. This will allow future basedemand revenues agreed with the regulator as part of the price control review, to be updated during the price control period for financial adjustments including tax, pensions, cost of debt, legacy price control adjustments from preceding price control periods and adjustments relating to actual and allowed total expenditure together withtt the Totex IncentiveMechanism (TIM). Under the TIM, WPD's DNOs are able to retain 70% of any amounts not spent against the RIIO-ED1plan and bear 70% of any over-spends. The AIP calculates an incremental change to base demand revenue, known as the "MOD" adjustment.
As both MOD and TRU are changes to future base demand revenues as determined by Ofgem, these adjustments are recognized as a component of revenues in future years in which service is provided and revenues are collected or returned tocustomers.
In addition to base demand revenue, certain other items are added or subtracted to arrive at allowed revenue. The most significant of these are:
• Incentives - Ofgem has established incentives to provide opportunities for DNO's to enhance overall returns by improving anetwork efficiency, reliability and customer service. These incentives can result in an increase or reduction in revenues based on incentives or penalties for actual performance against pre-established targets based on past performance. The annual incentives and penalties are reflected in customers' rates on a two-year lag from the time they are earned and/or assessed. Incentive revenues and penalties are included in revenues when they are billed to customers.
• Correction Factor - During the current price control period, WPD sets its tariffs to recover allowed revenue. However, inany fiscal period, WPD's revenue could be negatively affected if its tariffs and the volume delivered do not fully recover the revenue allowed for a particular period. Conversely, WPD could also over-recover revenue. Over and under-recoveries are subtracted from or added to allowed revenue in future years when they are billed to customers, known as the"Correction Factor" or "K-factor." Over and under-recovered amounts arising for the periods beginning with the 2014/15regulatory year and refunded/recovered under RIIO-ED1 are refunded/recovered on a two year lag (previously one year). Therefore the 2015/16 over/under-recovery adjustment occurred in the 2017/18 regulatory year.

84
Accounts Receivable
(All Registrants)
Accounts receivable are reported on the Balance Sheets at the gross outstanding amount adjusted for an allowance for doubtfulaccounts.
Allowance for Doubtful Accounts
Accounts receivable collectability is evaluated using a combination of factors, including past due status based on contractual terms, trends in write-offs and the age of the receivable. Specific events, such as bankruptcies, are also considered whenapplicable. Adjustments to the allowance for doubtful accounts are made when necessary based on the results of analysis, the aging of receivables and historical and industry trends.
Accounts receivable are written off in the period in which the receivable is deemed uncollectible.
The changes in the allowance for doubtful accounts were:
AdditionsBalance at
Beginning of Period
Charged toIncome
Charged to Other
Accounts Deductions
(a) Balance at
End of PeriodPPL 2018 $ 51 $ 41 $ 3 $ 39 $ 562017 54 28 (1) 30 512016 41 44 — 31 54
PPL Electric 2018 $ 24 $ 29 $ — $ 26 $ 272017 28 18 — 22 242016 16 35 — 23 28
LKE 2018 $ 25 $ 10 $ 3 $ 11 $ 272017 24 8 (1) 6 252016 23 8 — 7 24
LG&E2018 $ 1 $ 4 $ 1 $ 5 $ 12017 2 2 (1) 2 12016 1 2 1 2 2
KU 2018 $ 1 $ 5 $ 2 $ 6 $ 22017 2 4 (1) 4 12016 2 4 — 4 2
(a) Primarily related to uncollectible accounts written off.
Cash
(All Registrants)
Cash Equivalents q
All highly liquid investments with original maturities of three months or less are considered to be cash equivalents.

85
(PPL and PPL Electric)
Restricted Cash and Cash Equivalentsq
Bank deposits and other cash equivalents that are restricted by agreement or that have been clearly designated for a specific dpurpose are classified as restricted cash and cash equivalents. On the Balance Sheets, the current portion of restricted cash and aacash equivalents is included in "Other current assets," while the noncurrent portion is included in "Other noncurrent assets."
(All Registrants)
Fair Value Measurements
The Registrants value certain financial and nonfinancial assets and liabilities at fair value. Generally, the most significant fair value measurements relate to price risk management assets and liabilities, investments in securities in defined benefit plans, and cash and cash equivalents. PPL and its subsidiaries use, as appropriate, a market approach (generally, data from market transactions), an income approach (generally, present value techniques and option-pricing models) and/or a cost approach (generally, replacement cost) to measure the fair value of an asset or liability. These valuation approaches incorporate inputssuch as observable, independent market data and/or unobservable data that management believes are predicated on the aassumptions market participants would use to price an asset or liability. These inputs may incorporate, as applicable, certainrisks such as nonperformance risk, which includes credit risk.
The Registrants classify fair value measurements within one of three levels in the fair value hierarchy. The level assigned to a fair value measurement is based on the lowest level input that is significant to the fair value measurement in its entirety. The three levels of the fair value hierarchy are as follows:
• Level 1 - quoted prices (unadjusted) in active markets for identical assets or liabilities that are accessible at the measurement date. Active markets are those in which transactions for the asset or liability occur with sufficient frequencyand volume to provide pricing information on an ongoing basis.
• Level 2 - inputs other than quoted prices included within Level 1 that are either directly or indirectly observable for substantially the full term of the asset or liability.
• Level 3 - unobservable inputs that management believes are predicated on the assumptions market participants would useto measure the asset or liability at fair value.
Assessing the significance of a particular input requires judgment that considers factors specific to the asset or liability. As such, the Registrants' assessment of the significance of a particular input may affect how the assets and liabilities are classrr ified within the fair value hierarchy.
Investments
(All Registrants)
Generally, the original maturity date of an investment and management's intent and ability to sell an investment prior to its original maturity determine the classification of investments as either short-term or long-term. Investments that would otherwise be classified as short-term, but are restricted as to withdrawal or use for other than current operations or are clearlyaadesignated for expenditure in the acquisition or construction of noncurrent assets or for the liquidation of long-term debts, are aaclassified as long-term.
Short-term Investments
Short-term investments generally include certain deposits as well as securities that are considered highly liquid or provide for periodic reset of interest rates. Investments with original maturities greater than three months and less than a year, as well asinvestments with original maturities of greater than a year that management has the ability and intent to sell within a year, areaaincluded in "Other current assets" on the Balance Sheets.

86
(PPL)
Investments in Debt Securities
Investments in debt securities are classified as held-to-maturity and measured at amortized cost when there is an intent and ability to hold the securities to maturity. Debt securities held principally to capitalize on fluctuations in their value withd theintention of selling them in the near-term are classified as trading. All other investments in debt securities are classified as available-for-sale. Both trading and available-for-sale securities are carried at fair value. The specific identification method isused to calculate realized gains and losses on debt securities. Unrealized gains and losses on available-for-sale debt securities are reported in other comprehensive income until realized.
The criteria for determining whether a decline in fair value of a debt security is other than temporary and whether the other-than-temporary impairment is recognized in earnings or reported in OCI require that when a debt security is in an unrealized loss position and:
• there is an intent or a requirement to sell the security before recovery, the other-than-temporary impairment is recognizedcurrently in earnings; or
• there is no intent or requirement to sell the security before recovery, the portion of the other-than-temporary impairment thatis considered a credit loss is recognized currently in earnings and the remainder of the other-than-temporary impairment is reported in OCI, net of tax; or
• there is no intent or requirement to sell the security before recovery and there is no credit loss, the unrealized loss is reported in OCI, net of tax.
(PPL, LKE, LG&E and KU)
Investments in Equity Securitiesq y
LG&E and KU each have an investment in OVEC, which is recorded at cost. The investment is recorded in "Other noncurrent assets" on the PPL, LKE, LG&E and KU Balance Sheets. LG&E and KU and ten other electric utilities are equity owners of OVEC. OVEC's power is currently supplied to LG&E and KU and 11 other companies affiliated with the various owners. LG&E and KU own 5.63% and 2.5% of OVEC's common stock. Pursuant to a power purchase agreement, LG&E and KU are contractually entitled to their ownership percentage of OVEC's output, which is approximately 120 MW for LG&E and approximately 53 MW for KU.
LG&E's and KU's combined investment in OVEC is not significant. The direct exposure to loss as a result of LG&E's and KU's involvement with OVEC is generally limited to the value of their investments; however, LG&E and KU are responsible for apro-rata share of certain OVEC obligations, pursuant to their power purchase contract with OVEC. As part of PPL's acquisition of LKE, the value of the power purchase contract was recorded as an intangible asset with an offsetting regulatory liability,dboth of which are being amortized using the units-of-production method until March 2026. For information relating to thebankruptcy filing of a co-sponsor of OVEC and potential impact, see footnote (f) under “Guarantees and Other Assurances” in Note 13. See also Notes 7, 13 and 18 for additional discussion of the power purchase agreement.
Long-Lived and Intangible Assets
Property, Plant and Equipmentp y, q p
(All Registrants)
PP&E is recorded at original cost, unless impaired. PP&E acquired in business combinations is recorded at fair value at thetime of acquisition. If impaired, the asset is written down to fair value at that time, which becomes the new cost basis of theasset. Original cost for constructed assets includes material, labor, contractor costs, certain overheads and financing costs, where applicable. The cost of repairs and minor replacements are charged to expense as incurred. The Registrants record costs associated with planned major maintenance projects in the period in which the costs are incurred. No costs associated withnplanned major maintenance projects are accrued to PP&E in advance of the period in which the work is performed. LG&E and KU accrue costs of removal net of estimated salvage value through depreciation, which is included in the calculation of customer rates over the assets' depreciable lives in accordance with regulatory practices. Cost of removal amounts accrued through depreciation rates are accumulated as a regulatory liability until the removal costs are incurred. For LKE, LG&E and

87
KU, all ARO depreciation expenses are reclassified to a regulatory asset. See "Asset Retirement Obligations" below and Note 7 for additional information. PPL Electric records net costs of removal when incurred as a regulatory asset. The regulatory assetis subsequently amortized through depreciation over a five-year period, which is recoverable in customer rates in accordancewith regulatory practices.
AFUDC is capitalized at PPL Electric as part of the construction costs for cost-based rate-regulated projects for which a return rron such costs is recovered after the project is placed in service. The debt component of AFUDC is credited to "Interest mmExpense" and the equity component is credited to "Other Income (Expense) - net" on the Statements of Income. LG&E and KUgenerally do not record AFUDC, except for certain instances in KU's FERC approved rates charged to its municipal customers, as a return is provided on construction work in progress.
(PPL)
PPL capitalizes interest costs as part of construction costs. Capitalized interest, including the debt component of AFUDC for PPL, was $15 million in 2018 and $11 million in 2017 and 2016.
Depreciationp
(All Registrants)
Depreciation is recorded over the estimated useful lives of property using various methods including the straight-line, composite and group methods. When a component of PP&E that was depreciated under the composite or group method istretired, the original cost is charged to accumulated depreciation. When all or a significant portion of an operating unit that was depreciated under the composite or group method is retired or sold, the property and the related accumulated depreciationaccount is reduced and any gain or loss is included in income, unless otherwise required by regulators.
Following are the weighted-average annual rates of depreciation, for regulated utility plant, for the years ended December 31:
2018 2017 2016 PPL 2.77% 2.65% 2.73%PPL Electric 3.01% 2.86% 2.63%LKE 3.69% 3.64% 3.69%LG&E 3.63% 3.63% 3.58%KU 3.74% 3.66% 3.77%
(All Registrants)
Goodwill and Other Intangible Assetsg
Goodwill represents the excess of the purchase price paid over the fair value of the identifiable net assets acquired in a businesscombination.
Other acquired intangible assets are initially measured based on their fair value. Intangibles that have finite useful lives are amortized over their useful lives based upon the pattern in which the economic benefits of the intangible assets are consumed or otherwise used. Costs incurred to obtain an initial license and renew or extend terms of licenses are capitalized as intangibleiassets.
When determining the useful life of an intangible asset, includiff ng intangible assets that are renewed or extended, PPL and its subsidiaries consider:
• the expected use of the asset; • the expected useful life of other assets to which the useful life of the intangible asset may relate; • legal, regulatory, or contractual provisions that may limit the useful life; • the company's historical experience as evidence of its ability to support renewal or extension;• the effects of obsolescence, demand, competition, and other economic factors; and,• the level of maintenance expenditures required to obtain the expected future cash flows from the asset.

88
Asset Impairment (Excluding Investments) p ( g )
The Registrants review long-lived assets that are subject to depreciation or amortization, including finite-lived intangibles, for impairment when events or circumstances indicate carrying amounts may not be recoverable.
A long-lived asset classified as held and used is impaired when the carrying amount of the asset exceeds the sum of thedundiscounted cash flows expected to result from the use and eventual disposition of the asset. If impaired, the asset's carrying value is written down to its fair value.
A long-lived asset classified as held for sale is impaired when the carrying amount of the asset (disposal group) exceeds its fair ffvalue less cost to sell. If impaired, the asset's (disposal group's) carrying value is written down to its fair value less cost to sell. t
PPL, LKE, LG&E and KU review goodwill for impairment at the reporting unit level annually or more frequently when eventsor circumstances indicate that the carrying amount of a reporting unit may be greater than the unit's fair value. Additionally,goodwill must be tested for impairment in circumstances when a portion of goodwill has been allocated to a business to bedisposed. PPL's, LKE's, LG&E's and KU's reporting units are primarily at the operating segment level.
PPL, LKE, LG&E and KU may elect either to initially make a qualitative evaluation about the likelihood of an impairment of goodwill or to bypass the qualitative evaluation and test goodwill for impairment using a two-step quantitative test. If the qualitative evaluation (referred to as "step zero") is elected and the assessment results in a determination that it is not morelikely than not that the fair value of a reporting unit is less than the carrying amount, the two-step quantitative impairment test is not necessary. However, the quantitative impairment test is required if management concludes it is more likely than not thatthe fair value of a reporting unit is less than the carrying amount based on the step zero assessment.
If the carrying amount of the reporting unit, including goodwill, exceeds its fair value, the implied fair value of goodwill must be calculated in the same manner as goodwill in a business combination. The fair value of a reporting unit is allocated to allassets and liabilities of that unit as if the reporting unit had been acquired in a business combination. The excess of the fair value of the reporting unit over the amounts assigned to its assets and liabilities is the implied fair value of goodwill. If the ttimplied fair value of goodwill is less than the carrying amount, goodwill is written down to its implied fair value.
PPL, LKE, LG&E and KU elected to bypass the qualitative step zero evaluation of goodwill and quantitatively tested the goodwill of all reporting units for impairment as of the fourth quarter of 2018. No impairment was recognized.
(PPL, LKE, LG&E and KU)UU
Asset Retirement Obligationsg
PPL and its subsidiaries record liabilities to reflect various legal obligations associated with the retirement of long-lived assets.Initially, this obligation is measured at fair value and offset with an increase ind the value of the capitalized asset, which in s depreciated over the asset's useful life. Until the obligation is settled, the liability is increased through the recognition of accretion expense classified within "Other operation and maintenance" on the Statements of Income to reflect changes in the obligation due to the passage of time. For LKE, LG&E and KU, all ARO accretion and depreciation expenses are reclassified as a regulatory asset. ARO regulatory assets associated with certain CCR projects are amortized to expense in accordance withregulatory approvals. For other AROs, at the time of retirement, the related ARO regulatory asset is offset against the associated aacost of removal regulatory liability, PP&E and ARO liability.
Estimated ARO costs and settlement dates, which affect the carrying value of the ARO and the related capitalized asset, arereviewed periodically to ensure that any material changes are incorporated into the latest estimate of d the ARO. Any change to the capitalized asset, positive or negative, is generally amortized over the remaining life of the associated long-lived asset.d SeeNote 7 and Note 19 for additional information on AROs.
Compensation and Benefits
Defined Benefits (All Registrants)
Certain PPL subsidiaries sponsor various defined benefit pension and other postretirement plans. An asset or liability is recorded to recognize the funded status of all defined benefit plans with an offsetting entry to AOCI or, for LG&E, KU and PPL

89
Electric, to regulatory assets or liabilities. Consequently, the funded status of all defined benefit plans is fully recognized on thedBalance Sheets.
The expected return on plan assets is determined based on a market-related value of plan assets, which is calculated by rollingforward the prior year market-related value with contributions, disbursements and long-term expected return on investments.One-fifth of the difference between the actual value and the expected value is added (or subtracted if negative) to the expectedvalue to determine the new market-related value.
PPL uses an accelerated amortization method for the recognition of gains and losses for its defined benefit pension plans.Under the accelerated method, actuarial gains and losses in excess of 30% of the plan's projected benefit obligation are amortized on a straight-line basis over one-half of the expected average remaining service of active plan participants. Actuarialgains and losses in excess of 10% of the greater of the plan's projected benefit obligation or the market-related value of planassets and less than 30% of the plan's projected benefit obligation are amortized on a straight-line basis over the expected average remaining service period of active plan participants.
In selecting the discount rates for U.S. defined benefit plans, the plan sponsors start with a cash flow analysis of the expected benefit payment stream for their plans. The plan-specific cash flows are matched against the coupons and expected maturity values of individually selected bonds. This bond matching process begins with the full universe of Aa-rated non-callable (or callable with make-whole provisions) bonds, serving as the base from which those with the lowest and highest yields areeliminated to develop an appropriate subset of bonds. Individual bonds are then selected based on the timing of each plan's cashflows and parameters are established as to the percentage of each individual bond issue that could be hypothetically purchased and the surplus reinvestment rates to be assumed.
In selecting the discount rate for its U.K. pension plans, WPD starts with a cash flow analysis of the expected benefit paymentstream for its plans. These plan-specific cash flows are matched against a spot-rate yield curve to determine the assumed discount rate. The spot-rate yield curve uses an iBoxx British pounds sterling denominated corporate bond index as its base. From this base, those bonds with the lowest and highest yields are eliminated to devet lop an appropriate subset of bonds. WPDuses the single weighted-average discount rate derived from the spot rates to discount the benefit obligation. In addition, thespot rates that match the cash flows associated with the service cost and interest cost are used to discount those components of net periodic defined benefit cost.
See Note 7 for a discussion of the regulatory treatment of defined benefit costs and Note 11 for a discussion of defined benefits.
Stock-Based Compensation (PPL, PPL Electric and LKE)p
PPL has several stock-based compensation plans for purposes of granting stock options, restricted stock, restricted stock unitsdand performance units to certain employees as well as stock units and restricted stock units to directors. PPL grants most stock-based awards in the first quarter of each year. PPL and its subsidiaries recognize compensation expense for stock-based awards based on the fair value method. Forfeitures of awards are recognized when they occur. See Note 10 for a discussion of stock-based compensation. All awards are recorded as equity or a liability on the Balance Sheets. Stock-based compensation isprimarily included in "Other operation and maintenance" on the Statements of Income. Stock-based compensation expense for PPL Electric and LKE includes an allocation of PPL Services' expense.
Taxes
Income Taxes
(All Registrants)
PPL and its domestic subsidiaries file a consolidated U.S. federal income tax return.
The Registrants recognized certain provisional amounts relating to the impact of the enactment of the TCJA in their December f31, 2017 financial statements, in accordance with SEC guidance. Included in those provisional amounts were estimates of: tax depreciation, deductible executive compensation, accumulated foreign earnings, foreign tax credits, and deemed dividends from foreign subsidiaries, all of which were based on the interpretation and application of various provisions of the TCJA.
In the third quarter of 2018, PPL filed its consolidated federal income tax return, which was prepared using guidance issued bythe U.S. Treasury Department and the IRS since the filing of each Registrant's 2017 Form 10-K. Accordingly, the Registrants

90
have updated the following provisional amounts and now consider them to be complete: (1) the amount of the deemed dividend and associated foreign tax credits relating to the transition tax imposed on accumulated foreign earnings as of December 31, 2017; (2) the amount of accelerated 100% "bonus" depreciation PPL was eligible to claim in its 2017 federal income tax return;and (3) the related impacts on PPL's 2017 consolidated federal net operating loss to be carried forward to future periods. Inaddition, the Registrants recorded the tax impact of the U.S. federal corporate income tax rate reduction from 35% to 21% on the changes to deferred tax assets and liabilities resulting from the completed provisional amounts. The completed provisionalamounts related to the tax rate reduction had an insignificant impact on the net regulatory liabilities of PPL's U.S. regulatedoperations. In the fourth quarter of 2018, PPL completed its analysis of the deductibility of executive compensation awarded asof November 2, 2017 and concluded that no material change to the provisional amounts is required. See Note 6 to the Financial Statements for the final amounts reported in PPL's 2017 federal income tax return, provisional adjustment amounts for the year ended December 31, 2017, the related measurement period adjustments and the resulting tax impact for 2018.
The Registrants' accounting related to the effects of the TCJA on financial results for the period ended December 31, 2017 is complete as of December 31, 2018 with respect to all provisional amounts.
In 2018, the IRS issued proposed regulations for certain provisions of the TCJA, including interest deductibility, Base ErosionAnti-Avoidance Tax (BEAT), and Global Intangible Low-Taxed Income (GILTI). PPL has determined that the proposed regulations related to BEAT and GILTI do not materially change PPL's current interpretation of the statutory impact of theserules on the company. Proposed regulations relating to the limitation on the deductibility of interest expense were issued in November 2018 and such regulations provide detailed rules implementing the broader statutorymm provisions. These proposedyregulations should not apply to the Registrants until the year in which the regulations are issued in final form, which isexpected to be 2019. It is uncertain what form the final regulations will take and, therefore, the Registrants cannot predict wt hat impact the final regulations will have on the tax deductibility of interest expense. However, if the proposed regulations were issued as final in their current form, the Registrants could have a limitation on a portion of their interest expense deduction for ntax purposes and such limitation could be significant.
Significant management judgment is also required in developing the Registrants' provision for income taxes, primarily due to the uncertainty related to tax positions taken or expected to be taken in tax returns, valuation allowances on deferred tax assets and whether the undistributed earnings of WPD are considered indefinitely reinvested. d
Additionally, significant management judgment is also required to determine the amount of benefit to be recognized in relationto an uncertain tax position. The Registrants use a two-step process to evaluate tax positions. The first step requires an entity todetermine whether, based on the technical merits supporting a particular tax position, it is moaa re likely than not (greater than a n50% chance) that the tax position will be sustained. This determination assumes that the relevant taxing authority will examinethe tax position and is aware of all the relevant facts surrounding the tax position. The second step requires an entity torecognize in the financial statements the benefit of a tax position that meets the more-likely-than-not recognition criterion. Thebenefit recognized is measured at the largest amount of benefit that has a likelihood of realization, upon settlement, that exceeds 50%. The amounts ultimately paid upon resolution of issues raised by taxing authorities may differ materially from the amounts accrued and may materially impact the financial statements of the Registrants in future periods.
Deferred income taxes reflect the net future tax effects of temporary differences between the carrying amounts of assets and liabilities for accounting purposes and their basis for income tax purposes, as well as the tax effects of net operating losses andtax credit carryforwards.
The Registrants record valuation allowances to reduce deferred income tax assets to the amounts that are more likely than not to be realized. The Registrants consider the reversal of temporary differences, future taxable income and ongoing prudent and feasible tax planning strategies in initially recording and subsequently reevaluating the need for valuation allowances. If theRegistrants determine that they are able to realize deferred tax assets in the future in excess of recorded net deferred tax assets,adjustments to the valuation allowances increase income by reducing tax expense in the period that such determination is made. Likewise, if the Registrants determine that they are not able to realize all or part of net deferred tax assets in the future,adjustments to the valuation allowances would decrease income by increasing tax expense in the period that such determination yis made.
The Registrants defer investment tax credits when the credits are utilized and amortize the deferred amounts over the average lives of the related assets.
The Registrants recognize tax-related interest and penalties in "Income Taxes" on their Statements of Income.
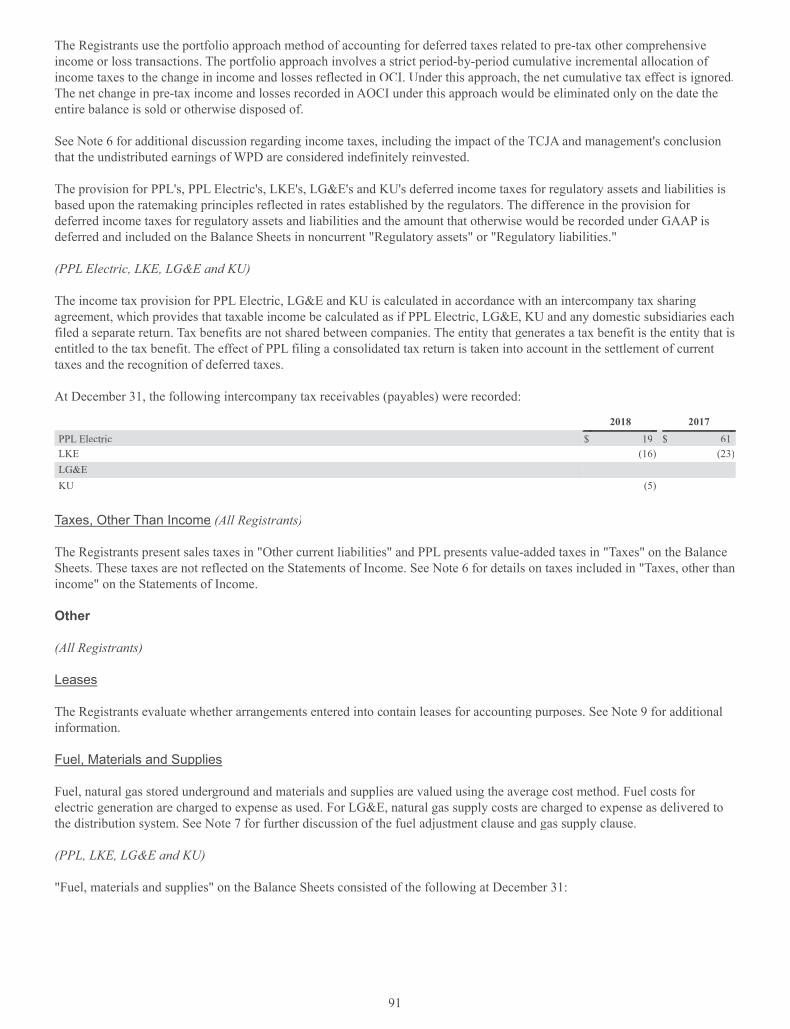
91
The Registrants use the portfolio approach method of accounting for deferred taxes related to pre-tax other comprehensiveincome or loss transactions. The portfolio approach involves a strict period-by-period cumulative incremental allocation of income taxes to the change in income and losses reflected in OCI. Under thisn approach, the net cumulative tax effect is ignored.The net change in pre-tax income and losses recorded in AOCI under this approach would be eliminated only on the date the entire balance is sold or otherwise disposed of.
See Note 6 for additional discussion regarding income taxes, including the impact of the TCJA and management's conclusion that the undistributed earnings of WPD are considered indefinitely reinvested.
The provision for PPL's, PPL Electric's, LKE's, LG&E's and KU's deferred income taxes for regulatory assets and liabilities is based upon the ratemaking principles reflected in rates established by the regulators. The difference in the provision for deferred income taxes for regulatory assets and liabilities and the amount that otherwise would be recorded under GAAP isdeferred and included on the Balance Sheets in noncurrent "Regulatory assets" or "Regulatory liabilities."
(PPL Electric, LKE, LG&E and KU)
The income tax provision for PPL Electric, LG&E and KU is calculated in accordance with an intercompany tax sharing agreement, which provides that taxable income be calculated as if PPL Electric, LG&E, KU and any domestic subsidiaries each filed a separate return. Tax benefits are not shared between companies. The entity that generates a tax benefit is the entity that is ttentitled to the tax benefit. The effect of PPL filing a consolidated tax return is taken into account in the settlement of current taxes and the recognition of deferred taxes.
At December 31, the following intercompany tax receivables (payables) were recorded:
2018 2017 PPL Electric $ 19 $ 61LKE (16) (23)LG&E — ——KU (5) —
Taxes, Other Than Income (All Registrants),
The Registrants present sales taxes in "Other current liabilities" and PPL presents value-added taxes in "Taxes" on the BalanceSheets. These taxes are not reflected on the Statements of Income. See Note 6 for details on taxes included in "Taxes, other thanincome" on the Statements of Income.
Other
(All Registrants)
Leases
The Registrants evaluate whether arrangements entered into contain leases for accounting purposes. See Note 9 for additionalrrinformation.
Fuel, Materials and Supplies, pp
Fuel, natural gas stored underground and materials and supplies are valued using the average cost method. Fuel costs for electric generation are charged to expense as used. For LG&E, natural gas supply costs are charged to expense as delivered tothe distribution system. See Note 7 for further discussion of the fuel adjustment clause and gas supply clause. n
(PPL, LKE, LG&E and KU)
"Fuel, materials and supplies" on the Balance Sheets consisted of the following at December 31:

92
PPL LKE LG&E KU2018 2017 2018 2017 2018 2017 2018 2017
Fuel $ 98 $ 107 $ 98 $ 107 $ 42 $ 45 $ 56 $ 62Natural gas stored underground 41 43 41 43 41 43 — —Materials and supplies 164 170 109 104 44 43 65 61
Total $ 303 $ 320 $ 248 $ 254 $ 127 $ 131 $ 121 $ 123
Guarantees (All Registrants)
Generally, the initial measurement of a guarantee liability is the fair value of the guarantee at its inception. However, there arecertain guarantees excluded from the scope of accounting guidance and other guarantees that are not subject to the initial recognition and measurement provisions of accounting guidance that only require disclosure. See Note 13 for further discussionof recorded and unrecorded guarantees.
Treasury Stock (PPL)y
PPL restores all shares of common stock acquired to authorized but unissued shares of common stock upon acquisition.
Foreign Currency Translation and Transactions (PPL)g y
WPD's functional currency is the GBP, which is the local currency in the U.K. As such, assets and liabilities are translated toU.S. dollars at the exchange rates on the date of consolidation and related revenues and expenses are generally translated at average exchange rates prevailing during the period included in PPL's results of operations. Adjustments resulting from foreigncurrency translation are recorded in AOCI.
Gains or losses relating to foreign currency transactions are recognized in "Other Income (Expense) - net" on the Statements ofIncome. See Note 15 for additional information.
New Accounting Guidance Adopted (All Registrants(( )
Accounting for Revenue from Contracts with Customersg
Effective January 1, 2018, the Registrants adopted accounting guidance that establishes a comprehensive new model for the recognition of revenue from contracts with customers. This model is based on the core principle that revenue should be recognized to depict the transfer of control of promised goods or services to customers in an amount that reflects the consideration to which the entity expects to be entitled in exchange for those goods or servn ices. The Registrants adopted thisguidance using the modified retrospective transition method. No cumulative effect adjustment was required as of the January 1, 2018 adoption date.
The adoption of this guidance did not have a material impact on the Registrants' revenue recognition policies. See Note 3 for the required disclosures resulting from the adoption of this standard.
Presentation of Net Periodic Pension Cost and Net Periodic Postretirement Benefit Cost
Effective January 1, 2018, the Registrants adopted accounting guidance that changes the income statement presentation of net periodic benefit cost. Retrospectively, this guidance requires the service cost component to be disaggregated from other components of net benefit cost and presented in the same income statement line items as other employee compensation costs arising from services rendered during the period. The other components of net periodic benefits are presented separately from mmthe line items that include the service cost and outside of any subtotal of operating income. Prospectively, the guidance limits the capitalization to the service cost component of net periodic benefit costs.
For PPL, the non-service cost components of net periodic benefit costs were in a net credit position for the twelve monthsended December 31, 2018. The non-service cost credits that would have been capitalized under previous guidance, but are nowrecorded as income within "Other Income (Expense) - net," were $22 million ($17 million after-tax or $0.02 per share) for thetwelve months ended December 31, 2018. For PPL Electric, LG&E and KU, non-service costs or credits that would have beencapitalized under previous guidance are now recognized as a regulatory asset or regulatory liability, as applicable, in accordance with regulatory approvals.

93
The following provides the non-service cost components of net periodic benefits (costs) or credits presented in "Other Income (Expense) - net" in 2018 and reclassified from "Other operation and maintenance" to "Other Income (Expense) - net" in 2017and 2016 on the Statements of Income as a result of the adoption.
2018 2017 2016 PPL $ 257 $ 167 $ 112PPL Electric 5 1 3LKE 4 (5) (6)LG&E (2) (5) (5)KU 3 (1) (2)
PPL and PPL Electric elected to use the practical expedient that permits using the amounts disclosed in the defined benefit planaanote for the prior comparative period as the estimation basis for applying the retrospective presentation requirements.
Presentation of Restricted Cash in the Statement of Cash Flows (PPL and PPL Electric)
Effective January 1, 2018, PPL and PPL Electric adopted accounting guidance that changes the cash flow statement presentation of restricted cash. Under the new guidance, amounts considered restricted cash are presented with cash and cashdequivalents when reconciling the beginning-of-period and end-of-period total cash amounts on the Statements of Cash Flows. The guidance requires a reconciliation of the total cash, cash equivalents and restricted cash from the Statement of Cash Flowsto amounts on the Balance Sheets and disclosure of the nature of the restrictions. PPL and PPL Electric have applied thisguidance on a retrospective basis for all periods presented. The adoption of this guidance did not have a material impact on the Statements of Cash Flows.
Reconciliation of Cash, Cash Equivalents and Restricted Cash
The following provides a reconciliation of Cash, Cash Equivalents and Restricted Cash reported within the Balance Sheets that sum to the total of the same amounts shown on the Statements of Cash Flows:
PPL PPL Electric
December 31, 2018
December 31, 2017
December 31, 2018
December 31, 2017
Cash and cash equivalents $ 621 $ 485 $ 267 $ 49
Restricted cash - current 3 3 2 2
Restricted cash - noncurrent (a) 19 23 — —Total Cash, Cash Equivalents and Restricted Cash $ 643 $ 511 $ 269 $ 51
(a) Primarily consists of funds received by WPD, which are to be spent on approved initiatives to support a low carbon environment.
Reclassification of Certain Tax Effects from Accumulated Other Comprehensive Income (PPL and LKE)p
Effective October 1, 2018, prospectively adopted accounting guidance that gives entities the option to reclassify tax effects stranded within AOCI as a result of the TCJA to retained earnings. The reclassification applies only to those stranded tax effects arising from the TCJA enactment.
The adoption of this guidance resulted in PPL and LKE reclassifying $51 million and $18 million of deferred tax effects (primarily related to pension and other post-retirement benefits) stranded in AOCI as a result of the TCJA to retained earnings.
2. Segment and Related Information
(PPL)
PPL is organized into three segments: U.K. Regulated, Kentucky Regulated and Pennsylvania Regulated. PPL's segments are segmented by geographic location.
The U.K. Regulated segment consists of PPL Global, which primarily includes WPD's regulated electricity distributionoperations, the results of hedging the translation of WPD's earnings from GBP into U.S. dollars, and certain costs, such as U.S.income taxes, administrative costs, and certain acquisition-related financing costs.

94
The Kentucky Regulated segment consists primarily of LKE's regulated electricity generation, transmission and distribution operations of LG&E and KU, as well as LG&E's regulated distribution and sale of natural gas. In addition, certain acquisition-related financing costs are allocated to the Kentucky Regulated segment.
The Pennsylvania Regulated segment includes the regulated electricity transmission and distribution operations of PPL Electric. In addition, certain costs are allocated to the Pennsylvania Regulated segment.
"Corporate and Other" primarily includes financing costs incurred at the corporate level that have not been allocated or assigned to the segments, certain other unallocated costs, as well as the financial results of Safari Energy, which is presented to reconcile segment information to PPL's consolidated results.
Income Statement data for the segments and reconciliation to PPL's consolidated results for the years ended December 31 are as follows:
2018 2017 2016 Operating Revenues from external customers (a)
U.K. Regulated $ 2,268 $ 2,091 $ 2,207Kentucky Regulated 3,214 3,156 3,141Pennsylvania Regulated 2,277 2,195 2,156Corporate and Other 26 5 13
Total $ 7,785 $ 7,447 $ 7,517
DepreciationU.K. Regulated $ 247 $ 230 $ 233Kentucky Regulated 475 439 404Pennsylvania Regulated 352 309 253Corporate and Other 20 30 36
Total $ 1,094 $ 1,008 $ 926
Amortization (b)U.K. Regulated $ 34 $ 34 $ 16Kentucky Regulated 18 24 29Pennsylvania Regulated 22 33 32Corporate and Other 4 6 3
Total $ 78 $ 97 $ 80
Unrealized (gains) losses on derivatives and other hedging activities (c)U.K. Regulated $ (190 ) $ 166 $ 13Kentucky Regulated 6 6 6Corporate and Other (2 ) 6 —
Total $ (186) $ 178 $ 19
Interest Expense
U.K. Regulated $ 413 $ 397 $ 402Kentucky Regulated 274 261 260Pennsylvania Regulated 159 142 129Corporate and Other 117 101 97
Total $ 963 $ 901 $ 888
Income Before Income TaxesU.K. Regulated $ 1,339 $ 804 $ 1,479Kentucky Regulated 531 645 640Pennsylvania Regulated 567 575 550Corporate and Other (152 ) (112) (119)
Total $ 2,285 $ 1,912 $ 2,550

95
2018 2017 2016 Income Taxes (d)
U.K. Regulated $ 225 $ 152 $ 233Kentucky Regulated 120 359 242Pennsylvania Regulated 136 216 212Corporate and Other (23) 57 (39)
Total $ 458 $ 784 $ 648
Deferred income taxes and investment tax credits (e)U.K. Regulated $ 118 $ 66 $ 31Kentucky Regulated 94 294 291Pennsylvania Regulated 125 257 221Corporate and Other 18 90 17
Total $ 355 $ 707 $ 560
NNet Income
U.K. Regulated $ 1,114 $ 652 $ 1,246Kentucky Regulated 411 286 398Pennsylvania Regulated 431 359 338Corporate and Other (129) (169) (80)
Total $ 1,827 $ 1,128 $ 1,902
(a) See Note 1 for additional information on Operating Revenues.(b) Represents non-cash expense items that include amortization of regulatory assets, debt discounts and premiums and debt issuance costs.(c) Includes unrealized gains and losses from economic activity. See Note 17 for additional information. (d) Represents both current and deferred income taxes, including investment tax credits. See Note 6 for additional information on the impact of the TCJA in
2018 and 2017. (e) Represents a non-cash expense item that is also included in "Income Taxes."
Cash Flow data for the segments and reconciliation to PPL's consolidated results for the years ended December 31 are asfollows:
2018 2017 2016 Expenditures for long-lived assets
U.K. Regulated $ 954 $ 1,015 $ 1,031Kentucky Regulated 1,117 892 791Pennsylvania Regulated 1,196 1,254 1,134Corporate and Other 1 10 1
Total $ 3,268 $ 3,171 $ 2,957
The following provides Balance Sheet data for the segments and reconciliation to PPL's consolidated results as of:
As of December 31, 2018 2017
Total Assets U.K. Regulated (a) $ 16,700 $ 16,813Kentucky Regulated 15,078 14,468Pennsylvania Regulated 11,257 10,082Corporate and Other (b) 361 116
Total $ 43,396 $ 41,479
(a) Includes $12.4 billion and $12.5 billion of net PP&E as of December 31, 2018 and December 31, 2017. WPD is not subject to accounting for the effects of certain types of regulation as prescribed by GAAP.
(b) Primarily consists of unallocated items, including cash, PP&E, goodwill, the elimination of inter-segment transactions as well as the assets of SafariEnergy.
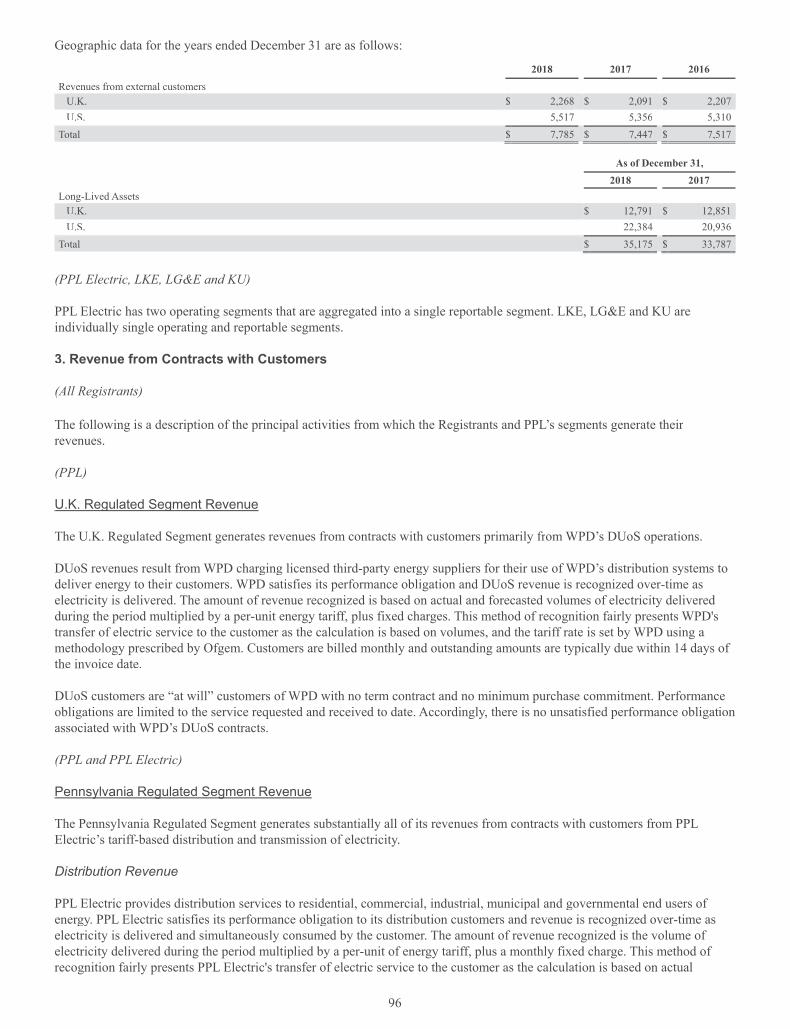
96
Geographic data for the years ended December 31 are as follows:
2018 2017 2016 Revenues from external customers
U.K. $ 2,268 $ 2,091 $ 2,207U.S. 5,517 5,356 5,310
Total $ 7,785 $ 7,447 $ 7,517
As of December 31, 2018 2017
Long-Lived Assets U.K. $ 12,791 $ 12,851U.S. 22,384 20,936
Total $ 35,175 $ 33,787
(PPL Electric, LKE, LG&E and KU)
PPL Electric has two operating segments that are aggregated into a single reportable segment. LKE, LG&E and KU are individually single operating and reportable segments.
3. Revenue from Contracts with Customers
(All Registrants)
The following is a description of the principal activities from which the Registrants and PPL’s segments generate their revenues.
(PPL)
U.K. Regulated Segment Revenue g g
The U.K. Regulated Segment generates revenues from contracts with customers primarily from WPD’s DUoS operations.
DUoS revenues result from WPD charging licensed third-party energy suppliers for their use of WPD’s distribution systems to rdeliver energy to their customers. WPD satisfies its performance obligation and DUoS revenue is recognized over-time aselectricity is delivered. The amount of revenue recognized is based on actual and forecasted volumes of electricity delivered during the period multiplied by a per-unit energy tariff, plus fixed charges. This method of recognition fairly presents WPD's transfer of electric service to the customer as the calculation is based on volumes, and the tariff rate is set by WPD using amethodology prescribed by Ofgem. Customers are billed monthly and outstanding amounts are typically due within 14 days of the invoice date.
DUoS customers are “at will” customers of WPD with no term contract and no minimum purchase commitment. Performance obligations are limited to the service requested and received to date. Accordingly, there is no unsatisfied performance obligation associated with WPD’s DUoS contracts.
(PPL and PPL Electric)
Pennsylvania Regulated Segment Revenue y g g
The Pennsylvania Regulated Segment generates substantially all of its revenues from contracts with customers from PPL Electric’s tariff-based distribution and transmission of electricity.
Distribution Revenue
PPL Electric provides distribution services to residential, commercial, industrial, municipal and governmental end users of ttenergy. PPL Electric satisfies its performance obligation to its distribution customers and revenue is recognized over-time as telectricity is delivered and simultaneously consumed by the customer. The amount of revenue recognized is the volume of electricity delivered during the period multiplied by a per-unit of energy tariff, plus a monthly fixed charge. This method of recognition fairly presents PPL Electric's transfer of electric service to the customer as the calculation is based on actual

97
volumes, and the per-unit of energy tariff rate and the monthly fixed charge are set by the PUC. Customers are typically billedmonthly and outstanding amounts are typically due within 21 days of the date of the bill.
Distribution customers are "at will" customers of PPL Electric with no term contract and no minimum purchase commitment. Performance obligations are limited to the service requested and received to date. Accordingly, there is no unsatisfied performance obligation associated with PPL Electric’s retail account contracts.
Transmission Revenue
PPL Electric generates transmission revenues from a FERC-approved PJM Open Access Transmission Tariff. An annualaarevenue requirement for PPL Electric to provide transmission services is calculated using a formula-based rate. This revenue requirement is converted into a daily rate (dollars per day). PPL Electric satisfies its performance obligation to providetransmission services and revenue is recognized over-time as transmission services are provided and consumed. This method of recognition fairly presents PPL Electric's transfer of transmission services as the daily rate is set by a FERC approved formula-based rate. PJM remits payment on a weekly basis.
PPL Electric's agreement to provide transmission services contains no minimum purchase commitment. The performanceobligation is limited to the service requested and received to date. Accordingly, PPL Electric has no unsatisfied performance obligations.
(PPL, LKE, LG&E and KU)
Kentucky Regulated Segment Revenue y g g
The Kentucky Regulated Segment generates substantially all of its revenues from contracts with customers from LG&E's and KU's regulated tariff-based sales of electricity and LG&E's regulated tariff-based sales of natural gas.
LG&E and KU are engaged in the generation, transmission, distribution and sale of electricity in Kentucky and, in KU's case,Virginia. LG&E also engages in the distribution and sale of natural gas in Kentucky. Revenue from these activities is generatedfrom tariffs approved by applicable regulatory authorities including the FERC, KPSC and VSCC. LG&E and KU satisfy their performance obligations upon LG&E's and KU's delivery of electricity and LG&E's delivery of natural gas to customers. This revenue is recognized over-time as the customer simultaneously receives and consumes the benefits provided by LG&E and KU. The amount of revenue recognized is the billed volume of electricity or natural gas delivered multiplied by a tariff rate per-unit of energy, plus any applicable fixed charges or additional regulatory mechanisms. Customers are billed monthly and outstanding amounts are typically due within 22 days of the date of the bill. Additin onally, unbilled revenues are recognized as a result of customers' bills rendered throughout the month, rather than bills being rendered at the end of the month. Unbilled revenues for a month are calculated by multiplying an estimate of unbilled kWh or Mcf delivered but not yet billed by theestimated average cents per kWh or Mcf. Any difference between estimated and actual revenues is adjusted the followingmonth when the previous unbilled estimate is reversed and actual billings occur. This method of recognition fairly presents LG&E's and KU's transfer of electricity and LG&E's transfer of natural gas to the customer as the amount recognized is based on actual and estimated volumes delivered and the tariff rate per-unit of energy and any applicable fixed charges or regulatorymechanisms as set by the respective regulatory body.
LG&E's and KU's customers generally have no minimum purchase commitment. Performance obligations are limited to the service requested and received to date. Accordingly, there is no unsatisfied performance obligation associated with these customers.
(All Registrants)
The following table reconciles "Operating Revenues" included in each Registrant's Statement of Income with revenues generated from contracts with customers for the year ended December 31:

98
2018
PPL PPL Electric LKE LG&E KU
Operating Revenues (a) $ 7,785 $ 2,277 $ 3,214 $ 1,496 $ 1,760
Revenues derived from: Alternative revenue programs (b) 32 (6) 38 12 26
Other (c) (38) (12) (17 ) (5) (12)
Revenues from Contracts with Customers $ 7,779 $ 2,259 $ 3,235 $ 1,503 $ 1,774
(a) PPL includes $2.3 billion for the year ended December 31, 2018 of revenues from external customers reported by the U.K. Regulated segment. PPL Electric and LKE represent revenues from external customers reported by the Pennsylvania Regulated and Kentucky Regulated segments. See Note 2 for additional information.
(b) Alternative revenue programs for PPL Electric include the over/under-collection of its transmission formula rate. Alternative revenue programs for LKE,LG&E and KU include the over/under collection for the ECR and DSM programs as well as LG&E's over/under collection of its GLT program and KU'sover/under collection of its generation formula rate. Over-collections of revenue are shown as positive amounts in the table above; under-collections are shown as negative amounts.
(c) Represents additional revenues outside the scope of revenues from contracts with customers such as leases and other miscellaneom us revenues.
As discussed in Note 2, PPL's segments are segmented by geographic location. Revenues from external customers for each segment/geographic location are reconciled to revenues from contracts with customers in the table above. For PPL Electric,revenues from contracts with customers are further disaggregated by distribution and transmission, which were $1.9 billion and $405 million for the year ended December 31, 2018.
The following table shows revenues from contracts with customers disaggregated by customer class for the year ended December 31:
2018
PPL PPL Electric LKE LG&E KU
Licensed energy suppliers (a) $ 2,127 $ — $ — $ — $ —
Residential 2,704 1,379 1,325 666 659
Commercial 1,233 368 865 455 410
Industrial 624 54 570 180 390
Other (b) 489 53 278 129 149
Wholesale - municipal 118 — 118 — 118
Wholesale - other (c) 79 — 79 73 48
Transmission 405 405 — — —
Revenues from Contracts with Customers $ 7,779 $ 2,259 $ 3,235 $ 1,503 $ 1,774
(a) Represents customers of WPD. (b) Primarily includes revenues from pole attachments, street lighting, other public authorities and other non-core businesses.(c) Includes wholesale power and transmission revenues. LG&E and KU amounts include intercompany power sales and transmission revenues, which are
eliminated upon consolidation at LKE.
Contract receivables from customers are primarily included in "Accounts receivable - Customer" and "Unbilled revenues" on the Balance Sheets. For PPL Electric, the "Accounts receivable - Customer" balance includes purchased receivables from alternative electricity suppliers. See Note 7 for additional information regarding the purchase of receivables program.
The following table shows the accounts receivable balances from contracts with customers that were impaired for the year ended December 31:
2018
PPL $ 34
PPL Electric 24
LKE 9
LG&E 4
KU 5

99
The following table shows the balances of contract liabilities resulting from contracts with customers.
PPL PPL Electric LKE LG&E KU
Contract liabilities as of December 31, 2017 $ 29 $ 19 $ 8 $ 4 $ 4
Contract liabilities as of December 31, 2018 42 23 9 5 4
The following table shows the revenue recognized in 2018 that was included in the contract liability balance at the beginning of the year.
2018 PPL $ 21
PPL Electric 8
LKE 8
LG&E 4
KU 4
Contract liabilities result from recording contractual billings in advance for custtt omer attachments to the Registrants'infrastructure and payments received in excess of revenues earned to date. Advanced billings for custaa omer attachments arerecognized as revenue ratably over the billing period. Payments received in excess of revenues earned to date are recognized asrevenue as services are delivered in subsequent periods.
At December 31, 2018, PPL had $49 million of performance obligations attributable to Corporate and Other that have not been satisfied. Of this amount, PPL expects to recognize approximately $37 million within the next 12 months.
4. Preferred Securities
(PPL)
PPL is authorized to issue up to 10 million shares of preferred stock. No PPL preferred stock was issued or outstanding in 2018,2017 or 2016.
(PPL Electric)
PPL Electric is authorized to issue up to 20,629,936 shares of preferred stock. No PPL Electric preferred stock was issued or outstanding in 2018, 2017 or 2016.
(LG&E)
LG&E is authorized to issue up to 1,720,000 shares of preferred stock at a $25 par value and 6,750,000 shares of preferred stock without par value. LG&E had no preferred stock issued or outstanding in 2018, 2017 or 2016.
(KU)
KU is authorized to issue up to 5,300,000 shares of preferred stock and 2,000,000 shares of preference stock without par value. KUhad no preferred or preference stock issued or outstanding in 2018, 2017 or 2016.d
5. Earnings Per Share
(PPL)
Basic EPS is computed by dividing income available to PPL common shareowners by the weighted-average number of common shares outstanding during the applicable period. Diluted EPS is computed by dividing income available to PPL common shareowners by the weighted-average number of common shares outstanding, increased by incremental shares that would be outstanding if potentially dilutive non-participating securities were converted to common shares as calculated using the Treasury Stock Method. Incremental non-participating securities that have a dilutive impact are detailed in the table below. In 2018, these securities also included the PPL common stock forward sale agreements. See Note 8 for additional information

on these agreements. The forward sale agreements are dilutive under the Treasury Stock Method to the extent the average stock price of PPL's common shares exceeds the forward sale price prescribed in the agreements.
Reconciliations of the amounts of income and shares of PPL common stock (in thousands) for the periods ended December 31, used in the EPS calculation are:
2018 2017 2016 Income (Numerator) NNet income $ 1,827 $ 1,128 $ 1,902Less amounts allocated to participating securities 2 2 6NNet income available to PPL common shareowners - Basic and Diluted $ 1,825 $ 1,126 $ 1,896
Shares of Common Stock (Denominator) Weighted-average shares - Basic EPS 704,439 685,240 677,592Add incremental non-participating securities:
Share-based payment awards (a) 445 2,094 2,854Forward sale agreements 3,735 — —
Weighted-average shares - Diluted EPS 708,619 687,334 680,446
Basic EPS
NNet Income available to PPL common shareowners $ 2.59 $ 1.64 $ 2.80
Diluted EPS
Net Income available to PPL common shareowners $ 2.58 $ 1.64 $ 2.79
(a) The Treasury Stock Method was applied to non-participating share-based payment awards.
For the year ended December 31, PPL issued common stock related to stock-based compensation plans and DRIP as follows (inthousands):
2018 Stock-based compensation plans (a) 720DRIP 1,974
(a) Includes stock options exercised, vesting of performance units, vesting of restricted stock and restricted stock units and conversion of stock units granted to directors.
See Note 8 for additional information on common stock issued under ATM Program and settlement of a portion of the PPL common stock forward sale agreements.
For the years ended December 31, the following shares (in thousands) were excluded from the computations of diluted EPSbecause the effect would have been antidilutive:
2018 2017 2016 Stock options 172 696 696Performance units — — 176Restricted stock units 11 — —
100

101
6. Income and Other Taxes
(All Registrants)
Tax Cuts and Jobs Act (TCJA)
On December 22, 2017, President Trump signed into law the TCJA. Substantially all of the provisions of the TCJA are effectivefor taxable years beginning after December 31, 2017. The TCJA included significant changes to the taxation of corporations,including provisions specifically applicable to regulated public utilities. The more significant changes that impact the Registrants were:
• The reduction in the U.S. federal corporate income tax rate from a top marginal rate of 35% to a flat rate of 21%, effectiveJanuary 1, 2018;
• The exclusion from U.S. federal taxable income of dividends from foreign subsidiaries and the associated "transition tax;"• Limitations on the tax deductibility of interest expense, with an exception to these limitations for regulated public utilities;• Full current year expensing of capital expenditures with an exception for regulated public utilities that qualify for the
exception to the interest expense limitation; and • The continuation of certain rate normalization requirements for accelerated depreciation benefits. For non-regulated
businesses, the TCJA generally provides for full expensing of property acquired after September 27, 2017.
Under GAAP, the tax effect of changes in tax laws must be recognized in the period in which the law is enacted, or December 2017 for the TCJA. The changes enacted by the TCJA were recorded as an adjustment to the Registrants' deferred tax provisions, and have been reflected in "Income Taxes" on the Statement of Income for the year ended December 31, 2017 asfollows:
PPL PPL Electric LKE LG&E KU Income tax expense (benefit) $ 321 $ (13) $ 112 $ — $ —
The components of these adjustments are discussed below:
Reduction of U.S. Federal Corporate Income Tax Rate p
GAAP requires deferred tax assets and liabilities to be measured at the enacted tax rate expectedrr to apply when temporary ddifferences are to be realized or settled. Thus, at the date of enactment, the Registrants' deferred taxes were remeasured baseaa dupon the U.S. federal corporate income tax rate of 21%. For PPL’s regulated entities, the changes in deferred taxes were, in large part, recorded as an offset to either a regulatory asset or regulatory liability and will be reflected in future rates charged to customers. The tax rate reduction impacts on non-regulated deferred tax assets and liabilities were recorded as an adjustment tothe Registrants' deferred tax provisions, and have been reflected in "Income Taxes" on the Statement of Income for the year ended December 31, 2017 as follows:
PPL PPL Electric LKE LG&E KU Income tax expense (benefit) $ 220 $ (13) $ 112 $ — $ —
As indicated in Note 1 - "Summary of Significant Accounting Policies - Income Taxes", PPL’s U.S. regulated operations'accounting for income taxes are impacted by rate regulation. Therefore, reductions in accumulated deferred income tax balances due to the reduction in the U.S. federal corporate income tax rate to 21% under the provisions of the TCJA will resultin amounts previously collected from utility customers for these deferred taxes to be refundable to such customers over a periodof time. The TCJA includes provisions that stipulate how these excess deferred taxes are to be passed back to customers for certain accelerated tax depreciation benefits. Refunds of other deferred taxes either have been or will be determined by the Registrants’ regulators. The Balance Sheets at December 31, 2017 reflect the increase to the Registrants' net regulatory liabilities as a result of the TCJA as follows:
PPL PPL Electric LKE LG&E KU NNet Increase in Regulatory Liabilities $ 2,185 $ 1,019 $ 1,166 $ 532 $ 634
Transition Tax
The TCJA included a conversion from a worldwide tax system to a territorial tax system, effective January 1, 2018. In the transition to the territorial regime, a one-time transition tax was imposed on PPL’s unrepatriated accumulated foreign earnings

102
in 2017. These earnings were treated as a taxable deemed dividend to PPL of approximately $462 million for purposes of the 2017 tax provision. As the PPL consolidated U.S. group had a taxable loss for 2017, inclusive of the taxable deemed dividend,the foreign tax credits associated with the deemed dividend were recorded as a deferred tax asset. However, it is expected thatunder the TCJA, the current and prior year foreign tax credit carryforwards will not be fully realizable.
As a result, the net deferred income tax expense impact of the deemed repatriation was $101 million and was recorded in"Income Taxes" on the PPL Statement of Income for the year ended December 31, 2017 and "Deferred tax liabilities" on thePPL Balance Sheet at December 31, 2017.
2018 Impacts of TCJA p
The Registrants recognized certain provisional amounts relating to the impact of the enactment of the TCJA in their December f31, 2017 financial statements, in accordance with SEC guidance. Included in those provisional amounts were estimates of: tax depreciation, deductible executive compensation, accumulated foreign earnings, foreign tax credits, and deemed dividends from foreign subsidiaries, all of which were based on the interpretation and application of various provisions of the TCJA.
In the third quarter of 2018, PPL filed its consolidated federal income tax return, which was prepared using guidance issued bythe U.S. Treasury Department and the IRS since the filing of each Registrant's 2017 Form 10-K. Accordingly, the Registrants have updated the following provisional amounts and now consider them to be complete: (1) the amount of the deemed dividend and associated foreign tax credits relating to the transition tax imposed on accumulated foreign earnings as of December 31,2017; (2) the amount of accelerated 100% "bonus" depreciation PPL was eligible to claim in its 2017 federal income tax return;and (3) the related impacts on PPL's 2017 consolidated federal net operating loss to be carried forward to future periods. Inaddition, the Registrants recorded the tax impact of the U.S. federal corporate income tax rate reduction from 35% to 21% on the changes to deferred tax assets and liabilities resulting from the completed provisional amounts. The completed provisional amounts related to the tax rate reduction had an insignificant impact on the net regulatory liabilities of PPL's U.S. regulatedoperations. In the fourth quarter of 2018, PPL completed its analysis of the deductibility of executive compensation awarded asof November 2, 2017 and concluded that no material change to the provisional amounts is required. The final amounts reported in PPL's 2017 federal income tax return, provisional amounts for the year ended December 31, 2017, the related measurement period adjustments, and the resulting tax impact for the year ended December 31,2018 are as follows.
Taxable Income (Loss) (a)
Adjustments per 2017 Tax
Return
Adjustments per 2017 Tax
Provision2018
AdjustmentsPPL Deemed Dividend $ 397 $ 462 $ (65)Bonus Depreciation (b) (67) — (67)Consolidated Federal Net Operating Loss due to the TCJA (c) (330) (462) 132 Total $ — $ — $ —
PPL Electric Bonus Depreciation (b) $ (39) $ — $ (39)Consolidated Federal Net Operating Loss reallocated due to the TCJA (c) (68) (105) 37 Total $ (107) $ (105) $ (2)
LKE Bonus Depreciation (b) $ (28) $ — $ (28)Consolidated Federal Net Operating Loss reallocated due to the TCJA (c) (32) (45) 13 Total $ (60) $ (45) $ (15)
LG&E Bonus Depreciation (b) $ (17) $ — $ (17)Consolidated Federal Net Operating Loss reallocated due to the TCJA (c) 17 — 17 Total $ — $ — $ —
KU Bonus Depreciation (b) $ (11) $ — $ (11)Consolidated Federal Net Operating Loss reallocated due to the TCJA (c) 11 — 11 Total $ — $ — $ —

103
(a) The above table reflects, for each item, the amount subject to change as a result of the TCJA and does not reflect the total amount of each item included in the return and the provision.
(b) The TCJA increased the bonus depreciation percentage from 50% to 100% for qualified property acquired and placed in service after September 27, 2017 and before January 1, 2018. Increases in tax depreciation reduce the Registrants' taxes payable and increase net deferred tax liabilities with no impact to“Income Taxes” on the Statements of Income.
(c) An increase in the consolidated federal net operating loss reduces net deferred tax liabilities with the opposite effect if there is a decrease in the consolidated federal net operating loss. These increases or decreases have no impact to “Income Taxes” on the Statements of Income.
Income Tax Expense (Benefit) Adjustments per 2017 Tax
Return
Adjustments per 2017 Tax
Provision2018
AdjustmentsPPL Deemed Dividend $ 139 $ 161 $ (22)Foreign Tax Credits (157) (205) 48Valuation of Foreign Tax Credit Carryforward 110 145 (35)Reduction in U.S. federal income tax rate 229 220 9 Total $ 321 $ 321 $ —
PPL Electric Reduction in U.S. federal income tax rate $ (13) $ (13) $ —
LKE Reduction in U.S. federal income tax rate $ 110 $ 112 $ (2)
The Registrants' accounting related to the effects of the TCJA on financial results for the period ended December 31, 2017 iscomplete as of December 31, 2018 with respect to all provisional amounts.
In 2018, the IRS issued proposed regulations for certain provisions of the TCJA, including interest deductibility, Base ErosionAnti-Avoidance Tax (BEAT), and Global Intangible Low-Taxed Income (GILTI). PPL has determined that the proposed regulations related to BEAT and GILTI do not materially change PPL's current interpretation of the statutory impact of these rrrules on the company. Proposed regulations relating to the limitation on the deductibility of interest expense were issued in November 2018 and such regulations provide detailed rules implementing the broader statutorymm provisions. These proposed yregulations should not apply to the Registrants until the year in which the regulations are issued in final form, which is expected to be 2019. It is uncertain what form the final regulations will take and, therefore, the Registrants cannot predict what impact the final regulations will have on the tax deductibility of interest expense. However, if the proposed regulations were issued asfinal in their current form, the Registrants could have a limitation on a portion of their interest expense deduction for taxfpurposes and such limitation could be significant.
(PPL)
"Income Before Income Taxes" included the following:
2018 2017 2016 Domestic income $ 1,127 $ 874 $ 1,463Foreign income 1,158 1,038 1,087
Total $ 2,285 $ 1,912 $ 2,550
Deferred income taxes reflect the net tax effects of temporary differences between the carrying amounts of assets and liabilities for accounting purposes and their basis for income tax purposes and the tax effects of net operating loss and tax credit carryforwards. The provision for PPL's deferred income taxes for regulated assets and liabilities is based upon the ratemakingprinciples of the applicable jurisdiction. See Notes 1 and 7 for additional information.
Net deferred tax assets have been recognized based on management's estimates of future taxable income for the U.S. and theU.K.
Significant components of PPL's deferred income tax assets and liabilities were as follows:

104
2018 2017 Deferred Tax Assets
Deferred investment tax credits $ 31 $ 33Regulatory liabilities 87 68Income taxes due to customer 479 499Accrued pension and postretirement costs 277 232Federal loss carryforwards 325 356State loss carryforwards 419 409Federal and state tax credit carryforwards 392 455Foreign capital loss carryforwards 313 329Foreign loss carryforwards 1 2Foreign - regulatory obligations — 2Foreign - other 9 7Contributions in aid of construction 139 134Domestic - other 81 102Unrealized losses on qualifying derivatives 7 10Valuation allowances (808) (838)
Total deferred tax assets 1,752 1,800
Deferred Tax Liabilities Domestic plant - net 3,359 3,168Regulatory assets 314 288Reacquired debt costs 12 15Foreign plant - net 724 726Foreign - pensions 83 32Domestic - other 28 9
Total deferred tax liabilities 4,520 4,238Net deferred tax liability $ 2,768 $ 2,438
State deferred taxes are determined on a by entity, by jurisdiction basis. As a resuy lt, $28 million and $24 million of net deferred tax assets are shown as "Other noncurrent assets" on the Balance Sheets for 2018 and 2017.
At December 31, 2018, PPL had the following loss and tax credit carryforwards, related deferred tax assets and valuation allowances recorded against the deferred tax assets.
Gross Deferred Tax
AssetValuationAllowance Expiration
Loss carryforwards Federal net operating losses $ 1,519 $ 319 $ —— 2031-2037Federal charitable contributions 29 6 — 2020-2022 State net operating losses 5,725 418 (370) 2019-2038State charitable contributions 7 1 — 2020-2022 Foreign net operating losses 6 1 —— IndefiniteForeign capital losses 1,842 313 (313) Indefinite
Credit carryforwards Federal investment tax credit 133 —— 2025-2036
Federal alternative minimum tax credit (a) 15 — IndefiniteFederal foreign tax credits (b) 218 (113) 2024-2027Federal - other 25 (8) 2019-2038 State - other 1 —— Indefinite
(a) The TCJA repealed the corporate alternative minimum tax (AMT) for tax years beginning after December 31, 2017. The existing indff efinite carryforward period for AMT credits was retained.
(b) Includes $62 million of foreign tax credits carried forward from 2016 and $156 million of additional foreign tax credits from 2017 related to the taxable deemed dividend associated with the TCJA.
Valuation allowances have been established for the amount that, more likely than not, will not be realized. The changes indeferred tax valuation allowances were as follows:

105
Additions
Balance atBeginning of Period
Charged to Income
Charged to Other
Accounts Deductions
Balance at End
of Period 2018 $ 838 $ 26 $ — $ 56 (a) $ 8082017 593 256 (b) — 11 8382016 662 17 2 88 (c) 593
(a) Decrease in the valuation allowance of approximately $35 million due to the change in the total foreign tax credits available after finalization of thedeemed dividend calculation required by the TCJA in 2017. In addition, the deferred tax assets and corresponding valuation allowances were reduced in2018 by approximately $19 million due to the effect of foreign currency exchange rates.
(b) Increase in valuation allowance of approximately $145 million related to expected future utilization of both 2017 foreign tax credits and pre-2017 foreigntax credits carried forward. For additional information, see the "Reconciliation of Income Tax Expense" and associated notes below.
In addition, the reduction of the U.S. federal corporate income tax rate enacted by the TCJA in 2017 resulted in a $62 million increase in federal deferred tax assets and a corresponding valuation allowance related to the federal tax benefits of state net operating losses.
(c) The reduction of the U.K. statutory income tax rate in 2016 resulted in a $19 million reduction in deferred tax assets and corresponding valuation allowances. See "Reconciliation of Income Tax Expense" below for additional information on the impact of the U.K. Finance Act 2016. In addition, deferred tax assets and corresponding valuation allowances were reduced in 2016 by approximately $65 million due to the effect of foreign currencyexchange rates.
PPL Global does not record U.S. income taxes on the unremitted earnings of WPD, as management has determined that suchearnings are indefinitely reinvested. Current year distributions from WPD to the U.S. are sourced from a portion of the currentyear’s earnings of the WPD group. There have been no material changes to the facts underlying PPL’s assertion that historicallyreinvested earnings of WPD as well as some portion of current year earnings will continue to be indefinitely reinvested. WPD'slong-term working capital forecasts and capital expenditure projections for the foreseeable future require reinvestment of WPD's undistributed earnings. Additionally, U.S. long-term working capital forecasts and capital expenditure projections for the foreseeable future do not require or contemplate annual distributions from WPD in excess of some portion of WPD's future annual earnings. The cumulative undistributed earnings are included in "Earnings reinvested" on the Balance Sheets. The amount considered indefinitely reinvested at December 31, 2018 was $6.7 billion. The foregoing is not impacted by U.S. taxreform and the conversion from a worldwide to a participation exemption system. It is not practicable to estimate the amount ofadditional taxes that could be payable on these foreign earnings in the event of repatriation to the U.S.
Details of the components of income tax expense, a reconciliation of federal income taxes derived from statutory tax ratesapplied to "Income Before Income Taxes" to income taxes for reporting purposes, and details of "Taxes, other than income" TTwere as follows:
2018 2017 2016 Income Tax Expense (Benefit)
Current - Federal $ (19) $ 6 $ (14)Current - State 17 25 21Current - Foreign 104 45 80
Total Current Expense 102 76 87Deferred - Federal (a) 203 532 385Deferred - State 100 88 89Deferred - Foreign 107 133 86
Total Deferred Expense, excluding operating loss carryforwards 410 753 560
Amortization of investment tax credit (3) (3) (3)Tax expense (benefit) of operating loss carryforwards
Deferred - Federal (20) (16) 25Deferred - State (31) (26) (21)
Total Tax Expense (Benefit) of Operating Loss Carryforwards (51) (42) 4Total income taxes $ 458 $ 784 $ 648
Total income tax expense - Federal $ 161 $ 519 $ 393Total income tax expense - State 86 87 89Total income tax expense - Foreign 211 178 166
Total income taxes $ 458 $ 784 $ 648
(a) Due to the enactment of the TCJA, PPL recorded the following in 2017:

106
• $220 million of deferred income tax expense related to the impact of the U.S. federal corporate income tax rate reduction from 35% to 21% on deferred tax assets and liabilities;
• $162 million of deferred tax expense related to the utilization of current year losses resulting from the taxable deemed dividend; partially offset by,• $60 million of deferred tax benefits related to the $205 million of 2017 foreign tax credits partially offset by $145 million of valuation allowances.
In the table above, the following income tax expense (benefit) are excluded from income taxes.
2018 2017 2016 Stock-based compensation recorded to Earnings reinvested $ — $ — $ (7)Other comprehensive income (6) (34) (6)Valuation allowance on state deferred taxes recorded to other comprehensive income — (1) 1
Total $ (6) $ (35) $ (12)
2018 2017 2016 Reconciliation of Income Tax Expense
Federal income tax on Income Before Income Taxes at statutory tax rate (a) $ 480 $ 669 $ 893Increase (decrease) due to:
State income taxes, net of federal income tax benefit (a) 40 46 46Valuation allowance adjustments (b) 21 36 16Impact of lower U.K. income tax rates(c) (25) (176) (177) U.S. income tax on foreign earnings - net of foreign tax credit (a)(d) 3 47 (42) Foreign income return adjustments — (8) 2Impact of the U.K. Finance Act on deferred tax balances (e) (13) (16) (49)Depreciation and other items not normalized (11) (10) (10) Amortization of excess deferred federal and state income taxes(f) (37) — —Interest benefit on U.K. financing entities (17) (16) (17) Stock-based compensation 4 (3) (10) Deferred tax impact of U.S. tax reform (g) — 220 ——Deferred tax impact of Kentucky tax reform (h) 9 — —Other (i) 4 (5) (4)
Total increase (decrease) (22) 115 (245) Total income taxes $ 458 $ 784 $ 648Effective income tax rate 20.0% 41.0% 25.4%
(a) The U.S. federal corporate tax rate was reduced from 35% to 21%, as enacted by the TCJA, effective January 1, 2018.(b) During 2017, PPL recorded an increase in valuation allowances of $23 million primarily related to foreign tax credits recorded in 2016. The future
utilization of these credits is expected to be lower as a result of the TCJA.
During 2018, 2017 and 2016, PPL recorded deferred income tax expense of $24 million, $16 million and $13 million for valuation allowances primarily related to increased Pennsylvania net operating loss carryforwards expected to be unutilized.
(c) The reduction in the U.S. federal corporate income tax rate from 35% to 21% significantly reduced the difference between the U.K. and U.S. income taxrates in 2018 compared with 2017.
(d) During 2017, PPL recorded a federal income tax benefit of $35 million primarily attributable to U.K. pension contributions.
During 2017, PPL recorded deferred income tax expense of $83 million primarily related to enactment of the TCJA. The enacted tax law included aconversion from a worldwide tax system to a territorial tax system, effective January 1, 2018. In the transition to the territorial regime, a one-time transition tax was imposed on PPL’s unrepatriated accumulated foreign earnings in 2017. These earnings were treated as a taxable deemed dividend to PPL of approximately $462 million, including $205 million of foreign tax credits. As the PPL consolidated U.S. group had a taxable loss for 2017, ainclusive of the taxable deemed dividend, these credits were recorded as a deferred tax asset. However, it is expected that under the TCJA, only $83 million of the $205 million of foreign tax credits will be realized in the carry forward period. Accordingly, a valuation allowance on the current year foreign tax credits in the amount of $122 million has been recorded to reflect the reduction in the future utilization of the credits. The foreign tax creditsassociated with the deemed repatriation result in a gross carryforward and corresponding deferred tax asset of $205 million offset by a valuationallowance of $122 million.
During 2016, PPL recorded lower income taxes primarily attributable to foreign tax credit carryforwards, arising from a decision to amend prior year taxreturns to claim foreign tax credits rather than deduct foreign taxes. This decision was prompted by changes to the company's most recent business plan.
(e) The U.K. Finance Act 2016, enacted in September 2016, reduced the U.K. statutory income tax rate effective April 1, 2020 to 17%. As a result, PPL reduced its net deferred tax liabilities and recognized a $42 million deferred income tax benefit during 2016.
(f) During 2018, PPL recorded lower income tax expense for the amortization of excess deferred income taxes that primarily resulted from the U.S. federaldcorporate income tax rate reduction from 35% to 21% enacted by the TCJA.
(g) During 2017, PPL recorded deferred income tax expense related to the U.S. federal corporate income tax rate reduction from 35% to 21% enacted by theTCJA.
(h) During 2018, PPL recorded deferred income tax expense, primarily associated with LKE’s non-regulated entities, due to the Kentucky corporate income tax rate reduction from 6% to 5%, as enacted by HB 487, effective January, 1, 2018.
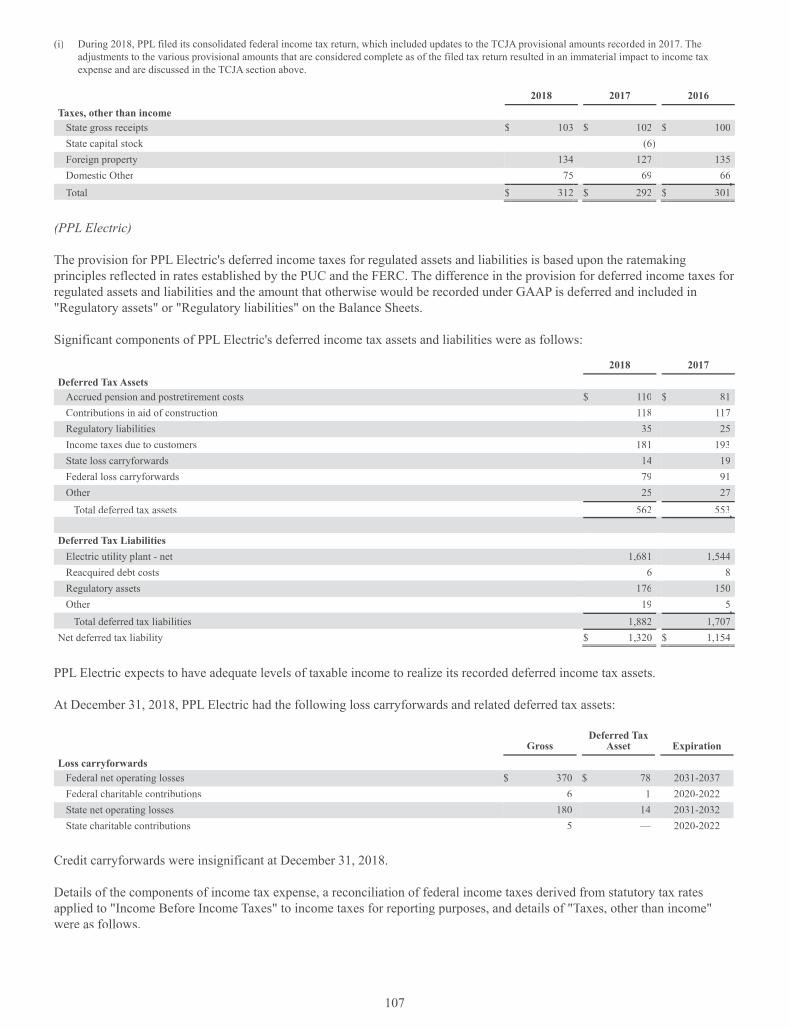
107
(i) During 2018, PPL filed its consolidated federal income tax return, which included updates to the TCJA provisional amounts recorded in 2017. The adjustments to the various provisional amounts that are considered complete as of the filed tax return resulted in an immaterial impact to income taxexpense and are discussed in the TCJA section above.
2018 2017 2016 Taxes, other than income
State gross receipts $ 103 $ 102 $ 100State capital stock — (6) —Foreign property 134 127 135Domestic Other 75 69 66Total $ 312 $ 292 $ 301
(PPL Electric)
The provision for PPL Electric's deferred income taxes for regulated assets and liabilities is based upon the ratemaking principles reflected in rates established by the PUC and the FERC. The difference in the provision for deferred income taxes for regulated assets and liabilities and the amount that otherwise would be recorded under GAAP is deferred and included in "Regulatory assets" or "Regulatory liabilities" on the Balance Sheets.
Significant components of PPL Electric's deferred income tax assets and liabilities were as follows:
2018 2017 Deferred Tax Assets
Accrued pension and postretirement costs $ 110 $ 81Contributions in aid of construction 118 117Regulatory liabilities 35 25Income taxes due to customers 181 193State loss carryforwards 14 19Federal loss carryforwards 79 91Other 25 27
Total deferred tax assets 562 553
Deferred Tax Liabilities Electric utility plant - net 1,681 1,544Reacquired debt costs 6 8Regulatory assets 176 150Other 19 5
Total deferred tax liabilities 1,882 1,707Net deferred tax liability $ 1,320 $ 1,154
PPL Electric expects to have adequate levels of taxable income to realize its recorded deferred income tax assets.
At December 31, 2018, PPL Electric had the following loss carryforwards and related deferred tax assets:
Gross Deferred Tax
Asset Expiration Loss carryforwards
Federal net operating losses $ 370 $ 78 2031-2037Federal charitable contributions 6 1 2020-2022State net operating losses 180 14 2031-2032State charitable contributions 5 — 2020-2022
Credit carryforwards were insignificant at December 31, 2018.
Details of the components of income tax expense, a reconciliation of federal income taxes derived from statutory tax ratesapplied to "Income Before Income Taxes" to income taxes for reporting purposes, and details of "Taxes, other than income" TTwere as follows.

108
2018 2017 2016 Income Tax Expense (Benefit) Current - Federal $ 2 $ (65) $ (29)Current - State 9 20 19
Total Current Expense (Benefit) 11 (45) (10)Deferred - Federal (a) 96 234 193Deferred - State 37 29 29
Total Deferred Expense, excluding operating loss carryforwards 133 263 222
Tax expense (benefit) of operating loss carryforwards Deferred - Federal (8) (5) —
Total Tax Expense (Benefit) of Operating Loss Carryforwards (8) (5) —Total income taxes $ 136 $ 213 $ 212
Total income tax expense - Federal $ 90 $ 164 $ 164Total income tax expense - State 46 49 48
Total income taxes $ 136 $ 213 $ 212
(a) Due to the enactment of the TCJA in 2017, PPL Electric recorded a $13 million deferred tax benefit related to the impact of the U.S. federal corporate income tax rate reduction from 35% to 21% on deferred tax assets and liabilities.
2018 2017 2016 Reconciliation of Income Taxes
Federal income tax on Income Before Income Taxes at statutory tax rate (a) $ 119 $ 201 $ 193Increase (decrease) due to:
State income taxes, net of federal income tax benefit (a) 43 36 36Depreciation and other items not normalized (11) (8) (8) Amortization of excess deferred federal income taxes (a) (17) — ——Stock-based compensation 1 (2) (6) Deferred tax impact of U.S. tax reform (b) — (13) ——Other 1 (1) (3)
Total increase (decrease) 17 12 19Total income taxes $ 136 $ 213 $ 212Effective income tax rate 24.0% 37.0% 38.4%
(a) The U.S. federal corporate tax rate was reduced from 35% to 21%, as enacted by the TCJA, effective January 1, 2018.(b) During 2017, PPL Electric recorded a deferred tax benefit related to the U.S. federal corporate income tax rate reduction from 35% to 21% enacted by the
TCJA.
2018 2017 2016 Taxes, other than income
State gross receipts $ 103 $ 102 $ 100Property and other 6 5 5
Total $ 109 $ 107 $ 105
(LKE)
The provision for LKE's deferred income taxes for regulated assets and liabilities is based upon the ratemaking principles reflected in rates established by the KPSC, VSCC and the FERC. The difference in the provision for deferred income taxes for regulated assets and liabilities and the amount that otherwise would be recorded under GAAP is deferred and included in "Regulatory assets" or "Regulatory liabilities" on the Balance Sheets.
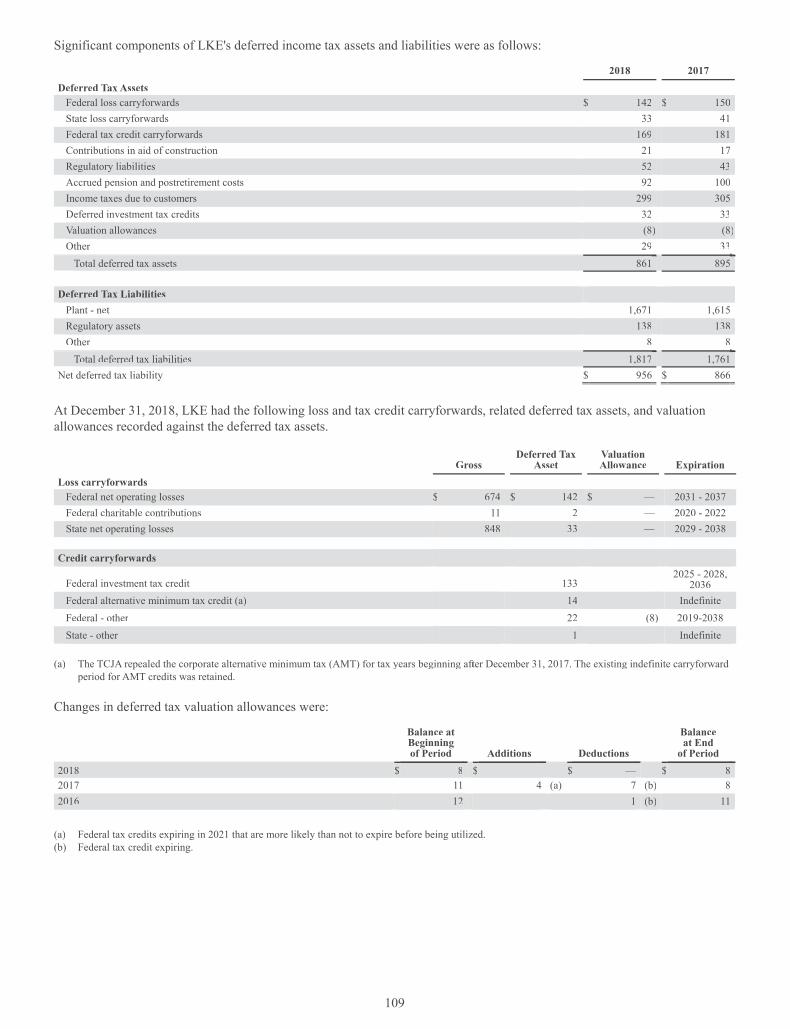
109
Significant components of LKE's deferred income tax assets and liabilities were as follows:
2018 2017 Deferred Tax Assets
Federal loss carryforwards $ 142 $ 150State loss carryforwards 33 41Federal tax credit carryforwards 169 181Contributions in aid of construction 21 17Regulatory liabilities 52 43Accrued pension and postretirement costs 92 100Income taxes due to customers 299 305Deferred investment tax credits 32 33Valuation allowances (8) (8)Other 29 33
Total deferred tax assets 861 895
Deferred Tax Liabilities Plant - net 1,671 1,615Regulatory assets 138 138Other 8 8
Total deferred tax liabilities 1,817 1,761Net deferred tax liability $ 956 $ 866
At December 31, 2018, LKE had the following loss and tax credit carryforwards, related deferred tax assets, and valuation allowances recorded against the deferred tax assets.
Gross Deferred Tax
AssetValuation Allowance Expiration
Loss carryforwards Federal net operating losses $ 674 $ 142 $ — 2031 - 2037Federal charitable contributions 11 2 — 2020 - 2022State net operating losses 848 33 — 2029 - 2038
Credit carryforwards
Federal investment tax credit 133 —2025 - 2028,
2036 Federal alternative minimum tax credit (a) 14 — IndefiniteFederal - other 22 (8) 2019-2038State - other 1 — Indefinite
(a) The TCJA repealed the corporate alternative minimum tax (AMT) for tax years beginning after December 31, 2017. The existing indff efinite carryforward period for AMT credits was retained.
Changes in deferred tax valuation allowances were:
Balance at Beginningof Period Additions Deductions
Balance at End
of Period2018 $ 8 $ — $ — $ 82017 11 4 (a) 7 (b) 82016 12 — 1 (b) 11
(a) Federal tax credits expiring in 2021 that are more likely than not to expire before being utilized. (b) Federal tax credit expiring.

110
Details of the components of income tax expense, a reconciliation of federal income taxes derived from statutory tax rates applied to "Income Before Income Taxes" to income taxes for reporting purposes, and details of "Taxes, other than income" TTwere:
2018 2017 2016 Income Tax Expense (Benefit)
Current - Federal $ 31 $ 74 $ (36)Current - State 4 6 1
Total Current Expense (Benefit) 35 80 (35)Deferred - Federal (a) 65 268 248Deferred - State 34 32 38
Total Deferred Expense, excluding benefits of operating loss carryforwards 99 300 286Amortization of investment tax credit - Federal (3) (3) (3)Tax benefit of operating loss carryforwards
Deferred - Federal (2) (2) 10Deferred - State — — (1)
Total Tax Expense (Benefit) of Operating Loss Carryforwards (2) (2) 9Total income taxes (b) $ 129 $ 375 $ 257
Total income tax expense - Federal $ 91 $ 337 $ 219Total income tax expense - State 38 38 38
Total income taxes (b) $ 129 $ 375 $ 257
(a) Due to the enactment of the TCJA in 2017, LKE recorded $112 million of deferred income tax expense, of which $108 million related to the impact of theU.S. federal corporate income tax rate reduction from 35% to 21% on deferred tax assets and liabilities and $4 million related to valuation allowances ontax credits expiring in 2021.
(b) Excludes deferred federal and state tax expense (benefit) recorded to OCI of $5 million in 2018, $(10) million in 2017 and $(16) million in 2016.
2018 2017 2016 Reconciliation of Income Tax Expense
Federal income tax on Income Before Income Taxes at statutory tax rate (a) $ 121 $ 242 $ 240Increase (decrease) due to:
State income taxes, net of federal income tax benefit 22 26 26Amortization of investment tax credit (3) (3) (3) Amortization of excess deferred federal and state income taxes (b) (20) (2) (1) Stock-based compensation 1 1 (3) Deferred tax impact of U.S. tax reform (c) — 112 ——Deferred tax impact of state tax reform (d) 9 — —Other (e) (1) (1) (2)
Total increase 8 133 17Total income taxes $ 129 $ 375 $ 257Effective income tax rate 22.5% 54.3% 37.5%
(a) The U.S. federal corporate tax rate was reduced from 35% to 21%, as enacted by the TCJA, effective January 1, 2018.(b) During 2018, LKE recorded lower income tax expense for the amortization of excess deferred income taxes that primarily resulted from the U.S. federal
corporate income tax rate reduction from 35% to 21% enacted by the TCJA.(c) During 2017, LKE recorded deferred income tax expense primarily due to the U.S. federal corporate income tax rate reduction from 35% to 21% enacted
by the TCJA.(d) During 2018, LKE recorded deferred income tax expense, primarily associated with LKE's non-regulated entities, due to the Kentucky corporate income
tax rate reduction from 6% to 5%, as enacted by HB 487, effective January 1, 2018.(e) During 2018, PPL filed its consolidated federal income tax return, which included updates to the TCJA provisional amounts recorded in 2017. The
adjustments to the various provisional amounts that are considered complete as of the filed tax return resulted in an immaterial impact to income taxexpense and are discussed in the TCJA section above.
2018 2017 2016 Taxes, other than income
Property and other $ 70 $ 65 $ 62Total $ 70 $ 65 $ 62
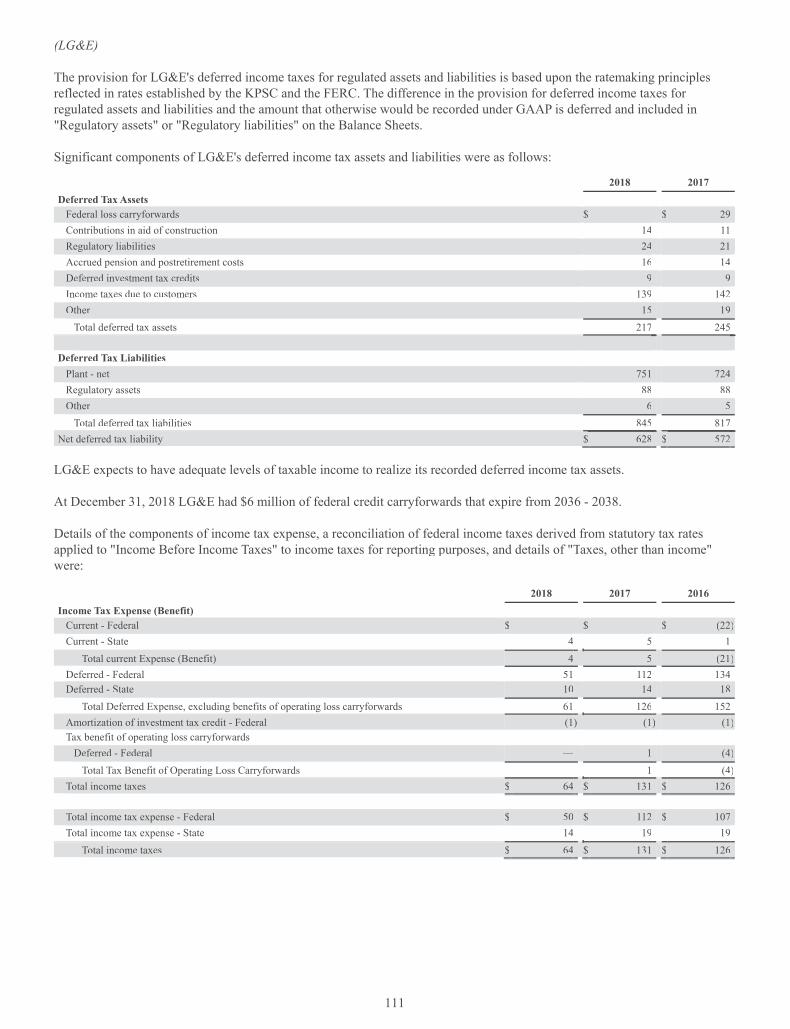
111
(LG&E)
The provision for LG&E's deferred income taxes for regulated assets and liabilities is based upon the ratemaking principlesreflected in rates established by the KPSC and the FERC. The difference in the provision for deferred income taxes for regulated assets and liabilities and the amount that otherwise would be recorded under GAAP is deferred and included in "Regulatory assets" or "Regulatory liabilities" on the Balance Sheets.
Significant components of LG&E's deferred income tax assets and liabilities were as follows:
2018 2017 Deferred Tax Assets
Federal loss carryforwards $ —— $ 29Contributions in aid of construction 14 11Regulatory liabilities 24 21Accrued pension and postretirement costs 16 14Deferred investment tax credits 9 9Income taxes due to customers 139 142Other 15 19
Total deferred tax assets 217 245
Deferred Tax Liabilities Plant - net 751 724Regulatory assets 88 88Other 6 5
Total deferred tax liabilities 845 817NNet deferred tax liability $ 628 $ 572
LG&E expects to have adequate levels of taxable income to realize its recorded deferred income tax assets.
At December 31, 2018 LG&E had $6 million of federal credit carryforwards that expire from 2036 - 2038.
Details of the components of income tax expense, a reconciliation of federal income taxes derived from statutory tax ratesapplied to "Income Before Income Taxes" to income taxes for reporting purposes, and details of "Taxes, other than income" TTwere:
2018 2017 2016 Income Tax Expense (Benefit)
Current - Federal $ — $ —— $ (22)Current - State 4 5 1
Total current Expense (Benefit) 4 5 (21)Deferred - Federal 51 112 134Deferred - State 10 14 18
Total Deferred Expense, excluding benefits of operating loss carryforwards 61 126 152Amortization of investment tax credit - Federal (1) (1) (1)Tax benefit of operating loss carryforwards
Deferred - Federal — 1 (4)Total Tax Benefit of Operating Loss Carryforwards — 1 (4)
Total income taxes $ 64 $ 131 $ 126
Total income tax expense - Federal $ 50 $ 112 $ 107Total income tax expense - State 14 19 19
Total income taxes $ 64 $ 131 $ 126
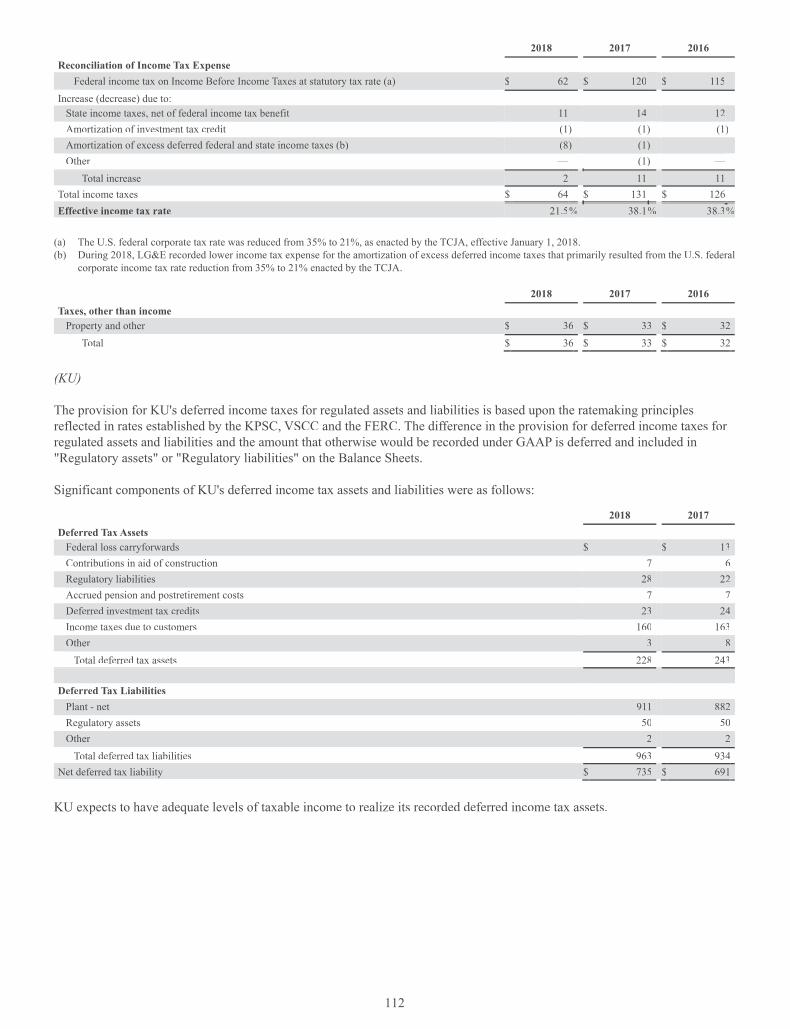
112
2018 2017 2016 Reconciliation of Income Tax Expense
Federal income tax on Income Before Income Taxes at statutory tax rate (a) $ 62 $ 120 $ 115Increase (decrease) due to:
State income taxes, net of federal income tax benefit 11 14 12Amortization of investment tax credit (1) (1) (1) Amortization of excess deferred federal and state income taxes (b) (8) (1) —Other — (1) —
Total increase 2 11 11Total income taxes $ 64 $ 131 $ 126Effective income tax rate 21.5% 38.1% 38.3%
(a) The U.S. federal corporate tax rate was reduced from 35% to 21%, as enacted by the TCJA, effective January 1, 2018. (b) During 2018, LG&E recorded lower income tax expense for the amortization of excess deferred income taxes that primarily resulted from the U.S. federal
corporate income tax rate reduction from 35% to 21% enacted by the TCJA.
2018 2017 2016 Taxes, other than income
Property and other $ 36 $ 33 $ 32Total $ 36 $ 33 $ 32
(KU)
The provision for KU's deferred income taxes for regulated assets and liabilities is based upon the ratemaking principlesreflected in rates established by the KPSC, VSCC and the FERC. The difference in the provision for deferred income taxes for regulated assets and liabilities and the amount that otherwise would be recorded under GAAP is deferred and included in "Regulatory assets" or "Regulatory liabilities" on the Balance Sheets.
Significant components of KU's deferred income tax assets and liabilities were as follows:
2018 2017 Deferred Tax Assets
Federal loss carryforwards $ —— $ 13Contributions in aid of construction 7 6Regulatory liabilities 28 22Accrued pension and postretirement costs 7 7Deferred investment tax credits 23 24Income taxes due to customers 160 163Other 3 8
Total deferred tax assets 228 243
Deferred Tax Liabilities Plant - net 911 882Regulatory assets 50 50Other 2 2
Total deferred tax liabilities 963 934NNet deferred tax liability $ 735 $ 691
KU expects to have adequate levels of taxable income to realize its recorded deferred income tax assets.

113
Details of the components of income tax expense, a reconciliation of federal income taxes derived from statutory tax rates applied to "Income Before Income Taxes" to income taxes for reporting purposes, and details of "Taxes, other than income" TTwere:
2018 2017 2016 Income Tax Expense (Benefit)
Current - Federal $ 22 $ —— $ 31Current - State 6 7 5
Total Current Expense (Benefit) 28 7 36Deferred - Federal 40 138 131Deferred - State 10 16 19
Total Deferred Expense, excluding benefits of operating loss carryforwards 50 154 150Amortization of investment tax credit - Federal (2) (2) (2)Tax benefit of operating loss carryforwards
Deferred - Federal — — (21)Total Tax Benefit of Operating Loss Carryforwards — — (21)
Total income taxes $ 76 $ 159 $ 163
Total income tax expense - Federal $ 60 $ 136 $ 139Total income tax expense - State 16 23 24
Total income taxes $ 76 $ 159 $ 163
2018 2017 2016 Reconciliation of Income Tax Expense
Federal income tax on Income Before Income Taxes at statutory tax rate (a) $ 76 $ 146 $ 150Increase (decrease) due to:
State income taxes, net of federal income tax benefit 13 15 16Amortization of investment tax credit (2) (2) (2) Amortization of excess deferred federal and state income taxes (b) (12) (1) (1) Other 1 1 —
Total increase (decrease) — 13 13Total income taxes $ 76 $ 159 $ 163Effective income tax rate 21.0% 38.0% 38.1%
(a) The U.S. federal corporate tax rate was reduced from 35% to 21%, as enacted by the TCJA, effective January 1, 2018.(b) During 2018, KU recorded lower income tax expense for the amortization of excess deferred income taxes that primarily resulted from the U.S. federal
corporate income tax rate reduction from 35% to 21% enacted by the TCJA.
2018 2017 2016 Taxes, other than income
Property and other $ 34 $ 32 $ 30Total $ 34 $ 32 $ 30
Unrecognized Tax Benefits (All Registrants)
PPL or its subsidiaries file tax returns in four major tax jurisdictions. The income tax provisions for PPL Electric, LG&E and KU are calculated in accordance with an intercompany tax sharing agreement, which provides that taxable income becalculated as if each domestic subsidiary filed a separate consolidated return. Based on this tax sharing agreement, PPL Electricor its subsidiaries indirectly or directly file tax returns in two major tax jurisdictions, and LKE, LG&E and KU or their subsidiaries indirectly or directly file tax returns in two major tax jurisdictions. With few exceptions, at December 31, 2018,these jurisdictions, as well as the tax years that are no longer subject to examination, were as follows.
PPL PPL Electric LKE LG&E KU U.S. (federal) 2013 and prior 2013 and prior 2013 and prior 2013 and prior 2013 and priorPennsylvania (state) 2011 and prior 2011 and prior Kentucky (state) 2013 and prior 2013 and prior 2013 and prior 2013 and priorU.K. (foreign) 2015 and prior

114
Other
Kentucky State Tax Reform (All Registrants)
HB 487, which became law on April 27, 2018, provides for significant changes to the Kentucky tax code including (1) adopting mandatory combined reporting for corporate members of unitary business groups for taxable years beginning on or after yJanuary 1, 2019 (members of a unitary business group may make an eight-year binding election to file consolidated corporateincome tax returns with all members of their federal affiliated group) and (2) a reduction in the Kentucky corporate income taxrate from 6% to 5% for taxable years beginning after December 31, 2017. LKE recognized a deferred tax charge of $9 millionin the second quarter of 2018 primarily associated with the remeasurement of non-regulated accumulated deferred income taxbalances.
As indicated in Note 1, LG&E's and KU's accounting for income taxes is impacted by rate regulation. Therefore, reductions inregulated accumulated deferred income tax balances due to the reduction in the Kentucky corporate income tax rate to 5%under the provisions of HB 487 will result in amounts previously collected from utility customers for these deferred taxes to be refundable to such customers in future periods. In the second quarter of 2018, LG&E and KU recorded the impact of thereduced tax rate, related to the remeasurement of deferred income taxes, as an increase in regulatory liabilities of $16 millionand $19 million. In a separate regulatory proceeding, LG&E and KU have requested to begin returning state excess deferred income taxes to customers in conjunction with the 2018 Kentucky base rate case, which was filed on September 28, 2018. SeeNote 7 for additional information related to the rate case proceedings. PPL is evaluating the impact, if any, of unitary or elective consolidated income tax reporting on all its Registrants.
7. Utility Rate Regulation
Regulatory Assets and Liabilities
(All Registrants)
PPL, PPL Electric, LKE, LG&E and KU reflect the effects of regulatory actions in the financial statements for their cost-based rate-regulated utility operations. Regulatory assets and liabilities are classified as current if, upon initial recognition, the entire amount related to an item will be recovered or refunded within a year of the balance sheet date.
(PPL)
WPD is not subject to accounting for the effects of certain types of regulation as prescribed by GAAP and doesy not record regulatory assets and liabilities. See Note 1 for additional information.
(PPL, LKE, LG&E and KU)
LG&E is subject to the jurisdiction of the KPSC and FERC, and KU is subject tof the jurisdiction of the KPSC, FERC and VSCC.
LG&E's and KU's Kentucky base rates are calculated based on a return on capitalization (common equity, long-term debt and short-term debt) including adjustments for certain net investments and costs recovered separately through other means. Assuch, LG&E and KU generally earn a return on regulatory assets.
As a result of purchase accounting requirements, certain fair value amounts related to contracts that had favorable or unfavorable terms relative to market were recorded on the Balance Sheets with an offsetting regulatory asset or liability. LG&Eand KU recover in customer rates the cost of power purchases. As a result, management believes the regulatory assets and liabilities created to offset the fair value amounts at LKE's acquisition date meet the recognition criteria established by existing accounting guidance and eliminate any rate-making impact of the fair value adjustments. LG&E's and KU's customer ratescontinue to reflect the original contracted prices for remaining contracts.
(PPL, LKE and KU)
KU's Virginia base rates are calculated based on a return on rate base (net utility plant plus working capital less accumulateddeferred income taxes and miscellaneous deductions). As all regulatory assets and liabilities, except the levelized fuel factorand regulatory assets or liabilities recorded for pension and postretirement benefits and AROs related to certain CCR

115
impoundments, are excluded from the return on rate base utilized in the calculation of Virginia base rates, no return is earned on the related assets.
KU's rates to 10 municipal customers for wholesale power requirements are calculated based on annual updates to a formularate that utilizes a return on rate base (net utility plant plus working capital less accumulated deferred income taxes and miscellaneous deductions). As all regulatory assets and liabilities, except regulatory assets recorded for AROs related to certain CCR impoundments, are excluded from the return on rate base utilized in the development of municipal rates, no return is earned on the related assets.
(PPL and PPL Electric)
PPL Electric's distribution base rates are calculated based on recovery of costs as well as a return on distribution rate base (net utility plant plus a working capital allowance less plant-related deferred taxes and other miscellaneous additions and deductions). PPL Electric's transmission revenues are billed in accordance with a FERC tariff that allows for recovery of transmission costs incurred, a return on transmission-related rate base (net utility plant plus a working capital allowance lessplant-related deferred taxes and other miscellaneous additions and deductions) and an automatic annual update. See"Transmission Formula Rate" below for additional information on this tariff. All regulatory assets and liabilities are excludedfrom distribution and transmission return on investment calculations; therefore, generally no return is earned on PPL Electric's regulatory assets.
(All Registrants)
The following table provides information about the regulatory assets and liabilities of cost-based rate-regulated utility operations at December 31:
PPL PPL Electric 2018 2017 2018 2017
Current Regulatory Assets: Environmental cost recovery $ — $ 5 $ — $ —Generation formula rate — 6 — —Gas supply clause 12 4 — —Smart meter rider 11 15 11 15Plant outage costs 10 3 — —Other 3 1 — 1
Total current regulatory assets (a) $ 36 $ 34 $ 11 $ 16
NNoncurrent Regulatory Assets:
Defined benefit plans $ 963 $ 880 $ 558 $ 504Taxes recoverable through future rates 3 3 3 3Storm costs 56 33 22 —Unamortized loss on debt 45 54 22 29Interest rate swaps 20 26 — —Terminated interest rate swaps 87 92 — —Accumulated cost of removal of utility plant 200 173 200 173AROs 273 234 — —Act 129 compliance rider 19 — 19 —Other 7 9 — —
Total noncurrent regulatory assets $ 1,673 $ 1,504 $ 824 $ 709
Current Regulatory Liabilities:Generation supply charge $ 33 $ 34 $ 33 $ 34Transmission service charge 3 9 3 9Environmental cost recovery 16 1 — —Universal service rider 27 26 27 26Transmission formula rate 3 9 3 9TCJA customer refund 20 — 3 —Storm damage expense rider 5 8 5 8Other 15 8 — —
Total current regulatory liabilities $ 122 $ 95 $ 74 $ 86

116
PPL PPL Electric 2018 2017 2018 2017
Noncurrent Regulatory Liabilities: Accumulated cost of removal of utility plant $ 674 $ 677 $ — $ —Power purchase agreement - OVEC 59 68 — —NNet deferred taxes 1,826 1,853 629 668Defined benefit plans 37 27 5 —Terminated interest rate swaps 72 74 — —TCJA customer refund 41 — 41 —Other 5 5 — —
Total noncurrent regulatory liabilities $ 2,714 $ 2,704 $ 675 $ 668
LKE LG&E KU2018 2017 2018 2017 2018 2017
Current Regulatory Assets: Plant outage costs $ 10 $ 3 $ 7 $ 3 $ 3 $ —Generation formula rate — 6 — — — 6Gas supply clause 12 4 12 4 — —Other 3 5 2 5r 1 —
Total current regulatory assets $ 25 $ 18 $ 21 $ 12 $ 4 $ 6
Noncurrent Regulatory Assets:
Defined benefit plans $ 405 $ 376 $ 249 $ 234 $ 156 $ 142Storm costs 34 33 20 18 14 15Unamortized loss on debt 23 25 15 16 8 9Interest rate swaps 20 26 20 26 — —Terminated interest rate swaps 87 92 51 54 36 38AROs 273 234 75 61 198 173Other 7 9 1 2 6 7
Total noncurrent regulatory assets $ 849 $ 795 $ 431 $ 411 $ 418 $ 384
Current Regulatory Liabilities: Environmental cost recovery $ 16 $ 1 $ 6 $ — $ 10 $ 1Fuel adjustment clauses — 3 — — — 3Gas line tracker 2 3 2 3 — —TCJA customer refund 17 — 7 — 10 —Generation formula Rate 7 — — — 7 —Other 6 2 2 — 4 2
Total current regulatory liabilities $ 48 $ 9 $ 17 $ 3 $ 31 $ 6
NNoncurrent Regulatory Liabilities:
Accumulated cost of removal of utility plant $ 674 $ 677 $ 279 $ 282 $ 395 $ 395Power purchase agreement - OVEC 59 68 41 47 18 21Net deferred taxes 1,197 1,185 557 552 640 633Defined benefit plans 32 27 — — 32 27Terminated interest rate swaps 72 74 36 37 36 37Other 5 5 2 1 3 4
Total noncurrent regulatory liabilities $ 2,039 $ 2,036 $ 915 $ 919 $ 1,124 $ 1,117
(a) For PPL, these amounts are included in "Other current assets" on the Balance Sheets.
Following is an overview of selected regulatory assets and liabilities detailed in the preceding tables. Specific developmentswith respect to certain of these regulatory assets and liabilities are discussed in "Regulatory Matters."
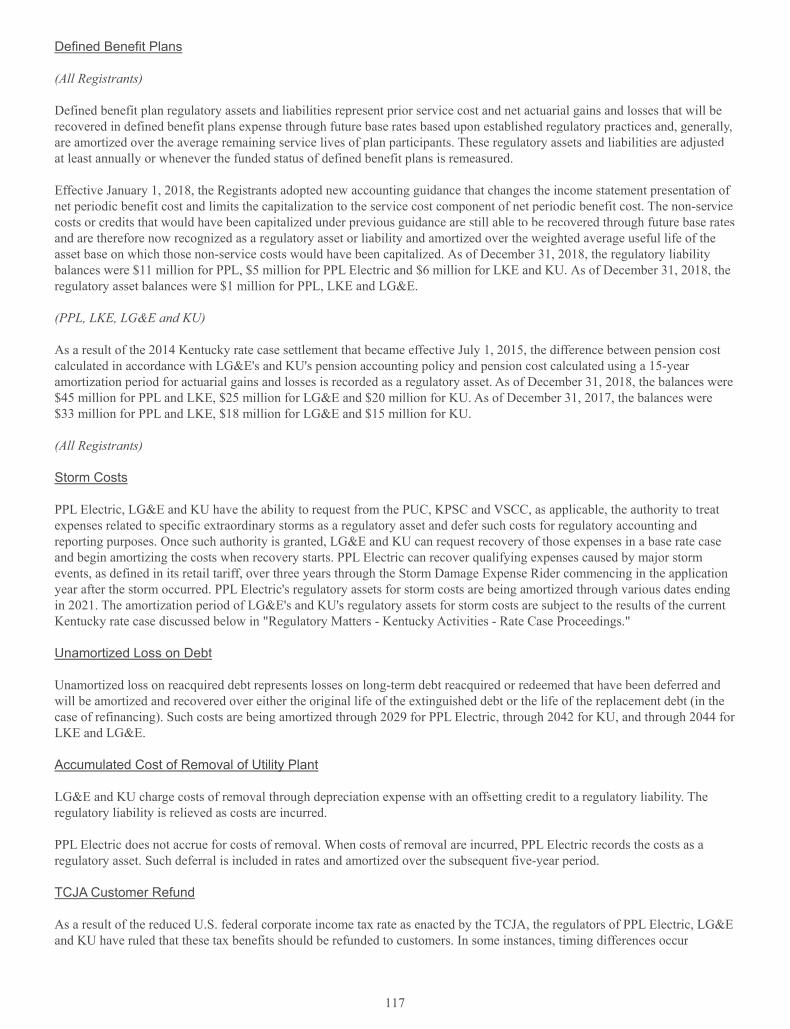
117
Defined Benefit Plans
(All Registrants)
Defined benefit plan regulatory assets and liabilities represent prior service cost and net actuarial gains and losses that will berecovered in defined benefit plans expense through future base rates based upon established regulatory practices and, generally,yyare amortized over the average remaining service lives of plan participants. These regulatory assets and liabilities are adjusted at least annually or whenever the funded status of defined benefit plans is remeasured.tt
Effective January 1, 2018, the Registrants adopted new accounting guidance that changes the income statement presentation of net periodic benefit cost and limits the capitalization to the service cost component of net periodic benefit cost. The non-service rrcosts or credits that would have been capitalized under previous guidance are still able to be recovered through future base ratesand are therefore now recognized as a regulatory asset or liability and amortized over the weighted average useful life of the asset base on which those non-service costs would have been capitalized. As of December 31, 2018, the regulatory liability balances were $11 million for PPL, $5 million for PPL Electric and $6 million for LKE and KU. As of December 31, 2018, the regulatory asset balances were $1 million for PPL, LKE and LG&E.
(PPL, LKE, LG&E and KU)
As a result of the 2014 Kentucky rate case settlement that became effective July 1, 2015, the difference between pension cost calculated in accordance with LG&E's and KU's pension accounting policy and pension cost calculated using a 15-year amortization period for actuarial gains and losses is recorded as a regulatory asset. As of December 31, 2018, the balances were $45 million for PPL and LKE, $25 million for LG&E and $20 million for KU. As of December 31, 2017, the balances were $33 million for PPL and LKE, $18 million for LG&E and $15 million for KU.
(All Registrants)
Storm Costs
PPL Electric, LG&E and KU have the ability to request from the PUC, KPSC and VSCC, as applicable, the authority to treat expenses related to specific extraordinary storms as a regulatory asset and defer such costs for regulatory accounting and reporting purposes. Once such authority is granted, LG&E and KU can request recovery of those expenses in a base rate case and begin amortizing the costs when recovery starts. PPL Electric can recover qualifying expenses caused by major storm events, as defined in its retail tariff, over three years through the Storm Damage Expense Rider commencing in the applicationyear after the storm occurred. PPL Electric's regulatory assets for storm costs are being amortized through various dates endingin 2021. The amortization period of LG&E's and KU's regulatory assets for storm costs are subject to the results of the currentKentucky rate case discussed below in "Regulatory Matters - Kentucky Activities - Rate Case Proceedings."
Unamortized Loss on Debt
Unamortized loss on reacquired debt represents losses on long-term debt reacquired or redeemed that have been deferred and rwill be amortized and recovered over either the original life of the extinguished debt or the life of the replacement debt (in the case of refinancing). Such costs are being amortized through 2029 for PPL Electric, through 2042 for KU, and through 2044 for LKE and LG&E.
Accumulated Cost of Removal of Utility Plant y
LG&E and KU charge costs of removal through depreciation expense with an offsetting credit to a regulatory liability. Theregulatory liability is relieved as costs are incurred.d
PPL Electric does not accrue for costs of removal. When costs of removal are incurred, PPL Electric records the costs as a regulatory asset. Such deferral is included in rates and amortized over the subsequent five-year period.
TCJA Customer Refund
As a result of the reduced U.S. federal corporate income tax rate as enacted by the TCJA, the regulators of PPL Electric, LG&Eand KU have ruled that these tax benefits should be refunded to customers. In some instances, timing differences occur
118
between the recognition of these tax benefits and the refund of the benefit to the customers which create a regulatory asset orliability.
LG&E and KU are currently distributing these amounts through the TCJA bill credit until tax-related savings will be reflected in base rates.
PPL Electric's current liability relates to the period of July 1, 2018 through December 31, 2018 and will be credited back to distribution customers through a negative surcharge which became effective July 1, 2018. Additionally, PPL Electric'snoncurrent liability balance relates to the period of January 1, 2018 through June 30, 2018 which is not yet reflected indistribution customer rates. PPL Electric must propose to the PUC the method by which it would like to return the amount of this liability to customers at the earlier of May 2021 or PPL Electric's next rate case.
Net Deferred Taxes
Regulatory liabilities associated with net deferred taxes represent the future revenue impact from the adjustment of deferred income taxes required primarily for excess deferred taxes and unamortized investment tax credits, largely a result of the TCJA enacted in 2017. See Note 6 for additional information on the TCJA.
(PPL and PPL Electric)
Generation Supply Charge (GSC) pp y g ( )
The GSC is a cost recovery mechanism that permits PPL Electric to recover costs incurred to provide generation supply to PLR customers who receive basic generation supply service. The recovery includes charges for generation supply, as well asadministration of the acquisition process. In addition, the GSC contains a reconciliation mechanism whereby any over- or under-recovery from prior quarters is refunded to, or recovered from, customers through the adjustment factor determined for the subsequent rate filing period.
Transmission Service Charge (TSC)g ( )
PPL Electric is charged by PJM for transmission service-related costs applicable to its PLR customers. PPL Electric passes these costs on to customers, who receive basic generation supply service through the PUC-approved TSC cost recovery mechanism. The TSC contains a reconciliation mechanism whereby any over- or under-recovery from customers is either refunded to, or recovered from, customers through the adjustment factor determined for the subsequent year.
Transmission Formula Rate
PPL Electric's transmission revenues are billed in accordance with a FERC-approved Open Access Transmission Tariff that utilizes a formula-based rate recovery mechanism. Under this formula, rates are put into effect in June of each year based uponprior year actual expenditures and current year forecasted capital additions. Rates are then adjusted the following year to reflect ffactual annual expenses and capital additions, as reported in PPL Electric's annual FERC Form 1, filed under the FERC's Uniform System of Accounts. Any difference between the revenue requirement in effect for the prior year and actualexpenditures incurred for that year is recorded as a regulatory asset or regulatory liability.
Storm Damage Expense Rider (SDER) g p ( )
The SDER is a reconcilable automatic adjustment clause under which PPL Electric annuallytt will compare actual storm costs tostorm costs allowed in base rates and refund or recover any differences from customers. In the 2015 rate case settlement approved by the PUC in November 2015, it was determined that reportable storm damage expenses to be recovered annuallythrough base rates will be set at $20 million. The SDER will recover from or refund to customers, as appropriate, only dapplicable expenses from reportable storms that are greater than or less than $20 million recovered annually through base rates. Storm costs incurred in PPL Electric's territory from a March 2018 storm will be amortized from 2019 through 2021.
Taxes Recoverable through Future Rates g
Taxes recoverable through future rates represent the portion of future income taxes that will be recovered through future ratesbased upon established regulatory practices. Accordingly, this regulatory asset is recognized when the offsetting deferred taxliability is recognized. For general-purpose financial reporting, this regulatory asset and the deferred tax liability are not offset;

119
rather, each is displayed separately. This regulatory asset is expected to be recovered over the period that the underlying book-tax timing differences reverse and the actual cash taxes are incurred.
Act 129 Compliance Rider p
In compliance with Pennsylvania's Act 129 of 2008 and implementing regulations, PPL Electric is currently in Phase III of the energy efficiency and conservation plan which was approved in June 2016. Phase III allows PPL Electric to recover the maximum $313 million over the five year period, June 1, 2016 through May 31, 2021. The plan includes programs intended to reduce electricity consumption. The recoverable costs include direct ana d indirect charges, including design and development costs, general and administrative costs and applicable state evaluator costs. The rates are applied to customers who receive distribution service through the Act 129 Compliance Rider. The actual Phase III program costs are reconcilable after each 12 month period, and any over- or under-recovery from customers will be refunded or recovered over the next rate filing period.
Smart Meter Rider (SMR) ( )
Act 129 requires each electric distribution company (EDC) with more than 100,000 customers to have a PUC approved Smart Meter Technology Procurement and Installation Plan (SMP). Under its SMP, PPL Electric will replace its current meters withnew meters that meet the Act 129 requirements by the end of 2019. Under Act 129, EDCs are able to recover the costs and earn a return on capital of providing smart metering technology. PPL Electric uses a mechanism known as the Smart Meter Rider (SMR) to recover the costs to implement its SMP on a full and current basis. The SMR is a reconciliation mechanism whereby any over-or under-recovery from prior years is refunded to, or recovered from, customers through the adjustment factor determined for the subsequent quarters.
Universal Service Rider (USR) ( )
The USR provides for recovery of costs associated with universal service programs, OnTrack and Winter Relief AssistanceProgram (WRAP), provided by PPL Electric to residential customers. OnTrack is a special payment program for low-incomehouseholds and WRAP provides low-income customers a means to reduce electric bills through energy saving methods. The USR rate is applied to residential customers who receive distribution service. The actual program costs are reconcilable, and any over- or under-recovery from customers will be refunded or recovered annually in the subsequent year.
(PPL, LKE, LG&E and KU)
Environmental Cost Recovery y
Kentucky law permits LG&E and KU to recover the costs, including a return of operating expenses and a return of and on capital invested, of complying with the Clean Air Act and those federal, state or local environmental requirements, which applyto coal combustion wastes and by-products from coal-fired electricity generating facilities. The KPSC requires reviews of the past operations of the environmental surcharge for six-month and two-year billing periods to evaluate the related charges,credits and rates of return, as well as to provide for the roll-in of ECR amounts to base rates each two-year period. The KPSC has authorized a return on equity of 9.7% for all existing approved ECR plans and projects. The ECR regulatory asset or liability represents the amount that has been under- or over-recovered due to timing or adjustments to the mechanism and is typically recovered within 12 months.
Fuel Adjustment Clausesj
LG&E's and KU's retail electric rates contain a fuel adjustment clause, whereby variances in the cost of fuel to generateelectricity, including transportation costs, from the costs embedded in base rates are adjusted in LG&E's and KU's rates. The dKPSC requires public hearings at six-month intervals to examine past fuel adjustments and at two-year intervals to review past operations of the fuel adjustment clause and, to the extent appropriate, reestablish the fuel charge included in base rates. Theregulatory assets or liabilities represent the amounts that have been under- or over-recovered due to timing or adjustments to the mechanism and are typically recovered within 12 months. LG&E's fuel adjustment clause asset is included within other current regulatory assets above.
KU also employs a levelized fuel factor mechanism for Virginia customers using an average fuel cost factor based primarily on projected fuel costs. The Virginia levelized fuel factor allows fuel recovery based on projected fuel costs for the coming yearplus an adjustment for any under- or over-recovery of fuel expenses from the prior year. The regulatory assets or liabilities

120
represent the amounts that have been under- or over-recovered due to timing or adjustments to the mechanism and are typically recovered within 12 months.
AROs
As discussed in Note 1, for LKE, LG&E and KU, all ARO accretion and depreciation expenses are reclassified as a regulatoryasset. ARO regulatory assets associated with certain CCR projects are amortized to expense in accordance with regulatory approvals. For other AROs, at the time of retirement, the related ARO regulatory asset is offset against the associated cost ofremoval regulatory liability, PP&E and ARO liability.
Power Purchase Agreement - OVEC g
As a result of purchase accounting associated with PPL's acquisition of LKE, the fair values of the OVEC power purchase agreement were recorded on the balance sheets of LKE, LG&E and KU with offsets to regulatory liabilities. The regulatoryliabilities are being amortized using the units-of-production method until March 2026, the expiration date of the agreement at the date of the acquisition. See Notes 1, 13 and 18 for additional discussion of the power purchase agreement.
Interest Rate Swaps p
LG&E's unrealized gains and losses are recorded as regulatory assets or regulatory liabilities until they are realized as interest expense. Interest expense from existing swaps is realized and recovered over the terms of the associated debt, which maturesthrough 2033.
Terminated Interest Rate Swaps p
Net realized gains and losses on all interest rate swaps are probable of recovery through regulated rates. As such, any gains and losses on these derivatives are included in regulatory assets or liabilities and are primarily recognized in "Interest Expense" onthe Statements of Income over the life of the associated debt.
Plant Outage Costsg
The Stipulation to the 2016 Kentucky rate case that became effective July 1, 2017 provided for the normalization of expensesassociated with plant outages using an eight-year average. The eight-year average is comprised of four historical years' and four forecasted years' expenses. Plant outage expenses that are greater or less than the eight-year average will be collected from or returned to customers, through future base rates. Prior year plant outage liabilities are included within other current regulatory liabilities above.
(PPL, LKE and LG&E)
Gas Line Tracker
The GLT authorizes LG&E to recover its incremental operating expenses, depreciation, property taxes and cost of capital,including a return on equity, for capital associated with the five year gas service riser, leak mitigation and customer service lineownership programs. As part of this program, LG&E makes necessary repairs to the gas distribution system and assumes ownership of service lines when replaced. In the 2016 rate case, the KPSC approved additional projects for recovery through the GLT mechanism related to further gas line replacements and transmission pipeline modernizations. Effective July 1, 2017,LG&E is authorized to earn a 9.7% return on equity for the GLT mechanism. As part of the 2016 rate case, LG&E nowannually files a combined application which includes revised rates based on projected costs and a balancing adjustment calculation with rates effective on the first billing cycle in May. After the completion of a plan year, the balancing adjustment, as part of the combined application filing to the KPSC, amends rates charged for the differences between the actual costs and actual GLT charges for the preceding year. The regulatory assets or liabilities represent the amounts that have been under- or over-recovered due to these cost differences.
Gas Supply Clause pp y
LG&E's natural gas rates contain a gas supply clause, whereby the expected cost of natural gas supply and variances betweenactual and expected costs from prior periods are adjusted quarterly in LG&E's rates, subject to approval by the KPSC. The gas supply clause also includes a separate natural gas procurement incentive mechanism, which allows LG&E's rates to be adjusted

121
annually to share savings between the actual cost of gas purchases and market indices, with the shareholders and the customers during each performance-based rate year (12 months ending October 31). The regulatory assets or liabilities represent the totalramounts that have been under- or over-recovered due to timing or adjustments to the mechanismsr and are typically recovered within 18 months.
(PPL, LKE and KU)
Generation Formula Rate
KU provides wholesale requirements service to its municipal customers and bills for this service pursuant to a FERC approved generation formula rate. Under this formula, rates are put into effect each July utilizing a return on rate base calculation and actual expenses from the preceding year. The regulatory asset or liability represents the difference between the revenueffrequirement in effect for the current year and actual expenditures incurred for the current year.
Regulatory Matters
(PPL, LKE, LG&E and KU)
Kentucky Activitiesy
Rate Case Proceedings
On September 28, 2018, LG&E and KU filed requests with the KPSC for an increase in annual base electricity rates of approximately $112 million at KU and increases in annual base electricity and gas rates of approximately $35 million and $25million at LG&E. The proposed base rate increases would result in an electricity rate increase of 6.9% at KU and electricity andgas rate increases of 3% and 7.5% at LG&E. As discussed in the "TCJA Impact on LG&E and KU Rates" section below, LG&E's and KU's applications seek to include applicable changes associated with the TCJA in the calculation of the proposed base rates and to terminate the TCJA bill credit mechanism when the new base rates go into effect.
New rates are expected to become effective on May 1, 2019. The applications are based on a forecasted test year of May 1, 2019 through April 30, 2020 with a requested return-on-equity of 10.42%. A number of parties have been granted intervention requests in the proceeding. Data discovery and the filing of written testimony will continue through February 2019 and a hearing is scheduled in March 2019. LG&E and KU cannot predict the outcome of these proceedings.
CPCN Filing
On January 10, 2018, LG&E and KU filed an application for a CPCN with the KPSC requesting approval for implementing Advanced Metering Systems across their Kentucky service territories, including gas operations for LG&E. The application projected completion in 2021 with estimated capital costs of $166 million and $155 million for LG&E and KU. On August 30, 2018, the KPSC issued an Order denying the CPCN for full deployment of the Advanced Metering Systems. The KPSCacknowledged the benefits of Advanced Metering Systems, expanded LG&E's and KU's Advanced Metering System pilot programs and encouraged LG&E and KU to consider other items to enhance the customer experience. This decision is not expected to have a significant impact on LG&E's and KU's results of operations.
TCJA Impact on LG&E and KU Rates
On December 21, 2017, Kentucky Industrial Utility Customers, Inc. submitted a complaint with the KPSC against LG&E and KU, as well as other utility companies in Kentucky, alleging that their respective rates would no longer be fair, just and reasonable following the enactment of the TCJA, which reduced the federal corporate tax rate from 35% to 21%. The complaint requested the KPSC to issue an order requiring LG&E and KU to begin deferring, as of January 1, 2018, the revenuerequirement effect of all income tax expense savings resulting from the federal corporate income tax reduction, including theamortization of excess deferred income taxes by recording those savings in a regulatory liability account and establishing a process by which the federal corporate income tax savings will be passed back to customers.
On January 29, 2018, LG&E, KU, Kentucky Industrial Utility Customers, Inc. and the Office of the Attorney General reached a ffsettlement agreement to commence returning savings related to the TCJA to their customers through their ECR, DSM and LG&E's GLT rate mechanisms beginning in March 2018 and through a new bill credhh it mechanism from April 1, 2018 throughApril 30, 2019 and thereafter until tax-reform related savings are reflected in changes in base rates. The estimated impact of the

122
rate reduction represents approximately $91 million in KU electricity revenues ($70 million through the new bill credit and $21million through existing rate mechanisms), $69 million in LG&E electricity revenues ($49 million through the new bill credit and $20 million through existing rate mechanisms) and $17 million in LG&E gas revenues (substantially all through the newbill credit) for the period January 2018 through April 2019.
On March 20, 2018, the KPSC issued an Order approving, with certain modifications, the settlement agreement reachedbetween LG&E, KU, Kentucky Industrial Utility Customers, Inc. and the Office of the Attorney General. The KPSC estimatesthat, pursuant to its modifications, electricity revenues would incorporate reductions of approximately $108 million for KU ($87 million through the new bill credit and $21 million through existing rate mechanisms) and $79 million for LG&E ($59 million through the new bill credit and $20 million through existing rate mechanisms). This represents $27 million ($17 millionat KU and $10 million at LG&E) in additional reductions from the amounts proposed by the settlement. The KPSC'smodifications to the settlement include certain changes in assumptions or inputs used in assessing tax reform or calculatingLG&E's and KU's electricity rates. LG&E gas rate reductions were not modified significantly from the amount included in thesettlement agreement.
On September 28, 2018, the KPSC issued an Order on reconsideration, pursuant to LG&E's and KU's petition, implementing trates reflecting electricity revenue reductions of $101 million for KU ($80 million through the new bill credit and $21 millionthrough existing rate mechanisms), $74 million for LG&E electricity revenues ($54 million through the new bill credit and $20million through existing rate mechanisms) and $16 million LG&E gas revenues (substantially all through the new bill credit)for the period January 2018 through April 2019. This represents lower revenue reduction amounts than the March 20, 2018Order of approximately $13 million ($7 million at KU and $6 million at LG&E).
In January 2018, the VSCC ordered KU, as well as other utilities in Virginia, to accrue regulatory liabilities reflecting the Virginia jurisdictional revenue requirement impacts of the reduced federal corporate tax rate. In March 2018, KU reached asettlement agreement regarding its rate case in Virginia. New rates, inclusive of TCJA impacts, were effective June 1, 2018.The settlement also stipulates that actual tax savings for the five month period prior to new rates taking effect would beaddressed through KU's annual information filing for calendar year 2018. In May 2018, the VSCC approved the settlement agreement. The TCJA and rate case are not expected to have a significant impact on KU's financial condition or results of aaoperations related to Virginia.
On November 15, 2018, the FERC issued a Policy Statement which stated that the appropriate ratemaking treatment for changes in accumulated deferred income taxes as a result of the TCJA will be addressed in a Notice of Proposed Rulemaking. Also on November 15, 2018, the FERC issued the Notice of Proposed Rulemaking which proposes that public utilitytransmission providers include mechanisms in their formula rates to deduct excess accumulated deferred income taxes from, or add deficient accumulated deferred income taxes to, rate base and adjust their income tax allowances by amortized excess or deficient accumulated deferred income taxes. The Notice of Proposed Rulemaking did not prescribe the mechanism companiesshould use to adjust their formula rates. LG&E and KU are currently assessing the Notice of Proposed Rulemf aking and arecontinuing to monitor guidance issued by the FERC. On February 5, 2019, in connection with a separate element of federal and Kentucky state tax reform effects, LG&E and KU filed a request with the FERC to amend their transmission formula rates, effective June 1, 2019, to incorporate reductions to corporate income tax rates as a result of the TCJA and HB 487. LG&E and KU do not anticipate the impact of the TCJA related to their FERC-jurim sdictional rates to be significant.
(LKE and LG&E)
Gas Franchise
LG&E’s gas franchise agreement for the Louisville/Jefferson County service area expired in March 2016. In August 2016, LG&E and Louisville/Jefferson County entered into a revised 5-year franchise agreement (with renewal options). The franchise fee may be modified at Louisville/Jefferson County's election upon 60 days' notice. However, any franchise fee is capped at 3% of gross receipts for natural gas service within the franchise area. The agreement further provides that if the KPSC determinesthat the franchise fee should be recovered from LG&E's Louisville/Jefferson county customers in the franchise areas as aseparate line item on their bill, the franchise fee will revert to zero. In August 2016, LG&E filed an application requesting tff he tKPSC to review and rule upon the recoverability of the franchise fee.
On March 14, 2018, the KPSC issued an Order authorizing the franchise fee to be recovered only from LG&E's Louisville/Jefferson County customers in the franchise area. As a result, the franchise fee will continue to be zero in accordanceaawith the terms of the August 2016, 5-year gas franchise agreement.

123
(PPL and PPL Electric)
Pennsylvania Activitiesy
TCJA Impact on PPL Electric Rates
On February 12, 2018, the PUC issued a Secretarial Letter requesting certain information from regulated utilities and invitingcomment from interested parties on potential revision to customer rates as a result of enactment of the TCJA. PPL Electric submitted its response to the Secretarial Letter on March 9, 2018. On March 15, 2018, the PUC issued a Temporary RatesOrder to allow time to determine the manner in which rates could be adjusted in response to the TCJA. The PUC issued another Temporary Rates Order on May 17, 2018 to address the impact of the TCJA and indicated that utilities without a currently pending general rate proceeding would receive a utility specific order. The PUC issued an Order specific to PPL Electric onMay 17, 2018 that required PPL Electric to file a tariff or tariff supplement by June 15, 2018 to establish (a) temporary rates tobe effective July 1, 2018, and (b) to record a deferred regulatory liability to reflect the tax savings associated with the TCJA for JJthe period January 1 through June 30, 2018. On June 8, 2018, PPL Electric submitted a petition to the PUC to charge a negativesurcharge of 7.05% to reflect the estimated 2018 tax savings associated with the TCJA. The PUC approved PPL Electric'spetition on June 14, 2018 and PPL Electric filed a tariff on June 15, 2018 reflecting the increased negative surcharge. PPL Electric recorded a $41 million noncurrent regulatory liability and a corresponding reduction of revenue to be distributed to customers pursuant to a future rate adjustment related to the period January 1, 2018 through June 30, 2018.
On March 15, 2018, the FERC issued a Notice of Inquiry seeking information on whether and how it should address changes toFERC-jurisdictional rates relating to accumulated deferred income taxes and bonus depreciation resulting from passage of theTCJA. On March 16, 2018, PPL Electric filed a waiver request, pursuant to Rule 207(a)(5) of the Rules of Practice and Procedure of the FERC, to accelerate incorporation of the changes to the federal corporate income tax rate in its transmissionformula rate commencing on June 1, 2018 rather than allowing the TCJA tax rate reduction to be initially incorporated in PPL Electric's June 1, 2019 transmission formula rate. The waiver was approved on April 23, 2018 and PPL Electric submitted itstransmission formula rate, reflecting the TCJA rate reduction, on April 27, 2018. In addition, on May 21, 2018, PPL Electric, as part of a PJM Transmission Owners joint filing, submitted comments in response to the FERC's March 15, 2018 Notice of Inquiry. The filing requested guidance on how the reduction in accumulated deferred income taxes, resulting from the TCJA reduced federal corporate income tax rate, should be treated for ratemaking purposes. On November 15, 2018, the FERC issued a Policy Statement which stated that the appropriate ratemaking treatment for changes in accumulated deferred income taxes asa result of the TCJA will be addressed in a Notice of Proposed Rulemaking. Also on November 15, 2018, the FERC issued theNotice of Proposed Rulemaking which proposes that public utility transmission providers should include mechanisms in their formula rates to deduct excess accumulated deferred income taxes from, or add deficient accumulated deferred income taxes to,rate base and adjust their income tax allowances by amortized excess or deficient accumulated deferred income taxes. The Notice of Proposed Rulemaking did not prescribe the mechanism companies should use to adjust their formula rates. PPL Electric is currently assessing the Notice of Proposed Rulemaking and is continuing to monitor guidance issued by the FERC. The changes, related to accumulated deferred income taxes impacting the transmission formula rate revenues, have not beensignificant since the new rate went into effect on June 1, 2018.t
Federal Matters
(PPL and PPL Electric)
FERC Formula Rate
In April 2018, PPL Electric filed its annual transmission formula rate update with the FERC, reflecting a revised revenuerequirement, which includes the impact of the TCJA. The filing establishes the revenue requirement used to set rates that took effect in June 2018. The time period for any challenges to PPL Electric's annual update has expired. No formal challenges were submitted.

124
(PPL, LKE, LG&E and KU)
FERC Transmission Rate Filing
On August 3, 2018, LG&E and KU submitted an application to the FERC requesting elimination of certain on-going credits to a sub-set of transmission customers relating to the 1998 merger of LG&E's and KU's parent entities and the 2006 withdrawal of LG&E and KU from the Midcontinent Independent System Operator, Inc. (MISO), a regional transmission operator and energy market. The application seeks termination of LG&E's and KU's commitment to provide mitigation for certain horizontal market power concerns arising out of the 1998 merger for certain transmission service between MISO and LG&E and KU. The affected transmission customers are a limited number of municipal entities in Kentucky. The amounts at issue are generally waivers or credits for either LG&E and KU or for MISO transmission charges depending upon the direction of transmissionservice incurred by the municipalities. LG&E and KU estimate that such charges may average approximately $22 millionannually, depending upon actual transmission customer and market volumes, structures and prices, with such charges allocated according to LG&E's and KU's respective transmission system ownership ratio. Due to the development of robust accessible energy markets over time, LG&E and KU believe the mitigation commitments are no longer relevant or appropriate. LG&Eand KU currently receive recovery of such expenses in other rate mechanisms. LG&E and KU cannot predict the outcome of the proceeding, including any effects on their financial condition or results of operations.
Transmission Customer Complaint
On September 21, 2018, a transmission customer filed a complaint with the FERC against LG&E and KU alleging LG&E and KU have violated and continue to violate their obligations under an existing rate schedule to credit this customer for certaintransmission charges from MISO. On October 11, 2018, LG&E and KU filed an answer to the complaint arguing such MISO transmission transactions are not covered by the rate schedulet , and the amounts in question are not eligible for credits. LG&E and KU cannot predict the outcome of the proceeding, but believe that any potential required credits, including amountscurrently reserved, would be subject to rate recovery.
Other
Purchase of Receivables Program g
(PPL and PPL Electric)
In accordance with a PUC-approved purchase of accounts receivable program, PPL Electric purchases certain accountsreceivable from alternative electricity suppliers at a discount, which reflects a provision for uncollectible accounts. Thealternative electricity suppliers have no continuing involvement or interest in the purchased accounts receivable. Accounts treceivable that are acquired are initially recorded at fair value on the date of acquisition. During 2018, 2017 and 2016, PPL Electric purchased $1.3 billion, $1.3 billion and $1.4 billion of accounts receivable from alternative suppliers.
8. Financing Activities
Credit Arrangements and Short-term Debt
(All Registrants)
The Registrants maintain credit facilities to enhance liquidity, provide credit support and provide a bau ckstop to commercial paper programs. For reporting purposes, on a consolidated basis, the credit facilities and commercial paper programs of PPL Electric, LKE, LG&E and KU also apply to PPL and the credit facilities and commercial paper programs of LG&E and KU also apply to LKE. The amounts borrowed below are recorded as "Short-term ded bt" on the Balance Sheets except for borrowings under LG&E's Term Loan Facility which are recorded as "Long-term debt due within one year" on the December 31, 2018 Balance Sheet and "Long-term debt" on the December 31, 2017 Balance Sheet. The following credit facilities were in place at:

125
December 31, 2018 December 31, 2017
ExpirationDate Capacity Borrowed
Letters of Credit
and Commercial
Paper Issued
Unused Capacity Borrowed
Letters of Credit
and Commercial
PaperIssued
PPL U.K.
WPD plc Syndicated Credit Facility (a) (c) Jan. 2023 £ 210 £ 157 £ — £ 54 £ 148 £ —
WPD (South West) Syndicated Credit Facility (a) (c) July 2021 245 — — 245 — —
WPD (East Midlands) Syndicated Credit Facility (a) (c) July 2021 300 38 — 262 180 —
WPD (West Midlands) Syndicated Credit Facility (a) (c) July 2021 300 — — 300 120 —
Uncommitted Credit Facilities 130 — 4 126 — 4Total U.K. Credit Facilities (b) £ 1,185 £ 195 £ 4 £ 987 £ 448 £ 4
U.S. PPL Capital Funding
Syndicated Credit Facility (c) (d) Jan. 2023 $ 950 $ — $ 669 $ 281 $ — $ 230Bilateral Credit Facility (c) (d) Mar. 2019 100 — 15 85 — 18
Total PPL Capital Funding Credit Facilities $ 1,050 $ — $ 684 $ 366 $ — $ 248
PPL Electric Syndicated Credit Facility (c) (d) Jan. 2023 $ 650 $ — $ 1 $ 649 $ — $ 1
LG&ESyndicated Credit Facility (c) (d) Jan. 2023 $ 500 $ — $ 279 $ 221 $ — $ 199Term Loan Credit Facility (c) (e) Oct. 2019 200 200 — — 100 —
Total LG&E Credit Facilities $ 700 $ 200 $ 279 $ 221 $ 100 $ 199
KU Syndicated Credit Facility (c) (d) Jan. 2023 $ 400 $ — $ 235 $ 165 $ — $ 45Letter of Credit Facility (c) (d) (f) Oct. 2020 198 — 198 — — 198
Total KU Credit Facilities $ 598 $ — $ 433 $ 165 $ — $ 243
(a) The facilities contain financial covenants to maintain an interest coverage ratio of not less than 3.0 times consolidated earnings before income taxes, depreciation and amortization and total net debt not in excess of 85% of its RAV, calculated in accordance with the credit facility.
(b) The WPD plc amounts borrowed at December 31, 2018 and 2017 included USD-denominated borrowings of $200 million for both periods, which boreinterest at 3.17% and 2.17%. The unused capacity reflects the amount borrowed in GBP of £156 million as of the date borrowed. The WPD (East Midlands) amount borrowed at December 31, 2018 and December 31, 2017 was a GBP-denominated borrowing, which equated to $48 million and $244 million and bore interest at 1.12%. and 0.89%. The WPD (West Midlands) amount borrowed at December 31, 2017 was a GBP-denominated borrowing,which equated to $162 million and bore interest at 0.89%. At December 31, 2018, the unused capacity under the U.K. credit facilities was approximately$1.3 billion.
(c) Each company pays customary fees under its respective facility and borrowings generally bear interest at LIBOR-based rates plus an applicable margin.(d) The facilities contain a financial covenant requiring debt to total capitalization not to exceed 70% for PPL Capital Funding, PPL Electric, LKE, LG&E
and KU, as calculated in accordance with the facilities and other customary covenants. Additionally, as it relates to the syndicated and bilateral credit facilities and subject to certain conditions, PPL Capital Funding may request that the capacity of its facility expiring in March 2019 be increased by up to $30 million, LG&E and KU each may request up to a $100 million increase in its facility's capacity.
(e) LG&E entered into a term loan credit agreement in October 2017 whereby it may borrow up to $200 million. The outstanding borrowings at December 31, 2018 and December 31, 2017 bore interest at an average rate of 2.97% and 2.06%.
(f) KU's letter of credit facility agreement allows for certain payments under the letter of credit facility to be converted to loans rather than requiringimmediate payment.
PPL, PPL Electric, LG&E and KU maintain commercial paper programs to provide an additional financing source to fund short-term liquidity needs, as necessary. Commercial paper issuances, included in "Short-term debt" on the Balance Sheets, are supported by the respective Registrant's credit facilities. The following commercial paper programs were in place at:

126
December 31, 2018 December 31, 2017Weighted -
Average Interest Rate Capacity
CommercialPaper
IssuancesUnused
Capacity
Weighted - Average
Interest Rate
CommercialPaper
IssuancesPPL Capital Funding 2.82% $ 1,000 $ 669 $ 331 1.64% $ 230PPL Electric 650 — 650 —LG&E 2.94% 350 279 71 1.83% 199KU 2.94% 350 235 115 1.97% 45
Total $ 2,350 $ 1,183 $ 1,167 $ 474
(PPL Electric, LKE, LG&E and KU)
See Note 14 for discussion of intercompany borrowings.
Long-term Debt (All Registrants)
December 31,Weighted-Average
Rate (g) Maturities (g) 2018 2017 PPL U.S.
Senior Unsecured Notes 3.88% 2020 - 2047 $ 4,325 $ 4,575Senior Secured Notes/First Mortgage Bonds (a) (b) (c) 3.99% 2019 - 2048 7,705 7,314Junior Subordinated Notes 5.68% 2067 - 2073 930 930Term Loan Credit Facility 2.97% 2019 200 100
Total U.S. Long-term Debt 13,160 12,919
U.K.
Senior Unsecured Notes (d) 5.13% 2020 - 2040 6,471 6,351Index-linked Senior Unsecured Notes (e) 1.45% 2026 - 2056 1,063 1,012
Total U.K. Long-term Debt (f) 7,534 7,363Total Long-term Debt Before Adjustments 20,694 20,282
Fair market value adjustments 16 21Unamortized premium and (discount), net (e) 9 14Unamortized debt issuance costs (120) (122)
Total Long-term Debt 20,599 20,195Less current portion of Long-term Debt 530 348
Total Long-term Debt, noncurrent $ 20,069 $ 19,847
PPL Electric Senior Secured Notes/First Mortgage Bonds (a) (b) 4.22% 2020 - 2048 $ 3,739 $ 3,339
Total Long-term Debt Before Adjustments 3,739 3,339
Unamortized discount (18) (16)Unamortized debt issuance costs (27) (25)
Total Long-term Debt 3,694 3,298Less current portion of Long-term Debt — —
Total Long-term Debt, noncurrent $ 3,694 $ 3,298
LKE Senior Unsecured Notes 3.97% 2020 - 2021 $ 725 $ 725Term Loan Credit Facility 2.97% 2019 200 100First Mortgage Bonds (a) (c) 3.76% 2019 - 2045 3,966 3,975Long-term debt to affiliate 3.69% 2026 - 2028 650 400
Total Long-term Debt Before Adjustments 5,541 5,200

127
December 31, Weighted-Average
Rate (g) Maturities (g) 2018 2017
Unamortized discount (13) (14)Unamortized debt issuance costs (26) (27)
Total Long-term Debt 5,502 5,159Less current portion of Long-term Debt 530 98
Total Long-term Debt, noncurrent $ 4,972 $ 5,061
LG&E
Term Loan Credit Facility 2.97% 2019 $ 200 $ 100First Mortgage Bonds (a) (c) 3.58% 2019 - 2045 1,624 1,624
Total Long-term Debt Before Adjustments 1,824 1,724
Unamortized discount (4) (4)Unamortized debt issuance costs (11) (11)
Total Long-term Debt 1,809 1,709Less current portion of Long-term Debt 434 98
Total Long-term Debt, noncurrent $ 1,375 $ 1,611
KU First Mortgage Bonds (a) (c) 3.89% 2019 - 2045 $ 2,342 $ 2,351
Total Long-term Debt Before Adjustments 2,342 2,351
Unamortized discount (8) (9)Unamortized debt issuance costs (13) (14)
Total Long-term Debt 2,321 2,328Less current portion of Long-term Debt 96 —
Total Long-term Debt, noncurrent $ 2,225 $ 2,328
(a) Includes PPL Electric's senior secured and first mortgage bonds that are secured by the lien of PPL Electric's 2001 Mortgage Indenture, which coverssubstantially all electric distribution plant and certain transmission plant owned by PPL Electric. The carrying value of PPL Electric's property, plant and equipment was approximately $9.4 billion and $8.5 billion at December 31, 2018 and 2017.
Includes LG&E's first mortgage bonds that are secured by the lien of the LG&E 2010 Mortgage Indenture which creates a lien, subject to certainbexceptions and exclusions, on substantially all of LG&E's real and tangible personal property located in Kentucky and used or to be used in connectionwith the generation, transmission and distribution of electricity and the storage and distribution of natural gas. The aggregate carrying value of the property subject to the lien was $5.1 billion and $4.7 billion at December 31, 2018 and 2017.
Includes KU's first mortgage bonds that are secured by the lien of the KU 2010 Mortgage Indenture which creates a lien, subject to certain exceptions and exclusions, on substantially all of KU's real and tangible personal property located in Kentucky and used or to be used in connection with the generation,transmission and distribution of electricity. The aggregate carrying value of the property subject to the lien was $6.3 billion and $6.0 billion atDecember 31, 2018 and 2017.
(b) Includes PPL Electric's series of senior secured bonds that secure its obligations to make payments with respect to each series of Pollution Control Bondsthat were issued by the LCIDA and the PEDFA on behalf of PPL Electric. These senior secured bonds were issued in the same principal amount, containpayment and redemption provisions that correspond to and bear the same interest rate as such Pollution Control Bonds. These senior secured bonds wereissued under PPL Electric's 2001 Mortgage Indenture and are secured as noted in (a) above. This amount includes $224 million of which PPL Electric isfallowed to convert the interest rate mode on the bonds from time to time to a commercial paper rate, daily rate, weekly rate, or term rate of at least oneyear and $90 million that may be redeemed, in whole or in part, at par beginning in October 2020, and are subject to mandatory redemption upondetermination that the interest rate on the bonds would be included in the holders' gross income for federal tax purposes.
(c) Includes LG&E's and KU's series of first mortgage bonds that were issued to the respective trustees of tax-exempt revenue bonds to secure its respectiveobligations to make payments with respect to each series of bonds. The first mortgage bonds were issued in the same principal amounts, contain payment and redemption provisions that correspond to and bear the same interest rate as such tax-exempt revenue bonds. These first mortgage bonds were issued under the LG&E 2010 Mortgage Indenture and the KU 2010 Mortgage Indenture and are secured as noted in (a) above. The related tax-exempt revenue bonds were issued by various governmental entities, principally counties in Kentucky, on behalf of LG&E and KU. The related revenue bond documents allow LG&E and KU to convert the interest rate mode on the bonds from time to time to a commercial paper rate, daily rate, weekly rate, term rate of at least one year or, in some cases, an auction rate or a LIBOR index rate.
At December 31, 2018, the aggregate tax-exempt revenue bonds issued on behalf of LG&E and KU that were in a term rate mode totaled $505 million for LKE, comprised of $391 million and $114 million for LG&E and KU respectively. At December 31, 2018, the aggregate tax-exempt revenue bonds issued on behalf of LG&E and KU that were in a variable rate mode totaled $375 million for LKE, comprised of $147 million and $228 million for
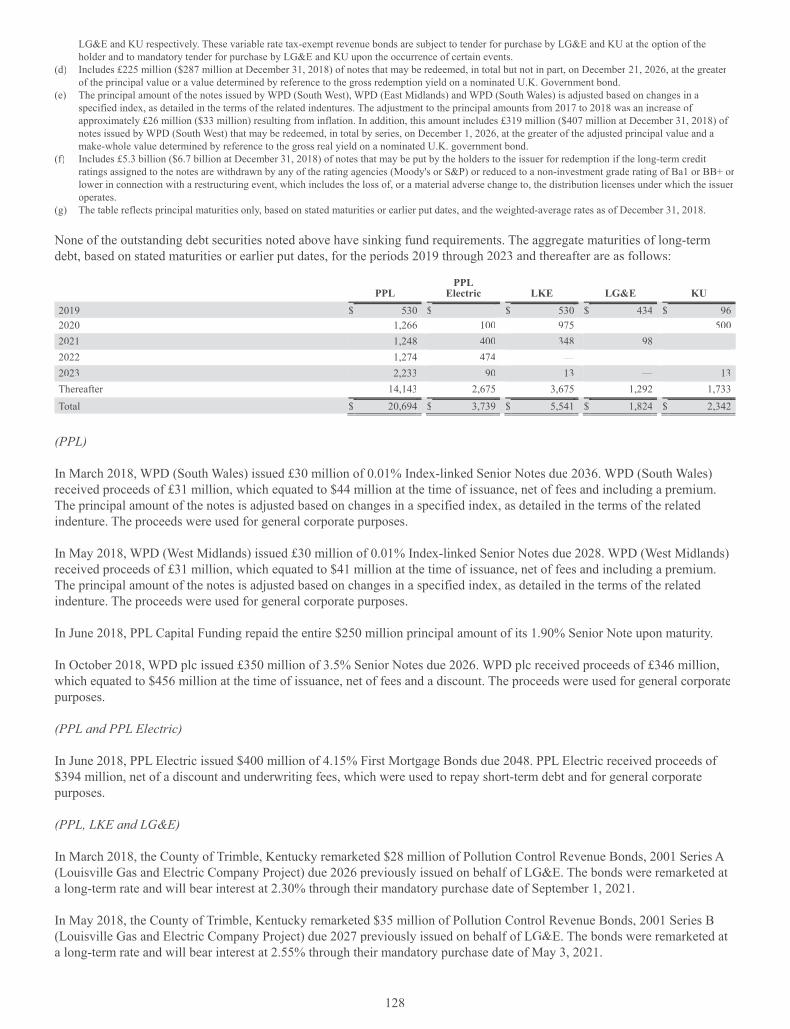
128
LG&E and KU respectively. These variable rate tax-exempt revenue bonds are subject to tender for purchase by LG&E and KU at the option of theholder and to mandatory tender for purchase by LG&E and KU upon the occurrence of certain events.
(d) Includes £225 million ($287 million at December 31, 2018) of notes that may be redeemed, in total but not in part, on December 21, 2026, at the greater of the principal value or a value determined by reference to the gross redemption yield on a nominated U.K. Government bond.
(e) The principal amount of the notes issued by WPD (South West), WPD (East Midlands) and WPD (South Wales) is adjusted based on changes in aspecified index, as detailed in the terms of the related indentures. The adjustment to the principal amounts from 2017 to 2018 was an increase of approximately £26 million ($33 million) resulting from inflation. In addition, this amount includes £319 million ($407 million at December 31, 2018) of notes issued by WPD (South West) that may be redeemed, in total by series, on December 1, 2026, at the greater of the adjusted principal value and a make-whole value determined by reference to the gross real yield on a nominated U.K. government bond.
(f) Includes £5.3 billion ($6.7 billion at December 31, 2018) of notes that may be put by the holders to the issuer for redemption if the long-term credit ratings assigned to the notes are withdrawn by any of the rating agencies (Moody's or S&P) or reduced to a non-investment grade rating of Ba1 or BB+ or lower in connection with a restructuring event, which includes the loss of, or a material adverse change to, the distribution licenses under which the issuer operates.
(g) The table reflects principal maturities only, based on stated maturities or earlier put dates, and the weighted-average rates as of December 31, 2018.
None of the outstanding debt securities noted above have sinking fund requirements. The aggregate maturities of long-term debt, based on stated maturities or earlier put dates, for the periods 2019 through 2023 and thereafter are as follows: ff
PPLPPL
Electric LKE LG&E KU 2019 $ 530 $ — $ 530 $ 434 $ 962020 1,266 100 975 — 5002021 1,248 400 348 98 —2022 1,274 474 — — —2023 2,233 90 13 — 13Thereafter 14,143 2,675 3,675 1,292 1,733Total $ 20,694 $ 3,739 $ 5,541 $ 1,824 $ 2,342
(PPL)
In March 2018, WPD (South Wales) issued £30 million of 0.01% Indd ex-linked Senior Notes due 2036. WPD (South Wales) received proceeds of £31 million, which equated to $44 million at the time of issuance, net of fees and including a premium. The principal amount of the notes is adjusted based on changes in a specified index, as detailed in the terms of the related indenture. The proceeds were used for general corporate purposes.
In May 2018, WPD (West Midlands) issued £30 million of 0.01% Index-linked Senior Notes due 2028. WPD (West Midlands)received proceeds of £31 million, which equated to $41 million at the time of issuance, net of fees and including a premium. The principal amount of the notes is adjusted based on changes in a specified index, as detailed in the terms of the related indenture. The proceeds were used for general corporate purposes.
In June 2018, PPL Capital Funding repaid the entire $250 million principal amount of its 1.90% Senior Note upon maturity.
In October 2018, WPD plc issued £350 million of 3.5% Senior Notes due 2026. WPD plc received proceeds of £346 million, which equated to $456 million at the time of issuance, net of fees and a discount. The proceeds were used for general corporatepurposes.
(PPL and PPL Electric)
In June 2018, PPL Electric issued $400 million of 4.15% First Mortgage Bonds due 2048. PPL Electric received proceeds of $394 million, net of a discount and underwriting fees, which were used to repay short-term debt and for general corporate purposes.
(PPL, LKE and LG&E)
In March 2018, the County of Trimble, Kentucky remarketed $28 million of Pollution Control Revenue Bonds, 2001 Series A (Louisville Gas and Electric Company Project) due 2026 previously issued on behalf of LG&E. The bonds were remarketed at fa long-term rate and will bear interest at 2.30% through their mandatory purchase date of September 1, 2021.
In May 2018, the County of Trimble, Kentucky remarketed $35 million of Pollution Control Revenue Bonds, 2001 Series B (Louisville Gas and Electric Company Project) due 2027 previously issued on behalf of LG&E. The bonds were remarketed at fa long-term rate and will bear interest at 2.55% through their mandatory purchase date of May 3, 2021.

129
In May 2018, the County of Jefferson, Kentucky remarketed $35 million of Pollution Control Revenue Bonds, 2001 Series B(Louisville Gas and Electric Company Project) due 2027 previously issued on behalf of LG&E. The bonds were remarketed at a long-term rate and will bear interest at 2.55% through their mandatory purchase date of May 3, 2021.
(LKE)
In May 2018, LKE borrowed $250 million from a PPL affiliate through the issuance of a 4% ten-year note due 2028. The proceeds were used to repay its outstanding notes payable to a PPL Energy Funding subsidiary. See Note 14 for additionalinformation related to intercompany borrowings.
Legal Separateness (All Registrants)
The subsidiaries of PPL are separate legal entities. PPL's subsidiaries are not liable for the debts of PPL. Accordingly, creditors of PPL may not satisfy their debts from the assets of PPL's subsidiaries absent a specific contractual undertaking by a subsidiary to pay PPL's creditors or as required by applicable law or regulation. Similarly, PPL is not liable for the debts of its fsubsidiaries, nor are its subsidiaries liable for the debts of one another. Accordingly, creditors of PPL's subsidiaries may not satisfy their debts from the assets of PPL or its other subsidiaries absent a specific contractual undertaking by PPL or its other ttsubsidiaries to pay the creditors or as required by applicable law or regulation.
Similarly, the subsidiaries of PPL Electric and LKE are each separate legal entities. These subsidiaries are not liable for thedebts of PPL Electric and LKE. Accordingly, creditors of PPL Electric and LKE may not satisfy their debts from the assets of their subsidiaries absent a specific contractual undertaking by a subsidiary to pay the creditors or as required by applicable law or regulation. Similarly, PPL Electric and LKE are not liable for the debts of their subsidiaries, nor are their subsidiaries liable for the debts of one another. Accordingly, creditors of these subsidiaries may not satisfy their debts from the assets of PPL uElectric and LKE (or their other subsidiaries) absent a specifict contractual undertaking by that parent or other subsidiary to pay such creditors or as required by applicable law or regulation.
(PPL)
Equity Securities
Equity Forward Contractsq y
In May 2018, PPL completed a registered underwritten public offering of 55 million shares of its common stock. In conjunctionwith that offering, the underwriters exercised an option to purchase 8.25 million additional shares of PPL common stock solelyto cover over-allotments.
In connection with the registered public offering, PPL entered into forward sale agreements with two counterparties coveringthe 63.25 million shares of PPL common stock. Full settlement of these forward sale agreements will occur no later than November 2019. Upon any physical settlements of any forward sale agreement, PPL will issue and deliver to the applicableLforward counterparty shares of its common stock in exchange for cash proceeds per share equal to the forward sale price. The forward sale price will be calculated based on an initial forward price of $26.7057 per share, reduced during the period the applicable forward contract is outstanding as specified in such forward sale agreement. PPL may, in certain circumstances, elect cash settlement or net share settlement for all or a portion of its rights or obligations under each forward sale agreement. The forward sale agreements are classified as equity transactions. PPL only receives proceeds and issues shares of common stock upon any settlements of the forward sale agreements. PPL intends to use net proceeds that it receives upon any settlement for general corporate purposes.
In September 2018, PPL settled a portion of the initial forward sale agreements by issuf ing 20 million shares of PPL commonstock, resulting in net cash proceeds of $520 million. For the unsettled portion of the agreements, the only impact to the financial statements will be the inclusion of incremental shares within the calculation of diluted EPS using the Treasury StockMethod. See Note 5 for information on the forward sale agreements impact on the calculation of diluted EPS. mm
ATM Programg
In February 2018, PPL entered into an equity distribution agreement, pursuant to which PPL may sell, from time to time, up toan aggregate of $1.0 billion of its common stock through an at-the-market offering program; including a forward salesffcomponent. The compensation paid to the selling agents by PPL may be up to 2% of the gross offering proceeds of the shares.

130
PPL issued 4.2 million shares of common stock and received gross proceeds of $119 million for the year ended December 31, 2018.
Distributions and Related Restrictions
In November 2018, PPL declared its quarterly common stock dividend, payable January 2, 2019, at 41.0 cents per share (equivalent to $1.64 per annum). On February 14, 2019, PPL announced that the r company is increasing its common stock dividend to 41.25 cents per share on a quarterly basis (equivalent to $1.65 per annum). Future dividends, declared at the discretion of the Board of Directors, will depend upon future earnings, cash flows, financial arr nd legal requirements and other factors.
Neither PPL Capital Funding nor PPL may declare or pay any cash dividend or distribution on its capital stock during anyperiod in which PPL Capital Funding defers interest payments on its 2007 Series A Junior Subordinated Notes due 2067 or 2013 Series B Junior Subordinated Notes due 2073. At December 31, 2018, no interest payments were deferred.
WPD subsidiaries have financing arrangements that limit their ability to pay dividends. However,y PPL does not, at this time,expect that any of such limitations would significantly impact PPL's ability to meet its cash obligations.
(All Registrants)
PPL relies on dividends or loans from its subsidiaries to fund PPL's dividends to its common shareholders. The net assets of certain PPL subsidiaries are subject to legal restrictions. LKE primarily relies on dividends from its subsidiaries to fund itsdistributions to PPL. LG&E, KU and PPL Electric are subject to Section 305(a) of the Federal Power Act, which makes it unlawful for a public utility to make or pay a dividend from any funds "properly included in capital account." The meaning of this limitation has never been clarified under the Federal Power Act. LG&E, KU and PPL Electric believe, however, that thisstatutory restriction, as applied to their circumstances, would not be construed or applied by the FERC to prohibit the paymentfrom retained earnings of dividends that are not excessive and are for lawful and legitimate business purposes. In February2012, LG&E and KU petitioned the FERC requesting authorization to pay dividends in the future baaa sed on retained earningsbalances calculated without giving effect to the impact of purchase accounting adjustments for the acquisition of LKE by PPL. In May 2012, the FERC approved the petitions with the further condition that each utility may not pay dividends if such tpayment would cause its adjusted equity ratio to fall below 30% of total capitalization. Accordingly, at December 31, 2018, netassets of $2.8 billion ($1.2 billion for LG&E and $1.6 billion for KU) were restricted for purposes of paying dividends to LKE,dand net assets of $3.3 billion ($1.5 billion for LG&E and $1.8 billion for KU) were available for payment of dividends to LKE. LG&E and KU believe they will not be required to change their current dividend practices as a result of the foregoingrequirement. In addition, under Virginia law, KU is prohibited from making loans to affiliates without the prior approval of the VSCC. There are no comparable statutes under Kentucky law applicable to LG&E and KU, or under Pennsylvania lawapplicable to PPL Electric. However, orders from the KPSC require LG&E and KU to obtain prior consent or approval beforelending amounts to PPL.
9. Leases
(PPL, LKE, LG&E and KU)
PPL and its subsidiaries have entered into various agreements for the lease of office space, vehicles, land, gas storage and other ttequipment.
Rent - Operating Leases p g
Rent expense for the years ended December 31 for operating leases was as follows:2018 2017 2016
PPL $ 45 $ 45 $ 50LKE 29 26 26LG&E 16 15 15KU 12 11 11
Total future minimum rental payments for all operating leases are estimated to be:
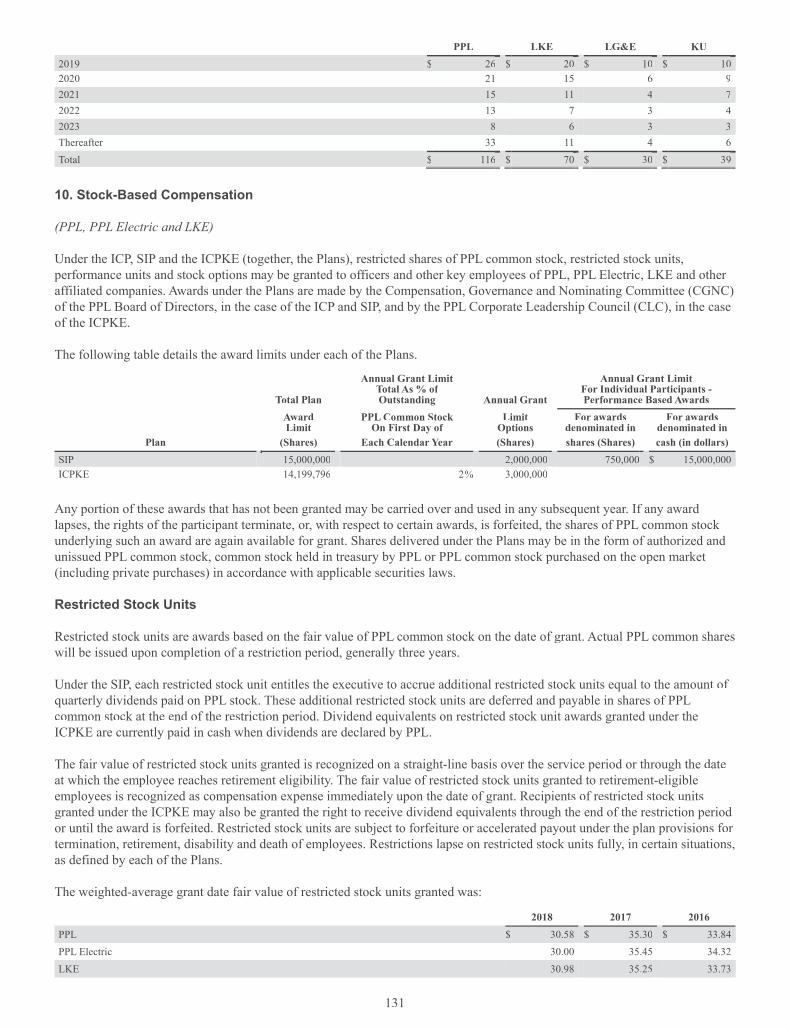
131
PPL LKE LG&E KU 2019 $ 26 $ 20 $ 10 $ 102020 21 15 6 92021 15 11 4 72022 13 7 3 42023 8 6 3 3Thereafter 33 11 4 6Total $ 116 $ 70 $ 30 $ 39
10. Stock-Based Compensation
(PPL, PPL Electric and LKE)
Under the ICP, SIP and the ICPKE (together, the Plans), restricted shares of PPL common stock, restricted stock units, performance units and stock options may be granted to officers and other key employees of PPL, PPL Electric, LKE and other affiliated companies. Awards under the Plans are made by the Compensation, Governance and Nominating Committee (CGNC) of the PPL Board of Directors, in the case of the ICP and SIP, and by the PPL Corporate Leadership Council (CLC), in the caseof the ICPKE.
The following table details the award limits under each of the Plans.
Total Plan
Annual Grant Limit Total As % of Outstanding Annual Grant
Annual Grant Limit For Individual Participants -Performance Based Awards
AwardLimit
PPL Common Stock On First Day of
Limit Options
For awardsdenominated in
For awardsdenominated in
Plan (Shares) Each Calendar Year (Shares) shares (Shares) cash (in dollars)SIP 15,000,000 2,000,000 750,000 $ 15,000,000ICPKE 14,199,796 2% 3,000,000
Any portion of these awards that has not been granted may be carried over and used in any subsequent year. If any award dlapses, the rights of the participant terminate, or, with respect to certain awards, is forfeited, the shares of PPL common stock underlying such an award are again available for grant. Shares delivered under the Plans may be in the form of authorized and aunissued PPL common stock, common stock held in treasury by PPL or PPL common stock purchased on the open market (including private purchases) in accordance with applicable securities laws.
Restricted Stock Units
Restricted stock units are awards based on the fair value of PPL common stock on the date of grant. Actual PPL common sharesLwill be issued upon completion of a restriction period, generally three years.
Under the SIP, each restricted stock unit entitles the executive to accrue additional restricted stock units equal to the amount of quarterly dividends paid on PPL stock. These additional restricted stock units are deferred and payable in shares of PPL common stock at the end of the restriction period. Dividend equivalents on restricted stock unit awards granted under theICPKE are currently paid in cash when dividends are declared by PPL.
The fair value of restricted stock units granted is recognized on a straight-line basis over the service period or through the date at which the employee reaches retirement eligibility. The fair value of restricted stock units granted to retirement-eligibleemployees is recognized as compensation expense immediately upon the date of grant. Recipients of restricted stock units granted under the ICPKE may also be granted the right to receive dividend equivalents through the end of the restriction periodor until the award is forfeited. Restricted stock units are subject to forfeiture or accelerated payout under the plan provisions for termination, retirement, disability and death of employees. Restrictions lapse on restricted stock units fully, in certain situt ations,as defined by each of the Plans.
The weighted-average grant date fair value of restricted stock units granted was:
2018 2017 2016 PPL $ 30.58 $ 35.30 $ 33.84PPL Electric 30.00 35.45 34.32LKE 30.98 35.25 33.73

132
Restricted stock unit activity for 2018 was:
RestrictedShares/Units
Weighted- Average
Grant Date Fair
Value Per Share
PPL NNonvested, beginning of period 1,291,649 $ 34.07Granted 369,308 30.58Vested (529,263) 32.97Forfeited (33,491) 33.30NNonvested, end of period (a) 1,098,203 33.45
PPL Electric Nonvested, beginning of period 184,416 $ 34.20Transfer between registrants (2,906) 33.95Granted 76,051 30.00Vested (56,352) 32.39Forfeited (13,872) 33.50NNonvested, end of period 187,337 33.09
LKE Nonvested, beginning of period 231,557 $ 34.01Transfer between registrants (1,284) 33.98Granted 58,377 30.98Vested (154,606) 33.38Forfeited (1,014) 29.52NNonvested, end of period 133,030 33.45
(a) Excludes 45,298 restricted stock units for which restrictions lapsed for former PPL Energy Supply employees as a result of the June 2015 spinoff, but for which distribution will not occur until the end of the original restriction period of the awards.
Substantially all restricted stock unit awards are expected to vest.
The total fair value of restricted stock units vesting for the years ended December 31 was:
2018 2017 2016 PPL $ 16 $ 20 $ 30PPL Electric 2 3 3LKE 5 4 5
Performance Units - Total Shareowner Return
Performance units based on relative Total Shareowner Return (TSR) are intended to encourage and reward future corporate performance. Performance units represent a target number of shares (Target Award) of PPL's common stock that the recipient would receive upon PPL's attainment of the applicable performance goal. Performance is determined based on TSR during a three-year performance period. At the end of the period, payout is determined by comparing PPL's performance to the TSR of tthe companies included in the Philadelphia Stock Exchange Utility Index. Awards are payable on a graduated basis based onthresholds that measure PPL's performance relative to peers that comprise the applicable index on which each year's awards aremeasured. Awards can be paid up to 200% of the Target Award or forfeited with no payout if per rformance is below a minimum established performance threshold. Dividends payable during the performance cycle accumulate and are converted into additional performance units and are payable in shares of PPL common stock upon completion of the performance period based on the determination of the CGNC of whether the performance goals have been achieved. Under the plan provisions, TSR performance units are subject to forfeiture upon termination of employment except for retirement, one year or more from commencement of the performance period, disability or death of an employee.
The fair value of TSR performance units granted to retirement-eligible employees is recognized as compensation expense on a straight-line basis over a one-year period, the minimum vesting period required for an employee to be entitled to payout of the

133
awards with no proration. For employees who are not retirement-eligible, compensation expense is recognized over the shorter of the three-year performance period or the period until the employee is retirement-eligible, with a minimum vesting and recognition period of one-year. If an employee retires before the one-year vesting period, the performance units are forfeited.Performance units vest on a pro rata basis, in certain situations, as defined by each of the Plans.
The fair value of each performance unit granted was estimated using a Monte Carlo pricing model that considers stock beta, a risk-free interest rate, expected stock volatility and expected life. The stock beta was calculated comparing the risk of theindividual securities to the average risk of the companies in the index group. The risk-free interest rate reflects the yield on aU.S. Treasury bond commensurate with the expected life of the performance unit. Volatility over the expected term of theperformance unit is calculated using daily stock price observations for PPL and ally companies in the index group and isevaluated with consideration given to prior periods that may need to be excluded based on eventsd not likely to recur that had impacted PPL and the companies in the index group. PPL uses a mix of historic and implied volatility to value awards.
The weighted-average assumptions used in the model were:
2018 2017 2016 Expected stock volatility 17.60% 17.40% 19.60%Expected life 3 years 3 years 3 years
The weighted-average grant date fair value of TSR performance units granted was:
2018 2017 2016 PPL $ 38.26 $ 38.38 $ 35.74PPL Electric 38.37 38.37 35.68LKE 38.32 38.24 35.28
TSR performance unit activity for 2018 was:
TSR Performance
Units
Weighted- AverageGrant
Date FairValue
Per Share PPL NNonvested, beginning of period 978,231 $ 36.67
Granted 263,593 38.26Vested (89,015) 34.78Forfeited (a) (312,685) 35.26
NNonvested, end of period 840,124 37.89
PPL Electric Nonvested, beginning of period 75,513 $ 37.00
Granted 22,394 38.37Vested (5,817) 35.34Forfeited (a) (24,227) 36.27
Nonvested, end of period 67,863 37.86
LKE NNonvested, beginning of period 180,289 $ 36.69
Granted 53,961 38.32Vested (14,547) 35.04Forfeited (a) (70,707) 35.91
NNonvested, end of period 148,996 37.81
(a) Primarily related to the forfeiture of 2015 performance units as performance during the period was below the minimum established performance threshold, which resulted in no payout.
The total fair value of TSR performance units vesting for the year ended December 31, 2018, 2017 and 2016 was $3 million, $8million and $12 million for PPL and insignificant for PPL Electric and LKE.
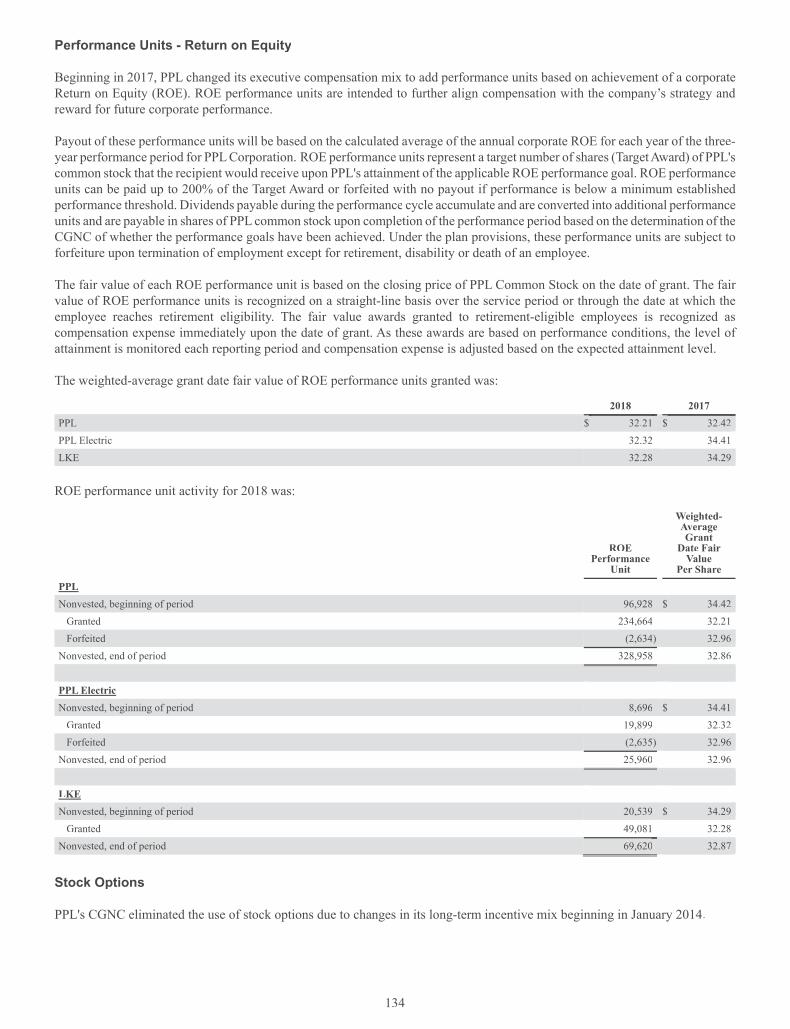
134
Performance Units - Return on Equity
Beginning in 2017, PPL changed its executive compensation mix to add performance units based on achievement of a corporateReturn on Equity (ROE). ROE performance units are intended to further align compensation with the company’s strategy and hreward for future corporate performance.
Payout of these performance units will be based on the calculated average of the annual corporate ROE for each year of the three-year performance period for PPL Corporation. ROE performance units represent a target number of shares (Target Award) of PPL's common stock that the recipient would receive upon PPL's attainment of the applicable ROE performance goal. ROE performance units can be paid up to 200% of the Target Award or forfeited with no payout if performance is below a minimum established performance threshold. Dividends payable during the performance cycle accumulate and are converted into additional performancedunits and are payable in shares of PPL common stock upon completion of the performance period based on the determination of theCGNC of whether the performance goals have been achieved. Under the plan provisions, these performance units are subject toforfeiture upon termination of employment except for retirement, disability or death of an employee.
The fair value of each ROE performance unit is based on the closing price of PPL Common Stock on the date of grant. The fair value of ROE performance units is recognized on a straight-line basis over the service d period or through the date at which theemployee reaches retirement eligibility. The fair value awards granted to retirement-eligible employees is recognized ascompensation expense immediately upon the date of grant. As these awards are based on performance conditions, the level of attainment is monitored each reporting period and compensation expense is adjusted based on the expected attainment level.
The weighted-average grant date fair value of ROE performance units granted was:
2018 2017 PPL $ 32.21 $ 32.42PPL Electric 32.32 34.41LKE 32.28 34.29
ROE performance unit activity for 2018 was:
ROE Performance
Unit
Weighted-Average Grant
Date FairValue
Per Share PPLNNonvested, beginning of period 96,928 $ 34.42
Granted 234,664 32.21Forfeited (2,634) 32.96
Nonvested, end of period 328,958 32.86
PPL Electric NNonvested, beginning of period 8,696 $ 34.41
Granted 19,899 32.32Forfeited (2,635) 32.96
Nonvested, end of period 25,960 32.96
LKE NNonvested, beginning of period 20,539 $ 34.29
Granted 49,081 32.28NNonvested, end of period 69,620 32.87
Stock Options
PPL's CGNC eliminated the use of stock options due to changes in its long-term incentive mix beginning in January 2014.

135
Under the Plans, stock options had been granted with an option exercise price per sharaa e not less than the fair value of PPL's common stock on the date of grant. Options outstanding at December 31, 2018, are fully vested. All options expire no later than10 years from the grant date. The options become exercisable immediately in certain situations, as defined by each of the Plans.
Stock option activity for 2018 was:
Numberof Options
Weighted AverageExercise Price Per
Share
Weighted-Average
Remaining ContractualTerm (years)
AggregateTotal Intrinsic
ValuePPL Outstanding at beginning of period 3,762,183 $ 29.42
Exercised (151,750) 28.43 Forfeited (695,908) 42.87
Outstanding and exercisable at end of period 2,914,525 26.26 3.4 $ 6
For 2018, 2017 and 2016, PPL received $5 million, $19 million and $52 million in cash from stock options exercised. Therelated income tax benefits realized were not significant.
The total intrinsic value of stock options exercised for 2018 was insignificant and was $8 million and $18 million for 2017 and2016.
Compensation Expense
Compensation expense for restricted stock, restricted stock units, performance units and stock options accounted for as equity awards, which for PPL Electric and LKE includes an allocation of PPL Services' expense, was:
2018 2017 2016 PPL $ 25 $ 32 $ 27PPL Electric 10 18 16LKE 8 8 7
The income tax benefit related to above compensation expense was as follows:
2018 2017 2016 PPL $ 10 $ 13 $ 12PPL Electric 3 8 7LKE 2 3 3
At December 31, 2018, unrecognized compensation expense related to nonvested stock awards was:
Unrecognized Compensation
Expense
Weighted-Average
Period forRecognition
PPL $ 10 1.6PPL Electric 2 1.7LKE 1 1.4
11. Retirement and Postemployment Benefits
(All Registrants)
Defined Benefits
Certain employees of PPL's domestic subsidiaries are eligible for pension benefits under non-contributory defined benefit pension plans with benefits based on length of service and final average pay, as defined by the plans. Effective January 1, 201h 2,PPL's primary defined benefit pension plan was closed to all newly hired salaried employees. Effective July 1, 2014, PPL'sprimary defined benefit pension plan was closed to all newly hired bargaining unit employees. Newly hired employees are eligible to participate in the PPL Retirement Savings Plan, a 401(k) savings plan with enhanced employer contributions.
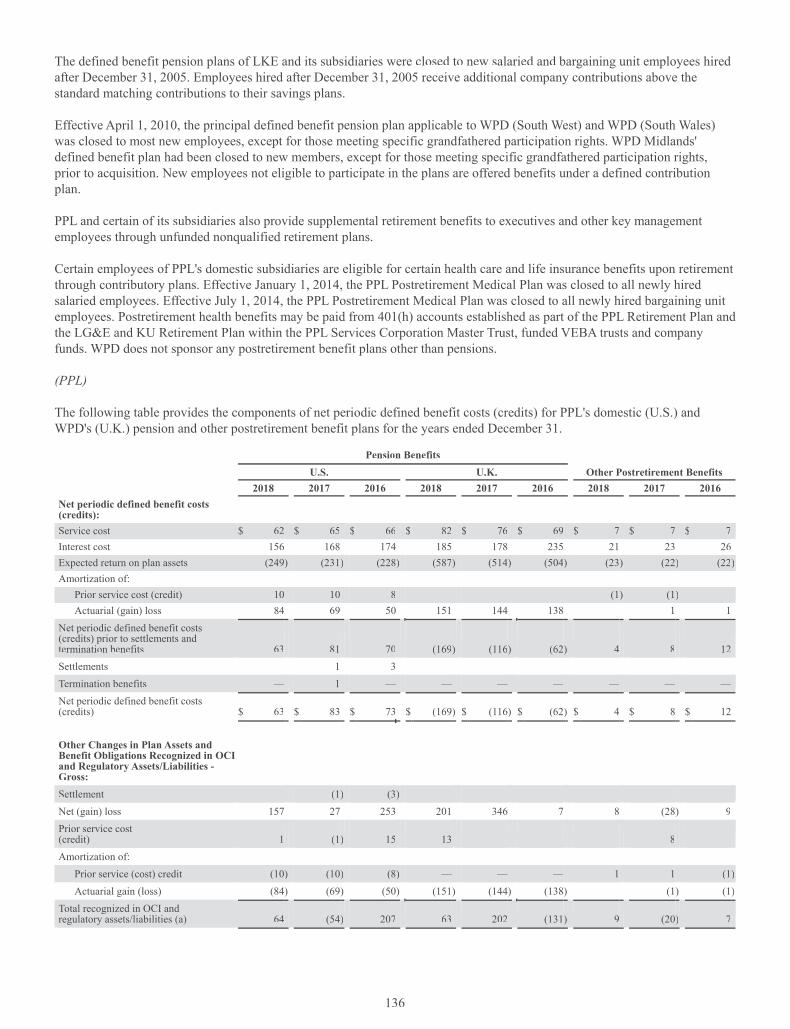
136
The defined benefit pension plans of LKE and its subsidiaries were closed to new salaried and bargaining unit employees hired after December 31, 2005. Employees hired after December 31, 2005 receive additional company contributions above the standard matching contributions to their savings plans.
Effective April 1, 2010, the principal defined benefit pension plan applicable to WPD (South West) and WPD (South Wales)was closed to most new employees, except for those meeting specific grandfathered participation rights. WPD Midlands'defined benefit plan had been closed to new members, except for those meeting specific grandfathered participation rights, prior to acquisition. New employees not eligible to participate in the plans are offered benefits under a defined contribution plan.
PPL and certain of its subsidiaries also provide supplemental retirement benefits to executives and other key management employees through unfunded nonqualified retirement plans.
Certain employees of PPL's domestic subsidiaries are eligible for certain health care and life insurance benefits upon retirement through contributory plans. Effective January 1, 2014, the PPL Postretirement Medical Plan was closed to all newly hired salaried employees. Effective July 1, 2014, the PPL Postretirement Medical Plan was closed to all newly hired bargaining unit employees. Postretirement health benefits may be paid from 401(h) accounts established as part of the PPL Retirement Plan and the LG&E and KU Retirement Plan within the PPL Services Corporation Master Trust, funded VEBA trusts and company funds. WPD does not sponsor any postretirement benefit plans other than pensions.
(PPL)
The following table provides the components of net periodic defined benefit costs (credits) for PPL's domestic (U.S.) and WPD's (U.K.) pension and other postretirement benefit plans for the years ended December 31.
Pension Benefits U.S. U.K. Other Postretirement Benefits
2018 2017 2016 2018 2017 2016 2018 2017 2016 Net periodic defined benefit costs(credits): Service cost $ 62 $ 65 $ 66 $ 82 $ 76 $ 69 $ 7 $ 7 $ 7Interest cost 156 168 174 185 178 235 21 23 26Expected return on plan assets (249) (231) (228) (587) (514) (504) (23) (22) (22)Amortization of:
Prior service cost (credit) 10 10 8 — — — (1) (1) —Actuarial (gain) loss 84 69 50 151 144 138 — 1 1
NNet periodic defined benefit costs (credits) prior to settlements and termination benefits 63 81 70 (169) (116) (62) 4 8 12Settlements — 1 3 — — — — — —Termination benefits — 1 — — — — — — —Net periodic defined benefit costs (credits) $ 63 $ 83 $ 73 $ (169) $ (116) $ (62) $ 4 $ 8 $ 12
Other Changes in Plan Assets andBenefit Obligations Recognized in OCIand Regulatory Assets/Liabilities -Gross: Settlement — (1) (3) — — — — — —Net (gain) loss 157 27 253 201 346 7 8 (28) 9Prior service cost (credit) 1 (1) 15 13 — — — 8 —Amortization of:
Prior service (cost) credit (10) (10) (8) — — — 1 1 (1)Actuarial gain (loss) (84) (69) (50) (151) (144) (138) — (1) (1)
Total recognized in OCI and regulatory assets/liabilities (a) 64 (54) 207 63 202 (131) 9 (20) 7

137
Pension Benefits U.S. U.K. Other Postretirement Benefits
2018 2017 2016 2018 2017 2016 2018 2017 2016 Total recognized in net periodic defined benefit costs, OCI and regulatoryassets/liabilities (a) $ 127 $ 29 $ 280 $ (106) $ 86 $ (193) $ 13 $ (12) $ 19
(a) WPD is not subject to accounting for the effects of certain types of regulation as prescribed by GAAP. As a result, WPD does not record regulatoryassets/liabilities.
For PPL's U.S. pension benefits and for other postretirement benefits, the amounts recognized in OCI and regulatory assets/liabilities for the years ended December 31 were as follows:
U.S. Pension Benefits Other Postretirement Benefits2018 2017 2016 2018 2017 2016
OCI $ 90 $ (53) $ 236 $ 20 $ (25) $ 7Regulatory assets/liabilities (26) (1) (29) (11 ) 5 —Total recognized in OCI and regulatory assets/liabilities $ 64 $ (54) $ 207 $ 9 $ (20) $ 7
(LKE)
The following table provides the components of net periodic defined benefit costs for LKE's pension and other postretirement benefit plans for the years ended December 31.
Pension Benefits Other Postretirement Benefits 2018 2017 2016 2018 2017 2016
Net periodic defined benefit costs (credits): Service cost $ 25 $ 24 $ 23 $ 4 $ 4 $ 5Interest cost 63 68 71 8 9 9Expected return on plan assets (102) (92) (91) (9) (7) (6)Amortization of:
Prior service cost 9 8 8 1 1 3Actuarial (gain) loss (a) 35 31 21 — — (1)
NNet periodic defined benefit costs (b) $ 30 $ 39 $ 32 $ 4 $ 7 $ 10
Other Changes in Plan Assets and Benefit Obligations Recognized in OCI andRegulatory Assets/Liabilities - Gross:Net (gain) loss $ 40 $ 30 $ 119 $ 1 $ (14) $ 6Prior service cost —— 7 — — 8 ——Amortization of:
Prior service credit (9) (8) (8) (1) (1) (3)Actuarial gain (loss) (35) (32) (21) — — 1
Total recognized in OCI and regulatory assets/liabilities (4) (3) 90 — (7) 4
Total recognized in net periodic defined benefit costs, OCI and regulatory assets/liabilities $ 26 $ 36 $ 122 $ 4 $ — $ 14
(a) As a result of the 2014 Kentucky rate case settlement that became effective July 1, 2015, the difference between actuarial (gain)/loss calculated inaccordance with LKE's pension accounting policy and actuarial (gain)/loss calculated using a 15 year amortization period was $11 million in 2018 and 2017 and $6 million in 2016.
(b) Due to the amount of lump sum payment distributions from the LG&E qualified pension plan, a settlement charge of $6 million in 2018 and $5 million in2017 was incurred. In accordance with existing regulatory accounting treatment, LG&E has maintained the settlement charge in regulatory assets. Theamount will be amortized in accordance with existing regulatory practice.
For LKE's pension and other postretirement benefits, the amounts recognized in OCI and regulatory assets/liabilities for theyears ended December 31 were as follows:
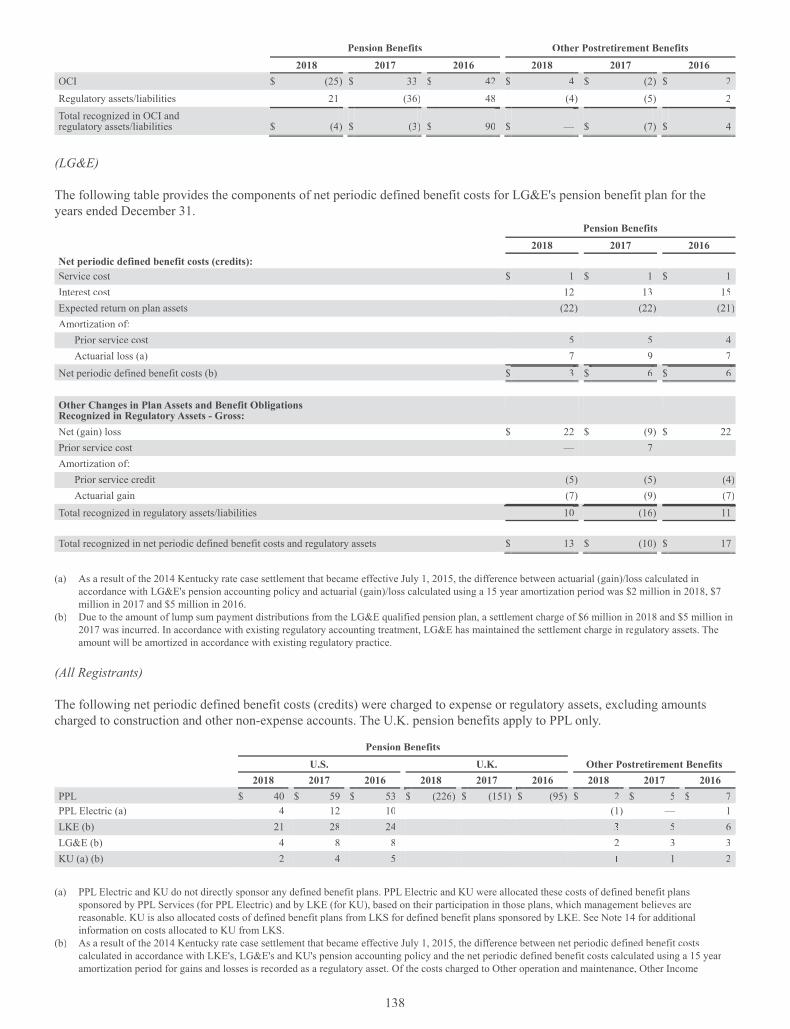
138
Pension Benefits Other Postretirement Benefits 2018 2017 2016 2018 2017 2016
OCI $ (25) $ 33 $ 42 $ 4 $ (2) $ 2Regulatory assets/liabilities 21 (36) 48 (4 ) (5) 2Total recognized in OCI and regulatory assets/liabilities $ (4) $ (3) $ 90 $ — $ (7) $ 4
(LG&E)
The following table provides the components of net periodic defined benefit costs for LG&E's pension benefit plan for the years ended December 31.
Pension Benefits 2018 2017 2016
Net periodic defined benefit costs (credits): Service cost $ 1 $ 1 $ 1Interest cost 12 13 15Expected return on plan assets (22) (22) (21)Amortization of:
Prior service cost 5 5 4Actuarial loss (a) 7 9 7
NNet periodic defined benefit costs (b) $ 3 $ 6 $ 6
Other Changes in Plan Assets and Benefit Obligations Recognized in Regulatory Assets - Gross:Net (gain) loss $ 22 $ (9) $ 22Prior service cost —— 7 —Amortization of:
Prior service credit (5) (5) (4)Actuarial gain (7 ) (9) (7)
Total recognized in regulatory assets/liabilities 10 (16) 11
Total recognized in net periodic defined benefit costs and regulatory assets $ 13 $ (10) $ 17
(a) As a result of the 2014 Kentucky rate case settlement that became effective July 1, 2015, the difference between actuarial (gain)/loss calculated inaccordance with LG&E's pension accounting policy and actuarial (gain)/loss calculated using a 15 year amortization period was $2 million in 2018, $7 million in 2017 and $5 million in 2016.
(b) Due to the amount of lump sum payment distributions from the LG&E qualified pension plan, a settlement charge of $6 million in 2018 and $5 million in2017 was incurred. In accordance with existing regulatory accounting treatment, LG&E has maintained the settlement charge in regulatory assets. Theamount will be amortized in accordance with existing regulatory practice.
(All Registrants)
The following net periodic defined benefit costs (credits) were charged to expense or regulatory assets, excluding amountscharged to construction and other non-expense accounts. The U.K. pension benefits apply to PPL only.
Pension Benefits U.S. U.K. Other Postretirement Benefits
2018 2017 2016 2018 2017 2016 2018 2017 2016 PPL $ 40 $ 59 $ 53 $ (226) $ (151) $ (95) $ 2 $ 5 $ 7PPL Electric (a) 4 12 10 (1) — 1LKE (b) 21 28 24 5 6LG&E (b) 4 8 8 2 3 3KU (a) (b) 2 4 5 1 2
(a) PPL Electric and KU do not directly sponsor any defined benefit plans. PPL Electric and KU were allocated these costs of defined benefit plans sponsored by PPL Services (for PPL Electric) and by LKE (for KU), based on their participation in those plans, which management believes aretreasonable. KU is also allocated costs of defined benefit plans from LKS for defined benefit plans sponsored by LKE. See Note 1m 4 for additional information on costs allocated to KU from LKS.
(b) As a result of the 2014 Kentucky rate case settlement that became effective July 1, 2015, the difference between net periodic defined benefit costscalculated in accordance with LKE's, LG&E's and KU's pension accounting policy and the net periodic defined benefit costs calculated using a 15 year amortization period for gains and losses is recorded as a regulatory asset. Of the costs charged to Other operation and maintenance, Other Income

139
(Expense) - net or regulatory assets, excluding amounts charged to construction and other non-expense accounts, $3 million for LG&E and $2 million for KU were recorded as regulatory assets in 2018, $4 million for LG&E and $2 million for KU were recorded as regulatory assets in 2017 and $3 million for LG&E and $2 million for KU were recorded as regulatory assets in 2016.
In the table above, LG&E amounts include costs for the specific plans it sponsors and the following allocated costs of defined benefit plans sponsored by LKE. LG&E is also allocated costs of defined benefit plans from LKS for defined benefit plans sponsored by LKE. See Note 14 for additional information on costs allocated to LG&E from LKS. These allocations are based on LG&E's participation in those plans, which management believes are reasonable:
Pension Benefits Other Postretirement Benefits 2018 2017 2016 2018 2017 2016
LG&E Non-Union Only $ 2 $ 5 $ 4 $ 2 $ 3 $ 3
(PPL, LKE and LG&E)
PPL, LKE and LG&E use the base mortality tables issued by the Society of Actuaries in October 2014 (RP-2014 base tables with collar and factor adjustments, where applicable) for all U.S. defined benefit pension and other postretirement benefit plans. For 2016, PPL, LKE and LG&E estimated projected mortality improvements using the IRS BB-2D two-dimensional improvement scale on a generational basis for all U.S. defined benefit pension and other postretirement benefit plans. In 2017,PPL, LKE and LG&E updated to the MP-2017 mortality improvement scale from 2006 on a generational basis and continue touse this improvement scale in 2018.
The following weighted-average assumptions were used in the valuation of the benefit obligations at December 31. The U.K.pension benefits apply to PPL only.
Pension Benefits U.S. U.K. Other Postretirement Benefits
2018 2017 2018 2017 2018 2017 PPL
Discount rate 4.35% 3.70% 2.98% 2.65% 4.31% 3.64%Rate of compensation increase 3.79% 3.78% 3.50% 3.50% 3.76% 3.75%
LKE Discount rate 4.35% 3.69% 4.32% 3.65%Rate of compensation increase 3.50% 3.50% 3.50% 3.50%
LG&E Discount rate 4.33% 3.65%
The following weighted-average assumptions were used to determine the net periodic defined benefit costs for the years ended December 31. The U.K. pension benefits apply to PPL only.
Pension Benefits U.S. U.K. Other Postretirement Benefits
2018 2017 2016 2018 2017 2016 2018 2017 2016 PPL
Discount rate service cost 3.70% 4.21% 4.59% 2.73% 2.99% 3.90% 3.64% 4.11% 4.48%Discount rate interest cost 3.70 % 4.21% 4.59% 2.31% 2.41% 3.14% 3.64 % 4.11% 4.48%Rate of compensation increase 3.78% 3.95% 3.93% 3.50% 3.50% 4.00% 3.75% 3.92% 3.91%Expected return on plan assets 7.25 % 7.00% 7.00% 7.23% 7.22% 7.20% 6.40 % 6.21% 6.11%
LKE Discount rate 3.69% 4.19% 4.56% 3.65% 4.12% 4.49%Rate of compensation increase 3.50 % 3.50% 3.50% 3.50 % 3.50% 3.50%Expected return on plan assets (a) 7.25% 7.00% 7.00% 7.15% 6.82% 6.82%
LG&E
Discount rate 3.65 % 4.13% 4.49%Expected return on plan assets (a) 7.25% 7.00% 7.00%

140
(a) The expected long-term rates of return for pension and other postretirement benefits are based on management's projections using a best-estimate of expected returns, volatilities and correlations for each asset class. Each plan's specific current and expected asset allocations are also considered indeveloping a reasonable return assumption.
(PPL and LKE)
The following table provides the assumed health care cost trend rates for the years ended December 31:
2018 2017 2016 PPL and LKE
Health care cost trend rate assumed for next year –– obligations 6.6% 6.6% 7.0%– cost 6.6% 7.0% 6.8%
Rate to which the cost trend rate is assumed to decline (the ultimate trend rate)– obligations 5.0% 5.0% 5.0%–– cost 5.0% 5.0% 5.0%
Year that the rate reaches the ultimate trend rate –– obligations 2023 2022 2022– cost 2022 2022 2020
(PPL)
The funded status of PPL's plans at December 31 was as follows:
Pension Benefits U.S. U.K. Other Postretirement Benefits
2018 2017 2018 2017 2018 2017 Change in Benefit Obligation Benefit Obligation, beginning of period $ 4,288 $ 4,079 $ 8,219 $ 7,383 $ 589 $ 591
Service cost 62 65 82 76 7 7Interest cost 156 168 185 178 21 23Participant contributions — — 13 13 13 14Plan amendments 1 (1) 12 — — 8Actuarial (gain) loss (352) 233 (406) 293 (34) 4Settlements —— (6) — (1) — —Termination benefits — 1 — — — —Gross benefits paid (272) (251) (381) (345) (58) (59)Federal subsidy — — — — — 1Currency conversion — — (449) 622 — —
Benefit Obligation, end of period 3,883 4,288 7,275 8,219 538 589
Change in Plan Assets Plan assets at fair value, beginning of period 3,488 3,243 8,490 7,211 405 378
Actual return on plan assets (260) 437 (30) 480 (20) 54Employer contributions 153 65 188 486 23 15Participant contributions — — 13 13 11 13Transfer out (a) —— — — — (65) —Settlements — (6) — (1 ) — —Gross benefits paid (272) (251) (381) (345) (53) (55)Currency conversion — — (479) 646 — —
Plan assets at fair value, end of period 3,109 3,488 7,801 8,490 301 405
Funded Status, end of period $ (774) $ (800) $ 526 $ 271 $ (237) $ (184)
Amounts recognized in the Balance Sheets consist of:
Noncurrent asset $ — $ — $ 535 $ 284 $ 2 $ 2Current liability (13) (13) (1) — (3) (3)Noncurrent liability (761) (787) (8) (13 ) (236) (183)
NNet amount recognized, end of period $ (774) $ (800) $ 526 $ 271 $ (237) $ (184)

141
Pension Benefits U.S. U.K. Other Postretirement Benefits
2018 2017 2018 2017 2018 2017
Amounts recognized in AOCI and regulatoryassets/liabilities (pre-tax) consist of: Prior service cost (credit) $ 40 $ 49 $ 12 $ — $ 10 $ 9NNet actuarial (gain) loss 1,207 1,134 2,806 2,755 24 16Total (b) $ 1,247 $ 1,183 $ 2,818 $ 2,755 $ 34 $ 25
Total accumulated benefit obligation for defined benefit pension plans $ 3,668 $ 4,000 $ 6,689 $ 7,542
(a) In May 2018, PPL received a favorable private letter ruling from the IRS permitting a transfer of excess funds from the PPL Bargaining Unit Retiree Health Plan VEBA to a new subaccount within the VEBA to be used to pay medical claims of active bargaining unit employees.
(b) WPD is not subject to accounting for the effects of certain types of regulation as prescribed by GAAP and as a result, does not record regulatory assets/liabilities.
For PPL's U.S. pension and other postretirement benefit plans, the amounts recognized in AOCI and regulatory assets/liabilitiesat December 31 were as follows:
U.S. Pension Benefits Other Postretirement Benefits 2018 2017 2018 2017
AOCI $ 370 $ 374 $ 21 $ 15Regulatory assets/liabilities 877 809 13 10Total $ 1,247 $ 1,183 $ 34 $ 25
The actuarial (gain) loss for all pension plans in 2018 and 2017 was primarily related to a change in the discount rate used tomeasure the benefit obligations of those plans.
The following tables provide information on pension plans where the projected benefit obligation (PBO) or accumulated benefit obligation (ABO) exceed the fair value of plan assets:
U.S. U.K. PBO in excess of plan assets PBO in excess of plan assets
2018 2017 2018 2017 Projected benefit obligation $ 3,883 $ 4,288 $ 9 $ 3,083Fair value of plan assets 3,109 3,488 — 3,070
U.S. U.K.
ABO in excess of plan assets ABO in excess of plan assets 2018 2017 2018 2017
Accumulated benefit obligation $ 3,668 $ 4,000 $ 9 $ 10Fair value of plan assets 3,109 3,488 — —
(LKE)
The funded status of LKE's plans at December 31 was as follows:
Pension Benefits Other Postretirement Benefits 2018 2017 2018 2017
Change in Benefit ObligationBenefit Obligation, beginning of period $ 1,771 $ 1,669 $ 223 $ 220
Service cost 25 24 4 4Interest cost 63 68 8 9Participant contributions — — 8 8Plan amendments (a) — 6 — 8Actuarial (gain) loss (b) (168) 113 (16) (7)Gross benefits paid (a) (111) (109) (22) (19)
Benefit Obligation, end of period 1,580 1,771 205 223

142
Pension Benefits Other Postretirement Benefits 2018 2017 2018 2017
Change in Plan AssetsPlan assets at fair value, beginning of period 1,402 1,315 116 98
Actual return on plan assets (106) 175 (9) 14Employer contributions 109 21 24 15Participant contributions — — 8 8Gross benefits paid (111) (109) (22) (19)
Plan assets at fair value, end of period 1,294 1,402 117 116
Funded Status, end of period $ (286) $ (369 ) $ (88) $ (107)
Amounts recognized in the Balance Sheets consist of:NNoncurrent asset $ — $ — $ 2 $ 2Current liability (4) (4 ) (3) (3)NNoncurrent liability (282) (365) (87) (106)
Net amount recognized, end of period $ (286) $ (369 ) $ (88) $ (107)
Amounts recognized in AOCI and regulatory assets/liabilities (pre-tax) consistof: Prior service cost $ 35 $ 44 $ 12 $ 13Net actuarial (gain) loss 439 434 (25) (26)Total $ 474 $ 478 $ (13) $ (13)
Total accumulated benefit obligation for defined benefit pension plans $ 1,467 $ 1,616
(a) The pension plans were amended in December 2015 to allow active participants and terminated vested participants who had not previously elected a form of payment of their benefit to elect to receive their accrued pension benefit as a one-time lump-sum payment effective January 1, 2016. Gross benefits paid by the plans include lump-sum cash payments made to participants during 2018 and 2017 of $52 million and $50 million in connection with theseofferings.
(b) The actuarial (gain) loss for all pension plans in 2018 and 2017 was primarily related to change in the discount rate used to measure the benefit obligations of those plans.
The amounts recognized in AOCI and regulatory assets/liabilities at December 31 were as follows:
Pension Benefits Other Postretirement Benefits 2018 2017 2018 2017
AOCI $ 118 $ 144 $ 10 $ 6Regulatory assets/liabilities 356 334 (23) (19)Total $ 474 $ 478 $ (13) $ (13)
The following tables provide information on pension plans where the projected benefit obligation (PBO) or accumulated benefit obligations (ABO) exceed the fair value of plan assets:
PBO in excess of plan assets2018 2017
Projected benefit obligation $ 1,580 $ 1,771Fair value of plan assets 1,294 1,402
ABO in excess of plan assets 2018 2017
Accumulated benefit obligation $ 1,467 $ 1,616Fair value of plan assets 1,294 1,402
(LG&E)
The funded status of LG&E's plan at December 31, was as follows:
Pension Benefits

143
2018 2017 Change in Benefit ObligationBenefit Obligation, beginning of period $ 326 $ 329
Service cost 1 1Interest cost 12 13Plan amendments (a) — 6Actuarial (gain) loss (24) 11Gross benefits paid (a) (30) (34)
Benefit Obligation, end of period 285 326
Change in Plan Assets Plan assets at fair value, beginning of period 325 318
Actual return on plan assets (24) 41Employer contributions 10 —Gross benefits paid (30) (34)
Plan assets at fair value, end of period 281 325
Funded Status, end of period $ (4) $ (1)
Amounts recognized in the Balance Sheets consist of:NNoncurrent liability $ (4) $ (1)
Net amount recognized, end of period $ (4) $ (1)
Amounts recognized in regulatory assets (pre-tax) consist of:Prior service cost $ 22 $ 27Net actuarial loss 107 92Total $ 129 $ 119
Total accumulated benefit obligation for defined benefit pension plan $ 285 $ 326
(a) The pension plan was amended in December 2015 to allow active participants and terminated vested participants who had not previously elected a form of payment of their benefit to elect to receive their accrued pension benefit as a one-time lump-sum payment effective January 1, 2016. Gross benefits paid by the plan include lump-sum cash payments made to participants during 2018 and 2017 of $16 million and $19 million in connection with thisoffering.
LG&E's pension plan had projected and accumulated benefit obligations in excess of plan assets at December 31, 2018 and 2017.
In addition to the plan it sponsors, LG&E is allocated a portion of the funded status and costs of certain defined benefit planssponsored by LKE. LG&E is also allocated costs of defined benefit plans from LKS for defined benefit plans sponsored byLKE. See Note 14 for additional information on costs allocated to LG&E from LKS. These allocations are based on LG&E'sparticipation in those plans, which management believes are reasonable. The actuarially determined obligations of current active employees and retired employees are used as a basis to allocate total plan activity, including active and retiree costs and obligations. Allocations to LG&E resulted in liabilities at December 31 as follows:
2018 2017 Pension $ 7 $ 44Other postretirement benefits 65 74
(PPL Electric)
Although PPL Electric does not directly sponsor any defined benefit plans, it is allocated a portion of the funded status and costs of plans sponsored by PPL Services based on its participation in those plans, which management believes are reasonable.The actuarially determined obligations of current active employees and retirees are used as a basis to allocate total plan activity,including active and retiree costs and obligations. Allocations to PPL Electric resulted in liabilities at December 31 as follows:
2018 2017 Pension $ 285 $ 246Other postretirement benefits 120 62

144
(KU)
Although KU does not directly sponsor any defined benefit plans, it is allocated a portion of the funded status and costs of rrplans sponsored by LKE. KU is also allocated costs of defined benefit plans from LKS for defined benefit plans sponsored byLKE. See Note 14 for additional information on costs allocated to KU from LKS. These allocations are based on KU's participation in those plans, which management believes are reasonable. The actuarially determined obligations of current active employees and retired employees of KU are used as a basis to allocate total plan activity, including active and retiree yycosts and obligations. Allocations to KU resulted in liabilities at December 31 as follows.
2018 2017 Pension $ 1 $ 36Other postretirement benefits 25 32
Plan Assets - U.S. Pension Plans
(PPL, LKE and LG&E)
PPL's primary legacy pension plan and the pension plans sponsored by LKE and LG&E are invested in the PPL ServicesCorporation Master Trust (the Master Trust) that also includes 401(h) accounts that are restricted for certain other postretirement benefit obligations of PPL and LKE. The investment strategy for the Master Trust is to achieve a risk-adjusted return on a mix of assets that, in combination with PPL's funding policy, will ensure that sufficient assets are available toprovide long-term growth and liquidity for benefit payments, while also managing the duration of the assets to complement the duration of the liabilities. The Master Trust benefits from a wide diversification of asset types, investment fund strategies and aaexternal investment fund managers, and therefore has no significant concentration of risk.
The investment policy of the Master Trust outlines investment objectives and defines the responsibilities of the EBPB, externalinvestment managers, investment advisor and trustee and custodian. The investment policy is reviewed annually by PPL's tBoard of Directors.
The EBPB created a risk management framework around the trust assets and pension liabilities. This framework considers thetrust assets as being composed of three sub-portfolios: growth, immunizing and liquidity portfolios. The growth portfolio is comprised of investments that generate a return at a reasonable risk, including equity securities, certain debt securities and alternative investments. The immunizing portfolio consists of debt securities, generally with long durations, and derivative positions. The immunizing portfolio is designed to offset a portion of the change in the pension liabilities due to changes ininterest rates. The liquidity portfolio consists primarily of cash and cash equivalents.
Target allocation ranges have been developed for each portfolio based on input from external consultants with a goal of limitingfunded status volatility. The EBPB monitors the investments in each portfolio, and seeks to obtain a target portfolio that emphasizes reduction of risk of loss from market volatility. In pursuing that goal, the EBPB establishes revised guidelines from time to time. EBPB investment guidelines as of the end of 2018 are presented below.
The asset allocation for the trust and the target allocation by portfolio at December 31 are as follows:
Percentage of trust assets 2018
2018 (a) 2017 (a) Target Asset
Allocation (a) Growth Portfolio 55% 56% 55%
Equity securities 30 % 32 %Debt securities (b) 15 % 14 %Alternative investments 10 % 10 %
Immunizing Portfolio 43% 43% 43%Debt securities (b) 39 % 39 %Derivatives 4 % 4 %
Liquidity Portfolio 2% 1% 2%Total 100 % 100 % 100 %
(a) Allocations exclude consideration of a group annuity contract held by the LG&E and KU Retirement Plan.(b) Includes commingled debt funds, which PPL treats as debt securities for asset allocation purposes.

145
(LKE)
LKE has pension plans, including LG&E's plan, whose assets are invested solely in the Master Trust, which is fully disclosed below. The fair value of these plans' assets of $1.3 billion and $1.4 billion at December 31, 2018 and 2017 represents an interest of approximately 42% and 40% in the Master Trust.
(LG&E)
LG&E has a pension plan whose assets are invested solely in the Master Trust, which is fully disclosed below. The fair value ofthis plan's assets of $281 million and $325 million at December 31, 2018 and 2017 represents an interest of approximately 9% in the Master Trust.
(PPL, LKE and LG&E)
The fair value of net assets in the Master Trust by asset class and level within the fair value hierarchy was:
December 31, 2018 December 31, 2017
Fair Value Measurements Using Fair Value Measurements Using Total Level 1 Level 2 Level 3 Total Level 1 Level 2 Level 3
PPL Services Corporation Master Trust Cash and cash equivalents $ 220 $ 220 $ — $ — $ 301 $ 301 $ — $ —Equity securities:
U.S. Equity 159 159 — — 229 229 — —U.S. Equity fund measured at NAV (a) 340 — — — 364 — — —International equity fund at NAV (a) 466 — — — 538 — — —Commingled debt measured at NAV (a) 543 — — — 611 — — —
Debt securities:U.S. Treasury and U.S. government sponsored agency 212 212 — — 186 186 — —Corporate 899 — 874 25 883 — 870 13Other 17 — 17 — 10 — 10 —
Alternative investments:Real estate measured at NAV (a) 90 — — — 109 — — —Private equity measured at NAV (a) 65 — — — 80 — — —Hedge funds measured at NAV (a) 175 — — — 175 — — —
Derivatives 33 — 33 — 51 — 51 —Insurance contracts 21 — — 21 24 — — 24PPL Services Corporation Master Trust assets, atfair value 3,240 $ 591 $ 924 $ 46 3,561 $ 716 $ 931 $ 37
Receivables and payables, net (b) (2) 72401(h) accounts restricted for other ppostretirement benefit obligations (129) (145) Total PPL Services Corporation Master Trust pension assets $ 3,109 $ 3,488
(a) In accordance with accounting guidance certain investments that are measured at fair value using the net asset value per share (NAV), or its equivalent, practical expedient have not been classified in the fair value hierarchy. The fair value amounts presented in the table are intended to permit reconciliationof the fair value hierarchy to the amounts presented in the statement of financial position.
(b) Receivables and payables, net represents amounts for investments sold/purchased but not yet settled along with interest and dividends earned but not yet received.
A reconciliation of the Master Trust assets classified as Level 3 at December 31, 2018 is as follows:
Corporatedebt
Insurance contracts Total
Balance at beginning of period $ 13 $ 24 $ 37Actual return on plan assets
Relating to assets still held at the reporting date (2) 1 (1)Relating to assets sold during the period 3 — 3
Purchases, sales and settlements 11 (4) 7Balance at end of period $ 25 $ 21 $ 46

146
A reconciliation of the Master Trust assets classified as Level 3 at December 31, 2017 is as follows:
Corporatedebt
Insurance contracts Total
Balance at beginning of period $ 13 $ 27 $ 40Actual return on plan assets
Relating to assets still held at the reporting date — 1 1Purchases, sales and settlements — (4) (4)
Balance at end of period $ 13 $ 24 $ 37
The fair value measurements of cash and cash equivalents are based on the amounts on deposit.
The market approach is used to measure fair value of equity securities. The fair value measurements of equity securities(excluding commingled funds), which are generally classified as Level 1, are based on quoted prices in active markets. Thesesecurities represent actively and passively managed investments that are managed against various equity indices.
Investments in commingled equity and debt funds are categorized as equity securitiest . Investments in commingled equity funds include funds that invest in U.S. and international equity securities. Investments in commingled debt funds include funds that invest in a diversified portfolio of emerging market debt obligations, as well as funds that invest in investment grade long-duration fixed-income securities.
The fair value measurements of debt securities are generally based on evaluations that reflect observable market information,such as actual trade information for identical securities or for similar securities, adjusted for observable differences. The fair ffvalue of debt securities is generally measured using a market approach, including the use of pricing models, which incorporate observable inputs. Common inputs include benchmark yields, relevant trade data, broker/dealer bid/ask prices, benchmark securities and credit valuation adjustments. When necessary, the fair value of debt securities is measured using the income approach, which incorporates similar observable inputs as well as payment data, future predicted cash flows, collateralperformance and new issue data. For the Master Trust, these securities represent investments in securities issued by U.S. Treasury and U.S. government sponsored agencies; investments securitized by residential mortgages, auto loans, credit cardsand other pooled loans; investments in investment grade and non-investment grade bonds issued by U.S. companies acrossseveral industries; investments in debt securities issued by foreign governments and corporations.
Investments in real estate represent an investment in a partnership whose purpose is to manage investments in core U.S. realestate properties diversified geographically and across major property types (e.g., office, industrial, retail, etc.). The strategy is aafocused on properties with high occupancy rates with quality tenants. This results in a focus on high income and stable cashflows with appreciation being a secondary factor. Core real estate generally has a lower degree of leverage when compared with more speculative real estate investing strategies. The partnership has limitations on the amounts that may be redeemed aabased on available cash to fund redemptions. Additionally, the general partner may decline to accept redemptions when necessary to avoid adverse consequences for the partnership, including legal and tax implications, among others. The fair valueof the investment is based upon a partnership unit value.
Investments in private equity represent interests in partnerships in multiple early-stage venture capital funds and private equity fund of funds that use a number of diverse investment strategies. The partnerships have limited lives of at least 10 years, after which liquidating distributions will be received. Prior to the end of each partnership's life, the investment cannot be redeemedwith the partnership; however, the interest may be sold to other parties, subject to the general partner's approval. The MasterTrust has unfunded commitments of $71 million that may be required during the lives of the partnerships. Fair value is based on an ownership interest in partners' capital to which a proportionate share of net assets is attributed.
Investments in hedge funds represent investments in a fund of hedge funds. Hedge funds seekf a return utilizing a number of kdiverse investment strategies. The strategies, when combined aim to reduce volatility and risk while attempting to deliver positive returns under most market conditions. Major investment strategies for the fund of hedge funds include long/short equity, tactical trading, event driven, and relative value. Shares may be redeemed with 45 days prior written notice. The fund issubject to short term lockups and other restrictions. The fair value for the fund has been estimated using the net asset value per share.
The fair value measurements of derivative instruments utilize various inputs that include quoted prices for similar contracts or market-corroborated inputs. In certain instances, these instruments may be valued using models, including standard optiondvaluation models and standard industry models. These securities primarily represent investments in treasury futures, total return

147
swaps, interest rate swaps and swaptions (the option to enter into an interest rate swap), which are valued based on quoted prices, changes in the value of the underlying exposure or on the swap details, such as swap curves, notional amount, index andterm of index, reset frequency, volatility and payer/receiver credit ratings.
Insurance contracts, classified as Level 3, represent an investment in an immediate participation guaranteedrr group annuitydcontract. The fair value is based on contract value, which represents cost plus interest income less distributions for benefit payments and administrative expenses.
Plan Assets - U.S. Other Postretirement Benefit Plans
The investment strategy with respect to other postretirement benefit obligations is to fund VEBA trusts and/or 401(h) accountswith voluntary contributions and to invest in a tax efficient manner. Excluding the 401(h) accounts included in the Master Trust, other postretirement benefit plans are invested in a mix of assets for long-term growth with an objective of earningreturns that provide liquidity as required for benefit payments. These plans benefit from diversification of asset types,investment fund strategies and investment fund managers and, therefore, have no significant concentration of risk. Equity securities include investments in domestic large-cap commingled funds. Ownership interests in commingled funds that invest entirely in debt securities are classified as equity securities, but treated as debt securities for asset allocation and targetallocation purposes. Ownership interests in money market funds are treated as cash and cash equivalents for asset allocation and target allocation purposes. The asset allocation for the PPL VEBA trusts, excluding LKE, and the target allocation, by asset class, at December 31 are detailed below.
Percentage of plan assets Target Asset Allocation
2018 2017 2018 Asset ClassU.S. Equity securities 40% 47% 45%Debt securities (a) 56% 49% 50%Cash and cash equivalents (b) 4% 4% 5%
Total 100% 100% 100%
(a) Includes commingled debt funds and debt securities.(b) Includes money market funds.
LKE's other postretirement benefit plan is invested primarily in a 401(h) account, as disclosed in the PPL Services CorporationMaster Trust, with insignificant amounts invested in money market funds within VEBA trusts for liquidity.
The fair value of assets in the U.S. other postretirement benefit plans by asset class and level within the fair value hierarchy was:
December 31, 2018 December 31, 2017
Fair Value Measurement Using Fair Value Measurement UsingTotal Level 1 Level 2 Level 3 Total Level 1 Level 2 Level 3
Money market funds $ 6 $ 6 $ — $ — $ 10 $ 10 $ — $ —U.S. Equity securities:
Large-cap equity fund measure at NAV (a) 69 — — — 123 — —— ——Commingled debt fund measured at NAV (a) 68 — — — 96 — — —
Debt securities: Corporate bonds 28 — 28 — 30 — 30 —
Total VEBA trust assets, at fair value 171 $ 6 $ 28 $ — 259 $ 10 $ 30 $ —Receivables and payables, net (b) 1 1 401(h) account assets 129Total other postretirement benefit plan assets $ 301 $ 405
(a) In accordance with accounting guidance certain investments that are measured at fair value using the net asset value per share (NAV), or its equivalent, practical expedient have not been classified in the fair value hierarchy. The fair value amounts presented in the table are intended to permit reconciliationof the fair value hierarchy to the amounts presented in the statement of financial position.
(b) Receivables and payables represent amounts for investments sold/purchased but not yet settled along with interest and dividends earned but not yet received.

148
Investments in money market funds represent investments in funds that invest primarily in a diversified portfolio of investmentygrade money market instruments, including, but not limited to, commercial paper, notes, repurchase agreements and other evidences of indebtedness with a maturity not exceeding 13 months from the date of purchase. The primary objective of thefund is a level of current income consistent with stability of principal and liquidity. Redemptions can be made daily on thisfund.
Investments in large-cap equity securities represent investments in a passively managed equity index fund that invests inysecurities and a combination of other collective funds. Fair value measurements are not obtained from a quoted price in an active market but are based on firm quotes of net asset values per share as provided by the trustee of the fund. Redemptions canaabe made daily on this fund.
Investments in commingled debt securities represent investments in a fund that invests in a diversified portfolio of investmentgrade long-duration fixed income securities. Redemptions can be made daily on these funds.
Investments in corporate bonds represent investment in a diversified portfolio of investment grade long-duration fixed income securities. The fair value of debt securities are generally based on evaluations that reflect observable market information, such as actual trade information for identical securities or for similar securities, adjusted for observable differences.
Plan Assets - U.K. Pension Plans (PPL)
The overall investment strategy of WPD's pension plans is developed by each plan's independent trustees in its Statement of Investment Principles in compliance with the U.K. Pensions Act of 1995 and other U.K. legislation. The trustees' primary focusis to ensure that assets are sufficient to meet members' benefits as they fall due with aff longer term objective to reduce investment risk. The investment strategy is intended to maximize investment returns while not incurring excessive volatility inthe funding position. WPD's plans are invested in a wide diversification of asset types, fund strategies and fund managers; andtherefore, have no significant concentration of risk. Commingled funds that consist entirely of debt securities are traded as equity units, but treated by WPD as debt securities for asset allocation and target allocation purposes. These include investments in U.K. corporate bonds and U.K. gilts.
The asset allocation and target allocation at December 31 of WPD's pension plans are detailed below.
Target Asset Percentage of plan assets Allocation
2018 2017 2018 Asset ClassCash and cash equivalents 2% 2% —%Equity securities
U.K. —% 2% 2%European (excluding the U.K.) 1% 1% 1%Asian-Pacific 1% 1% 1%North American 1% 1% 1%Emerging markets 1% 1% 1%Global equities 19% 16% 10%Global Tactical Asset Allocation 31% 33% 41%
Debt securities (a) 38% 37% 38%Alternative investments 6% 6% 5%
Total 100% 100% 100%
(a) Includes commingled debt funds.

149
The fair value of assets in the U.K. pension plans by asset class and level within the fair value hierarchy was:
December 31, 2018 December 31, 2017
Fair Value Measurement Using Fair Value Measurement UsingTotal Level 1 Level 2 Level 3 Total Level 1 Level 2 Level 3
Cash and cash equivalents $ 147 $ 147 $ — $ — $ 216 $ 216 $ — $ —Equity securities measured at NAV (a) :
U.K. companies 27 — — — 157 — —— ——European companies (excluding the U.K.) 76 — — — 98 — — —Asian-Pacific companies 49 — — — 60 — —— ——North American companies 105 — — — 123 — — —Emerging markets companies 44 — — — 62 — —— ——Global Equities 1,465 — — — 1,335 — — —Other 2,437 — — — 2,807 — —— ——
Debt Securities: U.K. corporate bonds 4 — 4 — 3 — 3 ——U.K. gilts 2,933 — 2,933 — 3,137 — 3,137 —
Alternative investments:Real estate measured at NAV (a) 485 — — — 492 — — —
Fair value - U.K. pension plans 7,772 $ 147 $ 2,937 $ — 8,490 $ 216 $ 3,140 $ —Receivables and payables, net (b) 29 — Total U.K. pension assets $ 7,801 8,490
(a) In accordance with accounting guidance certain investments that are measured at fair value using the net asset value per share (NAV), or its equivalent, practical expedient have not been classified in the fair value hierarchy. The fair value amounts presented in the table are intended to permit reconciliationof the fair value hierarchy to the amounts presented in the statement of financial position.
(b) Receivables and payables, net represents amounts for investments sold/purchased but not yet settled along with interest and dividends earned but not yet received.
Except for investments in real estate, the fair value measurements of WPD's pension plan assets are based on the same inputs and measurement techniques used to measure the U.S. pension plan assets described above.
Investments in equity securities represent actively and passively managed funds that are measured against various equityindices.
Other comprises a range of investment strategies, which invest in a variety of assets including equities, bonds, currencies, realestate and forestry held in unitized funds, which are considered in the Global Tactical Asset Allocation target.
U.K. corporate bonds include investment grade corporate bonds of companies from diversified U.K. industries.
U.K. gilts include gilts, index-linked gilts and swaps intended to track a portion of the plans' liabilities.
Investments in real estate represent holdings in a U.K. unitized fund that owns and manages U.K. industrial and commercialreal estate with a strategy of earning current rental income and achieving capital growth. The fair value measurement of thefund is based upon a net asset value per share, which is based on the value of underlying properties that are independentlyappraised in accordance with Royal Institution of Chartered Surveyors valuation standards at least annually with quarterly valuation updates based on recent sales of similar properties, leasing levels, propef rty operations and/or market conditions. The fund may be subject to redemption restrictions in the unlikely event of a large forced sale in order to ensure other unit holders are not disadvantaged.
Expected Cash Flows - U.S. Defined Benefit Plans (PPL)
While PPL's U.S. defined benefit pension plans have the option to utilize available prior year credit balances to meet current and future contribution requirements, PPL contributed $50 million to its U.S. pension plans in January 2019. No additionalcontributions are expected in 2019.
PPL sponsors various non-qualified supplemental pension plans for which no assets are segregated from corporate assets. PPL expects to make approximately $13 million of benefit payments under these plans in 2019.

150
PPL is not required to make contributions to its other postretirement benefit plans but hastt historically funded these plans in amounts equal to the postretirement benefit costs recognized. Continuation of this past practice would cause PPL to contributet$15 million to its other postretirement benefit plans in 2019.
The following benefit payments, which reflect expected future service, as appropriate, are expected to be paid by the plans andthe following federal subsidy payments are expected to be received by PPL.
Other Postretirement
Pension Benefit
Payment
Expected Federal Subsidy
2019 $ 274 $ 50 $ —2020 266 50 12021 265 49 —2022 265 48 12023 264 46 —2024-2028 1,290 210 1
(LKE)
While LKE's defined benefit pension plans have the option to utilize available prior year credit balances to meet current and future contribution requirements, LKE contributed $20 million to its pension plans in January 2019. No additionalcontributions are expected in 2019.
LKE sponsors various non-qualified supplemental pension plans for which no assets are segregated from corporate assets. LKEexpects to make $4 million of benefit payments under these plans in 2019. ff
LKE is not required to make contributions to its other postretirement benefit plan but has historically funded this plan inamounts equal to the postretirement benefit costs recognized. Continuation of this past practice would cause LKE to contribute ta projected $15 million to its other postretirement benefit plan in 2019.
The following benefit payments, which reflect expected future service, as appropriate, are expected to be paid by the plans andthe following federal subsidy payments are expected to be received by LKE.
Other Postretirement
Pension Benefit
Payment
Expected Federal Subsidy
2019 $ 112 $ 15 $ —2020 112 15 —2021 113 16 —2022 113 16 12023 112 16 —2024-2028 547 78 1
(LG&E)
While LG&E's defined benefit pension plan has the option to utilize available prior year credit balances to meet current and future contribution requirements, LG&E contributed $1 million to its pension plan in January 2019. No additional contributionsare expected in 2019.
The following benefit payments, which reflect expected future service, as appropriate, are expected to be paid by the plan.
Pension2019 $ 252020 252021 242022 232023 222024-2028 95

151
Expected Cash Flows - U.K. Pension Plans (PPL)
The pension plans of WPD are subject to formal actuarial valuations every three years, which are used to determine fundingrequirements. Contribution requirements were evaluated in accordance with the valuation performed as of March 31, 2016.WPD expects to make contributions of approximately $277 million in 2019. WPD is currently permitted to recover in current revenues approximately 78% of its pension funding requirements for its primary pension plans.
The following benefit payments, which reflect expected future service, as appropriate, are expected to be paid by the plans.
Pension2019 $ 3372020 3402021 3442022 3492023 3522024-2028 1,781
Savings Plans (All Registrants)
Substantially all employees of PPL's subsidiaries are eligible to participate in deferred savingsaa plans (401(k)s). Employer contributions to the plans were:
2018 2017 2016 PPL $ 40 $ 36 $ 35PPL Electric 6 6 6LKE 20 18 17LG&E 6 5 5KU 5 4 4
12. Jointly Owned Facilities
(PPL, LKE, LG&E and KU)
At December 31, 2018 and 2017, the Balance Sheets reflect the owned interests in the facilities listed below.
Ownership Interest Electric Plant
AccumulatedDepreciation
ConstructionWork
in Progress PPL and LKE
December 31, 2018 ,Generating Plants
Trimble County Unit 1 75.00% $ 427 $ 77 $ —Trimble County Unit 2 75.00% 1,063 199 293
,Generating Plants
Trimble County Unit 1 75.00% $ 427 $ 69 $ 1Trimble County Unit 2 75.00% 1,032 176 198
LG&E
December 31, 2018 ,Generating Plants
E.W. Brown Units 6-7 38.00% $ 41 $ 20 $ —Paddy's Run Unit 13 & E.W. Brown Unit 5 53.00% 51 17 —Trimble County Unit 1 75.00% 427 77 —Trimble County Unit 2 14.25% 226 39 152Trimble County Units 5-6 29.00% 32 11 —Trimble County Units 7-10 37.00% 77 24 —Cane Run Unit 7 22.00% 119 9 —E.W. Brown Solar Unit 39.00% 10 1 —

152
Ownership Interest Electric Plant
AccumulatedDepreciation
ConstructionWork
in Progress
December 31, 2017 ,Generating Plants
E.W. Brown Units 6-7 38.00% $ 41 $ 17 $ —Paddy's Run Unit 13 & E.W. Brown Unit 5 53.00% 52 15 —Trimble County Unit 1 75.00% 427 69 1Trimble County Unit 2 14.25% 215 36 102Trimble County Units 5-6 29.00% 32 9 —Trimble County Units 7-10 37.00% 73 21 —Cane Run Unit 7 22.00% 120 8 1E.W. Brown Solar Unit 39.00% 10 1 —
KU December 31, 2018 ,Generating Plants
E.W. Brown Units 6-7 62.00% $ 66 $ 31 $ —Paddy's Run Unit 13 & E.W. Brown Unit 5 47.00% 46 15 —Trimble County Unit 2 60.75% 837 160 141Trimble County Units 5-6 71.00% 76 25 —Trimble County Units 7-10 63.00% 129 41 —Cane Run Unit 7 78.00% 428 36 —E.W. Brown Solar Unit 61.00% 16 2 —
December 31, 2017 ,
Generating PlantsE.W. Brown Units 6-7 62.00% $ 66 $ 27 $ —Paddy's Run Unit 13 & E.W. Brown Unit 5 47.00% 46 13 —Trimble County Unit 2 60.75% 817 140 96Trimble County Units 5-6 71.00% 76 20 —Trimble County Units 7-10 63.00% 120 34 —Cane Run Unit 7 78.00% 431 31 4E.W. Brown Solar Unit 61.00% 16 1 —
Each subsidiary owning these interests provides its own funding for its share of the facility. Each receives a portion of the total output of the generating plants equal to its percentage ownership. The share of fuel and other operating costs associated withthe plants is included in the corresponding operating expenses on the Statements of Income.
13. Commitments and Contingencies
Energy Purchase Commitments (PPL, LKE, LG&E and KU)
LG&E and KU enter into purchase contracts to supply the coal and natural gas requirements for generation facilities and LG&E's retail natural gas supply operations. These contracts include the following commitments:
Contract Type yp
MaximumMaturity
Date NNatural Gas Fuel 2020 Natural Gas Retail Supply 2020Coal 2023 Coal Transportation and Fleeting Services 2027 NNatural Gas Transportation 2026
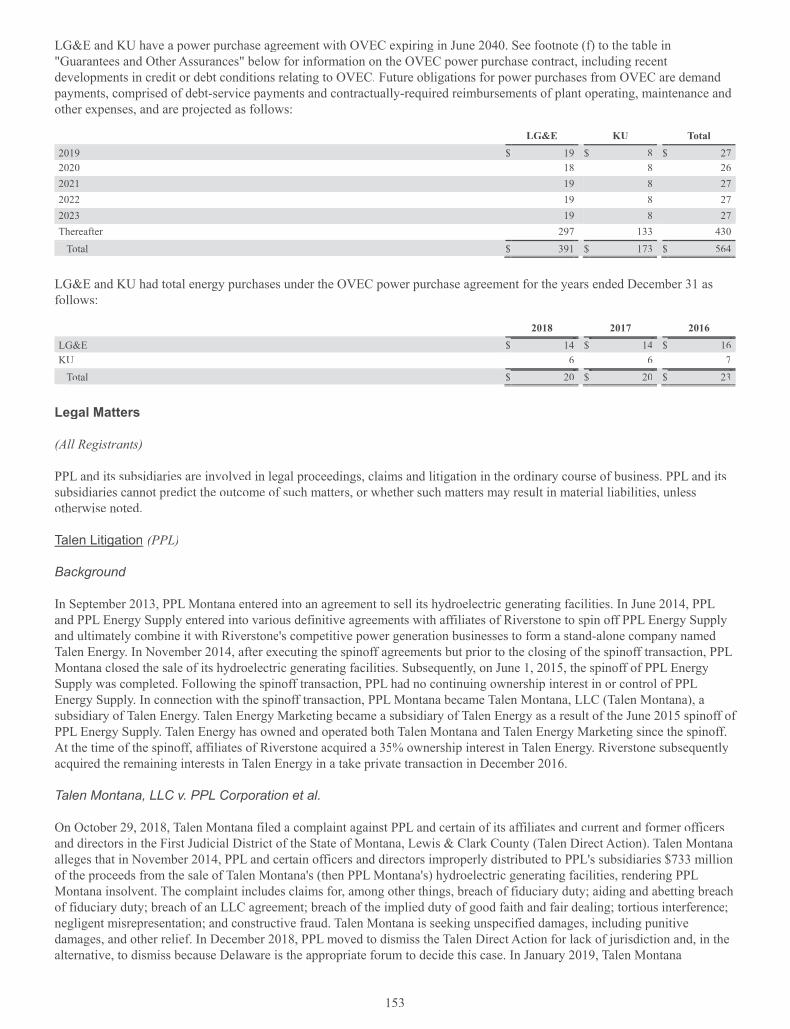
153
LG&E and KU have a power purchase agreement with OVEC expiring in June 2040. See footnote (f) to the table in x"Guarantees and Other Assurances" below for information on the OVEC power purchase contract, including recent developments in credit or debt conditions relating to OVEC. Future obligations for power purchases from OVEC are demand payments, comprised of debt-service payments and contractually-required reimbursements of plant operating, maintenance and other expenses, and are projected as follows:
LG&E KU Total 2019 $ 19 $ 8 $ 272020 18 8 262021 19 8 272022 19 8 272023 19 8 27Thereafter 297 133 430
Total $ 391 $ 173 $ 564
LG&E and KU had total energy purchases under the OVEC power purchase agreement for the years ended December 31 as follows:
2018 2017 2016 LG&E $ 14 $ 14 $ 16KU 6 6 7
Total $ 20 $ 20 $ 23
Legal Matters
(All Registrants)
PPL and its subsidiaries are involved in legal proceedings, claims and litigation in the ordinary course of business. PPL and its subsidiaries cannot predict the outcome of such matters, or whether such matters may result in material liabilities, unlessotherwise noted.
Talen Litigation (PPL)g
Background
In September 2013, PPL Montana entered into an agreement to sell its hydroelectric generating facilities. In June 2014, PPL and PPL Energy Supply entered into various definitive agreements with affiliates of Riverstone to spin off PPL Energy Supply and ultimately combine it with Riverstone's competitive power generation businesses to form a stand-alone company named Talen Energy. In November 2014, after executing the spinoff agreements but prior to the closing of the spinoff transaction, PPLMontana closed the sale of its hydroelectric generating facilities. Subsequently, on June 1, 2015, the spinoff of PPL Energy nSupply was completed. Following the spinoff transaction, PPL had no continuing ownership interest in or control of PPL Energy Supply. In connection with the spinoff transaction, PPL Montana became Talen Montana, LLC (Talen Montana), a subsidiary of Talen Energy. Talen Energy Marketing became a subsidiary of Talen Energy as a result of the June 2015 spinoff of PPL Energy Supply. Talen Energy has owned and operated both Talen Montana and Talen Energy Marketing since the spinoff.At the time of the spinoff, affiliates of Riverstone acquired a 35% ownership interest in Talen Energy. Riverstone subsequentlyacquired the remaining interests in Talen Energy in a take private transaction in December 2016.
Talen Montana, LLC v. PPL Corporation et al.
On October 29, 2018, Talen Montana filed a complaint against PPL and certain of its affiliates and current and former officersand directors in the First Judicial District of the State of Montana, Lewis & Clark County (Talen Direct Action). Talen Montanaalleges that in November 2014, PPL and certain officers and directors improperly distributed to PPL's subsidiaries $733 millionof the proceeds from the sale of Talen Montana's (then PPL Montana's) hydroelectric generating facilities, rendering PPL Montana insolvent. The complaint includes claims for, among other things, breach of fiduciary duty; aiding and abetting breach of fiduciary duty; breach of an LLC agreement; breach of the implied duty of good faith and fair dealing; tortious interference; negligent misrepresentation; and constructive fraud. Talen Montana is seeking unspecified damages, including punitivedamages, and other relief. In December 2018, PPL moved to dismiss the Talen Direct Action for lack of jurisdiction and, in the alternative, to dismiss because Delaware is the appropriate forum to decide this case. In January 2019, Talen Montana

154
dismissed without prejudice all current and former PPL Corporation directors from the case. The parties are proceeding withlimited jurisdictional discovery.
Talen Montana Retirement Plan and Talen Energy Marketing, LLC, Individually and on Behalf of All Others Similarly Situated v. PPL Corporation et al.
Also on October 29, 2018, Talen Montana Retirement Plan and Talen Energy Marketing filed a putative class action complaint on behalf of current and contingent creditors of Talen Montana who allegedly suffered harm or allegedly will suffer reasonablyforeseeable harm as a result of the November 2014 distribution. The action was filed in the Sixteenth Judicial District of the State of Montana, Rosebud County, against PPL and certain of its affiliates and current and former officers and directors (TalenPutative Class Action). The plaintiffs assert claims for, among other things, fraudulent transfer, both actual and constructive;recovery against subsequent transferees; civil conspiracy; aiding and abetting tortious conduct; and unjust enrichment. They are seeking avoidance of the purportedly fraudulent transfer, unspecified damages, including punitive damages, the imposition of a constructive trust, and other relief. In December 2018, PPL removed the Talen Putative Class Action from the Sixteenth LJudicial District of the State of Montana to the United States District Court for the District of Montana, Billings Division. In January 2019, the plaintiffs moved to remand the Talen Putative Class Action back to state court and dismissed without prejudice all current and former PPL Corporation directors from the case. The parties are proceeding with limited jurisdictional adiscovery in connection with the motion to remand.
PPL Corporation et al. vs. Riverstone Holdings LLC, Talen Energy Corporation et al.
On November 30, 2018, PPL, certain PPL affiliates, and certain current and former officers and directors (PPL plaintiffs) filed a dcomplaint in the Court of Chancery of the State of Delaware seeking various forms of relief against Riverstone, Talen Energy and certain of their affiliates (Delaware Action). In the complaint, the PPL plaintiffs ask the Delaware Court of Chancery for declaratory and injunctive relief. This includes a declaratory judgment that, under the separation agreement governing thespinoff of PPL Energy Supply, all related claims that arise must be heard in Delaware; that the statute of limitations inDelaware and the spinoff agreement bar these claims at this point; that PPL is not liable for the claims int either the Talen Direct Action or the Talen Putative Class Action as PPL Montana was solvent at all relevant times; and that the separation agreement requires that Talen Energy indemnify PPL for all losses arising from the debts of L Talen Montana, among other things. PPL's complaint also seeks damages against Riverstone for interfering with the separation agreement and against Riverstone affiliatesfor breach of the implied covenant of good faith and fair dealing.t In addition, the complaint asks the court to order, on behalf of creditors, the recovery of a $500 million "special cash dividend" that Riverstone extracted from Talen Energy in December 2017. On January 11, 2019, the PPL plaintiffs filed an amended complaint, adding claims related to indemnification with respect to the Talen Direct Action and the Talen Putative Class Action (together, the Montana Actions) and requested adeclaration that the Montana Actions are time-barred under the spinoff agreements. On February 11, 2019, the defendants filed ffmotions to dismiss the amended complaint.
With respect to each of the Talen-related matters described above, PPL believes that the 2014 distribution of proceeds was made in compliance with all applicable laws and that PPL Montana was solvent at all relevant times. Additionally, the agreements entered into in connection with the spinoff, which PPL and affiliates of Tah len Energy and Riverstone negotiated and executed prior to the 2014 distribution, directly address the treatment of the proceeds from the sale of PPL Montana's hydroelectric generating facilities; in those agreements, Talen Energy and Riverstone definitively agreed that PPL was entitledto retain the proceeds.
PPL believes that it has meritorious defenses to the claims made in the Montana Actions and intends to vigorously defend against these actions. The Montana Actions and the Delaware Action are all in the early stages of litigation; at this time, PPLcannot predict the outcome of these matters or estimate the range of possible lof sses, if any, that PPL might incur as a result of the claims, although they could be material.
(PPL, LKE and LG&E)
Cane Run Environmental Claims
In December 2013, six residents, on behalf of themselves and others similarly situated, filed a class action complaint against LG&E and PPL in the U.S. District Court for the Western District of Kentucky (U.S. District Court) tt alleging violations of theClean Air Act, RCRA, and common law claims of nuisance, trespass and negligence. These plaintiffs seek injunctive relief and civil penalties, plus costs and attorney fees, for the alleged statutory violations.ff Under the common law claims, these plaintiffsseek monetary compensation and punitive damages for property damage and diminished property values for a class consistingof residents within four miles of the Cane Run plant, which retired three coal-fired units in 2015. In their individual capacities,

155
these plaintiffs sought compensation for alleged adverse health effects. In July 2014, the court dismissed the RCRA claims and ffall but one Clean Air Act claim, but declined to dismiss the common law tort claims. In November 2016, the plaintiffs filed anamended complaint removing the personal injury claims and removing certain previously named plaintiffs. In February 2017,the U.S. District Court issued an Order dismissing PPL as a defendant and dismissing the final federal claim against LG&E. In April 2017, the U.S. District Court issued an Order declining to exercise supplemental jurisdiction on the state law claims anddismissed the case in its entirety. In June 2017, the plaintiffs filed a class action complaint in Jefferson County, KentuckyCircuit Court, against LG&E alleging state law nuisance, negligence and trespass tort claims. The plaintiffs seek compensatoryand punitive damages for alleged property damage due to purported plant emissions on behalf of a class of residents within one to three miles of the plant. Proceedings are currently underway regarding potential class certification, for which a decision maybe rendered in 2019. PPL, LKE and LG&E cannot predict the outcome of this matter and an estimate or range of possiblelosses cannot be determined.
(PPL, LKE and KU)
E.W. Brown Environmental Claims
On July 12, 2017, the Kentucky Waterways Alliance and the Sierra Club filed a citizen suit complaint against KU in the U.S. District Court for the Eastern District of Kentucky (U.S. District Court) alleging discharges at the E.W. Brown plant in violation of the Clean Water Act and the plant's water discharge permit and alleging contamination that may present an imminent and substantial endangerment in violation of the RCRA. The plaintiffs' suit relates to prior notices of intent to file a citizen suit submitted in October and November 2015 and October 2016. Thr ese plaintiffs sought injunctive relief ordering KUnto take all actions necessary to comply with the Clean Water Act and RCRA, including ceasing the discharges in question,abating effects associated with prior discharges and eliminating the alleged imminent and substantial endangerment. Theseplaintiffs also sought assessment of civil penalties and an award of litigation costs and attorney fees. On December 28, 2017 thettU.S. District Court issued an Order dismissing the Clean Water Act and RCRA complaints against KU in their entirety. OnJanuary 26, 2018, the plaintiffs appealed the dismissal Order to the U.S. Court of Appeals for the Sixth Circuit. On September A24, 2018, the U.S. Court of Appeals for the Sixth Circuit issued its ruling affirming the lower court's decision to dismiss theClean Water Act claims and reversing its dismissal of the RCRA claims against KU and remanding the latter to the U.S. District Court. On October 9, 2018, KU filed a petition for rehearing to the U.S. Court of Appeals for the Sixth Circuit regarding theRCRA claims. On November 27, 2018, the U.S. Court of Appeals for the Sixth Circuit denied KU's petition for rehearing regarding the RCRA claims. On January 8, 2019, KU filed an answer to plaintiffs’ complaint in the U.S. District Court.PPL, LKE and KU cannot predict the outcome of these matters and an estimate or range of possible losses cannot be determined.
KU is undertaking extensive remedial measures at the E.W. Brown plant including closure of the former ash pond, implementation of a groundwater remedial action plan and performance of a corrective action planrr including aquatic study of nadjacent surface waters and risk assessment. The aquatic study and risk assessment are being undertaken pursuant to a 2017agreed Order with the Kentucky Energy and Environment Cabinet (KEEC). KU conducted sampling of Herrington Lake in2017 and 2018. A final report of KU's findings is expected to be submitted to the KEEC in 2019. KU believes that current and planned measures for the E.W. Brown plant, including closure of impoundments, cessation of certain discharges and deployment of new discharge controls, are sufficient to ensure compliance with applicable requirements. However, until completion of the aquatic study and related assessments and issuance of regulatory determinations by the KEEC, PPL, LKEand KU are unable to determine whether additional remedial measures will be required at the E.W. Brown plant.
(All Registrants)
Regulatory Issues
See Note 7 for information on regulatory matters related to utility rate regulation.
Electricity - Reliability Standardsy y
The NERC is responsible for establishing and enforcing mandatory reliability standards (Reliability Standards) regarding the bulk electric system in North America. The FERC oversees this process and independently enforces the Reliability Standards.
The Reliability Standards have the force and effect of law and apply to certain users of the bulk electric system, includingelectric utility companies, generators and marketers. Under the Federal Power Act, the FERC may assess civil penalties for certain violations.

156
PPL Electric, LG&E and KU monitor their compliance with the Reliability Standards and self-report or self-log potentialviolations of applicable reliability requirements whenever identified, and submit accompanying mitigation plans, as required.The resolution of a small number of potential violations is pending. Penalties incurred to date have not been significant. AnyRegional Reliability Entity (including RFC or SERC) determination concerning the resolution of violations of the Reliability Standards remains subject to the approval of the NERC and the FERC.
In the course of implementing their programs to ensure compliance with the Reliability Standards by those PPL affiliatessubject to the standards, certain other instances of potential non-compliance may be identified from time to time. TheRegistrants cannot predict the outcome of these matters, and an estimate or range of possiblen losses cannot be determined.
Environmental Matters
(All Registrants)
Due to the environmental issues discussed below or other environmental matters, it may be necessary for the Registrants tomodify, curtail, replace or cease operation of certain facilities or performance of certain operations to comply with statutes,regulations and other requirements of regulatory bodies or courts. In addition, legal challenges to new environmental permits or rules add to the uncertainty of estimating the future cost of these permits and rules. Finally, the regulatory reviews specified in the President's March 2017 Executive Order (the March 2017 Executive Order) promoting energy independence and economic growth could result in future regulatory changes and additional uncertainty.
WPD's distribution businesses are subject to certain statutory and regulatory environmental requirements. It may be necessaryfor WPD to incur significant compliance costs, which costs may be recoverable through rates subject to the approval of Ofgem. PPL believes that WPD has taken and continues to take measures to comply with all applicable environmental laws and regulations.
LG&E and KU are entitled to recover, through the ECR mechanism, certain costs of complying with the Clean Air Act, as amended, and those federal, state or local environmental requirements applicable to coal combustion wastes and by-productsfrom facilities that generate electricity from coal in accordance with approved compliance plans. Costs not covered by the ECR mechanism for LG&E and KU and all such costs for PPL Electric are subject to rate recovery before u the companies' respectivestate regulatory authorities, or the FERC, if applicable. Because neither WPD nor PPL Electric owns any generating plants, Ltheir exposure to related environmental compliance costs is reduced. PPL, PPL Electric, LKE, LG&E and KU can provide noassurances as to the ultimate outcome of future environmental or rate proceedings before regulatory authorities.
Air
(PPL, LKE, LG&E and KU)
NAAQS
The Clean Air Act, which regulates air pollutants from mobile and stationary sources in the United States, has a significant impact on the operation of fossil fuel generation plants. Among other things, the Clean Air Act requires the EPA periodically toreview and establish concentration levels in the ambient air for six pollutants to protect public health and welfare. The six pollutants are carbon monoxide, lead, nitrogen dioxide, ozone (contributed to by nitrogen oxide emissions), particulate matter and sulfur dioxide. The established concentration levels for these six pollutants are known as NAAQS. Under the Clean Air Act, the EPA is required to reassess the NAAQS on a five-year schedule.
Federal environmental regulations of these six pollutants require states to adopt implementation plans, known as state implementation plans, which detail how the state will attain the standards that are mandated by the relevant law or regulation.Each state identifies the areas within its boundaries that meet the NAAQS (attainment areas) and those that do not (non-attainment areas), and must develop a state implementation plan both to bring non-attainment areas into compliance with the NAAQS and to maintain good air quality in attainment areas. In addition, for attainment of ozone and fine particulatesstandards, states in the eastern portion of the country, including Kentucky, are subject to a regional program developed by theEPA known as the Cross-State Air Pollution Rule. The NAAQS, future revisions to the NAAQt S and state implementationplans, or future revisions to regional programs, may require installation of additional pollution controls, the costs of which PPL,LKE, LG&E and KU believe are subject to cost recovery.
157
Although PPL, LKE, LG&E and KU do not anticipate significant costs to comply with these programs, changes in market or operating conditions could result in different costs than anticipated.
Ozone
The EPA issued the current ozone standard in October 2015. The states and the EPA are required to determine (based on ambient air monitoring data) those areas that meet the standard and those that are in nonattainment. The EPA was scheduled to designate areas as being in attainment or nonattainment of the current ozone standard by no later than October 2017 which was uuto be followed by further regulatory proceedings identifying compliance measures and deadlines. However, the current implementation and compliance schedule is uncertain because the EPA failed to make nonattainment designations by theapplicable deadline. In addition, some industry groups have requested the EPA to defer implementation of the 2015 ozone standard, but the EPA has not yet acted on this request. Although implementation of the 2015 ozone standard could potentiallyrequire the addition of SCRs at some LG&E and KU generating units, PPL, LKE, LG&E and KU are currently unable to determine what the compliance measures and deadlines may ultimately be with respect to the new standard.
States are also obligated to address interstate transport issues associated with ozone standards through the establishment of "good neighbor" state implementation plans for those states that are found to contribute significantly to another state's non-attainment. As a result of a partial consent decree addressing claims regarding federal implementation, the EPA and severalstates, including Kentucky, have evaluated the need for further nitrogen oxide reductions from fossil-fueled plants to addressinterstate impacts. On August 23, 2018, Kentucky submitted a proposed state implementation plan finding that no additionalreductions beyond existing and planned controls set forth in Kentucky's existing State Implementation Plan are necessary toprevent Kentucky from contributing significantly to any other state's nonattainment. On September 14, 2018, the EPA announced its denial of petitions filed by Maryland and Delaware alleging that the states including Kentucky and Pennsylvaniacontribute to nonattainment in the petitioning states. PPL, LKE, LG&E, and KU are unable to predict the outcome of ongoing and future evaluations by the EPA and the states, or whether such evaluations could potentially result in requirements for nitrogen oxide reductions beyond those currently required under the Cross-State Air Pollution Rule.
Sulfur Dioxide
In 2010, the EPA issued the current NAAQS for sulfur dioxide and required states to identify areas that meet those standards and areas that are in nonattainment. In July 2013, the EPA finalized nonattainment designations for parts of the country, including part of Jefferson County in Kentucky. As a result of scrubber replacements completed by LG&E at the Mill Creek plant in 2016, all Jefferson County monitors now indicate compliance with the sulfur dioxide standards. Additionally, LG&E accepted a new sulfur dioxide emission limit to ensure continuing compliance with the NAAQS. PPL, LKE, LG&E and KU do not anticipate any further measures to achieve compliance with the new sulfur dioxide standards.
MATS
On December 28, 2018, the EPA proposed to revise its previous finding that regulation of hazardous air emissions from coal- and oil-fired electric generating units is justified and instead find that the agency erred ind determining such regulation is“appropriate and necessary” due to mistakes in its regulatory cost-benefit analysis. As a result of its review of relevant precedent, the EPA further proposed not to remove the coal- and oil-fired electric generating unit source category from the list of sources that must be regulated under Section 112 of the Clean Air Act and leave existing emission standards in place. Finally, the EPA proposed to find that the results of its residual risk and technology review indicate that residual risk due to air toxicemissions from this source category is acceptable and current standards provide an ample margin of safety to protect publichealth. LG&E and KU have completed installation of controls at their plants as necessary to achieve compliance with the applicable provision of MATS. It is not possible to predict the outcome of the pending regulatory proceedings includingwhether existing standards may be repealed, or the resulting impacts on plant operations, financial condition or results of operations.
Climate Change
There is continuing world-wide attention focused on issues related to climate change. In June 2016, President Obamaannounced that the United States, Canada and Mexico established the North American Climate, Clean Energy, and Environment Partnership Plan, which specifies actions to promote clean energy, address climate change and protect theenvironment. The plan includes a goal to provide 50% of the energy used in North America from clean energy sources by 2025. The plan does not impose any nation-specific requirements.
158
In December 2015, 195 nations, including the U.S., signed the Paris Agreement on Climate, which establishes a comprehensiveframework for the reduction of GHG emissions from both developed and developing nations. Although the agreement does not establish binding reduction requirements, it requires each nation to prepare, communicate, and maintain GHG reduction commitments. Reductions can be achieved in a variety of ways, including energy conservation, power plant efficiencyimprovements, reduced utilization of coal-fired generation or replacing coal-fired generation with natural gas or renewable generation. Based on the EPA's rules issued in 2015 imposing GHG emission standardsd for both new and existing power plants, the U.S. committed to an initial reduction target of 26% to 28% below 2005 levels by 2025. However, on June 1, 2017, President Trump announced a plan to withdraw from the Paris Agreement and undertake negotiations to reenter the current agreement or enter a new agreement on terms more favorable to the U.S. Under the terms of the Paris Agreement, any U.S. withdrawal would not be complete until November 2020.
Additionally, the March 2017 Executive Order directed the EPA to review its 2015 greenhouse gas rules for consistency withcertain policy directives and suspend, revise, or rescind those rules as appropriate. The March 2017 Executive Order alsodirects rescission of specified guidance, directives, and prior Presidential actions regarding climate change. PPL, LKE, LG&Eand KU cannot predict the outcome of such regulatory actions or the impact, if any, on plant operations, rate treatment or future uucapital or operating needs.
The U.K. has enacted binding carbon reduction requirements that are applicable to WPD. Under the U.K. law, WPD must purchase carbon allowances to offset emissions associated with WPD's operations. The cost of these allowances is not significant and is included in WPD's current operating expenses.
The EPA's Rules under Section 111 of the Clean Air Act including the EPA's Proposed Affordable Clean Energy Rule
In 2015 the EPA finalized rules imposing GHG emission standards for both new and existing power plants and had proposed a federal implementation plan that would apply to any states that failed to submit an acceptable state implementation plan toreduce GHG emissions on a state-by-state basis (the Clean Power Plan).
Following legal challenges to the Clean Power Plan, a stay of those rules by the U.S. Supreme Court and the March 2017Executive Order requiring the EPA to review the Clean Power Plan in October 2017, the EPA proposed to rescind the CleanPower Plan. On August 21, 2018, the EPA proposed the Affordable Clean Energy (ACE) Rule as a replacement for the CleanPower Plan pertaining to existing sources. The ACE Rule would give states broad latitude in establishing emission guidelines providing for plant-specific efficiency upgrades or "heat-rate improvements" that would reducmm e GHG emissions per unit of electricity generated. The ACE Rule proposes a list of "candidate technologies" that would be considered in establishing standards of performance at individual power plants. The ACE Rule also proposes new criteria for determining whether such efficiency projects would trigger New Source Review and thus be subject to more stringent emission controls.
In April 2014, the Kentucky General Assembly passed legislation limiting the measures that the Kentucky Energy and Environment Cabinet may consider in setting performance standards to comply with the Clean Power Plan, if enacted. Thelegislation provides that such state GHG performance standards will be based on emission reductions, efficiency measures and other improvements available at each power plant, rather than renewable energy, end-use energy efficiency, fuel switching and re-dispatch. These statutory restrictions are broadly consistent with the EPA's proposed ACE Rule.PP
LG&E and KU are monitoring developments at the state and federal level. Until the ACE Rule is finalized and the statedetermines implementation measures, PPL, LKE, LG&E and KU cannot predict the potential impact, if any, on plant mmoperations, future capital or operating costs. PPL, LKE, LG&E and KU believe that the costs, which could be significant, would be subject to rate recovery.
Sulfuric Acid Mist Emissions (PPL, LKE and LG&E)
In June 2016, the EPA issued a notice of violation under the Clean Air Act alleging that LG&E violated applicable rules relating to sulfuric acid mist emissions at its Mill Creek plant. The notice alleges failure to install proper controls, failure to operate the facility consistent with good air pollution control practice, and causing emissions exceeding applicable requirements or constituting a nuisance or endangerment. LG&E believes it has complied with applicable regulations during the relevant time period. Discussions between the EPA and LG&E are ongoing. The parties have entered into a tolling agreement with respect tothis matter through June 2019. PPL, LKE and LG&E are unable to predict the outcome of this matter or the potential impact on operations of the Mill Creek plant, including increased capital or operating costs, and potential civil penalties or remedialmeasures, if any.
159
Water/Waste
(PPL, LKE, LG&E and KU)
CCRs
In April 2015, the EPA published its final rule regulating CCRs. CCRs include fly ash, bottom ash and sulfur dioxide scrubber wastes. The rule became effective in October 2015. It imposes extensive new requirements, including location restrictions, design and operating standards, groundwater monitoring and corrective action requirements, and closure and post-closure carerequirements on CCR impoundments and landfills that are located on active power plantsff in the United States and not closed.Under the rule, CCRs are regulated as non-hazardous under Subtitle D of RCRA and beneficial use of CCRs is allowed, with some restrictions. The rule's requirements for covered CCR impoundments and landfills include implementation of groundwater monitoring and commencement or completion of closure activities generally between three and ten years from certain triggering events. The rule requires posting of compliance documentation on a publicly accessible website. Industry groups, environmental groups, individual companies and others have filed legal challenges to the final rule, which are pending before the D.C. Circuit Court of Appeals. On March 1, 2018, the EPA proposed amendments to the CCR rule primarily relatingto impoundment closure and remediation requirements. On July 30, 2018, the EPA published in the Federal Register a final ruleextending the deadline for closure of certain impoundments to October 2020 and adopting substantive changes relating to certifications, suspensions of groundwater monitoring and groundwater protection standards for certain constituents. The EPA rhas announced that additional amendments to the rule will be proposed. On August 21, 2018, the D.C. Circuit Court of Appealsvacated and remanded portions of the CCR rule including provisions allowing unlined impoundments to continue operating and exempting inactive impoundments at inactive plants from regulation. PPL, LKE, LG&E and KU are unable to predict theoutcome of the ongoing rulemaking or potential impacts on current LG&E and KU compliance plans. The Registrants areucurrently finalizing closure plans and schedules.
In January 2017, Kentucky issued a new state rule relating to CCR matters, effective May 2017, aimed at reflecting the requirements of the federal CCR rule. In May 2017, a resident adjacent to LG&E's and KU's Trimble County plant filed a lawsuit in Franklin County, Kentucky Circuit Court against the Kentucky Energy and Environmental Cabinet and LG&Eseeking to invalidate the new rule. On January 31, 2018, the state court issued an opinion invalidating certain proceduralelements of the new rule but finding the substantive requirements of the new rule to be consistent with those of the federal CCR rule. This ruling was not appealed by any party to the litigation and is now final. Accordingly, LG&E and KU presently operate their facilities under continuing permits authorized via the former program and do not currently anticipate material impacts as a result of the judicial ruling. Separately, in December 2016, federal legislation was enacted that authorized the EPA to approveequally protective state programs that would operate in lieu of the CCR rule. The Kentucky Energy and Environmental Cabinet has indicated it may propose rules under such authority in the future.
LG&E and KU received KPSC approval for a compliance plan providing for the closure of impoundments at the Mill Creek,Trimble County, E.W. Brown, and Ghent stations, and construction of process water management facilities at those plants. Inaddition to the foregoing measures required for compliance with the federal CCR rule, KU also received KPSC approval for itsplans to close impoundments at the retired Green River, Pineville and Tyrone plants to comply with applicable state law. OnJanuary 26, 2018, KU filed an application requesting a CPCN and approval of amendments to the second phase of its compliance plan for the landfill at the E.W. Brown station. On July 9, 2018, the KPSC granted approval to KU for amendmentsto the second phase of its compliance plan for the landfill at the E.W. Brown station.
In connection with the final CCR rule, LG&E and KU recorded adjustments to existing AROs beginning in 2015, and continueto record adjustments as required. See Note 19 for additional information. Further changes to AROs, current capital plans or operating costs may be required as estimates are refined based on closure developments, groundwater monitoring results, and regulatory or legal proceedings. Costs relating to this rule are subject to rate recovery.
Clean Water Act
Regulations under the federal Clean Water Act dictate permitting and mitigation requirements for facilities and construction projects in the United States. Many of those requirements relate to power plant operations, including requirements related to the tttreatment of pollutants in effluents prior to discharge, the temperature of effluent discharges and the location, design and construction of cooling water intake structures at generating facilities, standards intended to protect aquatic organisms that become trapped at or pulled through cooling water intake structures at generating facilities. The requirements could impose significant costs for LG&E and KU, which are subject to rate recovery.

160
Litigation is currently pending in various courts relating to whether Clean Water Act jurisdiction covers discharges of contaminated groundwater that reach surface water via a direct hydrologic connection. Courts in different jurisdictions have come to contrary conclusions in the past. On February 20, 2018, the EPA issued a notice requesting comment on the scope of discharges subject to regulation under the Clean Water Act. Specifically, the EPA seeks comments on whether Clean Water Act jurisdiction should cover discharges to groundwater that reach surface water via a direct hydrologic connection. Extending Clean Water Act jurisdiction to such discharges could potentially subject certain releases from CCR impoundments toadditional permitting and remediation requirements. PPL, LKE, LG&E and KU are unable to predict the future regulatory developments or potential impacts on current LG&E and KU compliance plans.
ELGs
In September 2015, the EPA released its final ELGs for wastewater discharge permits for new and existing steam electric generating facilities. The rule provides strict technology-based discharge limitations for control of pollutants in scrubber wastewater, fly ash and bottom ash transport water, mercury control wastewater, gasification wastewater and combustion residual leachate. The new guidelines require deployment of additional control technologies providing physical, chemical and biological treatment of wastewaters. The guidelines also mandate operational changes including "no discharge" requirementsfor fly ash and bottom ash transport waters and mercury control wastewaters. The implementation date for individualgenerating stations will be determined by the states on a case-by-case basis according to criteria provided by the EPA. Industry rrgroups, environmental groups, individual companies and others have filed legal challenges to the final rule, which have been consolidated before the U.S. Court of Appeals for the Fifth Circuit. In April 2017, the EPA announced that it would grant PPpetitions for reconsideration of the rule. In September 2017, the EPA published in the Federal Register a proposed rule that would postpone the compliance date for requirements relating to bottom ash transport waters and scrubber wastewatersdischarge limits. The EPA expects to complete its reconsideration of best available technology standards by the fall of 2020. fUpon completion of the ongoing regulatory proceedings, the rule will be implemented by the states in the course of their normal permitting activities. LG&E and KU are developing compliance strategies and schedules. PPL, LKE, LG&E and KU are unable to predict the outcome of the EPA's pending reconsideration of the rule or fully estimate compliance costs or timing. Additionally, certain aspects of these compliance plans and estimates relate to developments in state water quality standards,which are separate from the ELG rule or its implementation. Costs to comply with ELGs orm other discharge limits are expectedrto be significant. Certain costs are included in the Registrants' capital plans and are subject to rate recovery.
Seepages and Groundwater Infiltration
In addition to the actions described above, LG&E and KU have completed, or are completing, assessments of seepages or groundwater infiltration at various facilities and have completed, or are working with agencies to implement, further testing, monitoring or abatement measures, where applicable. Depending on the circumstances in each case, certain costs, which maybe subject to rate recovery, could be significant. LG&E and KU cannot currently estimate a possible loss or range of possible losses related to this matter.
(All Registrants)
Other Issues
In June 2016, the Frank Lautenberg Chemical Safety Act took effect as an amendment to k the Toxic Substance Control Act (TSCA). The Act made no changes to the pre-existing TSCA rules as it pertains to polychlorinated biphenyls (PCB). Registrants have been concerned that the EPA may issue a rule under TSCA relating to the use of PCBs in electrical equipment and natural gas pipelines, as well as continued use of PCB-contaminated porous surfaces which may affect Registrants' facilities in the United States, including phase-out of some or all equipment containing PCBs. The costs of such a phase-out, which are subject to rate recovery, could be significant. However, the EPA has continued to defer undertaking the rule-making nof concern and no such rulemaking is on the EPA's rulemaking docket.
Superfund and Other Remediationp
PPL Electric, LG&E and KU are potentially responsible for investigating, responding to agency inquiries, implementingvarious preventative measures, and/or remediating contamination under programs other than those described in the sectionsabove. These include a number of former coal gas manufacturing plants in Pennsylvania and Kentucky previously owned or operated or currently owned by predecessors or affiliates of PPL Electric, LG&E and KU. To date, the costs of these sites have not been significant.

161
There are additional sites, formerly owned or operated by PPL Electric, LG&E and KU predecessors or affiliates. PPL Electric,LG&E and KU lack sufficient information about such additional sites to estimate any potential liability they may have or a range of reasonably possible losses, if any, related to these matters.
PPL Electric is potentially responsible for a share of the costs at several sites listed by the EPA under the federal Superfundprogram, including the Columbia Gas Plant site and the Brodhead site. Clean-up actions have been or are being undertaken at all of these sites, the costs of which have not been, and are not expected to be, significant to PPL Electric.
The EPA is evaluating the risks associated with polycyclic aromatic hydrocarbons and naphthalene, chemical by-products of coal gas manufacturing. As a result of the EPA's evaluation, individual states may establish stricter standards for water qualityand soil cleanup. This could require several PPL subsidiaries to take more extensive assessment and remedial actions at former coal gas manufacturing plants. PPL, PPL Electric, LKE, LG&E and KU cannot estimate a range of reasonably possible losses,if any, related to these matters.
From time to time, PPL's subsidiaries in the United States undertake testing, monitoring or remedial action in response tonotices of violations, spills or other releases at various on-site and off-site locations, negotiate with the EPA and state and localdagencies regarding actions necessary to comply with applicable requirements, negotiate with property owners and other third parties alleging impacts from PPL's operations and undertake similar actions necessary to resolve environmental matters that arise in the course of normal operations. Based on analyses to date, resolution of these environmental matters is not expected tohave a significant adverse impact on the operations of PPL Electric, LG&E and KU.
As of December 31, 2018 and December 31, 2017, PPL Electric had a recorded liability of $11 million and $10 million representing its best estimate of the probable loss incurred to remediate the sites identified in this section. Depending on the outcome of investigations at identified sites where investigations have not begun or been completed, or developments at sitesfor which information is incomplete, additional costs of remediation could be incurred; however, such costs are not expected tobe significant.
Future cleanup or remediation work at sites not yet identified may result in significant additional costs for PPL, PPL Electric, LKE, LG&E and KU. Insurance policies maintained by LKE, LG&E and KU may be available to cover certain of the costs or other obligations related to these matters but the amount of insurance coverage or reimbursement cannot be estimated or assured.
Other
Labor Union Agreementsg
(LKE and KU)
In August 2018, KU and the IBEW ratified a three-year labor agreement through August 2021. The agreement covers rapproximately 68 employees. The agreement includes a wage reopener in 2020. The terms of the new labor agreement are not expected to have a significant impact on the financial results of LKE or KU.
The Registrants cannot predict the outcome of future union labor negotiations.
Separation Benefitsp
(PPL and PPL Electric)
In June 2018, PPL EU Services announced it was reorganizing its IT organization into the following new areas: planning, operations, data and information management and IT transformation. Organizational plans and staffing selections for the new ffIT organization were substantially completed in the third quarter of 2018 which reduced the number of contractors and PPL EUServices’ employees in IT. Affected employees had the option of joining a managed services vendor, applying for a newlycreated position in IT or opting for severance. As a result, for the twelve months ended December 31, 2018, estimated charges for separation benefits of $6 million, which were primarily allocated to PPL Electric, relating to 86 displaced PPL EU Services’ IT employees, was recorded in “Other operation and maintenance” on the Statement of Income and in “Other current liabilities” on the Balance Sheet. The separation benefits include cash severance compensation, lump sum COBRA reimbursement payments, outplacement services and accelerated stock award vesting and were primarily paid in 2018.
162
Guarantees and Other Assurances
(All Registrants)
In the normal course of business, the Registrants enter into agreements that provide financial performance assurance to third parties on behalf of certain subsidiaries. Such agreements include, for example, guarantees, stand-by letters of y credit issued byfinancial institutions and surety bonds issued by insurance companies. These agreements are entered into primarily to support or enhance the creditworthiness attributed to a subsidiary on a stand-alone basis or to facilitate the commercial activities inwhich these subsidiaries engage.
(PPL)
PPL fully and unconditionally guarantees all of the debt securities of PPL Capital Funding. f
(All Registrants)
The table below details guarantees provided as of December 31, 2018. "Exposure" represents the estimated maximum potential amount of future payments that could be required to be made under the guarantee. The probability of expected payment/performance under each of these guarantees is remote except for "WPD guarantee of pension and other obligations of unconsolidated entities." The total recorded liability at December 31, 2018 was $6 million for PPL. The total recorded liability ttat December 31, 2017 was $17 million for PPL and $11 million for LKE. For reporting purposes, on a consolidated basis, allguarantees of PPL Electric, LKE, LG&E and KU also apply to PPL, and all guarantees of LG&E and KU also apply to LKE.
Exposure atDecember 31,
2018 Expiration
DatePPL Indemnifications related to the WPD Midlands acquisition (a)WPD indemnifications for entities in liquidation and sales of assets $ 10 (b) 2020 WPD guarantee of pension and other obligations of unconsolidated entities 80 (c)PPL Electric Guarantee of inventory value 8 (d) 2020 LKE Indemnification of lease termination and other divestitures 200 (e) 2021 LG&E and KU LG&E and KU obligation of shortfall related to OVEC (f)
(a) Indemnifications related to certain liabilities, including a specific unresolved tax issue and those relating to properties and assets owned by the seller that were transferred to WPD Midlands in connection with the acquisition. A cross indemnity has been received from the seller on the tax issue. The maximum exposure and expiration of these indemnifications cannot be estimated because the maximum potential liability is not capped and theexpiration date is not specified in the transaction documents.
(b) Indemnification to the liquidators and certain others for existing liabilities or expenses or liabilities arising during the liquidation process. Theindemnifications are limited to distributions made from the subsidiary to its parent either prior or subsequent to liquidation or are not explicitly stated inthe agreements. The indemnifications generally expire two to seven years subsequent to the date of dissolution of the entities. The exposure noted only includes those cases where the agreements provide for specific limits.
In connection with their sales of various businesses, WPD and its affiliates have provided the purchasers with indemnifications that are standard for suchtransactions, including indemnifications for certain pre-existing liabilities and environmental and tax matters or have agreed to continue their obligations under existing third-party guarantees, either for a set period of time following the transactions or upon the condition that the purchasers make reasonableefforts to terminate the guarantees. Additionally, WPD and its affiliates remain secondarily responsible for lease payments under certain leases that theyhave assigned to third parties.
(c) Relates to certain obligations of discontinued or modified electric associations that were guaranteed at the time of privatization by the participating members. Costs are allocated to the members and can be reallocated if an existing member becomes insolvent. At December 31, 2018, WPD has recorded an estimated discounted liability for which the expected payment/performance is probable. Neither the expiration date nor the maximum amount of potential payments for certain obligations is explicitly stated in the related agreements, and as a result, the exposure has been estimated.
(d) A third party logistics firm provides inventory procurement and fulfillment services. The logistics firm has title to the inventory, however, upon termination of the contracts, PPL Electric has guaranteed to purchase any remaining inventory that has not been used or sold. In January 2018, this agreement was superseded by a new contract which extends the guarantee until 2020.
(e) LKE provides certain indemnifications covering the due and punctual payment, performance and discharge by each party of its respective obligations.The most comprehensive of these guarantees is the LKE guarantee covering operational, regulatory and environmental commitments and indemnifications made by WKE under a 2009 Transaction Termination Agreement. This guarantee has a term of 12 years ending July 2021, and a maximum exposure of $200 million, exclusive of certain items such as government fines and penalties that may exceed the maximum. Additionally, LKE has indemnified various third parties related to historical obligations for other divested subsidiaries and affiliates. The indemnifications vary by entity and the maximum exposures range from being capped at the sale price to no specified maximum. LKE could be required to perform on these indemnifications
163
in the event of covered losses or liabilities being claimed by an indemnified party. LKE cannot predict the ultimate outcomes of the variousindemnification scenarios, but does not expect such outcomes to result in significant losses above the amounts recorded.
(f) Pursuant to the OVEC power purchase contract, LG&E and KU are obligated to pay for their share of OVEC's excess debt service, post-retirement and decommissioning costs, as well as any shortfall from amounts included within a demand charge designed and expected to cover these costs over the term of the contract. LKE's proportionate share of OVEC's outstanding debt was $113 million at December 31, 2018, consisting of LG&E's share of $78 million and KU's share of $35 million. The maximum exposure and the expiration date of these potential obligations are not presently determinable. See"Energy Purchase Commitments" above for additional information on the OVEC power purchase contract.
In March 2018, a sponsor with a pro-rata share of certain OVEC obligations of 4.85% filed for bankruptcy under Chapter 11 and, in August 2018, received a rejection Order for the OVEC power purchase contract in the bankruptcy proceeding. OVEC and certain sponsors are appealing this action, in addition to pursuing appropriate rejection claims in the bankruptcy proceeding. OVEC and certain of its sponsors, including LG&E and KU, areanalyzing certain potential additional credit support actions to preserve OVEC's access to credit markets or mitigate risks or adverse impacts relatingthereto, including increased interest costs, establishing or continuing debt reserve accounts or other changes involving OVEC's existing short and long-term debt. The ultimate outcome of these matters, including the sponsor bankruptcy and related proceedings and any other potential impact on LG&E'sand KU's obligations relating to OVEC debt under the power purchase contract cannot be predicted.
The Registrants provide other miscellaneous guarantees through contracts entered into in the normal course of business. These guarantees are primarily in the form of indemnification or warranties related to services or equipment and vary in duration. Theamounts of these guarantees often are not explicitly stated, and the overall maximum amount of the obligation under suchguarantees cannot be reasonably estimated. Historically, no significant payments have been made with respect to these types of guarantees and the probability of payment/performance under these guarantees is remote.
PPL, on behalf of itself and certain of its subsidiaries, maintains insurance that covers liability assumed under contract for bodily injury and property damage. The coverage provides maximum aggregate coverage of $225 million. This insurance maybe applicable to obligations under certain of these contractual arrangements.
14. Related Party Transactions
Wholesale Sales and Purchases (LG&E and KU)
LG&E and KU jointly dispatch their generation units with the lowest cost generation used to serve their retail customers. When LG&E has excess generation capacity after serving its own retail customers and its generation cost is lower than that of KU, KU purchases electricity from LG&E and vice versa. These transactions are reflected in the Statements of Income as "Electric revenue from affiliate" and "Energy purchases from affiliate" and are recorded at a price equal to the seller's fuel cost plus anysplit savings. Savings realized from such intercompany transactions are shared equally between both companies. The volume of energy each company has to sell to the other is dependent on its retail customers' needs and its available generation.
Support Costs (PPL Electric, LKE, LG&E and KU)
PPL Services, PPL EU Services and LKS provide PPL, PPL Electric and LKE, their respective subsidiaries, including LG&E and KU, and each other with administrative, management and support services. For all service companies, the costs of theseservices are charged to the respective recipients as direct support costs. General costs that cannot be directly attributed tot a specific entity are allocated and charged to the respective recipients as indirect support costs. PPL Services and PPL EUServices use a three-factor methodology that includes the applicable recipients' invested capital, operation and maintenance expenses and number of employees to allocate indirect costs. PPL Services may also use a ratio of overall direct and indirect costs or a weighted average cost ratio. LKS bases its indirect allocations on the subsidiaries' number of employees, total assets, revenues, number of customers and/or other statistical information. PPL Services, PPL EU Services and LKS charged thefollowing amounts for the years ended December 31, including amounts applied to accounts that are further distributed between capital and expense on the books of the recipients, based on methods that are believed to be reasonable.
2018 2017 2016 PPL Electric from PPL Services $ 59 $ 182 $ 132LKE from PPL Services 26 20 18PPL Electric from PPL EU Services 148 64 69LG&E from LKS 151 169 178KU from LKS 169 190 194
In addition to the charges for services noted above, LKS makes payments on behalf of LG&E and KU for fuel purchases and other costs for products or services provided by third parties. LG&E and KU also provide services to each other and to LKS.Billings between LG&E and KU relate to labor and overheads associated with union and hourly employees performing work for the other company, charges related to jointly-owned generating units and other miscellaneous charges. Tax settlements between LKE and LG&E and KU are reimbursed through LKS.

164
Intercompany Borrowings
(PPL Electric)
PPL Energy Funding maintains a revolving line of credit with a PPL Electric subsidiary. In June 2018, the revolving line of credit was increased by $250 million and the limit as of December 31, 2018 was $650 million. No balance was outstanding at December 31, 2018 and 2017. The interest rates on borrowings are equal to one-month LIBOR plus a spread. Interest income is reflected in "Interest Income from Affiliate" on the Income Statements.ff
(LKE)
LKE maintains a $375 million revolving line of credit with a PPL Energy Funding subsidiary whereby LKE f can borrow funds on a short-term basis at market-based rates. In October 2018, the revolving line of credit was increased by $75 million to thecurrent limit of $375 million. The interest rates on borrowings are equal to one-month LIBOR plus a spread. At December 31,2018 and 2017, $113 million and $225 million were outstanding and reflected in "Notes payable with affiliates" on the Balance Sheets. The interest rate on the outstanding borrowings at December 31, 2018 and 2017 were 3.85% and 2.87%. Interest expense on the revolving line of credit was not significant for 2018, 2017 or 2016.
LKE maintains an agreement with a PPL affiliate that has a $300 million borrowing limit whereby LKE can loan funds on a short-term basis at market-based rates. No balance was outstanding at December 31, 2018 and aa 2017. The interest rate on the loan based on the PPL affiliates credit rating is currently equal to one-month LIBOR plus a spread. u
LKE maintains a $400 million ten-year-note with a PPL affiliate with an interest rate of 3.5%. At December 31, 2018 and 2017, the note was reflected in "Long-term debt to affiliate" on the Balance Sheets. Interest expense on this note was $14 million for 2018 and 2017 and not significant for 2016.
In May 2018, LKE borrowed $250 million from a PPL affiliate through the issuance of a 4% ten-year note due 2028 with interest due in May and November. At December 31, 2018, the note was reflected in "Long-term debt to affiliate" on theBalance Sheets. The proceeds were used to repay its outstanding notes payable with a PPL Energy Funding subsidiary. Interest expense on this note was $7 million for 2018.
(LG&E)
LG&E participates in an intercompany money pool agreement whereby LKE and/or KU make available to LG&E funds up to$500 million at an interest rate based on a market index of commercial paper issues. No balances were outstanding at December 31, 2018 and 2017.
(KU)
KU participates in an intercompany money pool agreement whereby LKE and/or LG&E make available to KU funds up to$500 million at an interest rate based on a market index of commercial paper issues. No balances were outstanding at December 31, 2018 and 2017.
Other (PPL Electric, LKE, LG&E and KU)
See Note 1 for discussions regarding the intercompany tax sharing agreement (for PPL Electric, LKE, LG&E and KU) and intercompany allocations of stock-based compensation expense (for PPL Electric and LKE). For PPL Electric, LG&E and KU, see Note 11 for discussions regarding intercompany allocations associated with defined benefits. For PPL Electric, see Note 13for discussions regarding separation benefits.
15. Other Income (Expense) - net
(PPL)
The breakdown of "Other Income (Expense) - net" for the years ended December 31, was:
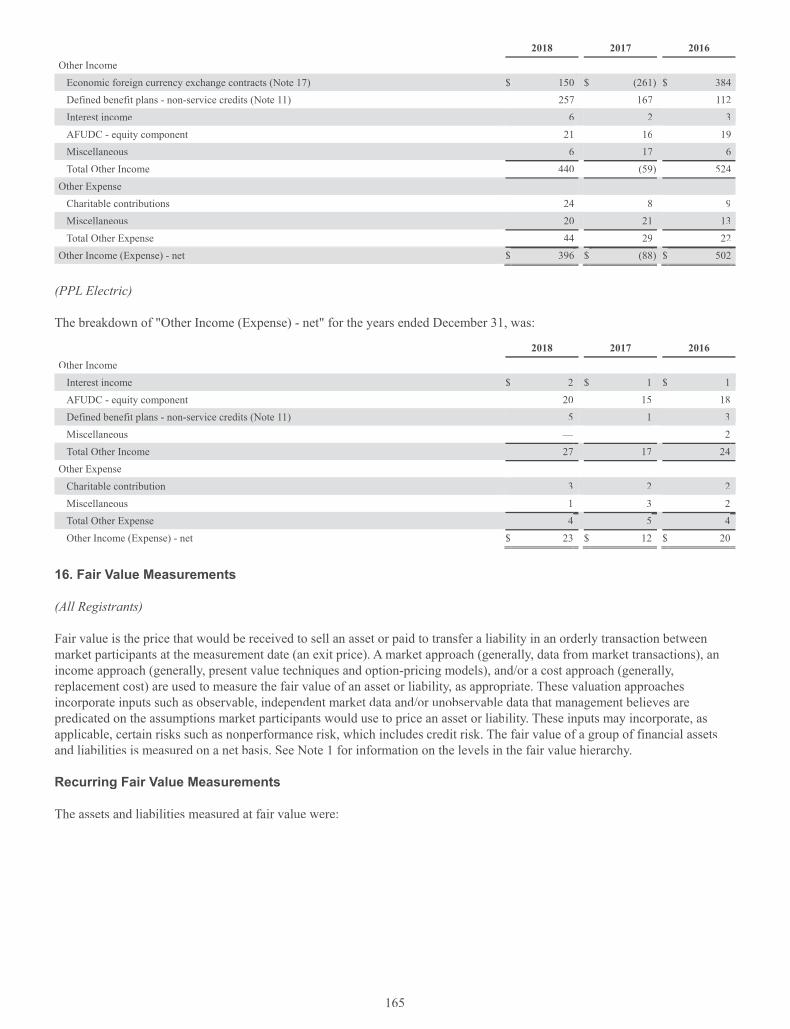
165
2018 2017 2016 Other Income
Economic foreign currency exchange contracts (Note 17) $ 150 $ (261) $ 384Defined benefit plans - non-service credits (Note 11) 257 167 112Interest income 6 2 3AFUDC - equity component 21 16 19Miscellaneous 6 17 6Total Other Income 440 (59) 524
Other Expense Charitable contributions 24 8 9Miscellaneous 20 21 13Total Other Expense 44 29 22
Other Income (Expense) - net $ 396 $ (88) $ 502
(PPL Electric)
The breakdown of "Other Income (Expense) - net" for the years ended December 31, was:
2018 2017 2016 Other Income
Interest income $ 2 $ 1 $ 1AFUDC - equity component 20 15 18Defined benefit plans - non-service credits (Note 11) 5 1 3Miscellaneous — — 2Total Other Income 27 17 24
Other Expense Charitable contribution 3 2 2Miscellaneous 1 3 2Total Other Expense 4 5 4Other Income (Expense) - net $ 23 $ 12 $ 20
16. Fair Value Measurements
(All Registrants)
Fair value is the price that would be received to sell an asset or paid to transfer a liability in an orderly transaction between market participants at the measurement date (an exit price). A market approach (generally, data from market transactions), anincome approach (generally, present value techniques and option-pricing models), and/or a cost approach (generally,replacement cost) are used to measure the fair value of an asset or liability, as appropriate. These valuation approachesincorporate inputs such as observable, independent market data and/or unobservable data that management believes arepredicated on the assumptions market participants would use to price an asset or liability. These inputs may incorporate, as applicable, certain risks such as nonperformance risk, which includes credit risk. The fair value of a group of financial assets and liabilities is measured on a net basis. See Note 1 for information on the levels in the fair value hierarchy.
Recurring Fair Value Measurements
The assets and liabilities measured at fair value were:

166
December 31, 2018 December 31, 2017 Total Level 1 Level 2 Level 3 Total Level 1 Level 2 Level 3
PPL Assets
Cash and cash equivalents $ 621 $ 621 $ — $ — $ 485 $ 485 $ — $ —Restricted cash and cash equivalents (a) 22 22 — — 26 26 — —Special use funds (a) 59 59 — — — — — —Price risk management assets (b):
Foreign currency contracts 202 — 202 — 163 — 163 —Cross-currency swaps 135 — 135 — 101 — 101 —
Total price risk management assets 337 — 337 — 264 — 264 —Total assets $ 1,039 $ 702 $ 337 $ — $ 775 $ 511 $ 264 $ —
Liabilities
Price risk management liabilities (b): Interest rate swaps $ 20 $ — $ 20 $ — $ 26 $ — $ 26 $ —Foreign currency contracts 2 — 2 — 148 — 148 —
Total price risk management liabilities $ 22 $ — $ 22 $ — $ 174 $ — $ 174 $ —
PPL Electric Assets
Cash and cash equivalents $ 267 $ 267 $ — $ — $ 49 $ 49 $ — $ —Restricted cash and cash equivalents (a) 2 2 — — 2 2 — —
Total assets $ 269 $ 269 $ — $ — $ 51 $ 51 $ — $ —
LKE Assets
Cash and cash equivalents $ 24 $ 24 $ — $ — $ 30 $ 30 $ — $ —Total assets $ 24 $ 24 $ — $ — $ 30 $ 30 $ — $ —
LiabilitiesPrice risk management liabilities:
Interest rate swaps $ 20 $ — $ 20 $ — $ 26 $ — $ 26 $ —Total price risk management liabilities $ 20 $ — $ 20 $ — $ 26 $ — $ 26 $ —
LG&E Assets
Cash and cash equivalents $ 10 $ 10 $ — $ — $ 15 $ 15 $ — $ —Total assets $ 10 $ 10 $ — $ — $ 15 $ 15 $ — $ —
Liabilities
Price risk management liabilities: Interest rate swaps $ 20 $ — $ 20 $ — $ 26 $ — $ 26 $ —
Total price risk management liabilities $ 20 $ — $ 20 $ — $ 26 $ — $ 26 $ —
KU Assets
Cash and cash equivalents $ 14 $ 14 $ — $ — $ 15 $ 15 $ — $ —Total assets $ 14 $ 14 $ — $ — $ 15 $ 15 $ — $ —
(a) Current portion is included in "Other current assets" and long-term portion is included in "Other noncurrent assets" on the Balance Sheets. (b) Current portion is included in "Price risk management assets" and "Other current liabilities" and noncurrent portion is included in "Price risk management
assets" and "Other deferred credits and noncurrent liabilities" on the Balance Sheets.

167
Special Use Funds p
(PPL)
The special use funds are investments restricted for paying active union employee medical costs. In May 2018, PPL received a favorable private letter ruling from the IRS permitting a transfer of excess funds from the PPL Bargaining Unit Retiree HealthPlan VEBA to a new subaccount within the VEBA to be used to pay medical claims of active bargaining unit employees. Thefunds are invested primarily in money market funds.
Price Risk Management Assets/Liabilities - Interest Rate Swaps/Foreign Currency Contracts/Cross-Currency g p g y ySwaps (PPL, LKE, LG&E and KU)p
To manage interest rate risk, PPL, LKE, LG&E and KU use interest rate contracts such as forward-starting swaps, floating-to-fixed swaps and fixed-to-floating swaps. To manage foreign currency exchange risk, PPL uses foreign currency contracts suchas forwards, options, and cross-currency swaps that contain characteristics of both interest rate and foreign currency contracts. An income approach is used to measure the fair value of these contracts, utilizing readily observable inputs, such as forward interest rates (e.g., LIBOR and government security rates) and forward foreign currency exchange rates (e.g., GBP), as well as inputs that may not be observable, such as credit valuation adjustments. In certain cases, market information cannot practicablybe obtained to value credit risk and therefore internal models are relied upon. Thesr e models use projected probabilities of default and estimated recovery rates based on historical observances. When the credit valuation adjustment is significant to the overall valuation, the contracts are classified as Level 3.
Financial Instruments Not Recorded at Fair Value (All Registrants)
The carrying amounts of long-term debt on the Balance Sheets and their estimated fair values are set forth below. Long-term debt is classified as Level 2. The effect of third-party credit enhancements is not included in the fair value measurement.
December 31, 2018 December 31, 2017Carrying
Amount (a) Fair Value Carrying
Amount (a) Fair ValuePPL $ 20,599 $ 22,939 $ 20,195 $ 23,783PPL Electric 3,694 3,901 3,298 3,769LKE 5,502 5,768 5,159 5,670LG&E 1,809 1,874 1,709 1,865KU 2,321 2,451 2,328 2,605
(a) Amounts are net of debt issuance costs.
The carrying amounts of other current financial instruments (except for long-term debt due within one year) approximate their fair values because of their short-term nature.
17. Derivative Instruments and Hedging Activities
Risk Management Objectives
(All Registrants)
PPL has a risk management policy approved by the Board of Directors to manage market risk associated with commodities,interest rates on debt issuances and foreign exchange (including price, liquidity and volumetric risk) and credit risk (includingnon-performance risk and payment default risk). The Risk Management Committee, comprised of senior management and chaired by the Senior Director-Risk Management, oversees the risk management function. Key risk control activities designed to ensure compliance with the risk policy and detailed programs include, but are not limited to, credit review and approval,validation of transactions, verification of risk and transaction limits, value-at-risk analyses (VaR, a statistical model that attempts to estimate the value of potential loss over a given holding period under normal market conditions at a given confidence level) and the coordination and reporting of the Enterprise Risk Management program.
168
Market Risk
Market risk includes the potential loss that may be incurred as a result of price changes associated with a particular financial or commodity instrument as well as market liquidity and volumetric risks. Forward contracts, futures contracts, options, swapsttand structured transactions are utilized as part of risk management strategies to minimize unanticipated fluctuations in earnings ncaused by changes in commodity prices, interest rates and foreign currency exchange rates. Many of these contracts meet thedefinition of a derivative. All derivatives are recognized on the Balance Sheets at their fair value, unless NPNS is elected.
The following summarizes the market risks that affect PPL and its subsidiaries.
Interest Rate Risk
• PPL and its subsidiaries are exposed to interest rate risk associated with forecasted fixed-rate and existing floating-rate debt issuances. PPL and WPD hold over-the-counter cross currency swaps to limit exposure to market fluctuations oninterest and principal payments from changes in foreign currency exchange rates and interest rates. PPL, LKE and LG&E utilize over-the-counter interest rate swaps to limit exposure to market fluctuations on floating-rate debt. PPL, LKE, LG&E and KU utilize forward starting interest rate swaps to hedge changes in benchmark interest rates, when appropriate,in connection with future debt issuances.
• PPL and its subsidiaries are exposed to interest rate risk associated with debt securities and derivatives held by defined benefit plans. This risk is significantly mitigated to the extent that the plans are sponsored at, or sponsored on behalf of, thettregulated domestic utilities and for certain plans at WPD due to the recovery methods in place.
Foreign Currency Risk (PPL)
• PPL is exposed to foreign currency exchange risk primarily associated with its investments in and earnings of U.K.affiliates.
(All Registrants)
Commodity Price Risk
PPL is exposed to commodity price risk through its domestic subsidiaries as described below.
• PPL Electric is required to purchase electricity to fulfill its obligation as a PLR. Potential commodity price risk is insignificant and mitigated through its PUC-approved cost recovery mechanism and full-requirement supply agreements to serve its PLR customers which transfer the risk to energy suppliers. ff
• LG&E's and KU's rates include certain mechanisms for fuel, fuel-related expenses and energy purchases. In addition,yLG&E's rates include a mechanism for natural gas supply expenses. These mechanisms generally provide for timelyrecovery of market price fluctuations associated with these expenses.
Volumetric Risk
PPL is exposed to volumetric risk through its subsidiaries as described below.
• WPD is exposed to volumetric risk which is significantly mitigated as a result of the method of regulation in the U.K. Under the RIIO-ED1 price control regulations, recovery of such exposure occurs on a two year lag. See Note 1 for additional information on revenue recognition under RIIO-ED1.
• PPL Electric, LG&E and KU are exposed to volumetric risk on retail sales, mainly due to weather and other economicconditions for which there is limited mitigation between rate cases.
Equity Securities Price Risk
• PPL and its subsidiaries are exposed to equity securities price risk associated with the fair value of the defined benefit plans' assets. This risk is significantly mitigated at the regulated domestic utilities and for certain plans at WPD due to therecovery methods in place.
• PPL is exposed to equity securities price risk from future stock sales and/or purchases. k

169
Credit Risk
Credit risk is the potential loss that may be incurred due to a counterparty's non-performance.
PPL is exposed to credit risk from "in-the-money" interest rate and foreign currency derivatives with financial institutions, as well as additional credit risk through certain of its subsidiaries, as discussed below.
In the event a supplier of PPL Electric, LG&E or KU defaults on its obligation, those Registrants would be required to seek replacement power or replacement fuel in the market. In general, subject to regulatory review or other processes, appropriateincremental costs incurred by these entities would be recoverable from customers through applicable rate mechanisms, thereby mitigating the financial risk for these entities.
PPL and its subsidiaries have credit policies in place to manage credit risk, including the use of an established credit approvalprocess, daily monitoring of counterparty positions and the use of master netting agreements or provisions. These agreementsgenerally include credit mitigation provisions, such as margin, prepayment or collateral requirements. PPL and its subsidiariesmay request additional credit assurance, in certain circumstances, in the event that the counterparties' credit ratings fall below investment grade, their tangible net worth falls below specified percentages or their exposures exceed an established credit limit.
Master Netting Arrangements (PPL, LKE, LG&E and KU)
Net derivative positions on the balance sheets are not offset against the right to reclaim cash collateral (a receivable) or the obligation to return cash collateral (a payable) under master netting arrangements.
PPL had a $40 million and $20 million obligation to return cash collateral under master netting arrangements at December 31, 2018 and 2017.
PPL had no obligation to post cash collateral under master netting arrangements at December 31, 2018 and 2017.r
LKE, LG&E and KU had no obligation to return cash collateral under master netting arrangements at December 31, 2018 and 2017.
LKE, LG&E and KU had no cash collateral posted under master netting arrangements at December 31, 2018 and 2017.
See "Offsetting Derivative Instruments" below for a summary of derivative positions presented in the balance sheets where a right of setoff exists under these arrangements.
Interest Rate Risk
(All Registrants)
PPL and its subsidiaries issue debt to finance their operations, which exposes them to interest rate risk. A variety of financial derivative instruments are utilized to adjust the mix of fixed and floating interest ratest in their debt portfolios, adjust theduration of the debt portfolios and lock in benchmark interest rates in anticipation of future financing, when appropriate. Risk limits under PPL's risk management program are designed to balance risk exposure to volatility in interest expense and changesin the fair value of the debt portfolio due to changes in benchmark interest rates. In addition, the interest rate risk of certainsubsidiaries is potentially mitigated as a result of the existing regulatory framework or the timing of rate cases.
Cash Flow Hedges (PPL)g
Interest rate risks include exposure to adverse interest rate movements for outstanding variable rate debt and for futureanticipated financings. Financial interest rate swap contracts that qualify as cash flow hedges may be entered into to hedgefloating interest rate risk associated with both existing and anticipated debt issuances. PPL had no such contracts at December 31, 2018.
For 2018 and 2017, PPL had no hedge ineffectiveness associated with interest rate derivatives. For 2016, hedge ineffectiveness associated with interest rate derivatives was insignificant.

170
At December 31, 2018, PPL held an aggregate notional value in cross-currency interest rate swap contracts of $702 million that range in maturity from 2021 through 2028 to hedge the interest payments and principal of WPD's U.S. dollar-denominated senior notes.
For 2018, 2017 and 2016, PPL had no hedge ineffectiveness associated with cross-currency interest rate swap derivatives.
Cash flow hedges are discontinued if it is no longer probable that the original forecasted transaction will occur by the end of theforiginally specified time period and any amounts previously recorded in AOCI are reclassified into earnings once it isdetermined that the hedged transaction is not probable of occurring.
For 2018 and 2016, PPL had no cash flow hedges reclassified into earnings associated with discontinued cash flow hedges and had an insignificant amount of cash flow hedges reclassified into earnings associated with discontinued cad sh flow hedges in 2017.
At December 31, 2018, the amount of accumulated net unrecognized after-tax gains (losses) on qualifying derivatives expected to be reclassified into earnings during the next 12 months is insignificant. Amounts are reclassified as the hedged interest expense is recorded.
Economic Activity (PPL, LKE and LG&E)y
LG&E enters into interest rate swap contracts that economically hedge interest payments on variable rate debt. Becauserealized gains and losses from the swaps, including terminated swap contracts, are recoverable through regulated rates, any subsequent changes in fair value of these derivatives are included in regulatory assets or liabilities until they are realized as interest expense. Realized gains and losses are recognized in "Interest Expense" on the Statements of Income at the time theunderlying hedged interest expense is recorded. In December 2016, a swap with a notional amount of $32 million was terminated. A cash settlement of $9 million was paid on the terminated swap. The settlement is included in noncurrent regulatory assets on the Balance Sheet and in "Cash Flows from Operating Activities" on the Statement of Cash Flows. At December 31, 2018, LG&E held contracts with a notional amount of $147 million that range in maturity through 2033.
Foreign Currency Risk
(PPL)
PPL is exposed to foreign currency risk, primarily through investments in and earnings of U.K. affiliates. PPL has adopted aforeign currency risk management program designed to hedge certain foreign currency exposures, including firm commitments,recognized assets or liabilities, anticipated transactions and net investments. In addition, PPL enters into financial instrumen nts to protect against foreign currency translation risk of expected GBP earnings.
Net Investment Hedgesg
PPL enters into foreign currency contracts on behalf of a subsidiary to protect the value of a portion of its net investment inWPD. There were no contracts outstanding at December 31, 2018.
At December 31, 2018 and 2017, PPL had $31 million and $22 million of accumulated net investment hedge after tax gains (losses) that were included in the foreign currency translation adjustment component of AOCI.
Economic Activityy
PPL enters into foreign currency contracts on behalf of a subsidiary to economically hedgeu GBP-denominated anticipated earnings. At December 31, 2018, the total exposure hedged by PPL was approximately £1.5 billion (approximately $2.2 billion based on contracted rates). These contracts had termination dates ranging fromtt January 2019 through October 2020. m
In the third quarter of 2016, PPL settled foreign currency hedges related to 2017 and 2018 anticipated earnings, resulting inreceipt of $310 million of cash and entered into new hedges at current market rates. The notional amount of the settled hedgeswas approximately £1.3 billion (approximately $2.0 billion based on contracted rates) with termination dates from January 2017 through November 2018. The settlement did not have a significant impact on net income as the hedge values werepreviously marked to fair value and recognized in "Other Income (Expense) - net" on the Statement of Income.

171
Accounting and Reporting
(All Registrants)
All derivative instruments are recorded at fair value on the Balance Sheet as an asset or liability unless NPNS is elected. NPNScontracts for PPL and PPL Electric include certain full-requirement purchase contracts and other physical purchase contracts. Changes in the fair value of derivatives not designated as NPNS are recognized in earnings unless specific hedge accountingcriteria are met and designated as such, except for the changes in fair values of LG&E's interest rate swaps that are recognized as regulatory assets or regulatory liabilities. See Note 7 for amounts recorded in regulatory assets and regulatory liabilities at December 31, 2018 and 2017.
See Note 1 for additional information on accounting policies related to derivative instruments.
(PPL)
The following table presents the fair value and location of derivative instruments recorded on the Balance Sheets.December 31, 2018 December 31, 2017
Derivatives designatedas
hedging instruments
Derivatives not designated
as hedging instruments
Derivatives designated as
hedging instruments
Derivatives notdesignated
as hedging instrumentsAssets Liabilities Assets Liabilities Assets Liabilities Assets Liabilities
Current: Price Risk Management
Assets/Liabilities (a): Interest rate swaps (b) $ — $ — $ — $ 4 $ — $ — $ — $ 4Cross-currency swaps (b) 6 — — — 4 — — —Foreign currency contracts — — 103 2 — — 45 67
Total current 6 — 103 6 4 — 45 71NNoncurrent:
Price Risk Management Assets/Liabilities (a):
Interest rate swaps (b) — — — 16 — — — 22Cross-currency swaps (b) 129 — — — 97 — — ——Foreign currency contracts — — 99 — — — 118 81
Total noncurrent 129 — 99 16 97 — 118 103Total derivatives $ 135 $ — $ 202 $ 22 $ 101 $ — $ 163 $ 174
(a) Current portion is included in "Price risk management assets" and "Other current liabilities" and noncurrent portion is included in "Price risk management assets" and "Other deferred credits and noncurrent liabilities" on the Balance Sheets.
(b) Excludes accrued interest, if applicable.
The following tables present the pre-tax effect of derivative instruments recognized in income, OCI or regulatory assets and regulatory liabilities.
Derivative Relationships
Derivative Gain (Loss) Recognized in
OCI (Effective Portion)
Location of Gain (Loss)Recognized in Income
on Derivative
Gain (Loss) Reclassified from AOCI into Income
(Effective Portion)
Gain (Loss) Recognizedin Income on Derivative(Ineffective Portion andAmount Excluded fromEffectiveness Testing)
2018 Cash Flow Hedges:
Interest rate swaps $ 4 Interest Expense $ (8) $ ——Cross-currency swaps 41 Other Income (Expense) - net 42 —
Interest Expense 1 —Total $ 45 $ 35 $ —NNet Investment Hedges:
Foreign currency contracts $ 11

172
Derivative Relationships
Derivative Gain (Loss) Recognized in
OCI (Effective Portion)
Location of Gain (Loss)Recognized in Income
on Derivative
Gain (Loss) Reclassified from AOCI into Income
(Effective Portion)
Gain (Loss) Recognizedin Income on Derivative(Ineffective Portion andAmount Excluded fromEffectiveness Testing)
2017 Cash Flow Hedges:
Interest rate swaps $ — Interest Expense $ (9) $ —Cross-currency swaps (98) Other Income (Expense) - net (82) —
Total $ (98) $ (91) $ —NNet Investment Hedges:
Foreign currency contracts $ 1
2016 Cash Flow Hedges:
Interest rate swaps $ (21) Interest Expense $ (7) $ —Cross-currency swaps 130 Other Income (Expense) - net 116 ——
Interest Expense 3 —Total $ 109 $ 112 $ —Net Investment Hedges:
Foreign currency contracts $ 2
Derivatives Not Designated asHedging Instruments
Location of Gain (Loss) Recognized in Income on Derivative 2018 2017 2016
Foreign currency contracts Other Income (Expense) - net $ 150 $ (261) $ 384Interest rate swaps Interest Expense (5) (6) (7)
Total $ 145 $ (267) $ 377
Derivatives Not Designated asHedging Instruments
Location of Gain (Loss) Recognized asRegulatory Liabilities/Assets 2018 2017 2016
Interest rate swaps Regulatory assets - noncurrent $ 6 $ 5 $ 7
(LKE and LG&E)
The following table presents the fair value and the location on the Balance Sheets of derivatives not designated as hedginginstruments.
December 31, 2018 December 31, 2017Assets Liabilities Assets Liabilities
Current: Price Risk Management
Assets/Liabilities: Interest rate swaps $ — $ 4 $ — $ 4
Total current — 4 — 4NNoncurrent:
Price Risk ManagementAssets/Liabilities:
Interest rate swaps — 16 — 22Total noncurrent — 16 — 22
Total derivatives $ — $ 20 $ — $ 26
The following tables present the pre-tax effect of derivatives not designated as cash flow hedges that are recognized in incomeor regulatory assets.
Derivative Instruments Location of Gain (Loss) 2018 2017 2016 Interest rate swaps Interest Expense $ (5) $ (6) $ (7)
Derivative Instruments Location of Gain (Loss) 2018 2017 2016 Interest rate swaps Regulatory assets - noncurrent $ 6 $ 5 $ 7

173
(PPL, LKE, LG&E and KU)
Offsetting Derivative Instruments
PPL, LKE, LG&E and KU or certain of their subsidiaries have master netting arrangements in place and also enter into agreements pursuant to which they purchase or sell certain energy and other products. Under the agreements, upon terminationof the agreement as a result of a default or other termination event, the non-defaulting party typically would have a right to set off amounts owed under the agreement against any other obligations arising between the two parties (whether under the agreement or not), whether matured or contingent and irrespective of the currency, place of payment or place of booking of theobligation.
PPL, LKE, LG&E and KU have elected not to offset derivative assets and liabilities and not to offset net derivative positions against the right to reclaim cash collateral pledged (an asset) or the obligation to return cash collateral received (a liability) under derivatives agreements. The table below summarizes the derivative positions presented in the balance sheets where aright of setoff exists under these arrangements and related cash collateral received or pledged. Assets Liabilities
Eligible for Offset Eligible for Offset
Gross Derivative
Instruments
CashCollateralReceived Net Gross
Derivative Instruments
CashCollateral Pledged Net
December 31, 2018 , Treasury Derivatives y
PPL $ 337 $ 2 $ 40 $ 295 $ 22 $ 2 $ — $ 20LKE — — — — 20 — — 20LG&E — —— — — 20 — — 20
December 31, 2017 , Treasury Derivatives y
PPL $ 264 $ 107 $ 20 $ 137 $ 174 $ 107 $ — $ 67LKE — —— — — 26 — — 26LG&E — — — — 26 — — 26
Credit Risk-Related Contingent Features
Certain derivative contracts contain credit risk-related contingent features, which when in a net liability position, would permit rrthe counterparties to require the transfer of additional collateral upon a decrease in thr e credit ratings of PPL, LKE, LG&E andKU or certain of their subsidiaries. Most of these features would require the transfer of additional collateral or permit the counterparty to terminate the contract if the applicable credit rating were to fall below investment grade. Some of these features uualso would allow the counterparty to require additional collateral upon each downgrade in credit rating at levels that remain above investment grade. In either case, if the applicable credit rating were to fall below investment grade, and assuming noassignment to an investment grade affiliate were allowed, most of these credit contingent features require either immediatepayment of the net liability as a termination payment or immediate and ongoing full collateralization on derivative instrumentsin net liability positions.
Additionally, certain derivative contracts contain credit risk-related contingent features that require adequate assurance of performance be provided if the other party has reasonable concerns regarding the performance of PPL's, LKE's, LG&E's and ttKU's obligations under the contracts. A counterparty demanding adequate assurance could require a transfer of additionalcollateral or other security, including letters of credit, cash and guarantees from a creditworthy entity. This would typicallyinvolve negotiations among the parties. However, amounts disclosed below represent assumed immediate payment or immediate and ongoing full collateralization for derivative instruments in net liability positions with "adequate assurance" features.
(PPL, LKE and LG&E)
At December 31, 2018, derivative contracts in a net liability position that contain credit risk-related contingent features, collateral posted on those positions and the related effect of a decrease in credit ratings below investment grade are summarizt ed as follows:

174
PPL LKE LG&E Aggregate fair value of derivative instruments in a net liability position with credit risk-related contingent features $ 6 $ 6 $ 6Aggregate fair value of collateral posted on these derivative instruments — — —Aggregate fair value of additional collateral requirements in the event of a credit downgrade belowinvestment grade (a) 6 6 6
(a) Includes the effect of net receivables and payables already recorded on the Balance Sheet.
18. Goodwill and Other Intangible Assets
Goodwill
(PPL)
The changes in the carrying amount of goodwill by segment were:
U.K. Regulated
Kentucky Regulated
Corporate and Other Total
2018 2017 2018 2017 2018 2017 2018 2017 Balance at beginning of period (a) $ 2,596 $ 2,398 $ 662 $ 662 $ — $ — $ 3,258 $ 3,060
Effect of foreign currency exchange rates (149) 198 — — — — (149) 198 Goodwill recognized during the period (b) — — — — 53 — 53 —Balance at end of period (a) $ 2,447 $ 2,596 $ 662 $ 662 $ 53 $ — $ 3,162 $ 3,258
(a) There were no accumulated impairment losses related to goodwill.(b) Recognized as a result of the acquisition of Safari Energy.
Other Intangible Assets
(PPL)
The gross carrying amount and the accumulated amortization of other intangible assets were:
December 31, 2018 December 31, 2017Gross
Carrying Amount
AccumulatedAmortization
Gross Carrying Amount
AccumulatedAmortization
Subject to amortization:Contracts (a) $ 137 $ 75 $ 138 $ 67Land rights and easements 418 128 382 120Licenses and other 21 1 8 3
Total subject to amortization 576 204 528 190
Not subject to amortization due to indefinite life: Land rights and easements 339 — 359 ——Other 6 — — —
Total not subject to amortization due to indefinite life 345 — 359 —Total $ 921 $ 204 $ 887 $ 190
(a) Gross carrying amount in 2018 and 2017 includes the fair value at the acquisition date of the OVEC power purchase contract with terms favorable to market recognized as a result of the 2010 acquisition of LKE by PPL.

175
Current intangible assets are included in "Other current assets" and long-term intangible assets are included in "Other intangibles" on the Balance Sheets.
Amortization Expense was as follows:2018 2017 2016
Intangible assets with no regulatory offset $ 7 $ 6 $ 6Intangible assets with regulatory offset 8 9 24Total $ 15 $ 15 $ 30
Amortization expense for each of the next five years is estimated to be:
2019 2020 2021 2022 2023 Intangible assets with no regulatory offset $ 7 $ 7 $ 7 $ 7 $ 7Intangible assets with regulatory offset 9 8 8 8 8Total $ 16 $ 15 $ 15 $ 15 $ 15
(PPL Electric)
The gross carrying amount and the accumulated amortization of other intangible assets were:
December 31, 2018 December 31, 2017Gross
Carrying Amount
AccumulatedAmortization
Gross Carrying Amount
AccumulatedAmortization
Subject to amortization:Land rights and easements $ 363 $ 121 $ 361 $ 117Licenses and other 2 1 3 1
Total subject to amortization 365 122 364 118
Not subject to amortization due to indefinite life:
Land rights and easements 17 — 13 —Total $ 382 $ 122 $ 377 $ 118
Intangible assets are shown as "Intangibles" on the Balance Sheets.
Amortization expense was insignificant in 2018, 2017 and 2016 and is expected to be insignificant in future years.
(LKE)
The gross carrying amount and the accumulated amortization of other intangible assets were:
December 31, 2018 December 31, 2017Gross
Carrying Amount
AccumulatedAmortization
Gross Carrying Amount
AccumulatedAmortization
Subject to amortization:Land rights and easements $ 21 $ 3 $ 21 $ 3OVEC power purchase agreement (a) 126 66 126 58
Total subject to amortization $ 147 $ 69 $ 147 $ 61
(a) Gross carrying amount represents the fair value at the acquisition date of the OVEC power purchase contract recognized as a result of the 2010acquisition by PPL. An offsetting regulatory liability was recorded related to this contract, which is being amortized over the same period as the intangible asset, eliminating any income statement impact. See Note 7 for additional information.
Long-term intangible assets are presented as "Other intangibles" on the Balance Sheets.
Amortization expense was as follows:

176
2018 2017 2016 Intangible assets with no regulatory offset $ — $ — $ 1Intangible assets with regulatory offset 8 9 24Total $ 8 $ 9 $ 25
Amortization expense for each of the next five years is estimated to be:
2019 2020 2021 2022 2023 Intangible assets with regulatory offset $ 9 $ 8 $ 8 $ 8 $ 8
(LG&E)
The gross carrying amount and the accumulated amortization of other intangible assets were:
December 31, 2018 December 31, 2017Gross
Carrying Amount
AccumulatedAmortization
Gross Carrying Amount
AccumulatedAmortization
Subject to amortization:Land rights and easements $ 7 $ 1 $ 7 $ 1OVEC power purchase agreement (a) 87 46 87 40
Total subject to amortization $ 94 $ 47 $ 94 $ 41
(a) Gross carrying amount represents the fair value at the acquisition date of the OVEC power purchase contract recognized as a result of the 2010acquisition by PPL. An offsetting regulatory liability was recorded related to this contract, which is being amortized over the same period as the intangible asset, eliminating any income statement impact. See Note 7 for additional information.
Long-term intangible assets are presented as "Other intangibles" on the Balance Sheets.
Amortization expense was as follows:
2018 2017 2016 Intangible assets with regulatory offset $ 6 $ 6 $ 13
Amortization expense for each of the next five years is estimated to be:
2019 2020 2021 2022 2023 Intangible assets with regulatory offset $ 6 $ 6 $ 6 $ 6 $ 6
(KU)
The gross carrying amount and the accumulated amortization of other intangible assets were:
December 31, 2018 December 31, 2017Gross
Carrying Amount
AccumulatedAmortization
Gross Carrying Amount
AccumulatedAmortization
Subject to amortization:Land rights and easements $ 14 $ 2 $ 14 $ 2OVEC power purchase agreement (a) 39 20 39 18
Total subject to amortization $ 53 $ 22 $ 53 $ 20
(a) Gross carrying amount represents the fair value at the acquisition date of the OVEC power purchase contract recognized as a result of the 2010acquisition by PPL. An offsetting regulatory liability was recorded related to this contract, which is being amortized over the same period as the intangible asset, eliminating any income statement impact. See Note 7 for additional information.
Long-term intangible assets are presented as "Other intangibles" on the Balance Sheets.

177
Amortization expense was as follows:
2018 2017 2016 Intangible assets with no regulatory offset $ — $ — $ 1Intangible assets with regulatory offset 2 3 11Total $ 2 $ 3 $ 12
Amortization expense for each of the next five years is estimated to be:
2019 2020 2021 2022 2023 Intangible assets with regulatory offset $ 3 $ 2 $ 2 $ 2 $ 2
19. Asset Retirement Obligations
(PPL)
WPD has recorded conditional AROs required by U.K. law related to treated wood poles, gas-filled switchgear and fluid-filled ffcables.
(PPL and PPL Electric)
PPL Electric has identified legal retirement obligations for the retirement of certain transmission assets that could not bereasonably estimated due to indeterminable settlement dates. These assets are located on rights-of-way that allow the grantor torequire PPL Electric to relocate or remove the assets. Since this option is at the discretion of the grantor of the right-of-way, aaPPL Electric is unable to determine when these events may occur.
(PPL, LKE, LG&E and KU)
LKE, LG&E's and KU's ARO liabilities are primarily related to CCR closure costs. See Note 13 for information on the CCR rule. ARO regulatory assets associated with certain CCR projects are amortized to expense in accordance with regulatory approvals. LG&E also has AROs related to natural gas mains and wells. LG&E's and KU's transmission and distribution lineslargely operate under perpetual property easement agreements, which do not generally require restoration upon removal of the property. Therefore, no material AROs are recorded for transmission and distribution assets. As described in Notes 1 and 7, forLKE, LG&E and KU, all ARO accretion and depreciation expenses are reclassified as a regulatory asset. For other AROs, at the time of retirement, the related ARO regulatory asset is offset against the associated cost of removal regulatory liability,PP&E and ARO liability.
The changes in the carrying amounts of AROs were as follows:
PPL LKE LG&E KU2018 2017 2018 2017 2018 2017 2018 2017
ARO at beginning of period $ 397 $ 488 $ 356 $ 433 $ 121 $ 145 $ 235 $ 288Accretion 20 21 18 20 6 7 12 13Obligations incurred 8 — 8 — — — 8 ——Changes in estimated timing or cost (3) (73) (14) (54) (2) (8 ) (12) (46)Effect of foreign currency exchange rates (3) 4 —— — — — — ——Obligations settled (72) (43) (72) (43) (22) (23 ) (50) (20)
ARO at end of period $ 347 $ 397 $ 296 $ 356 $ 103 $ 121 $ 193 $ 235
20. Accumulated Other Comprehensive Income (Loss)
(PPL and LKE)
The after-tax changes in AOCI by component for the years ended December 31 were as follows:

178
Defined benefit plans
Foreigncurrency
translationadjustments
Unrealizedgains (losses)
onqualifying derivatives
Equityinvestees'
AOCI
Prior servicecosts
Actuarialgain(loss) Total
PPL December 31, 2015 $ (520) $ (7) $ — $ (6) $ (2,195) $ (2,728)Amounts arising during the year (1,107) 91 — (3 ) (61) (1,080)Reclassifications from AOCI — (91) (1) 1 121 30Net OCI during the year (1,107) — (1) (2 ) 60 (1,050)December 31, 2016 $ (1,627) $ (7) $ (1) $ (8) $ (2,135) $ (3,778)
Amounts arising during the year 538 (79) — — (308) 151Reclassifications from AOCI — 73 1 1 130 205NNet OCI during the year 538 (6) 1 1 (178) 356December 31, 2017 $ (1,089) $ (13) $ — $ (7 ) $ (2,313) $ (3,422)
Amounts arising during the year (444) 36 — (11 ) (187) (606)Reclassifications from AOCI — (29) — 2 142 115Net OCI during the year (444) 7 — (9 ) (45) (491)Adoption of reclassification of certain tax effects from AOCI guidance cumulative effect adjustment (Note 1) — (1) — (3) (47) (51)December 31, 2018 $ (1,533) $ (7) $ — $ (19 ) $ (2,405) $ (3,964)
LKE December 31, 2015 $ — $ (10) $ (36) $ (46)
Amounts arising during the year — — (27) (27)
Reclassifications from AOCI (1) 2 2 3
Net OCI during the year (1) 2 (25) (24)
December 31, 2016 $ (1) $ (8) $ (61) $ (70)
Amounts arising during the year — (2) (23) (25)
Reclassifications from AOCI 1 1 5 7
NNet OCI during the year 1 (1) (18) (18)
December 31, 2017 $ — $ (9 ) $ (79) $ (88)
Amounts arising during the year — — 7 7
Reclassifications from AOCI — 2 8 10
Net OCI during the year — 2 15 17Adoption of reclassification of certain tax effects from AOCI guidance cumulative effect adjustment (Note 1) — (2) (16) (18)
December 31, 2018 $ — $ (9 ) $ (80) $ (89)
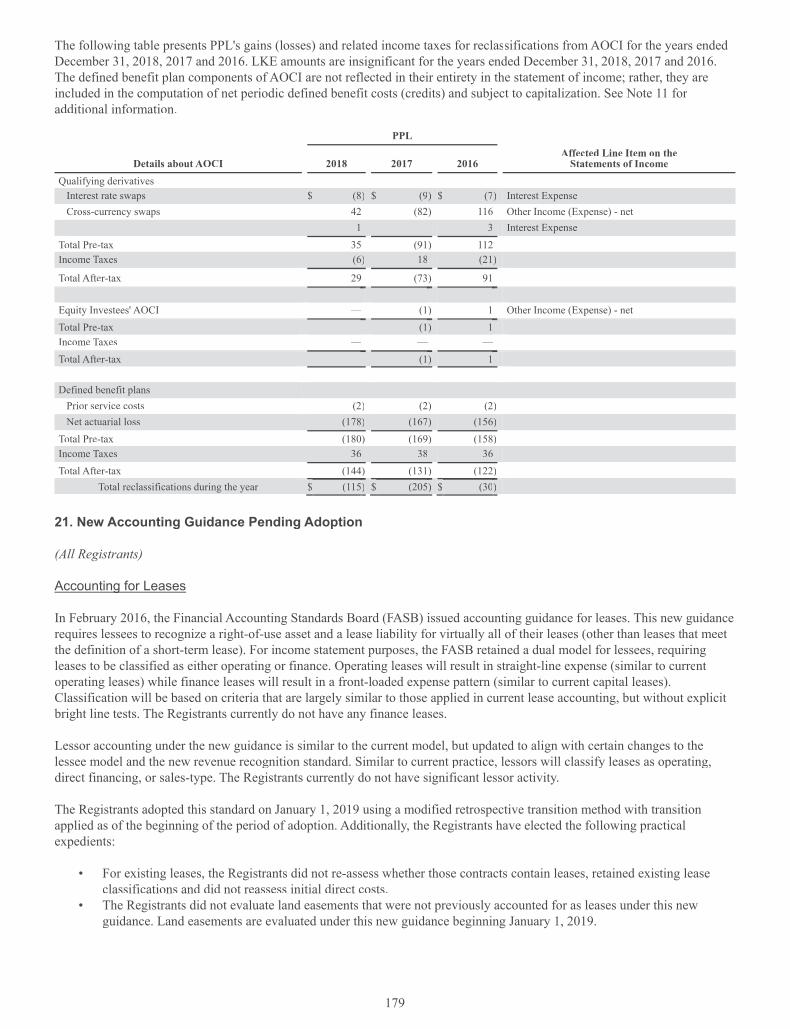
179
The following table presents PPL's gains (losses) and related income taxes for reclassifications from AOCI for the years ended December 31, 2018, 2017 and 2016. LKE amounts are insignificant for the years ended December 31, 2018, 2017 and 2016. The defined benefit plan components of AOCI are not reflected in their entirety in the statement of income; rather, they are included in the computation of net periodic defined benefit costs (credits) and subject to capitalization. See Note 11 for additional information.
PPL
Details about AOCI 2018 2017 2016Affected Line Item on the
Statements of Income Qualifying derivatives
Interest rate swaps $ (8) $ (9) $ (7) Interest Expense Cross-currency swaps 42 (82) 116 Other Income (Expense) - net
1 — 3 Interest Expense Total Pre-tax 35 (91) 112Income Taxes (6) 18 (21)
Total After-tax 29 (73) 91
Equity Investees' AOCI — (1) 1 Other Income (Expense) - net Total Pre-tax — (1) 1Income Taxes — — —Total After-tax — (1) 1
Defined benefit plans
Prior service costs (2) (2) (2)NNet actuarial loss (178) (167) (156)
Total Pre-tax (180) (169) (158)Income Taxes 36 38 36Total After-tax (144) (131) (122)
Total reclassifications during the year $ (115) $ (205) $ (30)
21. New Accounting Guidance Pending Adoption
(All Registrants)
Accounting for Leasesg
In February 2016, the Financial Accounting Standards Board (FASB) issued accounting guidance for leases. This new guidance FFrequires lessees to recognize a right-of-use asset and a lease liability for virtually all of their leases (other than leases tr hat meet ttthe definition of a short-term lease). For income statement purposes, the FASB retained a dual model for lessees, requiring leases to be classified as either operating or finance. Operating leases will result in straight-line expense (similar to current operating leases) while finance leases will result in a front-loaded expense pattern (similar to current capital leases). Classification will be based on criteria that are largely similar to those applied in current lease accounting, but without explicit bright line tests. The Registrants currently do not have any finance leases.
Lessor accounting under the new guidance is similar to the current model, but updated to align with certain changes to thelessee model and the new revenue recognition standard. Similar to current practice, lessors will classify leases as operating,rdirect financing, or sales-type. The Registrants currently do not have significant lessor activity.
The Registrants adopted this standard on January 1, 2019 using a modified retrospective transition method with transition applied as of the beginning of the period of adoption. Additionally, the Registrants have elected the following practicalexpedients:
• For existing leases, the Registrants did not re-assess whether those contracts contain leases, retained existing leaseclassifications and did not reassess initial direct costs.
• The Registrants did not evaluate land easements that were not previously accounted for as leases under this new guidance. Land easements are evaluated under this new guidance beginning January 1, 2019.
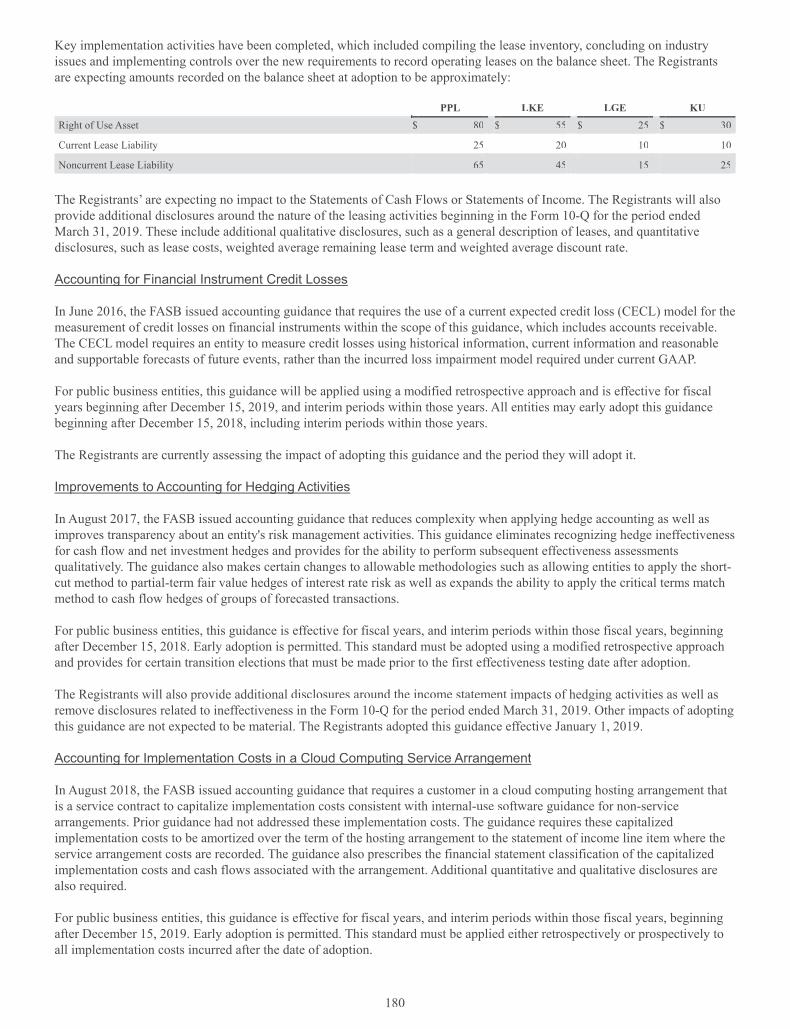
180
Key implementation activities have been completed, which included compiling the lease inventory, concluding on industry issues and implementing controls over the new requirements to record operating leases on the balance sheet. The Registrants are expecting amounts recorded on the balance sheet at adoption to be approximately:
PPL LKE LGE KURight of Use Asset $ 80 $ 55 $ 25 $ 30
Current Lease Liability 25 20 10 10
NNoncurrent Lease Liability 65 45 15 25
The Registrants’ are expecting no impact to the Statements of Cash Flows or Statements of Income. The Registrants will also provide additional disclosures around the nature of the leasing activities beginning in the Form 10-Q for the period ended March 31, 2019. These include additional qualitative disclosures, such as a general description of leases, and quantitativedisclosures, such as lease costs, weighted average remaining lease term and weighted average discount rate.
Accounting for Financial Instrument Credit Losses g
In June 2016, the FASB issued accounting guidance that requires the use of a current expected credit loss (CECL) model for themeasurement of credit losses on financial instruments within the scope of this guidance, which includes accounts receivable.The CECL model requires an entity to measure credit losses using historical information, current information and reasonable and supportable forecasts of future events, rather than the incurred loss impairment model required under current GAAP.
For public business entities, this guidance will be applied using a modified retrospective approach and is effective for fiscalyears beginning after December 15, 2019, and interim periods within those years. All entities may early adopt this guidance beginning after December 15, 2018, including interim periods within those years.
The Registrants are currently assessing the impact of adopting this guidance and the period they will adopt it.
Improvements to Accounting for Hedging Activitiesp g g g
In August 2017, the FASB issued accounting guidance that reduces complexity when applying hedge accounting as well as improves transparency about an entity's risk management activities. This guidance elimink ates recognizing hedge ineffectiveness for cash flow and net investment hedges and provides for the ability to perform subsequent effectiveness assessmentsqualitatively. The guidance also makes certain changes to allowable methodologies such as allowing entities to apply the short-cut method to partial-term fair value hedges of interest rate risk as well as expands the ability to apply the critical terms matchmethod to cash flow hedges of groups of forecasted transactions.
For public business entities, this guidance is effective for fiscal years, and interim periods within those fiscal years, beginning after December 15, 2018. Early adoption is permitted. This standard must be adopted using a modified retrospective approach and provides for certain transition elections that must be made prior to the first effectiveness testing date after adoption.
The Registrants will also provide additional disclosures around the income statement impacts of hedging activities as well as tremove disclosures related to ineffectiveness in the Form 10-Q for the period ended March 31, 2019. Other impacts of adopting this guidance are not expected to be material. The Registrants adopted this guidance effective January 1, 2019.
Accounting for Implementation Costs in a Cloud Computing Service Arrangementg p p g g
In August 2018, the FASB issued accounting guidance that requires a customer in a cloud computing hosting arrangement that is a service contract to capitalize implementation costs consistent with internal-use software guidance for non-service arrangements. Prior guidance had not addressed these implementation costs. The guidance requires these capitalized implementation costs to be amortized over the term of the hosting arrangement to the statement of income line item where theservice arrangement costs are recorded. The guidance also prescribes the financial statement classification of the capitalized implementation costs and cash flows associated with the arrangement. Additional quantitative and qualitative disclosures are also required.
For public business entities, this guidance is effective for fiscal years, and interim periods within those fiscal years, beginning after December 15, 2019. Early adoption is permitted. This standard must be applied either retrospectively or prospectively to all implementation costs incurred after the date of adoption.

181
The Registrants are currently assessing the impact of adopting this guidance and the period they will adopt it.
Simplifying the Test for Goodwill Impairment (PPL, LKE, LG&E and KU)p y g p
In January 2017, the FASB issued accounting guidance that simplifies the test for goodwill impairment by eliminating thesecond step of the quantitative test. The second step of the quantitative test requires a calculation of the implied fair value of goodwill, which is determined in the same manner as the amount of goodwill in a business combination. Under this new guidance, an entity will now compare the estimated fair value of a reporting unit with its carrying value and recognize an impairment charge for the amount the carrying amount exceeds the fair value of the reporting unit.t
For public business entities, this guidance will be applied prospectively and is effective for annual or any interim goodwillimpairment tests for fiscal years beginning after December 15, 2019. All entities may early adopt this guidance for interim or annual goodwill impairment tests performed on testing dates after January 1, 2017.d
The Registrants are currently assessing the impact of adopting this guidance and the period they will adopt it.
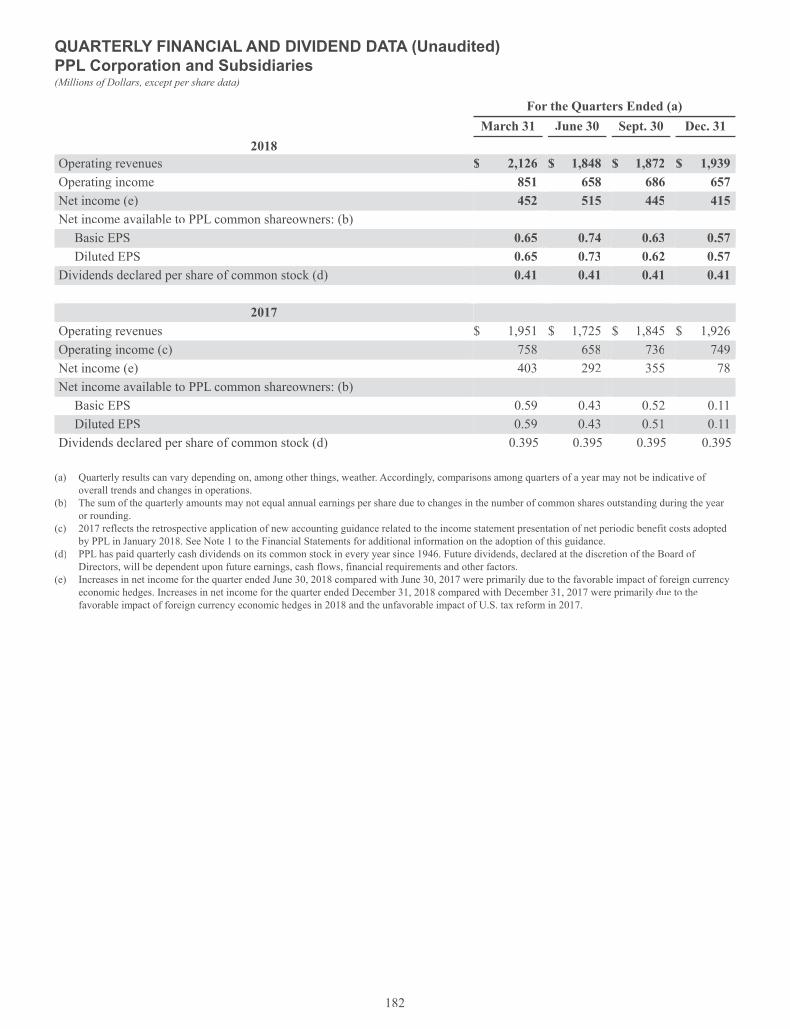
182
QUARTERLY FINANCIAL AND DIVIDEND DATA (Unaudited)PPL Corporation and Subsidiaries(Millions of Dollars, except per share data)
For the Quarters Ended (a)March 31 June 30 Sept. 30 Dec. 31
2018 Operating revenues $ 2,126 $ 1,848 $ 1,872 $ 1,939Operating income 851 658 686 657NNet income (e) 452 515 445 415Net income available to PPL common shareowners: (b)
Basic EPS 0.65 0.74 0.63 0.57Diluted EPS 0.65 0.73 0.62 0.57
Dividends declared per share of common stock (d) 0.41 0.41 0.41 0.41
2017Operating revenues $ 1,951 $ 1,725 $ 1,845 $ 1,926Operating income (c) 758 658 736 749Net income (e) 403 292 355 78NNet income available to PPL common shareowners: (b) L
Basic EPS 0.59 0.43 0.52 0.11Diluted EPS 0.59 0.43 0.51 0.11
Dividends declared per share of common stock (d) 0.395 0.395 0.395 0.395
(a) Quarterly results can vary depending on, among other things, weather. Accordingly, comparisons among quarters of a year may not be indicative of toverall trends and changes in operations.
(b) The sum of the quarterly amounts may not equal annual earnings per share due to changes in the number of common shares outstanding during the year or rounding.
(c) 2017 reflects the retrospective application of new accounting guidance related to the income statement presentation of net periodic benefit costs adopted by PPL in January 2018. See Note 1 to the Financial Statements for additional information on the adoption of this guidance.
(d) PPL has paid quarterly cash dividends on its common stock in every year since 1946. Future dividends, declared at the discretion of the Board of Directors, will be dependent upon future earnings, cash flows, financial requirements and other factors.
(e) Increases in net income for the quarter ended June 30, 2018 compared with June 30, 2017 were primarily due to the favorable impact of foreign currency economic hedges. Increases in net income for the quarter ended December 31, 2018 compared with December 31, 2017 were primarily due to theyfavorable impact of foreign currency economic hedges in 2018 and the unfavorable impact of U.S. tax reform in 2017.
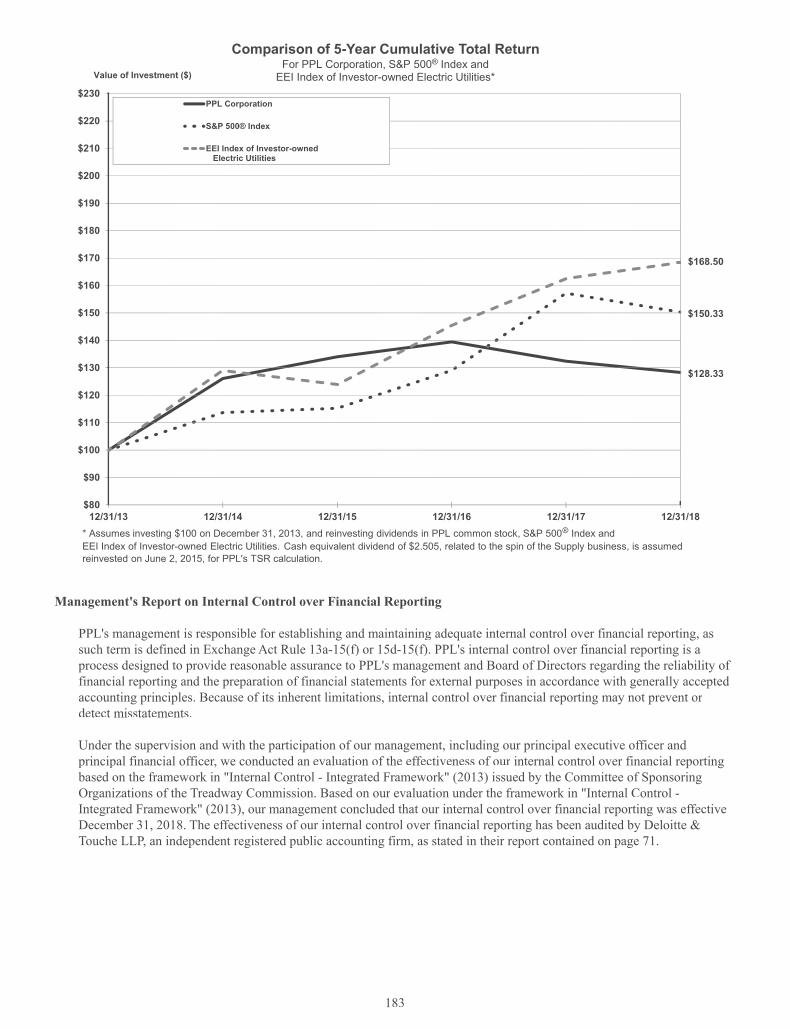
183
Management's Report on Internal Control over Financial Reporting
PPL's management is responsible for establishing and maintaining adequate internal control over financial reporting, assuch term is defined in Exchange Act Rule 13a-15(f) or 15d-15(f). PPL's internal control over financial reporting is aprocess designed to provide reasonable assurance to PPL's management and Board of Directors regarding the reliability of financial reporting and the preparation of financial statements for external purposes in accordance with generally accepted accounting principles. Because of its inherent limitations, internal control over financial reporting may not prevent or detect misstatements.
Under the supervision and with the participation of our management, including our principal executive officer and principal financial officer, we conducted an evaluation of the effectiveness of our n internal control over financial reporting based on the framework in "Internal Control - Integrated Framework" (2013) issued by the Committee of SponsoringOrganizations of the Treadway Commission. Based on our evaluation under the framework in "Internal Control -Integrated Framework" (2013), our management concluded that our internal control over financial reporting was effective December 31, 2018. The effectiveness of our internal control over financial reporting has been audited by Deloitte & Touche LLP, an independent registered public accounting firm, as stated in their report contained on page 71.

184
GLOSSARY OF TERMS AND ABBREVIATIONS
PPL Corporation and its subsidiaries p
KU - Kentucky Utilities Company, a public utility subsidiary of LKE engaged in the regulated generation, transmission, Udistribution and sale of electricity, primarily in Kentucky.
LG&E - Louisville Gas and Electric Company, a public utility subsE idiary of LKE engaged in the regulated generation,transmission, distribution and sale of electricity and the distribution and sale of natural gas in Kentucky.
LKE - LG&E and KU Energy LLC, a subsidiary of PPL and the parent of LG&E, KU and other subsidiaries.
LKS - LG&E and KU Services Company, a subsidiary of LKE that provides administrative, management and support services primarily to LKE and its subsidiaries.
PPL - PPL Corporation, the parent holding company of PPL Electric, PPL Energy Funding, PPL Capital Funding, LKE and other subsidiaries.
PPL Capital Funding - PPL Capital Funding, Inc., a financing subsidiary g of PPL that provides financing for the operations of PPL and certain subsidiaries. Debt issued by PPL Capital Funding is guaranteed as to payment by PPL.
PPL Electric - PPL Electric Utilities Corporation, a public utility subsidiac ry of PPL engaged in the regulated transmission and distribution of electricity in its Pennsylvania service area and that provides electricity supply to its retail customers in this area as a PLR.
PPL Energy Funding - PPL Energy Funding Corporation, a subsidiary of PPL and the parent holding company of PPL gGlobal and other subsidiaries.
PPL EU Services - PPL EU Services Corporation, a subsidiary of PPL that provides administrative, management and support services primarily to PPL Electric.
PPL Global - PPL Global, LLC, a subsidiary of PPL Energy Fundingl that, primarily through its subsidiaries, owns and operates WPD, PPL's regulated electricity distribution businesses in the U.K.y
PPL Services - PPL Services Corporation, a subsidiary of PPL that provides administrative, management and support services to PPL and its subsidiaries.
PPL WPD Limited - an indirect U.K. subsidiary d of PPL Global. Following a reorganization in October 2015 and October 2017, PPL WPD Limited is an indirect parent to WPD plc having previously been a sister company.y
Safari Energy - Safari Energy, LLC, an indirect subsidiary of PPL, acquired in June 2018, that provides solar energysolutions for commercial customers in the U.S.
WPD - refers to PPL WPD Limited and its subsidiaries.
WPD (East Midlands) - Western Power Distribution (East Midlands) plc, a British regional electricity distribution utility company.
WPD plc - Western Power Distribution plc, an c indirect U.K. subsidiary of PPL WPD Limited. Its principal indirectly owned subsidiaries are WPD (East Midlands), WPD (South Wales), WPD (South West) and WPD (West Midlands).h
WPD Midlands - refers to WPD (East Midlands) and WPD (West Midlands), collectively.
WPD (South Wales) - Western Power Distribution (South Wales) plc, a British regional electricity distribution utilitycompany.
WPD (South West) - Western Power Distribution (South West) plc, a British regional electricity distribution utility company.

185
WPD (West Midlands) - Western Power Distribution (West Midlands) plc, a British regional electricity distribution utilitycompany.
WKE - Western Kentucky Energy Corp., a subsidiary of LKE thE at leased certain non-regulated utility generating plants inwestern Kentucky until July 2009.
Other terms and abbreviations
£ - British pound sterling.
401(h) account(s) - a sub-account established within a qualified pension trust to provide for the payment of retiree medical costs.
Act 11 - Act 11 of 2012 that became effective on April 16, 2012. The Pennsylvania legislation authorized the PUC to approvetwo specific ratemaking mechanisms: the use of a fully projected future test year in base rate proceedings and, subject to certainconditions, a DSIC.
Act 129 - Act 129 of 2008 that became effective in October 2008. The law amended the Pennsylvania Public Utility Code and created an energy efficiency and conservation program and smart metering technology requirements, adopted new PLR electricity supply procurement rules, provided remedies for market misconduct and changed the Alternative Energy Portfolio Standard (AEPS).
Act 129 Smart Meter program - PPL Electric's system-wide meter replacement program that installs wireless digital metersthat provide secure communication between PPL Electric and the meter as well as all related infrastructure.
Adjusted Gross Margins - a non-GAAP financial measure of performance used in "Combined Management's Discussion and Analysis of Financial Condition and Results of Operations" (MD&A).
Advanced Metering System - meters and meter-reading systems that provide two-way communication capabilities, which communicate usage and other relevant data to LG&E and KU at regular intervals, and are alsot able to receive information from LG&E and KU, such as software upgrades and requests to provide meter readings in real time.
AFUDC - allowance for funds used during construction. The cost ofC equity and debt funds usedf to finance construction projectsof regulated businesses, which is capitalized as part of construction costs.
AIP - annual iteration process.P
AOCI - accumulated other comprehensive income or loss.I
ARO - asset retirement obligation.O
ATM Program - at-the-market stock offering program.
Cane Run Unit 7 - a natural gas combined-cycle generating unit in Kentucky, jointly owned by LG&E and KU.7
CCR(s) - coal combustion residual(s). CCRs include fly ash, bottom ash and sulfur dioxide scrubber wastes.
CDP - a not-for-profit organization based in the United Kingdom formerly known as the Carbon Disclosure Project; that runs the global disclosure system that enables investors, companies, cities, states and regions to measure and manage their environmental impacts.
Clean Air Act - federal legislation enacted to address certain environmental issues related to air emissions, including acid rain, tozone and toxic air emissions.
Clean Water Act - federal legislation enacted to address certain environmental issues relating to water quality includingteffluent discharges, cooling water intake, and dredge and fill activities.
186
COBRA - Consolidated Omnibus Budget Reconciliation Act, which provides individuals the option to temporarily continueemployer group health insurance coverage after termination of employment.
CPCN - Certificate of Public Convenience and Necessity. AuthorN ity granted by the KPSC pursuant to Kentucky Revised Statute 278.020 to provide utility service to or for the public or the construction of certain plant, equipment, property or facility for furnishing of utility service to the public.
CPIH - Consumer Price Index including owner-occupiers' housing costs. An aggregate measure of changes in the cost of living Hin the U.K., including a measure of owner-occupiers' housing costs.f
Customer Choice Act - the Pennsylvania Electricity Generation Customert Choice and Competition Act, legislation enacted rto restructure the state's electric utility industry to create retail access to a competitive market for generation of electricity.
DNO - Distribution Network Operator in the U.K.O
DPCR5 - Distribution Price Control Review 5 5, the U.K. five-year rate review period applicable to WPD that commenced April 1, 2010.
DRIP - PPL Amended and Restated Dividend ReinP vestment and Direct Stock Purchase Plan.
DSIC - Distribution System Improvement Charge. Authorized unC der Act 11, which is an alternative ratemaking mechanism providing more-timely cost recovery of qualifying distribution system capital expenditures.
DSM - Demand Side Management. Pursuant to Kentucky Revised Statute 278.285, the KPSC may determine the reasonableness of DSM programs proposed by any utility under its jurisdiction. DSM programs consist of energy efficiencyprograms intended to reduce peak demand and delay the investment in additional power plant construction, provide customers twith tools and information regarding their energy usage and support energy efficiency.
DUoS - Distribution Use of System. The charge to licensed third party energy suppliers who are WPD's customers and use SWPD's networks to deliver electricity to their customers, the end-users.
Earnings from Ongoing Operations - a non-GAAP financial measure of earnings adjusted for the impact of special items and used in "Combined Management's Discussion and Analysis of Financial Condition and Results of Operations" (MD&A).
EBPB - Employee Benefit Plan Board. The administrator of PPL's U.S. qualified retirement plans, which is charged with thefiduciary responsibility to oversee and manage those plans and the investments associated with those plans.
ECR - Environmental Cost Recovery. Pursuant to Kentucky Re- vised Statute 278.183, Kentucky electric utilities are entitled to the current recovery of costs of complying with the Clean Air Act, as amended, and those federal, state or local environmentalrequirements that apply to coal combustion wastes and by-products from the production of energy from coal.
ELG(s) - Effluent Limitation Guidelines, regulations promulgated by the EPA.
EPA - Environmental Protection Agency, a U.S. government agency.
EPS - earnings per share.S
Fast pot - Under RIIO-ED1, Totex costs that are recovered in the period they are incurred.t
FERC - Federal Energy Regulatory Commission, the U.S. fedeC ral agency that regulates, among other things, interstate transmission and wholesale sales of electricity, hydroelectric power projects and related matters.
GAAP - Generally Accepted Accounting Principles in the U.S.P
GBP - British pound sterling.P
GHG(s) - greenhouse gas(es).

187
GLT -T gas line tracker. The KPSC approved mechanism for LG&E's recovery of costs associated with gas transmission lines, gas service lines, gas risers, leak mitigation, and gas main replacements.
GWh - gigawatt-hour, one million kilowatt hours.
HB 487 - House Bill 487. Comprehensive Kentucky state tax legislation enacted on April 27, 2018.
IBEW - International Brotherhood of Electrical Workers.
ICP - The PPL Incentive Compensation Plan. This plan provides for incentive compensation to PPL's executive officers and Pcertain other senior executives. New awards under the ICP were suspended in 2012 upon adoption of PPL's 2012 Stock Incentive Plan.
ICPKE - The PPL Incentive Compensation Plan for Key Employees. The ICPKE provides for incentive compensation tocertain employees below the level of senior executive.
IRS - Internal Revenue Service, a U.S. government agency.
IT - Information Technology.
KPSC - Kentucky Public Service Commission, the state agency that has jurisdiction over the regulation of rates and service of utilities in Kentucky.
KU 2010 Mortgage Indenture - KU's Indenture, dated as of October 1, 2010, to The Bank of New York Mellon, as supplemented.
kWh - kilowatt hour, basic unit of electrical energy.
LCIDA - Lehigh County Industrial Development Authority.
LG&E 2010 Mortgage Indenture - LG&E's Indenture, dated as of October 1, 2010, to The Bank of New York Mellon, as supplemented.
LIBOR - London Interbank Offered Rate.
MATS - Mercury and Air Toxics Standards, regulations promulgated by the EPA.
Mcf - one thousand cubic feet, a unit of measure for natural gas.f
MMBtu - one million British Thermal Units.
MOD - a mechanism applied in the U.K. to adjust allowed baseD revenue in future periods for differences in prior periodsbetween actual values and those in the agreed business plan.
Moody's - Moody's Investors Service, Inc., a credit rating agency.
MPR- Mid-period review, a review of output requirements in RIIO-ED1 covering material changes to existing outputs that canbe justified by clear changes in government policy or new outputs that may be needed to meet the needs of consumers and other network users. On April 30, 2018, Ofgem decided not to engage in a mid-period review of the RIIO-ED1 price-controlperiod.
MW - megawatt, one thousand kilowatts.W
NAAQS - National Ambient Air Quality Standards periodically adopted pursuant to the Clean Air Act.S
NERC - North American Electric Reliability Corporation.C

188
New Source Review - a Clean Air Act program that requires industriw al facilities to install updated pollution controlequipment when they are built or when making a modification that increases emissions beyond certain allowable thresholds.
NPNS - the normal purchases and normal sales exception as permitteS d by derivative accounting rules. Derivatives that qualifyfor this exception may receive accrual accounting treatment.
OCI - other comprehensive income or loss.I
Ofgem - Office of Gas and Electricity Markets, the British agency that regulates transmission, distribution and wholesale sales of electricity and gas and related matters.
OVEC -C Ohio Valley Electric Corporation, located in Piketon, Ohio, an entity in which LKE indirectly owns an 8.13% interest (consists of LG&E's 5.63% and KU's 2.50% interests), which is recorded at cost. OVEC owns and operates two coal-fired power plants, the Kyger Creek plant in Ohio and the Clifty Creek plant in Indiana, with combined capacities of 2,120 MW.
PEDFA - Pennsylvania Economic Development Financing Authority.
Performance unit - stock-based compensation award that represents a vat riable number of shares of PPL common stock that aa recipient may receive based on PPL's attainment of (i) relative total shareowner return (TSR) over a three-year performanceperiod as compared to companies in the Philadelphia Stock Exchange Utility Index; or (ii) corporate return on equity (ROE) based on the average of the annual ROE for each year of the three-year performance period.
PJM - PJM Interconnection, L.L.C., operator of the electricity tranM smission network and electricity energy market in all or parts of Delaware, Illinois, Indiana, Kentucky, Maryland, Michigan, New Jersey, North Carolina, Ohio, Pennsylvania,Tennessee, Virginia, West Virginia and the District of Columbia.
PLR - Provider of Last Resort, the role of R PPL Electric in providing default electricity supply within its delivery area to retailucustomers who have not chosen to select an alternative electricity supplier under the Customer Choice Act.
PP&E - property, plant and equipment.
PPL EnergyPlus - prior to the June 1, 2015 spinoff of PPL Energy Supply, LLC, PPL EnergyPlus, LLC, a subsidiary of PPL Energy Supply that marketed and traded wholesale and retail electricity and gas, and supplied energy and energy services in competitive markets.
PPL Energy Supply - prior to the June 1, 2015 spinoff, PPL Energyy Supply, LLC, a subsidiary of PPL Energy Funding and ythe parent company of PPL EnergyPlus and other subsidiaries.
PPL Montana - Prior to the June 1, 2015 spinoff of PPL Energy Supply, PPL Montana, LLC, an indirect subsidiary of PPL Energy Supply that generated electricity for wholesale sales in Montana and the Pacific Northwest.
PUC - Pennsylvania Public Utility Commission, the state agency that regulates certain ratemaking, services, accounting and operations of Pennsylvania utilities.
RAV - regulatory asset value. This term, usV ed within the U.K. regulatory environment, is also commonly known as RAB or regulatory asset base. RAV is based on historical investment costs at time of privatization, plus subsequent allowed additionsless annual regulatory depreciation, and represents the value on which DNOs earn a return in accordance with the regulatory cost of capital. RAV is indexed to Retail Price Index (RPI) in order to allow for the effects of inflation. RAV additions have been based on a percentage of annual total expenditures that have a long-term benefit to WPD (similar to capital projects for tthe U.S. regulated businesses that are generally included in rate base).
RCRA - Resource Conservation and Recovery Act of 1976.
Registrant(s) - refers to the Registrants named on the cover of this Report (each a "Registrant" and collectively, the "Registrants").
RFC - ReliabilityFirst Corporation, one of eight regional entities wC ith delegated authority from NERC that work to safeguard the reliability of the bulk power systems throughout North America.
189
RIIO - Ofgem's framework for setting U.K. regulated gas and elO ectric utility price controls which stands for "Revenues = Incentive + Innovation + Outputs." RIIO-1 refers to the first generation of price controls under the RIIO framework. RIIO-ED1refers to the RIIO regulatory price control applicable to the operators of U.K. electricity distribution networks, the duration of nwhich is April 2015 through March 2023. RIIO-2 refers to the second generation of price controls under the RIIO framework.RIIO-ED2 refers to the second generation of the RIIO regulatory price control applicable to the operators of U.K. electricity distribution networks, which will begin in April 2023.
Riverstone - Riverstone Holdings LLC, a Delaware limited liability company and, as of December 6, 2016, ultimate parent company of the entities that own the competitive power generation business contributed to Talen Energy.
RPI - retail price index, is a measure of inflation in the UniteI d Kingdom published monthly by the Office for NationalStatistics.
Sarbanes-Oxley - Sarbanes-Oxley Act of 2002, which sets requirements for management's assessment of internal controlsfor financial reporting. It also requires an independent auditor to make its own assessment.
SCRs - selective catalytic reduction, a pollution cos ntrol process for the removal of nitrogen oxide from exhaust gas.
Scrubber - an air pollution control device that can remove particulr ates and/or gases (primarily sulfur dioxide) from exhaust gases.
SEC - the U.S. Securities and Exchange Commission, a U.S. governC ment agency primarily responsible to protect investors and maintain the integrity of the securities markets.
SERC - SERC Reliability Corporation, one of eight regional enC tities with delegated authority from NERC that work to safeguard the reliability of the bulk power systems throughout North America.f
SIP - PPL Corporation's Amended and Restated 2012 Stock Incentive Plan.P
Slow pot - Under RIIO-ED1, Totex costs that are added (capitalized) to RAV and recovered through depreciation over a 20 to t45 year period.
Smart metering technology - technology that can measure, among other things, time of electricity consumption to permit yoffering rate incentives for usage during lower cost or demand intervals. The use of this technology also has the potential tostrengthen network reliability.
S&P - S&P Global Ratings, a credit rating agency.P
Superfund - federal environmental statute that addresses remediation of contaminated sites; states also have similar statutes.d
Talen Energy - Talen Energy Corporation, the Delawarey corporation formed to be the publicly traded company and owner of the competitive generation assets of PPL Energy Supply and certain affiliates of Riverstone, which as of December 6, 2016, became wholly owned by Riverstone.
Talen Energy Marketing - Talen Energy Marketing, LLC, the new name of g PPL EnergyPlus subsequent to the spinoff of PPL Energy Supply.
TCJA - Tax Cuts and Jobs Act. Comprehensive U.S. federal tax legislation enacted on December 22, 2017.d
Total shareowner return - the change in market value of a share of the company's common stock plus the value of alldividends paid on a share of the common stock during the applicable performance period, divided by the price of the common stock as of the beginning of the performance period. The price used for purposes of this calculation is the average share pricefor the 20 trading days at the beginning and end of the applicable period.

190
Totex (total expenditures) - Totex generally consists of all the expenditures relating to WPD's regulated activities with theexception of certain specified expenditure items (Ofgem fees, National Grid transmission charges, property and corporateincome taxes, pension deficit funding and cost of capital). The annual net additions to RAV are calculated as a percentage of Totex. Totex can be viewed as the aggregate net network investment, net network operating costs and indirect costs, less any ttcash proceeds from the sale of assets and scrap.
Treasury Stock Method - a method applied to calculated diluted EPS that assumes any proceeds that could be obtained uponexercise of options and warrants (and their equivalents) would be used to purchase common stock at the average market priceduring the relevant period.
TRU - a mechanism applied in the U.K. to true-up iU nflation estimates used in determining base revenue.
U.K. Finance Act - refers to the U.K. Fit nance Act of 2016, enacted in September 2016, which reduced the U.K. statutory corporate income tax rate from 19% to 17%, effective April 1, 2020.
VEBA - Voluntary Employee Beneficiary Association. A tax-exempt trust under the Internal Revenue Code Section 501 (c)(9) used by employees to fund and pay eligible medical, life and similar benefits.
VSCC - Virginia State Corporation Commission, the state agencyC that has jurisdiction over the regulation of Virginiacorporations, including utilities.

DIRECTORS & OFFICERS
DIRECTORS
Rodney C. Adkins, 60, President of 3RAM Group, LLC, an investment, consulting and property management firm. He retired as a Senior Vice President of International Business Machines Corporation, a globally integrated technology and consulting company.
John W. Conway, 73, retired Chief Executive Officer of Crown Holdings, Inc., aninternational manufacturer of packaging products for consumer goods. He remains Chairman of the Board of Crown Holdings.
Steven G. Elliott, 72, retired Senior Vice Chairman of The Bank of New York Mellon Corporation, an investment management and investment servicing company.
Raja Rajamannar, 57, Chief Marketing & Communications Officer and President, Healthcare, of MasterCard International Incorporated, a technology company in theglobal payments industry.
Craig A. Rogerson, 62, Chairman, President and Chief Executive Officer of Hexion Inc.,a global producer of thermoset resins as well as other chemical platforms serving awide range of market applications.
William H. Spence, 62, Chairman, President and Chief Executive Officer of PPL Corporation.
Natica von Althann, 68, a founding partner of C&A Advisors, a consulting firm in thefinancial services and risk management areas, from 2009 until 2013. She retired in 2008 as the Senior Credit Risk Management Executive for Bank of America and Chief Credit Officer of U.S. Trust, an investment management company.
Keith H. Williamson, 66, Executive Vice President, Secretary and General Counsel of Centene Corporation, a provider of Medicaid-managed care and specialty healthcare services for under-insured and uninsured individuals.
Phoebe A. Wood, 65, principal of CompaniesWood, a consulting firm specializing in early stage investments. She is the former Vice Chairman and Chief Financial Officer of Brown-Forman Corporation, a diversified consumer products manufacturer.
Armando Zagalo de Lima, 60, retired as an Executive Vice President of Xerox Corporation, a multinational enterprise for business process and document management.
BOARD COMMITTEES
Executive CommitteeWilliam H. Spence, ChairJohn W. ConwaySteven G. ElliottCraig A. RogersonNatica von Althann
Audit CommitteeSteven G. Elliott, ChairRodney C. AdkinsRaja RajamannarCraig A. RogersonKeith H. WilliamsonArmando Zagalo de Lima
Compensation, Governanceand Nominating CommitteeCraig A. Rogerson, ChairJohn W. ConwayRaja RajamannarNatica von AlthannPhoebe A. Wood
Finance CommitteeNatica von Althann, ChairRodney C. AdkinsJohn W. ConwaySteven G. ElliottKeith H. WilliamsonArmando Zagalo de Lima
EXECUTIVE OFFICERS
William H. Spence, Chairman, President and Chief Executive Officer, PPL CorporationJoanne H. Raphael, Executive Vice President, General Counsel and Corporate Secretary, PPL CorporationVincent Sorgi, Executive Vice President and Chief Financial Officer, PPL CorporationGregory N. Dudkin, President, PPL Electric Utilities CorporationPhilip Swift, Chief Executive, Western Power DistributionPaul W. Thompson, Chairman, Chief Executive Officer and President, LG&E and KU Energy LLCMarlene C. Beers, Vice President and Controller, PPL CorporationTadd J. Henninger, Vice President and Treasurer, PPL Corporation
PPL Corporation 2018 Annual Report v

SHAREOWNER INFORMATION
Annual Meeting Shareowners are invited to attend PPL Corporation's AnnualMeeting on Tuesday, May 14, 2019, at the Hyatt Regency Lexington, 401 West High St., Lexington, Kentucky. The meeting will begin at 9 a.m. Eastern Time.
Stock Exchange Listing PPL Corporation common stock is listed on the New York Stock Exchange (NYSE). The symbol is PPL. On March 15, 2019, the closing price per share was $32.74, and there were 53,267 shareowners of record.
2018
High Low DividendsDeclared
1st quarter $32.45 $27.08 $0.412nd quarter 29.71 25.30 0.413rd quarter 31.10 27.64 0.414th quarter 32.46 27.31 0.41
2017
High Low DividendsDeclared
1st quarter $37.95 $33.72 $0.3952nd quarter 40.20 36.91 0.3953rd quarter 39.90 37.19 0.3954th quarter 38.55 30.74 0.395
The company has paid cash dividends on its common stock in every quarter since 1946. The annualized dividend was$1.64 per share in 2018 and $1.58 per share in 2017. On February 14, 2019, PPL declared a quarterly dividend of $0.4125 per share (equivalent to $1.65 annualized), effectivewith the dividend paid April 1, 2019, to shareowners of recordon March 8, 2019.
Dividend Calendar Subject to the declaration of dividends on PPL Common Stock by the PPL Board of Directors or its Executive Committee, dividends are paid on the first business day of April, July, October and January. The record dates fordividends for the balance of 2019 are expected to be June 10,September 10 and December 10.
PPL's Website: www.pplweb.com
Shareowners can access PPL publications such as annual and quarterly reports to the Securities and Exchange Commission (SEC Forms 10-K and 10-Q), other PPL filings, corporate governance materials, news releases, slide presentations,stock quotes and historical performance information. Visitorsto our website may subscribe to receive automated email alerts for SEC filings, earnings news releases, daily stock pricesand other financial news.
Financial reports, which are available at www.pplweb.com, will be mailed without charge upon request by contacting:
PPL Treasury Dept.Two North Ninth Street, Allentown, PA 18101Email: [email protected]: PPL Corporate Offices, 610-774-5151, orEQ Shareowner Services, 1-800-345-3085
Lost Dividend Checks Dividend checks lost by investors, or those that may be lost in the mail, will be replaced if the check has not been located bythe 10th business day following the payment date.
Direct Stock Purchase and Dividend Reinvestment Plan (Plan) PPL offers investors the opportunity to acquire shares of PPL common stock through its Plan. Through the Plan,participants are eligible to invest up to $25,000 per calendar month in PPL common stock. Shareowners may choose to have dividends on their PPL Corporation common stock fully or partially reinvested in PPL common stock, or can receive full payment of cash dividends by check or EFT. Participants in the Plan may choose to have their common stock certificates deposited into their Plan account.
Direct Registration System PPL participates in the Direct Registration System (DRS). Shareowners may choose to have their common stock certificates converted to book-entry form within the DRS by submitting their certificates to PPL's transfer agent.
Online Account Access Registered shareowners can activate their account for online access by visiting shareowneronline.com.
Shareowner Inquiries, Transfer Agent and Registrar; Dividend Disbursing Agent; Plan Administrator
Equiniti Trust Company EQ Shareowner Services1110 Centre Pointe Curve, Suite 101Mendota Heights, MN 55120Toll-free: 1-800-345-3085Outside U.S.: 1-651-450-4064Website: shareowneronline.com
Corporate Offices PPL CorporationTwo North Ninth StreetAllentown, PA 18101610-774-5151
PPL and the PPL logo are trademarks of PPL Corporation or an affiliate.
© 2019 PPL Corporation. All rights reserved.
VI PPL Corporation 2018 Annual Report


PPL Corporation | Two North Ninth Street, Allentown PA 18101-1179 | www.pplweb.com