2.presentasi corsec february 2011 - erik agustian · 8/2/2011 · tarahan port tanjung stockpile :...
TRANSCRIPT

Bukit Asam
CORPORATE PRESENTATIONFebruary 2011
1

••HighlightsHighlights••OverviewOverviewOverviewOverview••Financial and Financial and CommercialCommercial PerformancePerformance
••Growth OptionsGrowth Optionspp
2

3
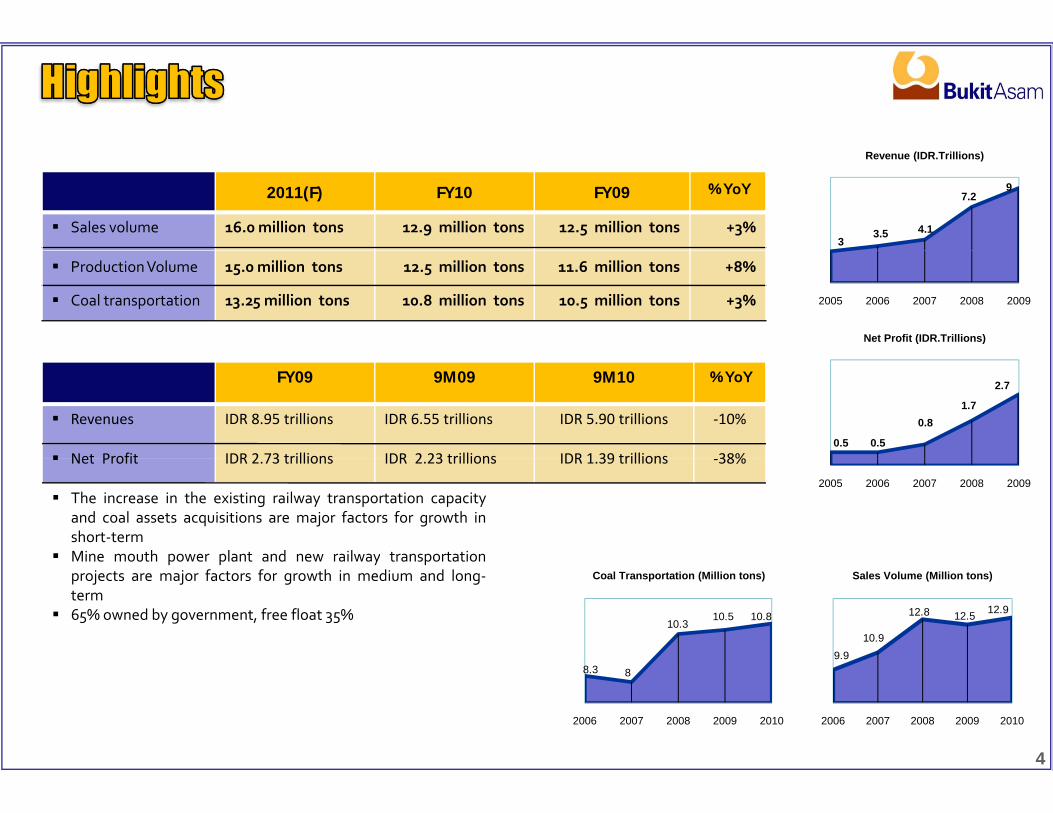
2011(F) FY10 FY09 % YoY
Sales volume 16.0 million tons 12.9 million tons 12.5 million tons +3%3
3.5 4.1
7.29
Revenue (IDR.Trillions)
ProductionVolume 15.0 million tons 12.5 million tons 11.6 million tons +8%
Coal transportation 13.25 million tons 10.8 million tons 10.5 million tons +3%
Net Profit (IDR.Trillions)
2005 2006 2007 2008 2009
FY09 9M09 9M10 % YoY
Revenues IDR 8.95 trillions IDR 6.55 trillions IDR 5.90 trillions ‐10%
Net Profit IDR 2 73 trillions IDR 2 23 trillions IDR 1 39 trillions 38%0.5 0.5
0.81.7
2.7
The increase in the existing railway transportation capacityand coal assets acquisitions are major factors for growth inshort‐term
Mine mouth power plant and new railway transportation
Net Profit IDR 2.73 trillions IDR 2.23 trillions IDR 1.39 trillions ‐38%
2005 2006 2007 2008 2009
p p y pprojects are major factors for growth in medium and long‐term
65% owned by government, free float 35%
Sales Volume (Million tons)Coal Transportation (Million tons)
10.5
8 3
10.310.8
9.9
10.9
12.8 12.5 12.9
4
2006 2007 2008 2009 20102006 2007 2008 2009 2010
8.3 8

5

MINING BUSINESS LICENSE (IUP) MINING BUSINESS LICENSE (IUP) Tanjung Enim Mine : 66,414 Ha Ombilin Mine : 3,950 HaPeranap/Cerenti Mine : 17,100 HaIPC Mine : 3,238 HaTOTAL : 90,702 Ha
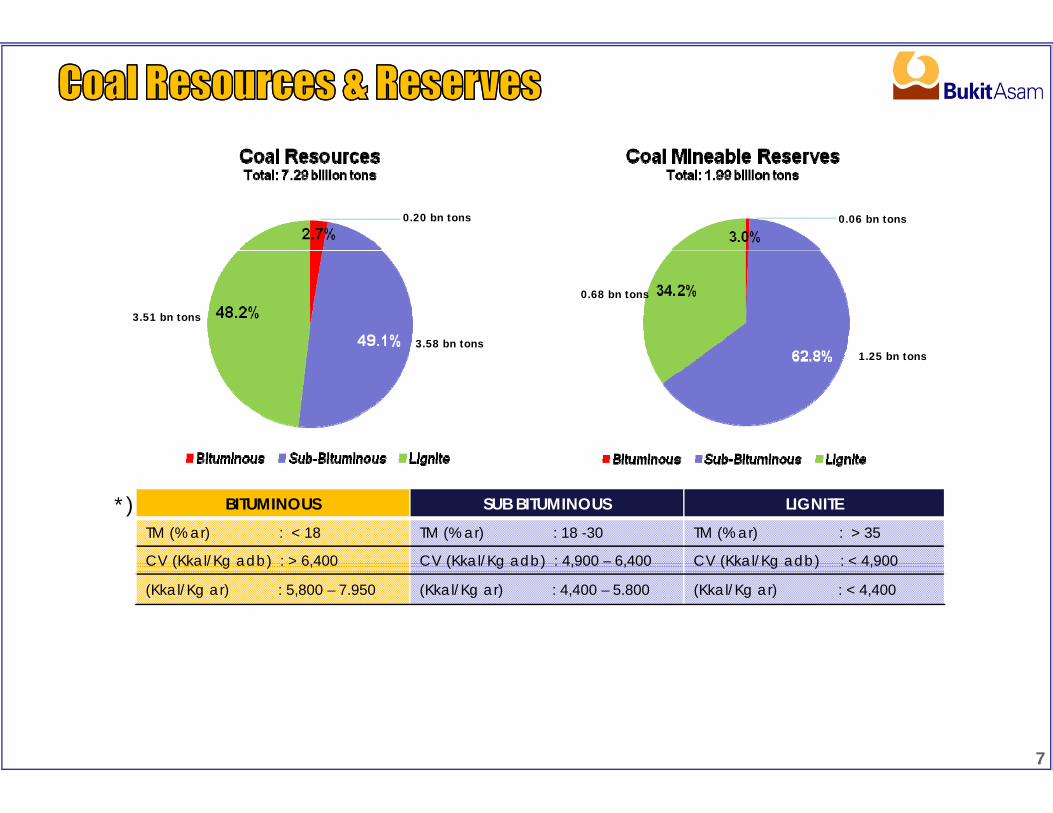
Total Resources : 7.29 billion tonsTotal Mineable Reserves : 1.99 billion tons
PERANAP/CERENTI MINERecources : 0.79 billion tonsMineable : 0.37 billion tons
KERTAPATI PIER
Padang
SamarindaPekan Baru
Stockpile : 50.000 tonsTroughput : 2.5 million tons/annumBarge Max. : 8,000 DWT
Palembang
Padang
TELUK BAYUR PORTStockpile : 90,000 tonsTroughput : 2.5 million tons/annumVessel Max : 40 000 DWT
TANJUNG ENIM MINEResources : 6.36 billion tonsMineable : 1.59 billion tons *)
Installed Cap. : 20 million tons/annum
Tanj ng EnimExisting Railway
IPC MINEResources : 0.045 billion tonsMineable : 0.01 billion tons
Vessel Max. : 40,000 DWT
OMBILIN MINEResources : 0.10 billion tonsMineable : 0.02 billion tons
TARAHAN PORT
Tanjung Enim
Stockpile : 560,000 tonsTroughput : 12 million tons/annumVessel Max : 80,000 DWT
*) include mineable reserve in disputed area Lahat (0.22 billion tons).6
0.20 bn tons 0.06 bn tons
3.58 bn tons
0.68 bn tons
1 25 bn tons
3.51 bn tons
1.25 bn tons
*) BITUMINOUS SUB BITUMINOUS LIGNITETM (% ar) : < 18 TM (% ar) : 18 -30 TM (% ar) : > 35
CV (Kkal/Kg adb) : > 6 400 CV (Kkal/Kg adb) : 4 900 – 6 400 CV (Kkal/Kg adb) : < 4 900CV (Kkal/Kg adb) : > 6,400 CV (Kkal/Kg adb) : 4,900 6,400 CV (Kkal/Kg adb) : < 4,900
(Kkal/Kg ar) : 5,800 – 7.950 (Kkal/Kg ar) : 4,400 – 5.800 (Kkal/Kg ar) : < 4,400
7

Seaborne thermal coal demand by region Pasific basin Seaborne thermal coal demand 2009 ‐ 2025y g
OtherAmericas
OtherPhillippinesThailandMalaysia
EuropeAsia
MalaysiaTaiwanSouth KoreaJapanChinaIndia
Mt
300
Source : Wood Mackenzie Coal Market Service, Juni 2010 Source : Wood Mackenzie Coal Market Service, Juni 2010
Seaborne thermal coal export supply Spot & Term Contract PriceGl
120140160180200
150
200
250
2010
p pp y
Mt
Global Index on 1 January 2010 = USD 84,75Global Index on 18 Feb 2011 = USD 126.64ICI 6.500 GAR on 18 Feb 2011 = USD 124.90ICI 5.800 GAR on 18 Feb 2011 = USD 98.74ICI 5.000 GAR on 18 Feb 2011 = USD 80.19ICI 4.200 GAR on 18 Feb 2011 = USD 51.44Australian Ref. Price JFY10 = USD 90
USD
020406080
100Ja
n-07
Feb-
07M
ar-0
7M
ar-0
7A
pr-0
7M
ay-0
7Ju
n-07
-Jul
-07
Aug
-07
Sep
-07
Oct
-07
Nov
-07
Dec
-07
Jan-
08Ja
n-08
Feb-
08M
ar-0
8A
pr-0
8M
ay-0
8Ju
n-08
-Jul
-08
Aug
-08
Sep
-08
Oct
-08
Nov
-08
Dec
-08
Jan-
09Fe
b-09
Mar
-09
Apr
-09
May
-09
May
-09
Jun-
09-J
ul-0
9A
ug 0
9S
ep-0
9O
ct-0
9N
ov-0
9D
ec-0
9Ja
n-10
Feb-
10M
ar-1
0A
pr-1
0A
pr-1
0M
ay-1
0Ju
n-10
-Jul
-10
Aug
-10
Sep
-10
Oct
-10
Nov
-10
Dec
-10
Dec
-10
Jan-
11
0
50
100
esia
ralia
ssia
fric
a
mbi
a
nam
nam
ther
USA uela
2010
2011
2012
M
4-J
1-F
1-M
29-M
26-A
24-M
21-J
19-
16-A
13-S
11-O
8-N
6-D
3-J
31-J
28-F
27-M
24-A
22-M
19-J
17-
14-A
11-S 9-O
6-N
4-D
8-J
5-F
5-M
2-A
1-M
29-M
26-J
24-
21 A
18-S
16-O
13-N
11-D 8-J
5-F
5-M
2-A
30-A
28-M
25-J
23-
20-A
17-S
15-O
5-N
3-D
31-D
28-J
Global Index ICI 6,500 GAR ICI 5,800 GAR ICI 5,000 GAR ICI 4,200 GARIndo
ne
Aus
tr
Rus
Sout
h A
f
Col
om
Viet
n
Viet
n Ot U
Vene
zu
Source : Wood Mackenzie Coal Market Service, Juni 2010
Source : Global Coal, ICI
Australian Ref. Price
8

P j t d I d i C l S l & D d N ti l E P li
220198 206 201 191254 270
321361 405
Projected Indonesian Coal Supply & Demand(Million tons)
National Energy Policy
20%
5%5%2%1.6%
2.6%
18.8%Oil
Nat.gasCoal
WaterGeothermal
5%
56 64 120170
198 206 201 191185
2009 2010 2015 2020 2025Domestic E port Prod ction 33%
30%28.6%
GeothermalRenewable
CTLBiofuel
Domestic Export Production
Sources : Ministry of Energy and Mineral Resources , Coaltrans Bali ,May 2010
Estimated Coal Consumption for Electricity (PLN)
2008 2025
33%48.4%
Electricity SupplySources : Ministry of Energy and Mineral Resources , Coaltrans Bali ,May 2010
25.832.2
35.4
44.3
27.7 28.7
36.943.2 42.1
p y ( )
(In million tons)
GasPumped Storage
Hydro HSD (High Speed Diesel)
O ( l O l)
14%
4%
1%
16%
6%
4%6%
3%
5%
y pp y
40.8
59.478 87.5 95.3
8.2
25.8
4.9 4.98.9 8.9 8.9
2010 2011 1012 2013 2014
MFO (Marine Fuel Oil)LNGCoal
Geothermal
59%
14%
43%
25%
9
4200 Koal/kg AR 5100 Koal/kg AR 6100 Koal/kg AR
Sources : PLN, Coaltrans Bali, May 2010
Total Consumption
Sources : PLN, January 2010
2009 2019
43%

10

Total Cash Cost (FOB) C iti f T t l C t 9M10Total Cash Cost (FOB) Composition of Total Cost 9M10
Railway Service24%
Rental of heavy equipments
7%
Shipping5%
Spare Parts3%
Fuel3%
Third-party2% Electricity
1%FY09 9M09 9M10 %YoY
Tanjung Enim 375,848 377,799 407,143 +9% 24%
Coal Purchase
Royalty7%
7%j gSystem*) (IDR)
, , ,
“or” (USD) 39.98 38.71 45.62 +18%
Currency : 1 USD= IDR 9,400 IDR 9,681 IDR 8.924
Stripping Ratio
Note : including COGS,G&A, Selling Expenses, Royalty, etc (excluding coal inventories)
Salaries/Wages19%
Mining Service14%
Others8%
7%
3 6 3 51
FY 09 9M09 9M10 %YoY
3.172.67 2.69
3.6 3,51
Average Selling Price (ASP)
Export (USD/ton) 64.59 69.98 65.44 -6 %
Domestic (IDR/ton) 747,417 751,428 613,214 -18 %
11
2006 2007 2008 2009 2010
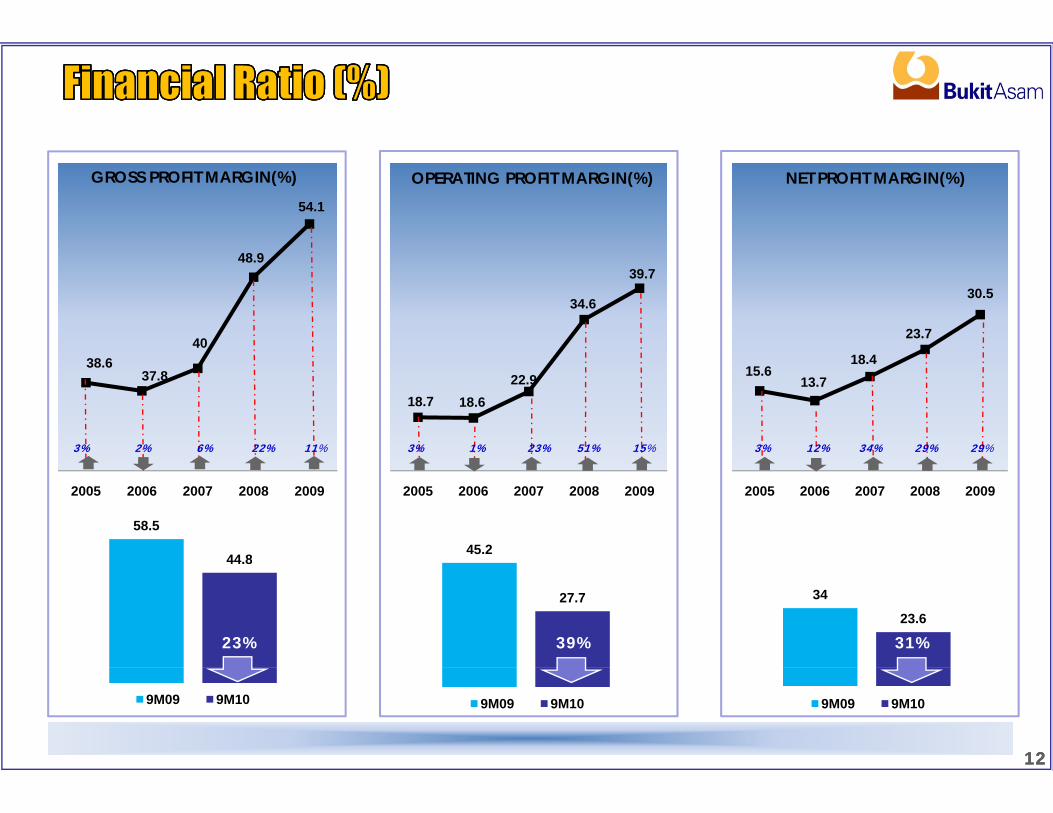
54.1
GROSS PROFIT MARGIN(%) NET PROFIT MARGIN(%)OPERATING PROFIT MARGIN(%)
34.6
39.7
40
48.9
18 4
23.7
30.5
18.7 18.622.9
38.637.8
3% 2% 6% 22% 11% 3% 1% 23% 51% 15%
15.613.7
18.4
3% 12% 34% 29% 29%
2005 2006 2007 2008 20092005 2006 2007 2008 2009 2005 2006 2007 2008 2009
58.5
44.845.2
47%53%36% 47%53%36%26% 49% 32%
44.8
27.7 34
23.6
23% 39% 31%
1212
47%53%36%
9M09 9M10 9M09 9M10 9M09 9M10
12
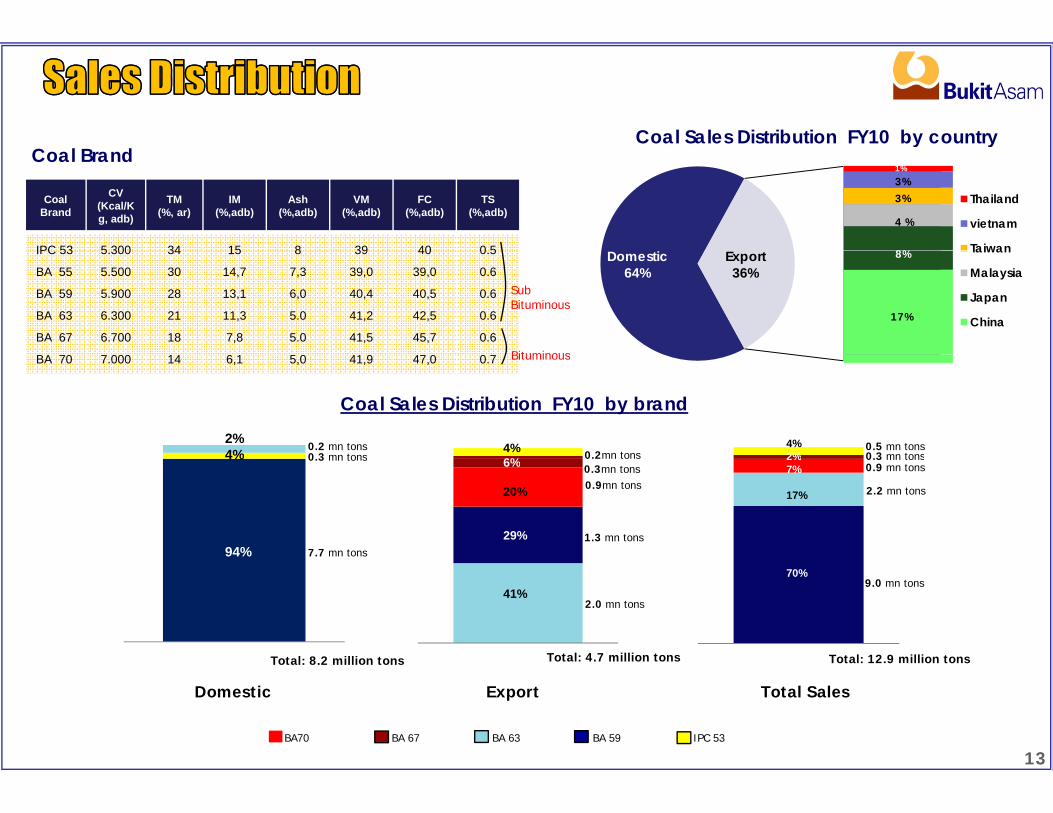
Coal Sales Distribution FY10 by country
Coal Brand
CV(Kcal/Kg, adb)
TM(%, ar)
IM(%,adb)
Ash(%,adb)
VM(%,adb)
FC(%,adb)
TS(%,adb)
IPC 53 5 300 34 15 8 39 40 0 5
y yCoal Brand
Thailand
vietnam
Taiwan
4 %
3%
8%
1%
3%
IPC 53
BA 55
BA 59
BA 63
BA 67
BA 0
5.300
5.500
5.900
6.300
6.700
000
34
30
28
21
18
14
15
14,7
13,1
11,3
7,8
6 1
8
7,3
6,0
5.0
5.0
0
39
39,0
40,4
41,2
41,5
41 9
40
39,0
40,5
42,5
45,7
4 0
0.5
0.6
0.6
0.6
0.6
0
Sub Bituminous
Bituminous
Domestic64%
Export36%
Taiwan
Malaysia
Japan
China
8%
17%
4%2%
Coal Sales Distribution FY10 by brand
BA 70 7.000 14 6,1 5,0 41,9 47,0 0.7 Bituminous
0.2 mn tons0.3 mn tons 0.2mn tons
0.5 mn tons0.3 mn tons
2%4% 4%
6% 2%7%
17%
7.7 mn tons
0.3 mn tons
1.3 mn tons
0.9mn tons
0 o 0.3 mn tons
2.2 mn tons
4%
94%
0.9 mn tons6%
20%
29%
0.3mn tons
70%
Total: 8.2 million tons Total: 4.7 million tons Total: 12.9 million tons
9.0 mn tons
2.0 mn tons41%
13
Domestic Export Total Sales
BA70 BA 67 BA 63 BA 59 IPC 53

50
Gross Profit Margin (GPM) Operating Profit Margin (OPM) Net Profit Margin (NPM)
44%
30
40
28%24%
10
20
24%
0ACI MEE BYAN BTU ITMG BUMI ADRO ANR BANPU PTBA AVERAGE
Based on Financial Report as of June 30, 2010
ACI : Arch Coal Inc. – USA (NYSE) BUMI : PT Bumi Resources – IDXADRO : PT Adaro Energi – IDX BYAN : PT Bayan Resources – IDXANR : Alpha Natural Resources,Inc.– USA (NYSE) ITMG : PT Indo Tambangraya Megah – IDXBANPU : Banpu Public Co. – USA (NYSE) MEE : Massey Energy Co. – USA (NYSE)BTU : Peabody Energy Corp. – USA (NYSE) PTBA : PT Bukit Asam – IDX
14

Description FY09 9M09 9M10 (%) YoY
(in billions of IDR)
Sales 8.947,85 6.554,89 5.901,73 -10%
COGS 4.104,30 2.721,71 3.257,18 +20%
Operating Income 3.548,32 2.962,21 1.633,44 -45%
EBITDA 3.845,56 3.187,08 1.874,40 -41%
Net Income 2.727,73 2.228,21 1.389,89 -38%
Assets 8.078,58 7.492,16 8.277,63 +10%
Cash 4.709,10 2.629,36 4.844,31 +84%
(in percentage)
Net Margin 30.5% 34% 23.6%
Return On Asset 34% 30% 17%
Return On Equity 48% 42% 24%
Return On Investment 48% 43% 23%
15
16

Existing Railway Project Project objective : increase capacity to 22.7 million tons / annum TE – Tarahan : 416.6 KmTE‐Kertapati : 167.6 Km Expected Completion : 2014
New Railway Project
Capacity : 25.0 million tons / annum Parties : PTBA; Transpacific Railway Infrastructure;
China Railway EngineeringDistance : 307 Km Expected COD : 2014
PALEMBANG
Expected COD : 2014
TANJUNG ENIM MINE
KERTAPATI PIER
Prabumulih
Muara Enim
KERTAPATI
Lahat
Pendopo
Baturaja
Lahat
TARAHAN PORT
STOCKPILE
BANJARSARI Mine Mouth Power Plant2 x 100 MW
Parties : PTBA; PJB; NII Coal Consumption : 1.0 miilion tons / annum Expected COD : 2013
17
NEW PORT
Expected COD : 2013
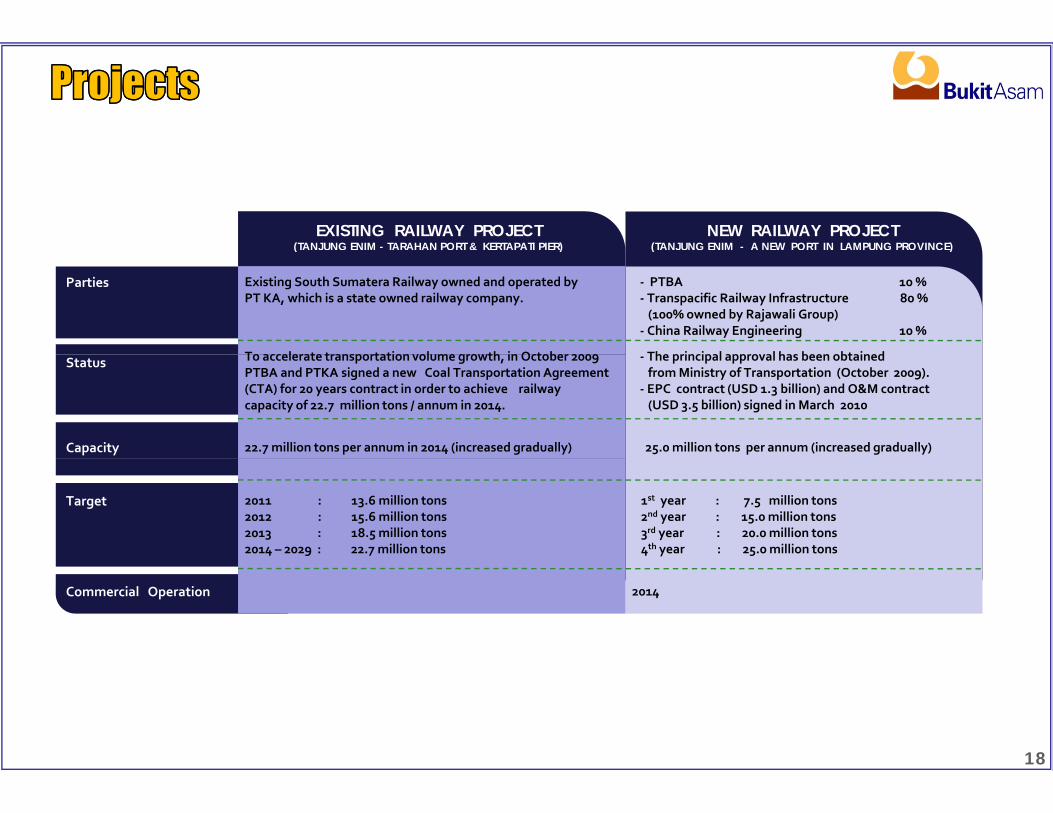
EXISTING RAILWAY PROJECT (TANJUNG ENIM - TARAHAN PORT & KERTAPATI PIER)
NEW RAILWAY PROJECT(TANJUNG ENIM - A NEW PORT IN LAMPUNG PROVINCE)( ) ( )
Parties Existing South Sumatera Railway owned and operated by PT KA, which is a state owned railway company.
‐ PTBA 10 %‐ Transpacific Railway Infrastructure 80 % (100% owned by Rajawali Group)‐ China Railway Engineering 10 %
To accelerate transportation volume growth in October 2009 The principal approval has been obtainedStatus To accelerate transportation volume growth, in October 2009 PTBA and PTKA signed a new Coal Transportation Agreement (CTA) for 20 years contract in order to achieve railwaycapacity of 22.7 million tons / annum in 2014.
‐ The principal approval has been obtainedfromMinistry of Transportation (October 2009).‐ EPC contract (USD 1.3 billion) and O&M contract (USD 3.5 billion) signed in March 2010
Capacity 22.7 million tons per annum in 2014 (increased gradually) 25.0 million tons per annum (increased gradually)
Target 2011 : 13.6 million tons2012 : 15.6 million tons2013 : 18.5 million tons2014 – 2029 : 22.7 million tons
1st year : 7.5 million tons2nd year : 15.0 million tons3rd year : 20.0 million tons4th year : 25.0 million tons
Commercial Operation 2014
18

BANJARSARI MINE MOUTH POWER PLANT COAL BED METHANEBANJARSARI MINE MOUTH POWER PLANT PROJECT (2x100 MW)
COAL BED METHANE
Location Tanjung Enimmine Tanjung Enimmine
Parties PTBA (59.75%), PJB (29.15%), NII (11.10%) PTBA (27.5%), Pertamina (27.5%), Arrow Energy (45%).
Financing from Bank Mandiri Production Sharing Contract between consortium and Status ‐Financing from Bank Mandiri‐EPC contractor by CNEEC‐Proposal to PLN for re‐negotiation electricity tarif has been submitted.
‐ Production Sharing Contract between consortium and government signed in August 2009‐ Joint Operation Agreement is in process.
Capacity 2 x 100 MW 50 MMSCF/day (million cubic feet per day)
Coal Consumption 1.0 million tons per annum, supplied by PTBA
Potential Reserve 0.8 Trillion cubic feet (TCF)
Commercial Operation 2013 2013
19

Contact :Investor RelationsAddress :Menara Kadin, 15th floor, Jl. Rasuna Said, Blok X‐5
Kav. 2 & 3, Jakarta 12950, IndonesiaTelephone :+62 21 5254014Fax :+62 21 5254002E‐mail address :[email protected] :www.ptba.co.id
<Disclaimer>The views expressed here contain information derived from publicly available sources that have not beenindependently verified. No representation or warranty is made as to the accuracy, completeness or reliability ofthe information. Any forward looking information in this presentation has been prepared on the basis of anumber of assumptions which may prove to be incorrect. This presentation should not be relied upon as arecommendation or forecast by PTBA. Nothing in this release should be construed as either an offer to sell or asolicitation of an offer to buy or sell shares in any jurisdiction.
20