2q17 earnings call presentation...2q17 earnings call presentation july 26, 2017 this presentation...
TRANSCRIPT

The Venetian Macao Marina Bay Sands, Singapore
Sands Macao Four Seasons Macao Sands Bethlehem The Venetian Las Vegas The Palazzo, Las Vegas
The Parisian MacaoSands Cotai Central, Macao
2Q17 Earnings Call PresentationJuly 26, 2017

This presentation contains forward-looking statements that are made pursuant to the Safe Harbor Provisions of the Private Securities Litigation Reform Act of 1995. Forward-looking statements involve a number of risks, uncertainties or other factors beyond the company’s control, which may cause material differences in actual results, performance or other expectations. These factors include, but are not limited to, general economic conditions, competition, new development, construction and ventures, substantial leverage and debt service, fluctuations in currency exchange rates and interest rates, government regulation, tax law changes, legalization of gaming, future terrorist acts, influenza, insurance, gaming promoters, risks relating to our gaming licenses, certificate and subconcession, infrastructure in Macao, our subsidiaries’ ability to make distribution payments to us, and other factors detailed in the reports filed by Las Vegas Sands with the Securities and Exchange Commission. Readers are cautioned not to place undue reliance on these forward-looking statements, which speak only as of the date thereof. Las Vegas Sands assumes no obligation to update such information.
Within this presentation, the company may make reference to certain non-GAAP financial measures including “adjusted net income,” “adjusted earnings per diluted share,” and “consolidated adjusted property EBITDA,” which have directly comparable financial measures presented in accordance with accounting principles generally accepted in the United States of America ("GAAP"), along with “adjusted property EBITDA margin,” “hold-normalized adjusted property EBITDA,” “hold-normalized adjusted property EBITDA margin,” “hold-normalized adjusted net income,” and “hold-normalized adjusted earnings per diluted share,” as well as presenting these items on a constant currency basis. The specific reasons why the company’s management believes that the presentation of each of these non-GAAP financial measures provides useful information to investors regarding Las Vegas Sands’ financial condition, results of operations and cash flows, as well as reconciliations of the non-GAAP measures to the most directly comparable GAAP measures, are included in the company’s Form 8-K dated July 26, 2017, which is available on the company’s website at www.sands.com. Reconciliations also are available in the Non-GAAP Measures Reconciliations section of this presentation.
Forward Looking Statements
2

The global leader in MICE-based Integrated Resort development and operation, delivering strong and diversified cash flow and earnings
Best positioned operator to deliver long-term growth in Asia, with the pre-eminent destination MICE-based Integrated Resort properties in the world
Uniquely positioned to bring unmatched track record, powerful convention-based business model and the industry’s strongest balance sheet to the world’s most promising IntegratedResort development opportunities
Committed to maximizing shareholder returns by delivering long-term growth while continuing the return of capital to shareholders through recurring dividend and stock repurchase programs
The industry’s most experienced leadership team: visionary, disciplined and dedicated todriving long-term shareholder value
The Investment Case for Las Vegas Sands
3
Maximizing Return to Shareholders by:1. Delivering long-term growth in current markets 2. Using leadership position in MICE-based Integrated Resort development and
operation to pursue global growth opportunities3. Continuing to return capital to shareholders

Net revenue increased 18.6% to $3.14 billion
Net income increased 61.9% to $638 million
Adjusted property EBITDA increased 26.5% to $1.21 billion
Hold-normalized adjusted property EBITDA increased 14.6% to $1.11 billion; Hold-normalized adjusted property EBITDA margin increased 100 bps to an industry-leading 36.9%1
Macao – Adjusted property EBITDA from Macao Operations increased 23.0% to $600 million; Hold-normalized adjusted property EBITDA increased 17.1% to $597 million1
The Parisian Macao continued to ramp, growing mass gaming win and rolling chip volume sequentially and generating $106 million of adjusted property EBITDA
Marina Bay Sands – Adjusted property EBITDA increased 37.8% to $492 million; Hold-normalized adjusted property EBITDA increased 19.5% to $386 million, with a margin of 55.0%
Diluted EPS increased 68.3% to $0.69 per share, Adjusted diluted EPS increased 37.7% to $0.73 per share, Hold-normalized adjusted diluted EPS increased 17.0% to $0.62 per share1
LVS returned a total of $653 million to shareholders during the quarter through its recurring dividend of $0.73 per share ($578 million) and $75 million of share repurchases (1.2 million shares at a weighted average price of $61.97 per share)
Second Quarter 2017 Financial HighlightsQuarter Ended June 30, 2017 vs Quarter Ended June 30, 2016
41. See page 32 for details regarding hold normalization.

$ in millions, except per share information 2Q16 2Q17 $ Change % Change
Net Revenue 2,649$ 3,141$ 492$ 18.6%
Net Income 394$ 638$ 244$ 61.9%
Adjusted Property EBITDA 955$ 1,208$ 253$ 26.5%
Adjusted Property EBITDA Margin 36.1% 38.5% 240 bps
Diluted EPS 0.41$ 0.69$ 0.28$ 68.3%
Adjusted Diluted EPS 0.53$ 0.73$ 0.20$ 37.7%
Dividends per Common Share 0.72$ 0.73$ 0.01$ 1.4%
Hold-Normalized :
Adjusted Property EBITDA 965$ 1,106$ 141$ 14.6%
Adjusted Property EBITDA Margin 35.9% 36.9% 100 bps
Adjusted Diluted EPS 0.53$ 0.62$ 0.09$ 17.0%
Second Quarter 2017 Financial Results (Y/Y)Quarter Ended June 30, 2017 vs Quarter Ended June 30, 2016
51. See page 32 for details regarding hold normalization.
1

Consolidated Adjusted Property EBITDA1
Geographically Diverse Sources of EBITDA EBITDA Contribution by Geography in 2Q 2017
6
Consolidated Hold-Normalized Adj. Prop. EBITDA1,2
$1,208M $1,106M
1. The Macao region includes adjusted property EBITDA from The Venetian Macao, Sands Cotai Central, The Parisian Macao, The Plaza Macao and Four Seasons Hotel Macao, the Sands Macao and Ferry Operations and Other. The Singapore region includes adjusted property EBITDA from Marina Bay Sands and the United States region includes adjusted property EBITDA from the Las Vegas Operating Properties and Sands Bethlehem.2. See page 32 for details regarding hold normalization.
Macao50%Singapore
41%
United States
9%
Macao54%Singapore
35%
United States11%
($ in millions)

LVS Recurring Dividends per Share1
7
LVS Increasing Return of Capital to ShareholdersOver $17.4 Billion of Capital Returned to Shareholders Since 2012
Las Vegas Sands remains committed to returning capital to shareholders via its recurring dividend program and share repurchases:
Dividends:
The LVS Board of Directors increased the LVS recurring dividend for the 2017 calendar year by $0.04 to $2.92 per share ($0.73 per share payable quarterly)
Las Vegas Sands is committed to maintaining its recurring dividend program and to increasing dividends in the future as cash flows grow
Repurchases:
Since the inception of the company’s share repurchase program in June 2013, the company has returned $2.66 billion to shareholders through the repurchase of 39.3 million shares
During the second quarter of 2017, $75 million of common stock was repurchased (1.2 million shares at a weighted average price of $61.97 per share)
The company has $1.34 billion available under its current repurchase authorization
1. Excludes dividends paid by Sands China and excludes the $2.75 per share special dividend paid in December 2012. 2. Reflects only the public (non-LVS) portion of dividends paid by Sands China (total Sands China dividends paid since 2012 were $11.4 billion).
Las Vegas Sands Remains Committed to Returning Capital to Shareholders While Maintaining a Strong Balance Sheet and the Financial Flexibility to Pursue Development Opportunities
Total Capital Returned to Shareholders
$1.00$1.40
$2.00
$2.60$2.88 $2.92
2012 2013 2014 2015 2016 2017
Year Ended December 31, YTD
$ in millions 2012 2013 2014 2015 2016 6/30/17 Total
LVS Dividends Paid1 $823 $1,153 $1,610 $2,074 $2,290 $1,156 $9,106
LVS Special Dividend Paid 2,262 - - - - - 2,262
LVS Shares Repurchased - 570 1,665 205 - 225 2,665
Subtotal LVS 3,085 $1,723 $3,275 $2,279 $2,290 $1,381 $14,033
SCL Dividends Paid2 357 411 538 619 619 619 3,163
SCL Special Dividend Paid2 - - 239 - - - 239
Subtotal SCL $357 $411 $777 $619 $619 $619 $3,402
Total $3,442 $2,134 $4,052 $2,898 $2,909 $2,000 $17,435

$1.16$1.33
$1.73$1.99 $1.99 $1.99
2012 2013 2014 2015 2016 2017
8
SCL Return of Capital to ShareholdersUS$11.4 Billion of Capital Returned to Shareholders Since 2012
SCL Recurring Dividends per Share (HK$)1
Sands China remains committed to returning capital to shareholders via its recurring bi-annual dividend program
Sands China is committed to maintaining its recurring dividend program and to increasing dividends in the future as cash flows grow
For the 2017 year, the SCL Board of Directors set the 2017 SCL interim and final dividends at HK$0.99 per share and HK$1.00 per share, respectively. The dividends were paid on February 24, 2017, and June 23, 2017, respectively
1. Excludes the special dividend paid in 2014.2. Sands China dividends presented here include the dividends paid to Las Vegas Sands.
Sands China Remains Committed to Returning Capital to Shareholders While Maintaining a Strong Balance Sheet and the Financial Flexibility to Pursue Development Opportunities
SCL Total Capital Returned to Shareholders
Year Ended December 31, YTD
$ in millions 2012 2013 2014 2015 2016 6/30/17 Total
SCL Dividends Paid1$1,201 $1,382 $1,800 $2,071 $2,071 $2,069 $10,594
SCL Special Dividend Paid - - 801 - - - 801
Total2 1,201$ 1,382$ 2,601$ 2,071$ 2,071$ 2,069$ 11,395$

Figures as of June 30, 2017 Sands China U.S. Corporate
($ in millions) Ltd. Singapore Operations3 and Other Total
Cash, Cash Equivalents and Restricted Cash $791 $319 $401 $807 $2,318
Debt1$4,919 $3,152 $2,179 $0 $10,250
Net Debt $4,128 $2,833 $1,778 ($807) $7,932
Trailing Twelve Months Adjusted Property EBITDA $2,462 $1,614 $536 $0 $4,612
Gross Debt to TTM Adjusted Property EBITDA 2.0 x 2.0 x 4.1 x NM 2.2 x
Net Debt to TTM Adjusted Property EBITDA 1.7 x 1.8 x 3.3 x NM 1.7 x
As of June 30, 2017:
Cash Balance – $2.32 billion
Debt – $10.25 billion1
Net Debt – $7.93 billion
Net Debt to TTM EBITDA – 1.7x
Strong Cash Flow, Balance Sheet and LiquidityFlexibility for Future Growth Opportunities and Return of Capital
9
1. Debt balances shown here exclude deferred financing costs of $110 million.2. Reflects only the public (non-LVS) portion of dividends paid by Sands China. Total dividends paid by Sands China in the TTM period ended June 30, 2017 were $2.07 billion.3. U.S. Operations include the cash and debt at the U.S. Restricted Group and adjusted property EBITDA from Las Vegas Operations and Sands Bethlehem.4. TTM Adjusted Property EBITDA for Sands China presented here reflects Adjusted Property EBITDA from our Macao Operations.5. TTM Adjusted Property EBITDA for U.S. Operations for covenant compliance purposes, which is adjusted primarily for the dividends and royalty fees paid by Sands China and Marina Bay Sands to the U.S. Operations, was $2.86 billion. 6. This ratio is a simplified calculation using adjusted property EBITDA. The TTM adjusted property EBITDA amounts shown above are different from the calculation as defined per respective debt agreements for covenant compliance purposes. For Sands China, Marina Bay Sands and U.S. Operations, the leverage ratio for covenant compliance purposes was 2.0x, 2.0x and 0.6x, respectively.
Strong Balance Sheet and Cash Flow Maximize Financial Flexibility
6
5
Trailing twelve months ended June 30, 2017:
Cash Flow from Operations – $4.37 billion
Adjusted Property EBITDA – $4.61 billion
LVS Dividends Paid – $2.30 billion
SCL Dividends Paid – $618.8 million2
4
6 6

Macao Operating Performance (Y/Y)Quarter Ended June 30, 2017 vs Quarter Ended June 30, 2016
10
($ in millions)
Macao Operations Adjusted Property EBITDA and Adjusted Property EBITDA Margin
Adjusted Property EBITDA Hold-Normalized Adj. Prop. EBITDA1
+17.1%+23.0%
1. See page 32 for details regarding hold normalization.
$488
$600
$510
$597
32.8% 32.7% 33.1% 32.8%
0%
10%
20%
30%
40%
50%
60%
$0
$100
$200
$300
$400
$500
$600
$700
2Q16 2Q17 2Q16 2Q17

Mass Tables49%
Slots8%
Hotel14%
Mall13%
Other4%
VIP12%
Mass Tables49%
Slots9%
Hotel15%
Mall14%
Other4%
VIP9%
TTM 2Q16
Diversified and Stable Sources of Departmental ProfitMacao Departmental Profit Contribution1
11
Mass Tables / Slots and Non-Gaming Generated 88% of Macao’s Departmental Profit in TTM 2Q17
TTM 2Q17
1. Represents departmental profit from The Venetian Macao, Sands Cotai Central, The Parisian Macao, The Plaza Macao and Four Seasons Hotel Macao, the Sands Macao and Ferry Operations and Other (before unallocated expenses) for the TTM periods ended June 30, 2016 and 2017.

$480
$540
0
100
200
300
400
500
600
2Q16 2Q17
($)(in millions)
Macao: Increased Overnight Visitation, Length of Stay and Win-per-Visit are Contributing to Growth in Mass Gaming Win
12
Solid Growth in Market Wide Mass Win-per-Visit
Mainland Chinese Overnight Visits
Mass (Tables & Slots) Win-per-Visit1
(Days)
Avg. Length of Stay for Mainland Chinese Visitors
Strong Growth in Mainland Chinese Overnight Visitation
More Hotel RoomsDriving Increased Length of Stay
1. Market-wide mass win for 2Q17 is estimated based on DICJ reported data and estimated differences between DICJ reporting and mass win reported by the operators in public filings. Market-wide mass win is defined as mass table win plus slot win as reported by the casino operators in their public filings (does not include revenue from Galaxy’s City Clubs business). Mass win-per-visit is defined as mass win (tables and slots) divided by total visitation to Macao as reported by the Macao DSEC. All figures reported in Hong Kong dollars have been converted to USD using a 7.75 exchange rate.2. 2Q17 length of stay is calculated as the weighted average length of stay of mainland Chinese visitors based on reported monthly figures as overall 2Q17 length of stay has not yet been released by the Macao DSEC.Source: Public company filings, Macao DSEC, Macao DICJ, LVS estimates.
2
2.38
2.76
0.0
0.5
1.0
1.5
2.0
2.5
3.0
2Q16 2Q17
1.21.3
0.0
0.2
0.4
0.6
0.8
1.0
1.2
1.4
2Q16 2Q17

Macao Mass Market Gaming Recovery Continues
13
The Recovery in Macao’s Important and High-Margin Mass Gaming Segment Continues
Macao Market Mass Gaming Revenue
1. Market-wide mass GGR for all periods prior to 2Q17 is defined as mass win (tables and slots) as reported by the casino operators in their public filings (does not include revenue from Galaxy’s City Clubs business). All figures reported in Hong Kong dollars have been converted to USD using a 7.75 exchange rate.2. Market-wide mass GGR for 2Q17 is estimated based on DICJ reported data and estimated differences between DICJ reporting and win reported by the operators in public filings.Source: Public company filings, Macao DICJ.
($ in millions)
Peak TTM Year Ended December 31,1
Ended 3Q14A 2015A 2016A Change
Mass Win (Tables & Slots) $17,797 Mass Win (Tables & Slots) $14,171 $14,922 5.3%
Quarter Ended March 31,1
2016A 2017A Change
Mass Win (Tables & Slots) $3,609 $4,147 14.9%
Quarter Ended June 30,
2016A1
2017E2
Change
Mass Win (Tables & Slots) $3,508 ~ $4,150 18.3%

$2,655 $2,679 $2,839
$3,175 $3,351 $3,441
$3,872
$4,340
$4,589 $4,449 $4,419
$3,919
$3,682
$3,408 $3,497 $3,584 $3,609 $3,508
$3,816
$3,989 $4,147 $4,150
$382$404 $390
$440$474 $487 $498
$585 $597 $586
$536$490 $497
$464$432
$456$484 $480 $471
$494$527 $540
$0
$200
$400
$600
$800
$1,000
$0
$1,000
$2,000
$3,000
$4,000
$5,000
1Q12 2Q12 3Q12 4Q12 1Q13 2Q13 3Q13 4Q13 1Q14 2Q14 3Q14 4Q14 1Q15 2Q15 3Q15 4Q15 1Q16 2Q16 3Q16 4Q16 1Q17 2Q17
Mass Win (Tables & Slots) Mass Win per Visit
Macao: Continued Double-Digit Growth in Macao’s High Margin Mass Gaming Segment
14
Macao Market Mass Gaming Revenue (Tables & Slots) & Mass Win-per-Visit1
We Estimate Macao Market-Wide Mass Win Increased~18% and Mass Win-per-Visit Increased ~13% Y/Y in 2Q17
($ in millions)
1. Market-wide mass win for 2Q17 is estimated based on DICJ reported data and estimated differences between DICJ reporting and mass win reported by the operators in public filings. Market-wide mass win is defined as mass table win plus slot win as reported by the casino operators in their public filings (does not include revenue from Galaxy’s City Clubs business). Mass win-per-visit is defined as mass win (tables and slots) divided by total visitation to Macao as reported by the Macao DSEC. All figures reported in Hong Kong dollars have been converted to USD using a 7.75 exchange rate. Source: Public company filings, Macao DSEC, Macao DICJ.
.

$532$563
$606 $607 $591
$0
$100
$200
$300
$400
$500
$600
$700
$800
2Q16 3Q16 4Q16 1Q17 2Q17
$369
$424 $438
$495$514
$0
$100
$200
$300
$400
$500
$600
$700
$800
2Q16 3Q16 4Q16 1Q17 2Q17
15
SCL Base Mass Table Win by Quarter
Sands China Mass Market Table UpdateMass Market Table Win Grew 22.6% in 2Q17 vs. 2Q16
Note: Sands China’s base mass and premium mass table revenues as presented above are based on the geographic position of non-rolling (mass) tables on the gaming floor. Some high-end mass play occurs in the base mass geographic area and some lower-end mass play occurs in the premium mass geographic area of the gaming floor.
Sands China’s Market Leading Mass Table Offering is Delivering Growth and Gaining Market Share in Macao’s Most Profitable Segment
($ in millions)
SCL Premium Mass Table Win by Quarter
Sands China Departmental Profit Margin: 40% - 50% Sands China Departmental Profit Margin: 25% - 40%
($ in millions)
Avg.Tables
336 361Avg.Tables
1,077 1,067
Avg. Win per Table per Day: $6,117 Avg. Win per Table per Day: $15,128
950 314959 329 3731,062

$369
$497
$0
$100
$200
$300
$400
$500
$600
2Q16 2Q17
$13.79
$14.84
$0
$2
$4
$6
$8
$10
$12
$14
$16
$18
$20
2Q16 2Q17
16
SCL Rolling Volume by Quarter
Sands China VIP Table UpdateVIP Table Win Grew 34.7% in 2Q17 vs. 2Q16
Sands China Participated in the Growth of Macao’s VIP Segment with Growth in Both Rolling Volumes and Rolling Gaming Win
($ in billions)
Avg.Tables
Avg. Win per Table per Day
260 211
($ in millions, except per table amounts)
SCL VIP Win by Quarter
$25,850
$15,576

The Parisian Macao3.6 Billion Online Impressions
17

The Parisian MacaoA New “Must See” Attraction on the Cotai Strip
18LVS
Operating
Assets
Third Party
Operating
Asset
Third Party
Future
Development
The Parisian Macao Grand Opening – Sept. 13, 2016Map of Macao’s Cotai Strip
The Parisian Macao is a $2.9 billion themed, iconic destination Integrated Resort on the Cotai Strip in Macao
The Parisian Macao has meaningfully expanded our critical mass on the Cotai Strip
The Parisian Macao is interconnected with our other Cotai Strip properties through mall access and other pedestrian connectivity
Hotel Rooms: 2,743; Paiza Suites: 208
Additional amenities including a retail mall, 50% scale replica Eiffel Tower, MICE space, diverse food & beverage options and entertainment
The Parisian Macao
LVS Future
Development

The Parisian MacaoRamp of our Latest Cotai Strip Property Continues
19
Strong visitation has contributed to increased traffic across our entire Cotai Strip property portfolio
Continued to ramp and generated $106 million of adjusted property EBITDA in the second quarter of 2017
Strong results in its first three full quarters of operations:
The Parisian Macao Continues to Ramp and Has Become a“Must See” Destination on The Cotai Strip
($ in millions) 4Q16 1Q17 2Q17
Adj. Property EBITDA 95$ 82$ 106$
Hold-Normal ized Adj. Property EBITDA 78 84 93
Adj. Property EBITDA/Day 1.03$ 0.91$ 1.16$
Mass Win/Day 2.16 2.37 2.44
Rol l ing Volume/Day 36.0 41.4 41.3

Macao Market Annual Adjusted Property EBITDA Market Share by Operator
Sands China Expanded Market Share of Macao EBITDA by 700 bps Since 2012
Source: Company Reports1. Reflects reported adjusted property EBITDA for the operating properties.2. Reflects adjusted property EBITDA from The Venetian Macao, Sands Cotai Central, The Parisian Macao, The Plaza Macao and Four Seasons Hotel Macao, the Sands Macao and Ferry Operations & Other.3. Galaxy only includes EBITDA from Starworld and Galaxy Macau. MGM reflects Adjusted EBITDA (excluding royalty fees) from MGM Grand Macau as reported by MGM Resorts.
Historical Adjusted Property EBITDA Market Share1
20
Galaxy MPELSands China3
SJM Wynn MGM
Sands China2 All Others
Macao
Leader in
Market Share
of EBITDA72%
65%
3

Marina Bay Sands UpdateAdjusted Property EBITDA Increased 37.8% to $492 million
21
Actual
Adjusted property EBITDA increased 37.8% to $492 million. Rolling win % was 4.42% in 2Q17 compared to 3.50% in the prior-year quarter.
Hold-normalized adjusted property EBITDA increased 19.5% to $386 million
Total mass (Non-rolling tables and slots) win-per-day decreased 1.8% to $4.42 million
— Non-rolling table win decreased 3.1% to $254 million
— Slot win increased 0.7% to $148 million
ADR increased 5.9% to $397 while occupancy decreased 2.1 pts to 94.3%
($ in millions)
Adjusted Property EBITDA and Adjusted Property EBITDA Margin
Adjusted Property EBITDA Increased 37.8% to $492 Million at Marina Bay Sands in 2Q17
Non-rolling Table and Slot Win Per Day
Hold-Normalized
($ in millions)
$357
$492
$323 $386
50.3%
58.9%
48.4%55.0%
20%
30%
40%
50%
60%
70%
80%
$0
$100
$200
$300
$400
$500
$600
2Q16 2Q17 2Q16 2Q17
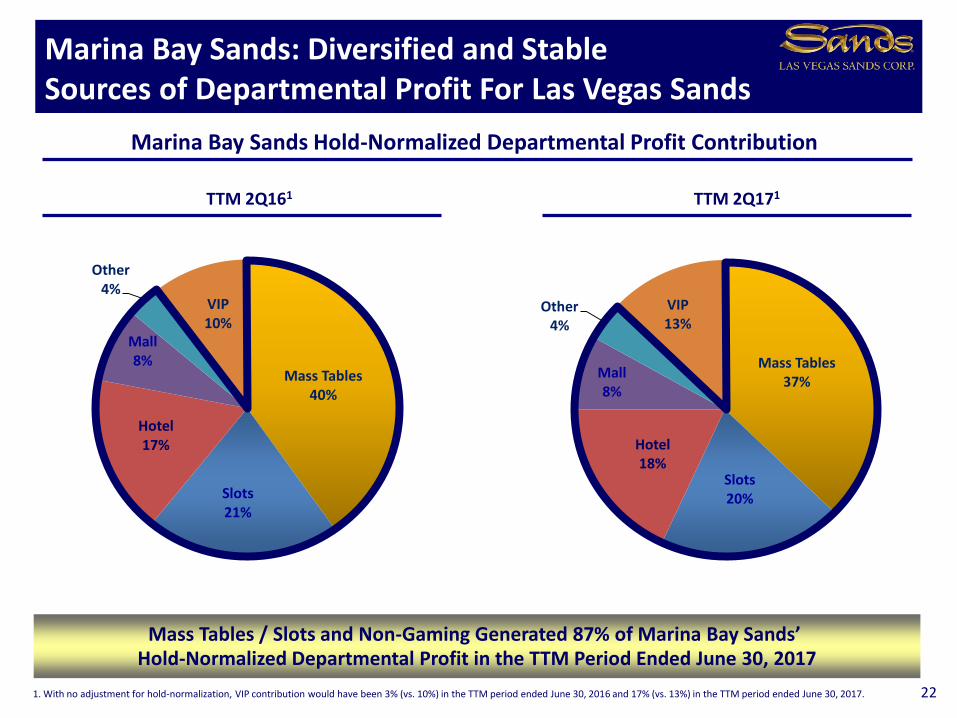
Mass Tables37%
Slots20%
Hotel18%
Mall8%
Other4%
VIP13%
Mass Tables40%
Slots21%
Hotel17%
Mall8%
Other4%
VIP10%
TTM 2Q161
Marina Bay Sands: Diversified and Stable Sources of Departmental Profit For Las Vegas Sands
22
Mass Tables / Slots and Non-Gaming Generated 87% of Marina Bay Sands’ Hold-Normalized Departmental Profit in the TTM Period Ended June 30, 2017
Marina Bay Sands Hold-Normalized Departmental Profit Contribution
TTM 2Q171
1. With no adjustment for hold-normalization, VIP contribution would have been 3% (vs. 10%) in the TTM period ended June 30, 2016 and 17% (vs. 13%) in the TTM period ended June 30, 2017.

Marina Bay Sands: The Reference Model for AllOther Integrated Resort Projects
23
No Other Company has such a Compelling and Proven Model to Demonstrate the Many Benefits of an Integrated Resort
Ideal reference site for jurisdictions considering MICE-based Integrated Resort development
Offers clear demonstration of a development’s exceptional economic power and direct contributions to tourism, employment and GDP growth

Leaders in World Class EntertainmentMarina Bay Sands - Global Artists and Events Hosted:
24
Western:
Rolling Stones
Michael Buble
Air Supply
Elton John
Elvis Costello
James Blunt
Empire of the Sun
Chemical Brothers
David Foster
Michael Bolton
Aerosmith
Pentatonix
Chaka Khan
Brian McKnight
Chris Botti
Paul Anka
Diana Ross
Pointer Sisters
Englebert Humperdick
Asian (Chinese):
Eason Chan
A-Mei
Jolin Tsai
Aaron Kwok
Wakin Chou
Alan Tam
Fei Yu Qing
Dayo Wong (comedian)
Lu Chen (magician)
Grasshopper
Asian (Korean):
Girls Generation
G-Dragon
2NE1
PSY
Rain
Other:
Singapore International Film Festival
The Social Star Awards
Zee TV Awards
TVB Awards
Singapore International Jazz Festival
MediaCorp Star TV Awards
Sports:
Boxing: WBA featherweight title: Chris John Vs
Shoji Kimura
Boxing: WBA featherweight title: Chris John Vs
Chonlatarn Piriyapinyo
MMA: UFC – Saffedine Vs Lim;
WTA: Serena Williams, Martina Navratilova, Maria
Sharapova, Garbine Murguruza, Martina Hingis,
Premier League Golf: Andy Cole, Rio Ferdinand,
Ian Wright, Ian Fowler, Glenn Hoddle, David Genola
Theatrical:
The Lion King
Wicked
Sound of Music
Singing in the Rain
Mamma Mia
Chicago
Village People
Madagascar
Annie
Shrek
Cats
Beauty and the Beast
Blue Man Group
Thriller Live
Illusionists
Cirque Elouise

Leaders in World Class EntertainmentSands China - Global Artists and Events Hosted:
25
Western:
Rolling Stones
Bon Jovi
Beyonce
Celine Dion
Rihanna
Katy Perry
Justin Bieber
Alicia Keys
Black Eyed Peas
Sarah Brightman
Armin Van Buuren
Asian (Chinese):
Jacky Cheung
Jay Chou
Joey Yung/Hacken Lee
A-Mei
Sandy Lam
Jolin Tsai
Aaron Kwok
Alan Tam
GEM
Show Luo
A-Lin
Sammi Cheng
SHE
Twins
Dayo Wong (comedian)
Lu Chen (magician)
Asian (Korean):
Bigbang
Girls Generation
G-Dragon
2NE1
Super Junior
Other:
China Music Awards
Jiangsu Satellite Television New
Years Eve Countdown Show
MNET Asian Music Awards (MAMA)
Indian International Film Academy
(IIFA) awards show
The Voice of China Finale
Sing China
I Am A Singer
Huading Awards show
Asian Film Awards
Disney on Ice
Theatrical:
Cirque du Soleil (Zaia)
Cats
Beauty and the Beast
Blue Man Group
Thriller Live
Sports:
Basketball: NBA (Cleveland
Cavaliers vs. Orlando Magic); US
Olympic Basketball team exhibition
game (players included Kobe Bryant
and LeBron James)
Boxing: Pacquiao vs. Rios;
Pacquiao vs. Algieri
MMA: UFC - Le vs. Bisping; Le vs.
Franklin; the Ultimate Fighter China
finale
Tennis: Federer vs Sampras;
Legends Match (McEnroe, Borg,
Agassi)
Muay Thai: Thai Fight (from
Bangkok)
Drifting: D1 Drift Team exhibition
(from Japan)
Motorcycle: Nitro Circus

$213 $215 $209 $212 $215
$132 $132 $127 $127 $127
$65 $65 $63 $66 $64$23 $40 $57
$163 $163 $166$165
$165
$573 $580 $588$610
$628
$0
$100
$200
$300
$400
$500
$600
$700
2Q16 3Q16 4Q16 1Q17 2Q17
The Venetian Macao Four Seasons Macao Sands Cotai Central¹ The Parisian Macao Marina Bay Sands
Asia Retail Mall Portfolio Continues to Generate Strong Revenue and Operating Profit
26
($ in millions)
Trailing Twelve Months Retail Mall Revenue
89%Operating Profit Margin
1. At June 30, 2017, 398,093 square feet of gross leasable area were occupied out of a total of up to 600,000 square feet of retail mall space that will be featured at completion of all phases of Sands Cotai Central. 2. Tenant sales per square foot is the sum of reported comparable sales for the trailing 12-months divided by the comparable square footage for the same period. Only tenants that have occupied mall space for a minimum of 12 months are included in the tenant sales per square foot calculation. The Parisian Macao opened on September 13, 2016 so TTM tenant sales data is not reported.
$524MOperating Profit
+9.6%TTM 2Q17 Sales
per Sq. Foot²
MBS:$1,482
SCC:$676
Four Seasons:
Luxury: $4,337Other: $1,483
Venetian:$1,340
89%
$545M
90%
$515M
90%
$520M
$5
89%
$559M

$96 $100 $112 $117 $114
$11$98
$104
$123 $118 $118
$-
$20
$40
$60
$80
$100
$120
$140
$160
2Q16 3Q16 4Q16 1Q17 2Q17
Base Rent and Other Fees Turnover Rent
Macao Quarterly Retail Revenue Composition
27
Sands China: Retail Mall Revenue Composition
($ in millions)
Strong Base Rent, Which Grew 18.8% in 2Q17, Provides the Majority of Sands China’s Retail Mall Revenue
$2$4
$1 $4

Las Vegas Operations UpdateAdjusted Property EBITDA Grew 9.7%
28
Composition of Table Games Drop
Adjusted property EBITDA increased 9.7% to $79 million
— On a hold-normalized basis, adjusted property EBITDA decreased 8.5% to $86 million
Hotel room revenue decreased 2.1% to $142 million
— ADR increased 1.7% to $244 with 92.7% occupancy, driving RevPAR of $226
Table games drop decreased 6.1% to $352 million
— Non-baccarat drop decreased 9.5% to $190 million
— baccarat drop declined 1.8% to $162 million
Slot win decreased 2.0% to $50 million
Best opportunities for potential future growth:
— Increase in group & FIT room pricing
— Non-gaming offerings
($ in millions)
Adjusted Property EBITDA and Adjusted Property EBITDA Margin
Actual($ in millions)
Hold-Normalized

29
Adjusted property EBITDA decreased 2.6% to $37 million1
Table games drop decreased 4.5% to $276 million due to slower Non-Baccarat play
Slot handle increased 5.6% to $1.18 billion
ADR increased 1.3% to $162 with occupancy of 93.9%, driving RevPAR of $152
The table games tax rate in Pennsylvania increased from 14% to 16% when compared to the prior-year quarter; regulatory fees also increased when compared to the 2016 quarter
The Outlets at Sands Bethlehem (150,000 SF) feature 29 stores including Coach, Tommy Hilfiger, DKNY, GUESS and European Body Concepts Day Spa
The Sands Bethlehem Event Center (50,000 SF)
— Headline events have included Bob Dylan, Dancing with the Stars, Tiesto, Rod Stewart, Stevie Nicks, Weezer, American Idol Live!, Jay Leno and Bill Maher
($ in millions)
($ in millions)
Adjusted Property EBITDA and Adjusted Property EBITDA Margin
Composition of Table Games Drop
Sands Bethlehem UpdateLeading Tri-State Region Property
$38 $37
26.0% 25.2%
0%
10%
20%
30%
40%
50%
$0
$10
$20
$30
$40
$50
2Q16 2Q17
1. Year-over-year Sands Bethlehem incurred almost $2 million of incremental expense associated with an increased table games tax rate and increased regulatory fees.
1

South Korea
Principal Areas of Future Development Interest:
Japan
Uniquely positioned to bring our unmatched track record and powerful convention-based business model to the world’s most promising Integrated Resort development opportunities
Development opportunity parameters:
— Targeting minimum of 20% return on total invested capital
— 25% - 35% of total project costs to be funded with equity (project financing to fund 65% - 75% of total project costs)
Disciplined Execution of Our Global Growth Strategy
30
Macao Singapore

Appendix

Beginning in Q1 2017, normalized win has been adjusted to 3.15% when outside the range of
3.00% - 3.30%
All periods presented throughout this document reflect this normalization range
In 2012, Sands China began normalizing rolling win using an assumed win percentage of 2.85%
when the Company’s actual rolling win percentage fell outside of a range of 2.70%-3.00%
Normalization calculation was based on actual historical trends at the time
During the past three years, Sands China has experienced a consistent increase in its actual
rolling win percentage
Sands China Hold Normalization
32
1. Calculated based on actual rolling figures from 1/1/2014 through 12/31/2016.2. Calculated based on actual rolling figures from 1/1/2015 through 12/31/2016.3. Calculated based on actual rolling figures from 1/1/2016 through 12/31/2016.
3-Year 2-Year 1-Year
($ in millions) Trailing1 Trailing2 Trailing3
Actual Rolling Win % 3.17% 3.18% 3.23%
Actual Rolling Volume 274,430$ 134,962$ 61,260$
Actual Rolling Win 8,712$ 4,293$ 1,978$

Historical Hold-Normalized Adj. Property EBITDA1
33
($ in millions) 2Q16 3Q16 4Q16 1Q17 2Q17
Macao Operations2
Reported 488$ 628$ 610$ 624$ 600$
Hold-Normalized 510$ 578$ 583$ 592$ 597$
Marina Bay Sands
Reported 357$ 391$ 366$ 365$ 492$
Hold-Normalized 323$ 368$ 366$ 388$ 386$
Las Vegas Operations
Reported 72$ 86$ 111$ 122$ 79$
Hold-Normalized 94$ 88$ 111$ 120$ 86$
Sands Bethlehem
Reported 38$ 37$ 28$ 36$ 37$
Hold-Normalized 38$ 37$ 28$ 36$ 37$
LVS Consolidated
Reported 955$ 1,142$ 1,115$ 1,147$ 1,208$
Hold-Normalized 965$ 1,071$ 1,088$ 1,136$ 1,106$ 1. This schedule presents hold-normalized adjusted property EBITDA based on the following methodology:
- for Macao Operations : if the quarter’s rolling win percentage is outside of the 3.00%-3.30% band, then a hold adjustment is calculated by applying a rolling win percentage of 3.15% to the rolling volume for the quarter.- for Marina Bay Sands: if the quarter’s rolling win percentage is outside of the 2.70%-3.00% band, then a hold adjustment is calculated by applying a rolling win percentage of 2.85% to the rolling volume for the quarter.- for Las Vegas Operations: if the quarter’s baccarat win percentage is outside of the 18.0%-26.0% band, then a hold adjustment is calculated by applying a baccarat win percentage of 22.0%, and if the quarter’s non-baccarat win
percentage is outside of the 16.0%-24.0% band, then a hold adjustment is calculated by applying a non-baccarat win percentage of 20.0%.- for Sands Bethlehem: no hold adjustment is made.- for all properties: gaming taxes, commissions paid to third parties on incremental win, bad debt expense, discounts and other incentives are applied to determine the adjusted property EBITDA impact.
2. As referenced on page 32, we revised the normalized rolling win percentage in Q1 2017. Adjusted property EBITDA presented here reflects adjusted property EBITDA from The Venetian Macao, Sands Cotai Central, The Parisian Macao, The Plaza Macao and Four Seasons Hotel Macao, Sands Macao and Ferry Operations and Other. The prior period presentation has been conformed to the current period presentation.

112
1,051
1,436
2,256
217
1,101
1,801
$60
$289
$1,245
$2,874
$1,458
$2,278
$22
$2,030
$0
$500
$1,000
$1,500
$2,000
$2,500
$3,000
2017 2018 2019 2020 2021 2022 2023 2024
SCL MBS US LVSC
Debt Maturity ProfileDebt Maturity by Year
Long Term and Low Cost Financing in Place
($ in millions)
3%% of Total 1% 12% 28%
34
14% 22% 0% 20%
1. Amounts maturing from July 1 through December 31, 2017.
1

$472 $447 $445 $396 $381 $500 $500 $500
$250 $175 $75
$830
$192 $75
$210 $390$767 $925 $275
$190
$285 $67 $107
$1,449
$898
$1,179
$1,529$1,398
$1,045
$725$575
$0
$500
$1,000
$1,500
$2,000
$2,500
$3,000
2012A 2013A 2014A 2015A 2016A 2017E 2018E 2019E
Maintenance Investments in Current Properties¹ Sands Cotai Central The Parisian Macao St. Regis at SCC Other
Capital Expenditures ExpectationsFuture Planned Investments Composed of Income Producing Projects and Maintenance
Future Capital Expenditures Focused on Growth in Asia
($ in millions)
1. Reflects investments that will generate future income in our current property portfolio.
Sands Cotai CentralSt. Regis at Sands Cotai CentralThe Parisian Macao
LVS Capex Expectations
Development Timeline Pre-OpeningPost-Opening
35
$40
$49
$60
$19
$25
$8
$73
$50
$20

Family-friendly Entertainment World Class Concerts, Sporting Events and Other
Entertainment Offerings Targeting Chinese Consumers
Over Two Million sq. feet
of World Class Shopping Market-Leading Customer Database
Highly Themed Tourism Attractions
Portfolio of Nearly
13,000 Suites and Hotel Rooms
Over Two Million sq. feet of Conference,
Exhibition and Carpeted Meeting Space
The Broadest
and Deepest
Mass
Tourism
Offerings
in MacaoGreat Brand Awareness in China
Market-Leading ~$13 Billion of Investment in Macao’s Future as a Business & Leisure Tourism Destination
Meaningful Expansion of Mass Market
Offerings with The Parisian Macao
Our Diversified Convention-based Integrated Resort Offerings Coupled with Industry Leading Branding and Service Offerings Appeal to the Broadest Set of Customers and Comprise a Unique and Enduring Competitive Advantage in the Macao Market 36

Macao Mass VisitationBusiness & Leisure Tourism Expenditure Drivers
Future Growth Drivers
More efficient and affordable transportation infrastructure
Greater number of hotel rooms and non-gaming offerings in Macao
Additional tourism attractions in Macao and Hengqin Island
Rapidly expanding middle-class with growing disposable income
37
As a result, Macao’s Mass visitors will:
Come From Farther
Away
Stay Longer
Spend More On:
• Lodging
• Retail
• Dining
• Entertainment
• Gaming

Supplemental Information 2Q17 and 2Q16
38
($ in millions) Three Months Ended June 30, 2017
Amortization Loss on Pre-Opening
Depreciation of Leasehold Disposal or and Adjusted
Operating and Interests Impairment Development Royalty Stock-Based Corporate Property
Income (Loss) Amortization in Land of Assets Expense Fees Compensation Expense EBITDA
Macao:
The Venetian Macao 207$ 43$ 1$ 3$ -$ -$ 2$ -$ 256$
62 67 2 - 1 - 1 - 133
The Parisian Macao 45 58 - - 2 - 1 - 106
48 9 1 - 1 - - - 59
Sands Macao 30 8 1 - - - - - 39
Ferry Operations and Other (21) 3 - - - 25 - - 7
Macao Operations 371 188 5 3 4 25 4 - 600
Marina Bay Sands 385 78 4 - 1 24 - - 492
United States:
Las Vegas Operating Properties 80 47 - - - (48) - - 79
Sands Bethlehem 29 8 - - - - - - 37
United States Property Operations 109 55 - - - (48) - - 116
Other Development (1) - - - 1 - - - -
Corporate (48) 6 - - - (1) - 43 -
816$ 327$ 9$ 3$ 6$ -$ 4$ 43$ 1,208$
Three Months Ended June 30, 2016
Amortization Loss on Pre-Opening
Depreciation of Leasehold Disposal or and Adjusted
Operating and Interests Impairment Development Royalty Stock-Based Corporate Property
Income (Loss) Amortization in Land of Assets Expense Fees Compensation Expense EBITDA
Macao:
The Venetian Macao 200$ 40$ 1$ -$ -$ -$ 3$ -$ 244$
69 72 2 1 - - 1 - 145
32 10 1 - 1 - - - 44
Sands Macao 38 9 1 - - - - - 48
Ferry Operations and Other (14) 4 - - - 17 - - 7
Macao Operations 325 135 5 1 1 17 4 - 488
Marina Bay Sands 270 61 4 - - 22 - - 357
United States:
Las Vegas Operating Properties 55 43 - 10 1 (38) 1 - 72
Sands Bethlehem 30 8 - - - - - - 38
United States Property Operations 85 51 - 10 1 (38) 1 - 110
Other Development (33) - - - 33 - - - -
Corporate (129) 8 - - - (1) - 122 -
518$ 255$ 9$ 11$ 35$ -$ 5$ 122$ 955$
The Plaza Macao and Four Seasons Hotel Macao
Sands Cotai Central
The Plaza Macao and Four Seasons Hotel Macao
Sands Cotai Central

Supplemental Information YTD 2Q17 and YTD 2Q16
39
($ in millions) Six Months Ended June 30, 2017
Amortization Loss on Pre-Opening
Depreciation of Leasehold Disposal or and Adjusted
Operating and Interests Impairment Development Royalty Stock-Based Corporate Property
Income (Loss) Amortization in Land of Assets Expense Fees Compensation Expense EBITDA
Macao:
The Venetian Macao 451$ 84$ 3$ 4$ -$ -$ 3$ -$ 545$
133 135 4 - 2 - 2 - 276
The Parisian Macao 71 113 1 - 2 - 1 - 188
87 19 2 - 2 - - - 110
Sands Macao 74 17 1 - - - 1 - 93
Ferry Operations and Other (44) 7 - - - 49 - - 12
Macao Operations 772 375 11 4 6 49 7 - 1,224
Marina Bay Sands 649 153 8 1 1 45 - - 857
United States:
Las Vegas Operating Properties 201 92 - 1 - (93) - - 201
Sands Bethlehem 58 15 - - - - - - 73
United States Property Operations 259 107 - 1 - (93) - - 274
Other Development (4) - - - 4 - - - -
Corporate (97) 13 - - - (1) - 85 -
1,579$ 648$ 19$ 6$ 11$ -$ 7$ 85$ 2,355$
Six Months Ended June 30, 2016
Amortization Loss on Pre-Opening
Depreciation of Leasehold Disposal or and Adjusted
Operating and Interests Impairment Development Royalty Stock-Based Corporate Property
Income (Loss) Amortization in Land of Assets Expense Fees Compensation Expense EBITDA
Macao:
The Venetian Macao 424$ 80$ 3$ -$ -$ -$ 5$ -$ 512$
155 146 4 1 - - 2 - 308
69 19 2 - 2 - - - 92
Sands Macao 60 18 1 - - - - - 79
Ferry Operations and Other (26) 7 - - - 33 1 - 15
Macao Operations 682 270 10 1 2 33 8 - 1,006
Marina Bay Sands 456 128 8 (2) - 42 - - 632
United States:
Las Vegas Operating Properties 133 87 - 10 1 (74) 2 - 159
Sands Bethlehem 60 15 - 1 - - - - 76
United States Property Operations 193 102 - 11 1 (74) 2 - 235
Other Development (44) - 1 - 43 - - - -
Corporate (183) 15 - - - (1) - 169 -
1,104$ 515$ 19$ 10$ 46$ -$ 10$ 169$ 1,873$
The Plaza Macao and Four Seasons Hotel Macao
Sands Cotai Central
The Plaza Macao and Four Seasons Hotel Macao
Sands Cotai Central

Macao Market Background and Infrastructure Slides

2Q17
54%
82%
46%
18%
0%
20%
40%
60%
80%
100%
Gross Gaming Revenue Operating Profit
Mass Tables and Slots VIP Gaming
53%
82%
47%
18%
0%
20%
40%
60%
80%
100%
Gross Gaming Revenue Operating Profit
Mass Tables and Slots VIP Gaming
Mass Tables and Slots Comprise the Majority of Total Macao Market GGR and Generate the Bulk of Gaming Operating Profit
Composition of Macao Market Gross Gaming Revenue and Est. Gaming Operating Profit¹
Source: Macao DICJ1. This presentation reflects an assumed operating profit margin of 10.0% on gross VIP revenue and a blended margin of 40% on mass table and slot gross revenue. Gross gaming revenue presented here for 2Q17 is estimated based on DICJ data and differences between DICJ reporting and Mass / VIP win as reported by the gaming operators in their public filings. For all other quarters, Mass and VIP win are calculated based on reported win by the operators in their public filings.
Mass Gaming is the Primary Driver of Gaming Operating Profit
41
~1.6X
$30,046M $7,850M$7,900M $2,050M
~1.5X
($ in millions) ($ in millions)
TTM 2Q17

Five Trends that Should Contribute To Growth in the Macao Market In The Future
1
2
3
4
5
200 million Chinese are expected to travel outside of China by 2020,compared to 128 million in 2015. Chinese tourism expenditures are expected to increase 10% annually through 2020 to reach $354 billion
Transportation infrastructure and connectivity throughout China,especially in the Pearl River Delta region, will be meaningfully expanded
Over 4,000 new hotel rooms will open in Macao through 2018
Increasing length of stay in Macao
Hengqin Island will contribute to Macao’s diversification and to its further development as a business and leisure tourism destination
Sources: McKinsey, Ernst & Young, CLSA, World Travel and Tourism Council (“WTTC”).
42

0%
5%
10%
15%
20%
25%
30%
35%
40%
45%
50%
55%
60%
'67 '73 '79 '85 '91 '97 '03 '09 '15
Taiwan
Korea
China
$8 $9 $9 $11$13$19 $26 $29
$39
$55
$84
$108
$143
$215
$235
$261
$289
$319
$354
5 8 10 11 13 14 18 20
27 31 38 41 46
48 57
70 83
98
117 128
137
150
165
181
200
0
50
100
150
200
250
300
350
400
'96 '98 '00 '02 '04 '06 '08 '10 '12 '14 '16 '18 '20
Outbound Travel from China
China Is The World’s Largest and Fastest Growing Outbound Tourism Market
43
Outbound Travel Penetration2
Wealth Generation and Increased Mobility in China Have Driven Strong Growth in Outbound Trips and Tourism Spend, and Comparative Outbound Travel Penetration Rates Show a Meaningful Opportunity for Continued Long-Term Growth
Expenditure ($ in billions)
Chinese outbound
tourists ($ in millions)
CLSA / WTTC estimates1
Source: CLSA, WTTC, UNWTO.1. The outbound tourist forecast is based on CLSA estimates. The expenditure forecast is based on estimates from the WTTC. Historical expenditure data is converted to USD using the average exchange rate during the respective year. WTTC forecasts are converted to USD using the average exchange rate in 2015. 2. Outbound travel penetration is defined as total departures by residents as a percentage of the respective country’s population. Penetration rates assume that each visitor from Mainland China is a unique visitor.
1
56.1%
38.3%
9.3%
CAGR
2009 - 2015 2015-2020
Expenditure 40% 10%
Tourists 18% 9%

Strong Growth in Chinese Outbound Tourism
44
Chinese Outbound Tourism to Select Markets
Source: CLSA, Macao DSEC, Hong Kong Tourism Board, Bloomberg.
Continued Growth of Chinese Outbound Tourism will Drive Macao Mass Tourism Opportunity
1
(in millions)
+17%2010-2016
CAGR +13% +16% +25% +29% +41% +11%+20% +27% +8%+14%+13%
0.4 0.5 0.9 1.1 1.2 0.8 1.6 1.4 1.9 1.1
13.2
22.7
1.2 1.3 1.9 2.3 2.9 3.1 3.5
6.48.1 8.8
20.5
42.8
0.0
10.0
20.0
30.0
40.0
50.0
Australia Germany France Malaysia Singapore USA Taiwan Japan Korea Thailand Macao Hong Kong
2010 2016

$1.1 $1.2 $1.2 $1.3 $1.4
$2.3 $2.5
$4.0
$10.0
$-
$5
$10
$15
France Brazil Mexico Germany Russia Japan Indonesia USA China
Chinese Middle Class Consumption GrowthChinese Middle Class Consumption in 2030 is Projected to Reach $10.0 trillion
45
Global Middle Class Consumption in 2030 (US$ in trillions)
Note: Brookings Institution defines the global middle class as those households with daily expenditures between $10 and $100 per person in purchasing power parity terms.Source: Brookings Institution, UN, World Bank, The Financial Times.
Continued Growth of the Chinese Middle Class Will Drive Macao Mass Tourism Opportunity
1
($ in trillions)

Twelve Months Ended June 30, Population GDP Per Penetration
Province 2016 2017 % Change (MM) Capita (US$) Rate
Guangdong 9,055,759 9,171,912 +1% 108 $10,346 8.5%
Hunan 825,802 931,052 +13% 68 $6,600 1.4%
Fujian 828,104 786,303 -5% 38 $10,432 2.0%
Hubei 636,229 674,405 6% 59 $7,784 1.2%
Guangxi 561,384 596,785 +6% 48 $5,400 1.2%
Zhejiang 549,165 584,486 +6% 55 $11,935 1.1%
Shanghai 488,121 569,121 +17% 24 $15,934 2.4%
Jiangsu 480,807 509,703 6% 80 $13,550 0.6%
Jiangxi 425,894 467,349 +10% 46 $5,647 1.0%
Henan 412,870 442,745 +7% 95 $6,018 0.5%
Sichuan 388,711 366,274 -6% 82 $5,656 0.4%
Beijing 324,389 336,401 +4% 22 $16,306 1.5%
Liaoning 311,974 299,093 -4% 44 $10,111 0.7%
Heilongjiang 245,378 261,690 7% 38 $6,100 0.7%
Shandong 242,651 249,217 3% 98 $9,862 0.3%
Anhui 246,273 243,445 -1% 61 $5,521 0.4%
Hebei 246,839 243,915 -1% 74 $6,187 0.3%
Chongqing 235,220 230,306 -2% 30 $8,031 0.8%
Jilin 206,629 216,443 +5% 28 $7,990 0.8%
Shanxi 193,609 196,963 2% 37 $5,385 0.5%
Tianjin 113,031 128,741 14% 15 $16,472 0.8%
All Other Provinces 3,348,378 3,539,457 +6% 225 N/A 1.6%
Subtotal (Excluding
Guangdong)11,311,458 11,873,894 +5% 1,266 $7,614 0.9%
Total China 20,367,217 21,045,806 +3% 1,375 $7,829 1.5%
46Note: Penetration rates assume that each visitor to Macao from Mainland China is a unique visitor. GDP per Capita defined as 2015 GDP divided by 2015 population (the latest data available).Source: Macao DSEC, National Bureau of Statistics of China.
Year-Over-Year Visitation Growth Mainland Chinese Visitation to Macao
Mainland Chinese Visitation to MacaoPenetration Remains Low
1
<-10%
10% - 20% Data not available
-10% - <0% 0% - <10%

Infrastructure: China’s High-Speed RailConnecting More of Mainland China to Macao
Source: SCMP, LVS, New York Times.47
2
The Chinese Premier Has Pledged to Continue Heavy Investment in the High Speed Rail System –Approximately US$130 billion per year for the 2016-2020 Period
Beijing – Guangzhou High-Speed Rail
World’s longest high-speed rail route
Covers 2,298km in ~10 hours (compared to 22 hours previously)
Provides seamless connection from Northern China to the Macao border via the Guangzhou-Zhuhai Intercity Rail
5-10 trains in each direction each day
Guangzhou – Zhuhai Intercity Rail
Rail line connecting Guangzhou to Zhuhai, where the Gongbei border gate to Macao is located
Guangzhou is the largest city in Guangdong province and is a key economic and transportation hub
Reduces travel time from Guangzhou to Zhuhai from 2+ hours by bus to as short as 60 minutes
Zhuhai station opened in Jan 2013
Future link to Macao Light Rail System
35 trains in each direction each day
Wuhan – Guangzhou High-Speed Rail
Wuhan is the capital of Hubei Province and one of the most populous cities in Central China with ~10 million people
Wuhan is an important economic and transportation hub in Central China
HSR reduces travel time to Guangzhou from 11 hours by bus to under 4 hours by train
55-65 trains in each direction each day
Hong KongMacao

Infrastructure: Meaningful Improvements Throughout the Pearl River Delta Region
Source: World Bank, China Daily, Macau Business Daily, Chinatrainguide.com, Analyst reports. Note: population and GDP data from 2014.48
GuangzhouPopulation: 13M
GDP Per Capita: US$20,000
MacaoPopulation: 0.6M
GDP Per Capita: US$96,000Hengqin Island
• Special economic area• Over $20B of overall investment expected• Over 10,000 hotel rooms expected (~5,000 today)• Phase I of Chimelong theme park opened in Jan. ‘14
and attracted 7.5M visitors in ‘15. 20M annual visitors expected at completion of all phases
Hong KongPopulation: 7.2M
GDP Per Capita: US$40,200
Hong Kong-Macao-Zhuhai Bridge (expected completion: 2018)
Wuhan – Guangzhou High-Speed Rail• 4 hour train ride• 55-65 trains in each direction per day
ShenzhenPopulation: 15M
GDP Per Capita: US$29,000China Border Gate Expansion
• Daily capacity increased from 150,000 to 350,000 people in 2H13
• Reduced average wait times on China side of border
Guangzhou – Zhuhai Intercity Rail• 70 - 90 minute train ride (2+ hours by bus)• 35 trains in each direction per day• Final link to Gongbei border gate completed in
January 2013
Guangzhou – Shenzhen – Hong Kong Rail• 2 hour train ride from Guangzhou to Hong Kong• 12 trains in each direction per day
Legend
Existing
Future
Gongbei – Hengqin Railway• Connects the Gongbei border crossing with
Hengqin Island• Stops at Lotus Bridge crossing and ends at
Chimelong theme park• Expected completion 2018
2
Taipa Ferry Terminal• Opened June 2017• 40 ferry per hour capacity and helipad• 114 immigration clearance counters
and e-channels

Sands Cotai Central5,846
The Venetian Macao
2,905
The Parisian Macao2,951
Galaxy Macau³
Phase I: 2,250Phase II: 1,250 City of Dreams
1,400
Macau Studio City1,600
Grand Lisboa, 430
SJM Cotai2,000
Wynn Macau, 1,008
Wynn Palace1,700
MGM Grand, 582
MGM Cotai1,400
12,770
4,3294,010
2,838 2,7081,982
0
2,000
4,000
6,000
8,000
10,000
12,000
14,000
Sands China Galaxy Entertainment Melco Crown SJM Holdings² Wynn Resorts MGM China
Hotel % of Gaming % of Total
Gaming Operator Rooms Operators Market
Sands China 12,770 45% 34%
Galaxy Entertainment 4,329 15% 11%
Melco Crown 4,010 14% 11%
SJM Holdings² 2,838 10% 8%
Wynn Resorts 2,708 9% 7%
MGM China 1,982 7% 5%
Subtotal Gaming Operators 28,637 100% 76%
Other 4/5 Star 9,060 0% 24%
Total 37,697 100% 100%
1. In addition to the hotel rooms that are owned by gaming operators presented here, it is projected that there will be approximately 9,060 additional four- and five-star hotel rooms in Macao at December 31, 2018.2. Reflects only SJM Holdings self-owned hotels.3. Reflects the opening of Galaxy Phase II, an extension to the Galaxy Macau, which opened on May 27, 2015.Note: SCL’s room counts may change based on future investments.Source: Public company filings, Macao DSEC.
49
Macao Market Gaming Operator Hotel Rooms at December 31, 20181
Four Seasons Macao, 379
St. Regis Macao, 400
With a Market-Leading ~US$13 billion of Investment,SCL Hotel Inventory Will Represent 45% of Macao Competitor Hotel Inventory
Market Leading Hotel Capacity at SCLProjected Macao Market 4/5 Star Hotel Rooms at December 31, 2018
Sands Macao, 289
Altira Macau, 230
Starworld, 509
Broadway Macau, 320
Sofitel Macau, 408
City of Dreams Morpheus Tower, 780
3
`

4.6
5.2
6.2
6.86.6
7.5
0.0
1.0
2.0
3.0
4.0
5.0
6.0
7.0
8.0
2011 2012 2013 2014 2015 2016
2.12.0
2.12.0
2.12.2
0.0
0.5
1.0
1.5
2.0
2.5
2011 2012 2013 2014 2015 2016
Average Length-of-Stay ofMainland Chinese Overnight Visitors in Macao Mainland Chinese Hotel Guests in Macao
Length-of-Stay of Chinese Overnight Visitors & Number of Chinese Hotel Guests in Macao
Source: Macao DSEC.50
(in millions)
Additional Hotel Capacity and Transportation Infrastructure Will Enhance Hotel Visitation and Average Length of Stay in Macao
4
(Days)

5.2
6.3
7.3
8.1
8.9
9.79.2
10.3
2.42.8
0.0
2.0
4.0
6.0
8.0
10.0
12.0
14.0
2009 2010 2011 2012 2013 2014 2015 2016 2Q16 2Q17
5.8
6.9
8.8 8.8
9.7
11.511.2
10.2
2.4 2.3
0.0
2.0
4.0
6.0
8.0
10.0
12.0
14.0
2009 2010 2011 2012 2013 2014 2015 2016 2Q16 2Q17
Mainland China Day-Trip Visitors to Macao Mainland China Overnight Visitors to Macao
Overnight Visitation Now Exceeds “Day-trip” Visitation to Macao
(in millions)
Source: Macao DSEC.51
(in millions)
While “Day-trip” Visitation is Decreasing…Overnight Visitation Grew 16.7% in 2Q17, Benefitting From Additional Hotel Capacity and Transportation Infrastructure
4

Hengqin Island Expands Critical Mass of Tourism Offerings for Visitors to the Region
52
Map of Hengqin Island New Area Important Facts
Island adjacent to Macao (3X the size of Macao) that has been identified as a strategic zone for cooperation among Guangdong Province, Hong Kong and Macao
Master-planned island with greater than US$20 billion of investment focused on tourism development, industrial and technological innovation and education
One of three current “New Area” reform zones in China
— Support from the Central Government to enable long term success
— Empowerment to have broad flexibility on economic and legal matters
Designed to contribute to the diversification of Macao
— US$3.2 billion Chimelong International Ocean Resort opened January 28, 2014 and attracted 7.5M visitors in 2015. It is expected to generate 20 million visits in the future after completion of all phases.¹
— Hengqin’s central business district features an 800,000square foot convention center
— More than 10,000 hotel rooms expected to open over the next five years. Around 5,000 hotel rooms are currently open.
Source: Macau Daily, Zhuhai Daily, Chimelong Group, Hengqin New Area Administrative Committee.1. Phase 1 includes the Hengqin Bay Hotel, the Ocean Kingdom theme park, the Circus World show and a waterpark in the Hengqin Bay Hotel.
5

Non-GAAP Measures Reconciliations

Reconciliation of Net Income to Consolidated Adjusted Property EBITDA and Hold-Normalized Adjusted Property EBITDA
541. As referenced on page 32, we revised the normalized rolling win percentage in Q1 2017. The prior period presentation has been conformed to the current period presentation.
($ in millions) Three Months Ended Six Months Ended
June 30, June 30,
2017 2016 2017 2016
Net income 638$ 394$ 1,216$ 803$
Add (deduct):
Income tax expense 78 55 147 118
Loss on modification or early retirement of debt - - 5 -
Other expense 25 7 61 54
Interest expense, net of amounts capitalized 79 64 157 133
Interest income (4) (2) (7) (4)
Loss on disposal or impairment of assets 3 11 6 10
Amortization of leasehold interests in land 9 9 19 19
Depreciation and amortization 327 255 648 515
Development expense 2 2 5 4
Pre-opening expense 4 33 6 42
Stock-based compensation 4 5 7 10
Corporate expense 43 122 85 169
Consolidated Adjusted Property EBITDA 1,208$ 955$ 2,355$ 1,873$
Hold-normalized casino revenue (1)(142) 36
Hold-normalized casino expense (1)40 (26)
Consolidated Hold-Normalized Adjusted Property EBITDA 1,106$ 965$

Non-GAAP Measures: Adjusted Net Income; Hold-Normalized Adjusted Net Income; Adjusted Earnings Per Diluted Share; and Hold-Normalized Adjusted Earnings Per Diluted Share
551. The information for the three months ended June 30, 2016 and the six months ended June 30, 2016 has been updated to conform to the current presentation.2. The income tax impact for each adjustment is derived by applying the effective tax rate, including current and deferred income tax expense, based upon the jurisdiction and nature of the adjustment.3. As referenced on page 32, we revised the normalized rolling win percentage in Q1 2017. The prior period presentation has been conformed to the current period presentation.
($ in millions) Three Months Ended Six Months Ended
June 30, June 30,
2017 2016 (1)2017 2016 (1)
Net income attributable to Las Vegas Sands Corp. 545$ 328$ 1,025$ 648$
Nonrecurring corporate expense - 79 - 79
Pre-opening expense 4 33 6 42
Development expense 2 2 5 4
Loss on disposal or impairment of assets 3 11 6 10
Other expense 25 7 61 54
Loss on modification or early retirement of debt - - 5 -
Income tax impact on net income adjustments (2)- (20) - (20)
Noncontrolling interest impact on net income adjustments (3) (19) (5) (21)
Adjusted net income 576$ 421$ 1,103$ 796$
Hold-normalized casino revenue (3)(142) 36
Hold-normalized casino expense (3)40 (26)
Income tax impact on hold adjustments (2)16 (2)
Noncontrolling interest impact on hold adjustments 1 (7)
Hold-normalized adjusted net income 491$ 422$
Three Months Ended Six Months Ended
June 30, June 30,
2017 2016 (1)2017 2016 (1)
Per diluted share of common stock:
Net income attributable to Las Vegas Sands Corp. 0.69$ 0.41$ 1.29$ 0.82$
Nonrecurring corporate expense - 0.10 - 0.10
Pre-opening expense 0.01 0.04 0.01 0.05
Development expense - - 0.01 0.01
Loss on disposal or impairment of assets - 0.01 0.01 0.01
Other expense 0.03 0.01 0.07 0.07
Loss on modification or early retirement of debt - - 0.01 -
Income tax impact on net income adjustments - (0.02) - (0.03)
Noncontrolling interest impact on net income adjustments - (0.02) (0.01) (0.03)
Adjusted earnings per diluted share 0.73$ 0.53$ 1.39$ 1.00$
Hold-normalized casino revenue (0.18) 0.04
Hold-normalized casino expense 0.05 (0.03)
Income tax impact on hold adjustments 0.02 -
Noncontrolling interest impact on hold adjustments - (0.01)
Hold-normalized adjusted earnings per diluted share 0.62$ 0.53$
Weighted average diluted shares outstanding 792 795 794 795

Non-GAAP Trailing Twelve Month Supplemental Schedule
56
($ in millions) 2Q16 3Q16 4Q16 1Q17 2Q17 TTM 2Q17
Cash Flows From Operations 988$ 1,043$ 1,213$ 963$ 1,146$ 4,365$
Adjust for:
Provision for doubtful accounts (43) (51) (34) (32) (22) (139)
Foreign exchange (gains) losses (17) 7 41 (18) (5) 25
Other non-cash items (16) (31) (15) (28) (22) (96)
Changes in working capital (243) (70) (206) 27 (120) (369)
Add: Stock-based compensation expense 5 2 2 3 4 11
Add: Corporate expense 122 39 48 42 43 172
Add: Pre-opening and development expense 35 89 4 5 6 104
Add: Other expense 69 45 10 116 100 271
Add: Income tax expense 55 69 52 69 78 268
LVS Consolidated Adjusted Property EBITDA 955$ 1,142$ 1,115$ 1,147$ 1,208$ 4,612$
Adjusted Property EBITDA
Macao:
The Venetian Macao 244$ 315$ 262$ 289$ 256$
Sands Cotai Central 145 176 132 143 133
The Parisian Macao - 19 95 82 106
The Plaza Macao and Four Seasons Hotel Macao 44 62 67 51 59
Sands Macao 48 46 47 54 39
Ferries and Other 7 10 7 5 7
Macao Operations 488 628 610 624 600 2,462
Marina Bay Sands 357 391 366 365 492 1,614
U.S.:
Las Vegas Operating Properties 72 86 111 122 79
Sands Bethlehem 38 37 28 36 37
U.S. Operating Properties 110 123 139 158 116 536
LVS Consolidated Adjusted Property EBITDA 955$ 1,142$ 1,115$ 1,147$ 1,208$ 4,612$

($ in millions) 2Q16 3Q16 4Q16 1Q17 2Q17
Macao OperationsReported 488$ 628$ 610$ 624$ 600$ Hold-Normalized Adjustment 22 (50) (27) (32) (3) Hold-Normalized 510$ 578$ 583$ 592$ 597$
Marina Bay SandsReported 357$ 391$ 366$ 365$ 492$ Hold-Normalized Adjustment (34) (23) - 23 (106) Hold-Normalized 323$ 368$ 366$ 388$ 386$
Las Vegas OperationsReported 72$ 86$ 111$ 122$ 79$ Hold-Normalized Adjustment 22 2 - (2) 7 Hold-Normalized 94$ 88$ 111$ 120$ 86$
Sands BethlehemReported 38$ 37$ 28$ 36$ 37$ Hold-Normalized 38$ 37$ 28$ 36$ 37$
LVS ConsolidatedReported 955$ 1,142$ 1,115$ 1,147$ 1,208$ Hold-Normalized Adjustment 10 (71) (27) (11) (102) Hold-Normalized 965$ 1,071$ 1,088$ 1,136$ 1,106$
Historical Hold-Normalized Adj. Property EBITDA1
57
2
1. This schedule presents hold-normalized adjusted property EBITDA based on the following methodology:- for Macao Operations : if the quarter’s rolling win percentage is outside of the 3.00%-3.30% band, then a hold adjustment is calculated by applying a rolling win percentage of 3.15% to the rolling volume for the quarter- for Marina Bay Sands: if the quarter’s rolling win percentage is outside of the 2.70%-3.00% band, then a hold adjustment is calculated by applying a rolling win percentage of 2.85% to the rolling volume for the quarter- for Las Vegas Operations: if the quarter’s baccarat win percentage is outside of the 18.0%-26.0% band, then a hold adjustment is calculated by applying a baccarat win percentage of 22.0%, and if the quarter’s non-baccarat win
percentage is outside of the 16.0%-24.0% band, then a hold adjustment is calculated by applying a non-baccarat win percentage of 20.0%- for Sands Bethlehem: no hold adjustment is made- for all properties: gaming taxes, commissions paid to third parties on incremental win, bad debt expense, discounts and other incentives are applied to determine the adjusted property EBITDA impact
2. As referenced on page 32, we revised the normalized rolling win percentage in Q1 2017. Adjusted property EBITDA presented here reflects adjusted property EBITDA from The Venetian Macao, Sands Cotai Central, The Parisian Macao, The Plaza Macao and Four Seasons Hotel Macao, Sands Macao and Ferry Operations and Other. The prior period presentation has been conformed to the current period presentation.

The Parisian Macao: Reconciliation of Adjusted Property EBITDA to Hold-Normalized Adjusted Property EBITDA1
58
1. Hold-normalized adjusted property EBITDA at The Parisian Macao is calculated using the following methodology: If the quarter’s rolling win percentage is outside of the 3.00%-3.30% band, then a hold-adjustment is calculated by applying a rolling win percentage of 3.15% to the rolling volume for the quarter. Gaming taxes, commissions paid to third parties on incremental win, bad debt expense, discounts and other incentives are applied to determine the adjusted property EBITDA impact.
($ in millions) Sequential Sequential
4Q16 1Q17 Change 2Q17 Change
As Reported 95$ 82$ -13.7% 106$ 29.3%
Hold-Normalized Casino Revenues (37) 8 (25)
Hold-Normalized Casino Expenses 20 (6) 12
Hold-Normalized 78$ 84$ 7.7% 93$ 10.7%
