3-5 total radiated power of radio transmitters … total radiated power of radio transmitters...
TRANSCRIPT

71HARIMA Katsushige et al.
1 Introduction
Designed to generate a statistically uni-form electric field by varying boundary condi-tions with stirrers provided in a shieldedenclosure[1], the reverberation chamber is usedfor EMC measurements, including radiatedemission and immunity measurements[2][3].This chamber is also an effective means ofmeasuring the radiated power of radio trans-mitters with built-in antennas.
Measuring radiated power with a reverber-ation chamber is accomplished by placing theequipment under test (EUT) within the testvolume of the chamber and estimating thetotal radiated power from the mean, median,or maximum value of received power obtainedby rotating the stirrer. If the direct wave com-ponent is included in the received power, it
causes measurement errors. On the other hand,the uniformity of the spatial electric field dis-tribution in an ideal reverberation chambercan be theoretically estimated from the proba-bility density function of its distribution[4][6].However, uniformity in an actual chamber isaffected by the dimensions of the chamber andthe structure of the stirrers[5][6].
Meanwhile, spurious measurement basedon regulations governing unwanted emissionsand radiated power measurement of ultrawideband (UWB) devices using short pulsesignals requires measurement over a wide fre-quency band. However, using conventionalmeasurement methods requires a great deal ofmeasurement time for a broadband radiatedsource.
This paper will first present the results ofcomparison between theoretical and measured
3-5 Total Radiated Power of Radio TransmittersMeasured in a Reverberation Chamber
HARIMA Katsushige, SUGIYAMA Tsutomu, YAMANAKA Yukio, and SHINOZUKA Takashi
A random electromagnetic field is created in a reverberation chamber by moving mechanicalstirrers to vary the boundary condition. The received E-field strength caused by moving the stir-rer is Rayleigh distributed and the field distribution is statistically uniform in an ideal reverbera-tion chamber. The total radiated power of the EUT is obtained by the substitution method fromthe average or median value of the E-field when the receiving antenna is placed so as to avoidthe influence of the direct wave from the EUT. However, using the substitution method requires agreat deal of time to measure the averaged received level for a broadband radiated source. Thedimensions of the chamber and the structure of the stirrers affect the field uniformity in an actualchamber. The statistical characteristics of the spatial E-field distribution in a reverberation cham-ber are described, along with an efficient technique for measuring total radiated power of broad-band radiation sources and the statistical technique using a 63.2% value of the cumulative distri-bution that can reduce the influence of the direct wave.
KeywordsReverberation chamber, Total radiated power, Rayleigh distribution, Rice distribution, Multi path, Stirrer

72 Journal of the National Institute of Information and Communications Technology Vol.53 No.1 2006
values for spatial uniformity of electric fielddistribution in a reverberation chambe[6], andwill then introduce two methods: theimproved mode-stirred method[7][8], capableof measuring radiated power of broadbandradiation sources in a short period of time; andthe statistical technique[9], a measurementmethod that can reduce direct wave effects.The latter method applies a 63.2% value of thecumulative distribution function (CDF) ofreceived power.
2 Statistical characteristics of theelectric field
2.1 Probability density functionThe electric field in a reverberation cham-
ber varies considerably with changes in theboundary condition as a result of the move-ment of the stirrer. When the reverberationchamber is large relative to the wavelength,that is, when a sufficient number of resonantmodes within the chamber exist, the electricfield at a given position in the chamber is thesum of multipath plane waves with randomphases caused by moving of the stirrers.
Generally, the total number of resonantmodes (n) occurring in a rectangular shieldedenclosure is given approximately by the Weylformula[1]:
(1)
where a, b, and c are the dimensions of thechamber andλ is the wavelength.
The electric field vector E at a given pointin the reverberation chamber can be expressedby the following formulas using three rectan-gular components, each of which consists of areal and imaginary part, that is, six parametersin total:
(2)
(3)
As the stirrer moves, an extremely largenumber of multipath waves are generated.Hence, each real and imaginary part of the
rectangular components of the electric field isnormally distributed by the central limit theo-rem. Since these real and imaginary parts arenot correlated, they are independent randomvariables. If a reverberation chamber is ideal,the mean value and the mean square value ofthe real and imaginary part of the rectangularcomponent are given respectively by[10]:
(4)
(5)
where E02 is the mean square of the magnitudeof the electric field E andσ2 is the variance.
Therefore, six parameters of the electricfield are independent random variables andeach parameter is normally distributed withzero mean and variance σ2. The sum of thesquare values of the six parameters, i.e. thesquared magnitude of the resultant field, is thechi-square (χ2) distributed with six degrees offreedom. Similarly, the root value of the chi-square distribution, i.e., the magnitude of theresultant field, is chi distributed with sixdegrees of freedom. The probability densityfunctions of these distributions are givenrespectively by[10][11]
(6)
(7)
Usually, the E-field in the chamber is mea-sured using a linear polarized antenna. The
Fig.1 Ideal reverberation chamber
73HARIMA Katsushige et al.
received data corresponds to one rectangularcomponent with two parameters of the fieldand is therefore the chi-distributed with twodegrees of freedom. The probability andcumulative density function of this chi distrib-ution, which has the same characteristic of aRayleigh distribution, are given respectivelyby[10][11]
(8)
(9)
2.2 Uniformity of spatial electric fielddistribution
The spatial uniformity of the electric fielddistribution in a reverberation chamber isaffected by the number of independent stirrerpositions, i.e., the number of positions towhich the stirrers move that produces uncorre-lated fields in the chamber. If an ideal rever-beration chamber is used, the received E-fieldstrength at a given measurement point in thechamber caused by moving the stirrers isRayleigh distributed, as described in the previ-ous paragraph. The spatial E-field obtained bymoving the measurement point at a fixed stir-rer position (N = 1) is also Rayleigh distributed.
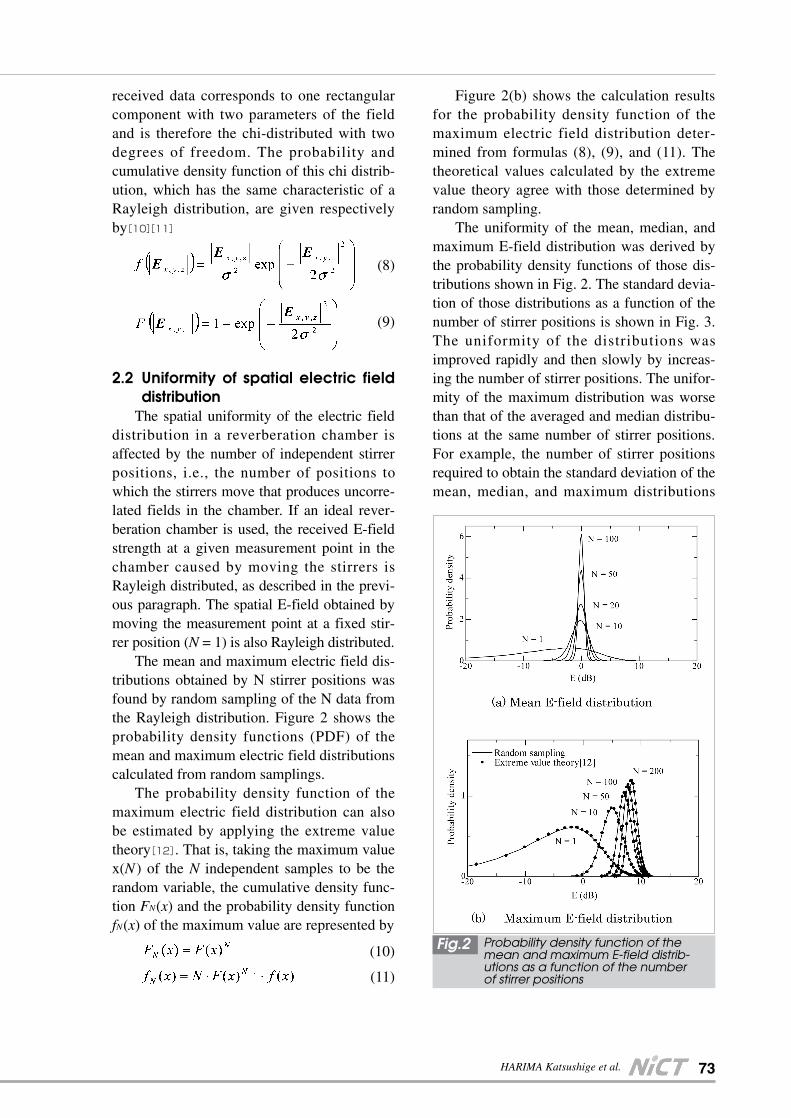
The mean and maximum electric field dis-tributions obtained by N stirrer positions wasfound by random sampling of the N data fromthe Rayleigh distribution. Figure 2 shows theprobability density functions (PDF) of themean and maximum electric field distributionscalculated from random samplings.
The probability density function of themaximum electric field distribution can alsobe estimated by applying the extreme valuetheory[12]. That is, taking the maximum valuex(N ) of the N independent samples to be therandom variable, the cumulative density func-tion FN(x) and the probability density functionfN(x) of the maximum value are represented by
(10)
(11)
Figure 2(b) shows the calculation resultsfor the probability density function of themaximum electric field distribution deter-mined from formulas (8), (9), and (11). Thetheoretical values calculated by the extremevalue theory agree with those determined byrandom sampling.
The uniformity of the mean, median, andmaximum E-field distribution was derived bythe probability density functions of those dis-tributions shown in Fig. 2. The standard devia-tion of those distributions as a function of thenumber of stirrer positions is shown in Fig. 3.The uniformity of the distributions wasimproved rapidly and then slowly by increas-ing the number of stirrer positions. The unifor-mity of the maximum distribution was worsethan that of the averaged and median distribu-tions at the same number of stirrer positions.For example, the number of stirrer positionsrequired to obtain the standard deviation of themean, median, and maximum distributions
Fig.2 Probability density function of themean and maximum E-field distrib-utions as a function of the numberof stirrer positions

74 Journal of the National Institute of Information and Communications Technology Vol.53 No.1 2006
within 1 dB was more than 19, 34, and 92positions, respectively.
As described above, assuming an idealreverberation chamber, the uniformity of theelectric field distribution can be obtained theo-retically using the probability density functionof that distribution, which is a function of thenumber of stirrer positions. However, unifor-mity in an actual chamber is affected by theoperating frequency and the structure of thestirrers. Theoretical and measured values werecompared to assess these effects on uniformity.
Figure 4 shows two reverberation cham-bers used in measurement; these differed insize, stirrer structure, and number of stirrersequipped. The electric field distribution wasmeasured over frequencies from 200 MHz to3 GHz at 125 measurement points partitionedby grids of 5×5×5 at intervals of 25 cm bysetting up 1 m×1 m×1 m measurement vol-
umes in these reverberation chambers.Figure 5 shows a comparison of uniformi-
ty between measured and theoretical valuesfor the mean electric field distribution. Unifor-mity is in good agreement with the theoreticalvalue when the dimensions of a chamber arelarge compared to the wavelength at the oper-ating frequency, that is, when a sufficientnumber of resonant modes exist. The experi-mental results show also that the spatial fielduniformity depends on the frequency and isnot greatly improved at lower operating fre-quencies with an insufficient number of reso-nant modes. Moreover, the figure indicatesthat uniformity is affected by the stirrer struc-ture.
3 Radiated power measurementmethod
This chapter presents two radiated powermeasurement methods reviewed using a rever-beration chamber. Section 3.1 will introduceefficient methods of measuring radiated powerfrom a broadband radiation source, and Sec-tion 3.2 will discuss statistical techniquesensuring the reduction of direct wave effects.
3.1 Improved mode-stirred methodTwo standard measurement methods, the
mode-stirred and mode-tuned method, areavailable for measuring radiated power usinga reverberation chamber[2].
The mode-stirred method continuouslyrotates the stirrer and measures the variation in
Fig.3 Uniformity of mean, median, andmaximum E-field distribution as afunction of the number of stirrerpositions
Fig.4 Reverberation chamber

75HARIMA Katsushige et al.
the received level over the period of one rota-tion of the stirrer at discrete frequencies, thusrequiring a significant amount of time to mea-sure the received level over a wide frequencyspan. In the mode-tuned method, the receivedlevel is measured at a desired full frequencyspan at each stirrer's position as the stirrers aremoved in discrete steps. Although effectivefor measurement over a wide frequency span,this method requires a number of steps torotate the stirrer, entailing difficulty in control-ling the stirrer's drive system. We proposed animproved method capable of measuring radiat-ed power from a broadband radiation source ina short period of time (i.e., within several min-utes) and experimentally verified the efficacyof the proposed method[7][8].
Transmitting and receiving antennas areplaced in a reverberation chamber and con-nected to a spectrum analyzer and signal gen-erator, as shown in Fig. 6. Input power Pin( f )is applied to the transmitting antenna and then
the received power Pr( f ) of the receivingantenna and the reflected power Pref( f ) fromthe transmitting antenna are measured for aperiod of one rotation while continuouslyrotating the stirrer. The averaged net inputpower Pnet( f ) to the transmitting antenna dur-ing the stirrer rotation is
(12)
The total radiated power PTotal ( f ) of theEUT is obtained by the substitution method,i.e., the EUT is replaced at the same locationwith the transmitting antenna, and the twoaveraged received powers Pr ( f ) and Peut ( f )during the stirrer rotation are compared. Thatis,
(13)
The frequency span of the spectrum ana-lyzer should be set to as wide a range as possi-ble, and the analyzer’s sweep speed should beset sufficiently high relative to the stirrer’srotational speed so as to provide a number ofsamples over a period of one rotation of thestirrer. The received power obtained over onerotation is averaged with the watt value usingthe sample detection mode of the spectrumanalyzer.3.1.1 Experimental results and discus-
sionRadiated power was measured by the
improved mode-stirred method using a rever-beration chamber. Double-ridged guide horn
Fig.5 Uniformity of mean E-field distribu-tion
Fig.6 Experimental setup

76 Journal of the National Institute of Information and Communications Technology Vol.53 No.1 2006
antennas were used as transmitting and receiv-ing antennas and connected to the spectrumanalyzer. The transmitting antenna was placedso as to prevent illuminating the test volumedirectly and thus to avoid the influence of adirect wave. As the EUT, a comb generatorwas used to generate pulse signals with apulse width of 84 ps and pulse period of 10 ns.This comb generator was equipped with adouble-ridged guide horn antenna.
The radiated power was measured over afrequency range of 1 to 18 GHz by rotatingthree stirrers at different speeds (1, 2, and3 rpm). The received power was measuredover 120 sweeps during one rotation of stirrersusing the spectrum analyzer at the frequencysweep time of 390 ms at intervals of 4 GHzspan (20001 points). The total radiated powerwas determined from the average receivedpower of the data obtained from the120 sweeps.
Figure 7 shows the output shape of thepulse signal of the comb generator and theshape of the received signal in the reverbera-tion chamber. The figure indicates that thepulse signal with short duration is distorteddue to the high-Q factor of the chamber. Whena reverberation chamber is used for the totalradiated power of pulse signals, the measure-ment results applied by continuous wave(CW) substitution may be possibly affected bya distortion of the pulse signal, depending onthe pulse duration, due to the chamber's high-Q factor. Hence, a pulse signal similar to theEUT's output pulse was substituted for a con-tinuous wave, and the results were compared
with those obtained by the CW substitution.Figure 8 shows the measurement results
for radiated power of the comb generator. Theresults obtained by the improved mode-stirredmethod agree well with those obtained by themode-turned method, thus confirming the effi-cacy of the improved method. Moreover, themeasurements time of 5 minutes was obtainedby using the improved method, that is, thisindicates the efficacy of measuring the radiat-ed power in a short period of time for a broad-band radiation source. However, the radiatedpower measured by applying the CW substitu-tion was shifted by 3–5 dB more than the out-put level of the comb generator, while that forthe pulse substitution agreed with the outputlevel. These results suggest that the pulse sub-stitution using a pulse waveform similar to theEUT's pulse signal is effective in measuringthe radiated power of short pulse signals.
3.2 Statistical estimation method3.2.1 Principle
When a radio transmitter and receivingantenna are arranged in a reverberation cham-ber, a direct wave from the transmitter andreflected waves with random phases createdby rotating stirrers arrive at the receivingantenna. The probability density function p(r)of the received power r, i.e., the mixed wavescombining the direct wave and multipathwaves, is given by the following formula, andthe received power is Rice distributed[13].
(14)
Fig.7 Pulse signal of comb generator

77HARIMA Katsushige et al.
where σ2 is the power corresponding tothe multipath waves, A2/2 is the power corre-sponding to the direct wave, and I0 is a 0th-order modified Bessel function.
Defining the ratio of direct and multipathwave power asρ and normalizing r by thesquare root of the sum of direct and multipathwave power, formula (14) can be rewritten asfollows:
(15)
where
(16)
(17)
Figure 9 shows the cumulative distributionfunction (CDF) F(R) derived by integrating Rin the Eq. (15). Whenρ→ ∞, F(R) = U(R-1),where U is the step function. Whenρ = 0,F(R) = 1-exp(-R2), thus reflecting the samecharacteristics as those of the Rayleigh distrib-ution. These curves intersect at a CDF of R =1, namely, at 0.632 (= F(1)). The intersectionpoint shifts somewhat with respect to rbetween the two curves, but it will be apparentfrom Fig. 9 that the degree of slippage is never
more than 0.5 dB when the CDF is 63.2%. Inother words, the 63.2% value of CDF of thenormalized envelope is practically constant forany value ofρ.
When a transmitting antenna T and receiv-ing antenna R are placed in a reverberationchamber as shown in Fig. 10, the radiatedpower Pt is given by
(18)
where PF is the input power to the antennaT and ΓT is the reflection coefficient of anten-na T.
Assuming that the 63.2% value of CDF ofthe received signal is PTR63, the chamber loss
Fig.8 Experimental results
Fig.9 Cumulative distribution function ofrice distribution

78 Journal of the National Institute of Information and Communications Technology Vol.53 No.1 2006
LC can be defined by
(19)
When the transmitting antenna T isreplaced by EUT, the above formula can berewritten as follows
(20)
Hence,
(21)
where PEUT is the radiated power of EUTand PEUTR63 is 63.2% of the value of CDF ofthe received signal.
Therefore, the radiated power of EUT canbe estimated from the chamber loss LC and the63.2% value of CDF of the received signal.This technique ensures high accuracy in mea-surement even under the condition in which adirect wave exists[9].3.2.2 Example of measuring radiated
power of 2.45 GHz radio trans-mitter
In the measurement of total radiated powerof the radio transmitters by the substitutionmethod, the substitute antenna can be placedanywhere in an ideal reverberation chamber.However, the uniformity of the electric field inan actual camber is affected by the operatingfrequency and by stirrer structure. As a result,the chamber loss varies depending on theantenna position. For example, if the EUT hasan unknown radiation source, as with wirelessLAN equipment built into a laptop PC, the
measured value will vary depending on theposition of the substitute antenna. For this rea-son, effects of the substitute antenna locationwere reviewed using a “dummy” laptop PCwith a built-in 2.45 GHz signal generator. Thedummy laptop PC consists of an actual laptopPC with components such as motherboard andhard disk drive, etc. removed. In the barechassis is installed a 2.45 GHz transmitter. Anantenna for a PCMCIA wireless LAN cardwas used as the transmitting antenna.
The radiated power of the dummy laptopPC was estimated using the 63.2% value ofCDF of the received signal by moving the lap-top PC in four directions, spaced 90 degreesapart in the horizontal plane[14]. The chamberloss was determined as the mean of lossesmeasured by the substitute antenna at fivepoints in the vicinity of the antenna of laptopPC and at six points in the vicinity of the PCenclosure.
Figure 12 shows the measurement results.The true value of radiated power was assessedby correcting the measured value obtained bydirectly connecting a power meter to theantenna cable, i.e., antenna input power, andthe measured value of the reflection coeffi-cient (variation width: 0.3 dB) of the antennain the reverberation chamber.
When the substitute antenna was placed inthe vicinity of the center of the PC enclosure(marked “O”) and the antenna of EUT(marked “◇“), the difference between the truevalue and the measured was within 1.5 dB and0.5 dB, respectively. For the mean of the radi-ated power values measured in the four differ-ent directions, however, when that of the cen-ter of the PC enclosure, the difference betweenthe true value and the measured was within0.6 dB, and when that of the antenna of EUT,the measured value was agreed with the truevalue.
4 Conclusions
We experimentally and theoreticallyreviewed the statistical characteristics of theelectric field distribution in a reverberation
Fig.10 Chamber loss and radiated powermeasurement

79HARIMA Katsushige et al.
chamber and evaluated the effects of stirrerson the spatial uniformity of the electric fielddistribution.
The improved mode-stirrers method wasproposed for the total radiated power measure-ment of broadband radiation sources and itsefficacy was confirmed. Experimental resultsdemonstrated that the measured resultsthrough application of the CW substitutioninclude errors, while the pulse substitution iseffective in measuring the radiated power ofshort pulse signals.
Further, we proposed a statistical tech-nique to estimate the radiated power using a63.2% value of the cumulative distribution forreducing the influence of the direct wave.Through results measured by this method for a2.45 GHz radio transmitter, it was demonstrat-ed that radiated power can be very accuratelyestimated by precisely matching the position
of the EUT's radiation source with the positionof the substitute antenna or by using the meanvalue at positions in the vicinity of the radia-tion source.
Future work is needed to evaluate theeffects of pulse width and to investigate amethod for spurious measurements, as well asa method of measuring radiated power forlarge EUT such as floor-standing equipment.
Acknowledgements
We would l ike to express our deepappreciation to Mr. Kyoichi Nakajima andMr. Tomoyuki Nojima of the Telecom Engi-neering Center for generously lending their“dummy” laptop PC (with 2.5 GHz radiotransmitter) for verification of the statisticalestimation method.
Fig.11 Setup for radiated power mea-surement
Fig.12 Measured result of radiatedpower from dummy laptop PC
References01 M. L. Crawford and G. H. Koepke, “Design, evaluation, and use of a reverberation chamber for perform-
ing electromagnetic susceptibility/vulnerability measurements”, National Bureau of Standards Technical
Note 1092, Apr. 1986.
02 IEC 61000-4-21, “Testing and measurement techniques - reverberation chamber test methods”, 2003.
03 CISPR Publication 16-1, “Reverberation chamber for total radiated power measurement”, 1996.
04 M. O. Hatfield, “A calibration procedure for reverberation chambers”, Proc. 2000 IEEE International
Symposium on EMC, pp.621-626, Washington D. C., USA, Aug. 2000.
05 K. Harima and Y. Yamanaka, “Evaluation of electric-field uniformity in a reverberation chamber for radi-
ated immunity testing”, IEICE Trans. Commun., Vol.E84-B, No.9, pp.2618-2621, Sep. 2001.

80 Journal of the National Institute of Information and Communications Technology Vol.53 No.1 2006
06 K. Harima, “Statistical Characteristics of E-Field Distribution in a Reverberation Chamber”, IEICE Trans.
Commun, Vol. E88-B, No. 8, pp. 3127-3132, Aug. 2005.
07 K. Harima and Y. Yamanaka, “Determining Total Radiated Power for Short Pulse Signals by Using a
Reverberation Chamber”, Proc. EMC Europe Workshop 2005, pp. 77-79, Rome, Italy, Sep. 2005.
08 K. Harima, “Radiated Emission Measurement of Small EUT by Using a Reverberation Chamber”, Proc.
2003 IEEE EMC Symposium, pp. 471-474, Istanbul, TURKEY, May 2003.
09 T. Sugiyama, T. Shinozuka, and K. Iwasaki, “Estimation of Radiated Power of Radio Transmitters Using a
Reverberation Chamber”, IEICE Trans. Commun., Vol. E88-B, No. 8, pp. 3158-3163, Aug. 2005.
10 G. Kostas and B. Boverie, “Statistical model for a mode-stirred chamber”, IEEE Trans. Electromagn.
Compat., Vol.33, No.4, pp.366-370, Nov. 1991.
11 D. A. Hill, “Plane wave integral representation for fields in reverberation chambers”, IEEE Trans. Electro-
magn. Compat., Vol.40, No.3, pp.209-217, Aug. 1998.
12 T. H. Lehman and G. J. Freyer, “Characterization of the maximum test level in a reverberation chamber”,
Proc. 1997 IEEE International Symposium on EMC, pp.44-47, Austin, USA, Aug. 1997.
13 S. O. Rice, “Statistical properties of a sine wave plus random noise”, Bell Syst. Tech. J., Vol. 27, pp.109-
157, Jan. 1948.
14 M. Uchino, O. Tagiri, and T. Shinozuka, “Real-Time Measurement of Noise Statistics”, IEEE Trans. Elec-
tromagn. Compat., Vol.43, No.4, pp.629-636, Nov. 2001.
HARIMA Katsushige
Senior Researcher, EMC MeasurementGroup, Wireless CommunicationsDepartment
EMC Measurement
YAMANAKA Yukio
Group Leader, EMC MeasurementGroup, Wireless CommunicationsDepartment
EMC Measurement
SUGIYAMA Tsutomu
Researcher, EMC Measurement Group,Wireless Communications Department
EMC Measurement
SHINOZUKA Takashi
Research Supervisor, Wireless Commu-nications Department
Electromagnetic Compatibility