3 bio-demographic differen- tials in childhood mortality3 bio-demographic differen- tials in...
TRANSCRIPT
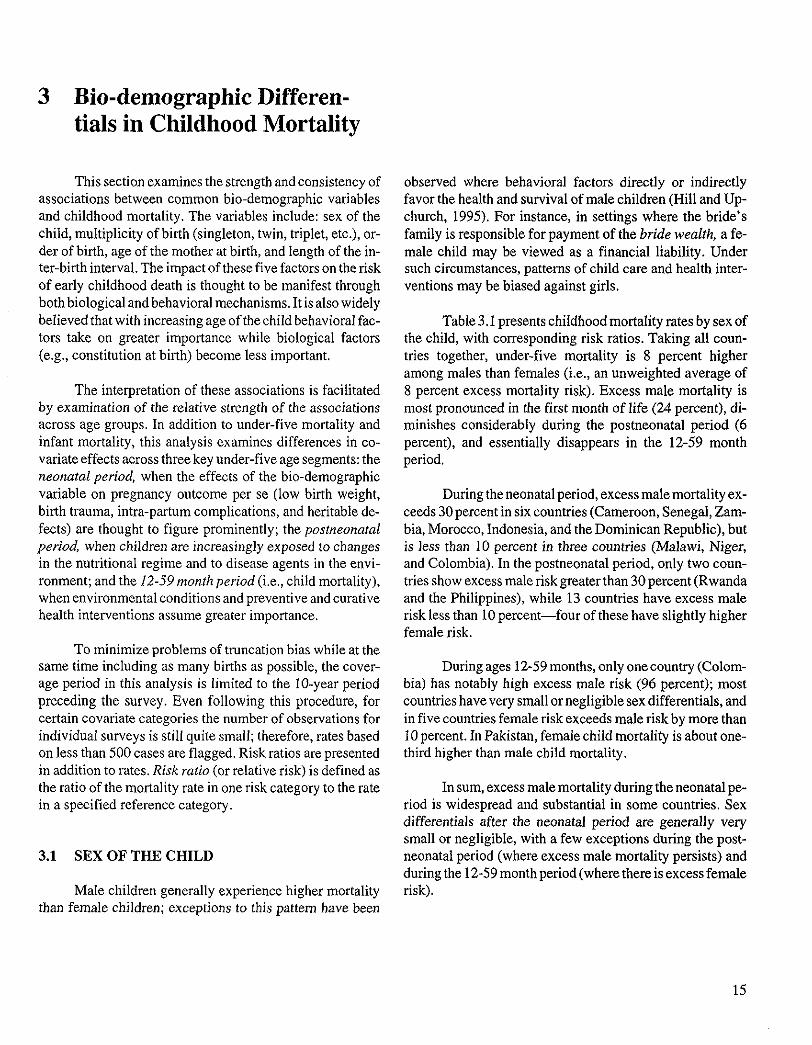
3 Bio-demographic Differen- tials in Childhood Mortality
This section examines the strength and consistency of associations between common bio-demographic variables and childhood mortality. The variables include: sex of the child, multiplicity of birth (singleton, twin, triplet, etc.), or- der of birth, age of the mother at birth, and length of the in- ter-birth interval. The impact of these five factors on the risk of early childhood death is thought to be manifest through both biological and behavioral mechanisms. It is also widely believed that with increasing age of the child behavioral fac- tors take on greater importance while biological factors (e.g., constitution at birth) become less important.
The interpretation of these associations is facilitated by examination of the relative strength of the associations across age groups. In addition to under-five mortality and infant mortality, this analysis examines differences in co- variate effects across three key under-five age segments: the neonatal period, when the effects of the bio-demographic variable on pregnancy outcome per se (low birth weight, birth trauma, intra-partum complications, and heritable de- fects) are thought to figure prominently; the postneonatal period, when children are increasingly exposed to changes in the nutritional regime and to disease agents in the envi- ronment; and the 12-59 month period (i.e., child mortality), when environmental conditions and preventive and curative health interventions assume greater importance.
To minimize problems of tmncation bias while at the same time including as many births as possible, the cover- age period in this analysis is limited to the 10-year period preceding the survey. Even following this procedure, for certain covariate categories the number of observations for individual surveys is still quite small; therefore, rates based on less than 500 cases are flagged. Risk ratios are presented in addition to rates. Risk ratio (or relative risk) is defined as the ratio of the mortality rate in one risk category to the rate in a specified reference category.
3.1 SEX OF THE CHILD
Male children generally experience higher mortality than female children; exceptions to this pattern have been
observed where behavioral factors directly or indirectly favor the health and survival of male children (Hill and Up- church, 1995). For instance, in settings where the bride's family is responsible for payment of the bride wealth, a fe- male child may be viewed as a financial liability. Under such circumstances, patterns of child care and health inter- ventions may be biased against girls.
Table 3.1 presents childhood mortality rates by sex of the child, with corresponding risk ratios. Taking all coun- tries together, under-five mortality is 8 percent higher among males than females (i.e., an unweighted average of 8 percent excess mortality risk). Excess male mortality is most pronounced in the first month of life (24 percent), di- minishes considerably during the postneonatal period (6 percent), and essentially disappears in the 12-59 month period,
During the neonatal period, excess male mortality ex- ceeds 30 percent in six countries (Cameroon, Senegal, Zam- bia, Morocco, Indonesia, and the Dominican Republic), but is less than 10 percent in three countries (Malawi, Niger, and Colombia). In the postneonatal period, only two coun- tries show excess male risk greater than 30 percent (Rwanda and the Philippines), while 13 countries have excess male risk less than 10 percent--four of these have slightly higher female risk.
During ages 12-59 months, only one country (Colom- bia) has notably high excess male risk (96 percent); most countries have very small or negligible sex differentials, and in five countries female risk exceeds male risk by more than I 0 percent. In Pakistan, female child mortality is about one- third higher than male child mortality.
In sum, excess male mortality during the neonatal pe- riod is widespread and substantial in some countries. Sex differentials after the neonatal period are generally very small or negligible, with a few exceptions during the post- neonatal period (where excess male mortality persists) and during the 12-59 month period (where there is excess female risk).
15
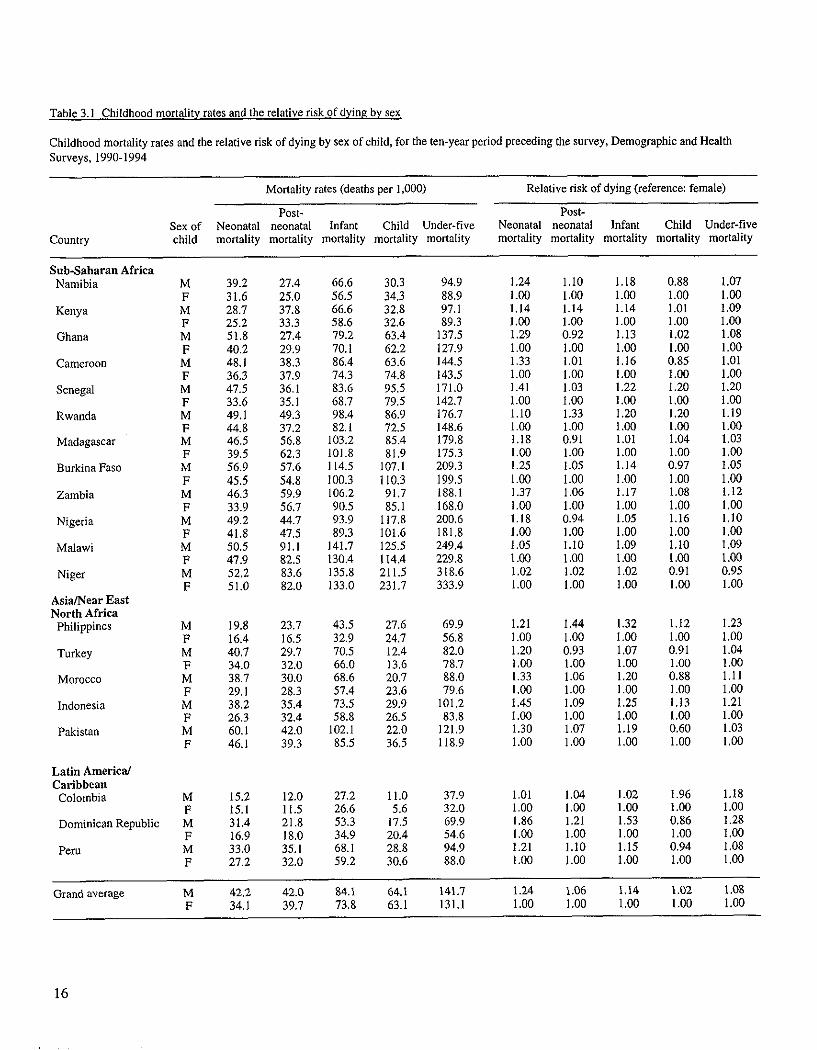
Table 3.1 Childhood mortality rates and the relative risk of dying by sex,
Childhood mortality rates and the relative risk of dying by sex of child, for the ten-year period preceding the survey, Demographic and Health Surveys, 1990-1994
Country
Mortality rates (deaths per 1,000)
Post- Sex of Neonatal neonatal Infant Child Under-five child mortality mortality mortality mortality mortality
Relative risk of dying (reference: female)
Post- Neonatal neonatal Infant Child Under-five mortality mortality mortality mortality mortality
Sub-Saharan Africa Namibia M
F Kenya M
F Ghana M
F Cameroon M
F Senegal M
F Rwanda M
F Madagascar M
F Burkina Faso M
F Zambia M
F Nigeria M
F Malawi M
F Niger M
F Asia/Near East North Africa
Philippines M F
Turkey M F
Morocco M F
Indonesia M F
Pakistan M F
Latin America/ Caribbean
Colombia
Dominican Republic
Peru
39.2 27.4 66.6 30.3 94.9 1.24 1.10 1.I8 0.88 1.07 31.6 25,0 56.5 34.3 88.9 1.00 1,00 1.00 1.00 1.00 28.7 37.8 66.6 32.8 97.1 1.14 1.14 1.14 1.01 1.09 25.2 33.3 58.6 32,6 89.3 1.00 1.00 1.00 1.00 1.00 51.8 27.4 79.2 63.4 137.5 1.29 0.92 1.13 1.02 1.08 40.2 29.9 70.1 62.2 127.9 1.00 1.00 1.00 1.00 1.00 48.1 38.3 86.4 63.6 144.5 1,33 1.01 1.16 0.85 1.01 36.3 37.9 74.3 74.8 143.5 1.00 1.00 1.00 1.00 1.00 47.5 36.1 83.6 95,5 171.0 1.41 1.03 1.22 1.20 1.20 33.6 35.1 68.7 79.5 142,7 1.00 1.00 1.00 1.00 1.00 49.1 49.3 98.4 86.9 176.7 1.10 1.33 1.20 1.20 1.19 44.8 37,2 82.1 72,5 148.6 1.00 1,00 1.00 1,00 1.00 46.5 56.8 103.2 85.4 179.8 1,18 0,91 1.01 1.04 1.03 39.5 62.3 101.8 81.9 175.3 1.00 1.00 1.00 1.00 1.00 56.9 57.6 114.5 107.1 209.3 1.25 1.05 1.14 0.97 1.05 45.5 54.8 100.3 110.3 199,5 1.00 1.00 1.00 1.00 1.00 46.3 59.9 106.2 91.7 188.1 1.37 1.06 1.17 1.08 1.12 33.9 56.7 90.5 85.1 168.0 1.00 1.00 1.00 1.00 1.00 49.2 44.7 93.9 117.8 200.6 1.18 0.94 1.05 1.16 1.10 41.8 47,5 89.3 101,6 181.8 1.00 1.00 1.00 1.00 1.00 50.5 91.1 141.7 125.5 249.4 1.05 I.I0 1.09 1.10 1.09 47.9 82.5 130.4 114.4 229,8 1.00 1.00 1.00 1.00 1.00 52.2 83.6 135.8 211.5 318.6 1.02 1.02 1.02 0.91 0.95 51.0 82.0 133.0 231.7 333.9 1.00 1.00 1.00 1.00 1.00
19.8 23.7 43.5 27.6 69.9 1.21 1.44 1.32 1.12 1.23 16.4 16.5 32.9 24.7 56.8 1.00 1.00 1.00 1.00 1.00 40.7 29.7 70,5 12.4 82.0 1.20 0,93 1.07 0.91 1.04 34.0 32.0 66.0 13.6 78.7 1,00 1.00 1,00 1.00 1.00 38.7 30.0 68.6 20,7 88.0 1.33 1.06 1.20 0.88 1.11 29. I 28.3 57.4 23.6 79.6 1.00 1.00 1.00 1.00 1.00 38.2 35.4 73.5 29.9 101.2 1.45 1.09 1.25 1.13 1.21 26.3 32.4 58.8 26.5 83,8 1.00 1.00 i .00 1.00 1.00 60.1 42.0 102.1 22.0 121,9 1.30 1.07 1.19 0.60 1.03 46.1 39.3 85.5 36.5 118.9 1.00 1.00 1.00 1.00 1.00
M i5.2 12.0 27.2 11.0 37.9 1.01 1.04 1.02 1.96 1.18 F 15.1 11.5 26.6 5.6 32.0 1.00 1.00 1.00 1.00 1.00 M 31.4 21.8 53.3 17.5 69.9 1.86 1.21 1.53 0.86 1.28 F 16.9 18.0 34.9 20.4 54.6 1.00 1.00 1.00 1.00 1.00 M 33.0 35.1 68.1 28.8 94.9 1.21 1.10 1.15 0.94 1.08 F 27.2 32.0 59.2 30.6 88.0 1.00 1.00 1.00 1.00 1.00
Grand average M 42.2 42.0 84.1 64.1 141.7 1.24 1.06 1.14 1.02 1.08 F 34.1 39.7 73.8 63.1 131.1 1.00 1.00 1.00 1.00 1.00
16
3.2 SINGLE AND MULTIPLE BIRTHS
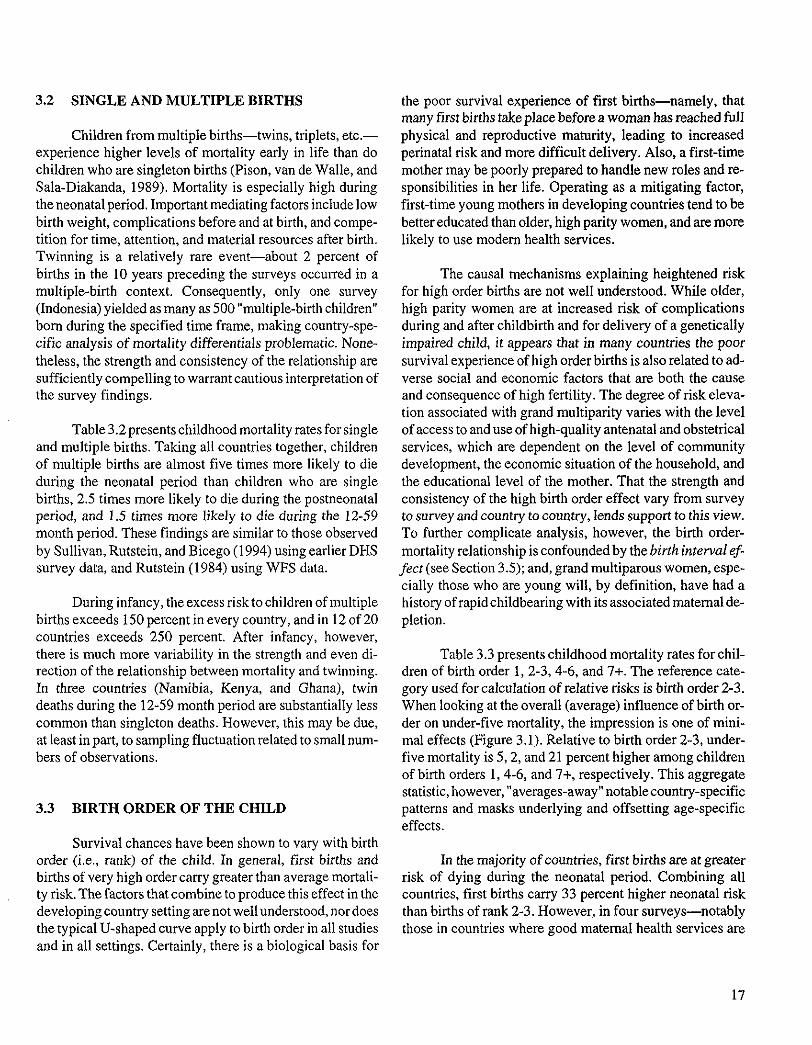
Children from multiple births--twins, triplets, etc.-- experience higher levels of mortality early in life than do children who are singleton births (Pison, van de Walle, and Sala-Diakanda, 1989). Mortality is especially high during the neonatal period. Important mediating factors include low birth weight, complications before and at birth, and compe- tition for time, attention, and material resources after birth. Twinning is a relatively rare event about 2 percent of births in the 10 years preceding the surveys occurred in a multiple-birth context. Consequently, only one survey (Indonesia) yielded as many as 500 "multiple-birth children" born during the specified time frame, making country-spe- cific analysis of mortality differentials problematic. None- theless, the strength and consistency of the relationship are sufficiently compelling to warrant cautious interpretation of the survey findings.
Table 3.2 presents childhood mortality rates for single and multiple births. Taking all countries together, children of multiple births are almost five times more likely to die during the neonatal period than children who are single births, 2.5 times more likely to die during the postneonatal period, and 1.5 times more likely to die during the 12-59 month period. These findings are similar to those observed by Sullivan, Rutstein, and Bicego (1994) using earlier DHS survey data, and Rutstein (1984) using WFS data.
During infancy, the excess risk to children of multiple births exceeds 150 percent in every country, and in 12 of 20 countries exceeds 250 percent. After infancy, however, there is much more variability in the strength and even di- rection of the relationship between mortality and twinning. In three countries (Namibia, Kenya, and Ghana), twin deaths during the 12-59 month period are substantially less common than singleton deaths. However, this may be due, at least in part, to sampling fluctuation related to small num- bers of observations.
3.3 BIRTH ORDER OF THE CHILD
Survival chances have been shown to vary with birth order (i.e., rank) of the child. In general, first births and births of very high order carry greater than average mortali- ty risk. The factors that combine to produce this effect in the developing country setting are not well understood, nor does the typical U-shaped curve apply to birth order in all studies and in all settings. Certainly, there is a biological basis for
the poor survival experience of first births--namely, that many first births take place before a woman has reached full physical and reproductive maturity, leading to increased perinatal risk and more difficult delivery. Also, a first-time mother may be poorly prepared to handle new roles and re- sponsibilities in her life. Operating as a mitigating factor, first-time young mothers in developing countries tend to be better educated than older, high parity women, and are more likely to use modern health services.
The causal mechanisms explaining heightened risk for high order births are not well understood. While older, high parity women are at increased risk of complications during and after childbirth and for delivery of a genetically impaired child, it appears that in many countries the poor survival experience of high order births is also related to ad- verse social and economic factors that are both the cause and consequence of high fertility. The degree of risk eleva- tion associated with grand multiparity varies with the level of access to and use of high-quality antenatal and obstetrical services, which are dependent on the level of community development, the economic situation of the household, and the educational level of the mother. That the strength and consistency of the high birth order effect vary from survey to survey and country to country, lends support to this view. To further complicate analysis, however, the birth order- mortality relationship is confounded by the birth interval ef- fect (see Section 3.5); and, grand multiparous women, espe- cially those who are young will, by definition, have had a history of rapid childbearing with its associated maternal de- pletion.
Table 3.3 presents childhood mortality rates for chil- dren of birth order 1, 2-3, 4-6, and 7+. The reference cate- gory used for calculation of relative risks is birth order 2-3. When looking at the overall (average) influence of birth or- der on under-five mortality, the impression is one of mini- mal effects (Figure 3.1). Relative to birth order 2-3, under- five mortality is 5, 2, and 21 percent higher among children of birth orders 1, 4-6, and 7+, respectively. This aggregate statistic, however, "averages-away" notable country-specific patterns and masks underlying and offsetting age-specific effects.
In the majority of countries, first births are at greater risk of dying during the neonatal period. Combining all countries, first births carry 33 percent higher neonatal risk than births of rank 2-3. However, in four surveys--notably those in countries where good maternal health services are
17
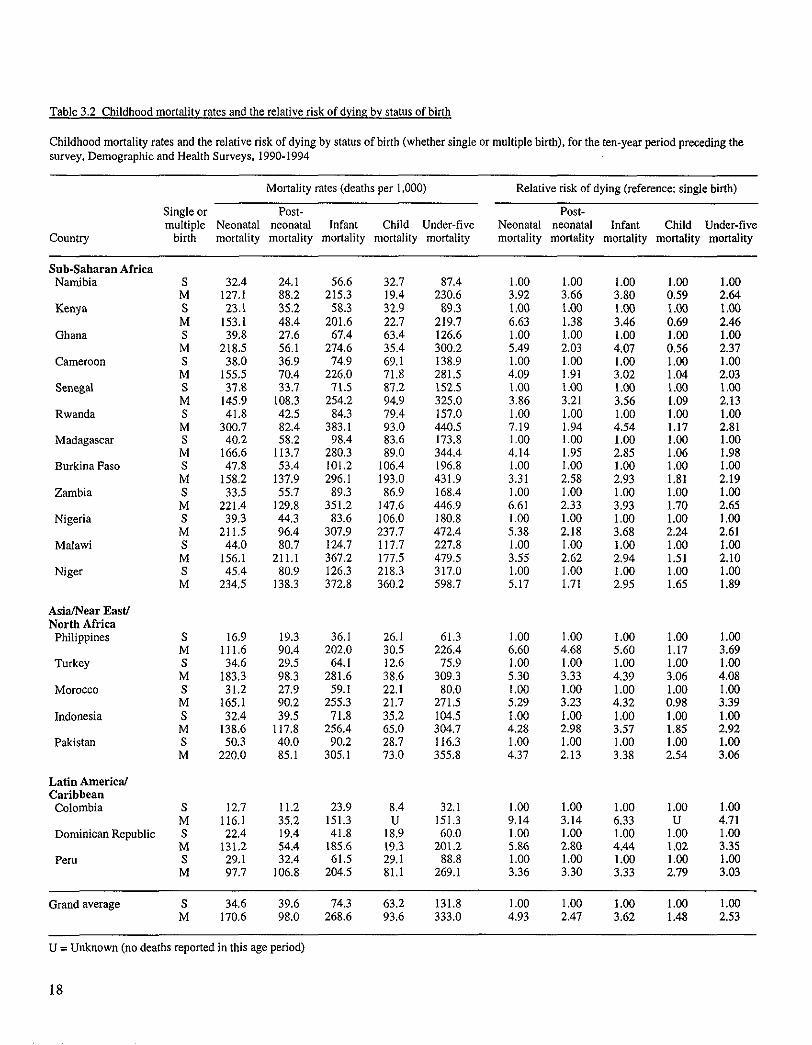
Table 3.2 Childhood mortality rates and the relative risk of dying by status of birth
Childhood mortality rates and the relative risk of dying by status of birth (whether single or multiple birth), for the ten-year period preceding the survey. Demographic and Health Surveys. 1990-1994
Mortality rates (deaths per 1,000) Relative risk of dying (reference: single birth)
Single or Post- Post- multiple Neonatal neonatal Infant Child Under-five Neonatal neonatal Infant Child Under-five
Country birth mortality mortality mortality mortality mortality mortality mortality mortality mortality mortality
Snb-Saharan Africa Namibia S 32,4 24.1 56.6 32.7 87.4 1.00 1.00 1.00 1.00 1.00
M 127,1 88.2 215.3 19,4 230.6 3.92 3.66 3.80 0.59 2.64 Kenya S 23.1 35.2 58.3 32.9 89.3 1.00 1.00 1.(30 1.00 1.00
M 153.1 48.4 201.6 22.7 219.7 6.63 1.38 3.46 0.69 2.46 Ghana S 39.8 27.6 67.4 63.4 126.6 1.00 1.00 1.00 1.00 1.00
M 218.5 56.1 274.6 35.4 300.2 5.49 2.03 4.07 0.56 2.37 Cameroon S 38.0 36.9 74.9 69.1 138.9 1.00 1.00 1.00 1.00 1.00
M 155.5 70.4 226.0 71.8 281.5 4.09 1.91 3.02 1.04 2.03 Senegal S 37.8 33.7 71.5 87.2 152.5 1.00 1.00 1.0(3 1.00 1.00
M 145.9 108.3 254.2 94.9 325.0 3.86 3.21 3.56 1.09 2.13 Rwanda S 41,8 42.5 84.3 79.4 157.0 1.00 1.00 1.00 1.00 1.00
M 300,7 82.4 383.1 93.0 440.5 7.19 1.94 4.54 1.17 2.81 Madagascar S 40,2 58.2 98.4 83.6 173.8 1,00 1.00 1.00 1.00 1.00
M 166,6 113.7 280.3 89,0 344.4 4.14 1.95 2.85 1.06 1.98 Burkina Faso S 47,8 53.4 101.2 106.4 196.8 1.00 1.00 1.00 1.00 1.00
M 158,2 137.9 296.1 193.0 431.9 3.31 2.58 2.93 1.81 2.19 Zambia S 33,5 55.7 89.3 86.9 168.4 1.00 1.00 1.00 1.00 1.00
M 221,4 129.8 351.2 147.6 446.9 6.61 2.33 3.93 1.70 2,65 Nigeria S 39,3 44.3 83.6 106.0 180.8 1.00 1.00 1.00 1.00 1.00
M 211,5 96.4 307.9 237,7 472.4 5.38 2.18 3.68 2.24 2.61 Malawi S 44.0 80.7 124.7 117.7 227.8 1.00 1.00 1.00 1.00 1.00
M 156,1 211.I 367.2 177.5 479.5 3.55 2.62 2.94 1.51 2.10 Niger S 45,4 80.9 I26.3 218.3 317.0 1.00 1.00 1.00 1.00 1.00
M 234,5 138.3 372.8 360.2 598.7 5.17 1.71 2.95 1.65 1.89
Asia/Near East/ North Africa
Philippines S 16,9 19.3 36.1 26.1 61.3 1.00 1.00 1.00 1.00 1.00 M 111,6 90.4 202.0 30.5 226.4 6.60 4.68 5.60 1.17 3.69
Turkey S 34.6 29.5 64.1 12.6 75.9 1.00 1.00 1.00 1.00 1.00 M I83.3 98.3 281.6 38,6 309.3 5.30 3.33 4.39 3.06 4.08
Morocco S 31,2 27.9 59.1 22,1 80.0 1.00 1.00 1.00 1.00 1.00 M 165,I 90.2 255.3 21.7 271.5 5.29 3.23 4.32 0.98 3.39
Indonesia S 32,4 39.5 71.8 35.2 104.5 1.00 1.00 1.00 1.00 1,00 M 138.6 117.8 256.4 65.0 304.7 4.28 2.98 3.57 1.85 2.92
Pakistan S 50.3 40.0 90.2 28.7 116.3 1.00 1.00 1.00 1.00 1.00 M 220.0 85.1 305,1 73.0 355.8 4.37 2.13 3.38 2.54 3.06
Latin America/ Caribbean Colombia
Dominican Republic
Peru
S 12,7 11.2 23.9 8.4 32.1 1.00 1.00 1.00 1.00 1.00 M 116,1 35,2 151.3 U 151.3 9.14 3.14 6.33 U 4.71 S 22,4 19.4 41.8 18.9 60.0 1.00 1.00 1.00 1.00 1.00 M 131,2 54.4 185.6 19.3 201.2 5.86 2.80 4.44 1.02 3.35 S 29,1 32.4 61.5 29.1 88.8 1.00 1.00 1.00 1.00 1.00 M 97,7 106.8 204.5 81.1 269.1 3.36 3.30 3.33 2.79 3.03
Grand average S 34,6 39.6 74.3 63.2 131.8 1.00 1.00 1.00 1.00 1.00 M 170,6 98.0 268.6 93.6 333.0 4.93 2.47 3.62 1.48 2.53
U = Unknown (no deaths reported in this age period)
18
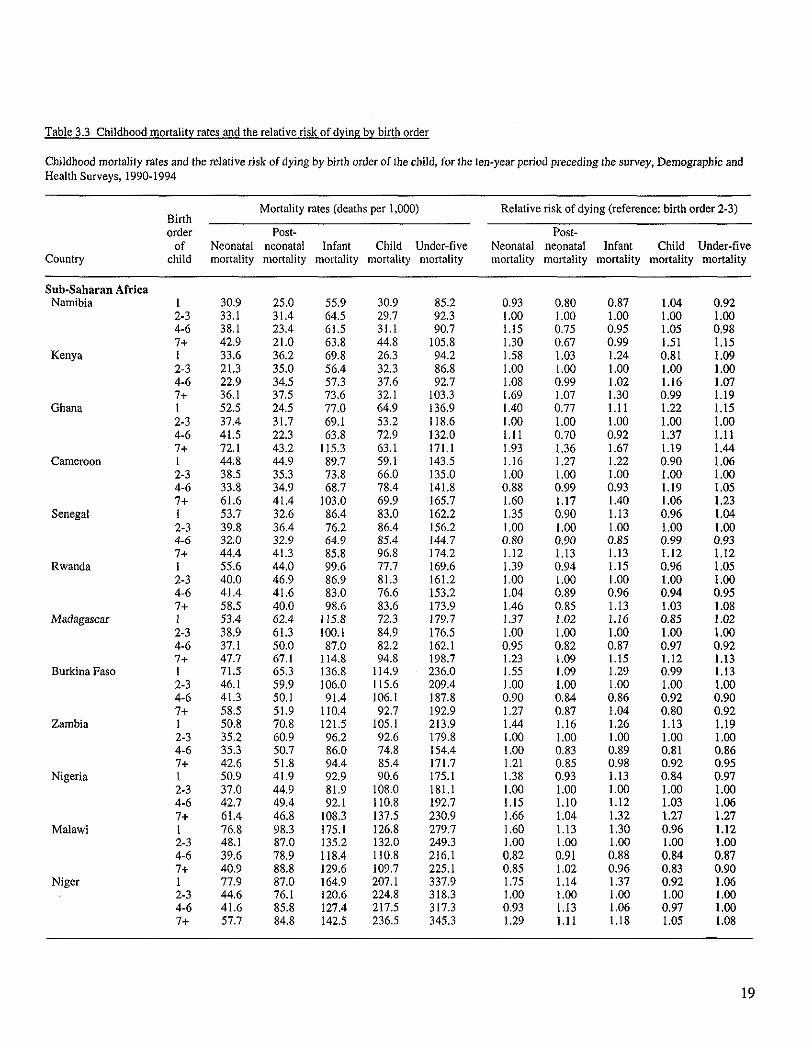
Table 3.3 Childhood mortality rates and the relative risk of dying by birth order
Childhood mortality rates and the relative risk of dying by birth order of the child, for the ten-year period preceding the survey, Demographic and Health Surveys, 1990-1994
Mortality rates (deaths per 1,000) Relative risk of dying (reference: birth order 2-3) Birth order Post- Post-
of Neonatal neonatal Infant Child Under-five Neonatal neonatal Infant Child Under-five Country child mortality mortality mortality mortality mortality mortality mortality mortality mortality mortality
Sub-Saharan Africa Namibia 1 30.9 25.0 55.9 30.9 85.2 0.93 0.80 0.87 1.04 0.92
2-3 33.1 31.4 64.5 29.7 92.3 1.00 1.00 1.00 1.00 1.00 4-6 38.1 23.4 61.5 31.1 90.7 1,15 0.75 0.95 1.05 0.98 7+ 42.9 21.0 63.8 44.8 105,8 1.30 0.67 0.99 1.51 1.15
Kenya 1 33.6 36.2 69.8 26.3 94.2 1.58 1.03 1.24 0.81 1.09 2-3 21.3 35.0 56.4 32,3 86.8 1.00 1.00 1.00 1.00 1.00 4-6 22,9 34.5 57.3 37.6 92.7 1.08 0.99 1.02 1.16 1.07 7+ 36.1 37.5 73~6 32.1 103.3 1.69 1.07 1.30 0.99 1.19
Ghana I 52.5 24.5 77.0 64.9 136.9 1.40 0.77 1.11 1.22 1.15 2-3 37.4 31.7 69.1 53.2 118.6 1,00 1.00 1.00 1.00 1.00 4-6 41.5 22.3 63.8 72.9 132.0 1.11 0.70 0.92 1.37 1.11 7+ 72.1 43.2 115.3 63.1 171.1 1.93 1.36 1.67 1.19 1.44
Cameroon 1 44.8 44.9 89.7 59.1 143.5 1.16 1.27 1.22 0.90 1.06 2-3 38.5 35.3 73,8 66.0 135,0 1.00 1.00 1.00 1.00 1.00 4-6 33.8 34.9 68.7 78.4 141.8 0.88 0.99 0.93 1.19 1.05 7+ 61.6 41.4 103.0 69.9 165.7 1.60 1.17 1.40 1.06 1.23
Senegal 1 53.7 32.6 86.4 83.0 162.2 1.35 0.90 1.13 0.96 1.04 2-3 39.8 36.4 76.2 86.4 156.2 1,00 1.00 1.00 1.00 1.00 4-6 32.0 32.9 64.9 85.4 144.7 0.80 0.90 0.85 0.99 0.93 7+ 44.4 41.3 85.8 96,8 174.2 1.12 1.13 1.13 1.12 1.12
Rwanda 1 55.6 44.0 99.6 77.7 169.6 1.39 0.94 1.15 0.96 1.05 2-3 40.0 46.9 86,9 81.3 161.2 1.00 1.00 1.00 1.00 1.00 4-6 41.4 41.6 83.0 76.6 153.2 1,04 0.89 0.96 0.94 0.95 7+ 58.5 40.0 98.6 83.6 173.9 1,46 0.85 1.13 1.03 1.08
Madagascar 1 53.4 62.4 115.8 72.3 179.7 1.37 1.02 1.16 0.85 1.02 2-3 38.9 61.3 100.1 84.9 176,5 1.00 1.00 1.00 1.00 1.00 4-6 37.1 50.0 87,0 82.2 162.1 0.95 0.82 0.87 0.97 0.92 7+ 47.7 67.1 114.8 94.8 198.7 1.23 1.09 1.15 1.12 1.13
Burkina Faso 1 71.5 65.3 136.8 114.9 236.0 1.55 1.09 1.29 0.99 1.13 2-3 46.1 59.9 106.0 115.6 209.4 1,00 L00 1.00 1.00 1.00 4-6 41.3 50.1 91.4 106.1 187.8 0.90 0.84 0.86 0.92 0.90 7+ 58.5 51.9 110,4 92.7 192.9 1.27 0.87 1.04 0.80 0.92
Zambia 1 50.8 70.8 121.5 105,1 213.9 1.44 1.16 1.26 1.13 1.19 2-3 35.2 60.9 96~2 92.6 179.8 1.00 1.00 1.00 1.00 1.00 4-6 35.3 50.7 86.0 74.8 154.4 1.00 0.83 0.89 0.81 0.86 7+ 42.6 51.8 94.4 85.4 171.7 1.21 0.85 0.98 0.92 0.95
Nigeria 1 50,9 41.9 92.9 90.6 175.1 1.38 0.93 1.13 0,84 0.97 2-3 37.0 44.9 81.9 108.0 181.1 1.00 1.00 1.00 1.00 1.00 4-6 42.7 49.4 92.1 110.8 192.7 IA5 1.10 1.12 1.03 1.06 7+ 61.4 46.8 108.3 137.5 230.9 1.66 1.04 1.32 1.27 1.27
Malawi 1 76.8 98.3 175.1 126.8 279,7 1.60 1.13 1.30 0.96 1.12 2-3 48.1 87.0 135.2 132,0 249.3 i.00 1.00 1.00 1.00 1.00 4-6 39.6 78~9 118.4 110.8 216.1 0,82 0.91 0.88 0.84 0.87 7+ 40.9 88.8 129.6 109.7 225.1 0.85 1.02 0.96 0.83 0.90
Niger 1 77.9 87.0 164.9 207.1 337.9 1.75 1.14 1.37 0.92 1.06 2-3 44.6 76.1 120.6 224.8 318,3 1.00 1.00 1.00 1.00 1.00 4-6 41.6 85.8 12%4 217.5 317.3 0.93 1.13 L06 0.97 1.00 7+ 57.7 84.8 142.5 236.5 345.3 1.29 1.11 1.18 1.05 1.08
19
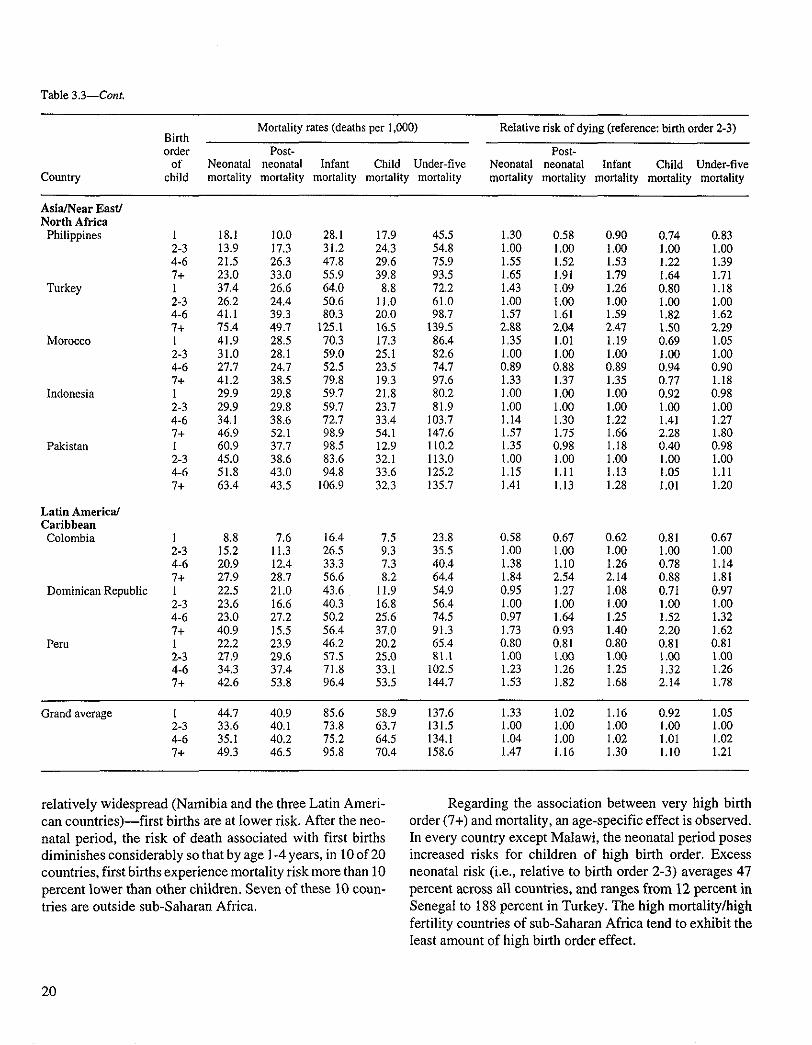
Table 3.3--Cont.
Country
Mortality rates (deaths per 1,000) Birth order Post-
of Neonatal neonatal Infant Child Under-five child mortality mortality mortality mortality mortality
Relative risk of dying (reference: birth order 2-3)
Post- Neonatal neonatal Infant Child Under-five mortality mortality mortality mortality mortality
Asia/Near East/ North Africa
Philippines
Turkey
Morocco
Indonesia
Pakistan
Latin America/ Caribbean Colombia
Dominican Republic
Peru
1 18.1 I0.0 28.1 17.9 45.5 2-3 13.9 17.3 31.2 24,3 54.8 4-6 21.5 26.3 47.8 29.6 75.9 7+ 23.0 33.0 55.9 39.8 93.5 1 37.4 26.6 64.0 8.8 72,2 2-3 26.2 24.4 50.6 11.0 61.0 4-6 41.1 39.3 80.3 20.0 98.7 7+ 75.4 49.7 125.1 16.5 139.5 1 41.9 28.5 70.3 17.3 86.4 2-3 31.0 28.1 59.0 25.1 82.6 4-6 27.7 24.7 52.5 23.5 74.7 7+ 41.2 38.5 79.8 19.3 97.6 1 29.9 29.8 59.7 21.8 80.2 2-3 29.9 29.8 59.7 23.7 81,9 4-6 34.1 38.6 72.7 33.4 103.7 7+ 46.9 52.1 98.9 54.1 147.6 I 60.9 37.7 98,5 12.9 110.2 2-3 45.0 38.6 83.6 32.1 113.0 4-6 51.8 43,0 94.8 33,6 125.2 7+ 63.4 43.5 106.9 32,3 135.7
I 8.8 7.6 16.4 7.5 23.8 2-3 15.2 11.3 26.5 9.3 35.5 4-6 20.9 12.4 33.3 7.3 40.4 7+ 27.9 28.7 56.6 8.2 64.4 1 22.5 21.0 43.6 11.9 54.9 2-3 23.6 16.6 40.3 16.8 56.4 4-6 23.0 27.2 50.2 25.6 74.5 7+ 40.9 15.5 56.4 37.0 91.3 1 22.2 23.9 46.2 20.2 65.4 2-3 27.9 29.6 57.5 25.0 81.1 4-6 34,3 37.4 71.8 33.1 102.5 7+ 42.6 53.8 96,4 53.5 144.7
1.30 0.58 0.90 0.74 0.83 1.00 1.00 1.00 1.00 1.00 1.55 1.52 1.53 1.22 1.39 1.65 1.91 1.79 1.64 1.71 1.43 1.09 1.26 0.80 1.18 1.00 1.00 1.00 1.00 1.00 1.57 1.61 1.59 1.82 1.62 2.88 2.04 2.47 1.50 2.29 1,35 1.01 1.19 0.69 1.05 1.00 1.00 1.00 1.00 1.00 0.89 0.88 0,89 0.94 0.90 1.33 1.37 1.35 0.77 1.18 1.00 1.00 1.00 0.92 0.98 1.00 1.00 1.00 1.00 1.00 1.14 1.30 1.22 1.41 1.27 1.57 1.75 1.66 2.28 1,80 1.35 0.98 1.i8 0.40 0.98 1,00 1.00 1.00 1.00 1.00 1.15 1,11 1,13 1.05 1.11 1.41 1.13 1.28 1.01 1.20
0.58 0.67 0.62 0.81 0.67 1.00 1.00 1.00 1.00 1.00 1.38 1.10 1.26 0.78 1.14 1.84 2.54 2.14 0.88 1.81 0.95 1.27 1.08 0,71 0,97 1.00 1,00 1.00 1.00 1.00 0.97 1.64 1.25 1.52 1.32 1.73 0.93 1.40 2.20 1.62 0.80 0.81 0.80 0.81 0.81 1.00 1.00 1.00 1.00 1.00 1.23 1.26 1.25 1.32 1.26 1.53 1.82 1.68 2.14 1.78
Grand average I 44.7 40,9 85.6 58.9 137.6 2-3 33.6 40.1 73.8 63.7 131.5 4-6 35.1 40.2 75.2 64.5 134.1 7+ 49.3 46.5 95.8 70.4 158.6
1.33 1.02 1.I6 0.92 1.05 1.00 1.00 1.00 1.00 1,00 1.04 1.00 1.02 1.01 1.02 1,47 1.16 1.30 1.10 1.21
relatively widespread (Namibia and the three Latin Ameri- can countries)--f irst births are at lower risk. After the neo- natal period, the risk of death associated with first births diminishes considerably so that by age 1-4 years, in 10 of 20 countries, first births experience mortality risk more than 10 percent lower than other children. Seven of these 10 coun- tries are outside sub-Saharan Africa.
Regarding the association between very high birth order (7+) and mortality, an age-specific effect is observed. In every country except Malawi, the neonatal period poses increased risks for children of high birth order. Excess neonatal risk (i.e., relative to birth order 2-3) averages 47 percent across all countries, and ranges from 12 percent in Senegal to 188 percent in Turkey. The high mortality/high fertility countries of sub-Saharan Africa tend to exhibit the least amount of high birth order effect.
20
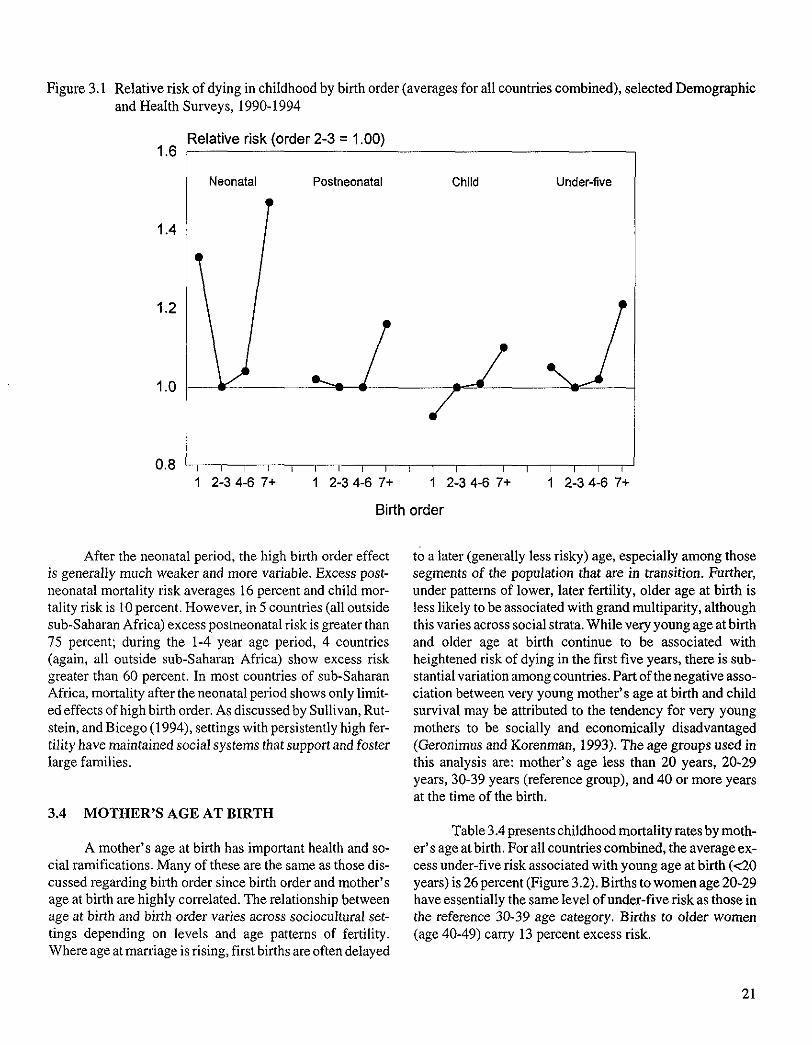
Figure 3.1 Relative risk of dying in childhood by birth order (averages for all countries combined), selected Demographic and Health Surveys, 1990-1994
Relative risk (order 2-3 = 1.00) 1.6
1.4
1.2
1.0
0.8
Neonatal Postneonatal Child Under-five
- / / w v
2-3 4-6 7+ 1 2-3 4-6 7+ 1 2-3 4-6 7+ 1 2-3 4-6 7+
Birth order
After the neonatal period, the high birth order effect is generally much weaker and more variable. Excess post- neonatal mortality risk averages 16 percent and child mor- tality risk is 10 percent. However, in 5 countries (all outside sub-Saharan Africa) excess postneonatal risk is greater than 75 percent; during the 1-4 year age period, 4 countries (again, all outside sub-Saharan Africa) show excess risk greater than 60 percent. In most countries of sub-Saharan Africa, mortality after the neonatal period shows only limit- ed effects of high birth order. As discussed by Sullivan, Rut- stein, and Bicego (1994), settings with persistently high fer- tility have maintained social systems that support and foster large families.
3.4 MOTHER'S AGE AT BIRTH
A mother's age at birth has important health and so- cial ramifications. Many of these are the same as those dis- cussed regarding birth order since birth order and mother's age at birth are highly correlated. The relationship between age at birth and birth order varies across sociocultural set- tings depending on levels and age patterns of fertility. Where age at marriage is rising, first births are often delayed
to a later (generally less risky) age, especially among those segments of the population that are in transition. Further, under patterns of lower, later fertility, older age at birth is less likely to be associated with grand multiparity, although this varies across social strata. While very young age at birth and older age at birth continue to be associated with heightened risk of dying in the first five years, there is sub- stantial variation among countries. Part of the negative asso- ciation between very young mother's age at birth and child survival may be attributed to the tendency for very young mothers to be socially and economically disadvantaged (Geronimus and Korenman, 1993). The age groups used in this analysis are: mother's age less than 20 years, 20-29 years, 30-39 years (reference group), and 40 or more years at the time of the birth.
Table 3.4 presents childhood mortality rates by moth- er' s age at birth. For all countries combined, the average ex- cess under-five risk associated with young age at birth (<20 years) is 26 percent (Figure 3.2). Births to women age 20-29 have essentially the same level of under-five risk as those in the reference 30-39 age category. Births to older women (age 40-49) carry 13 percent excess risk.
21
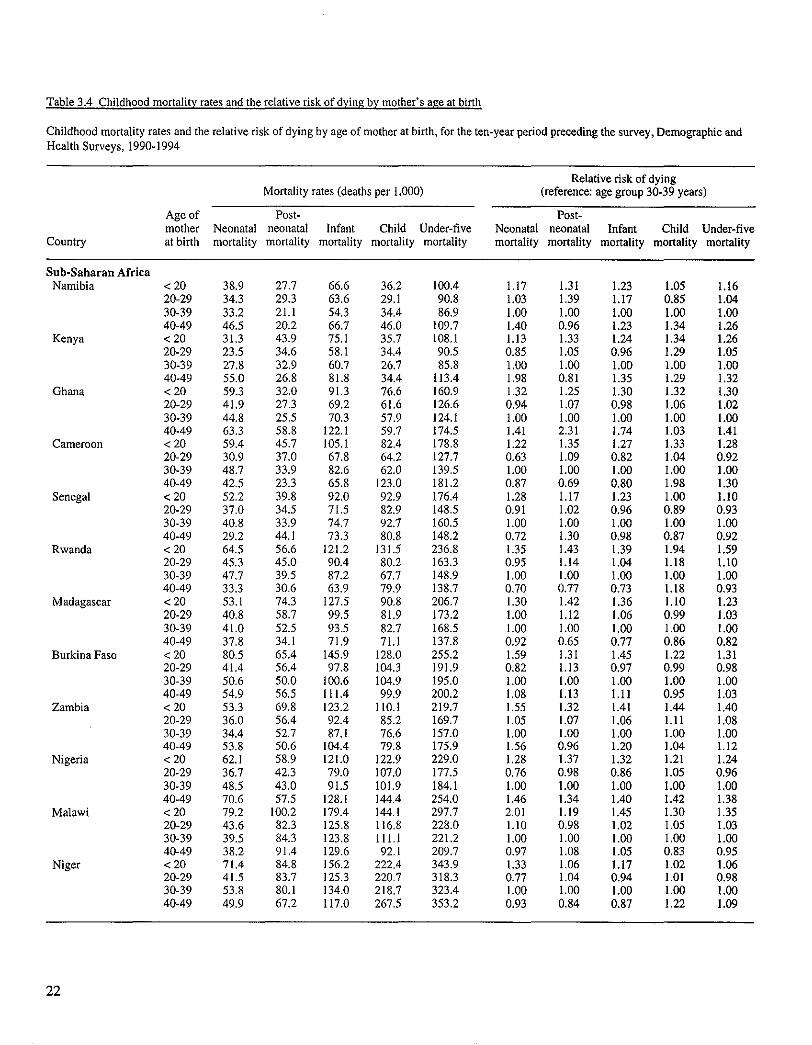
Table 3.4 Childhood mortality rates and the relative risk of dying by mother's age at birth
Childhood mortality rates and the relative risk of dying by age of mother at birth, for the ten-year period preceding the survey, Demographic and Health Surveys, 1990-1994
Mortality rates (deaths per 1,000) Relative risk of dying
(reference: age group 30-39 years)
Age of Post- Post- mother Neonatal neonatal Infant Child Under-five Neonatal neonatal Infant Child Under-five
Country at birth mortality mortality mortality mortality mortality mortality mortality mortality mortality mortality
Sub-Saharan Africa Namibia < 20 38.9 27.7 66.6 36.2 100.4 1.17 1.31 1.23 1.05 1.16
20-29 34.3 29.3 63.6 29.1 90.8 1.03 1.39 1.I7 0.85 1.04 30-39 33.2 21.1 54.3 34.4 86.9 1,00 1.00 1.00 1.00 1.00 40-49 46.5 20.2 66.7 46.0 109.7 1.40 0.96 1.23 1.34 1.26
Kenya < 20 31.3 43.9 75.1 35.7 108.1 1.13 1.33 1.24 1.34 1.26 20-29 23.5 34.6 58.1 34.4 90.5 0.85 1.05 0.96 1.29 1.05 30-39 27.8 32.9 60.7 26.7 85.8 1.00 1.00 1.00 1.00 1.00 40-49 55.0 26.8 81.8 34.4 113.4 1.98 0.81 1.35 1.29 1.32
Ghana < 20 59.3 32.0 91.3 76.6 160.9 1.32 1.25 1.30 1.32 1.30 20-29 41.9 27.3 69.2 61.6 126.6 0.94 1.07 0.98 1.06 1.02 30-39 44.8 25.5 70.3 57.9 124.1 1.00 1.00 1.00 1.00 1,00 40-49 63.3 58.8 122.1 59.7 174.5 1.41 2.3I 1.74 1.03 1.41
Cameroon < 20 59.4 45.7 105. I 82.4 I78.8 1.22 1.35 1.27 1.33 1.28 20-29 30.9 37.0 67.8 64,2 127.7 0.63 1.09 0.82 1.04 0,92 30-39 48.7 33.9 82.6 62.0 139.5 1.00 1.00 1.00 1.00 1.00 40-49 42.5 23.3 65.8 123.0 181.2 0.87 0.69 0.80 1.98 1.30
Senegal < 20 52.2 39.8 92.0 92.9 176.4 1.28 1.17 1.23 1.00 1.10 20-29 37.0 34.5 71.5 82.9 148.5 0.91 1.02 0.96 0.89 0.93 30-39 40.8 33.9 74.7 92.7 160.5 1.00 1.00 1.00 1.00 1.00 40-49 29.2 44.1 73.3 80.8 148.2 0.72 1.30 0.98 0.87 0.92
Rwanda < 20 64.5 56.6 121.2 131.5 236.8 1.35 1.43 1.39 1.94 1,59 20-29 45.3 45.0 90.4 80.2 163.3 0.95 1,14 1.04 1.18 1.10 30-39 47.7 39.5 87.2 67.7 148.9 1,00 1.00 1.00 1.00 1.00 40-49 33,3 30,6 63~9 79.9 I38,7 0.70 0,77 0.73 1,18 0,93
Madagascar < 20 53.1 74.3 127.5 90,8 206.7 1.30 1.42 1.36 1.10 1.23 20-29 40.8 58.7 99.5 81.9 173.2 1.00 1.12 1.06 0.99 1.03 30-39 41.0 52.5 93.5 82.7 168.5 1.00 1.00 1.00 1.00 1.00 40-49 37.8 34.1 71.9 71.1 137.8 0.92 0.65 0.77 0.86 0.82
Burkina Faso < 20 80,5 65.4 145.9 128.0 255.2 1.59 1.31 1.45 1.22 1.31 20-29 41.4 56.4 97.8 104.3 191.9 0.82 1,13 0.97 0,99 0.98 30-39 50.6 50.0 100.6 104.9 195.0 1.00 1,00 1.00 1.00 1.00 40-49 54.9 56.5 111.4 99.9 200.2 1.08 1,13 1.11 0.95 1.03
Zambia < 20 53.3 69.8 123.2 110.1 219.7 1.55 1.32 1.41 1.44 1.40 20-29 36.0 56.4 92.4 85.2 169.7 1.05 1.07 1,06 1.11 1.08 30-39 34.4 52.7 87.1 76.6 157.0 1.00 1.00 1.00 1.00 1.00 40-49 53.8 50.6 104.4 79.8 175.9 1.56 0.96 1.20 1.04 1.12
Nigeria < 2 0 62.1 58.9 121.0 122.9 229.0 1.28 1.37 1.32 1.21 1.24 20-29 36.7 42.3 79.0 107.0 177.5 0.76 0.98 0.86 1.05 0.96 30-39 48.5 43.0 91.5 101.9 184.1 1.00 1.00 1.00 1.00 1.00 40-49 70.6 57.5 128.1 144.4 254.0 1.46 1.34 1.40 1.42 1.38
Malawi < 2 0 79.2 100.2 179.4 144.1 297.7 2.01 1.19 1,45 1.30 1.35 20-29 43.6 82.3 125.8 116,8 228.0 1.10 0.98 1.02 1.05 1.03 30-39 39.5 84.3 123.8 111.1 221.2 1.00 1.00 1.00 1.00 1.00 40-49 38.2 91,4 129.6 92.1 209.7 0.97 1.08 1.05 0.83 0.95
Niger < 2 0 71.4 84.8 156.2 222,4 343.9 1.33 1.06 1.17 1.02 1.06 20-29 41.5 83.7 125.3 220.7 318.3 0.77 1.04 0.94 1.01 0.98 30-39 53.8 80.1 134.0 218.7 323.4 1.00 1.00 1.00 1.00 1.00 40-49 49.9 67.2 117.0 267.5 353.2 0.93 0.84 0.87 1.22 1.09
2 2
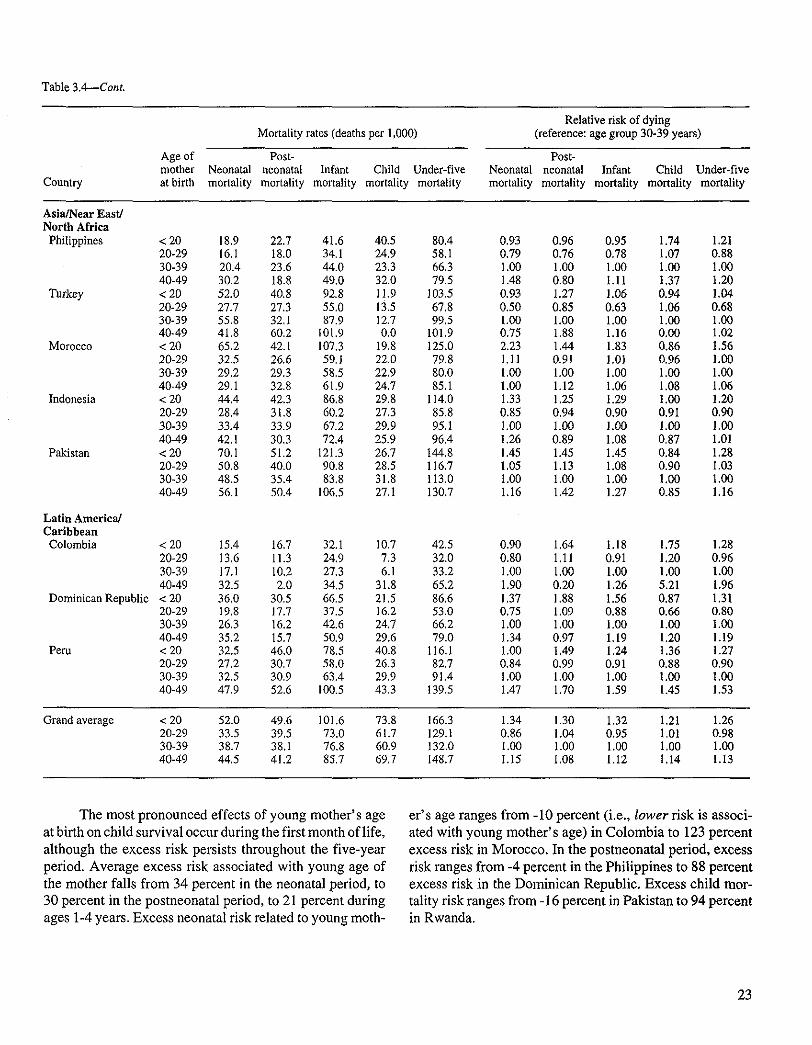
Table 3.4---Cont.
Country
Mortality rates (deaths per 1,000)
Age of Post- mother Neonatal neonatal Infant Child Under-five at birth mortality mortality mortality mortality mortality
Relative risk of dying (reference: age group 30-39 years)
Post- Neonatal neonatal Infant Child Under-five mortality mortality mortality mortality mortality
Asia/Near East/ North Africa
Philippines
Turkey
Morocco
Indonesia
Pakistan
Latin America/ Caribbean Colombia
Dominican Republic
Peru
< 20 18.9 22.7 41.6 40.5 80.4 20-29 16.1 18.0 34.1 24.9 58.1 30-39 20.4 23.6 44.0 23.3 66.3 40-49 30.2 18.8 49.0 32.0 79.5 < 20 52.0 40.8 92.8 11.9 ] 03.5 20-29 27.7 27.3 55.0 13.5 67.8 30-39 55.8 32,1 87.9 12.7 99.5 40-49 41.8 60.2 101.9 0.0 101.9 < 20 65.2 42.1 107.3 19.8 125,0 20-29 32,5 26.6 59.1 22,0 79.8 30-39 29.2 29.3 58,5 22.9 80.0 40-49 29.1 32.8 61.9 24.7 85.1 < 20 44.4 42.3 86.8 29.8 114.0 20-29 28.4 31.8 60.2 27.3 85.8 30-39 33.4 33.9 67.2 29.9 95.1 40-49 42.1 30.3 72.4 25.9 96.4 <20 70.1 51.2 121.3 26.7 144.8 20-29 50.8 40.0 90.8 28.5 116.7 30-39 48.5 35.4 83.8 31.8 113.0 40-49 56.1 50.4 106.5 27.1 130.7
< 20 15.4 16.7 32.1 10.7 42.5 20-29 13,6 11.3 24.9 7.3 32.0 30-39 17.1 10.2 27.3 6.1 33.2 40-49 32.5 2.0 34,5 31.8 65.2 < 20 36.0 30.5 66.5 21.5 86.6 20-29 19.8 17.7 37.5 16.2 53.0 30-39 26.3 16.2 42.6 24.7 66.2 40-49 35,2 15.7 50.9 29,6 79.0 < 20 32.5 46.0 78.5 40.8 116.1 20-29 27.2 30,7 58.0 26.3 82.7 30-39 32.5 30.9 63.4 29.9 91.4 40-49 47.9 52.6 100.5 43.3 139.5
0.93 0.96 0.95 1.74 1.21 0.79 0.76 0.78 1.07 0.88 1.00 1.00 1.00 1.00 1.00 1.48 0.80 1.11 1.37 1.20 0.93 1.27 1.06 0.94 1.04 0.50 0.85 0.63 1.06 0.68 1.00 1.00 1.00 1.00 1.00 0.75 1.88 1.16 0.00 1.02 2.23 1.44 1.83 0,86 1.56 IA 1 0.91 1,0i 0,96 1,00 1.00 1.00 1.00 1.00 1.00 1,00 1.12 1.06 1.08 1.06 1.33 1.25 1.29 1.00 1.20 0.85 0.94 0.90 0.9I 0.90 l,O0 1.00 1,00 1.00 1,00 1.26 0.89 1.08 0.87 1.01 1.45 1.45 1.45 0.84 1.28 1,05 1.13 1.08 0.90 1.03 1.00 1.00 1.00 1.00 1.00 1.16 1.42 1.27 0.85 1.16
0.90 1.64 1.18 1.75 1.28 0.80 1.11 0.91 1.20 0.96 1.00 1.00 1.00 1.00 1.00 1.90 0.20 1.26 5.21 1.96 1.37 1.88 1.56 0.87 1.31 0.75 1,09 0.88 0.66 0.80 1.00 1.00 1.00 1.00 1.00 1.34 0.97 1.19 1.20 1.19 1.00 1.49 1.24 1.36 1.27 0,84 0.99 0.91 0.88 0.90 1.00 1.00 1.00 1.00 1.00 1.47 1.70 1.59 1.45 1.53
Grand average < 20 52.0 49.6 101.6 73.8 166.3 20-29 33.5 39,5 73.0 61.7 129.1 30-39 38.7 38.1 76.8 60.9 132.0 40-49 44.5 41.2 85.7 69,7 148.7
1.34 1.30 1,32 1.21 1.26 0.86 1.04 0.95 1.01 0.98 1.00 1.00 1.00 1.00 1.00 1.15 1.08 1.12 1.14 1.13
The most pronounced effects of young mother's age at birth on child survival occur during the first month of life, although the excess risk persists throughout the five-year period. Average excess risk associated with young age of the mother falls from 34 percent in the neonatal period, to 30 percent in the postneonatal period, to 21 percent during ages 1-4 years. Excess neonatal risk related to young moth-
er's age ranges from -10 percent (i.e., lower risk is associ- ated with young mother's age) in Colombia to 123 percent excess risk in Morocco. In the postneonatal period, excess risk ranges from -4 percent in the Philippines to 88 percent excess risk in the Dominican Republic. Excess child mor- tality risk ranges from -16 percent in Pakistan to 94 percent in Rwanda.
23
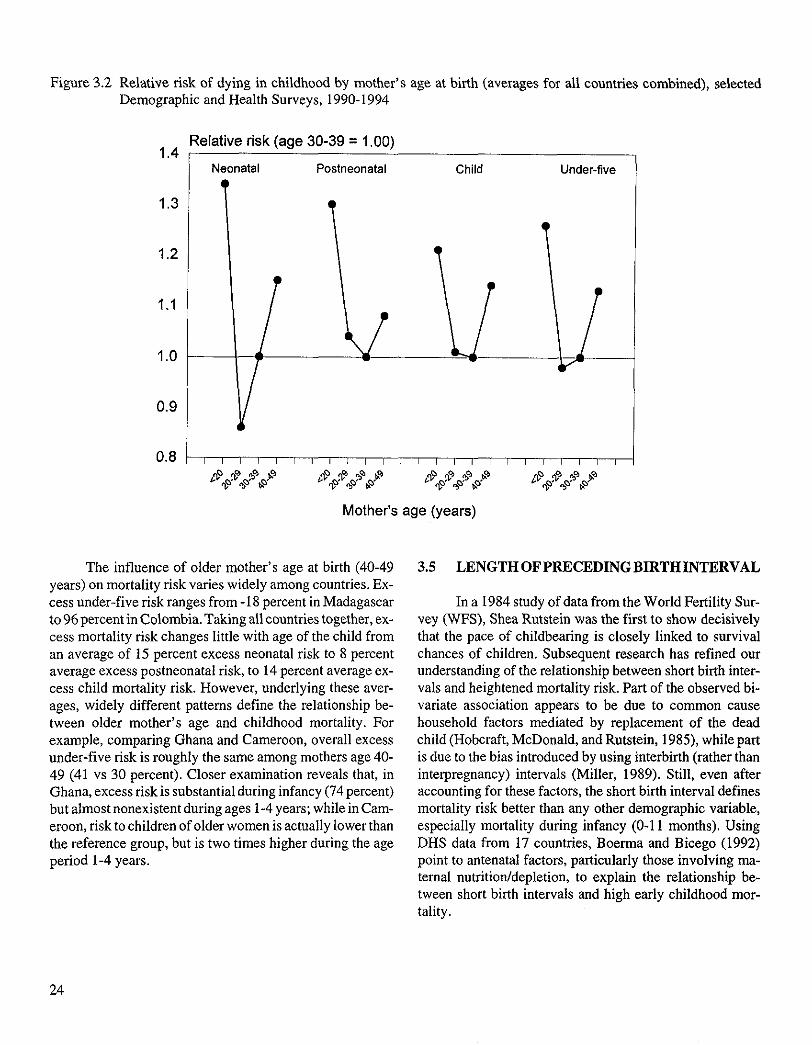
Figure 3.2 Relative risk of dying in childhood by mother's age at birth (averages for all countries combined), selected Demographic and Health Surveys, 1990-1994
1.4
1.3
1.2
1.1
1.0
0.9
0.8
Relative risk (age 30-39 = 1.00)
Neonatal Postneonatal Child Under-five
Mother's age (years)
The influence of older mother's age at birth (40-49 years) on mortality risk varies widely among countries. Ex- cess under-five risk ranges from -18 percent in Madagascar to 96 percent in Colombia. Taking all countries together, ex- cess mortality risk changes little with age of the child from an average of 15 percent excess neonatal risk to 8 percent average excess postneonatal risk, to 14 percent average ex- cess child mortality risk. However, underlying these aver- ages, widely different patterns define the relationship be- tween older mother's age and childhood mortality. For example, comparing Ghana and Cameroon, overall excess under-five risk is roughly the same among mothers age 40- 49 (41 vs 30 percent). Closer examination reveals that, in Ghana, excess risk is substantial during infancy (74 percent) but almost nonexistent during ages 1-4 years; while in Cam- eroon, risk to children of older women is actually lower than the reference group, but is two times higher during the age period 1-4 years.
3.5 LENGTH OF PRECEDING BIRTH INTERVAL
In a 1984 study of data from the World Fertility Sur- vey (WFS), Shea Rutstein was the first to show decisively that the pace of childbearing is closely linked to survival chances of children. Subsequent research has refined our understanding of the relationship between short birth inter- vals and heightened mortality risk. Part of the observed bi- variate association appears to be due to common cause household factors mediated by replacement of the dead child (Hobcraft, McDonald, and Rutstein, 1985), while part is due to the bias introduced by using interbirth (rather than interpregnancy) intervals (Miller, 1989). Still, even after accounting for these factors, the short birth interval defines mortality risk better than any other demographic variable, especially mortality during infancy (0-11 months). Using DHS data from 17 countries, Boerma and Bicego (1992) point to antenatal factors, particularly those involving ma- ternal nutrition/depletion, to explain the relationship be- tween short birth intervals and high early childhood mor- tality.
24
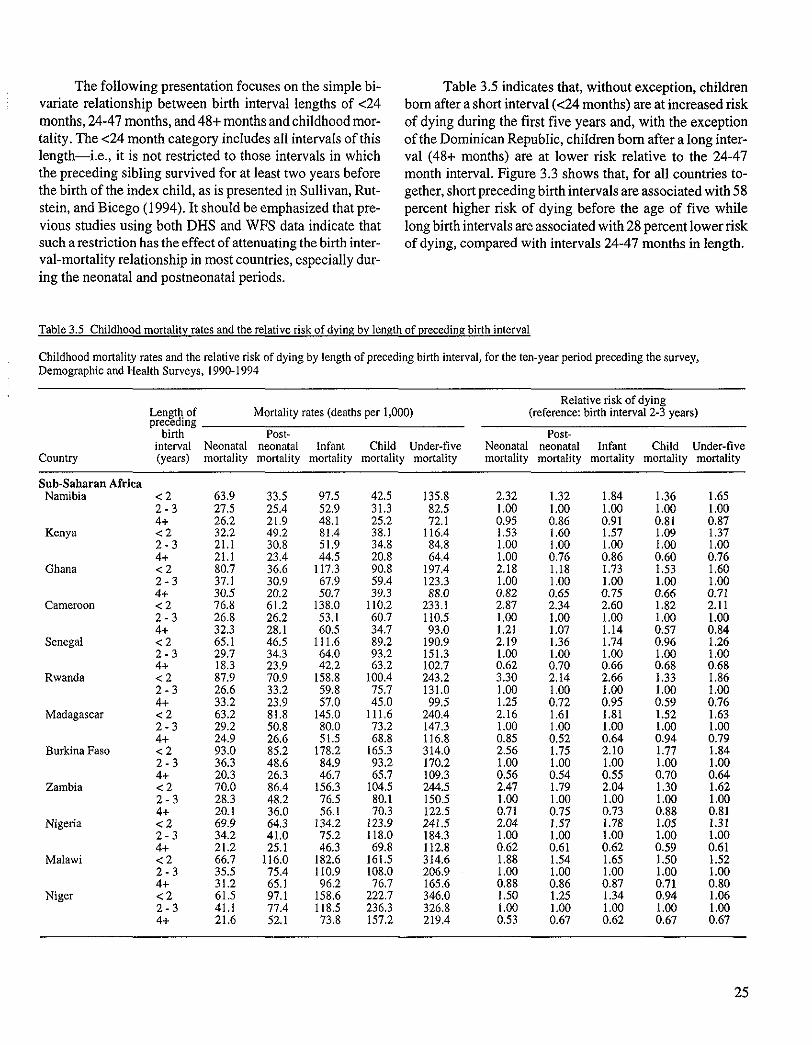
The following presentation focuses on the simple bi- variate relationship between birth interval lengths of <24 months, 24-47 months, and 48+ months and childhood mor- tality. The <24 month category includes all intervals of this length--i.e., it is not restricted to those intervals in which the preceding sibling survived for at least two years before the birth of the index child, as is presented in Sullivan, Rut- stein, and Bicego (1994). It should be emphasized that pre- vious studies using both DHS and WFS data indicate that such a restriction has the effect of attenuating the birth inter- val-mortality relationship in most countries, especially dur- ing the neonatal and postneonatal periods.
Table 3.5 indicates that, without exception, children born after a short interval (<24 months) are at increased risk of dying during the first five years and, with the exception of the Dominican Republic, children born after a long inter- val (48+ months) are at lower risk relative to the 24-47 month interval. Figure 3.3 shows that, for all countries to- gether, short preceding birth intervals are associated with 58 percent higher risk of dying before the age of five while long birth intervals are associated with 28 percent lower risk of dying, compared with intervals 24-47 months in length.
Table 3.5 Childhood mortality rates and the relative risk of dying by length of preceding birth interval
Childhood mortality rates and the relative risk of dying by length of preceding birth interval, for the ten-year period preceding the survey, Demographic and Health Surveys, 1990-1994
Country
Length of Mortality rates (deaths per 1,000) preceding
birth Post- interval Neonatal neonatal Infant Child Under-five (years) mortality mortality mortality mortality mortality
Relative risk of dying (reference: birth interval 2-3 years)
Post- Neonatal neonatal Infant Child Under-five mortality mortality mortality mortality mortality
Sub-Saharan Africa Namibia < 2 63.9 33.5 97,5 42.5 135.8 2.32
2 - 3 27.5 25.4 52,9 31.3 82.5 1.00 4+ 26.2 21.9 48.1 25.2 72.1 0.95
Kenya < 2 32.2 49.2 81.4 38.1 116.4 1.53 2 - 3 21.1 30.8 51.9 34.8 84.8 1,00 4+ 21.1 23.4 44.5 20.8 64.4 1.00
Ghana < 2 80.7 36.6 117.3 90.8 197.4 2.18 2 - 3 37.1 30.9 67.9 59.4 123.3 1.00 4+ 30.5 20.2 50.7 39.3 88.0 0.82
Cameroon < 2 76.8 61.2 138,0 110.2 233.1 2.87 2 - 3 26.8 26.2 53.1 60.7 110.5 1.00 4+ 32.3 28,1 60.5 34.7 93.0 1.21
Senegal < 2 65.1 46.5 111.6 89.2 190.9 2.19 2 - 3 29.7 34.3 64.0 93.2 151.3 1.00 4+ 18.3 23.9 42.2 63.2 102.7 0.62
Rwanda < 2 87.9 70.9 158.8 100.4 243.2 3.30 2 - 3 26.6 33.2 59.8 75.7 131.0 1.00 4+ 33.2 23.9 57.0 45.0 99.5 1.25
Madagascar < 2 63.2 81.8 145.0 111,6 240.4 2.16 2 - 3 29.2 50.8 80.0 73.2 147.3 1.00 4+ 24.9 26.6 51.5 68.8 116.8 0.85
Burkina Faso < 2 93.0 85.2 178.2 165.3 314.0 2.56 2 - 3 36.3 48.6 84.9 93.2 170.2 1.00 4+ 20.3 26.3 46.7 65.7 109.3 0.56
Zambia < 2 70.0 86.4 156.3 104.5 244.5 2.47 2 - 3 28.3 48.2 76.5 80.1 150.5 1.00 4+ 20.1 36.0 56.1 70.3 122.5 0.71
Nigeria < 2 69.9 64.3 134.2 123.9 241.5 2.04 2 - 3 34.2 41.0 75.2 118.0 184.3 1.00 4+ 21.2 25.1 46.3 69.8 112.8 0.62
Malawi < 2 66.7 116.0 182.6 161.5 314.6 1.88 2 - 3 35.5 75.4 110.9 108.0 206.9 1.00 4+ 31.2 65.1 96.2 76.7 165.6 0.88
Niger < 2 61.5 97.1 158,6 222.7 346.0 1.50 2 - 3 41.1 77.4 118.5 236.3 326.8 1.00 4+ 21.6 52.1 73.8 157.2 219.4 0,53
1.32 1.84 1.36 1.65 1.00 1.00 1.00 1.00 0.86 0.91 0.81 0.87 1,60 1.57 1.09 1.37 1.00 1.00 i .00 1.00 0.76 0.86 0.60 0.76 1.18 1.73 1.53 1.60 1.00 1.00 1.00 1.00 0.65 0.75 0.66 0.71 2.34 2.60 1.82 2.11 1.00 1.00 1.00 1.00 1.07 1.14 0.57 0.84 1.36 1.74 0.96 1.26 1.00 1.00 1.00 1.00 0.70 0.66 0.68 0.68 2,14 2.66 1.33 1.86 1.00 1.00 1.00 1.00 0.72 0.95 0.59 0.76 1.61 1.81 1.52 1.63 1.00 1.00 1.00 1,00 0.52 0.64 0.94 0.79 1,75 2.10 1.77 1.84 1.00 1.00 1,00 1.00 0.54 0.55 0.70 0.64 1.79 2.04 1,30 1.62 1.00 1.00 1,00 1,00 0.75 0.73 0.88 0.81 1.57 1.78 1.05 1.31 1.00 1.00 1.00 1.00 0.61 0.62 0.59 0.61 1.54 1.65 1.50 1.52 1.00 1.00 1,00 1.00 0.86 0.87 0.71 0.80 1.25 1.34 0.94 1.06 1.00 1.00 1,00 1.00 0.67 0.62 0.67 0.67
25
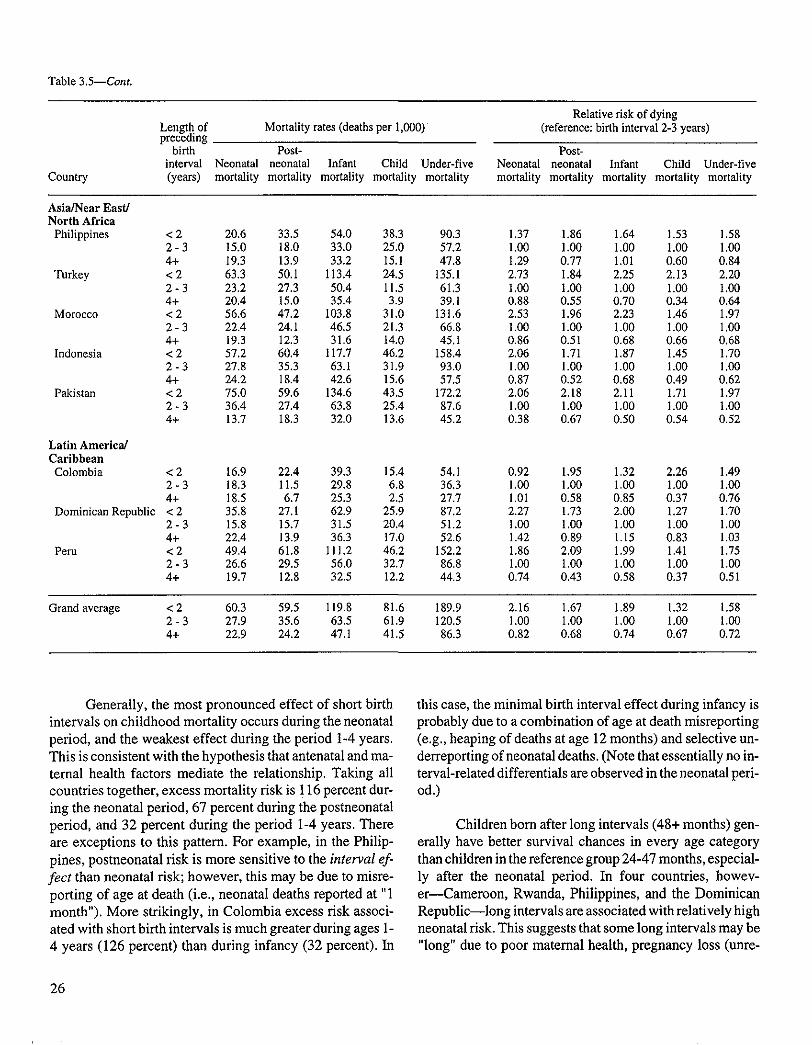
Table 3.5--Cont.
Country
Relative risk of dying Length of Mortality rates (deaths per 1.000) (reference: birth interval 2-3 years) preceding
birth Post- Post- interval Neonatal neonatal Infant Child Under-five Neonatal neonatal Infant Child Under-five (years) mortality mortality mortality mortality mortality mortality mortality mortality mortality mortality
Asia/Near East/ North Africa
Philippines
Turkey
Morocco
Indonesia
Pakistan
Latin America/ Caribbean Colombia
Dominican Republic
Peru
< 2 20.6 33.5 54.0 38.3 90.3 1.37 1.86 1.64 1.53 1.58 2 - 3 15.0 18.0 33.0 25.0 57.2 1.00 1.00 1.00 1.00 1.00 4+ 19.3 13.9 33.2 15.1 47.8 1.29 0.77 1.01 0.60 0.84 <2 63.3 50.1 113.4 24.5 135.1 2.73 1.84 2.25 2.I3 2.20 2 - 3 23.2 27.3 50.4 11.5 61.3 1.00 1.00 1.00 1.00 1.00 4+ 20.4 15.0 35.4 3.9 39.1 0.88 0.55 0.70 0.34 0.64 < 2 56.6 47.2 I03.8 31.0 131.6 2.53 1.96 2.23 1.46 1.97 2 - 3 22.4 24.1 46.5 21.3 66.8 1.00 1.00 1.00 1.00 1.00 4+ 19.3 12.3 31.6 14.0 45.1 0.86 0.51 0.68 0.66 0.68 < 2 57.2 60.4 117.7 46.2 158.4 2.06 1.71 1.87 1.45 1.70 2 - 3 27.8 35.3 63.1 31.9 93.0 1.00 1.00 1.00 1.00 1.00 4+ 24.2 18.4 42.6 15.6 57.5 0.87 0.52 0.68 0.49 0.62 <2 75.0 59.6 134.6 43.5 172.2 2.06 2.18 2.11 1.71 1.97 2 - 3 36.4 27.4 63.8 25.4 87.6 1.00 1.00 1.00 1.00 1.00 4+ 13.7 18.3 32.0 13.6 45.2 0.38 0.67 0.50 0.54 0.52
<2 16.9 22A 39.3 15.4 54.1 0.92 1.95 1.32 2.26 1.49 2 - 3 18.3 11.5 29.8 6.8 36.3 1.00 1.00 1.00 1.00 1.00 4+ 18.5 6.7 25.3 2.5 27.7 1.01 0.58 0.85 0.37 0.76 < 2 35.8 27.1 62.9 25.9 87.2 2.27 1.73 2.00 1.27 1.70 2 - 3 15.8 15.7 31.5 20.4 51.2 1.00 1.00 1.00 1.00 1.00 4+ 22.4 13.9 36.3 17.0 52.6 1.42 0.89 1.15 0.83 1.03 < 2 49.4 61.8 111.2 46.2 152.2 1.86 2.09 1.99 1.41 1.75 2 - 3 26.6 29.5 56.0 32.7 86.8 1.00 1.00 1.00 1.00 1.00 4+ 19.7 12.8 32.5 12.2 44.3 0.74 0.43 0.58 0.37 0.51
Grand average < 2 60.3 59.5 119.8 81.6 189.9 2.16 1.67 1.89 1.32 1.58 2 - 3 27.9 35.6 63.5 61.9 120.5 1.00 1.00 1.00 1.00 1.00 4+ 22.9 24.2 47.1 41.5 86.3 0.82 0.68 0.74 0.67 0.72
Generally, the most pronounced effect o f short birth intervals on childhood mortality occurs during the neonatal period, and the weakest effect during the period 1-4 years. This is consistent with the hypothesis that antenatal and ma- ternal health factors mediate the relationship. Taking all countries together, excess mortality risk is ! 16 percent dur- ing the neonatal period, 67 percent during the postneonatal period, and 32 percent during the period 1-4 years. There are exceptions to this pattern. For example, in the Philip- pines, postneonatal r isk is more sensit ive to the interval ef- fect than neonatal risk; however , this may be due to misre- port ing of age at death (i.e., neonatal deaths reported at "1 month"). More strikingly, in Colombia excess risk associ- ated with short birth intervals is much greater during ages 1- 4 years (126 percent) than during infancy (32 percent). In
this case, the minimal birth interval effect during infancy is probably due to a combination of age at death misreport ing (e.g., heaping of deaths at age 12 months) and selective un- derreporting of neonatal deaths. (Note that essentially no in- terval-related differentials are observed in the neonatal peri- od.)
Children bom after long intervals (48+ months) gen- erally have better survival chances in every age category than children in the reference group 24-47 months, especial- ly after the neonatal period. In four countries, howev- e r - -Cameroon , Rwanda, Philippines, and the Dominican Republ ic - - long intervals are associated with relatively high neonatal risk. This suggests that some long intervals may be "long" due to poor maternal health, pregnancy loss (unre-
26
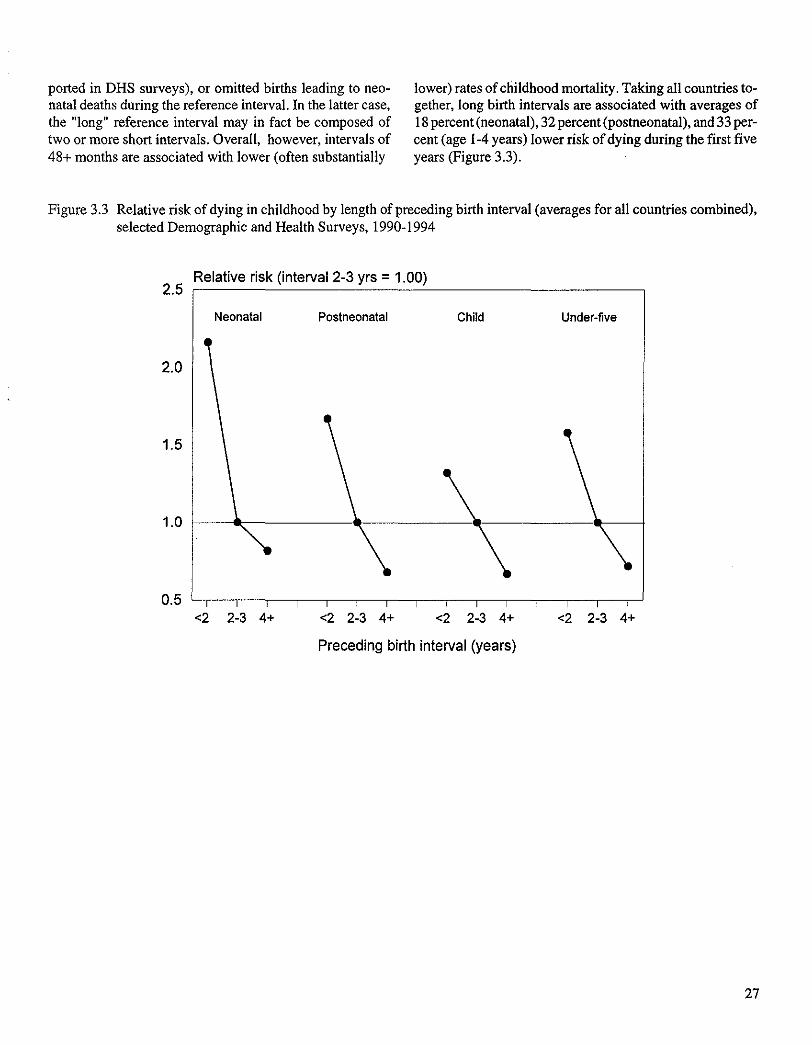
ported in DHS surveys), or omitted births leading to neo- natal deaths during the reference interval. In the latter case, the "long" reference interval may in fact be composed of two or more short intervals. Overall, however, intervals of 48+ months are associated with lower (often substantially
lower) rates of childhood mortality. Taking all countries to- gether, long birth intervals are associated with averages of 18 percent (neonatal), 32 percent (postneonatal), and 33 per- cent (age I-4 years) lower risk of dying during the first five years (Figure 3.3).
Figure 3.3 Relative risk of dying in childhood by length of preceding birth interval (averages for all countries combined), selected Demographic and Health Surveys, 1990-1994
2.5
2.0
1.5
1.0
0.5
Relative risk (interval 2-3 yrs = 1.00)
Neonatal Postneonatal Child Under-five
\ \ \ I I I I I I I I I I I I
<2 2-3 4+ <2 2-3 4+ <2 2-3 4+ <2
Preceding birth interval (years)
\ I I
2-3 4+
27