3. broiler meat market value chain - department of agriculture
TRANSCRIPT

A PROFILE OF THE SOUTH AFRICAN BROILER MARKET VALUE CHAIN
2010
Directorate Marketing Private Bag X 15
Arcadia 0007
Tel: 012 319 8455/6 Fax: 012 319 8131
Email: [email protected] www.daff.gov.za
1

1. DESCRIPTION OF THE INDUSTRY. 3
1.1. Production areas. 4
5
6
7
8
10112326
33
35
37
37
39
40
40
41
43
56
1.2. Production trends.
1.3. Local consumption.
1.4. Employment.
2. MARKET STRUCTURE.
2.2. Import – Export analysis. 2.2.1. Exports. 2.2.2. Share Analysis. 2.2.3. Imports.
3. BROILER MEAT MARKET VALUE CHAIN.
4. MARKETING CHANNELS FOR BROILER MEAT.
5. EMPOWERMENT STRATEGIES BY THE INDUSTRY AND GOVERNMENT.
6. BARRIERS TO PARTICIPATION BY THE EMERGING SECTOR.
7. OPPORTUNITIES AND WEAKNESSES.
8. MARKET INTELLIGENCE.
8.1. Export tariffs for broiler meat.
8.2. Import tariffs for broiler meat.
9. PERFORMANCE ANALYSIS OF SOUTH AFRICAN POULTRY INDUSTRY IN 2009.
10. ACKNOWLEDGEMENTS.
2

1. DESCRIPTION OF THE INDUSTRY. Broiler production, especially broiler meat production, was the largest segment of South African agriculture by 24% in 2009 while all animal products in South Africa contribute 48%. The farm income from broiler meat for 2009 was R23, 165 billion. Broiler production dominates the agricultural sector and it is the main supplier in protein terms of food than all other animal proteins combined followed by beef. The growth had spill-over effects in the grain and chick industries. Broiler meat accounts for about 93.6% to the total poultry-meat production, with the rest made up of mature chicken slaughter (culls), small-scale and backyard broiler meat production and other specialized broiler meat products (geese, turkey, ducks and guinea fowl). Pure lines are imported at great-grandparent level. Currently 7.8 million parents are required to produce commercial progeny for the broiler meat industry from 212 000 grandparents and 4000 pure breed lines. The gross value of broiler meat is depended on the quantity produced and prices received by producers. The trend in gross value follows a pattern of production. The contribution of broiler meat industry to the gross value of production increased continuously during the period under analysis due to increasing production and consumption. The average gross value of production amounted to R 1,045,500,000 over ten years. Although the broiler meat prices declined in 2007/08, the contribution to the gross value continued to increase due to higher production. Figure 1 below show the contribution of broiler meat to the gross value of production.
3

Figure 1: Gross value of broiler meat production
0
5 000 000
10 000 000
15 000 000
20 000 000
25 000 000
1999
/00
2000
/01
2001
/02
2002
/03
2003
/04
2004
/05
2005
/06
2006
/07
2007
/08
2008
/09
Period (Years)
Rand
s ('0
00)
Source: Agricultural Statistics.
1.1. Production areas.
Broiler meat is produced throughout South Africa with North West, Western Cape, Mpumalanga and Kwa-Zulu–Natal Provinces being the largest producers accounting for approximately 79% of total production. Figure 2 below show the distribution of production during 2008/09.
4

Figure 2: Broiler meat production per province 2008/09
KwaZulu-Natal 15%
Eastern Cape 7%
Gauteng 6%
Free-State 6%
Limpopo 1%
Western Cape 21%
Mpumalanga 18%
North West 25%
Northern Cape 1%
Source: Agricultural Statistics.
During 2008/09 North West Province produced 25% of the entire broiler meat in South Africa followed by Western Cape by 21%, Mpumalanga 18% and KwaZulu–Natal 15%. Limpopo and Northern Cape were the least producers, producing 1% each of South African broiler meat
1.2. Production trends.
The number of birds slaughtered has significantly increased by about 40% in 2009 compared with the year 2000, leading to 59% in 2009 compared to 2000. This is mainly driven by the increasing demand. Figure 3 below shows the production trends from 2000 to 2009.
5

Figure 3: Broiler meat production and slaughterings
0
200,000,000
400,000,000
600,000,000
800,000,000
1,000,000,000
1,200,000,000
1,400,000,000
1,600,000,000
2000
2001
2002
2003
2004
2005
2006
2007
2008
2009
Period (Year)
Kilo
gram
s
0100,000,000200,000,000300,000,000400,000,000500,000,000600,000,000700,000,000800,000,000900,000,0001,000,000,000
Num
bner
of b
roile
rs
slau
ghte
rd
Production Broilers slaughtered
Source: Agricultural Statistics and SAPA.
Figure 3 above shows that production of broiler meat and the number of birds slaughtered increased continuously from 2000 when 850 million kilograms was produced to 2009 when 1 349 million kilograms was produced.
1.3. Local consumption.
Figure 4 below depicts local consumption of broiler meat comparing it to total production for each year to determine if the country is self sufficient.
6

Figure 4: Broiler production and consumption
0
200 000
400 000
600 000
800 000
1 000 000
1 200 000
1 400 000
1 600 000
1 800 000
1999
/00
2000
/01
2001
/02
2002
/03
2003
/04
2004
/05
2005
/06
2006
/07
2007
/08
2008
/09
Period (Years)
Kilo
gram
s ('0
00)
Production Consumption
Source: Agricultural Statistics.
Figure 4 indicate that in South Africa consume more broiler meat than it is produced. This is the reason why South Africa became the net importer of broiler meat. The gap widened from 2004/05 as rising living standards are pushing larger numbers of consumers towards protein filled diets. The per capita of broiler meat consumed in South Africa has increased from 19.7 kg per person in 2000 to 31.83 kg per person in 2009. Broiler meat has the highest per capita consumption than all other animal protein sources.
1.4. Employment.
Commercial broiler meat producers are estimated at 404 (199 producers and 205 contract growers). Smallholder farmers are estimated at around 1 554. These farmers produced 920.4 million chickens in 2009 and employ around 60 000 workers.
7

2. MARKET STRUCTURE.
The domestic market consists of approximately 265 formal abattoirs. These abattoirs sell mainly to 5 main retailers (Pick n Pay, Shoprite-Checkers, Spar, Woolworths and MassMart) and SMME’s in the retail sector. These retailers buy the largest share of domestic production. Figure 5 below show the price movements from 1999/00 to 2008/09.
Figure 5: Average annual producer prices
5.007.009.00
11.0013.0015.0017.0019.00
1999
/00
2000
/01
2001
/02
2002
/03
2003
/04
2004
/05
2005
/06
2006
/07
2007
/08
2008
/09
Years
Ran
d pe
r kg
Source: Agricultural Statistics.
The price increased from 2000/01 and reached the highest level in 2006/07 before declining in 2007/08, then increased slightly in 2008/09. The decline in 2007/08 may be due to global economic recession that occurred from August 2008.
Figure 6 below show the market shares in the broiler meat industry.
8

Figure 6: Market shares of larger commercial broiler producers
Rainbow36%
Daybreak4%
Chubby Chick4%
Country Bird8%
Tydstroom5%
Astral27%
Rocklands4%
Argyle2%
others10%
Source: NAMC The broiler meat industry in South Africa is dominated by 2 large producers, namely Rainbow and Astral. Together these 2 companies produce 63% of the total broiler meat production. The other 4 medium-sized producers (Tydstroom, Daybreak, Chubby Chick and Rocklands) produce more than 400 000 broilers each per week or 15% of the market. Argyle owns 2% of the market with more than 300 000 broilers per week followed by approximately 49 smaller producers producing less than 200 000 broilers per week each and around 1745 subsistence farmers (selling approximately 500 live chickens per week).
• Rainbow which owns the Rainbow, Bonny Bird and Farmer Brown
brands is the largest vertically integrated broiler meat producer in South Africa holding an approximate market share of 36% and produces 4.1 million broilers per week.
• Astral (27%) and Earlybird farm both broiler meat producers are
subsidiaries of Astral Foods. On the 08th September 2004 the Competition Tribunal approved the merger of the two subsidiaries. Astral produces 3.4 million broilers per week and Country Bird produces 1.2 million broilers per week.
9

• Tydstroom Pluimveeplaas which belongs to Pioneer Foods and holds 5% of the market share,
• Daybreak farms subsidiary of AFGRI which owns the superior brand
holds 4%. It currently processes 650 000 broilers per week.
• Chubby Chicks (also known as Fourie’s poultry farm) based in Uitenhage holds 4% of the market share.
• Rocklands is a subsidiary of JSE-listed Sovereign Food Investments. It is
the seventh-largest broiler producer in South Africa and its broiler meat is marketed under the Crown label. Its market share is 4%.
Table 1: Total production, number of birds slaughtered, consumption, exports and imports.
Broilers slaughtered Production Consumption
Exports
Imports
Years
(Kilograms) 1999/00 671,055,000 850,000,000 927,000,000 6,228,237 93,390,819 2000/01 652,995,000 869,000,000 938,000,000 7,393,777 78,470,172 2001/02 724,132,500 896,000,000 965,000,000 9,002,249 93,900,937 2002/03 690,900,000 925,000,000 1,032,000,000 4,009,216 153,006,500 2003/04 704,392,500 928,000,000 1,082,000,000 3,577,946 181,996,728 2004/05 774,322,500 1,019,000,000 1,204,000,000 1,765,874 214,022,528 2005/06 837,112,500 1,143,000,000 1,383,000,000 1,950,160 293,598,112 2006/07 870,555,000 1,200,000,000 1,470,000,000 1,507,171 276,016,746 2007/08 927,832,500 1,276,000,000 1,508,000,000 2,548,420 220,278,304 2008/09 937,807,500 1,349,000,000 1,551,000,000 18,657,957 225,106,632
Source: Agricultural Statistics, SAPA and Quantec EasyData.
Table 1 above shows that although the number of broilers slaughtered increases, South Africa still does not produce enough to justify the domestic demand and therefore, the shortfall is imported after exporting smaller quantities.
2.2. Import – Export analysis.
Figure 7 compares quantities of imports and exports of broiler meat from 2000 to 2009.
10

Figure 7: Broiler meat import and export quantities
0
50 000 000
100 000 000
150 000 000
200 000 000
250 000 000
300 000 000
350 000 000
2000
2001
2002
2003
2004
2005
2006
2007
2008
2009
Period (Years)
Qua
ntity
(Kg)
Import Quantity Export Quantity
Source: Quantec EasyData.
Figure 7 indicates that from 2000 to 2009 South African broiler meat exports were far less than the imports. South Africa is therefore a net importer of broiler meat.
2.2.1. Exports.
The broiler meat industry is also an earner of foreign exchange through the export of broiler meat. South Africa experienced a drastic increase of 18.7 million kilograms for broiler meat exports in 2009, yielding approximately R 239 million. Figure 8 below indicates the export of broiler meat from 2000 to 2009.
11

Figure 8: Broiler meat exports
02 000 0004 000 0006 000 0008 000 000
10 000 00012 000 00014 000 00016 000 00018 000 00020 000 000
2000
2001
2002
2003
2004
2005
2006
2007
2008
2009
Period (Years)
Qua
ntity
(Kg)
0
50 000 000
100 000 000
150 000 000
200 000 000
250 000 000
300 000 000
Valu
e (R
ands
)
Export Quantity Export Value
Source: Quantec EasyData.
Broiler meat exports quantity and value are followed the same trend throughout the decade. From 2000 to 2003 broiler meat have been exported at a lower rate due to the stronger South African exchange rate. Broiler meat exports reached its lowest level from 2005 to 2008 due to increased domestic demand.
Figure 9 below shows the main export market of South Africa’s broiler meat from 2000 to 2009.
12

Figure 9: Broiler meat exports to SADC
0
2,000,000
4,000,000
6,000,000
8,000,000
10,000,000
12,000,000
14,000,000
16,000,000
18,000,000
2000
2001
2002
2003
2004
2005
2006
2007
2008
2009
Period (Years)
Qua
ntity
(Kg)
Angola Democratic Republic of the CongoMalawi MozambiqueUnited Republic of Tanzania Zimbabwe
Source: Quantec EasyData.
Figure 9 above indicates that Mozambique was an important export market of South Africa’s broiler meat throughout the decade though the quantities of exports declined significantly from 2003 to 2009. In 2009 Zimbabwe commanded the greatest market share of 15.7 million kilograms of South African broiler meat. There were recorded fluctuations among Malawi, Angola, Democratic Republic of Congo, United Republic of Tanzania and Zimbabwe from 2000 to 2009.
13

Figure 10: Broiler meat exports to Eastern, Middle and Western Africa
0
20,000
40,000
60,000
80,000
100,000
120,000
140,000
2000
2001
2002
2003
2004
2005
2006
2007
2008
2009
Period (Years)
Qua
ntity
(Kg)
Congo Ghana Nigeria Saint Helena Uganda
Source: Quantec EasyData
It is clearly indicated from figure 10 above that from 2002 to 2006 Nigeria commanded the greatest market share of South African broiler meat while Ghana & Saint Helena competed for the second level over the same period.
Figure 11 below shows the main export destinations of South Africa’s broiler meat in 2008. Most of South African broiler meat is exported to Mozambique which obtained 42% of South African broiler meat followed by Zimbabwe by 33%, Malawi 7% and United Arab Emirates by 5%. It is noted that South African broiler meat is exported mostly to SADC countries which constitutes 88% of the total broiler meat exports.
14

Destinations of broiler meat in 2009
Zimbabwe85%
Angola1%
Not allocated3%
Zambia1%
Mozambique9%
Democratic Republic of the
Congo1%
Source: Quantec EasyData.
It is noted that South African broiler meat is exported mostly to SADC countries. Zimbabwe commanded 85% of South African broiler meat followed by Mozambique with 9%. This shows that Zimbabwe is the net importer of South African broiler meat. Values of broiler meat exports from various provinces of South Africa are presented in Figure 12.
15

Figure 12: Value of broiler meat exports by Provinces
0
20,000,000
40,000,000
60,000,000
80,000,000
100,000,000
120,000,000
2000 2001 2002 2003 2004 2005 2006 2007 2008 2009
Period (years)
Valu
e (R
ands
)
Western Cape Eastern Cape Northern CapeFree State Kwazulu-Natal North WestGauteng Mpumalanga Limpopo
Source: Quantec EasyData.
Broiler meat exports originate mainly from the Gauteng, Kwazulu-Natal and Western Cape provinces. This is due to the fact that these provinces are the main exit points. Gauteng province has recorded the greatest values in broiler meat exports between the periods 2000 and 2003 with the highest value in 2002. From 2004 to 2008, export values fluctuated between Kwazulu-Natal, Western Cape and Gauteng provinces. Free State experienced the greatest values in 2009. Mpumalanga province was a regular exporter while Northern Cape, Eastern Cape, North West and Limpopo provinces registered intermittent exports.
The following figures (Figures 13 - 21) show the values of broiler meat exports from the various districts in the nine provinces of South Africa.
16

Figure 13:Value of broiler meat exports from Western Cape Province
010,000,00020,000,00030,000,00040,000,00050,000,00060,000,00070,000,00080,000,000
Period (Years)
Valu
e (R
ands
)
City of Cape Tow n 3,434,917 17,813,27840,218,763 8,351,398 5,624,826 6,844,787 9,577,628 10,484,442 17,030,01870,731,779
West Coast 0 0 0 0 0 0 2,019,646 2,210,389 0 0
Cape Winelands 0 0 0 0 0 0 0 0 0 598,130
Overberg 0 0 134,009 0 0 0 0 0 0 0
Eden 0 72,724 0 0 4,945,699 0 0 0 374,683 0
2000 2001 2002 2003 2004 2005 2006 2007 2008 2009
Source: Quantec EasyData.
The greatest share of broiler meat exports from Western Cape Province originates mainly from City of Cape Town district municipality. Broiler meat exports originating from City of Cape Town district municipality have shown increases in 2001 and 2002 but declined dramatically in 2003, thereafter the value of broiler meat exports experienced a drastic increase in 2009. Small intermittent export values were recorded in West Coast, Cape Winelands, Overberg and Eden district municipalities.
17

Figure 14: Value of broiler meat exports from Eastern Cape Province
0
2000000
4000000
6000000
8000000
10000000
12000000
14000000
Period (Years)
Valu
e (R
ands
)
Cacadu 304726 168900 4188032 3766538 185734 0 0 0 0 0
Nelson Mandela 0 12690388 4780888 1621120 0 0 9911 17586 0 941
2000 2001 2002 2003 2004 2005 2006 2007 2008 2009
Source: Quantec EasyData.
Broiler meat exports from Eastern Cape Province were from Cacadu district municipality during 2000 to 2004 while Nelson Mandela district also realized exports of broiler meat between 2001 and 2003, and resumed in 2006 to 2007, diminished in 2008 and experienced another broiler meat imports in 2009.
Figure 15: Value of broiler meat exports from Northern Cape Province
0
100,000
200,000
300,000
400,000
500,000
600,000
Period (Years)
Valu
e (R
ands
)
Pixley ka Seme 0 0 0 516,647 0 0 0 0 0 0
2000 2001 2002 2003 2004 2005 2006 2007 2008 2009
Source: Quantec EasyData.
18
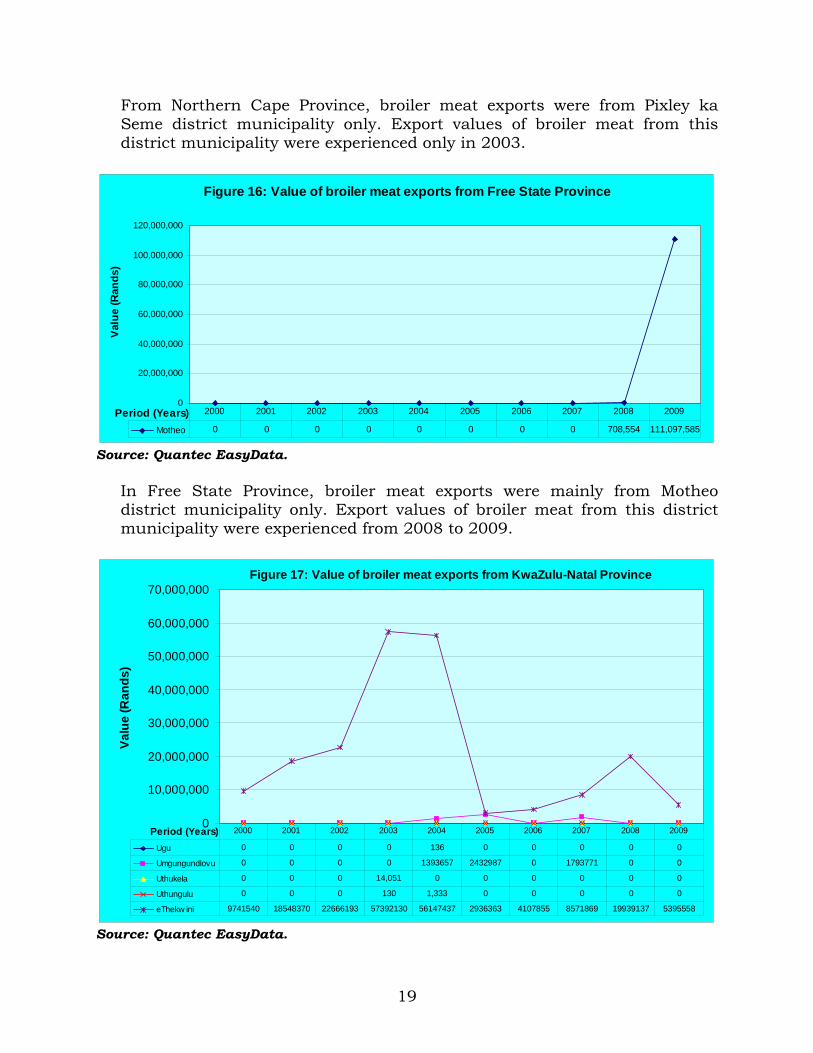
From Northern Cape Province, broiler meat exports were from Pixley ka Seme district municipality only. Export values of broiler meat from this district municipality were experienced only in 2003.
Figure 16: Value of broiler meat exports from Free State Province
0
20,000,000
40,000,000
60,000,000
80,000,000
100,000,000
120,000,000
Period (Years)
Valu
e (R
ands
)
Motheo 0 0 0 0 0 0 0 0 708,554 111,097,585
2000 2001 2002 2003 2004 2005 2006 2007 2008 2009
Source: Quantec EasyData.
In Free State Province, broiler meat exports were mainly from Motheo district municipality only. Export values of broiler meat from this district municipality were experienced from 2008 to 2009.
Figure 17: Value of broiler meat exports from KwaZulu-Natal Province
0
10,000,000
20,000,000
30,000,000
40,000,000
50,000,000
60,000,000
70,000,000
Period (Years)
Valu
e (R
ands
)
Ugu 0 0 0 0 136 0 0 0 0 0
Umgungundlovu 0 0 0 0 1393657 2432987 0 1793771 0 0
Uthukela 0 0 0 14,051 0 0 0 0 0 0
Uthungulu 0 0 0 130 1,333 0 0 0 0 0
eThekw ini 9741540 18548370 22666193 57392130 56147437 2936363 4107855 8571869 19939137 5395558
2000 2001 2002 2003 2004 2005 2006 2007 2008 2009
Source: Quantec EasyData.
19

From KwaZulu–Natal Province, the export of broiler meat were mainly from eThekwini district municipality with increasing export values recorded since 2000 and a dramatic increase in 2003 followed by dramatic decline in 2005, thereafter the value of broiler meat exports experienced slight increases until 2008 then decreased again in 2009. Umgungundlovu district municipality obtained the second level during 2004, 2005 and 2007. Intermittent exports of broiler meat were recorded in Ugu, Umgungundlovu, Uthukela, Uthungulu and iLembe.
Figure 18: Value of broiler meat exports from North West Province
0
50,000
100,000
150,000
200,000
250,000
300,000
350,000
Period (Years)
Valu
e (R
ands
)
Bojanala 0 0 0 0 0 0 4,667 0 0 68,355
Southern 0 0 0 0 0 129,120 300,542 232,326 191,267 0
2000 2001 2002 2003 2004 2005 2006 2007 2008 2009
Source: Quantec EasyData.
The value of broiler meat exports from Southern district municipality of North West was recorded from 2005 and increased to the highest level in 2006 but showed a decline between the periods 2007 and 2008 and diminished in 2009. From Bojanala district municipality exports of broiler meat were experienced in 2006 and 2009.
20

Figure 19: Value of broiler meat from Gauteng Province
0
10,000,000
20,000,000
30,000,000
40,000,000
50,000,000
60,000,000
70,000,000
Period (Years)
Valu
e (R
ands
)
Sedibeng 0 2,740 0 7,840,028 1,919,659 1,646,221 1,834,846 0 0 0
Metsw eding 0 0 0 2,893,478 0 0 0 0 0 2,536,819
West Rand 0 0 0 2,893,478 0 0 0 0 0 2,536,819
Ekurhuleni 5,324,587 17,504,222 1,316,094 265,781 222 9,529 812,088 7,215 531 171,299
City of Johannesburg 275,471 12,898,263 57,731,913 12,739,765 3,173,950 965,355 621,205 3,050,187 772,926 1,981,838
City of Tshw ane 20,891,060 11,796,257 6,242,247 7,874,522 10,660,521 8,382,432 6,991,231 7,928,697 19,115,262 33,837,782
2000 2001 2002 2003 2004 2005 2006 2007 2008 2009
Source: Quantec EasyData.
In Gauteng province, broiler meat exports arose mainly from Ekurhuleni, City of Johannesburg and City of Tshwane district municipalities. The value of broiler meat exports originating from the City of Johannesburg district municipality increased to the highest level in 2002 and then declined drastically in 2003. City of Tshwane district municipality continually obtained the greatest share from 2004 until it reached the highest level in 2009. Sedibeng, Metsweding and West Rand district municipalities showed some irregularities throughout the decade.
21

Figure 20: Value of broiler meat exports from Mpumalanga
0
2,000,000
4,000,000
6,000,000
8,000,000
10,000,000
12,000,000
Period (Years)
Valu
e (R
ands
)
Gert Sibande 0 0 0 0 0 0 0 0 0 297,234
Ehlanzeni 129,887 1,971,453 96,387 2,042,191 225,595 772,795 3,250,382 38,468 806,908 11,211,444
2000 2001 2002 2003 2004 2005 2006 2007 2008 2009
Source: Quantec EasyData.
In Mpumalanga Province, the values of broiler meat exports from the Ehlanzeni district municipality were fluctuating between the periods 2000 and 2010 with high values recorded in 2001, 2003, 2006 and the highest in 2009.
Figure 21: Value of broiler meat exports from Limpopo Province
0
500,000
1,000,000
1,500,000
2,000,000
2,500,000
Period (Years)
Valu
e (R
ands
)
Mopani 0 0 0 0 0 0 0 323,150 0 0
Vhembe 0 0 382,633 0 0 0 0 0 49,651 0
Capricorn 0 0 0 0 0 0 0 0 0 2,074,47
2000 2001 2002 2003 2004 2005 2006 2007 2008 2009
1 Source: Quantec EasyData.
Figure 20 indicates that exports of broiler meat from the Limpopo Province occurred from the Vhembe district municipality in 2002 and 2008, in
22

Mopani district municipality exports were recorded only in 2007, while Capricorn district municipality experienced some imports in 2009.
2.2.2. Share Analysis. Table 2: Share of Provincial broiler meat exports to the total RSA broiler meat exports (%) Years Province
2000 2001 2002 2003 2004 2005 2006 2007 2008 2009
Western Cape 7.62 20.82 32.09 11.28 18.86 31.14 41.77 42.65 34.30 29.84 Eastern Cape 0.34 7.49 3.57 3.64 0.17 0.00 0.02 0.03 0.00 0.00 Northern Cape 0.00 0.00 0.00 0.70 0.00 0.00 0.00 0.00 0.00 0.00 Free State 0.00 0.00 0.00 0.00 0.00 0.00 0.00 0.00 1.40 46.47 Kwazulu-Natal 10.80 10.80 9.01 38.76 51.34 12.22 7.40 17.41 19.65 1.13 North West 0.00 0.00 0.00 0.00 0.00 0.59 1.10 0.78 0.38 0.03 Gauteng 80.95 58.60 54.95 42.87 29.23 52.54 38.00 37.92 42.58 16.85 Mpumalanga 0.29 2.30 0.08 2.76 0.40 3.52 11.71 0.13 1.59 4.81 Limpopo 0.00 0.00 0.30 0.00 0.00 0.00 0.00 1.09 0.10 0.87 Total 100 100 100 100 100 100 100 100 100 100 Source: Calculated from Quantec EasyData.
From Table 2 above, Gauteng Province commands the greatest share of South African broiler meat exports followed by KwaZulu–Natal and Western Cape provinces. This is mainly due to the fact that most exporters of broiler meat are situated in these provinces and also that they are the exit points. Mpumalanga province was a regular exporter while Northern Cape, Eastern Cape, Free State, North West and Limpopo provinces registered fractional exports of broiler meat.
The accompanying Tables 3 to 11 shows a share of the various districts broiler meat exports to the various provincial broiler meat exports.
Table 3: Share of district broiler meat exports to the total Western Cape provincial broiler meat exports (%) Years District
2000 2001 2002 2003 2004 2005 2006 2007 2008 2
City of Cape Town 100.00 99.59 99.67 100.00 53.21 100.00 82.59 82.59 97.85 West Coast 0.00 0.00 0.00 0.00 0.00 0.00 17.41 17.41 0.00 Cape Winelands 0.00 0.00 0.00 0.00 0.00 0.00 0.00 0.00 0.00 Overberg 0.00 0.00 0.33 0.00 0.00 0.00 0.00 0.00 0.00 Eden 0.00 0.41 0.00 0.00 46.79 0.00 0.00 0.00 2.15 Total 100.00 100.00 100.00 100.00 100.00 100.00 100.00 100.00 100.00 10Source: Calculated from Quantec EasyData.
City of Cape Town district municipality has commanded the greatest share of broiler meat exports in Western Cape Province during the period between
23

2000 and 2009. During the same period, Eden and Overberg district municipalities recorded intermittent exports of broiler meat and West Coast district municipality exported from 2006 to 2007.
Table 4: Share of district broiler meat exports to the total Eastern Cape provincial broiler meat exports (%) Years District
2000 2001 2002 2003 2004 2005 2006 2007 2008 2009
Cacadu 100.00 1.31 46.69 69.91 100.00 0.00 0.00 0.00 0.00 0.00 Nelson Mandela 0.00 98.69 53.31 30.09 0.00 0.00 100.00 100.00 0.00 100.00 Total 100.00 100.00 100.00 100.00 100.00 0.00 100.00 100.00 0.00 100.00 Source: Calculated from Quantec EasyData.
FromEastern Cape Province, the export shares of broiler meat fluctuated between Cacadu and Nelson Mandela district municipalities. There were no exports of broiler meat from 2005 to 2008 in Eastern Cape Province.
Table 5: Share of district broiler meat exports to the total Northern Cape provincial broiler meat exports (%) Years District
2000 2001 2002 2003 2004 2005 2006 2007 2008 2009
Pixley ka Seme 0.00 0.00 0.00 100.00 0.00 0.00 0.00 0.00 0.00 0.00 Total 0 0 0 100 0 0 0 0 0 0 Source: Calculated from Quantec EasyData.
Northern Cape recorded exports of broiler meat only in 2003 from Pixley ka Seme district municipality and diminished from 2004 to 2009.
Table 6: Share of district broiler meat exports to the total Free State provincial broiler meat exports (%) Years District
2000 2001 2002 2003 2004 2005 2006 2007 2008 2009
Lejweleputswa 0 0 0 0 0 0 0 0 100 100 Total 0 0 0 0 0 0 0 0 100 100 Source: Calculated from Quantec EasyData.
From Free State Province exports of broiler meat occurred from Motheo district municipality in 2008 to 2009.
24

Table 7: Share of district broiler meat exports to the total Kwazulu–Natal provincial broiler meat exports (%) Years District
2000 2001 2002 2003 2004 2005 2006 2007 2008 2009
Ugu 0.00 0.00 0.00 0.00 0.00 0.00 0.00 0.00 0.00 0.00 Umgungundlovu 0.00 0.00 0.00 0.00 2.42 45.31 0.00 17.30 0.00 0.00 Uthukela 0.00 0.00 0.00 0.02 0.00 0.00 0.00 0.00 0.00 0.00 Uthungulu 0.00 0.00 0.00 0.00 0.00 0.00 0.00 0.00 0.00 0.00 eThekwini 100 100 100 99.98 97.58 54.69 100.00 82.70 100.00 100.00 Total 100 100 100 100 100 100 100.00 100 100 100 Source: Calculated from Quantec EasyData.
From KwaZulu-Natal Province, eThekwini district munipality has commanded the greatest share of broiler meat exports throughout the period under analysis. The broiler meat exports also occurred in Umgungundlovu district municipality from 2004 to 2007. Fractional exports of broiler meat were recorded in Ugu, Uthukela, and Uthungulu district municipalities.
Table 8: Share of district broiler meat exports to the total North West provincial broiler meat exports (%) Years District
2000 2001 2002 2003 2004 2005 2006 2007 2008 2009
Bojanala 0.00 0.00 0.00 0.00 0.00 0.00 1.53 0.00 0.00 100.00 Southern 0.00 0.00 0.00 0.00 0.00 100.00 98.47 100.00 100.00 0.00 Total 0.00 0.00 0.00 0.00 0.00 100.00 100.00 100.00 100.00 100.00 Source: Calculated from Quantec EasyData.
Southern district municipality has commanded the greatest share of broiler meat exports in North West Province during the period between 2005 and 2008. Fractional exports of broiler meat were recorded in 2006 and 2009 from Bojanala district municipality. There were no exports of broiler meat from North West Province before 2005.
Table 9: Share of district broiler meat exports to the total Gauteng provincial broiler meat exports (%) Years District
2000 2001 2002 2003 2004 2005 2006 2007 2008 2009
Sedibeng 0.00 0.01 0.00 22.72 12.18 14.96 17.88 0.00 0.00 0.00 Metsweding 0.00 0.00 0.00 8.39 0.00 0.00 0.00 0.00 0.00 6.18 West Rand 0.00 0.00 0.00 8.39 0.00 0.00 0.00 0.00 0.00 6.18 Ekurhuleni 20.10 41.48 2.02 0.77 0.00 0.09 7.92 0.07 0.00 0.42 City of Johannesburg 1.04 30.56 88.42 36.92 20.15 8.77 6.06 27.76 3.89 4.83 City of Tshwane 78.86 27.95 9.56 22.82 67.67 76.18 68.14 72.17 96.11 82.40 Total 100 100 100 100 100 100 100 100 100 100 Source: Calculated from Quantec EasyData.
25

In Gauteng Province, City of Tshwane districts district municipality commanded the greatest share of broiler meat exports followed by City of Johannesburg and Ekurhuleni district municipalities. Intermittent exports of broiler meat were recorded in Sedibeng, Metsweding and West Rand district municipalities.
Table 10: Share of district broiler meat exports to the total Mpumalanga provincial broiler meat exports (%) Years District
2000 2001 2002 2003 2004 2005 2006 2007 2008 2009
Gert Sibande 0.00 0.00 0.00 0.00 0.00 0.00 0.00 0.00 0.00 2.58 Ehlanzeni 100 100 100 100 100 100 100 100 100 97.42 Total 100 100 100 100 100 100 100 100 100 100. Source: Calculated from Quantec EasyData.
Ehlanzeni district in Mpumalanga Province commanded 100% share of all broiler meat exports from 2000 to 2008. Gert Sibande district municipality experienced some exports only in 2009.
Table 11: Share of district broiler meat exports to the total Limpopo provincial broiler meat exports (%) Years District
2000 2001 2002 2003 2004 2005 2006 2007 2008 2009
Mopani 0 0 0 0 0 0 0 100 0 0 Vhembe 0 0 100 0 0 0 0 0 100 0 Capricorn 0 0 0 0 0 0 0 0 0 100 Total 0 0 100 0 0 0 0 100 100 100 Source: Calculated from Quantec EasyData.
From Limpopo Province, exports of broiler meat occurred in 2002 and 2008 from the Vhembe district municipality and in 2007 and 2008 from Mopani and Vhembe district municipalities respectively.
2.2.3. Imports.
South Africa imported approximately 225 million kilograms of broiler meat in 2009 at an estimated value of R 1 540 million. The import value showed a significant decline of 3.9% compared to 2007 but increased by 407% compared to 2000. The decline in 2008 might have been caused by global economic meltdown that occurred from August 2008. Figure 21 below show the imports of broiler meat from 2000 to 2009.
26

Figure 21: Broiler meat imports
0
50 000 000
100 000 000
150 000 000
200 000 000
250 000 000
300 000 000
350 000 000
2000
2001
2002
2003
2004
2005
2006
2007
2008
2009
Period (Years)
Qua
ntity
(Kg)
0
200 000 000
400 000 000
600 000 000
800 000 000
1 000 000 000
1 200 000 000
1 400 000 000
1 600 000 000
1 800 000 000
Valu
e (R
ands
)
Quantity Value
Source: Quantec EasyData.
Broiler meat imports are exchange rate driven, when the Rand appreciates against US$, imports of broiler meat increases and when the Rand depreciates against US$ imports of broiler meat decreases. The import of broiler meat quantities increased significantly from 2003 and reached the highest level in 2006 before decreasing from 2007 to 2009. The Rand appreciated (average of R7.66/US$) from the last six months of 2009 and led the broiler meat imports to accelerate. During 2006 to 2009, it was more expensive to import broiler meat as less quantity was imported at a higher value. This may be due to the depreciation of South African Rand against US$. Figure 22 below show the main suppliers of broiler meat to South Africa during the period 2000 to 2009.
27

Figure 22: Quantity of broiler meat imported from European Union
0
2,000,000
4,000,000
6,000,000
8,000,000
10,000,000
12,000,000
14,000,000
2000
2001
2002
2003
2004
2005
2006
2007
2008
2009
Period (Years)
Qua
ntity
(Kg)
Belgium Germany DenmarkFrance United Kingdom IrelandNetherlands
Source: Quantec EasyData. Figure 22 clearly indicates that the highest quantity of broiler meat imports from 2000 to 2006 originated from United Kingdom followed by France and Belgium. Belgium experienced greatest share of broiler meat import from 2007 to 2009. There were some fluctuations among Belgium, France, Netherlands, Denmark and Ireland throughout the period under analysis.
28

Figure 23: Quantity of broiler meat imported from America
0
50,000,000
100,000,000
150,000,000
200,000,000
250,000,000
2000
2001
2002
2003
2004
2005
2006
2007
2008
2009
Years
Qua
ntity
(Kg)
Argentina Brazil Canada Cayman Islands United States
Source: Quantec EasyData. During the past decade Brazil commanded the highest South Africa’s import market of broiler meat. Its quantity increased drastically throughout the decade and dropped significantly from 2007 to 2009. The decrease was due to the world economic recession which led to a slow down of consumer demand. Canada was the second largest importer of broiler meat to South Africa followed by Argentina and United States. Generally, Brazil is the net exporter of South African broiler meat imports.
29

Figure 24: Quantity of broiler meat imported from Oceania
0
2,000,000
4,000,000
6,000,000
8,000,000
10,000,000
12,000,000
14,000,000
2000
2001
2002
2003
2004
2005
2006
2007
2008
2009
Period (Years)
Qua
ntity
(Kg)
Australia New Zealand
Source: Quantec EasyData. It is clearly indicated from figure 24 above that from Oceania, Australia is the main importer of broiler meat to South Africa. There are some increases throughout the decade with some little fluctuations. Oceania reached the highest levels in 2001 and 2007, which might be due to decreased imports from other countries.
30

Figure 25: Quantity of broiler meat imported from Asia
0
2,000,000
4,000,000
6,000,000
8,000,000
10,000,000
12,000,000
2000
2001
2002
2003
2004
2005
2006
2007
2008
2009
Period (Years)
Qua
ntity
(Kg)
China Israel Thailand
Source: Quantec EasyData. Figure 25 shows that China was the main supplier from 2000 to 2003 and diminished from 2005 to 2009. Israel has been South Africa’s regular importer of broiler meat over the past decade and it obtained the highest market share from 2005 to 2009. Thailand recorded intermittent supply of broiler meat to South Africa.
31

Figure 26: Countries of origin for broiler meat imports in 2009
Brazil74%
United States3%Canada
5%
Argentina14%
Australia4%
Source: Quantec EasyData. Figure 26 above shows the share of various suppliers to South Africa’s broiler meat in 2009. Brazil commanded the highest market share of broiler meat in South Africa with 74% share followed by Argentina with 14% then Canada with 5%.
32

3. BROILER MEAT MARKET VALUE CHAIN Figure 24: Structure of the broiler meat industry.
Source: Adapted from NAMC.
Retail
Abattoirs
Abattoirs A: 0 B: 29 C: 102 D: 60 E: 68 Total: 265
Domestic Production Commercial
Production: 72% or 18.6 million broiler meats sold per week
Contract growers
Feed companies
Breeders
Import Import: 225 107 000 Kg
37 Breeders: 3 primary: Cobb Ross and Hybro Multipliers: 34
207 Broiler meat contract growers: Early Bird 82 Country Bird 56 Rainbow 42
SMMEs: 28% or 4 983 906 broiler meats sold per week.
48.6 million Consumers (Estimate for 2009) Per Capita Consumption = 31.83 kg / year
17 % of Agricultural Production
Export
Farms
27 Feed companies:
75% of industry ⎪⎭
⎪⎬
⎫
AfgriEpolMeadow
24 remaining mills: 25% of industry
Export: 18 658 000 kg
Total Production: National DoA Sector for Agriculture/ Livestock 32% of the National flock is contributed by SMME`s Indigenous fowls sustenance farming.
- SAPA Stats (Commercial only) 8 producers handle 72% of total Broiler meatsupply to RSA SMMEs (<200 000 broiler meats slaughtered or sold per week) handle 28%
33

34
South African broiler meat value chain consists of broiler meat farms and contract growers, Feed Companies and other input suppliers and breeders. In the secondary sector we have abattoirs, importers, exporters and retailers. There are around 48.6 million consumers with a per capita consumption of 31.83%. Production in kilograms is around 1 349 million, Consumption around 1 551 million, Imports 225 million and Export 18.7 million.

35
4. MARKETING CHANNELS FOR BROILER MEAT.
Figure 25: Marketing Channels.
Small Scale Production
Hawkers & Retailers.
Live Broiler meatMarket
Import
Commercial Production.
Abattoirs Processors and Packers
Further Processors.
Retailers Consumers
Export
From Figure 25, broiler meat production is by two sectors; viz, commercial and small scale. Live broiler meat is marketed mainly through two channels, live broiler meat market and abattoirs. Majority of broiler meat from commercial is sold through abattoirs while small scale through live broiler meat market. Live broiler meat market depends on hawkers and small retailers for distribution to customers.

Abattoirs slaughters broiler meat and sell it as carcass to processors and packers, who in turn may export, sell to retailers or further processors. Processors and packers and further processors also rely on imports for their supplies. Further processors sell to retailers for final distribution to the consumer.
36

5. EMPOWERMENT STRATEGIES BY THE INDUSTRY AND GOVERNMENT. o The Land Bank sponsors the distribution of broiler meat bulletin to
developing farmers. o Sector for Education and Training (SetaSA) sponsors training under
the National Skills Broiler Project Fund.
o Rocklands broiler meat has entered into a R20-million joint venture with BEE company Kamnandi Trading to produce 265 000 live birds every eight weeks in the Eastern Cape town of Loerie over 20 years.
o Vukanathi Broiler Project in North West is presently an out grower for
Country Bird. Country Bird provides the day old chicks, medicine, feed and the market to the project. In 2005 the venture was transformed into black employment equity (BEE) entity that required Thembani’s assistance as guarantor to secure a working capital and growth line of credit. The Vukanathi project will own 72% of the equity of the business and effectively transform the venture into a BEE entity, with a strategic partner owning 28% of this venture.
o The South African Broiler Association (SAPA) was the catalyst in the
formation of the Developing Broiler Farmers Organization (DPFO). The main objective of the DPFO is to serve as a conduit to the developing broiler farmers for information dissemination and to co-ordinate and address collective issues in the industry.
Possible market entry for SMME.
Contract growing. Empowerment purchases of existing operation’s farms by workers. Strategic partnerships – not for beginner farmers. Resource centres in the form of central distribution points that will allow farmers to organize into buyer groups or small cooperatives.
6. BARRIERS TO PARTICIPATION BY THE EMERGING SECTOR.
The transaction costs of the emerging farmers are much higher than those of their large developed counterparts in the commercial sector.
37

The availability of day-old chicks is a problem because the big producers are given preference. The long distances from the suppliers to the farms could result in high fatalities.
The lack of abattoirs/slaughter houses to market/sell dressed chickens in the formal markets. The lack of bar coding facilities and proper freezers to store dressed birds. Most retail companies look for bar coded products for traceability.
The volumes produced and their location places them at a disadvantage to supply to the retail sector. Hence many farmers sell live birds to the informal sector. Other constraints that affect the industry
• Low priced imports. • Sanitary and Phytosanitary
Standards. • Exchange rate fluctuations. • Chick Costs are high. • Feed Costs are high. • Lack of Finance as small scale
farmers do not meet the requirements set by the commercial banks.
• Lack of Health Control as state veterinarians are not trained in broiler or available when needed.
• Lack of Marketing Skills. • Lack of Technical Training. • Lack of strong Farmer
Organization, support structures and mentorship.
38

7. OPPORTUNITIES AND WEAKNESSES.
The per capita consumption increased from 19.7 kilograms in 2000 to 30.8 kilograms in 2009. If this trend continues this is an opportunity for new entrants and the growth of existing broiler farmers in the industry.
The per capita broiler meat consumption is set to increase further with the redistribution of wealth, recovery of the economy and the increase in the level of disposable income. With the redistribution of wealth the per capita income of the nation has resulted in an upward movement of individuals in the pyramid of purchasing power. This thus results in the demands changing hence individuals would include more broiler meat in their regular meals.
There are 35 producers who provide 61% of the total broiler meat market. Imports control 27% of the market. The balance 12% is being supplied by hundreds of small/emerging farmers. New entrants are free to enter but are limited in terms of capital, expertise and the availability of day-old chicks.
Another inhibiting factor to the growth of the emerging sector is the lack of abattoirs to slaughter and sell their products to the retail sector. Their volumes are too small to warrant the capital outlay for the establishment of an abattoir. Thus many emerging farmers sell their products in the informal sector as live birds.
The quality standards and bar coding are pre-requisites by most retail companies. This is thus an area that can be jointly addressed by government and the industry. This intervention could assist with the growth of the domestic supply and could ultimately reduce imports. Some farmers lack the knowledge/expertise on handling diseases on their farms.
39

8. MARKET INTELLIGENCE
8.1. Export tariffs for broiler meat. Tariffs that different importing countries applied to broiler meat originating from South Africa in 2009 are shown in Table 12. Table 12: Broiler meat export tariffs.
2009 Country Product Code Trade Regime Description Applied
Tariffs. Total Ad Valorem Equivalent Tariff (estimated)
Angola 02071100 (Fresh or chilled Broiler chicken) 02071210 (Frozen Broiler chicken)
MFN Applied MFN Applied
10.00% 10.00%
10.00% 10.00%
Democratic Republic of Congo
02071100 (Fresh or chilled Broiler chicken) 02071210 (Frozen Broiler chicken)
MFN Applied MFN Applied
10.00% 10.00%
10.00% 10.00%
Ghana 0207130000 (Fresh or chilled cuts and edible offal of fowls of the species Gallus domesticus) 0207140000 (Frozen cuts edible offal of fowls of the species Gallus domesticus)
MFN Applied MFN Applied
20.00% 20.00%
20.00% 20.00%
Mozambique 02071300 (Fresh or chilled cuts and edible offal of fowls of the species Gallus domesticus) 02071400 (Frozen cuts edible offal of fowls of the species Gallus domesticus)
Preferential tariff for South Africa Preferential tariff for South Africa
15.00% 15.00%
15.00% 15.00%
Nigeria 0207130000 (Fresh or chilled
MFN Applied 20.00% 20.00%
40

2009 Country Product Code Trade Regime Description Applied Total Ad
Tariffs. Valorem Equivalent Tariff (estimated)
cuts and edible offal of fowls of the species Gallus domesticus) 0207140000 (Frozen cuts edible offal of fowls of the species Gallus domesticus)
MFN Applied
20.00%
20.00%
Zimbabwe 02071300 (Fresh or chilled cuts and edible offal of fowls of the species Gallus domesticus) 02071400 (Frozen cuts edible offal of fowls of the species Gallus domesticus)
MFN Applied MFN Applied
40.00% 40.00%
40.00% 40.00%
Source: MacMap. Table 12 indicates that exports tariff of broiler meat exports from South Africa receives the highest tariff rate of 40% from Zimbabwe, Ghana and Nigeria apply a tariff of 20% and the lowest rate of 10% is applied by Angola and Democratic Republic of Congo. South Africa receives a preferential tariff rate of 15% when exporting to Mozambique.
8.2. Import tariffs for broiler meat. Tariffs that South Africa applied to imports of broiler meat originating from all possible countries in 2009 are shown in Table 13. Table 13: Broiler meat import tariffs
2009 Country Product Code Trade Regime Description Applied
Tariffs Total Ad Valorem Equivalent Tariff (estimated)
Argentina Australia Belgium
02071100 (fresh or chilled fowls of species Gallus domesticus, not
MFN Applied
0.00%
0.00%
41

42
2009 Country Product Code Trade Regime Description Applied
Tariffs Total Ad Valorem Equivalent Tariff (estimated)
Brazil Canada United Sates of America
cut in pieces) 02071290 (frozen fowls of species Gallus domesticus, not cut in pieces: Other) 02071300 (Fresh or chilled cuts and edible offal of fowls of the species Gallus domesticus) 02071410 (Frozen cuts edible offal of fowls of the species Gallus domesticus: Boneless cuts)
MFN Applied MFN Applied MFN Applied
27.00% 0.00% 5.00%
27.00% 0.00% 5.00%
Source: MacMap. During 2009 South Africa applied different tariff rates to different products of broiler meat. It applied a tariff rate of 0% on HS 02071100 and HS 02071300 from Argentina, Australia, Belgium, Brazil, Canada and United States of America. The same countries receive the tariff rate of 5% on HS 02071410 and 27% on HS 02071290.

9. PERFORMANCE ANALYSIS OF SOUTH AFRICAN POULTRY INDUSTRY IN 2009. Table 14: List of importing markets for the Meat & edible offal of broiler exported by South Africa in 2009. South Africa’s exports represent 0.15% of world exports for Meat & edible offal of broiler, its ranking in world’s exports is 32.
Trade Indicators
Importers Exported
value 2009, USD
thousand
Trade balance
2009 in USD thousand
Share in South
Africa's exports, %
Exported quantity
2009
Quantity unit
Unit value, (USD/unit)
Exported growth in
value between 2005-2009,
%, p.a.
Exported growth in quantity
between 2005-2009, %, p.a.
Exported growth in
value between 2008-2009,
%, p.a.
Ranking of partner
countries in world imports
Share of partner
countries in world
imports, %
Total import growth in value
of partner countries
between 2005-2009, %, p.a.
Tariff (estimated)
faced by South Africa
'World 28973 -153974 100 19124 Tons 1515 58 59 300 100 15
'Zimbabwe 21778 21778 75.2 16007 Tons 1361 168 111 1467 68 0.2 383 '40
'Mozambique 3475 3475 12 1655 Tons 2100 33 26 31 96 0.1 9 '15
'Ship stores and bunkers 1170 1170 4 478 Tons 2448 22 15 3 131 0 45
'Democratic Republic of the Congo 1013 1013 3.5 369 Tons 2745 51 22 189 47 0.3 15 '10
'Angola 418 418 1.4 214 Tons 1953 -6 -9 -35 25 0.9 25 '10
'Ghana 293 293 1 83 Tons 3530 2 13 109 43 0.4 25 '20
'Nigeria 190 190 0.7 50 Tons 3800 -7 -14 -38 '20
'Zambia 164 164 0.6 105 Tons 1562 35 126 3180 191 0 19 '12.9
'Saint Helena 139 139 0.5 56 Tons 2482 10 8 19 178 0 8
'United Arab Emirates 138 138 0.5 30 Tons 4600 64 58 -34 11 2.7 37 '5
'Mauritius 127 127 0.4 30 Tons 4233 16 19 -14 166 0 12 '0
'Madagascar 17 17 0.1 7 Tons 2429 76 '20
'Seychelles 13 13 0 28 Tons 464 20 66 -32 137 0 39 '0
'Uganda 8 8 0 1 Tons 8000 -43 202 0 89 '25
43

44
Trade Indicators
Importers Exported
value 2009, USD
thousand
Trade balance
2009 in USD thousand
Share in South
Africa's exports, %
Exported quantity
2009
Quantity unit
Unit value, (USD/unit)
Exported growth in
value between 2005-2009,
%, p.a.
Exported growth in quantity
between 2005-2009, %, p.a.
Exported growth in
value between 2008-2009,
%, p.a.
Ranking of partner
countries in world imports
Share of partner
countries in world
imports, %
Total import growth in value
of partner countries
between 2005-2009, %, p.a.
Tariff (estimated)
faced by South Africa
'Congo 6 6 0 2 Tons 3000 5 19 100 46 0.4 36 '5
'Gabon 3 3 0 1 Tons 3000 50 0.3 27 '5
'Malawi 3 3 0 2 Tons 1500 0 19 188 0 187 '10
'Burundi 2 2 0 0 Tons 214 0 '5
Source: ITC calculations based on COMTRADE statistics.

45
Table 14 shows that during 2009 South Africa exported a total of 19 124 tons of meat & edible offal of broiler at an average value of US$ 1 515/unit. The major export destinations for meat & edible offal of broiler originating from South Africa during 2009 were Zimbabwe, Mozambique, Democratic Republic of Congo, and Angola. The greatest share of South Africa’s meat & edible offal of broiler exports were exported to Zimbabwe which commanded a share of 75.2% during the year 2009 followed by Mozambique which commanded 12%. South Africa’s meat & edible offal of broiler exports increased by 58% in value and 59% in quantity between the periods 2005 and 2009. During the same period, exports for meat & edible offal of broiler to Zimbabwe remained increased by 168% in value while in quantity it increased by 111%; and exports to Mozambique increased by 23% in value while quantity increased by 26%. Between the periods 2008 and 2009, South Africa’s exports value of meat & edible offal of broiler increased by 300%. During the same period, exports value of meat & edible offal of broiler to Zimbabwe increased by 1 471% and Zambia experience the highest growth of 3 180%. This shows that Zimbabwe is the net importer of South African meat & edible offal of broiler.

46

47
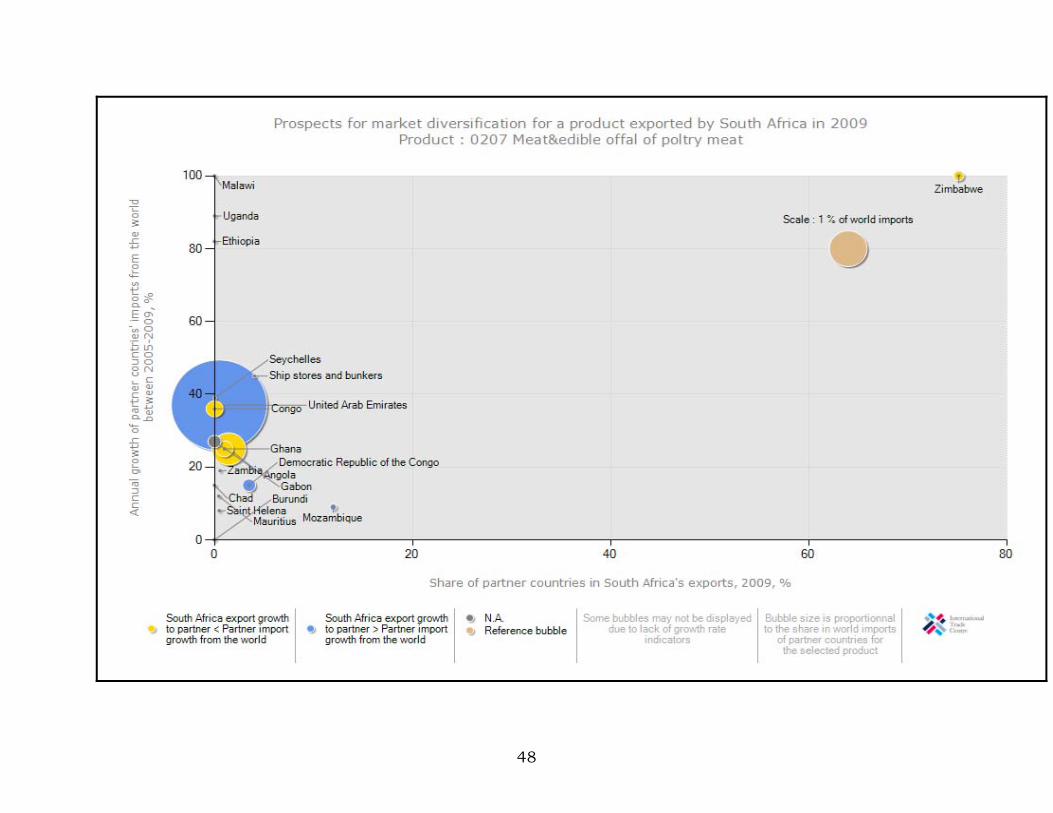
The chart illustrates that between 2005 and 2009 South Africa’s meat & edible offal of broiler exports to Ethiopia, Congo, Angola, Ghana, Seychelles and Zimbabwe were growing at a rate that is less than their import growth from the rest of the world. Further analysis shows that Ethiopia, Malawi, Chad and Angola represent losses in the dynamic markets while Zimbabwe, Congo, Ghana and Seychelles represent gains in the dynamic markets of South African export for meat & edible offal of poultry. During the same period, South Africa’s meat & edible offal of broiler exports to United Arab Emirates, Democratic Republic of Congo, Zambia, Mozambique, Mauritius and Saint Helena were growing at a rate that is greater than their imports from the rest of the world. Further analysis shows that United Arab Emirates and Zambia represents gains in the dynamic markets while Mozambique, Mauritius and Saint Helena represent gains in the declining markets of South African export for meat & edible offal of poultry. Generally the country which has the most growth in demand of South African meat & edible offal poultry is Zimbabwe with annual import growth of 383%, followed by Malawi with187%
48

49
The chart above shows the prospects for market diversification for meat & edible offal of broiler exports by South Africa in 2009. The analysis of the results as shown on the figure above shows that Zimbabwe commanded the greatest shares (75.17%) of South Africa’s meat & edible offal of broiler exports during the year 2009, but the figure still shows that Zimbabwe’s imports growth from the world is greater than South Africa exports to Zimbabwe. If South Africa is to diversify its meat & edible offal of broiler exports, the most attractive market for South Africa to penetrate in is Malawi. It gas a market share of 0.01% of South Africa’s meat & edible offal of broiler meat and its imports growth is 187%. Another attractive market, although small is Uganda due to its import growth of 89% per annum.

Table 14: List of supplying markets for Meat & edible offal of broiler imported by South Africa in 2009.
50
South Africa’s imports represent 0.98% of world’s imports of Meat & edible offal of broiler, its ranking in world’s imports is 23.
Trade Indicators
Exporters Imported
value 2009, USD
thousand
Trade balance
2009 in USD thousand
Share in South
Africa's imports, %
Imported quantity
2009
Quantity unit
Unit value, (USD/unit)
Imported growth in
value between 2005-2009, %,
p.a.
Imported growth in quantity
between 2005-2009, %, p.a.
Imported growth in
value between 2008-2009, %,
p.a.
Ranking of partner
countries in world exports
Share of partner
countries in world exports,
%
Total export growth in value of partner countries between 2005-2009, %, p.a.
Tariff (estimated) applied by
South Africa
'World 182947 -153974 100 230695 Tons 793 5 -1 -4 100 14
'Brazil 132785 -132785 72.6 165584 Tons 802 4 -2 -7 1 26.4 15 '7.9
'Argentina 21065 -21065 11.5 31365 Tons 672 27 22 15 13 1.4 30 '7.9
'Canada 10752 -10752 5.9 11793 Tons 912 -13 -24 47 14 1.2 18 '7.6
'Australia 8080 -8080 4.4 9534 Tons 847 15 4 -18 31 0.2 21 '7.6
'USA 5575 -5575 3 6122 Tons 911 21 22 -8 2 20.6 16 '7.6
'Belgium 1887 -1887 1 3079 Tons 613 29 24 -47 6 4.3 8 '1.7
'United Kingdom 973 -973 0.5 1081 Tons 900 -43 -53 1578 10 1.9 2 '1.7
'Israel 696 -696 0.4 502 Tons 1386 -5 -24 3 42 0.1 359 '7.6
'Chile 454 -454 0.2 784 Tons 579 1035 16 1.1 11 '7.6
'France 340 -340 0.2 321 Tons 1059 -23 -33 -25 4 6.3 5 '1.7
'Ireland 160 -160 0.1 283 Tons 565 5 83 5233 21 0.5 -6 '1.7
'New Zealand 55 -55 0 69 Tons 797 0 29 44 0.1 15 '7.9
'Iran (Islamic Republic of) 53 -53 0 24 Tons 2208 24 -17 80 0 -58 '7.6
'Singapore 33 -33 0 75 Tons 440 41 0.1 0 '9.6
'Netherlands 23 -23 0 27 Tons 852 -40 -40 -83 3 9.5 11 '1.7
'Denmark 8 -8 0 26 Tons 308 -62 -51 -93 15 1.2 0 '1.7
'Cayman Islands 7 -7 0 26 Tons 269 -50 -47 124 0 -51 '9
Sources: ITC calculations based on COMTRADE statistics.

51
Table 14 shows that during 2009 South Africa imported a total of 230 695 tons of meat & edible offal of broiler at an average value of US$ 793/unit. The major origins for meat & edible offal of broiler imported by South Africa during 2009 were Brazil, Argentina, Canada, Australia and United States of America. The greatest share of South African meat & edible offal of broiler imports were from Brazil which commanded 72.6% during the year 2009. South Africa’s meat & edible offal of broiler imports increased by 5% in value and decreased by 4% in quantity between the periods 2005 and 2009. During the same period, imports of meat & edible offal of broiler from Brazil also increased by 4% in value and decreased by 2% in quantity while imports from Argentina increased by 27% in value and 22% in quantity. Between the periods 2008 and 2009 South Africa’s imports for meat & edible offal of broiler decreased by 4% in value. During the same period, imports of meat & edible offal of broiler from Brazil decreased by 7% and Argentina increased by 15 in value. In addition, Ireland experienced the highest import growth value of 5 233% followed by United Kingdom (1 578%) and Chile (1 035%) per annum during 2008 and 2009.

52

The chart illustrates that between 2005 and 2009 South Africa’s meat & edible offal of broiler imports from Argentina, Brazil, Canada, France, Netherlands, United Kingdom, Denmark and New Zealand were growing at a rate that is less than their export growth to the rest of the world. During the same period, South Africa’s meat & edible offal of broiler imports from United States of America, Belgium, Iran and Ireland were growing at a rate that is greater than their exports to the rest of the world. Generally the most competitive market is Brazil followed by United States of America. Their share in the world market of meat & edible offal of broiler is 26.4% and 20.6% respectively and together they constitute a total of 47% of the world‘s meat & edible offal of broiler.
53

54

The chart above shows the prospects for diversification of suppliers for meat & edible offal of broiler imports by South Africa in 2009. The analysis of the results as shown on the figure shows that Brazil commanded the greatest shares (72.58%) in South Africa’s meat & edible offal of broiler imports during the year 2009 but it still shows that Brazil’s exports to the world is greater that South Africa’s imports from Brazil. If South Africa is to diversify its meat & edible offal of broiler imports Brazil remains a traditional supplier, however other possible suppliers can be Israel because its export annual growth is 359% and the chart shows that Israel export more of its meat & edible offal of broiler to the world than to South Africa. Therefore, Israel stands a chance to be South Africa’s supplier of meat & edible offal of broiler.
55

10. ACKNOWLEDGEMENTS 1. Astral Foods Limited
Tel: 012 347 5077 Fax: 012 347 5308 www.astralfoods.co.za
2. Competition commission
Tel: 012 394 3300 Fax: 012 394 0169 www.comptrib.co.za
3. Agricultural Statistics
Tel: 012 319 8453 Fax: 012 319 8031 www.daff.gov.za.
4. Market Access Map www.macmap.org.
5. National Agricultural Marketing
Council. Chicken Meat Industry Overview Research Report (2007 – 03) Tel: 012 341 1115 www.namc.co.za
6. Broiler Site www.thepoultrysite.com
7. Quantec Easydata
www.quantec.co.za
8. Rainbow P.O. Box 2734 Westville, 3630 Tel: 031 242 8500 Fax: 031 242 8890 www.rainbowchickens.co.za
9. South African Poultry
Association (SAPA), Zach Coetzee P.O. Box 1192 Honeydew, 2040 Tel: 011-795 2051 Fax: 011-795 3180 www.sapa.org.za.
10. TradeMap www.trademap.org.
11. Tydstroom
Klipheuwel Road Durbanville, 7550 Tel: 021 975 0162 Fax: 021 976 8987 www.tydstroom.co.za
56

Disclaimer: This document and its contents have been compiled by the Department of Agriculture, forestry and fisheries for the purpose of detailing the broiler meat industry. The views expressed in this document are those of the Department of Agriculture, forestry and fisheries with regard to agricultural industry, unless otherwise stated and, therefore the Department of Agriculture, forestry and fisheries does not accept responsibility for any errors in such information and anyone acting on such information does so entirely at his or her own risk.
57