3 do the media shape parties’ agenda preferences?
TRANSCRIPT

123456789101112131415161718192021222324252627282930313233343536373839404142434445
123456789101112131415161718192021222324252627282930313233343536373839404142434445
3 Do the media shape parties’ agenda preferences?An empirical study of party manifestos in Belgium (1987–2003)
Stefaan Walgrave and Jonas Lefevere
Whether mass media affects public policy and political decision making still is an unanswered question. One of the reasons we do not have a conclusive answer yet is that the media’s impact on the public policy simply is too broad a question to be answered. It can only be dealt with when split up into small and theoreti-cally and empirically manageable subquestions: which media, which politics, and what impact? One of the most straightforward ways of defining media power is to consider the media’s role in setting the political agenda, that is, the array of topics that receive attention in a given political system. But even in this distinct sub- domain, the available studies contradict each other: some claim the media do matter for the political agenda, others disagree and argue that the media is entirely tangential to the agenda- setting process (Walgrave and van Aelst 2006). The dependent variable – the political agenda affected by the media – has, in most studies, been the official and institutional agendas of parliament, govern-ment or the president. Studies sought to find out whether, for example, oral ques-tions and interpellations in parliament (Soroka 2002a; Walgrave et al. 2007); governmental decisions (Walgrave et al. 2007); or presidential statements (Bartels 1996; Edwards and Wood 1999; Gilberg et al. 1980) are affected by preceding media coverage. The central argument this paper makes is that focus-ing on these institutional political agendas is only half of the story. Media might on the one hand directly affect the political priorities of democracy’s primary institutions such as parliament or government. Yet, media coverage might on the other hand also affect the agenda of democracy’s primary actors which are in most democracies political parties. The aim of this paper is to scrutinize whether political parties’ agenda preferences are affected by preceding media coverage. In many democracies, parties’ issue priorities affect actual public policies. Parties make pledges in their manifestos and when they are elected in office they tend to carry out those pledges. Klingemann and his colleagues (1994) demon-strated, based on longitudinal evidence covering 40 years and ten democracies, that party manifestos matter for policy making. Parties keep their manifesto promises: when parties devote attention to a certain issue in their manifesto, chances are high that government spending on policies related to that issue will go up in the following legislature. Others have shown, in single country studies, that not only budgeting but also legislation is affected by electoral program
599_03_Public Policy.indd 44 20/11/09 15:58:27
PROOF
123456789101112131415161718192021222324252627282930313233343536373839404142434445
Do the media shape agenda preferences? 45
123456789101112131415161718192021222324252627282930313233343536373839404142434445
promises (Budge and Bara 2001; Stimson et al.1995; Walgrave et al.2006). Our point is that party manifestos matter; they affect the political agenda and steer policy attention towards certain issues and away from other issues. Party mani-festos are good ‘predictions’ of subsequent public policy. Consequently, media coverage may not only directly affect the priorities of democracy’s main institutions – the legislative and executive branch of govern-ment – but may also indirectly, via political parties, matter for political agenda- setting. The mass media set the agenda of the political parties, the political parties in turn set the policy agenda. Hence, examining whether media coverage affects party programs is a useful, albeit indirect, way to tackle whether mass media affect political decision making and public policy. However, we note that party manifestos cannot be equated with actual public policy. At the heart of this book lays the distinction between media’s impact on the policy debate on the one hand and on policy institutions on the other hand. Party manifestos sit some-where in between: they are not pure discourse as they encapsulate the main polit-ical actors’ official policy pledges; they are not real political institutions that can issue binding decisions either. This chapter considers the case of Belgium, a small consociational demo-cracy. Belgium is the prime example of a partitocracy dominated by political parties (de Winter et al. 1996; de Winter and Dumont 2003). Party manifestos, hence, are important policy documents in Belgium. Belgian parties are the main players in the polity – issue entrepreneurs and veto players at the same time – determining government policy. If we effectively find the media to impact party programs in Belgium this would almost certainly mean that the media indirectly determine public policy. Yet, Belgium also is a tough case. Parties are closed mass organizations exclusively associated with a host of befriended social organ-izations in a system called ‘pillarization’ or segmented pluralism (Lorwin 1971). Parties do not have too much leeway to react freely on media cues and to change their issue priority as they are closely connected to organizations who try to influence their priorities. In the period under study, though, the pillars were grad-ually disintegrating and consequently we expect the grip of organizations on their befriended party programs to have diminished. In this chapter, first, we review the existing evidence about how party pro-grams come about and we formulate five explorative hypotheses. Next, we present our evidence: party programs covering five national elections in Belgium between 1987 and 2003. Then, we turn to our results and empirically assess whether the media effectively affect parties’ priorities. We conclude with sum-marizing our results and sketching avenues for further research.
What affects party program priorities?Party manifestos have received extensive scholarly attention. Doubtless, the most important stream of research has been produced by the Manifesto Research Group (MRG) who has systematically focused on party manifestos in 25 demo-cracies for more than half a decade (Budge et al. 2001). MRG scholars have
599_03_Public Policy.indd 45 20/11/09 15:58:28
PROOF

46 S. Walgrave and J. Lefevere
123456789101112131415161718192021222324252627282930313233343536373839404142434445
123456789101112131415161718192021222324252627282930313233343536373839404142434445
undertaken ample research on the left–right dimension in party programs, on the link between programs and electors, on the policy consequences of party pro-grams, on policy equilibria, on government composition, on the polarization of party systems etc. (Budge and Bara 2001). Remarkably, the primary question – where party programs come from in the first place – has been largely neglected. The origins of party manifestos did not receive a lot of scholarly attention. We know relatively little about where party manifestos come from, how they are drafted and, especially, how and why party programs change over time (Rohr-schneider 2002). This implies that we do have access to ready hypotheses about to what extent and under which circumstances party manifestos are affected by preceding media coverage. Our research question on the media’s impact on party manifestos can be reframed more general in terms of party program change (see also: Walgrave and Nuytemans 2009). Only if party programs change can they be determined by media coverage. As circumstances change – new demands, new issues, new popular preferences, and new challenges turn up – party manifestos are expected to follow and to change too. These new demands, issues, and prefer-ences are partially conveyed to parties via the media. Electoral competition should lead to constant adaptation of parties’ preferences, as Downs (1957) has argued. The maximum of votes lies in the middle of the ideological spectrum, around the median voter. Parties try to maximize votes by trying to get as close as possible to the media voter. Other scholars maintained that parties only change their manifesto when they see elections as competitive and they need extra votes to win. If winning or losing is perceived as being sure, they do not need to win votes and, thus, will not adapt their programmatic preferences (Robertson 1976). Budge, in contrast, argued that parties have no, or only imperfect, information about whether they will win or lose the election, or about the median voter’s position, and thus they move little or incrementally because they do not want to risk losing the votes they have (Budge 1994). Hence, Budge, in contrast to Downs, expects no adaptation but hardly changea-ble and incremental party manifestos. Empirical research tends to confirm Budge’s argument: party preferences are quite stable. Parties’ programmatic left–right positions, for example, do change but big changes are rather uncommon (Budge and Bara 2001; Budge and Klin-gemann 2001; Volkens and Klingemann 2002). Parties do not change opinion all the time and they do not haphazardly jump from one issue to another; they hardly leapfrog each other. Budge and Bara found, regarding some compound measures of party position, in the 18 countries under study between 1945 and 1998, that party positions remained remarkably stable ‘which may tell one some-thing about the rigidity of party ideology and their lack of responsiveness either to external problems or electoral concerns’ (Budge and Bara 2001: 53). If parties do not adapt their programs and hardly change, the media’s impact on the party manifestos, obviously, cannot be large. But sometimes parties do change their program, sometimes even dramatically (Walgrave and Nuytemans 2009). In those instances, does media coverage then play a role?
599_03_Public Policy.indd 46 20/11/09 15:58:28
PROOF

123456789101112131415161718192021222324252627282930313233343536373839404142434445
Do the media shape agenda preferences? 47
123456789101112131415161718192021222324252627282930313233343536373839404142434445
Media coverage probably plays a role because parties consider the media to reflect the issue priorities of the public. Parties may not react on media coverage per se but on their perception of public opinion as reflected by media coverage; this ‘proxy effect’ is a well- known mechanism in the political agenda- setting literature (Cook et al. 1983; Kennamer 1992; Walgrave and van Aelst 2006). So, the general argument goes as follows: parties adapt their party program to gain votes; via this adaptation they try to get as close as possible to the median voter; they find out about the position of the median voter via mass media coverage. Hence: the more media cover a certain issue the more parties will consider this issue as being an important issue for the public at large and, consequently, the more attention they will devote to that issue in their party program. This very general hypothesis must, of course, be qualified and specified. We expect not all parties to react to media coverage to the same extent. The only study we found that systematically examined the media’s impact on the content of the party manifestos and the government agreement is a study by Rihoux et al. (2005). They found that, in Belgium in the 1990s, 14 percent of the issue saliency variation in party programs could be attributed to preceding media coverage (Rihoux et al. 2005: 137–139). Their study also established interesting differences between parties. The Christian- Democrat center parties’ programs were more affected by the preceding media coverage than the manifestos of the socialist and ecologist parties. Also, they found differences between the two elections they examined with more impact of the media on the 1995 manifestos than on the 1999 manifestos. What tentative hypotheses can we put forward? Janda and colleagues (1995) argue that one of the main drivers of programmatic renewal is electoral success or failure. One can expect that parties that lost the previous elections tend to change their program more dramatically than parties that won the previous elect-oral competition. Electoral loss often severely shakes parties: party leaders resign, parties reorganize their structures, and the party reconsiders its party manifesto. This is precisely what Janda et al. (1995) found in their analysis of party manifesto change in Britain, Germany and the United States. Looking for cues about what to change in their failing program, parties may look at media coverage to see what the public cares about and change their issue emphases accordingly. Manifestos of parties that lost the previous elections are more affected by media coverage than parties that won the previous elections (H1). Klingemann and colleagues contend that opposition parties more than gov-ernment parties have strong reasons to draft innovative and alternative programs. As they have only their program to attract attention and not their deeds, manifes-tos of opposition parties tend to be more changeable than government parties’ manifestos trying to seek maximization of votes (Klingemann et al. 1994). Moreover, incumbents run the risk of being confronted afterwards with their pledges while opposition parties cannot be held accountable for the fact that their program has not been carried out. To be responsive, opposition parties more than government parties draw on media coverage to nurture their program. Research has shown, similarly, that opposition MPs’ parliamentary action is more affected
599_03_Public Policy.indd 47 20/11/09 15:58:28
PROOF

48 S. Walgrave and J. Lefevere
123456789101112131415161718192021222324252627282930313233343536373839404142434445
123456789101112131415161718192021222324252627282930313233343536373839404142434445
by media coverage than government MPs’ initiatives (Vliegenthart and Wal-grave 2009; Walgrave et al. 2007). The second hypothesis, thus, states that opposition parties’ issue priorities as reflected in their manifesto are more affected by mass media coverage than government parties’ programs (H2). Apart from their government or opposition position, parties’ ideological posi-tion may play a role too. Centre parties’ ideological positions are less outspoken; they are positioned less clearly on the deep cleavages dividing societies than more extreme parties. Often, they switch government partners and alternate left- wing with right- wing government partners. Their ideological maneuvering space is probably more extended than parties positioned at the extremes of the ideo-logical spectrum (see Rihoux et al. 2005). This allows centre parties to adapt more easily and to follow media cues more closely (Klingemann et al. 1994). Parties having a central ideological position are more affected by media cover-age when drafting their program than ideologically extreme parties (H3). The agenda- setting literature established that there are quite some differences across issues in the way political actors react on coverage. Whether issues are ‘prominent’, ‘sensational’ or ‘governmental’ makes a difference, as Soroka (2002b) has shown. Law and order issues and environmental issues are most typ-ically ‘sensational’ and we expect the media to affect the party programs more when it comes to these issues than to political and social issues that are ‘promi-nent’ or even ‘governmental’. Hence, we hypothesize that issues matter and that the agenda- setting impact of the media will differ. For some issues mass media coverage affects the party manifestos more than for other issues (H4). Finally, the political agenda- setting literature states that political actors tend to react quickly on media attention. As the issue attention cycle from both public and media tends to be short (Downs 1972) it is not in political actors’ interest to wait before reacting. They react immediately or they do not react at all (Wal-grave and van Aelst 2006). On the one hand, as parties want to display their responsiveness, we expect party manifestos to obey these same mechanisms of immediacy. On the other hand, party manifestos are sometimes well- wrought pieces of work designed to have some staying power; they contain a party’s plans for the whole next legislature and this is not reconcilable with an imme-diate and symbolic reaction on media cues. A crucial question, of course is when precisely parties draft their program. Drafting the program might be a sustained process stretching out for months or it may be a clenched exercise taking just a few weeks. This is important as it determines the media coverage to take into account. The question thus remains: Do parties incorporate in their party mani-festo media coverage during a longer period relying on their long- term memory or do they just attend to the short time period when they are actually drafting their program? As we have no clear clue here, our hypothesis can only be general. Parties’ electoral manifestos are differentially affected by long- term and short- term media coverage (H5). Our aim is to test media’s independent impact on party programs. Since party programs, like many political documents or activities, are often stable and char-acterized by inertia and path dependency, we will control for parties’ own
599_03_Public Policy.indd 48 20/11/09 15:58:28
PROOF

123456789101112131415161718192021222324252627282930313233343536373839404142434445
Do the media shape agenda preferences? 49
123456789101112131415161718192021222324252627282930313233343536373839404142434445
programmatic past. Consequently, we will not only assess whether media cover-age merely affects the attention for issues in the manifestos but also whether media coverage affects the change in parties’ issue attention from one manifesto to the next.
Data and methodsOur study focuses on the 1987–2003 period. In this period, Belgium counted ten major parliamentary parties – we omitted parties that held seats in parliament during only a small fraction of the research period. In the 18-year research period five general elections were organized. So, we consider the 1987, 1991, 1995, 1999, and 2003 national elections and party manifestos. Party manifestos were carefully encoded (quasi)sentence per (quasi)sentence following the methodol-ogy devised by the MRG (Budge et al. 2001). However, we did not rely on the 53-code system as developed by MRG but on a much more detailed issue cat-egorization system drawing on 141 different issue codes (for more details, see: Walgrave et al. 2007). Not only manifestos but also the mass media were meas-ured drawing on the same codebook. The mass media database consists of two separate parts. National media do not exist in Belgium: both media- systems are completely separate with (Dutch- speaking) Flemings only reading Flemish newspapers and watching Flemish tel-evision and French- speaking people doing the same with their media. Therefore, for the core 1991–2000 period including three of the five elections covered here, we take into account French- speaking as well as Flemish media, and code both print and broadcast media in both regions. In Flanders, our media dataset for this period contains three Flemish newspapers, tabloids and broadsheets with differ-ent partisan leanings (De Standaard, De Morgen and Het Laatste Nieuws), and two main television channels: one public service broadcasting (TV1); and the other commercially run (VTM). For the newspapers, no indexes were available and we consequently used actual newspaper copies. We coded all front- page newspaper stories, with exception of the newspapers that appeared on Tuesdays and Thursdays, on a daily basis. The main news programs in prime time (7 p.m.) of the two main national television channels TV1 and VTM were coded on a daily basis. For the Walloon media, we undertook a comparable effort, also com-bining newspapers with TV news. The newspapers we coded are Le Soir and La Libre Belgique, both broadsheets but one with a more leftist and the other one with a more conservative leaning. Just as in Flanders we focused on the two main news channels, RTBF and RTL- TV, the first a public channel and the latter a commercial channel. Taken together, the Flemish and French- speaking media database contains 180,265 news items (to be precise 113,658 TV items and 66,607 newspaper items). For the 2003 manifestos, we do not have at our disposal such detailed preced-ing mass media measures. We only have – thanks to the Flemish Electronic News Archive (see ENA website) – an extensive measure of the issue salience of the coverage on the main evening news on the Flemish public and commercial
599_03_Public Policy.indd 49 20/11/09 15:58:28
PROOF
50 S. Walgrave and J. Lefevere
123456789101112131415161718192021222324252627282930313233343536373839404142434445
123456789101112131415161718192021222324252627282930313233343536373839404142434445
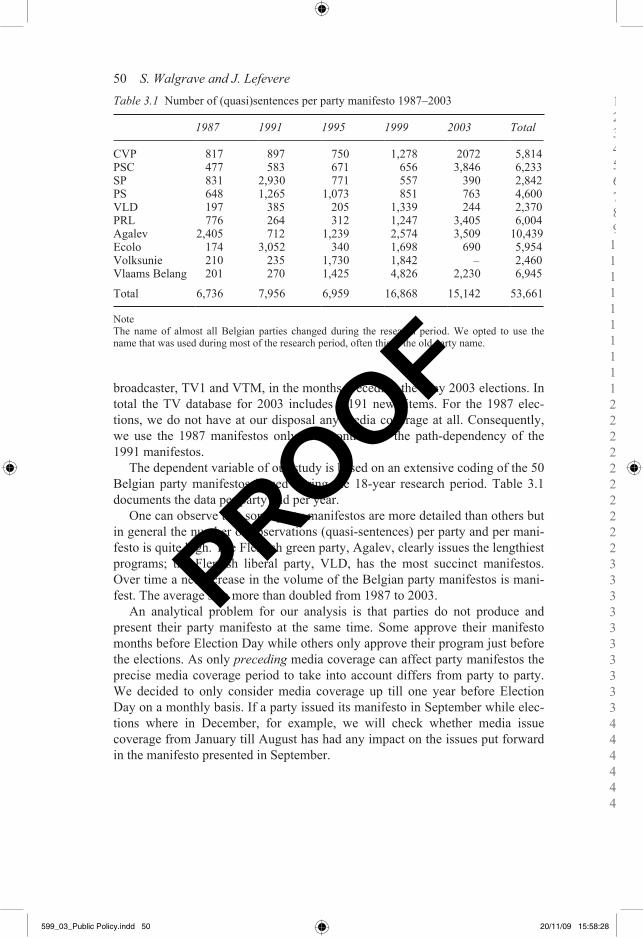
broadcaster, TV1 and VTM, in the months preceding the May 2003 elections. In total the TV database for 2003 includes 7,191 news items. For the 1987 elec-tions, we do not have at our disposal any media coverage at all. Consequently, we use the 1987 manifestos only as a control for the path- dependency of the 1991 manifestos. The dependent variable of our study is based on an extensive coding of the 50 Belgian party manifestos issued during the 18-year research period. Table 3.1 documents the data per party and per year. One can observe that some party manifestos are more detailed than others but in general the number of observations (quasi- sentences) per party and per mani-festo is quite high. The Flemish green party, Agalev, clearly issues the lengthiest programs; the Flemish liberal party, VLD, has the most succinct manifestos. Over time a net increase in the volume of the Belgian party manifestos is mani-fest. The average size more than doubled from 1987 to 2003. An analytical problem for our analysis is that parties do not produce and present their party manifesto at the same time. Some approve their manifesto months before Election Day while others only approve their program just before the elections. As only preceding media coverage can affect party manifestos the precise media coverage period to take into account differs from party to party. We decided to only consider media coverage up till one year before Election Day on a monthly basis. If a party issued its manifesto in September while elec-tions where in December, for example, we will check whether media issue coverage from January till August has had any impact on the issues put forward in the manifesto presented in September.
Table 3.1 Number of (quasi)sentences per party manifesto 1987–2003
1987 1991 1995 1999 2003 Total
CVP 817 897 750 1,278 2072 5,814PSC 477 583 671 656 3,846 6,233SP 831 2,930 771 557 390 2,842PS 648 1,265 1,073 851 763 4,600VLD 197 385 205 1,339 244 2,370PRL 776 264 312 1,247 3,405 6,004Agalev 2,405 712 1,239 2,574 3,509 10,439Ecolo 174 3,052 340 1,698 690 5,954Volksunie 210 235 1,730 1,842 – 2,460Vlaams Belang 201 270 1,425 4,826 2,230 6,945
Total 6,736 7,956 6,959 16,868 15,142 53,661
NoteThe name of almost all Belgian parties changed during the research period. We opted to use the name that was used during most of the research period, often this is the old party name.
599_03_Public Policy.indd 50 20/11/09 15:58:28
PROOF

123456789101112131415161718192021222324252627282930313233343536373839404142434445
Do the media shape agenda preferences? 51
123456789101112131415161718192021222324252627282930313233343536373839404142434445
Analyses and results
General results
As a first step, we calculate simple Pearson’s correlations between party mani-festos and preceding media coverage for four aggregated party manifestos of all parties (1991, 1995, 1995, and 1999). In this explorative phase, we do not distin-guish between elections, time periods, issues, losing or winning parties etc. Many associations are significant. This means that there is, at least statisti-cally, a relation between parties’ issue attention and the media coverage for these issues in the preceding months. This suggests that the media indeed affect party programs. Correlations are most of the time modest, however. There are differ-ences between parties and media outlets which we regrouped according to lan-guage and type. French- speaking parties seem to be systematically less affected by media coverage than Dutch- speaking parties (average correlation of 0.64 compared to 0.106). Most affected by media coverage are the programs of the Christian- Democrat CVP (0.130) and the extreme- right party Vlaams Belang (0.131). Least affected by media coverage are the programs of the French- speaking socialist party PS (0.059). Comparing the TV and newspaper coeffi-cients yields a more or less consistent picture. Both French- speaking and Flemish party manifestos seem to be more affected by newspaper coverage than by TV coverage. This is in line with earlier studies by Walgrave and colleagues (2008) showing that political actors react more to newspapers than to TV. The least influential media clearly are the Dutch- speaking TV- stations TV1 and VTM, both among French- speaking and Flemish parties. If we run analyses ‘predicting’ a certain party manifesto’s issue attention based on the same party’s previous manifesto we come to very high autocorrela-tions (systematically +0.60). This means that party programs are highly path- dependent. There is a lot of continuity in party programs; parties do not change issue emphasis frequently or strongly. The consequences are obvious: there is little variance left over to be explained by external factors like the media or changing real world situations. Media’s impact on party programs can only be modest as manifestos are largely determined by their own past (that past might, in turn, be partially determined by past media attention).
Testing the hypotheses
We proceed with testing our five explorative hypotheses one by one. For each hypothesis we present analyses. First, we always correlate party programs’ level of proportional attention for issues with media’s level of proportional attention for the same issues in the preceding months. Second, we correlate party pro-grams’ attention change for issues with media coverage’s attention change for the same issues in the preceding months. This latter procedure controls for path- dependency; that is: programs being determined by their own past.
599_03_Public Policy.indd 51 20/11/09 15:58:28
PROOF

123456789101112131415161718192021222324252627282930313233343536373839404142434445
123456789101112131415161718192021222324252627282930313233343536373839404142434445Ta
ble
3.2
Cor
rela
tion
(Pea
rson
and
sign
ifica
nce)
of p
arty
pro
gram
issu
e at
tent
ion
(%) a
nd p
rece
ding
med
ia is
sue
cove
rage
(%) (
1987
–200
3)
Flem
ish
tele
visi
onFl
emis
h ne
wsp
aper
sFl
emis
h m
edia
Fren
ch
tele
visi
onFr
ench
ne
wsp
aper
sFr
ench
med
iaAv
erag
e
Flem
ish
part
ies
CV
P0.
099*
**0.
148*
**0.
127*
**0.
123*
**0.
148*
**0.
137*
**0.
130
SP0.
084*
**0.
111*
**0.
119*
**0.
094*
**0.
107*
**0.
105*
**0.
103
VLD
0.05
3**
0.08
8***
0.08
9***
0.08
1***
0.10
6***
0.10
2***
0.08
7A
gale
v0.
067*
**0.
056*
**0.
085*
**0.
059*
**0.
066*
**0.
081*
**0.
069
Vol
ksun
ie0.
088*
**0.
141*
**0.
114*
**0.
095*
**0.
133*
**0.
112*
**0.
114
Vla
ams B
lok
0.10
4***
0.14
3***
0.15
2***
0.11
3***
0.13
6***
0.13
8***
0.13
1
Ave
rage
0.08
30.
115
0.11
40.
094
0.11
60.
113
0.10
6
Fren
ch p
artie
sPS
C0.
010
0.06
7***
0.04
7**
0.09
2***
0.09
1***
0.09
9***
0.06
8PS
0.02
70.
072*
**0.
055*
*0.
064*
**0.
069*
**0.
066*
**0.
059
PRL
0.03
30.
081*
**0.
066*
**0.
052*
*0.
071*
**0.
063*
**0.
061
Ecol
o0.
027
0.09
6***
0.05
4**
0.06
6***
0.09
1***
0.08
1***
0.06
9
Ave
rage
0.02
40.
079
0.05
60.
069
0.08
10.
077
0.06
4
Not
eN
dep
ends
on
anal
ysis
: ran
ges f
rom
2,9
61 to
4,9
35. S
igni
fican
ce: *
**p
< .0
01; *
*p <
.01
599_03_Public Policy.indd 52 20/11/09 15:58:28
PROOF

123456789101112131415161718192021222324252627282930313233343536373839404142434445
Do the media shape agenda preferences? 53
123456789101112131415161718192021222324252627282930313233343536373839404142434445
Electoral success or failure
Table 3.3 tells us that there is no systematic difference between parties that won and parties that lost the previous elections. The first hypotheses that especially losing parties would adopt media cues must therefore be rejected. For both elec-tions (1995–1999) there are even fairly clear signs of the exact opposite pattern: winning parties are slightly more adaptive to media cues than losing parties. This opposite pattern is apparent both among the Flemish as among the French- speaking parties alike (not shown in table). Losing elections clearly does not inspire parties to take media attention into consideration more carefully. Of course, adapting to media cues might have been what made the winning parties successful in the first place. So if there is some continuity in parties’ behavior it might be the case that parties who gained votes thanks to their adaptability to media cues continue to do so and persist in their winning strategy. Losing parties would then follow the opposite pattern and stick to the losing non- adaptive strategy. Table 3.3 also contains the analyses of the changes in coverage and program-matic attention. Patterns are unclear. Often, we find negative correlations. This means that when media coverage for an issue goes up attention for that issue in the subsequent party programs goes down, and vice versa. This is, of course, dif-ficult to explain. For 1999 however, there seems to be an interesting consistent pattern emerging. Parties that lost votes at the previous elections change their party manifesto in the opposite direction than media coverage change. This opposite pattern is entirely absent among the winning parties. Again this seems to suggest that losing parties do not adapt to media cues. Even the opposite seems to be true to some extent. Parties that have lost the previous elections adapt their program by attributing less attention to issues that gained more atten-tion in the media. This non- adaptive strategy may lead to more electoral defeats.
Opposition and government parties
Table 3.4 seems to confirm the hypothesis that opposition parties take media coverage more into account than government parties when drafting their party manifestos. This seems to be a general tendency that applies both to the 1995 and 1999 elections. Except for a single case (1995, French TV), all coefficients tapping the correlation between media and party manifestos are larger for opposition than for government parties. Most telling is that there often is a negat-ive and significant relationship between party manifesto change and media change and that this only applies to the government parties, never to the opposi-tion parties. When government parties change their program compared to their previous program they even move in the opposite direction than the media; their party manifesto tends to drift away from media coverage instead of getting closer to the media agenda.
599_03_Public Policy.indd 53 20/11/09 15:58:28
PROOF

123456789101112131415161718192021222324252627282930313233343536373839404142434445
123456789101112131415161718192021222324252627282930313233343536373839404142434445Ta
ble
3.3
Cor
rela
tions
bet
wee
n w
inni
ng v
ersu
s lo
sing
par
ties’
(pr
evio
us e
lect
ions
) is
sue
atte
ntio
n an
d pr
eced
ing
issu
e at
tent
ion
in t
he m
edia
(N
= 16
92) Fl
emis
h m
edia
Fren
ch m
edia
Flem
ish
new
spap
ers
Fren
ch
new
spap
ers
Flem
ish
te
levi
sion
Fren
ch
tele
visi
onAv
erag
e
Atte
ntio
n le
vel 1
995
man
ifest
osW
inni
ng p
artie
s0.
117*
*0.
125*
*0.
095*
*0.
133*
*0.
157*
*0.
109*
*0.
123
Losi
ng p
artie
s0.
122*
*0.
115*
*0.
120*
*0.
111*
*0.
140*
*0.
084*
*0.
115
Atte
ntio
n ch
ange
199
5 m
anife
stos
Win
ning
par
ties
−0.0
65**
−0.0
42−0
.077
**0.
019
0.00
80.
015
−0.0
24Lo
sing
par
ties
0.00
90.
034
−0.0
23−0
.029
−0.0
04−0
.046
*−0
.010
Atte
ntio
n le
vel 1
999
man
ifest
osW
inni
ng p
artie
s 0.
131*
*0.
137*
*0.
110*
*0.
134*
*0.
132*
*0.
119*
*0.
127
Losi
ng p
artie
s0.
046
0.05
9*0.
023
0.06
8**
0.08
4**
0.04
50.
054
Atte
ntio
n ch
ange
199
9 m
anife
stos
Win
ning
par
ties
0.04
20.
044
0.03
3−0
.025
−0.0
36−0
.012
0.00
8Lo
sing
par
ties
−0.1
51**
−0.1
37**
−0.1
46**
−0.1
25**
−0.0
72**
−0.1
27**
−0.1
26
599_03_Public Policy.indd 54 20/11/09 15:58:28
PROOF

123456789101112131415161718192021222324252627282930313233343536373839404142434445
123456789101112131415161718192021222324252627282930313233343536373839404142434445 Ta
ble
3.4
Cor
rela
tions
bet
wee
n go
vern
men
t ver
sus
oppo
sitio
n pa
rties
’ is
sue
atte
ntio
n an
d pr
eced
ing
(6–1
2 m
onth
s) is
sue
atte
ntio
n in
the
med
ia
(N =
846)
Flem
ish
med
iaFr
ench
med
iaFl
emis
h ne
wsp
aper
sFr
ench
ne
wsp
aper
sFl
emis
h
tele
visi
onFr
ench
te
levi
sion
Aver
age
Atte
ntio
n le
vel 1
995
man
ifest
osG
over
nmen
t par
ties
0.14
6**
0.15
5**
0.12
0**
0.14
2**
0.15
2**
0.12
6**
0.14
0O
ppos
ition
par
ties
0.15
4**
0.15
9**
0.13
2**
0.14
1**
0.15
9**
0.11
9**
0.14
4
Atte
ntio
n ch
ange
199
5 m
anife
stos
Gov
ernm
ent p
artie
s −0
.086
*−0
.080
*−0
.070
*−0
.039
−0.0
62−0
.009
−0.0
58O
ppos
ition
par
ties
0.02
70.
050
−0.0
060.
005
−0.0
090.
017
0.01
4
Atte
ntio
n le
vel 1
999
man
ifest
osG
over
nmen
t par
ties
0.08
0*0.
102*
*0.
043
0.07
4*0.
093*
*0.
045
0.07
3O
ppos
ition
par
ties
0.12
6**
0.13
7**
0.09
8**
0.12
0**
0.13
7**
0.08
7*0.
118
Atte
ntio
n ch
ange
199
9 m
anife
stos
Gov
ernm
ent p
artie
s −0
.157
**−0
.164
**−0
.112
**−0
.179
**−0
.110
**−0
.178
**−0
.150
Opp
ositi
on p
artie
s−0
.001
0.00
4−0
.007
0.00
20.
010
−0.0
050.
001
599_03_Public Policy.indd 55 20/11/09 15:58:28
PROOF

56 S. Walgrave and J. Lefevere
123456789101112131415161718192021222324252627282930313233343536373839404142434445
123456789101112131415161718192021222324252627282930313233343536373839404142434445
Center and radical parties
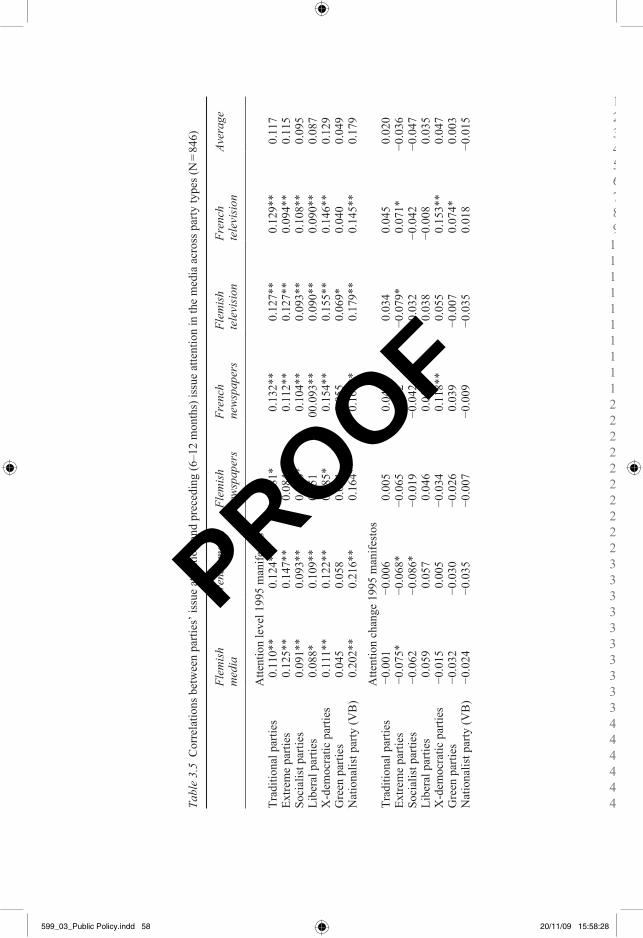
Looking at Table 3.5 it shows that especially the party manifesto of the radical Flemish nationalist and right- wing Vlaams Belang is inspired by media cover-age. The congruence of this populist party’s manifesto and the media coverage is by far the highest both in 1995 (0.179) and in 1999 (0.166). This makes some sense as we can expect populist parties to be very sensitive to media coverage. Next come the Christian- Democrat parties. Their program priorities came fairly close to the media agenda in the previous period in 1995 (0.129); this had changed in 1999 (0.090). This mixed finding more or less confirms the hypothe-sis that center- parties are more affected by media coverage. Indeed, the least affected by media coverage seem to be both green parties that, especially in 1995 (0.049), were not inspired at all by media coverage. On the other hand, extreme parties are not less affected by media coverage than the other parties, contradict-ing the radicality hypothesis. We also see differences between both elections in the tables with some parties only weakly affected in 1995 and stronger in 1999 (e.g. the socialist parties). The part of Table 3.5 taking the change in attention in media and programs as focus does not yield clear and interpretable results. There is no clear indication that media attention change leads to party manifesto change and that this differs systematically across party families. Also, 1995 and 1999 results partially con-tradict each other.
Issue type
We run the issue type analysis only for the 1995 data. We created two groups of issues: on the one hand the ‘law and order’ issues from which we know that they often affect the political agenda and on the other hand all other issues pooled together. These two groups are mutually exclusive. We then ran our correlational analysis on these two separate groups. The results yield a nuanced picture. First, when inspecting the top of the table we see that, on average, coverage on law and order themes affects the party programs more than coverage on non- law and order issues; congruence is higher for law and order issues. Especially French TV coverage on law and order themes, and consequently the aggregated French media agenda, was very strongly correlated with law and order issue attention in the party programs of both the Flemish (0.346) and the French (0.431) parties. These are the highest correlations we found so far. The bottom table documenting the change in issue attention in the party mani-festos shows, again with unusually high correlations, that the change in media attention for law and order issues was followed by a similar change in attention in the Flemish party manifestos in the amount of attention devoted to law and order. Remarkably, this only applies to the Flemish parties. French parties did not react at all to changes in media coverage. We believe this fact must be attrib-uted to the presence and the electoral success of the extreme- right party Vlaams Belang in Flanders who forced the other Flemish parties to embrace a more
599_03_Public Policy.indd 56 20/11/09 15:58:28
PROOF

123456789101112131415161718192021222324252627282930313233343536373839404142434445
Do the media shape agenda preferences? 57
123456789101112131415161718192021222324252627282930313233343536373839404142434445
repressive law and order agenda. The impact of the Vlaams Belang on the French parties – the Vlaams Belang is not participating in the elections in the French speaking part of Belgium in the French- speaking part of Belgium – was much less compelling and they did not react as strongly on the increased media attention for law and order issues. Our results corroborate the hypothesis put forward: both when it comes to the level of attention and when it comes to atten-tion change, parties do seem to adjust their programs more to law and order coverage than to other kinds of coverage. If media devote more attention to law and order issues, then parties tend to follow. This is especially the case when a strong challenging party is claiming the issue of law and order, pushing the other parties to be extra sensitive to crime and similar coverage.
Long- or short- term impact
Table 3.7 contains the analyses distinguishing two periods. We take into account long- term impact by assessing media coverage 6–12 months before the elections and we assess short- term impact by measuring coverage 1–6 months before Election Day. An interesting pattern emerges from the data. When it comes to attention level the long- term impact seems to prevail slightly. Both in 1995 and in 1999 the correlations with the earlier period are somewhat more substantial than the correlations with the latter period. When it comes to attention level change, in contrast, the data suggest the opposite. Correlations with the short- term period are higher – yet also here very modest – than with the longer- term period. This seems to suggest that parties, when drafting their programs take both the long- and the short- term into account, but differently. For the level of attention they stick to the longer- term, to decide what issues should get more or less attention compared to the previous program they seem to rely on the coverage just before they started drafting the program. Hence, we can cautiously maintain our hypothesis that there would be a diverging impact from short- versus long- term media coverage as the hypothesis is not clearly rejected but certainly not strongly corroborated either.
ConclusionOur analysis was preliminary and explorative. Our methods were not very soph-isticated and we did not control for alternative effects on party manifesto content. Party manifestos, for example, may not only be affected by preceding media coverage but also by other activities and initiatives parties and their representa-tives undertake. For example: party programs may also be ‘predicted’ by a party’s preceding activities in parliament. Parties, then, would first adjust their issue emphasis in parliament and only afterwards change their party program. Another track to pursue is to see what happens after a party has changed or not changed its party program according to media coverage. We may anticipate, for example, that parties who do manage to adjust their manifesto to media coverage
599_03_Public Policy.indd 57 20/11/09 15:58:28
PROOF
123456789101112131415161718192021222324252627282930313233343536373839404142434445
123456789101112131415161718192021222324252627282930313233343536373839404142434445Ta
ble
3.5
Cor
rela
tions
bet
wee
n pa
rties
’ iss
ue a
ttent
ion
and
prec
edin
g (6
–12
mon
ths)
issu
e at
tent
ion
in th
e m
edia
acr
oss p
arty
type
s (N
= 84
6)
Flem
ish
m
edia
Fren
ch m
edia
Flem
ish
new
spap
ers
Fren
ch
new
spap
ers
Flem
ish
te
levi
sion
Fren
ch
tele
visi
onAv
erag
e
Atte
ntio
n le
vel 1
995
man
ifest
osTr
aditi
onal
par
ties
0.11
0**
0.12
4**
0.08
1*0.
132*
*0.
127*
*0.
129*
*0.
117
Extre
me
parti
es0.
125*
*0.
147*
*0.
084*
0.11
2**
0.12
7**
0.09
4**
0.11
5So
cial
ist p
artie
s0.
091*
*0.
093*
*0.
080*
0.10
4**
0.09
3**
0.10
8**
0.09
5Li
bera
l par
ties
0.08
8*0.
109*
*0.
051
00.0
93**
0.09
0**
0.09
0**
0.08
7X
-dem
ocra
tic p
artie
s0.
111*
*0.
122*
*0.
085*
0.15
4**
0.15
5**
0.14
6**
0.12
9G
reen
par
ties
0.04
50.
058
0.02
40.
055
0.06
9*0.
040
0.04
9N
atio
nalis
t par
ty (V
B)
0.20
2**
0.21
6**
0.16
4**
0.16
5**
0.17
9**
0.14
5**
0.17
9
Atte
ntio
n ch
ange
199
5 m
anife
stos
Trad
ition
al p
artie
s−0
.001
−0.0
060.
005
0.04
40.
034
0.04
50.
020
Extre
me
parti
es−0
.075
*−0
.068
*−0
.065
−0.0
02−0
.079
*0.
071*
−0.0
36So
cial
ist p
artie
s−0
.062
−0.0
86*
−0.0
19−0
.042
−0.0
32−0
.042
−0.0
47Li
bera
l par
ties
0.05
90.
057
0.04
60.
016
0.03
8−0
.008
0.03
5X
-dem
ocra
tic p
artie
s−0
.015
0.00
5−0
.034
0.11
8**
0.05
50.
153*
*0.
047
Gre
en p
artie
s−0
.032
−0.0
30−0
.026
0.03
9−0
.007
0.07
4*0.
003
Nat
iona
list p
arty
(VB
)−0
.024
−0.0
35−0
.007
−0.0
09−0
.035
0.01
8−0
.015
599_03_Public Policy.indd 58 20/11/09 15:58:28
PROOF

123456789101112131415161718192021222324252627282930313233343536373839404142434445
123456789101112131415161718192021222324252627282930313233343536373839404142434445
Atte
ntio
n le
vel 1
999
man
ifest
osTr
aditi
onal
par
ties
0.11
9**
0.12
9**
0.09
5**
0.09
7**
0.11
2**
0.07
1*0.
104
Extre
me
parti
es0.
173*
*0.
182*
*0.
145*
*0.
167*
*0.
181*
*0.
131*
*0.
163
Soci
alis
t par
ties
0.14
8**
0.14
6**
0.13
7**
0.08
6*0.
093*
*0.
068*
0.11
3Li
bera
l par
ties
0.06
50.
077*
0.04
20.
074*
0.10
5**
0.03
30.
066
X-d
emoc
ratic
par
ties
0.09
7**
0.11
1**
0.06
9*0.
092*
*0.
091*
*0.
081*
0.09
0G
reen
par
ties
0.11
0**
0.11
5**
0.09
2**
0.10
9**
0.14
2**
0.06
00.
105
Nat
iona
list p
arty
(VB
)0.
176*
*0.
179*
*0.
156*
*0.
168*
*0.
156*
*0.
159*
*0.
166
Atte
ntio
n ch
ange
199
9 m
anife
stos
Trad
ition
al p
artie
s−0
.035
−0.0
41−0
.019
−0.0
180.
007
−0.0
32−0
.023
Extre
me
parti
es0.
015
−0.0
030.
034
−0.0
75*
−0.0
59−0
.063
−0.0
25So
cial
ist p
artie
s0.
088*
0.05
40.
111*
*0.
067
0.04
20.
066
0.07
1Li
bera
l par
ties
−0.0
84*
−0.0
68*
−0.0
85*
0.00
00.
008
−0.0
07−0
.039
X-d
emoc
ratic
par
ties
−0.0
36−0
.037
−0.0
26−0
.122
**−0
.048
−0.1
44**
−0.0
69G
reen
par
ties
0.00
4−0
.015
0.02
8−0
.078
*−0
.002
−0.1
15**
−0.0
30N
atio
nalis
t par
ty (V
B)
0.04
70.
049
0.03
30.
048
−0.0
600.
123*
*0.
040
599_03_Public Policy.indd 59 20/11/09 15:58:28
PROOF

123456789101112131415161718192021222324252627282930313233343536373839404142434445
123456789101112131415161718192021222324252627282930313233343536373839404142434445Ta
ble
3.6
Cor
rela
tions
bet
wee
n th
e Fl
emis
h ve
rsus
Fre
nch
parti
es’ i
ssue
atte
ntio
n an
d pr
eced
ing
(6–1
2 m
onth
s) m
edia
atte
ntio
n ac
ross
issu
e ty
pes
Flem
ish
m
edia
Fren
ch
med
iaFl
emis
h
new
spap
ers
Fren
ch
new
spap
ers
Flem
ish
te
levi
sion
Fren
ch
tele
visi
onAv
erag
e
Atte
ntio
n le
vel 1
995
man
ifest
osLa
w-a
nd o
rder
(N =
60)
Fl
emis
h pa
rties
0.01
30.
346*
*0.
033
0.11
0−0
.019
0.43
5**
0.15
3
Fren
ch p
artie
s−0
.005
0.43
1**
0.01
10.
147
−0.0
300.
535*
*0.
182
Oth
er is
sues
(N =
786)
Fl
emis
h pa
rties
0.17
0**
0.13
3**
0.18
2**
0.15
7**
0.13
7**
0.10
7**
0.14
8
Fren
ch p
artie
s0.
051
0.07
2*0.
075*
0.08
0*0.
014
0.06
20.
059
Atte
ntio
n ch
ange
199
5 m
anife
stos
Law
-and
-ord
er (N
= 60
)
Flem
ish
parti
es0.
356*
*0.
371*
*0.
387*
*0.
010
0.20
10.
478*
*0.
301
Fr
ench
par
ties
0.00
90.
104
0.15
0−0
.008
−0.1
800.
142
0.03
6O
ther
issu
es (N
= 78
6)
Flem
ish
parti
es−0
.015
−0.0
08−0
.021
−0.0
55−0
.004
0.03
8−0
.011
Fr
ench
par
ties
−0.0
71*
0.04
5−0
.072
*0.
003
−0.0
520.
077*
−0.0
12
599_03_Public Policy.indd 60 20/11/09 15:58:29
PROOF

123456789101112131415161718192021222324252627282930313233343536373839404142434445
123456789101112131415161718192021222324252627282930313233343536373839404142434445 Ta
ble
3.7
Cor
rela
tions
bet
wee
n pa
rties
’ iss
ue a
ttent
ion
and
prec
edin
g m
edia
atte
ntio
n by
pre
cedi
ng ti
me
perio
ds (N
= 84
6)
Mon
ths b
efor
e el
ectio
nFl
emis
h
med
iaFl
emis
h
new
spap
ers
Flem
ish
tele
visi
onFr
ench
m
edia
Fren
ch
new
spap
ers
Fren
ch
tele
visi
onAv
erag
e
Atte
ntio
n le
vel 1
995
man
ifest
os6–
120.
159*
*0.
171*
*0.
128*
*0.
092*
*0.
082*
0.09
6**
0.12
11–
60.
116*
*0.
114*
*0.
108*
*0.
081*
0.10
4**
0.05
90.
097
Atte
ntio
n le
vel 1
999
man
ifest
os6–
120.
175*
*0.
178*
*0.
155*
*0.
076*
0.09
3**
0.05
00.
121
1–6
0.12
8**
0.13
0**
0.11
3**
0.10
8**
0.08
9**
0.11
0**
0.11
3
Atte
ntio
n ch
ange
199
5 m
anife
stos
6–12
−0.0
13−0
.019
−0.0
030.
049
0.00
10.
084*
0.01
71–
6 n
0.03
20.
019
0.04
20.
064
0.05
30.
045
0.04
3
Atte
ntio
n ch
ange
199
9 m
anife
stos
6–12
−0.0
52−0
.069
*−0
.017
−0.0
090.
025
−0.0
35−0
.026
1–6
−0.0
63−0
.050
−0.0
740.
146*
*0.
152*
*0.
120*
*0.
039
599_03_Public Policy.indd 61 20/11/09 15:58:29
PROOF

62 S. Walgrave and J. Lefevere
123456789101112131415161718192021222324252627282930313233343536373839404142434445
123456789101112131415161718192021222324252627282930313233343536373839404142434445
have a higher chance of winning the elections than parties who do not follow the mass media. What have we learned in this chapter? The first finding is that party manifes-tos are highly stable and not very variable. Party programs are strongly path- dependent. This means that, inevitably, the media’s impact on the party manifestos can only be small as there is not much variation left to be explained. Second, we do find systematic similarities between issue emphasis in manifestos and preceding media coverage. Party programs and media coverage are associ-ated. Statistically, the associations are weak but they are significant. Third, our hypotheses did not really deliver very strong results. Our understanding of party manifesto antecedents remains limited. Two hypotheses kept the track and were corroborated. First, opposition parties are more inspired by media coverage than government parties. Second, issue types make a difference with more media impact on attention for law and order issues in the programs than for other types of issues. Another interesting finding, going against our initial hypothesis, is that parties who won the previous elections do seem to adjust their manifesto more to media coverage than parties who lost the previous electoral contest. If adjusting to media coverage is a winning strategy this would mean that some parties persist in their winning strategy while others persist in embracing a losing strat-egy. We also found some proof of the fact that some parties’ manifestos are more affected by media coverage than other parties: in Belgium, especially the extreme- right populist party Vlaams Belang seems to have been inspired by media coverage more than any other party. Finally, long- term media impact on party manifestos seems to prevail on short- term impact – parties are more inspired by media coverage a long time before they draft their program – but this finding was not entirely consistent and must be nuanced. By and large, we found some evidence that media matter for party manifes-tos, but admittedly the link we found was weak and elusive. Media matter to some extent, it is clear that parties decide on their priorities while somehow taking media into account, but the association is not straightforward nor is it easy to disentangle it. Especially the level of attention media and parties devote to issues is correlated, but a change in media attention hardly seems to lead to a subsequent change in party attention. Our analysis was explorative, our results show that there probably is something going on, but we need more research to lay bare the actual process.
ReferencesBartels, L. (1996) Politicians and the Press: Who Leads, Who Follows? Paper read at
APSA 1996, September, San Francisco.Budge, I. (1994) ‘A New Spatial Theory of Party Competition: Uncertainty, Ideology and
Policy Equilibria Viewed Comparatively and Spatially’, British Journal of Political Science, 24(4): 443–467.
—— and Bara, T. (2001) ‘Manifesto- based Research: A Critical Overview’, in I. Budge, H.-D. Klingemann, A. Volkens, J. Bara, E, Tanenbaum (eds) Mapping Policy Prefer-
599_03_Public Policy.indd 62 20/11/09 15:58:29
PROOF

123456789101112131415161718192021222324252627282930313233343536373839404142434445
Do the media shape agenda preferences? 63
123456789101112131415161718192021222324252627282930313233343536373839404142434445
ences: Estimated for Parties, Electors and Governments 1945–1998, Oxford: Oxford University Press: 51–75.
—— and Klingemann, H.D. (2001) ‘Finally! Comparative Over- time Mapping of Party Policy Movement’, in I. Budge, H.-D. Klingemann, A. Volkens, J. Bara, E, Tanenbaum (eds) Mapping Policy Preferences. Estimated for Parties, Electors and Governments 1945–1998, Oxford: Oxford University Press: 19–51.
——, H.-D. Klingemann, A. Volkens, J. Bara, E, Tanenbaum (eds) (2001) Mapping Policy Preferences. Estimated for Parties, Electors and Governments 1945–1998, Oxford: Oxford University Press.
Cook, F.L., T.R. Tyler, E.G. Goetz, M.T. Gordon, D. Protess, D.R. Leff and H.L. Molotch (eds) (1983) ‘Media and Agenda Setting: Effects on the Public, Interest Group Leaders, Policy Makers, and Policy’, Public Opinion Quarterly, 47(1): 16–35.
Downs, A. (1957) An Economic Theory of Democracy, New York: Harper & Row.—— (1972) ‘Up and Down with Ecology – the Issue Attention Cycle’, Public Interest,
28: 38–50.Edwards, G.C. and Dan Wood, B. (1999) ‘Who Influences Whom? The President, Con-
gress and the Media’, American Political Science Review, 93(2): 327–344.Elektronisch Nieuwsarchief Vlaanderen [Flemish Electronic News Archive] (no date)
online, available at: www.nieuwsarchief.be.Gilberg, S., C. Eval, M. McCombs, D. Nicholas (1980) ‘The State of the Union Address
and the Press Agendas’, Journalism Quarterly, 57: 584–588.Janda, K., R. Harmel, C. Edens, P. Goff (1995) ‘Changes in Party Identity: Evidence from
Party Manifestos’, Party Politics, 1(2): 171–196.Kennamer, D. (ed.) (1992) Public Opinion, the Press and Public Policy, Westpoint, CT:
Praeger Publishers.Klingemann, H., Hofferbert, R. and Budge, I. (1994) Parties, Policies and Democracy,
Oxford: Westview.Lorwin, V.R. (1971) ‘Segmented Pluralism: Ideological Cleavage and Political Cleavage
in the Smaller European Democracies’, Comparative Politics, 3(2): 141–144.Rihoux, B., Dumont, P. and Dandoy, R. (2005) ‘L’effet des médias et des programmes de
partis sur le contenu des accords de gouvernement, 1991–1999: particratie ou médiac-ratie?’, in S. Walgrave, L. De Winter and M. Nuytemans (eds.) Politieke agenda- setting in België (1991–2000). De moeilijke dialoog tussen publieke opinie, media en het politieke systeem, Gent: Academia Press: 123–148.
Robertson, D. (1976) A Theory of Party Competition, London and New York: Wiley.Rohrschneider, R. (2002) ‘Mobilizing versus Changing: How do Parties Target Voters in
Election Campaigns?’, Electoral Studies, 21(3): 367–382.Soroka, S.N. (2002a) Agenda- setting Dynamics in Canada, Vancouver: UBC Press.—— (2002b) ‘Issue Attributes and Agenda- setting by Media, the Public, and Policymak-
ers in Canada’, International Journal of Public Opinion Research, 14(3): 264–285.Stimson, J.A., Mackuen, M.B. and Erikson, R.S. (1995) ‘Dynamic Representation’,
American Political Science Review, 89(3): 543–565.Vliegenthart, R. and Walgrave, S. (2009 forthcoming) ‘When Media Matter for Politics.
Partisan Moderators of Mass Media’s Agenda- setting Influence on Parliament in Belgium’, accepted for publication in Party Politics.
Volkens, A. and Klingemann, H.-D. (2002) ‘Parties, Ideologies and Issues: Stability and Change in Fifteen European Party Systems 1945–1998’, in K.R. Luther and F. Müller-Rommel (eds.) Political Parties in the New Europe: Political and Analytical Challenges, New York: Oxford University Press: 143–169.
599_03_Public Policy.indd 63 20/11/09 15:58:29
PROOF

64 S. Walgrave and J. Lefevere
123456789101112131415161718192021222324252627282930313233343536373839404142434445
Walgrave, S. and Aelst, P. van (2006) ‘The Contingency of the Mass Media’s Political Agenda Setting Power. Towards a Preliminary Theory’, Journal of Communication, 56(1): 88–109.
—— and Nuytemans, M. (2009) ‘Friction and Party Manifesto Change in 25 Countries (1945–1998)’, American Journal of Political Science, 53(1): 190–206.
——, Varone, F. and Dumont, P. (2006) ‘Policy with or without Parties? A Comparative Analysis of Policy Priorities and Policy Change in Belgium (1991–2000)’, Journal of European Public Policy, 13(7): 1021–1038.
——, Soroka, S. and Nuytemans, M. (2007) ‘The Mass Media’s Political Agenda- setting Power: A Longitudinal Analysis of Media, Parliament and Government in Belgium (1993–2000)’, Comparative Political Studies, 41(6): 814–836.
Winter, L. de and Dumont, P. (2003) ‘Belgium: Delegation and Accountability under Par-titocratic Rule’, in K. Ström, W. Müller and T. Bergman (eds.) Delegation and Accountability in Parliamentary Democracies, New York: Oxford University Press: 253–281.
——, D. della Porta, and K. Deschouwer (1996) ‘Comparing Similar Countries: Italy and Belgium’, Res Publica, 38(2): 215–236.
599_03_Public Policy.indd 64 20/11/09 15:58:29
PROOF