3. hand drawn vectorization using 100% vectors - web view01/11/2015 · scalable vector...
TRANSCRIPT

Graphics
From Greek γραφικός graphikos - something written.
Graphics are visual images or designs on some surface, such as a wall, canvas, screen, paper, or stone to inform, illustrate, or entertain. Graphics often combine text, illustration, and color.
Drawing is a form of visual art in which a person uses various drawing instruments to mark paper or another two-dimensional medium. Instruments include graphite pencils, pen and ink, inked brushes.
Technical drawing, also known as drafting or draughting, is the act and discipline of composing drawings that visually communicate how something functions or is to be constructed.
Printmaking is the process of making artworks by printing, normally on paper. Printmaking normally covers only the process of creating prints that have an element of originality, rather than just being a photographic reproduction of a painting.
An illustration is a visualization or a depiction of a subject made by an artist, such as a drawing, sketch, painting, photograph, or other kind of image of things seen, remembered or imagined, using a graphical representation. The word comes from the latin word illustra'tio, illu'stro meaning enlighten, irradiate.
A diagram is a symbolic representation of information according to some visualization technique.
Photography is the science, art and practice of creating durable images by recording light or other electromagnetic radiation, either electronically by means of an image sensor, or chemically by means of a light-sensitive material such as photographic film.
1

Computer graphics
Computer graphics are pictures and movies created using computers - usually referring to image data created by a computer specifically with help from specialized graphical hardware and software. It is a vast and recent area in computer science. The phrase was coined by computer graphics researchers Verne Hudson and William Fetter of Boeing in 1960. Another name for the field is computer-generated imagery, or simply CGI.
In 1950, the first computer-driven display was attached to MIT's Whirlwind I computer to generate simple pictures.
In 1962, Ivan Sutherland invented Sketchpad, an innovative program that influenced alternative forms of interaction with computers.
In the mid-1960s, large computer graphics research projects were begun at MIT, General Motors, Bell Labs, and Lockheed Corporation.
2
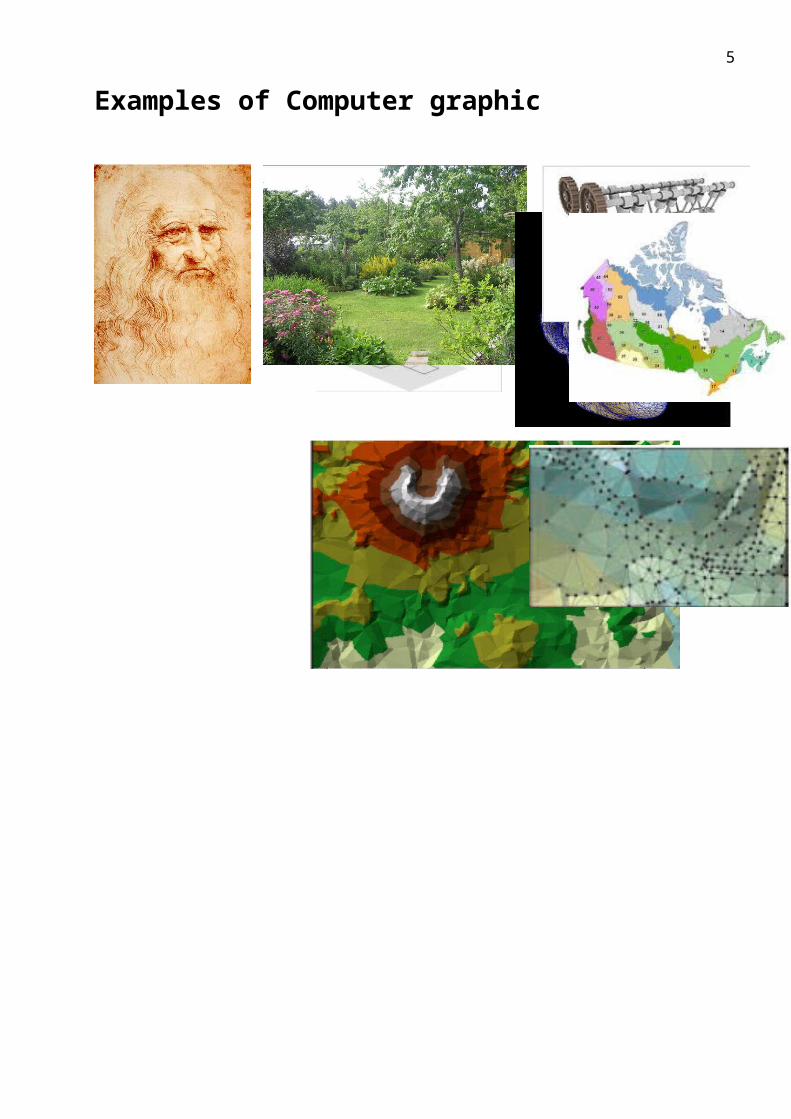
Examples of Computer graphic
3

Raster and vector graphics1
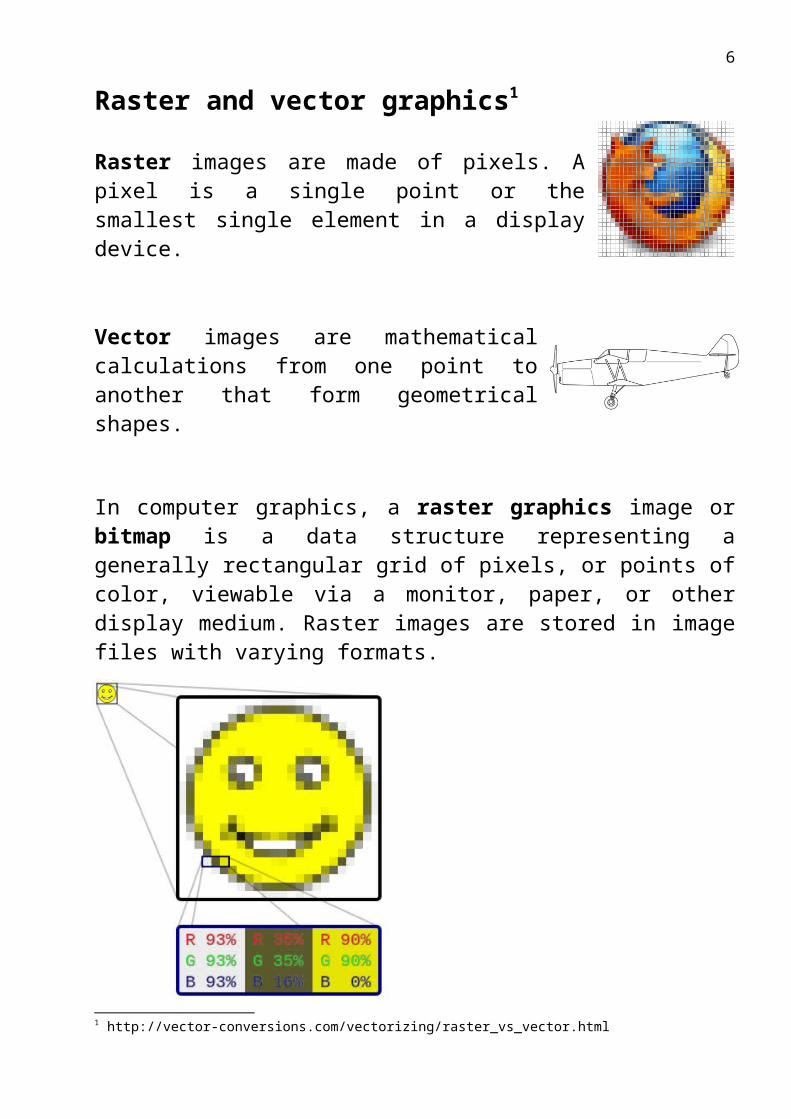
Raster images are made of pixels. A pixel is a single point or the smallest single element in a display device.
Vector images are mathematical calculations from one point to another that form geometrical shapes.
In computer graphics, a raster graphics image or bitmap is a data structure representing a generally rectangular grid of pixels, or points of color, viewable via a monitor, paper, or other display medium. Raster images are stored in image files with varying formats.
1 http://vector-conversions.com/vectorizing/raster_vs_vector.html
4
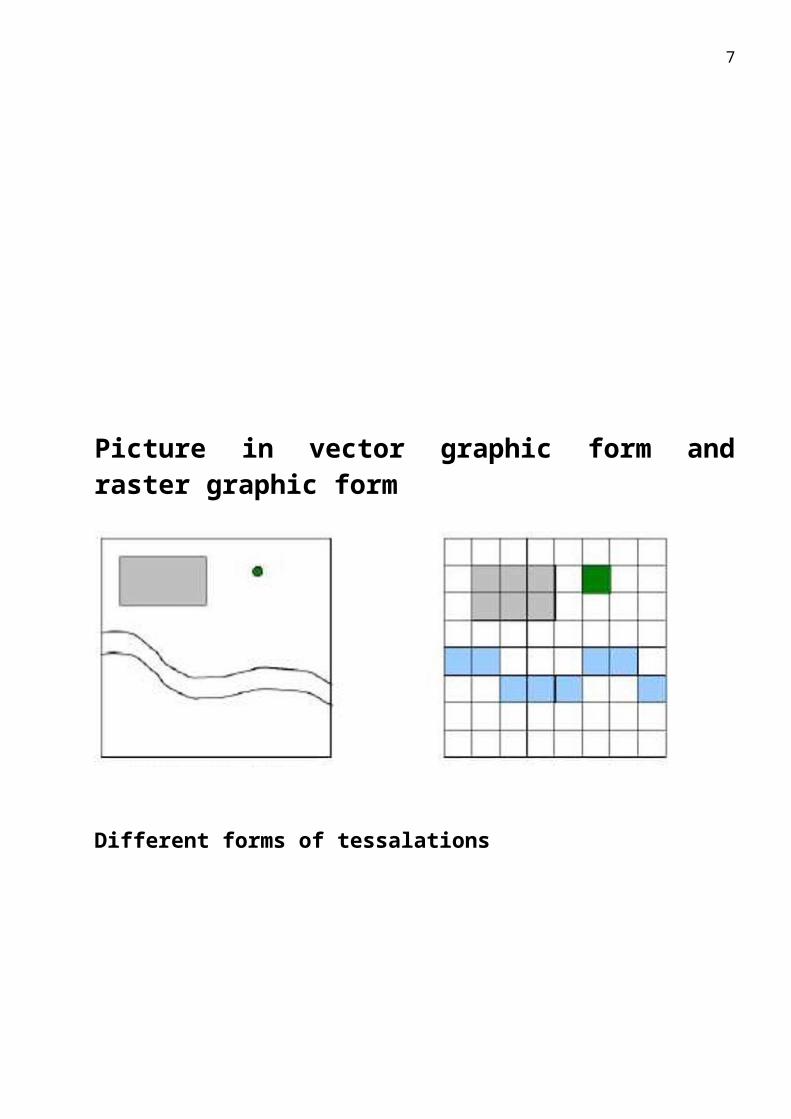
Picture in vector graphic form and raster graphic form
Different forms of tessalations
5
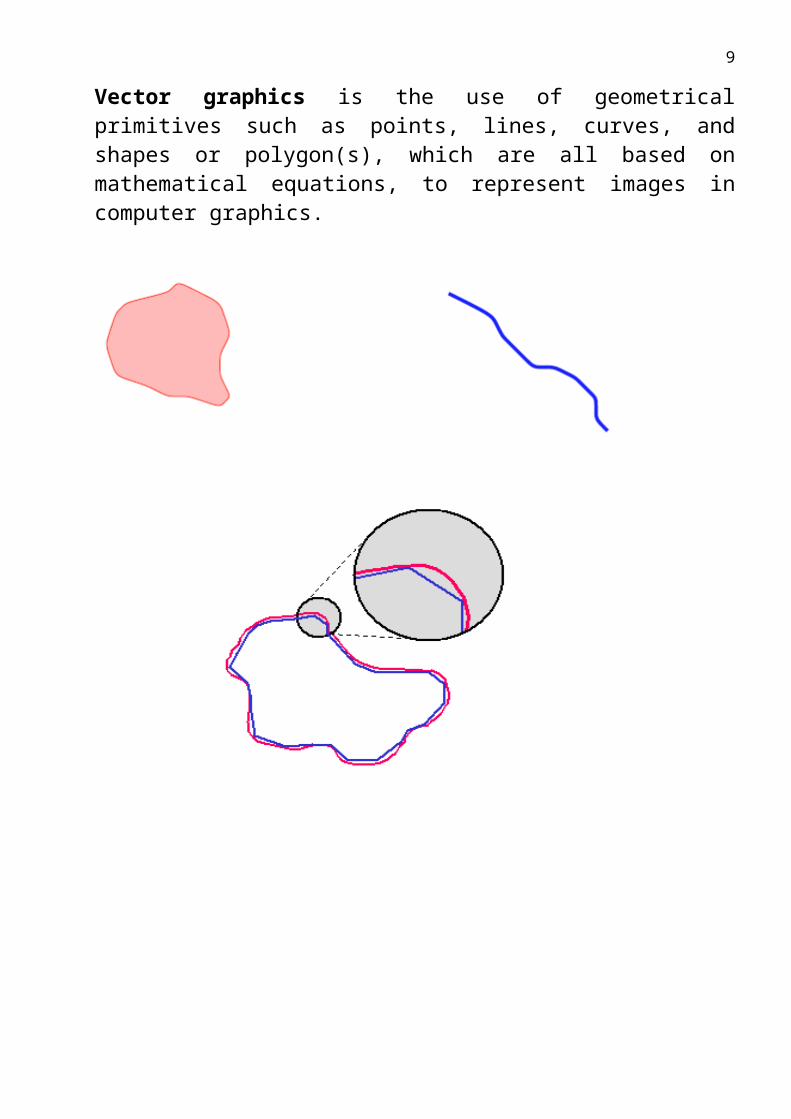
Vector graphics is the use of geometrical primitives such as points, lines, curves, and shapes or polygon(s), which are all based on mathematical equations, to represent images in computer graphics.
6
7

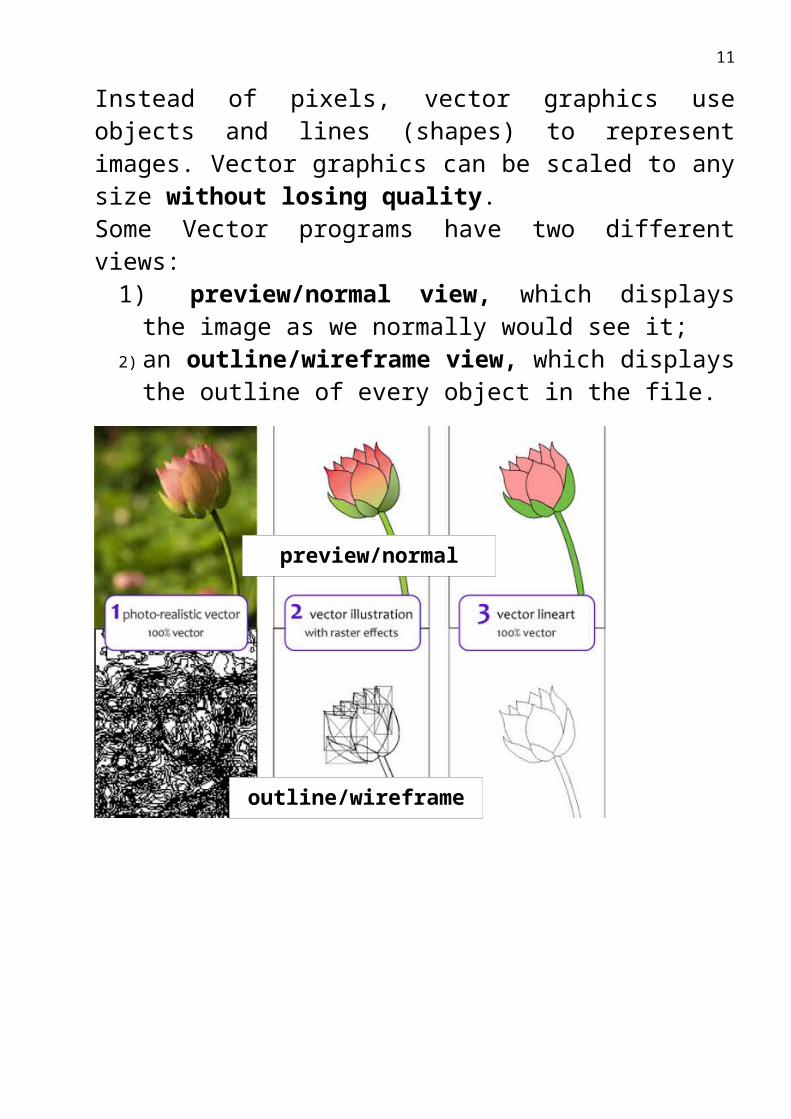
Instead of pixels, vector graphics use objects and lines (shapes) to represent images. Vector graphics can be scaled to any size without losing quality.Some Vector programs have two different views:
1) preview/normal view, which displays the image as we normally would see it;
2) an outline/wireframe view, which displays the outline of every object in the file.
outline/wireframe view
preview/normal view
8
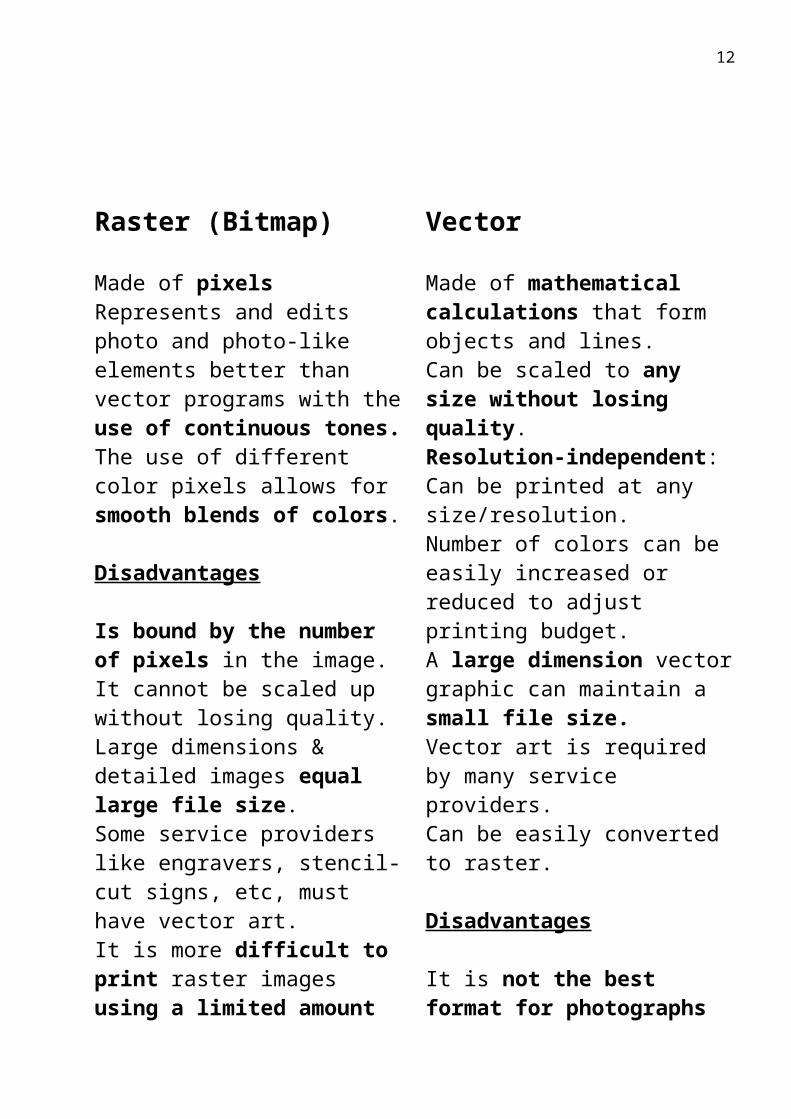
Raster (Bitmap)
Made of pixelsRepresents and edits photo and photo-like elements better than vector programs with the use of continuous tones. The use of different color pixels allows for smooth blends of colors.
Disadvantages
Is bound by the number of pixels in the image. It cannot be scaled up without losing quality.Large dimensions & detailed images equal large file size.Some service providers like engravers, stencil-cut signs, etc, must have vector art.It is more difficult to print raster images using a limited amount of spot colors.Depending on the complexity of the image, conversion to vector may be time consuming.
Vector
Made of mathematical calculations that form objects and lines.Can be scaled to any size without losing quality.Resolution-independent: Can be printed at any size/resolution.Number of colors can be easily increased or reduced to adjust printing budget.A large dimension vector graphic can maintain a small file size.Vector art is required by many service providers.Can be easily converted to raster.
Disadvantages
It is not the best format for photographs or photo-like elements with blends of color.
9

Vektorization
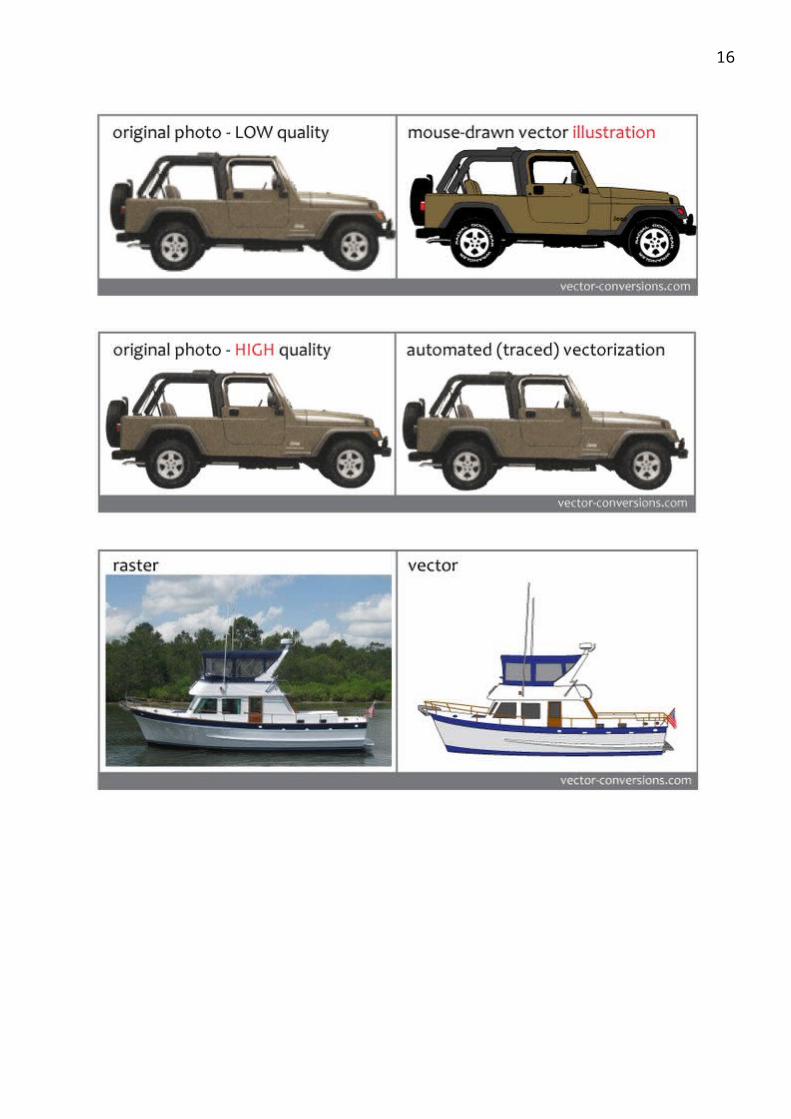
Vectorization programs are drawing programs so converting a photograph into vector format means making a drawing of the photo.Photos can be converted to vector art either with automated vector conversion software (vector tracing) or by manually drawing the image with a vector program. Manual photograph vectorization is usually very time consuming unless the image is being changed to a simple illustration.
1. Automated traced vectorization using 100% vectorsIf the image quality allows, a raster image with color blends may be vectorized with the aid of automated software. The appearance of the image can be preserved but this type of vectorization may render the image unsuitable for certain processes. The vectored image will have a multitude of colored objects and may not be suitable for spot color separation, vinyl cut signs, engraving and any other process that is guided by the "wireframe" or "outline" of the vector file.
2. Hand drawn vectorization using Raster (non-vector) effectsManual drawing with a pen tool - node by node - is often necessary to produce the desired results. This is more time consuming than automated tracing therefore more costly. Gradients & shadows effects allow a softer blend of colors but vector files with raster effects are not suitable for all processes.
3. Hand drawn vectorization using 100% vectors
10
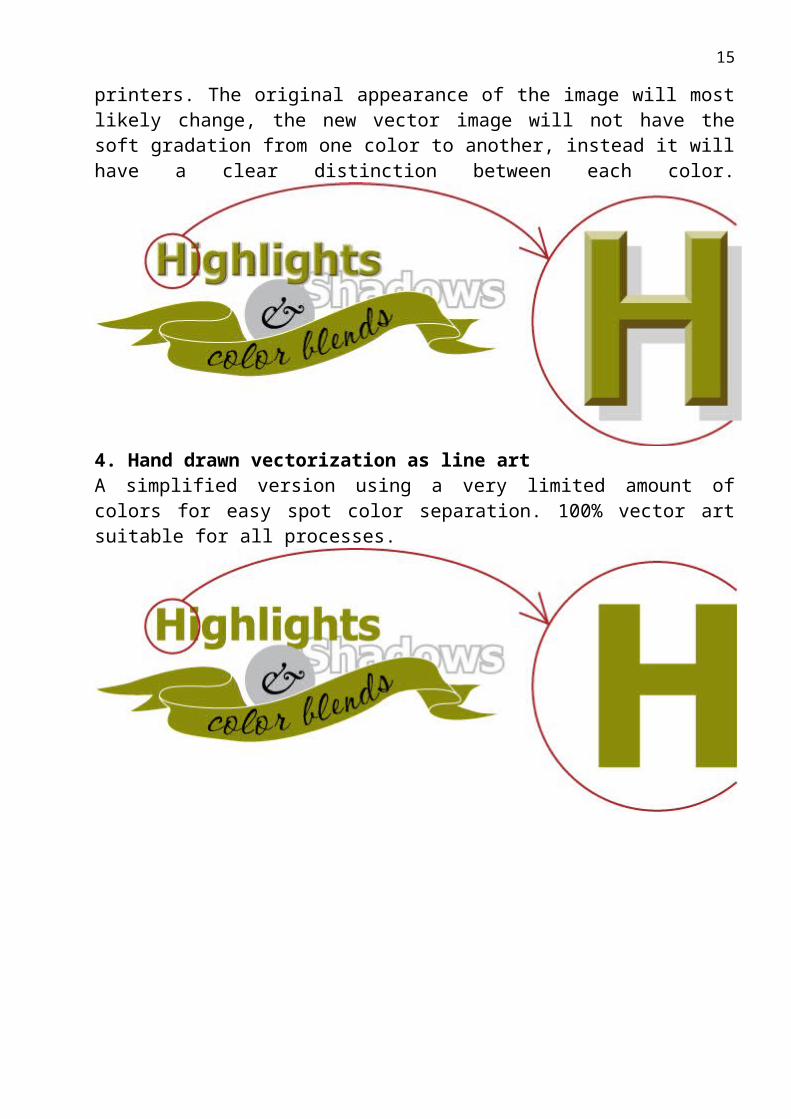
Manual drawing with a pen tool - node by node - with NO gradient effects produces a file suitable for all processes. 100% vector art with no raster effects is required by process that are guided by the vector outline such as engraving, vinyl cut signs, and some specialty printers. The original appearance of the image will most likely change, the new vector image will not have the soft gradation from one color to another, instead it will have a clear distinction between each color.
4. Hand drawn vectorization as line artA simplified version using a very limited amount of colors for easy spot color separation. 100% vector art suitable for all processes.
11
12
Vector File Formats
Extension Name Notes
.ai Adobe Illustrator Document Native format of Adobe Illustrator (based on .eps)
.eps Encapsulated Postscript
Industry standard for including vector graphics in print
.ps PostScriptVector based printing language, used by many Laser printers, used as electronic paper for scientific purposes.
.pdf Portable Document Format
Modernized version of ps, adopted by the general public as 'electronic print version'
.svg Scalable Vector Graphics
XML based W3C standard, incorporating animation, gaining adoption.
.swf Shockwave Flash Binary vector format, with animation and sound, supported by most major web browsers.
13

Raster File Formats
Extension Name Notes
.jpgJoint Photographic Experts Group
Lossy compression format well suited for photographic images
.pngPortable Network Graphics
Lossless compression image, supporting 16bit sample depth, and Alpha channel
.gifGraphics Interchange Format
8bit indexed bitmap format, is superceded by PNG on all accounts but animation
.exr EXR HDR, High Dynamic Range format, used by movie industry..
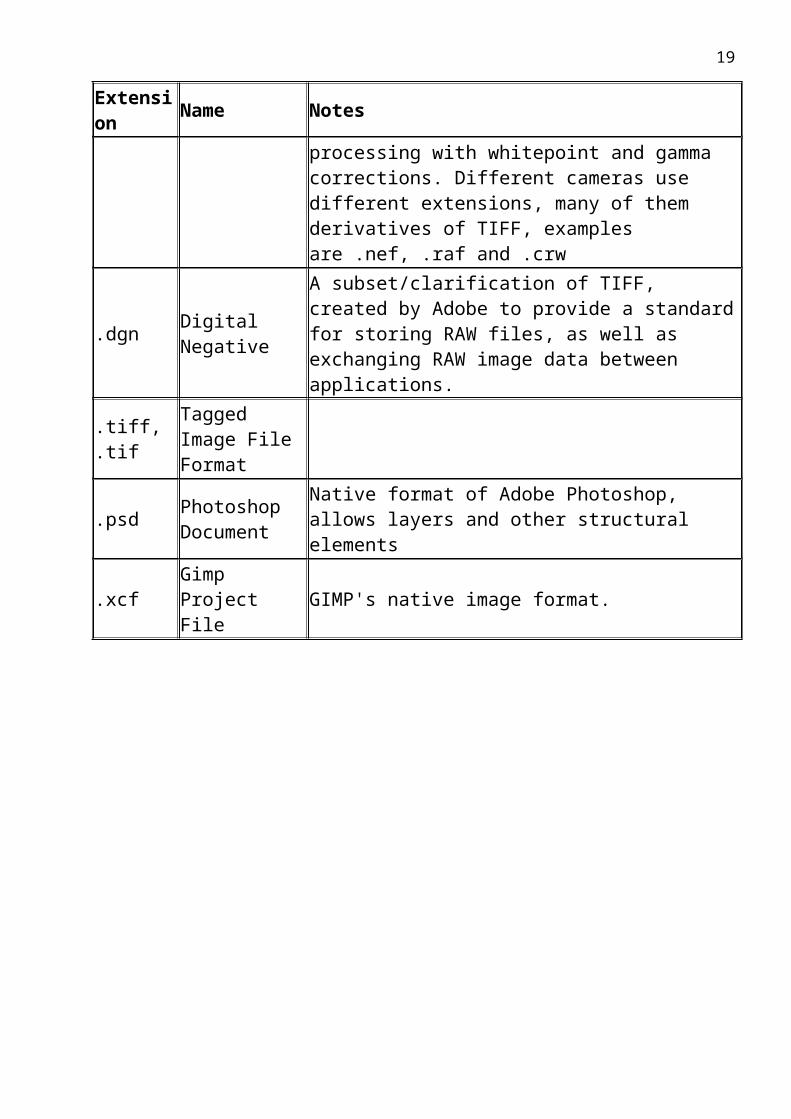
.raw Raw image file
Direct memory dump from a digital camera, contains the direct imprint from the imaging sensor without processing with whitepoint and gamma corrections. Different cameras use different extensions, many of them derivatives of TIFF, examples are .nef, .raf and .crw
.dgn Digital NegativeA subset/clarification of TIFF, created by Adobe to provide a standard for storing RAW files, as well as exchanging RAW image data between applications.
.tiff, .tif Tagged Image File Format
.psd Photoshop Document
Native format of Adobe Photoshop, allows layers and other structural elements
.xcf Gimp Project File GIMP's native image format.
14
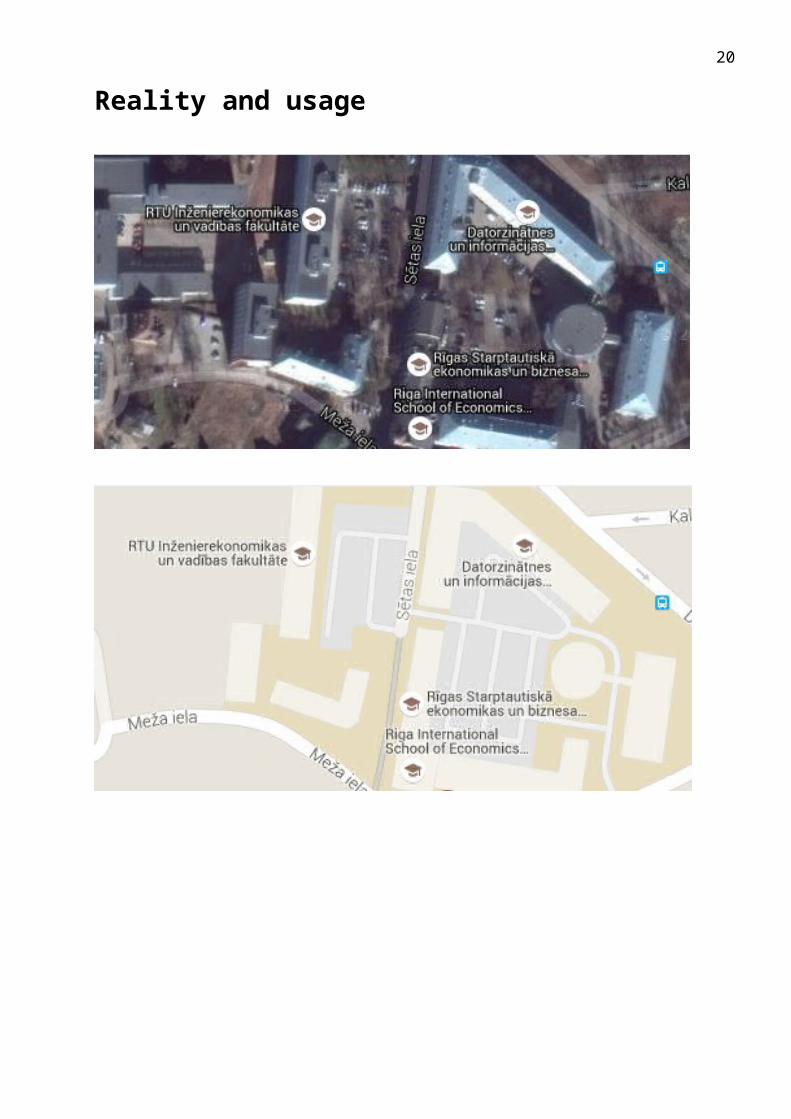
Reality and usage
15
Vizualizācija (visualization)Glabāšana (storage)
Sameklēšana un izgūšana (search and extraction)Relāciju DBSRelaciju-objektu DBSXML DBS
Computer graphics are graphics created using computers and more generally, the representation and manipulation of graphics data by a computer.
16

Grafiskās sistēmas (graphical systems)1. CAD/CAM (computer aided design/ computer aided manufacturing) sistēmas
2. GIS (geographical information systems) sistēmas
3. Vadības informācijas sistēmas (management information systems)
4. Pētniecības informācijas sistēmas (research information systems).
17

Computer aided design (datorizētā projektēšana)
Computer-aided design (CAD) is the use of computer systems to aid in the creation, modification, analysis or optimization of a design. CAD software is used to increase the productivity of the designer, improve the quality of design and improve communications through documentation and to create a database for manufacturing. CAD output is often in the form of electronic files for print, machining, or other manufacturing operations.
The first commercial applications of CAD were in large companies in the automotive and aerospace industries, as well as in electronics. Only large corporations could afford the computers capable of performing the calculations. Notable company projects were, a joint project of GM (Dr. Patrick J.Hanratty) and IBM (Sam Matsa , Doug Ross`s MIT APT research assistant) to develop a prototype system for design engineers DAC-1 (Design Augmented by Computer) 1964; Lockheed projects; Bell GRAPHIC 1 and Renault.
18
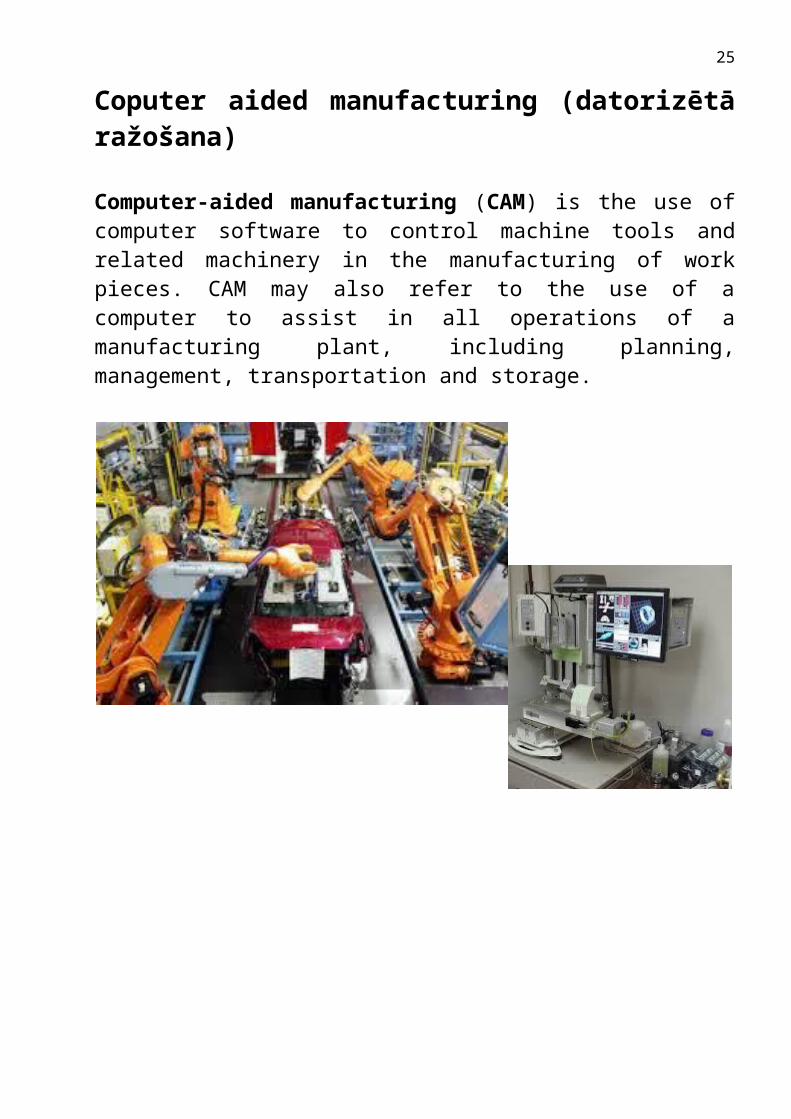
Coputer aided manufacturing (datorizētā ražošana)
Computer-aided manufacturing (CAM) is the use of computer software to control machine tools and related machinery in the manufacturing of work pieces. CAM may also refer to the use of a computer to assist in all operations of a manufacturing plant, including planning, management, transportation and storage.
19
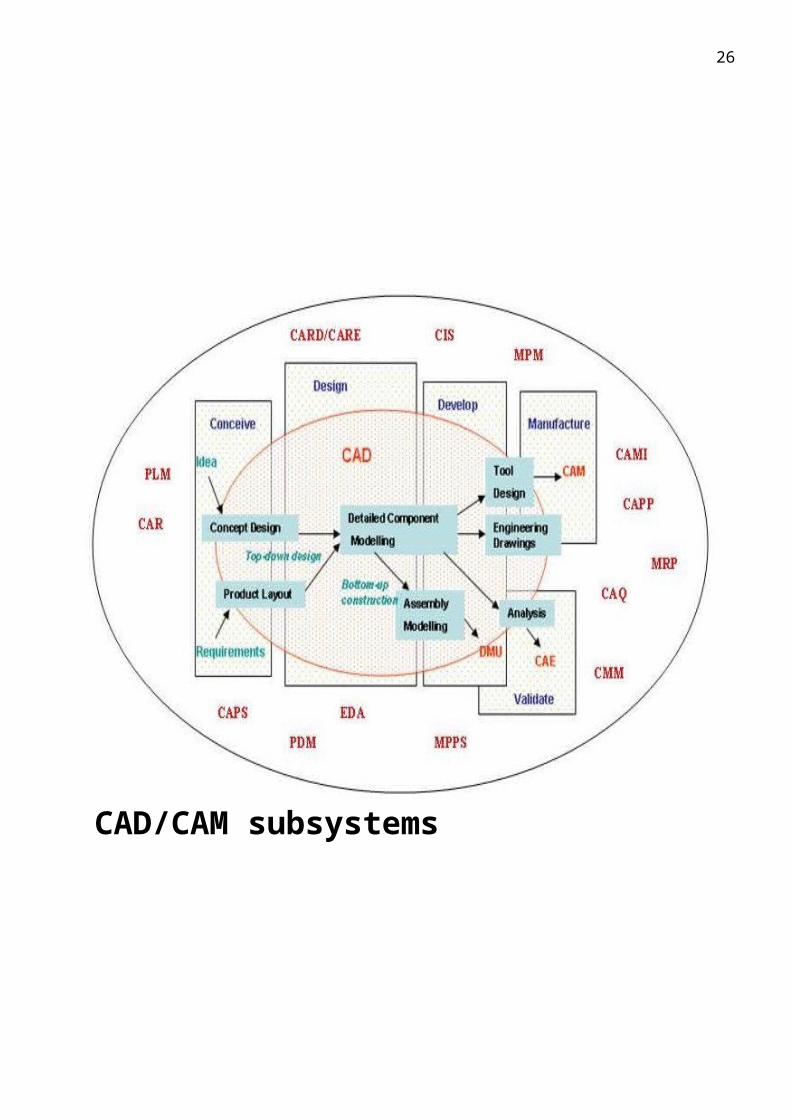
CAD/CAM subsystems20

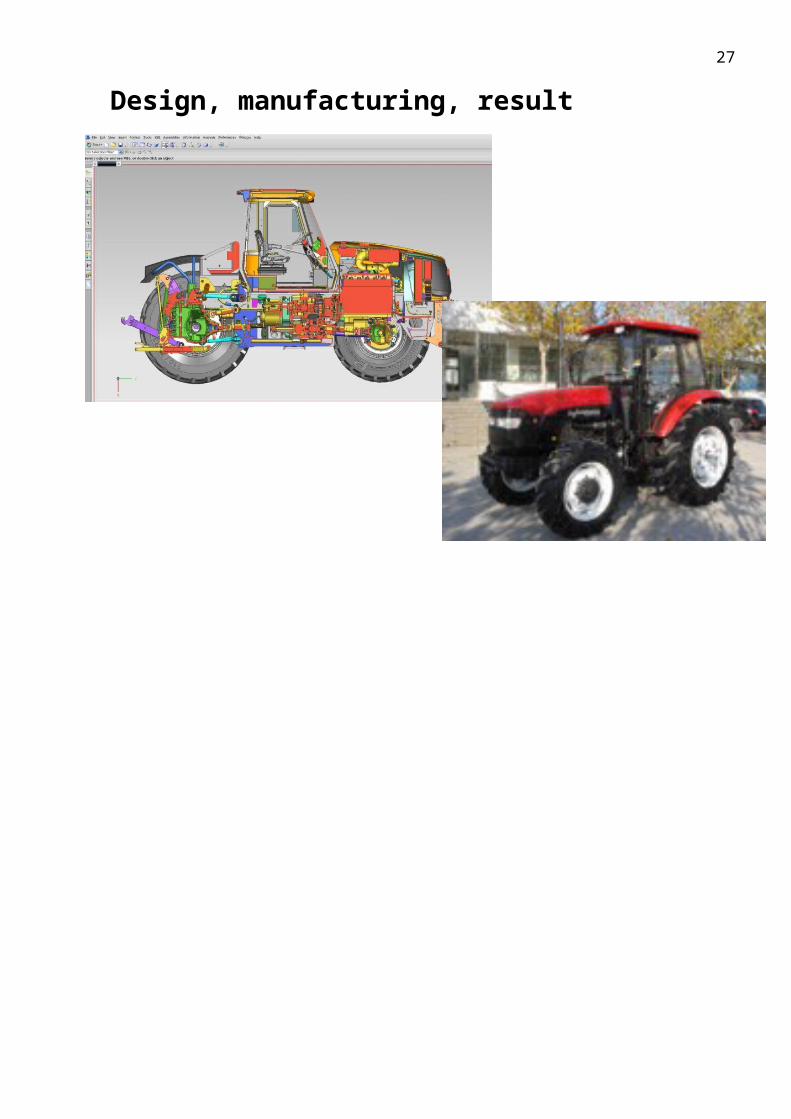
Design, manufacturing, result
21

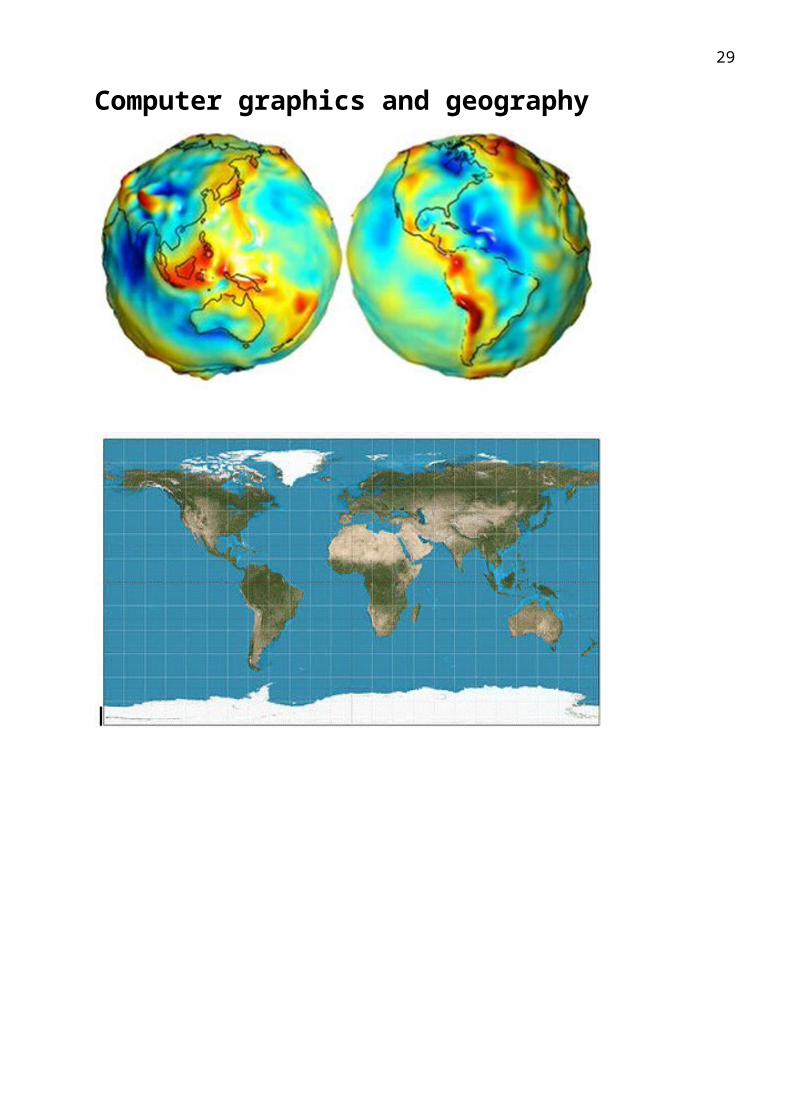
Computer graphics and geography
22

Problems
Locations on the Earth’s surface is usually marked using the longitude and latitude.
As seen in the above figure, a one degree longitude difference differs greatly depending on the latitude. A longitude 1° from the equator is 111.321 km, but longitude 1° from latitude 60° is only 55.802 km.
23

Geographic information sistems (GIS)
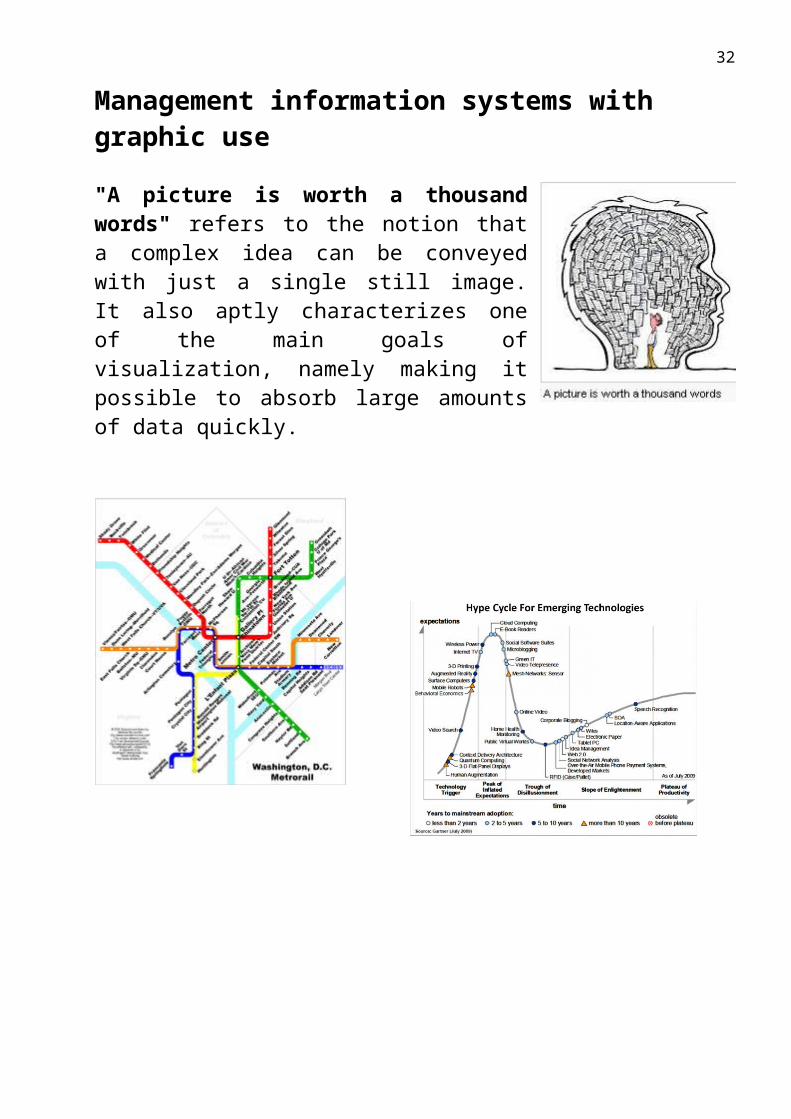
Management information systems with graphic use
24
"A picture is worth a thousand words" refers to the notion that a complex idea can be conveyed with just a single still image. It also aptly characterizes one of the main goals of visualization, namely making it possible to absorb large amounts of data quickly.
25
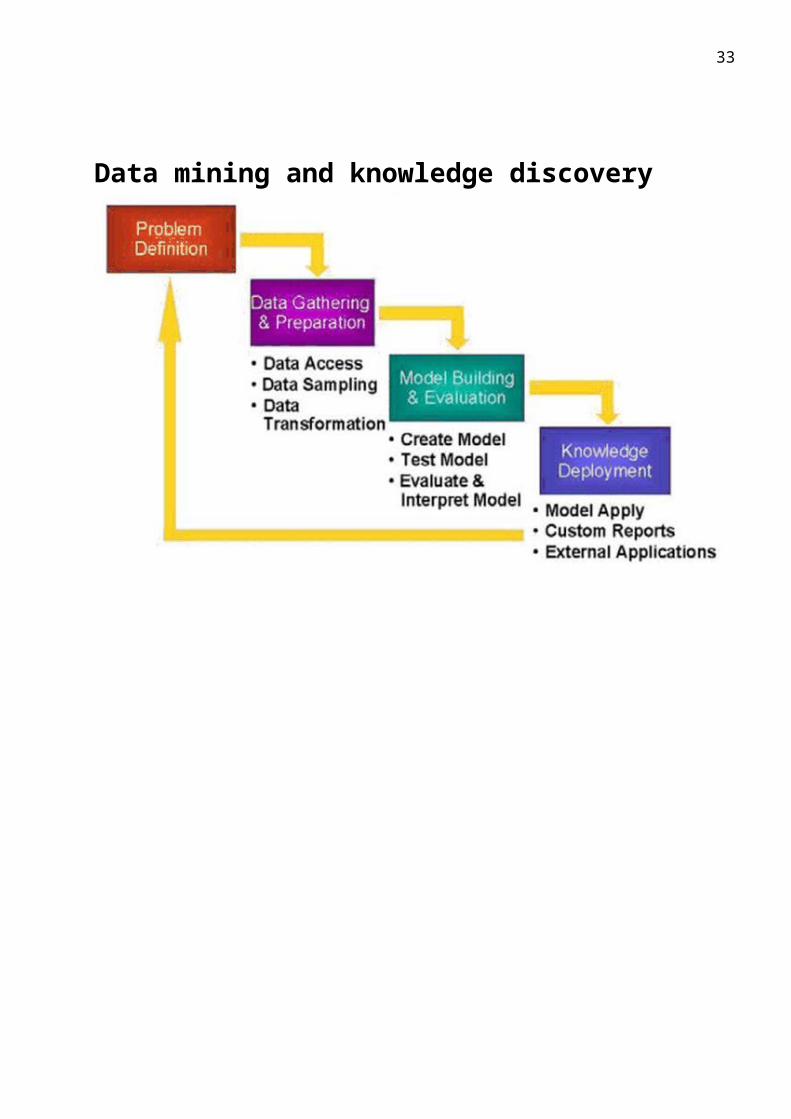
Data mining and knowledge discovery
26
Graphic in research systems
Graphic in biology research system
27

Medical information vizualization
28
Graphic in biology research systems
29

Skaitļošanas ģeometrija (computational geometry)
Computational geometry is a branch of computer science devoted to the study of algorithms which can be stated in terms of geometry.
The main branches of computational geometry are:
1. Combinatorial computational geometry, also called algorithmic geometry, which deals with geometric objects as discrete entities. A groundlaying book in the subject by Preparata and Shamos dates the first use of the term "computational geometry" in this sense by 1975.
2. Numerical computational geometry, also called machine geometry, computer-aided geometric design (CAGD), or geometric modeling, which deals primarily with representing real-world objects in forms suitable for computer computations in CAD/CAM systems.
30

Skaitļošanas ģeometrijas problēmas
1. Ģeometrijas objekti kā diskrētas vienības (geometric objects as discrete entities)Problēma: nepārtrauktā telpa (reālā dzīve) un diskrētā telpa (datori)
-----------------------------------------------------------------------------------------------------------
31
2. The convex hull or convex envelope of a set X of points in the Euclidean plane or Euclidean space is the smallest convex set that contains X.
3. Line segment intersection problem supplies a list of line segments in the plane and asks us to determine whether any two of them intersect, or cross.
4. A Delaunay triangulation for a set P of points in a plane is a triangulation DT(P) such that no point in P is inside the circumcircle of any triangle in DT(P). Delaunay triangulations maximize the minimum angle of all the angles of the triangles in the triangulation; they
tend to avoid skinny triangles. The triangulation is named after Boris Delaunay for his work on this topic from 1934.
5. Closest point pair problem is a problem of computational geometry: given n points in metric space, find a pair of points with the smallest distance between them.
6. The Euclidean shortest path problem: is given a set of polyhedral obstacles in a Euclidean space, and two points, find the shortest path between the points that does not intersect any of the obstacles.
7. Polygon triangulation is the decomposition of a polygonal area (simple polygon) P into a set of triangles, i.e., finding the set of triangles with pairwise non-intersecting interiors whose union is P.
32
Grafisko datu standarti
This basic model is defined in the Open Geospatial Consortium (OGC) “Simple Features for SQL” (SFSQL) specification and defines the playing field shared by all the particular spatial database implementations we will be discussing.The SFSQL specifies the particular rules for building valid geometries, the legal representations of geometries in both ASCII and binary form, and a set of basic functions for constructing, inspecting, measuring and manipulating geometries.
Simple Features (officially Simple Feature Access) is both:1) an Open Geospatial Consortium (OGC);2) an International Organization for Standardization (ISO) standard ISO
19125 that specifies a common storage model of mostly two-dimensional geographical data (point, line, polygon, multi-point, multi-line, etc.)
The ISO 19125 standard comes in two parts. Part one, ISO 19125-1 (SFA-CA for "common architecture"), defines a model for two-dimensional simple features, with linear interpolation between vertices. The data model defined in SFA-CA is a hierarchy of classes. This part also defines representation using Well-Known Text (and Binary). Part 2 of the standard, ISO 19125-2 (SFA-SQL), defines an implementation using SQL. The OpenGIS standard(s) cover implementations in CORBA and OLE/COM as well, although these have lagged behind the SQL one and are not standardized by ISO.The ISO/IEC 13249-3 SQL/MM Spatial extends the Simple Features data model mainly with circular interpolations (e.g. circular arcs) and adds other features like coordinate transformations and methods for validating geometries as well as Geography Markup Language support.
33

Standartu dokumenti
1. ISO/IEC: ISO 19125-1:2004 Geographic information -- Simple feature access -- Part 1: Common architectureISO 19125-2:2004 Geographic information -- Simple feature access -- Part 2: SQL optionISO SQL/MM part 3
2. OpenGIS: OpenGIS Implementation Specification for Geographic information - Simple feature access - Part 1: Common architecture (05-126, 06-103r3, 06-103r4), current version 1.2.1OpenGIS Simple Feature Access - Part 2: SQL Option (99-054, 05-134, 06-104r3, 06-104r4), current version 1.2.1, formerly OpenGIS Simple Features [Implementation Specification] for SQLOpenGIS Simple Features Implementation Specification for CORBA (99-054), current version 1.0OpenGIS Simple Features Implementation Specification for OLE/COM (99-050), current version 1.1
http://www.opengis.org/GIS Standards and Interoperability (ESRI)http://www.esri.com/software/opengisGIS Standards (NCGIA Core Curriculum 1990)http://www.geog.ubc.ca/courses/klink/gis.notes/ncgia/toc.htmlInternational Organization for Standardization (ISO)http://www.iso.org/iso/home.htmSpatial Data Standards and Interoperability White Paper (ESRI)http://www.esri.com/library/whitepapers/pdfs/spatial-data-standards.pdf
34