3 social studies
TRANSCRIPT

2020-20213
So
cia
l Stu
die
sS
tud
en
t bo
ok
GR
AD
E 11
1
23
144
1- 144
2 A
.H. /2
02
0- 2
02
1 A.D
.
GradeGrade11Student Book
SOCIAL STUDIES
OUR UAE, OUR WORLD: UNDERSTANDING OUR
PAST, PRESENT AND FUTURE

Social StudiesOur UAE, Our World:
Understanding our Past, Present and Future
Student BookGrade 11
Term 3
1441- 1442 A.H. /2020- 2021 A.D.
Certi�ed The materials in this book
is certi�ed from theMinistry of Education
(Pilot Version)


INTRODUCTION
6

7
In this term students will further develop and apply research skills. Students will collect, analyse and present research. This book provides opportunities to collect data in a variety of contexts, and analyse and present data results in an appropriate format.
The skills students learn this term may be used in a variety of other courses such as Science, English and Mathematics.
In the end of term project students may choose to further develop one of the class projects into a poster presentation. This increasing level of complexity, scaffold by in-class activities and projects is aligned to the spiral learning approach applied throughout the year.

CONTENTS
8

content is defined on smart learning app
Introduction 6
Lesson 1: Why Do Research? 10
Lesson 2: Introduction to Research Types and Methods 18
Lesson 3: Research Questions 26
Lesson 4: Data Collection Techniques 34
Lesson 5: Mid-term Review 44
Lesson 6: Preparing for Research-Part I: Research Topic & Question 50
Lesson 7: Preparing for Research Part II: Research Plan 56
Lesson 8: Preparing for Research Part III: Literature Review 64
Lesson 9: Term Project 70
Lesson 10: Final Review 74
Glossary 80
Certi�ed The materials in this book
is certi�ed from theMinistry of Education
9

10
LESSON 1: QUALITATIVE ANALYSIS

11
Lesson Objective:
By the end of the lesson, students will:
� gain a basic understanding of qualitative analysis and different methods of qualitative data analysis
� practice qualitative analysis and apply different methods of qualitative data analysis
Key Vocabulary
phenomenon
integrity
unbiased
constraints
deductive
inductive
categories
transcript
narrative

All rights reserved. No part of this bage m
ay be reproduced, stored in a retieval system or transm
itted in any form or by any m
eans without prior perm
ission in writing of the publisher.
All rights reserved. No part of this bage m
ay be reproduced, stored in a retieval system or transm
itted in any form or by any m
eans without prior perm
ission in writing of the publisher.
12
Social Studies - Grade 11 Term 3
WARM UP: BRAINSTORM
Brainstorm some of sources of qualitative data.
SOURCES OF QUALITATIVE
DATA

All r
ight
s re
serv
ed. N
o pa
rt o
f thi
s ba
ge m
ay b
e re
prod
uced
, sto
red
in a
retie
val s
yste
m o
r tra
nsm
itted
in a
ny fo
rm o
r by
any
mea
ns w
ithou
t prio
r per
miss
ion
in w
ritin
g of
the
publ
isher
. Al
l rig
hts
rese
rved
. No
part
of t
his
bage
may
be
repr
oduc
ed, s
tore
d in
a re
tieva
l sys
tem
or t
rans
mitt
ed in
any
form
or b
y an
y m
eans
with
out p
rior p
erm
issio
n in
writ
ing
of th
e pu
blish
er.
13
Social Studies - Grade 11 Term 3
Lesson 1 | Qualitative Analysis
PRE-READING
Data are raw facts while information is processed data. Researchers try to find relationships or patterns that will lead them to make claims or conclusions. In qualitative data analysis, researchers deal with data based on text, images and other types of non-numerical information.
Researchers use qualitative data analysis to find meanings and get a deeper understanding of what the data reveals about the phenomenon being studied. Researchers use quantitative data analysis to confirm, to predict or to explain a phenomenon.
The key difference between qualitative and quantitative data analysis is the role of the researcher. In quantitative research numbers are used to objectively understand the phenomenon. In qualitative research, the researcher extracts meaning according to his or her interpretation of the data. This is why qualitative research is called subjective. This heavy involvement of the researcher and subjectivity is one of the criticisms of qualitative research. The strength of qualitative data analysis is determined by the researcher’s integrity, knowledge of the phenomenon, ability to stay neutral (unbiased), and ability to analyse data.

All rights reserved. No part of this bage m
ay be reproduced, stored in a retieval system or transm
itted in any form or by any m
eans without prior perm
ission in writing of the publisher.
All rights reserved. No part of this bage m
ay be reproduced, stored in a retieval system or transm
itted in any form or by any m
eans without prior perm
ission in writing of the publisher.
14
Social Studies - Grade 11 Term 3
There are two approaches to analyse qualitative data.
Deductive Approach Inductive Approach
The researcher has a theory to start with. Therefore, this approach is usually adopted in quantitative research, but can be used in qualitative research when applying qualitative methods to research a well-known phenomenon.
Researcher predetermines data structure.
The research criteria or questions can be used to carry out analysis. For example, “students responded positively when asked about experience with classroom learning technologies, therefore…”
It is quick and easy.
The researcher does not start with a theory. Therefore, this approach is usually adopted in qualitative research.
The researcher has little or no idea about what they will find. So it is not structured.
This approach is used to develop an initial theory. It is time consuming.

All r
ight
s re
serv
ed. N
o pa
rt o
f thi
s ba
ge m
ay b
e re
prod
uced
, sto
red
in a
retie
val s
yste
m o
r tra
nsm
itted
in a
ny fo
rm o
r by
any
mea
ns w
ithou
t prio
r per
miss
ion
in w
ritin
g of
the
publ
isher
. Al
l rig
hts
rese
rved
. No
part
of t
his
bage
may
be
repr
oduc
ed, s
tore
d in
a re
tieva
l sys
tem
or t
rans
mitt
ed in
any
form
or b
y an
y m
eans
with
out p
rior p
erm
issio
n in
writ
ing
of th
e pu
blish
er.
15
Social Studies - Grade 11 Term 3
Lesson 1 | Qualitative Analysis
METHODS FOR QUALITATIVE DATA ANALYSISResearchers use a combination of data analysis tools depending on the research project. For example, in small scale research project, a simple analytical tool such as content analysis may be used (see table). However, in more complex research involving many sources, a combination may be used such as content analysis and narrative analysis. All qualitative data analysis methods use codes to organise data. The table describes some of the most common data analysis methods.
Method Description
Content analysis:
This simple method just analyses the content of a text to find patterns, ideas, categories, relationships, and so on. It is used mostly to analyse interviews, but also for secondary research from newspapers, blogs and so on.
Narrative analysis:
This method is used develop a story or narrative from the data.
The researcher may use a range of sources. For example, interviews, observations, journal entries, and other sources can be used to establish a narrative of what the data is showing.
The researcher may group the different stories of participants to develop the (overarching) main theme or story.
Discourse analysis:
This method analyses data according to the respondent’s perspective, situation and social context.
It takes on a form discussion and comparison of different responses. For example, (a) said this, (b) said that, therefore, we can say…. In other words, the researcher uses the respondent’s viewpoints to develop his or her viewpoint.
Grounded theory:
This method is more complex and time consuming because it aims to explain why certain things happened by comparing similar situations.
First, the researcher analyses the collected data (may be content analysis), and then compares it with existing knowledge and theories to develop an explanation.
The method is used to explain the specific situation or context the research is in, rather than trying to find answers that can be generalised.
Researchers look for themes in comparisons and a theory or explanation is developed according to these themes.
All rights reserved. No part of this bage m
ay be reproduced, stored in a retieval system or transm
itted in any form or by any m
eans without prior perm
ission in writing of the publisher.
All rights reserved. No part of this bage m
ay be reproduced, stored in a retieval system or transm
itted in any form or by any m
eans without prior perm
ission in writing of the publisher.
16
Social Studies - Grade 11 Term 3
Activity 1:
Activity 2:
Check Your Understanding
Application
Instructions: Answer the questions.
Q1. Which method is most commonly used to analyse interviews?____________________________________________________________________________________________________________
Q2. Which method takes on a form of discussion?____________________________________________________________________________________________________________
Q3. Which method first analyses data and then compares it with existing knowledge?____________________________________________________________________________________________________________
Q4. Which method requires the researcher to gather data in order to establish a common story?____________________________________________________________________________________________________________
Match the statement to the most appropriate qualitative data analysis method.
Method Statement
content analysis I will read interview data and analyse the discussion to assess what the respondent liked or disliked.
narrative analysis I will read interview data to assess what the respondent liked or disliked then compare it to other studies to explain why they may have had these likes and dislikes.
discourse analysis I will read interview data to assess what the respondent liked or disliked.
grounded theory I will read interview data and make connections between different things the responded said to assess whether there is a story to be told about their likes and dislikes.

All r
ight
s re
serv
ed. N
o pa
rt o
f thi
s ba
ge m
ay b
e re
prod
uced
, sto
red
in a
retie
val s
yste
m o
r tra
nsm
itted
in a
ny fo
rm o
r by
any
mea
ns w
ithou
t prio
r per
miss
ion
in w
ritin
g of
the
publ
isher
. Al
l rig
hts
rese
rved
. No
part
of t
his
bage
may
be
repr
oduc
ed, s
tore
d in
a re
tieva
l sys
tem
or t
rans
mitt
ed in
any
form
or b
y an
y m
eans
with
out p
rior p
erm
issio
n in
writ
ing
of th
e pu
blish
er.
17
Social Studies - Grade 11 Term 3
Lesson 1 | Qualitative Analysis
Activity3: Discussion
In small group, discuss:
Which method of qualitative data analysis do you prefer?
Discuss the strengths and weaknesses of different methods to justify your choice.
____________________________________________________________________________________________________________
____________________________________________________________________________________________________________
____________________________________________________________________________________________________________
____________________________________________________________________________________________________________
____________________________________________________________________________________________________________
____________________________________________________________________________________________________________
____________________________________________________________________________________________________________
QUALITATIVE DATA ANALYSISAll qualitative data analysis methods use codes to organise data. Coding is a process of classifying and categorizing text. A researcher might organise these codes in different ways.
Codes may be created by what or who is being researched, and what they said about the information or ideas (code1). There might be a separate code for similar ideas or categories (code 2) in the same way other codes might be used to show when these ideas or categories agree or disagree (code3 / code4). The naming of the codes depends on the researcher. The main aim is to organise data in a way that makes it easier to understand and identify patterns in the text.
Below is a small section from a research interview transcript. Read the text and highlight different reasons for the interviewee to start a business.

All rights reserved. No part of this bage m
ay be reproduced, stored in a retieval system or transm
itted in any form or by any m
eans without prior perm
ission in writing of the publisher.
All rights reserved. No part of this bage m
ay be reproduced, stored in a retieval system or transm
itted in any form or by any m
eans without prior perm
ission in writing of the publisher.
18
Social Studies - Grade 11 Term 3
Interviewer: when was the first time you thought of starting a business? Interviewee: one, people around the world have a negative view of the middle east (talks about some negative stereo types), the UAE gave me free education, free health care, so perhaps somehow if I started a successful business and it goes international, we could show the world a different perspective about us; that if we are given the opportunity, we have the potential, the ambition. We could show them that we are more than what is shown on the TV or media.
Interviewer: But, why do you feel you have to give something back to the UAE?Interviewee: I feel like it’s an obligation. It’s just part of being a good citizen.
Interviewer: why do you feel you have to be a good citizen? Interviewee: It’s a general moral to be a good citizen. It’s part of our religion.
Interviewer: let’s go back a bit. why else did you want to start a business?Interviewee: well… to be productive… for financial reasons. I don’t come from a rich family, so I wanted to have a different source of income for myself, and for my family.
Interviewer: which one was the stronger reason; for yourself or your family?Interviewee: Yes, my family. I studied accountancy to get a good job, otherwise I wanted to be an artist.
Brainstorm different categories that you might draw out of the above transcript
Activity3: Application and Reflection

All r
ight
s re
serv
ed. N
o pa
rt o
f thi
s ba
ge m
ay b
e re
prod
uced
, sto
red
in a
retie
val s
yste
m o
r tra
nsm
itted
in a
ny fo
rm o
r by
any
mea
ns w
ithou
t prio
r per
miss
ion
in w
ritin
g of
the
publ
isher
. Al
l rig
hts
rese
rved
. No
part
of t
his
bage
may
be
repr
oduc
ed, s
tore
d in
a re
tieva
l sys
tem
or t
rans
mitt
ed in
any
form
or b
y an
y m
eans
with
out p
rior p
erm
issio
n in
writ
ing
of th
e pu
blish
er.
19
Social Studies - Grade 11 Term 3
Lesson 1 | Qualitative Analysis
Activity4:
Activity5:
Application
Application and Reflection
Instructions: Answer the questions.
Q1. How many people are involved in the interview?
____________________________________________________________________________________________________________
Q2. What is the main focus of the question?
____________________________________________________________________________________________________________
Q3. Which main reason for starting a business were revealed during the interview?
____________________________________________________________________________________________________________
Q4. How can these be coded? Using the ideas from the brainstorm above, organise different categories into codes? ____________________________________________________________________________________________________________
You have been given two possible codes ‘personal ambition’ and ‘family reasons’ that explain the main question.
Continue with these two to see what information from the transcript above can fit within each code.
Reasons for starting a business
Family reasons Personal Ambitions

All rights reserved. No part of this bage m
ay be reproduced, stored in a retieval system or transm
itted in any form or by any m
eans without prior perm
ission in writing of the publisher.
All rights reserved. No part of this bage m
ay be reproduced, stored in a retieval system or transm
itted in any form or by any m
eans without prior perm
ission in writing of the publisher.
20
Social Studies - Grade 11 Term 3
Activity 6: Application and Reflection
Which key points have you been able to draw out from the transcript?
A “HOW TO GUIDE” FOR CONDUCTING QUALITATIVE DATA ANALYSIS
This simple guide outlines basics step you should take when conducting qualitative data analysis. This guide will be useful in later units when you will be collecting, interpreting and presenting data.
Step 1: Outline
Before you start with the analysis you should outline what you are analysing. In most instances this will come from your research question. Even then, it is good practice to outline your unit of analysis. This is not the same as the unit of observation. For example, the unit of observation might be students, but what you want to analyse (unit of analysis) might be their view of canteen services.
Step 2: Label
Get into the habit of labelling your data. This should happen before you start the analysis process. You should label things like time and date, location, respondents and anything major that you noticed as the data was being collected.
Step 3: Format
Format your data. In most cases, this means transcribing interviews, observations, etc.
Step 4: Organize
Organize your data. After formatting, you should organise the data in a coherent manner. For example, you can organise interviews according to sample or dissect the data according to the research questions.

All r
ight
s re
serv
ed. N
o pa
rt o
f thi
s ba
ge m
ay b
e re
prod
uced
, sto
red
in a
retie
val s
yste
m o
r tra
nsm
itted
in a
ny fo
rm o
r by
any
mea
ns w
ithou
t prio
r per
miss
ion
in w
ritin
g of
the
publ
isher
. Al
l rig
hts
rese
rved
. No
part
of t
his
bage
may
be
repr
oduc
ed, s
tore
d in
a re
tieva
l sys
tem
or t
rans
mitt
ed in
any
form
or b
y an
y m
eans
with
out p
rior p
erm
issio
n in
writ
ing
of th
e pu
blish
er.
21
Social Studies - Grade 11 Term 3
Lesson 1 | Qualitative Analysis
Step 5: Code
Use codes to separate the data. As you start the content analysis process, it is crucial that you start to code and categorise themes and patterns. You can change or merge as you go on, but start early and this will give you a much better understanding of what’s inside your data.
Step 6: Conclude & Present
Make conclusions and present findings. All this work has to lead to something, even if that something is a conclusion that nothing new is found. In qualitative research, the analysis process starts along with data collection. So you, as the researchers, will be analysing and making sense of the information you are collecting as you collect it. By the time you have followed the preceding steps, you would have come to some conclusions. It is important to communicate these in a concise and clear manner. A report, accompanied by a presentation would be a good way to do that. You will follow this method for your final year project.
Think-Pair-Share. Think about the challenges and advantages of qualitative research analysis. Then pair up with a classmate and share your points. Finally, share with the whole class and complete your table.
Discussion Notes: Challenges
Benefits:
Activity 6: Discussion
22
LESSON 2: QUANTITATIVE DATA ANALYSIS

23
Lesson Objective:
By the end of the lesson, students will:
� learn the key steps in analysing quantitative data.
Key Vocabulary
interpreting
consistently
investigate
measurement
tabulation
descriptive
disaggregation
subsequent
All rights reserved. No part of this bage m
ay be reproduced, stored in a retieval system or transm
itted in any form or by any m
eans without prior perm
ission in writing of the publisher.
All rights reserved. No part of this bage m
ay be reproduced, stored in a retieval system or transm
itted in any form or by any m
eans without prior perm
ission in writing of the publisher.
24
Social Studies - Grade 11 Term 3
WARM UP: MIND MAP
Building on your knowledge from the previous term, create a mind map of different types of qualitative and quantitative data collection methods.
Qualitative Quantitative
All r
ight
s re
serv
ed. N
o pa
rt o
f thi
s ba
ge m
ay b
e re
prod
uced
, sto
red
in a
retie
val s
yste
m o
r tra
nsm
itted
in a
ny fo
rm o
r by
any
mea
ns w
ithou
t prio
r per
miss
ion
in w
ritin
g of
the
publ
isher
. Al
l rig
hts
rese
rved
. No
part
of t
his
bage
may
be
repr
oduc
ed, s
tore
d in
a re
tieva
l sys
tem
or t
rans
mitt
ed in
any
form
or b
y an
y m
eans
with
out p
rior p
erm
issio
n in
writ
ing
of th
e pu
blish
er.
25
Social Studies - Grade 11 Term 3
Lesson 2 | Quantitative Data Analysis
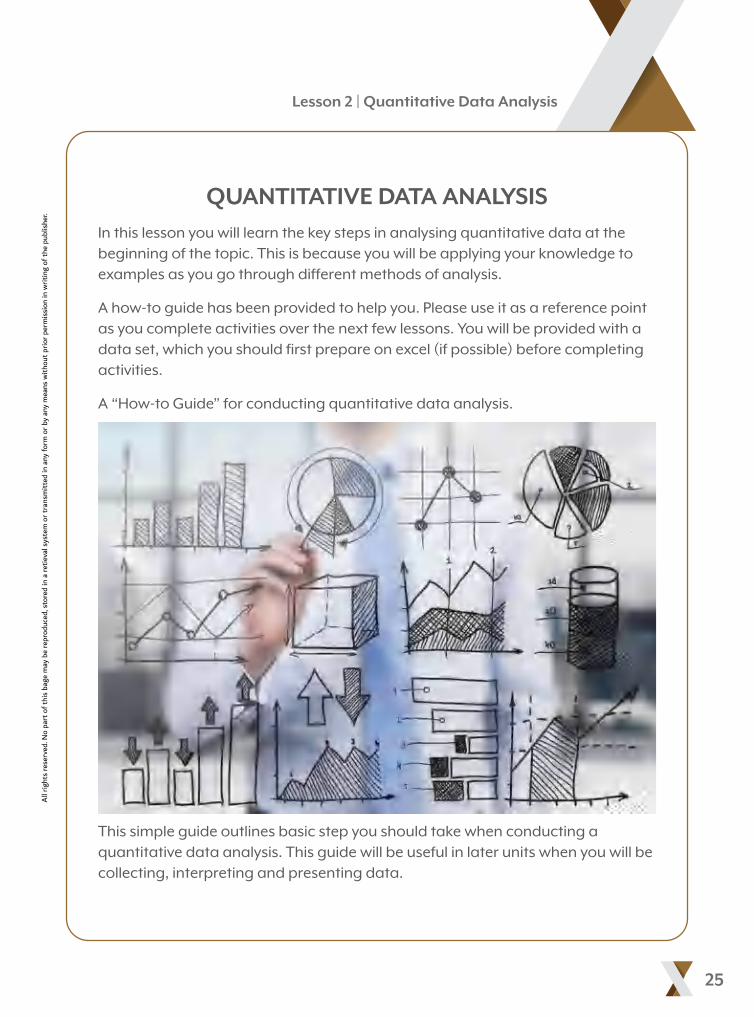
QUANTITATIVE DATA ANALYSISIn this lesson you will learn the key steps in analysing quantitative data at the beginning of the topic. This is because you will be applying your knowledge to examples as you go through different methods of analysis.
A how-to guide has been provided to help you. Please use it as a reference point as you complete activities over the next few lessons. You will be provided with a data set, which you should first prepare on excel (if possible) before completing activities.
A “How-to Guide” for conducting quantitative data analysis.
This simple guide outlines basic step you should take when conducting a quantitative data analysis. This guide will be useful in later units when you will be collecting, interpreting and presenting data.

All rights reserved. No part of this bage m
ay be reproduced, stored in a retieval system or transm
itted in any form or by any m
eans without prior perm
ission in writing of the publisher.
All rights reserved. No part of this bage m
ay be reproduced, stored in a retieval system or transm
itted in any form or by any m
eans without prior perm
ission in writing of the publisher.
26
Social Studies - Grade 11 Term 3
Step 1: Transfer
Transfer your data into a readable format.
If you have access to excel then this should be your starting point.
Organise the data in a way that clearly differentiates between questions, and different categories.
Step 2: Analyse
Once the data is transferred, make final checks to ensure that the data sets are complete, and without errors.
Conduct some initial analysis to ensure there is no bias judgement and the data is valid.
Are there responses missing from some questions consistently? This would indicate some questions were missed on purpose.
If you have a large data set, then you can use the filter option on excel, or pick a smaller sample to verify data.
Step 3: Format
Format your data. This means adding codes to further simplify your data.
For example, if you are measuring student happiness from a scale of 1 to 10, in a sample of 20 students, then you might want to separate how many students responded under each level of happiness (1=2), (2=1), (8=7) and so on.
This will also help you identify the unit of analysis, which includes what you want to investigate.
Step 4: Prepare Data
The first 3 steps outline how you prepare your data before analysis.
The fourth step is about choosing an appropriate level of measurement.
How are you measuring the data? There are 4 ways you can do this;
ɮ Nominal ɮ Ordinal ɮ Interval ɮ Ratio (scale)
Step 5: Analyse
After data preparation, and identifying an appropriate level of measurement, you are ready to apply data analysis techniques.
At this basic level, you do not need to go beyond the 3 options outlined below.
However, you might want to use a combination of these when it comes to completing your final year project in grade 12.
ɮ Data tabulation (frequency distributions & percent distributions) ɮ Descriptive data ɮ Data disaggregation
Step 6: Write up
The final step is to write-up your results and present your findings.

All r
ight
s re
serv
ed. N
o pa
rt o
f thi
s ba
ge m
ay b
e re
prod
uced
, sto
red
in a
retie
val s
yste
m o
r tra
nsm
itted
in a
ny fo
rm o
r by
any
mea
ns w
ithou
t prio
r per
miss
ion
in w
ritin
g of
the
publ
isher
. Al
l rig
hts
rese
rved
. No
part
of t
his
bage
may
be
repr
oduc
ed, s
tore
d in
a re
tieva
l sys
tem
or t
rans
mitt
ed in
any
form
or b
y an
y m
eans
with
out p
rior p
erm
issio
n in
writ
ing
of th
e pu
blish
er.
27
Social Studies - Grade 11 Term 3
Lesson 2 | Quantitative Data Analysis
Instructions: Read the case and follow the instructions.
Case Study: Jadid Trading LLC
Jadid Trading LLC is a new company in the UAE. It employs 20 sales staff across two Emirates of Dubai and Sharjah. After advertising the job vacancies, the company started to hire sales staff in February of 2019, and completed its quota of 20 staff by the end of March 2019. All new sales staff should receive training within the first week of joining, and extra training within the first month of joining the company.
In May 2019 the company carried out a survey. The survey was conducted with all sales staff using a questionnaire. Read through the survey and highlight important questions.
Activity 1: Application

All rights reserved. No part of this bage m
ay be reproduced, stored in a retieval system or transm
itted in any form or by any m
eans without prior perm
ission in writing of the publisher.
All rights reserved. No part of this bage m
ay be reproduced, stored in a retieval system or transm
itted in any form or by any m
eans without prior perm
ission in writing of the publisher.
28
Social Studies - Grade 11 Term 3
Staff Survey May 2019
Please fill in the relevant information below as accurately as you can.
Name: __________________________________________________________________________________________________
Employee Reference Number _______________________________________________________________________
Q1: What date did you join the company? _________________________________________________________
Q2: Which branch do you work at? ________________________________________________________________
Q3: What was the last rating given by your Manager?
1 2 3 4 5
Q4: On a scale of 1 to 5 how satisfied would you say you are with your line manager?
Not sure Not Satisfied Somewhat Satisfied
Satisfied Very Satisfied
1 2 3 4 5
Q5: On a scale of 1 to 5 how satisfied would you say you are with your Work Conditions?
Not sure Not Satisfied Somewhat Satisfied
Satisfied Very Satisfied
1 2 3 4 5
Q6: What was your sales Performance rating in April?
1 2 3 4 5
Q7: Did you receive extra training
Yes No
Q8: In which Emirate do you live?
Sharjah Dubai Other

All r
ight
s re
serv
ed. N
o pa
rt o
f thi
s ba
ge m
ay b
e re
prod
uced
, sto
red
in a
retie
val s
yste
m o
r tra
nsm
itted
in a
ny fo
rm o
r by
any
mea
ns w
ithou
t prio
r per
miss
ion
in w
ritin
g of
the
publ
isher
. Al
l rig
hts
rese
rved
. No
part
of t
his
bage
may
be
repr
oduc
ed, s
tore
d in
a re
tieva
l sys
tem
or t
rans
mitt
ed in
any
form
or b
y an
y m
eans
with
out p
rior p
erm
issio
n in
writ
ing
of th
e pu
blish
er.
29
Social Studies - Grade 11 Term 3
Lesson 2 | Quantitative Data Analysis
In pairs or groups, brainstorm the strengths and weaknesses of the questionnaire above.
Activity 2: Discussion

All rights reserved. No part of this bage m
ay be reproduced, stored in a retieval system or transm
itted in any form or by any m
eans without prior perm
ission in writing of the publisher.
All rights reserved. No part of this bage m
ay be reproduced, stored in a retieval system or transm
itted in any form or by any m
eans without prior perm
ission in writing of the publisher.
30
Social Studies - Grade 11 Term 3
Instructions: Answer the questions. Which questions are closed questions and which questions are scaled?
Identify at least 2 questions that can potentially lead to inaccurate or biased responses. Discuss why?
_____________________________________________________________________________________________________
_____________________________________________________________________________________________________
_____________________________________________________________________________________________ _______
_____________________________________________________________________________________________________
_____________________________________________________________________________________________________
______________________________________________________________________________________
The results from the questionnaire were transferred to an excel sheet.
Note: You should use this data set to complete related activities. However, your class teacher may also give students additional data, or a different data set altogether. Either way, you need to follow the steps in the “How-to Guide” provided in this lesson to complete related activities. You should first prepare this data on excel (if possible) before completing activities. The file has been provided with this book which you can use to copy and paste the data below.
Activity 3:
Activity 4:
Concept Check
Concept Check
_____________________________________________________________________________________________________
_____________________________________________________________________________________________________
_____________________________________________________________________________________________

All r
ight
s re
serv
ed. N
o pa
rt o
f thi
s ba
ge m
ay b
e re
prod
uced
, sto
red
in a
retie
val s
yste
m o
r tra
nsm
itted
in a
ny fo
rm o
r by
any
mea
ns w
ithou
t prio
r per
miss
ion
in w
ritin
g of
the
publ
isher
. Al
l rig
hts
rese
rved
. No
part
of t
his
bage
may
be
repr
oduc
ed, s
tore
d in
a re
tieva
l sys
tem
or t
rans
mitt
ed in
any
form
or b
y an
y m
eans
with
out p
rior p
erm
issio
n in
writ
ing
of th
e pu
blish
er.
31
Social Studies - Grade 11 Term 3
Lesson 2 | Quantitative Data Analysis
If your teacher has not given you this data on an excel file, you must transfer it to excel yourself. Make sure this is done accurately, otherwise your analysis in later activities may not be correct.
Employee Reference
Q1 - Joining Date
Q2 - Current Branch
Q3 - Manager Rating in May 2019
Q4 - Employee Satisfac-tion with Manager
Q5 - Employee Satisfac-tion with Work Condi-tions
Q6 - Employee Perfor-mance by Sales
Q7 - Extra Training Received
Q8 - Employee Residence
101 5/3/2019 Dubai 4 3 3 5 1 Dubai
102 2/3/2019 Dubai 3 3 4 4 1 Dubai
103 1/2/2019 Dubai 1 2 2 2 0 Sharjah
104 1/2/2019 Dubai 2 2 1 1 0 Sharjah
105 1/2/2019 Sharjah 2 2 1 1 0 Sharjah
106 15/03/2019 Sharjah 4 3 4 3 1 Sharjah
107 29/03/2019 Sharjah 5 4 5 5 1 Sharjah
108 2/2/2019 Dubai 1 2 1 3 1 Sharjah
109 5/2/2019 Dubai 1 3 3 4 1 Sharjah
110 11/3/2019 Dubai 4 3 5 5 1 Dubai
111 1/2/2019 Dubai 2 1 2 3 1 Sharjah
112 11/3/2019 Dubai 5 4 5 5 1 Dubai
113 12/3/2019 Dubai 5 5 5 5 1 Dubai
114 7/2/2019 Sharjah 3 2 2 3 1 Sharjah
115 3/2/2019 Sharjah 2 1 2 3 1 Sharjah
116 11/2/2019 Sharjah 3 3 3 3 0 Sharjah
117 15/2/2019 Sharjah 2 2 3 2 0 Sharjah
118 7/3/2019 Dubai 5 4 5 5 1 Dubai
119 8/3/2019 Dubai 5 5 5 4 1 Dubai
120 5/2/2019 Sharjah 1 2 2 2 0 Dubai
Activity 5: Application

All rights reserved. No part of this bage m
ay be reproduced, stored in a retieval system or transm
itted in any form or by any m
eans without prior perm
ission in writing of the publisher.
All rights reserved. No part of this bage m
ay be reproduced, stored in a retieval system or transm
itted in any form or by any m
eans without prior perm
ission in writing of the publisher.
32
Social Studies - Grade 11 Term 3
Answer questions related to the data in the table.
Q1. Which branch employs more sales staff?
____________________________________________________________________________________________________________
Q2. Which Emirate do most employees live?
____________________________________________________________________________________________________________
Q3. How many employees received extra training?
____________________________________________________________________________________________________________
Optional bonus question
Q4. Which function on excel makes it easier to obtain the above answers quickly?
____________________________________________________________________________________________________________
Look at the main questionnaire again. Discuss which questions should be changed in order to create a better data set and subsequent analysis.
_____________________________________________________________________________________________________
_____________________________________________________________________________________________________
_____________________________________________________________________________________________ _______
_____________________________________________________________________________________________________
_____________________________________________________________________________________________________
______________________________________________________________________________________ ______________
_____________________________________________________________________________________________________
_____________________________________________________________________________________________________
_______________________________________________________________________________ _____________________
__________________________________________________________________________________________________
Activity 6:
Activity 7:
Concept Check
Reflection

Notes
______________________________________________________________________________________________________
_____________________________________________________________________________________________________________
_____________________________________________________________________________________________________________
_____________________________________________________________________________________________________________
_____________________________________________________________________________________________________________
_____________________________________________________________________________________________________________
_____________________________________________________________________________________________________________
_____________________________________________________________________________________________________________
_____________________________________________________________________________________________________________
_____________________________________________________________________________________________________________
_____________________________________________________________________________________________________________
_____________________________________________________________________________________________________________
_____________________________________________________________________________________________________________
_____________________________________________________________________________________________________________
_____________________________________________________________________________________________________________
_____________________________________________________________________________________________________________
_____________________________________________________________________________________________________________
_____________________________________________________________________________________________________________
_____________________________________________________________________________________________________________
_____________________________________________________________________________________________________________
_____________________________________________________________________________________________________________
_____________________________________________________________________________________________________________
All r
ight
s re
serv
ed. N
o pa
rt o
f thi
s ba
ge m
ay b
e re
prod
uced
, sto
red
in a
retie
val s
yste
m o
r tra
nsm
itted
in a
ny fo
rm o
r by
any
mea
ns w
ithou
t prio
r per
miss
ion
in w
ritin
g of
the
publ
isher
. Al
l rig
hts
rese
rved
. No
part
of t
his
bage
may
be
repr
oduc
ed, s
tore
d in
a re
tieva
l sys
tem
or t
rans
mitt
ed in
any
form
or b
y an
y m
eans
with
out p
rior p
erm
issio
n in
writ
ing
of th
e pu
blish
er.
33
Social Studies - Grade 11 Term 3
Lesson 2 | Quantitative Data Analysis

34
LESSON 3: UNIT OF ANALYSIS

35
Lesson Objective:
By the end of the lesson, students will:
� apply different methods of analysis.
Key Vocabulary
unit of analysis
nominal
ordinal
interval
ratio

All rights reserved. No part of this bage m
ay be reproduced, stored in a retieval system or transm
itted in any form or by any m
eans without prior perm
ission in writing of the publisher.
All rights reserved. No part of this bage m
ay be reproduced, stored in a retieval system or transm
itted in any form or by any m
eans without prior perm
ission in writing of the publisher.
36
Social Studies - Grade 11 Term 3
Look at the data set provided in the previous lesson.
In small groups or pairs brainstorm some of the challenges you might face when analysing employee information as it is presented in the set.
WARM UP: BRAINSTORM

All r
ight
s re
serv
ed. N
o pa
rt o
f thi
s ba
ge m
ay b
e re
prod
uced
, sto
red
in a
retie
val s
yste
m o
r tra
nsm
itted
in a
ny fo
rm o
r by
any
mea
ns w
ithou
t prio
r per
miss
ion
in w
ritin
g of
the
publ
isher
. Al
l rig
hts
rese
rved
. No
part
of t
his
bage
may
be
repr
oduc
ed, s
tore
d in
a re
tieva
l sys
tem
or t
rans
mitt
ed in
any
form
or b
y an
y m
eans
with
out p
rior p
erm
issio
n in
writ
ing
of th
e pu
blish
er.
37
Social Studies - Grade 11 Term 3
Lesson 3 | Unit of analysis
CASE STUDY: JADID TRADING LLC (CONTINUED)
CASE STUDY: JADID TRADING LLC (CONTINUED)
Jadid Trading LLC mainly conducted the survey to find out why certain sales staff were underperforming. They have given this task to you. The company expects a detailed analysis of data with reasons for why some sales staff might not be performing to expectations. You will continue with this work over the next few lessons. Go back to the previous lesson and the “How-to Guide” for conducting quantitative data analysis. After you have prepared the data (steps 1-3), the data is ready for analysis. First, you need to identify the unit of analysis.
After confirming that the unit of analysis as employee performance, and the units of observation related to other details about sales staff, you are nearly ready to start the analysis process. However, first you need to identify the level of measurement relevant to the data set. Keep in mind there might be different levels of measurements that are best suited to individual questions. Therefore, a questionnaire can include multiple levels of measurements. Here is some more information about levels of measurements. Apply this information to complete related activities.
Instructions: Answer the questions.
Q1. What are your units of observation?
____________________________________________________________________________________________________________
Q2. What is your unit of analysis?
____________________________________________________________________________________________________________
Activity 1: Concept Check

All rights reserved. No part of this bage m
ay be reproduced, stored in a retieval system or transm
itted in any form or by any m
eans without prior perm
ission in writing of the publisher.
All rights reserved. No part of this bage m
ay be reproduced, stored in a retieval system or transm
itted in any form or by any m
eans without prior perm
ission in writing of the publisher.
38
Social Studies - Grade 11 Term 3
How many levels of measurements were discussed in step 4? Circle the correct number
1 6 3 4 5
Level of Measurement: Nominal data
Nominal data is basic classification data. The simplest level of measurement usually includes names. By itself it does not have any quantitative value and cannot be measured. Instead, these can be grouped together to measure other variables. For example, fathers and mothers, males and females, Rome and Venice, can all make up nominal data. They can be grouped. For example, males and females can be used to measure other variables. One example could be male and female students’ scores in an English exam. In this example, the nominal data (male and female) is being used to label other variables, like scores in an English exam. This type of data can be grouped together into categories to analyse each category. For example, the percentage of males in the English class.
Level of Measurement: Ordinal data
Ordinal data is data or information in a logical order. For example, very sad, sad, happy, very happy are usually used in scaled questions (1 to something), where the difference between values follows a logical order, and used to rank information. But, the difference between them is not necessarily the same. For example, the number of people who said between somewhat satisfied, and satisfied. This type of data is usually presented in tables, charts, bar graphs, etc. Lastly, this type of data is not constant, meaning the values change with the variables. For example, the number of participants that pick different options may change their value, i.e. very sad (3 people), sad (5 people), happy (3 people), very happy (7 people).
Activity 2: Concept Check
All r
ight
s re
serv
ed. N
o pa
rt o
f thi
s ba
ge m
ay b
e re
prod
uced
, sto
red
in a
retie
val s
yste
m o
r tra
nsm
itted
in a
ny fo
rm o
r by
any
mea
ns w
ithou
t prio
r per
miss
ion
in w
ritin
g of
the
publ
isher
. Al
l rig
hts
rese
rved
. No
part
of t
his
bage
may
be
repr
oduc
ed, s
tore
d in
a re
tieva
l sys
tem
or t
rans
mitt
ed in
any
form
or b
y an
y m
eans
with
out p
rior p
erm
issio
n in
writ
ing
of th
e pu
blish
er.
39
Social Studies - Grade 11 Term 3
Lesson 3 | Unit of analysis
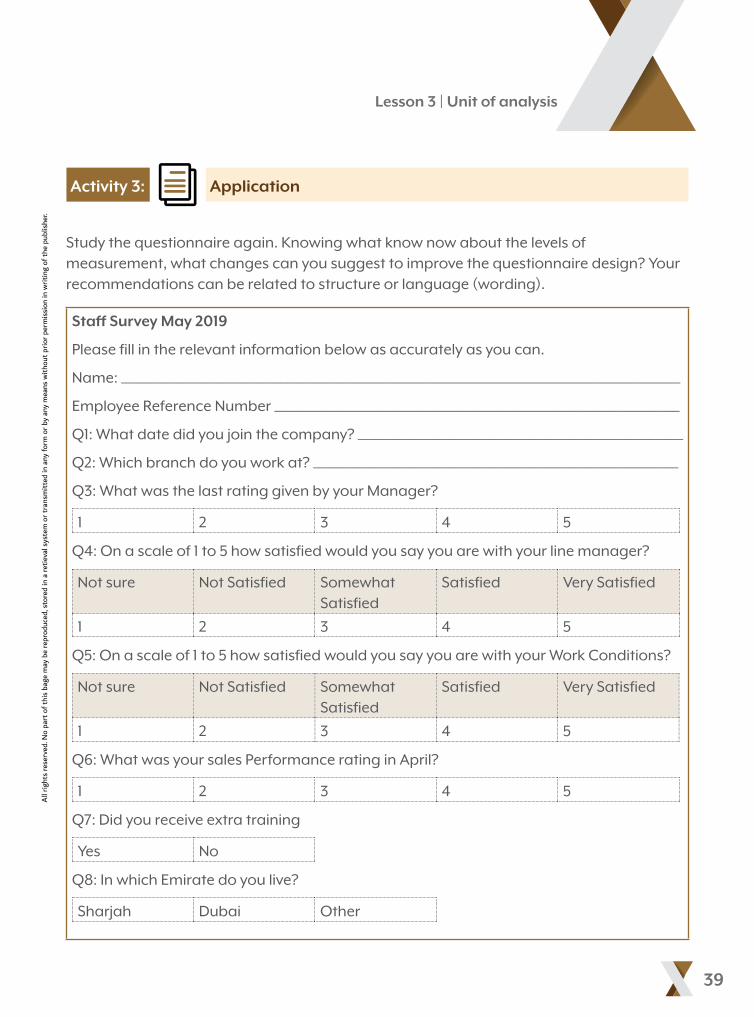
Study the questionnaire again. Knowing what know now about the levels of measurement, what changes can you suggest to improve the questionnaire design? Your recommendations can be related to structure or language (wording).
Staff Survey May 2019
Please fill in the relevant information below as accurately as you can.
Name: __________________________________________________________________________________________________
Employee Reference Number _______________________________________________________________________
Q1: What date did you join the company? _________________________________________________________
Q2: Which branch do you work at? ________________________________________________________________
Q3: What was the last rating given by your Manager?
1 2 3 4 5
Q4: On a scale of 1 to 5 how satisfied would you say you are with your line manager?
Not sure Not Satisfied Somewhat Satisfied
Satisfied Very Satisfied
1 2 3 4 5
Q5: On a scale of 1 to 5 how satisfied would you say you are with your Work Conditions?
Not sure Not Satisfied Somewhat Satisfied
Satisfied Very Satisfied
1 2 3 4 5
Q6: What was your sales Performance rating in April?
1 2 3 4 5
Q7: Did you receive extra training
Yes No
Q8: In which Emirate do you live?
Sharjah Dubai Other
Activity 3: Application

All rights reserved. No part of this bage m
ay be reproduced, stored in a retieval system or transm
itted in any form or by any m
eans without prior perm
ission in writing of the publisher.
All rights reserved. No part of this bage m
ay be reproduced, stored in a retieval system or transm
itted in any form or by any m
eans without prior perm
ission in writing of the publisher.
40
Social Studies - Grade 11 Term 3
Which question/s could have been given to a different sample to improve reliability?
____________________________________________________________________________________________________________
____________________________________________________________________________________________________________
____________________________________________________________________________________________________________
____________________________________________________________________________________________________________
____________________________________________________________________________________________________________
____________________________________________________________________________________________________________
In the table below, outline which levels of measurement can be applied to different questions.
Level of Measurement Question Number/s
Nominal
Ordinal
Interval
Ratio (scale)
Activity 4:
Activity 5:
Concept Check
Concept Check

All r
ight
s re
serv
ed. N
o pa
rt o
f thi
s ba
ge m
ay b
e re
prod
uced
, sto
red
in a
retie
val s
yste
m o
r tra
nsm
itted
in a
ny fo
rm o
r by
any
mea
ns w
ithou
t prio
r per
miss
ion
in w
ritin
g of
the
publ
isher
. Al
l rig
hts
rese
rved
. No
part
of t
his
bage
may
be
repr
oduc
ed, s
tore
d in
a re
tieva
l sys
tem
or t
rans
mitt
ed in
any
form
or b
y an
y m
eans
with
out p
rior p
erm
issio
n in
writ
ing
of th
e pu
blish
er.
41
Social Studies - Grade 11 Term 3
Lesson 3 | Unit of analysis
The data set above has a mix of different types of nominal, ordinal, interval and scaled data.
Discuss what problems this could lead to when it comes to analysing the data.
____________________________________________________________________________________________________________
____________________________________________________________________________________________________________
____________________________________________________________________________________________________________
____________________________________________________________________________________________________________
____________________________________________________________________________________________________________
____________________________________________________________________________________________________________
____________________________________________________________________________________________________________
____________________________________________________________________________________________________________
____________________________________________________________________________________________________________
____________________________________________________________________________________________________________
____________________________________________________________________________________________________________
____________________________________________________________________________________________________________
____________________________________________________________________________________________________________
____________________________________________________________________________________________________________
____________________________________________________________________________________________________________
____________________________________________________________________________________________________________
____________________________________________________________________________________________________________
____________________________________________________________________________________________________________
Activity 6: Application and Reflection

42
LESSON 4: METHODS OF QUANTITATIVE DATA ANALYSIS

43
Lesson Objective:
By the end of the lesson, students will:
� develop their understanding of quantitative data and descriptive analysis
� apply descriptive analysis
Key Vocabulary
descriptive analysis
frequency distributions
percent distributions
replicate
patterns
tabulation
statistic

All rights reserved. No part of this bage m
ay be reproduced, stored in a retieval system or transm
itted in any form or by any m
eans without prior perm
ission in writing of the publisher.
All rights reserved. No part of this bage m
ay be reproduced, stored in a retieval system or transm
itted in any form or by any m
eans without prior perm
ission in writing of the publisher.
44
Social Studies - Grade 11 Term 3
Complete the exercises below. You only have 60 seconds to complete all 4 questions.
Questions Answers
1,4,5,3,3,3,3,5,2,2,2,1,5,4,1,5,3,5,2,5,6,5,1,1
What is the frequency of 1?
Which number has the highest frequency?
In a class of 20 students, only 5 passed the Math exam.
What percentage of students failed?
What percentage of students passed?
WARM UP: BRAINSTORM

All r
ight
s re
serv
ed. N
o pa
rt o
f thi
s ba
ge m
ay b
e re
prod
uced
, sto
red
in a
retie
val s
yste
m o
r tra
nsm
itted
in a
ny fo
rm o
r by
any
mea
ns w
ithou
t prio
r per
miss
ion
in w
ritin
g of
the
publ
isher
. Al
l rig
hts
rese
rved
. No
part
of t
his
bage
may
be
repr
oduc
ed, s
tore
d in
a re
tieva
l sys
tem
or t
rans
mitt
ed in
any
form
or b
y an
y m
eans
with
out p
rior p
erm
issio
n in
writ
ing
of th
e pu
blish
er.
45
Social Studies - Grade 11 Term 3
Lesson 4 | Methods of Quantitative Data Analysis
DATA TABULATION, FREQUENCY DISTRIBUTIONS & PERCENT
DISTRIBUTIONS
Deciding on the level of measurement you need to create tables for your raw data is an important step in data analysis. It further develops your understanding of the data and helps in identifying patterns. This process also confirms the total values in each category.
You need to identify which questions go together, and have the same level of measurement. Then start with the basics and calculate frequency (how many times something happens), and percent distributions (how much of the total does each category represent).
Note: At this stage it is important to have transferred all the data onto excel as you will be completing a number of exercises based on this data below. Alternatively, you can use graph paper, calculator and additional resources to complete manually, but that will take you much longer.

All rights reserved. No part of this bage m
ay be reproduced, stored in a retieval system or transm
itted in any form or by any m
eans without prior perm
ission in writing of the publisher.
All rights reserved. No part of this bage m
ay be reproduced, stored in a retieval system or transm
itted in any form or by any m
eans without prior perm
ission in writing of the publisher.
46
Social Studies - Grade 11 Term 3
Activity 1: Online Survey Mini-Project
The first question in the data set looks at joining dates. Think about how you can group these together to create a frequency table?
Employee Reference
Q1 - Joining Date
Q2 - Current Branch
Q3 - Manager Rating in May 2019
Q4 - Em-ployee Satisfac-tion with Manager
Q5 - Em-ployee Sat-isfaction with Work Conditions
Q6 - Em-ployee Per-formance by Sales
Q7 - Extra Training Received
Q8 - Em-ployee Residence
101 5/3/2019 Dubai 4 3 3 5 1 Dubai
102 2/3/2019 Dubai 3 3 4 4 1 Dubai
103 1/2/2019 Dubai 1 2 2 2 0 Sharjah
104 1/2/2019 Dubai 2 2 1 1 0 Sharjah
105 1/2/2019 Sharjah 2 2 1 1 0 Sharjah
106 15/03/2019 Sharjah 4 3 4 3 1 Sharjah
107 29/03/2019 Sharjah 5 4 5 5 1 Sharjah
108 2/2/2019 Dubai 1 2 1 3 1 Sharjah
109 5/2/2019 Dubai 1 3 3 4 1 Sharjah
110 11/3/2019 Dubai 4 3 5 5 1 Dubai
111 1/2/2019 Dubai 2 1 2 3 1 Sharjah
112 11/3/2019 Dubai 5 4 5 5 1 Dubai
113 12/3/2019 Dubai 5 5 5 5 1 Dubai
114 7/2/2019 Sharjah 3 2 2 3 1 Sharjah
115 3/2/2019 Sharjah 2 1 2 3 1 Sharjah
116 11/2/2019 Sharjah 3 3 3 3 0 Sharjah
117 15/2/2019 Sharjah 2 2 3 2 0 Sharjah
118 7/3/2019 Dubai 5 4 5 5 1 Dubai
119 8/3/2019 Dubai 5 5 5 4 1 Dubai
120 5/2/2019 Sharjah 1 2 2 2 0 Dubai

All r
ight
s re
serv
ed. N
o pa
rt o
f thi
s ba
ge m
ay b
e re
prod
uced
, sto
red
in a
retie
val s
yste
m o
r tra
nsm
itted
in a
ny fo
rm o
r by
any
mea
ns w
ithou
t prio
r per
miss
ion
in w
ritin
g of
the
publ
isher
. Al
l rig
hts
rese
rved
. No
part
of t
his
bage
may
be
repr
oduc
ed, s
tore
d in
a re
tieva
l sys
tem
or t
rans
mitt
ed in
any
form
or b
y an
y m
eans
with
out p
rior p
erm
issio
n in
writ
ing
of th
e pu
blish
er.
47
Social Studies - Grade 11 Term 3
Lesson 4 | Methods of Quantitative Data Analysis
Insert frequency table here
Frequency distributions are presented in a table with the number of individual scores that can be grouped in the same category. Since there are too many different joining dates in the data set, it is useful to group them in a logical order. In this case, 2 weeks apart is one way of doing it.
1st Feb to 14 Feb 15th Feb to 28th Feb
1st March to 14 March
15th March to 31 March
Q1 - Joining Date
10 2 7 1

All rights reserved. No part of this bage m
ay be reproduced, stored in a retieval system or transm
itted in any form or by any m
eans without prior perm
ission in writing of the publisher.
All rights reserved. No part of this bage m
ay be reproduced, stored in a retieval system or transm
itted in any form or by any m
eans without prior perm
ission in writing of the publisher.
48
Social Studies - Grade 11 Term 3
Activity 2: Application
The examples below show the rest. But, there are other ways of doing it. Can you replicate these in your excel sheet with the right answers? Your teacher may suggest different ways of creating the groups to calculate frequency distributions.
Q2: Which branch do you work at?
Sharjah Dubai
Q2 - Current Branch
Q3: What was the last rating given by your Manager?
Rating 1 Rating 2 Rating 3 Rating 4 Rating 5
Q3 - Manager Rating in May 2019
Q4: On a scale of 1 to 5 how satisfied would you say you are with your line manager?
Rating 1 Rating 2 Rating 3 Rating 4 Rating 5
Q4 - Employee Satisfaction with Manager
This process of tabulation makes it easier for the researcher to understand the date, identify mistakes, and start identifying patterns. Researchers would be developing these tables, finding frequencies, assigning percentages and preparing graphs all at the same time. This is an important part of the data analysis process as it allows the researcher to adjust how the data is displayed. For example, you would have noticed how the questions 2, 7 and 8 have been displayed differently compared to how they were posed in the questionnaire. Why do you think this is?
Percent Distribution
A percent distribution shows the quantity of respondents who are represented within each category. For example, question 8 shows 40% of respondents live in Dubai while 60% live in Sharjah. As nominal measures, they will not tell you anything more until you compare and contrast with other information.

All r
ight
s re
serv
ed. N
o pa
rt o
f thi
s ba
ge m
ay b
e re
prod
uced
, sto
red
in a
retie
val s
yste
m o
r tra
nsm
itted
in a
ny fo
rm o
r by
any
mea
ns w
ithou
t prio
r per
miss
ion
in w
ritin
g of
the
publ
isher
. Al
l rig
hts
rese
rved
. No
part
of t
his
bage
may
be
repr
oduc
ed, s
tore
d in
a re
tieva
l sys
tem
or t
rans
mitt
ed in
any
form
or b
y an
y m
eans
with
out p
rior p
erm
issio
n in
writ
ing
of th
e pu
blish
er.
49
Social Studies - Grade 11 Term 3
Lesson 4 | Methods of Quantitative Data Analysis
Activity 3: Application
An example has been provided for you below. Using the excel function or calculator, add an additional row to all the tables, and calculate the percentage weights for all responses.
1st Feb to 14 Feb 15th Feb to 28th Feb
1st March to 14 March
15th March to 31 March
Q1 - Joining Date 10 2 7 1
50% 10% 35% 5%
Q2: Which branch do you work at?
Sharjah Dubai
Q2 - Current Branch
Q3: What was the last rating given by your Manager?
Rating 1 Rating 2 Rating 3 Rating 4 Rating 5
Q3 - Manager Rating in May 2019
Q4: On a scale of 1 to 5 how satisfied would you say you are with your line manager?
Rating 1 Rating 2 Rating 3 Rating 4 Rating 5
Q4 - Employee Satisfaction with Manager
Q5: On a scale of 1 to 5 how satisfied would you say you are with your Work Conditions?
Not sure Not Satisfied
Somewhat Satisfied
Satisfied Very Satisfied
Q5 - Employee Satisfaction with Work Conditions

All rights reserved. No part of this bage m
ay be reproduced, stored in a retieval system or transm
itted in any form or by any m
eans without prior perm
ission in writing of the publisher.
All rights reserved. No part of this bage m
ay be reproduced, stored in a retieval system or transm
itted in any form or by any m
eans without prior perm
ission in writing of the publisher.
50
Social Studies - Grade 11 Term 3
Q6: What was your sales Performance rating in April?
Rating 1 Rating 2 Rating 3 Rating 4 Rating 5
Q6 - Employee Performance by Sales
Q7: Did you receive extra training
No Yes
Q7 - Extra Training Received
Q8: In which Emirate do you live?
Other Dubai Sharjah
Q8 - Employee Residence
Descriptive Analysis
Once you start the tabulation process with frequencies and percentage scores, the data analysis is started. However, you need to start describing that it is telling the reading. The two commonly used quantitative data analysis methods are descriptive and inferential analysis. Descriptive analysis is used when the researchers is looking at a specific issue (like the one above), and the sample size is relatively small. Descriptive simply mean describing the data. You have a number of tools to do this:
ɮ mean = the numerical average value ɮ minimum and maximum values – the highest and lowest value ɮ median – the numerical middle value ɮ mode: the most common value
You will not need to run all of these for a data set, in fact depending the data set and questions, in most cases the mean is enough to describe the data. But keep in mind the mean (or average) can only be calculated for interval and ratio data.
Activity 3: Application

All r
ight
s re
serv
ed. N
o pa
rt o
f thi
s ba
ge m
ay b
e re
prod
uced
, sto
red
in a
retie
val s
yste
m o
r tra
nsm
itted
in a
ny fo
rm o
r by
any
mea
ns w
ithou
t prio
r per
miss
ion
in w
ritin
g of
the
publ
isher
. Al
l rig
hts
rese
rved
. No
part
of t
his
bage
may
be
repr
oduc
ed, s
tore
d in
a re
tieva
l sys
tem
or t
rans
mitt
ed in
any
form
or b
y an
y m
eans
with
out p
rior p
erm
issio
n in
writ
ing
of th
e pu
blish
er.
51
Social Studies - Grade 11 Term 3
Lesson 4 | Methods of Quantitative Data Analysis
Complete the exercises below. You only have 120 seconds to complete all 4 questions.
Questions Answers
1,4,5,3,3,3,3,5,2,2,2,1,5,4,1,5,3,5,2,5,6,5,1,1
What is the Max & Min in this range?
Which number appears the most amount of time (Mode)?
Calculate the median for the numbers above?
Calculate the mean for the numbers above?
Case Study: Jadid Trading LLC (continued)
Employ-ee Refer-ence
Q1 - Joining Date
Q2 - Current Branch
Q3 - Manager Rating in May 2019
Q4 - Em-ployee Satisfac-tion with Manager
Q5 - Em-ployee Sat-isfaction with Work Conditions
Q6 - Em-ployee Per-formance by Sales
Q7 - Extra Training Received
Q8 - Em-ployee Residence
101 5/3/2019 Dubai 4 3 3 5 1 Dubai
102 2/3/2019 Dubai 3 3 4 4 1 Dubai
103 1/2/2019 Dubai 1 2 2 2 0 Sharjah
104 1/2/2019 Dubai 2 2 1 1 0 Sharjah
105 1/2/2019 Sharjah 2 2 1 1 0 Sharjah
106 15/03/2019 Sharjah 4 3 4 3 1 Sharjah
107 29/03/2019 Sharjah 5 4 5 5 1 Sharjah
108 2/2/2019 Dubai 1 2 1 3 1 Sharjah
109 5/2/2019 Dubai 1 3 3 4 1 Sharjah
110 11/3/2019 Dubai 4 3 5 5 1 Dubai
111 1/2/2019 Dubai 2 1 2 3 1 Sharjah
112 11/3/2019 Dubai 5 4 5 5 1 Dubai
113 12/3/2019 Dubai 5 5 5 5 1 Dubai
114 7/2/2019 Sharjah 3 2 2 3 1 Sharjah
115 3/2/2019 Sharjah 2 1 2 3 1 Sharjah
116 11/2/2019 Sharjah 3 3 3 3 0 Sharjah
117 15/2/2019 Sharjah 2 2 3 2 0 Sharjah
118 7/3/2019 Dubai 5 4 5 5 1 Dubai
119 8/3/2019 Dubai 5 5 5 4 1 Dubai
120 5/2/2019 Sharjah 1 2 2 2 0 Dubai
Activity 4: Concept Check

All rights reserved. No part of this bage m
ay be reproduced, stored in a retieval system or transm
itted in any form or by any m
eans without prior perm
ission in writing of the publisher.
All rights reserved. No part of this bage m
ay be reproduced, stored in a retieval system or transm
itted in any form or by any m
eans without prior perm
ission in writing of the publisher.
52
Social Studies - Grade 11 Term 3
Look at the Jadid Trading data set again and answer related questions.
Q1. In which branch do most of the employees work?
____________________________________________________________________________________________________________
Q2. In which Emirate do most of the employees live?
____________________________________________________________________________________________________________
Q3. In which month did most of the employees join the company?
____________________________________________________________________________________________________________
Q4. Which descriptive statistic methods can be being used to answer the above questions?
____________________________________________________________________________________________________________
From activity 5, can you see that on their own, descriptive analysis only describe the data? If you were only looking at question 1, you would only know which branch was employing the most amount of sales staff. It does not tell you anything more (12 employees in Dubai and 8 in Sharjah). Yes, it shows there are more sales staff in Dubai. However, they do not explain the reasoning behind responses, they simply report on the responses. That is why descriptive analysis is used mainly to summarize data into a manageable format that might show patterns. Once we do similar exercises for all questions these, patterns might be easier to see.
Descriptive Analysis (continued)
As you can you see, some descriptive statistics are better suited to specific questions. It should now also be clearer that these descriptive analyses only describe the numbers in the variable. Up to now, we have been looking at these variables individually. This is also known as univariate analysis. Working out the mean has enabled us to better understand individual responses when compared to the whole, even though we might still be focusing on a single variable. For example, in question 3 or 4, there is a better understanding of what is going on. The tables we made earlier can help enhance this understanding.
Activity 5: Application

All r
ight
s re
serv
ed. N
o pa
rt o
f thi
s ba
ge m
ay b
e re
prod
uced
, sto
red
in a
retie
val s
yste
m o
r tra
nsm
itted
in a
ny fo
rm o
r by
any
mea
ns w
ithou
t prio
r per
miss
ion
in w
ritin
g of
the
publ
isher
. Al
l rig
hts
rese
rved
. No
part
of t
his
bage
may
be
repr
oduc
ed, s
tore
d in
a re
tieva
l sys
tem
or t
rans
mitt
ed in
any
form
or b
y an
y m
eans
with
out p
rior p
erm
issio
n in
writ
ing
of th
e pu
blish
er.
53
Social Studies - Grade 11 Term 3
Lesson 4 | Methods of Quantitative Data Analysis
Using the Jadid Trading L.L.C. data set and tables you completed earlier, answer the related questions. On average, the manager gave employees a rating of 3. You can now use this information to work out how many of the employees are above and below average. You can do this for groups using the table we completed earlier, and for individuals using the raw data set. The individual comparison would only be useful for very specific purposes, like if you were carrying out an appraisal.
Q3: What was the last rating given by your Manager?
Rating 1 Rating 2 Rating 3 Rating 4 Rating 5
Q3 - Manager Rating in May 2019
Q1. In question 3 how many of the employees are above and below the average rating given by the manager?
Above _________ Below _________
Q2. Look at employees with reference numbers 107 and 108. Are they performing above or below manager’s average rating? Explain your answer.
__________________________________________________________________________________________________________
__________________________________________________________________________________________________________
__________________________________________________________________________________________________________
While the mean scores are important, it is vital to remember that they only provide a description of what the variable is showing. They do not explain the rationale or reasoning behind those numbers. If the researcher or the person analysing the data does not understand the question, then it can all go wrong. For example, in question 4 of the questionnaires the employees were asked “how satisfied would you say you are with your line manager?”
The average for this question was 2.8, very close to the median of 3. So, over all it does not look so bad. But go back to the actual questionnaires. What does 2.8 really mean? Upon closer inspection, you can see that on average employees are either “not satisfied” or just “somewhat satisfied” with the manager. If we consider the rating 1 which basically says, “not sure,” then the average of 2.8 is even worse.
Activity 6: Application

All rights reserved. No part of this bage m
ay be reproduced, stored in a retieval system or transm
itted in any form or by any m
eans without prior perm
ission in writing of the publisher.
All rights reserved. No part of this bage m
ay be reproduced, stored in a retieval system or transm
itted in any form or by any m
eans without prior perm
ission in writing of the publisher.
54
Social Studies - Grade 11 Term 3
Using the same data set above answer related questions.
Q4: On a scale of 1 to 5 how satisfied would you say you are with your line manager?
Rating 1 Rating 2 Rating 3 Rating 4 Rating 5
Q4 - Employee Satisfaction with Manager
Q1. In question 4 how many of the employees rate the manager above and below the average?
Above _________ Below _________
Q2. What does this rating say about what most employees think about the manager?
__________________________________________________________________________________________________________
__________________________________________________________________________________________________________
__________________________________________________________________________________________________________
Optional Extension Activity
Activity 7: Application

All r
ight
s re
serv
ed. N
o pa
rt o
f thi
s ba
ge m
ay b
e re
prod
uced
, sto
red
in a
retie
val s
yste
m o
r tra
nsm
itted
in a
ny fo
rm o
r by
any
mea
ns w
ithou
t prio
r per
miss
ion
in w
ritin
g of
the
publ
isher
. Al
l rig
hts
rese
rved
. No
part
of t
his
bage
may
be
repr
oduc
ed, s
tore
d in
a re
tieva
l sys
tem
or t
rans
mitt
ed in
any
form
or b
y an
y m
eans
with
out p
rior p
erm
issio
n in
writ
ing
of th
e pu
blish
er.
55
Social Studies - Grade 11 Term 3
Lesson 4 | Methods of Quantitative Data Analysis
Apply the same approach to questions 5 and 6. Consider how many employees are above and below the average, but also comment on what this shows. Write this information out in paragraphs. Use statistic and the terms from questions to make comparisons for questions 5 and 6 individually. Then try to see if you can find any relationships or patterns between the responses in questions 5 and 6.
Q5: On a scale of 1 to 5 how satisfied would you say you are with your Work Conditions?
Not sure Not Satisfied
Somewhat Satisfied
Satisfied Very Satisfied
Q5 - Employee Satisfaction with Work Conditions
Average = 3.15
Q6: What was your sales Performance rating in April?
Rating 1 Rating 2 Rating 3 Rating 4 Rating 5
Q6 - Employee Performance by Sales
Average = 3.5
__________________________________________________________________________________________________________
__________________________________________________________________________________________________________
__________________________________________________________________________________________________________
Activity 9: Application

56
LESSON 5: MID-TERM REVIEW

57
Lesson Objective:
By the end of the lesson, students will:
� check their understanding of lessons one through four
� reflect on areas for improvement
Key Vocabulary
Review keywords for lessons one through four.
Important Note: The activities provided below serve as a review and do not represent the full scope of materials for the final examination. In order to succeed in the final examination students should ensure they have a sound understanding of key concepts in all in Lessons
What are the key differences between an Inductive and Deductive Approach?
______________________________________________________________________________________________________
______________________________________________________________________________________________________
______________________________________________________________________________________________________
Connect the method of analysis with the most relevant statement.
Method Statement
content analysis I will read interview data and analyse the discussion to assess what the respondent liked or disliked.
narrative analysis I will read interview data to assess what the respondent liked or disliked then compare it to other studies to explain why they may have had these likes and dislikes.
discourse analysis I will read interview data to assess what the respondent liked or disliked.
grounded theory I will read interview data and make connections between different things the responded said to assess whether there is a story to be told about their likes and dislikes.
All rights reserved. No part of this bage m
ay be reproduced, stored in a retieval system or transm
itted in any form or by any m
eans without prior perm
ission in writing of the publisher.
All rights reserved. No part of this bage m
ay be reproduced, stored in a retieval system or transm
itted in any form or by any m
eans without prior perm
ission in writing of the publisher.
58
Social Studies - Grade 11 Term 3

Describe closed, open and scaled questions?
Open Questions: ___________________________________________________________________________Closed Questions: ___________________________________________________________________________Scaled Questions: ___________________________________________________________________________
What is the difference between a unit of observation and unit of analysis?
______________________________________________________________________________________________________
______________________________________________________________________________________________________
______________________________________________________________________________________________________
Use the table below to explain each level of measurement.
Level of Measurement Explanation
Nominal
Ordinal
Interval
Ratio (scale)
What is the difference between Data tabulation, frequency distributions & percent distributions?
______________________________________________________________________________________________________
______________________________________________________________________________________________________
______________________________________________________________________________________________________
All r
ight
s re
serv
ed. N
o pa
rt o
f thi
s ba
ge m
ay b
e re
prod
uced
, sto
red
in a
retie
val s
yste
m o
r tra
nsm
itted
in a
ny fo
rm o
r by
any
mea
ns w
ithou
t prio
r per
miss
ion
in w
ritin
g of
the
publ
isher
. Al
l rig
hts
rese
rved
. No
part
of t
his
bage
may
be
repr
oduc
ed, s
tore
d in
a re
tieva
l sys
tem
or t
rans
mitt
ed in
any
form
or b
y an
y m
eans
with
out p
rior p
erm
issio
n in
writ
ing
of th
e pu
blish
er.
59
Social Studies - Grade 11 Term 3
Lesson 5 | Mid-term Review

Connect the key terms with the correct description
Key term Description
median the numerical average value
mean the highest and lowest value
mode the numerical middle value
minimum and maximum values the most common value
Go back to activity 1 and 2 in lesson 4.
Use the survey results to complete the tables below. Then replicate these in your excel sheet with the right answers? Your teacher may suggest different ways of creating the groups to calculate frequency distributions.
Q5: On a scale of 1 to 5 how satisfied would you say you are with your Work Conditions?
Not sure Not Satisfied Somewhat Satisfied
Satisfied Very Satisfied
Q5 - Employee Satisfaction with Work Conditions
Q6: What was your sales Performance rating in April?
Rating 1 Rating 2 Rating 3 Rating 4 Rating 5
Q6 - Employee Performance by Sales
Q7: Did you receive extra training
No Yes
Q7 - Extra Training Received
All rights reserved. No part of this bage m
ay be reproduced, stored in a retieval system or transm
itted in any form or by any m
eans without prior perm
ission in writing of the publisher.
All rights reserved. No part of this bage m
ay be reproduced, stored in a retieval system or transm
itted in any form or by any m
eans without prior perm
ission in writing of the publisher.
60
Social Studies - Grade 11 Term 3

Q8: In which Emirate do you live?
Other Dubai Sharjah
Q8 - Employee Residence
Using the survey results provided in lesson 4 answer related questions below.
Q1. What was the mean (average) rating given by the manager in question 3?
______________________________________________________________________________________________________
Q2. What was the mean (average) employee satisfaction with manager in question 4?
______________________________________________________________________________________________________
Q3. What was the mean (average) employee satisfaction with work conditions in question 5?
______________________________________________________________________________________________________
Q4. What was the mean (average) employee performance by sales in question 6?
______________________________________________________________________________________________________
Q5. Why could you not do the same analysis for questions 1, 2, 7 and 8 in the questionnaire in their present form?
______________________________________________________________________________________________________
Using the survey results provided in lesson 4. Consider how many employees are above and below the average, but also comment on what this shows. Write this information out in paragraphs. Use statistic and the terms from questions to make comparisons for questions 5 and 6 individually. Then try to see if you can find any relationships or patterns between the responses in questions 5 and 6.
All r
ight
s re
serv
ed. N
o pa
rt o
f thi
s ba
ge m
ay b
e re
prod
uced
, sto
red
in a
retie
val s
yste
m o
r tra
nsm
itted
in a
ny fo
rm o
r by
any
mea
ns w
ithou
t prio
r per
miss
ion
in w
ritin
g of
the
publ
isher
. Al
l rig
hts
rese
rved
. No
part
of t
his
bage
may
be
repr
oduc
ed, s
tore
d in
a re
tieva
l sys
tem
or t
rans
mitt
ed in
any
form
or b
y an
y m
eans
with
out p
rior p
erm
issio
n in
writ
ing
of th
e pu
blish
er.
61
Social Studies - Grade 11 Term 3
Lesson 5 | Mid-term Review

Q5: On a scale of 1 to 5 how satisfied would you say you are with your Work Conditions?
Not sure Not Satisfied
Somewhat Satisfied
Satisfied Very Satisfied
Q5 - Employee Satisfaction with Work Conditions
Average = 3.15
Q6: What was your sales Performance rating in April?
Rating 1 Rating 2 Rating 3 Rating 4 Rating 5
Q6 - Employee Performance by Sales
Average = 3.5
_____________________________________________________________________________________________________________
_____________________________________________________________________________________________________________
_____________________________________________________________________________________________________________
_____________________________________________________________________________________________________________
_____________________________________________________________________________________________________________
_____________________________________________________________________________________________________________
_____________________________________________________________________________________________________________
_____________________________________________________________________________________________________________
_____________________________________________________________________________________________________________
_____________________________________________________________________________________________________________
_____________________________________________________________________________________________________________
All rights reserved. No part of this bage m
ay be reproduced, stored in a retieval system or transm
itted in any form or by any m
eans without prior perm
ission in writing of the publisher.
All rights reserved. No part of this bage m
ay be reproduced, stored in a retieval system or transm
itted in any form or by any m
eans without prior perm
ission in writing of the publisher.
62
Social Studies - Grade 11 Term 3

Notes
______________________________________________________________________________________________________
_____________________________________________________________________________________________________________
_____________________________________________________________________________________________________________
_____________________________________________________________________________________________________________
_____________________________________________________________________________________________________________
_____________________________________________________________________________________________________________
_____________________________________________________________________________________________________________
_____________________________________________________________________________________________________________
_____________________________________________________________________________________________________________
_____________________________________________________________________________________________________________
_____________________________________________________________________________________________________________
_____________________________________________________________________________________________________________
_____________________________________________________________________________________________________________
_____________________________________________________________________________________________________________
_____________________________________________________________________________________________________________
_____________________________________________________________________________________________________________
_____________________________________________________________________________________________________________
_____________________________________________________________________________________________________________
_____________________________________________________________________________________________________________
_____________________________________________________________________________________________________________
_____________________________________________________________________________________________________________
_____________________________________________________________________________________________________________
All r
ight
s re
serv
ed. N
o pa
rt o
f thi
s ba
ge m
ay b
e re
prod
uced
, sto
red
in a
retie
val s
yste
m o
r tra
nsm
itted
in a
ny fo
rm o
r by
any
mea
ns w
ithou
t prio
r per
miss
ion
in w
ritin
g of
the
publ
isher
. Al
l rig
hts
rese
rved
. No
part
of t
his
bage
may
be
repr
oduc
ed, s
tore
d in
a re
tieva
l sys
tem
or t
rans
mitt
ed in
any
form
or b
y an
y m
eans
with
out p
rior p
erm
issio
n in
writ
ing
of th
e pu
blish
er.
63
Social Studies - Grade 11 Term 3
Lesson 5 | Mid-term Review

64
vw
LESSON 6: DESCRIPTIVE ANALYSIS CONTINUED

65
Lesson Objective:
By the end of the lesson, students will:
� learn how to present descriptive analysis
� further develop their understanding of descriptive analysis and apply it to learn how to identify patterns and relationships
Key Vocabulary
univariate
bivariate
multivariate
variables
categorical
characteristics

All rights reserved. No part of this bage m
ay be reproduced, stored in a retieval system or transm
itted in any form or by any m
eans without prior perm
ission in writing of the publisher.
All rights reserved. No part of this bage m
ay be reproduced, stored in a retieval system or transm
itted in any form or by any m
eans without prior perm
ission in writing of the publisher.
66
Social Studies - Grade 11 Term 3
Draw out a mind of the different variables we can use when trying to find answers to employee performance at Jadid Trading LLC.
WARM UP: MIND MAP
EMPLOYEE
PERFORMANCE

All r
ight
s re
serv
ed. N
o pa
rt o
f thi
s ba
ge m
ay b
e re
prod
uced
, sto
red
in a
retie
val s
yste
m o
r tra
nsm
itted
in a
ny fo
rm o
r by
any
mea
ns w
ithou
t prio
r per
miss
ion
in w
ritin
g of
the
publ
isher
. Al
l rig
hts
rese
rved
. No
part
of t
his
bage
may
be
repr
oduc
ed, s
tore
d in
a re
tieva
l sys
tem
or t
rans
mitt
ed in
any
form
or b
y an
y m
eans
with
out p
rior p
erm
issio
n in
writ
ing
of th
e pu
blish
er.
67
Social Studies - Grade 11 Term 3
Lesson 6 | Descriptive Analysis Continued
JADID TRADING L.L.C (CONTINUED)
If we were only looking at one variable, such as whether employees had training or not, then this was would be univariate. If we look at different variables individually, as we have been doing, then this we would also call it univariate descriptive analysis. However, in order to truly find relationships and patterns within the data, we need to look at them together. If we are looking at 2 variables together then this becomes Bivariate. When comparing multiple variables then we call it a multivariate analysis. At this stage of your study, it is easier to think about them as two different types.
ɮ Descriptive analysis for each individual variable ɮ Descriptive analysis for combinations of variables
We have done most of the hard work already in preparing the data and identifying the different variables. At this stage, it is also useful to separate the variables’ types into quantitative and categorical. As the name suggests, quantitative variables represent quantities or numerical values. For example weight, size or height. In this case study, we only have access to categorical variables, which are represented in qualities or characteristics. For example, joining date, satisfaction with manager, and such.
In the Jadid Trading L.L.C. case study you are trying to work out possible reasons for the poor performance of sales staff in the company. Although you have identified a number of mistakes and drawbacks in the questionnaires and subsequent data set, you still have access to a combination of variables that we can use to find relationships and patterns that might explain the poor performance.

All rights reserved. No part of this bage m
ay be reproduced, stored in a retieval system or transm
itted in any form or by any m
eans without prior perm
ission in writing of the publisher.
All rights reserved. No part of this bage m
ay be reproduced, stored in a retieval system or transm
itted in any form or by any m
eans without prior perm
ission in writing of the publisher.
68
Social Studies - Grade 11 Term 3
Carry out descriptive analysis for each individual variable.
Reuse the frequency tables you have created in the previous lessons and present them in bar charts and doughnut charts. We have given you an example of each type below. Please complete the remaining questions for the data set.
Q1. Replicate the bar graph below using excel.
1st Feb to 14 Feb 15th Feb to 28th Feb
1st March to 14 March
15th March to 31 March
Q1 - Joining Date
10 2 7 1
Q2. What does the dotted line tell us in this graph?
______________________________________________________________________________________________________
______________________________________________________________________________________________________
______________________________________________________________________________________________________
Activity 1: Application

All r
ight
s re
serv
ed. N
o pa
rt o
f thi
s ba
ge m
ay b
e re
prod
uced
, sto
red
in a
retie
val s
yste
m o
r tra
nsm
itted
in a
ny fo
rm o
r by
any
mea
ns w
ithou
t prio
r per
miss
ion
in w
ritin
g of
the
publ
isher
. Al
l rig
hts
rese
rved
. No
part
of t
his
bage
may
be
repr
oduc
ed, s
tore
d in
a re
tieva
l sys
tem
or t
rans
mitt
ed in
any
form
or b
y an
y m
eans
with
out p
rior p
erm
issio
n in
writ
ing
of th
e pu
blish
er.
69
Social Studies - Grade 11 Term 3
Lesson 6 | Descriptive Analysis Continued
Now complete the following exercises for the remaining questions on the questionnaires. Note: Your teacher might give you different types of instructions based on time available and the resources available.
Although it takes time, completing these by hand can be a great learning experience. Remember the main purpose of this exercise is to identify the relationships and patterns that might exist within the data.
Replicate the graphs as shown below. Make sure you are able to use the labels in the same way.
Sharjah Dubai
Q2 - Current Branch
8 12
Use this space to write a short description of what the Pie Chart is telling you?
Activity 2: Application

All rights reserved. No part of this bage m
ay be reproduced, stored in a retieval system or transm
itted in any form or by any m
eans without prior perm
ission in writing of the publisher.
All rights reserved. No part of this bage m
ay be reproduced, stored in a retieval system or transm
itted in any form or by any m
eans without prior perm
ission in writing of the publisher.
70
Social Studies - Grade 11 Term 3
Rating 1 Rating 2 Rating 3 Rating 4 Rating 5
Q3 - Manager Rating in May 2019 4 5 3 3 5
Rating 1 Rating 2 Rating 3 Rating 4 Rating 5
Q4 - Employee Satisfaction with Manager
2 7 6 3 2

All r
ight
s re
serv
ed. N
o pa
rt o
f thi
s ba
ge m
ay b
e re
prod
uced
, sto
red
in a
retie
val s
yste
m o
r tra
nsm
itted
in a
ny fo
rm o
r by
any
mea
ns w
ithou
t prio
r per
miss
ion
in w
ritin
g of
the
publ
isher
. Al
l rig
hts
rese
rved
. No
part
of t
his
bage
may
be
repr
oduc
ed, s
tore
d in
a re
tieva
l sys
tem
or t
rans
mitt
ed in
any
form
or b
y an
y m
eans
with
out p
rior p
erm
issio
n in
writ
ing
of th
e pu
blish
er.
71
Social Studies - Grade 11 Term 3
Lesson 6 | Descriptive Analysis Continued
Not sure Not Satisfied Somewhat Satisfied
Satisfied Very Satisfied
Q5 - Employee Satisfaction with Work Conditions
Rating 1 Rating 2 Rating 3 Rating 4 Rating 5
Q6 - Employee Performance by Sales

All rights reserved. No part of this bage m
ay be reproduced, stored in a retieval system or transm
itted in any form or by any m
eans without prior perm
ission in writing of the publisher.
All rights reserved. No part of this bage m
ay be reproduced, stored in a retieval system or transm
itted in any form or by any m
eans without prior perm
ission in writing of the publisher.
72
Social Studies - Grade 11 Term 3
No Yes
Q7 - Extra Training Received
Dubai Sharjah
Q8 - Employee Residence
Finding Patterns in Data
Up to now we have been looking at individual variables, but this approach is limited to describing the data. In this lesson of quantitative data analysis, you will learn about combination of variables. This will allow us to find relationships and patterns within the data more clearly. This process also allows the researchers to justify their findings and make recommendations.

All r
ight
s re
serv
ed. N
o pa
rt o
f thi
s ba
ge m
ay b
e re
prod
uced
, sto
red
in a
retie
val s
yste
m o
r tra
nsm
itted
in a
ny fo
rm o
r by
any
mea
ns w
ithou
t prio
r per
miss
ion
in w
ritin
g of
the
publ
isher
. Al
l rig
hts
rese
rved
. No
part
of t
his
bage
may
be
repr
oduc
ed, s
tore
d in
a re
tieva
l sys
tem
or t
rans
mitt
ed in
any
form
or b
y an
y m
eans
with
out p
rior p
erm
issio
n in
writ
ing
of th
e pu
blish
er.
73
Social Studies - Grade 11 Term 3
Lesson 6 | Descriptive Analysis Continued
This example shows 2 variables displayed together. Write your responses in the space provided below.
What is the pattern?
What does the trend line tell you?
___________________________________________________________________________________________________________
___________________________________________________________________________________________________________
___________________________________________________________________________________________________________
___________________________________________________________________________________________________________
___________________________________________________________________________________________________________
__________________________________________________________________________________________________________
Rating 1 Rating 2 Rating 3 Rating 4 Rating 5
Q5 - Employee Satisfaction with Work Conditions
3 5 4 2 6
Q6 - Employee Performance by Sales 2 3 6 3 6
Activity 3: Application and Reflection

All rights reserved. No part of this bage m
ay be reproduced, stored in a retieval system or transm
itted in any form or by any m
eans without prior perm
ission in writing of the publisher.
All rights reserved. No part of this bage m
ay be reproduced, stored in a retieval system or transm
itted in any form or by any m
eans without prior perm
ission in writing of the publisher.
74
Social Studies - Grade 11 Term 3
In order to identify relationships between different variables in an easier way, put them together in a graphical form. However, to do this you will need to identify the variables that seem to be connected in some way. In some cases, as in the case of the data from Jadid Trading L.L.C., this means reorganising the data. See how we have reorganised this data.
Q1. Replicate the data below in your excel sheet. Then make a similar lined graph.
Employee Reference
Q5 - Employee Satisfaction with Work Conditions
Q6 - Employee Performance by Sales
101 3 5
102 4 4
103 2 2
104 1 1
105 1 1
106 4 3
107 5 5
108 1 3
109 3 4
110 5 5
111 2 3
112 5 5
113 5 5
114 2 3
115 2 3
116 3 3
117 3 2
118 5 5
119 5 4
120 2 2
Activity 4: Application

All r
ight
s re
serv
ed. N
o pa
rt o
f thi
s ba
ge m
ay b
e re
prod
uced
, sto
red
in a
retie
val s
yste
m o
r tra
nsm
itted
in a
ny fo
rm o
r by
any
mea
ns w
ithou
t prio
r per
miss
ion
in w
ritin
g of
the
publ
isher
. Al
l rig
hts
rese
rved
. No
part
of t
his
bage
may
be
repr
oduc
ed, s
tore
d in
a re
tieva
l sys
tem
or t
rans
mitt
ed in
any
form
or b
y an
y m
eans
with
out p
rior p
erm
issio
n in
writ
ing
of th
e pu
blish
er.
75
Social Studies - Grade 11 Term 3
Lesson 6 | Descriptive Analysis Continued
Q2. What does the line graph tell you? What types of relationship do these variables have? Discuss in pairs and write your thoughts in the space below.
________________________________________________________________________________________________________
________________________________________________________________________________________________________
________________________________________________________________________________________________________
________________________________________________________________________________________________________
________________________________________________________________________________________________________
________________________________________________________________________________________________________
Application

All rights reserved. No part of this bage m
ay be reproduced, stored in a retieval system or transm
itted in any form or by any m
eans without prior perm
ission in writing of the publisher.
All rights reserved. No part of this bage m
ay be reproduced, stored in a retieval system or transm
itted in any form or by any m
eans without prior perm
ission in writing of the publisher.
76
Social Studies - Grade 11 Term 3
Now take it a set further and see whether more variables have a relationship. After completing the example below, you can do the same with a combination of 2 or 3 other variables.
Q1. Replicate the data below in your excel sheet. Then make a similar lined graph.
Employ-ee Refer-ence
Q4 - Employee Satisfaction with Manager
Q5 - Employee Sat-isfaction with Work Conditions
Q6 - Employee Performance by Sales
101 3 3 5102 3 4 4103 2 2 2104 2 1 1105 2 1 1106 3 4 3107 4 5 5108 2 1 3109 3 3 4110 3 5 5111 1 2 3112 4 5 5113 5 5 5114 2 2 3115 1 2 3116 3 3 3117 2 3 2118 4 5 5119 5 5 4120 2 2 2
Activity 5: Application
Q2. What does the line graph below tell you?
____________________________________
____________________________________
____________________________________
____________________________________
____________________________________
____________________________________
____________________________________
____________________________________
________________

All r
ight
s re
serv
ed. N
o pa
rt o
f thi
s ba
ge m
ay b
e re
prod
uced
, sto
red
in a
retie
val s
yste
m o
r tra
nsm
itted
in a
ny fo
rm o
r by
any
mea
ns w
ithou
t prio
r per
miss
ion
in w
ritin
g of
the
publ
isher
. Al
l rig
hts
rese
rved
. No
part
of t
his
bage
may
be
repr
oduc
ed, s
tore
d in
a re
tieva
l sys
tem
or t
rans
mitt
ed in
any
form
or b
y an
y m
eans
with
out p
rior p
erm
issio
n in
writ
ing
of th
e pu
blish
er.
77
Social Studies - Grade 11 Term 3
Lesson 6 | Descriptive Analysis Continued
So far we have looked at three main variables in different ways.
Q1. In small groups or pairs, review activities 1 and 2.
Q2. Write a summary of whether “Employee Satisfaction with Manager” (Question 4) and “Employee Satisfaction with Work Conditions” (Question 5) have a relationship.
Focus on explaining what the relationship is. Example: What is the effect of employee satisfaction on performance?
_____________________________________________________________________________________________________________
_____________________________________________________________________________________________________________
_____________________________________________________________________________________________________________
____________________________________________________________________________________________________________
_____________________________________________________________________________________________________________
_____________________________________________________________________________________________________________
_____________________________________________________________________________________________________________
_____________________________________________________________________________________________________________
_____________________________________________________________________________________________________________
_____________________________________________________________________________________________________________
_____________________________________________________________________________________________________________
____________________________________________
From this basic analysis you should have been able to notice that the data and analysis just tells you whether there is a relationship and the type of relationship. It cannot tell you why the relationship is there. The “why” is best answered by using qualitative methods that seek to understand why people behave in the way that they do. This fact marks one of the biggest differences between qualitative and quantitative research. However, we can analyse the data to make predictions and start to form conclusions.
Activity 6: Reflection

All rights reserved. No part of this bage m
ay be reproduced, stored in a retieval system or transm
itted in any form or by any m
eans without prior perm
ission in writing of the publisher.
All rights reserved. No part of this bage m
ay be reproduced, stored in a retieval system or transm
itted in any form or by any m
eans without prior perm
ission in writing of the publisher.
78
Social Studies - Grade 11 Term 3
Optional Extension Activities
Now that you have practiced with a few variables try to analyse the remaining ones on your own.
After completing the above activities, you should have reached some conclusions about which factors have a positive or negative effect on employee performance in Jadid Trading L.L.C.
Q1. Write out these as 4-5 key findings.
__________________________________________________________________________________________________________________________________________________________________________________________________________________________________________________________________________________________________________________________________________________________________________________________________________________________________________________________________
Q2. Based on your findings what recommendations can you make for Jadid Trading?
__________________________________________________________________________________________________________________________________________________________________________________________________________________________________________________________________________________________________________________________________________________________________________________________________________________________________________________________________
Activity 7: Reflection
Activity 8: Reflection

Notes
______________________________________________________________________________________________________
_____________________________________________________________________________________________________________
_____________________________________________________________________________________________________________
_____________________________________________________________________________________________________________
_____________________________________________________________________________________________________________
_____________________________________________________________________________________________________________
_____________________________________________________________________________________________________________
_____________________________________________________________________________________________________________
_____________________________________________________________________________________________________________
_____________________________________________________________________________________________________________
_____________________________________________________________________________________________________________
_____________________________________________________________________________________________________________
_____________________________________________________________________________________________________________
_____________________________________________________________________________________________________________
_____________________________________________________________________________________________________________
_____________________________________________________________________________________________________________
_____________________________________________________________________________________________________________
_____________________________________________________________________________________________________________
_____________________________________________________________________________________________________________
_____________________________________________________________________________________________________________
_____________________________________________________________________________________________________________
_____________________________________________________________________________________________________________
All r
ight
s re
serv
ed. N
o pa
rt o
f thi
s ba
ge m
ay b
e re
prod
uced
, sto
red
in a
retie
val s
yste
m o
r tra
nsm
itted
in a
ny fo
rm o
r by
any
mea
ns w
ithou
t prio
r per
miss
ion
in w
ritin
g of
the
publ
isher
. Al
l rig
hts
rese
rved
. No
part
of t
his
bage
may
be
repr
oduc
ed, s
tore
d in
a re
tieva
l sys
tem
or t
rans
mitt
ed in
any
form
or b
y an
y m
eans
with
out p
rior p
erm
issio
n in
writ
ing
of th
e pu
blish
er.
79
Social Studies - Grade 11 Term 3
Lesson 6 | Descriptive Analysis Continued

80
LESSON 7: INTERVIEWS

81
Lesson Objective:
By the end of the lesson, students will: � practice collecting and analysing interview data
� apply their knowledge and understand to collect and analysis interview data
� practice how to present interview and qualitative data in general
Key Vocabulary
semi-structured
perceptions
attitudes
narrative
conversation
body language
consent
transcript
transcribe

All rights reserved. No part of this bage m
ay be reproduced, stored in a retieval system or transm
itted in any form or by any m
eans without prior perm
ission in writing of the publisher.
All rights reserved. No part of this bage m
ay be reproduced, stored in a retieval system or transm
itted in any form or by any m
eans without prior perm
ission in writing of the publisher.
82
Social Studies - Grade 11 Term 3
WARM UP: BRAIN GAMEThink back to work you have done in previous terms and make a mind map of open and close-ended questions. What are the key differences? Provide some examples.
OPEN-ENDED
QUESTIONS
CLOSE-ENDEDQUESTIONS
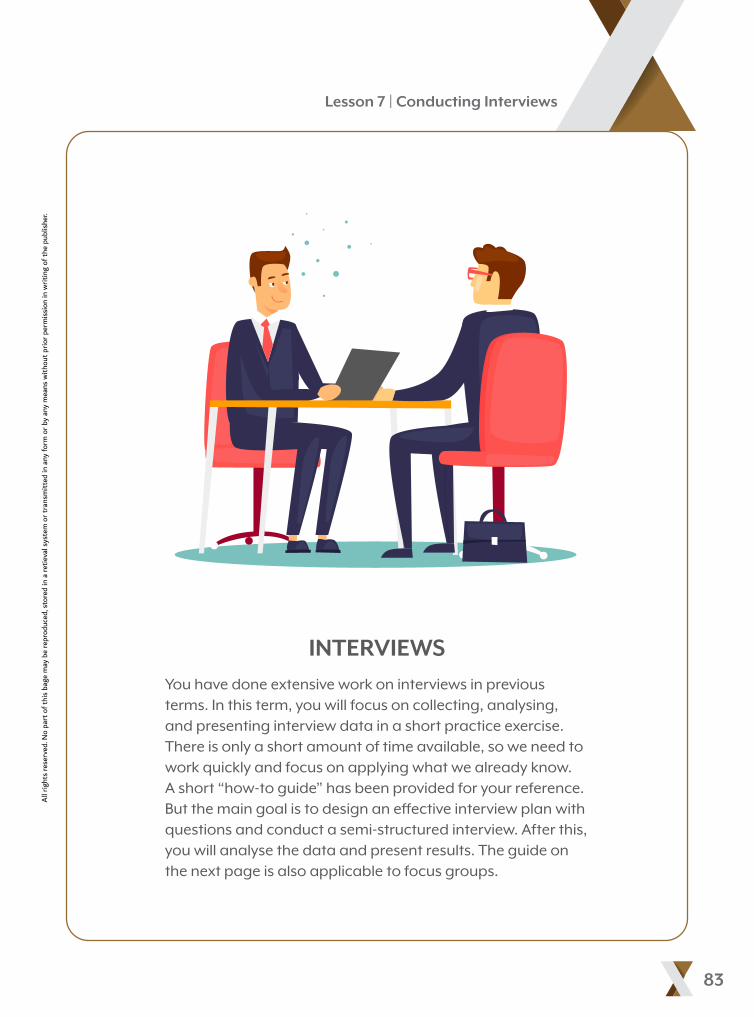
All r
ight
s re
serv
ed. N
o pa
rt o
f thi
s ba
ge m
ay b
e re
prod
uced
, sto
red
in a
retie
val s
yste
m o
r tra
nsm
itted
in a
ny fo
rm o
r by
any
mea
ns w
ithou
t prio
r per
miss
ion
in w
ritin
g of
the
publ
isher
. Al
l rig
hts
rese
rved
. No
part
of t
his
bage
may
be
repr
oduc
ed, s
tore
d in
a re
tieva
l sys
tem
or t
rans
mitt
ed in
any
form
or b
y an
y m
eans
with
out p
rior p
erm
issio
n in
writ
ing
of th
e pu
blish
er.
83
Social Studies - Grade 11 Term 3
Lesson 7 | Conducting Interviews
INTERVIEWSYou have done extensive work on interviews in previous terms. In this term, you will focus on collecting, analysing, and presenting interview data in a short practice exercise. There is only a short amount of time available, so we need to work quickly and focus on applying what we already know. A short “how-to guide” has been provided for your reference. But the main goal is to design an effective interview plan with questions and conduct a semi-structured interview. After this, you will analyse the data and present results. The guide on the next page is also applicable to focus groups.

Activity 1: Check Your Understanding
All rights reserved. No part of this bage m
ay be reproduced, stored in a retieval system or transm
itted in any form or by any m
eans without prior perm
ission in writing of the publisher.
All rights reserved. No part of this bage m
ay be reproduced, stored in a retieval system or transm
itted in any form or by any m
eans without prior perm
ission in writing of the publisher.
84
Social Studies - Grade 11 Term 3
You will be conducting a semi-structured interview on this occasion, but can you name two types other of interviews?
1. _____________________ _____________________ _____________________ _____________________
and 2. _____________________ _____________________ _____________________ _____________________
Your main task in this lesson is to create a semi-structured interview to find out about the birthday or any other special celebration experiences of people in your class. Of course, there are other types of interviews available, but given the short space of time this is an appropriate data collection technique.
Semi-structured Interviews will enable you to collect focused and relevant information quickly. These types of interviews give you the balance of control between asking informal open-ended questions and the focus of a more structured interview. These interviews enable the researcher to gather opinions, perceptions, attitudes, and the reasons behind them. In this case, you will mainly use descriptive questions to develop a narrative.
How-to guide: Before the interview
Develop questions
Make sure you use open-ended questions
Avoid biases, so don’t ask questions that are leading
Be precise and ask short questions that are specific and easy to understand. For the same reason do not ask double questions or 2-in-1 questions.
Language is very important. Keep it simple and be aware of social cultural context.

Check Your Understanding
All r
ight
s re
serv
ed. N
o pa
rt o
f thi
s ba
ge m
ay b
e re
prod
uced
, sto
red
in a
retie
val s
yste
m o
r tra
nsm
itted
in a
ny fo
rm o
r by
any
mea
ns w
ithou
t prio
r per
miss
ion
in w
ritin
g of
the
publ
isher
. Al
l rig
hts
rese
rved
. No
part
of t
his
bage
may
be
repr
oduc
ed, s
tore
d in
a re
tieva
l sys
tem
or t
rans
mitt
ed in
any
form
or b
y an
y m
eans
with
out p
rior p
erm
issio
n in
writ
ing
of th
e pu
blish
er.
85
Social Studies - Grade 11 Term 3
Lesson 7 | Conducting Interviews
How-to guide: Before the interview
Make a plan of how and when you will ask them. You need to have some sort of structure.
Make sure you have space to record these items:
Responses (answers) from the interviewees.
Demographic information about the interviewee.
Your own notes above observations you make during the interview. Example: were there occasions when the interviewee looks more-or-less upset.
Order Questions carefully
Start with an icebreaker or a question not related to the interview to make the interviewee feel comfortable
Start by asking about simple things and then move more complex questions
Make sure you group questions according to topic.
Start with questions that can easily be categorised or listed, for example, good vs bad. Then move on to more abstract, for example, why was it good? How did it make you feel?
Be prepared! If you have a recording device (should use it) make sure it is charged. Be care with using mobile phones as recording devices as they can distract.
Make sure your questions make sense to you (practice)
In most cases of formal research, you will need additional documents like consent forms, approvals and so on. Make sure you have these in place before the interviews.

ApplicationActivity 2:
All rights reserved. No part of this bage m
ay be reproduced, stored in a retieval system or transm
itted in any form or by any m
eans without prior perm
ission in writing of the publisher.
All rights reserved. No part of this bage m
ay be reproduced, stored in a retieval system or transm
itted in any form or by any m
eans without prior perm
ission in writing of the publisher.
86
Social Studies - Grade 11 Term 3
Birthdays were the worst days!
You are researching bad birthday or special celebration experiences of peers in your class. You want to be able to understand which celebrations were the worse and what turned them into bad experiences. So, consider asking about the factors that turned the Birthday into bad experiences, and why these factors effected the interviewees negatively, and how they felt during and after the celebration. You may also ask about other factors that might have led to the bad experience. Remember this is a semi-structured interview so you need to be ready for follow-up questions and at times let the interviewee explore their responses.
Task Brief (You have 20 minutes for this task)
You need to write out 3-5 questions that will give you an understanding of this issue.
Plan for a 10-minute interview. Your teacher will give you a template to follow.
Make sure you are prepared to collect the information. Make a template before the start of the interview.
When planning for the interview, follow the key steps outlined in the How-to Guide. Remember to start with specific questions, and then move to more complex questions.
Review and compare the questions with the person sitting next to you. Are they fit for purpose?

ApplicationActivity 3:
All r
ight
s re
serv
ed. N
o pa
rt o
f thi
s ba
ge m
ay b
e re
prod
uced
, sto
red
in a
retie
val s
yste
m o
r tra
nsm
itted
in a
ny fo
rm o
r by
any
mea
ns w
ithou
t prio
r per
miss
ion
in w
ritin
g of
the
publ
isher
. Al
l rig
hts
rese
rved
. No
part
of t
his
bage
may
be
repr
oduc
ed, s
tore
d in
a re
tieva
l sys
tem
or t
rans
mitt
ed in
any
form
or b
y an
y m
eans
with
out p
rior p
erm
issio
n in
writ
ing
of th
e pu
blish
er.
87
Social Studies - Grade 11 Term 3
Lesson 7 | Conducting Interviews
Interviewing people you already know is not easy. What can you do to minimise bias and remain professional?
______________________________________________________________________________________________________________
_______________________________________________________________________________________________________________
______________________________________________________________________________________________________________
______________________________________________________________________________________________________________
______________________________________________________________________________________________________________
______________________________________________________________________________________________________________
______________________________________________________________________________________________________________
______________________________________________________________________________________________________________
______________________________________________________________________________________________________________
_______________________________________________________________________________________________________________
______________________________________________________________________________________________________________
______________________________________________________________________________________________________________
______________________________________________________________________________________________________________
______________________________________________________________________________________________________________
______________________________________________________________________________________________________________
______________________________________________________________________________________________________________

All rights reserved. No part of this bage m
ay be reproduced, stored in a retieval system or transm
itted in any form or by any m
eans without prior perm
ission in writing of the publisher.
All rights reserved. No part of this bage m
ay be reproduced, stored in a retieval system or transm
itted in any form or by any m
eans without prior perm
ission in writing of the publisher.
88
Social Studies - Grade 11 Term 3
How to guide: During the Interview
Starting the Interview
Make sure you introduce yourself and the purpose of the interview.
Ask a question that makes both of you feel more comfortable and gets the conversation started (Ice Breaker). For example, have you been interviewed before?
Personal conduct and body language
Make sure you remain professional throughout the interview.
Your personal behaviour and body language play a big part in the interview and reduce chances of bias actions.
Ask questions in a clear tone of voice and be confident
Dress appropriately. Sometimes it helps to be dressed in a similar attire to the interviewee. For example, casual wear if the interviewee is also wearing casual. But on other occasions, especially when you are representing another organisation as the interviewer, professional attire is more appropriate.
Plan ahead and be prepared
If there are forms or documents that need to be completed before the interview, make sure you bring them. Sometimes information about the research or consent forms are also required.
Think about what the interviewee may ask you and be prepared to answer the questions.
Practice asking the questions.
If you have recording equipment, make sure it works.
Recording responses and Controlling the flow
It is good practice to make summary notes of everything said. Even if you are recording.
It is also good practice to note down some key quotes, exactly as the interviewee said it.
Sometimes the interviewees go off on a different direction. You must be able to politely bring them back on track. You can quite simply say “can we come back to….”
If you think you have enough information and want to move on. Make sure you do have the right understanding and then say, “thank you I think I understand (interviewer summaries their understanding) I would now like to ask….”
Ending and after At the end remember to thank the interviewee and ask whether they have questions.
In academic research, the typed transcript is sometimes shared with the interviewee to make sure the information collected is accurate.

ApplicationActivity 4:
Birthdays were the worse days! (Continued)
You are ready to conduct the interview. This is a short interview so you have to get to the heart of the matter as quickly as possible, while giving the interviewee enough time to think and reflect about their experiences. This will not be easy. Therefore, it is important to remain professional and focused.
Task Brief (You have 20 minutes for this task)
Pair up with another student in the class. This should not be the same person you reviewed the questions with. Ideally this should be someone you don’t sit with usually.
Both of you interview each other, this cannot last longer than 10 minutes each way.
As the interviewer, you need to be recording key information on the template you have prepared.
All r
ight
s re
serv
ed. N
o pa
rt o
f thi
s ba
ge m
ay b
e re
prod
uced
, sto
red
in a
retie
val s
yste
m o
r tra
nsm
itted
in a
ny fo
rm o
r by
any
mea
ns w
ithou
t prio
r per
miss
ion
in w
ritin
g of
the
publ
isher
. Al
l rig
hts
rese
rved
. No
part
of t
his
bage
may
be
repr
oduc
ed, s
tore
d in
a re
tieva
l sys
tem
or t
rans
mitt
ed in
any
form
or b
y an
y m
eans
with
out p
rior p
erm
issio
n in
writ
ing
of th
e pu
blish
er.
89
Social Studies - Grade 11 Term 3
Lesson 7 | Conducting Interviews

All rights reserved. No part of this bage m
ay be reproduced, stored in a retieval system or transm
itted in any form or by any m
eans without prior perm
ission in writing of the publisher.
All rights reserved. No part of this bage m
ay be reproduced, stored in a retieval system or transm
itted in any form or by any m
eans without prior perm
ission in writing of the publisher.
90
Social Studies - Grade 11 Term 3
Presenting Interview Data
The whole process of analysing interview data requires a lot of personal involvement and interpretation from the interviewers. Now that you have transcribed the interview and made a note of your first impressions, you need to read through the transcript again thoroughly. You will be using this transcript at different stages, so make sure you have done a good job. Follow the steps outlines below in activities to complete this process. Once complete, you can choose to use this as the end-of-term project. So, it is important you follow the steps carefully. In the end-of-year project, this analysis can be presented as a conceptual diagram or a narrative story on a poster.
Browse through the interview and make a list of first impressions
______________________________________________________________________________________________________________
_______________________________________________________________________________________________________________
______________________________________________________________________________________________________________
______________________________________________________________________________________________________________
______________________________________________________________________________________________________________
______________________________________________________________________________________________________________
______________________________________________________________________________________________________________
______________________________________________________________________________________________________________
______________________________________________________________________________________________________________
_______________________________________________________________________________________________________________
______________________________________________________________________________________________________________
______________________________________________________________________________________________________________
______________________________________________________________________________________________________________

Step 1: Codes
Once you have read through the transcript again you can start the coding process. You can names these codes or simply use different colour highlighters to differentiate between them.
The codes can be based on relevant words, phrases, sentences or sections.
When deciding on different codes, think about actions, activities, concepts, differences, opinions, processes, or relevance to the research?
Note: How do you decide something is relevant in the transcript?
Well it might be that the interviewee repeated the information again and again. It might also be something you did not expect to hear, a surprise. Sometimes these lightbulb moments are most important. It could also be that the interviewee explicitly said “this is important” or you have read about it and know it in your secondary or background research and know it is relevant. Whatever the reasons, it is important at this stage to keep an open mind and not worry about having too many codes. Create as many as you think you can see.
Step 2: Categories / Themes
After creating codes, you now need to start looking for the most relevant ones. At this stage you need to start focusing on the ones that stand out.
Combine codes that go together. Drop the ones that you feel are less relevant.
Start grouping them according to how you see their importance or suitability. These groups are basically categories or themes. Label these categories by giving them appropriate names. For example
ɮ Bad celebration / Worst celebration ɮ Factors leading to Bad celebration / Reasons ɮ Personal Feelings / Reactions / outcomes
ApplicationActivity 5:
ApplicationActivity 6a:
All r
ight
s re
serv
ed. N
o pa
rt o
f thi
s ba
ge m
ay b
e re
prod
uced
, sto
red
in a
retie
val s
yste
m o
r tra
nsm
itted
in a
ny fo
rm o
r by
any
mea
ns w
ithou
t prio
r per
miss
ion
in w
ritin
g of
the
publ
isher
. Al
l rig
hts
rese
rved
. No
part
of t
his
bage
may
be
repr
oduc
ed, s
tore
d in
a re
tieva
l sys
tem
or t
rans
mitt
ed in
any
form
or b
y an
y m
eans
with
out p
rior p
erm
issio
n in
writ
ing
of th
e pu
blish
er.
91
Social Studies - Grade 11 Term 3
Lesson 7 | Conducting Interviews

All rights reserved. No part of this bage m
ay be reproduced, stored in a retieval system or transm
itted in any form or by any m
eans without prior perm
ission in writing of the publisher.
All rights reserved. No part of this bage m
ay be reproduced, stored in a retieval system or transm
itted in any form or by any m
eans without prior perm
ission in writing of the publisher.
92
Social Studies - Grade 11 Term 3
Step 3: Results!
Use the space provided below to describe the connections between different categories. How do they relate to each other?
ApplicationActivity 6b:
______________________________________________________________________________________________________________
______________________________________________________________________________________________________________
______________________________________________________________________________________________________________
______________________________________________________________________________________________________________
______________________________________________________________________________________________________________
______________________________________________________________________________________________________________
______________________________________________________________________________________________________________
______________________________________________________________________________________________________________
_______________________________________________________________________________________________________________
______________________________________________________________________________________________________________
______________________________________________________________________________________________________________
______________________________________________________________________________________________________________
______________________________________________________________________________________________________________
______________________________________________________________________________________________________________
______________________________________________________________________________________________________________

All r
ight
s re
serv
ed. N
o pa
rt o
f thi
s ba
ge m
ay b
e re
prod
uced
, sto
red
in a
retie
val s
yste
m o
r tra
nsm
itted
in a
ny fo
rm o
r by
any
mea
ns w
ithou
t prio
r per
miss
ion
in w
ritin
g of
the
publ
isher
. Al
l rig
hts
rese
rved
. No
part
of t
his
bage
may
be
repr
oduc
ed, s
tore
d in
a re
tieva
l sys
tem
or t
rans
mitt
ed in
any
form
or b
y an
y m
eans
with
out p
rior p
erm
issio
n in
writ
ing
of th
e pu
blish
er.
93
Social Studies - Grade 11 Term 3
Lesson 7 | Conducting Interviews
Optional Extension Activities
You now need to transcribe the interview. Use your interview notes and recordings (if you have any) to develop a detailed account of the conversation.
_______________________________________________________________________________________________________________
_______________________________________________________________________________________________________________
_______________________________________________________________________________________________________________
_______________________________________________________________________________________________________________
_______________________________________________________________________________________________________________
_______________________________________________________________________________________________________________
_______________________________________________________________________________________________________________
______________________________________________________________________________________________________
You can add your own thoughts and observations under each question as footnotes.
Using different colours, highlight information that goes together. For example, which experiences or factors made it bad? Why? How did it make you feel?
_____________________________________________________________________________________________________________
______________________________________________________________________________________________________________
______________________________________________________________________________________________________________
______________________________________________________________________________________________________________
______________________________________________________________________________________________________________
______________________________________________________________________________________________________________
______________________________________________________________________________________________________________
______________________________________________________________________________________________________________
ReflectionActivity 7:

94
LESSON 8: EXPERIMENTS

95
Lesson Objective:
By the end of the lesson, students will: � practice setting up and conducting a simple
experiment
Key Vocabulary
hypotheses
scientific method
social and natural science
human interactions
phenomenon

All rights reserved. No part of this bage m
ay be reproduced, stored in a retieval system or transm
itted in any form or by any m
eans without prior perm
ission in writing of the publisher.
All rights reserved. No part of this bage m
ay be reproduced, stored in a retieval system or transm
itted in any form or by any m
eans without prior perm
ission in writing of the publisher.
96
Social Studies - Grade 11 Term 3
WARM UP: BRAINSTORM
In the space below brainstorm the important things you remember about the scientific method.
SCIENTIFIC
METHOD

All r
ight
s re
serv
ed. N
o pa
rt o
f thi
s ba
ge m
ay b
e re
prod
uced
, sto
red
in a
retie
val s
yste
m o
r tra
nsm
itted
in a
ny fo
rm o
r by
any
mea
ns w
ithou
t prio
r per
miss
ion
in w
ritin
g of
the
publ
isher
. Al
l rig
hts
rese
rved
. No
part
of t
his
bage
may
be
repr
oduc
ed, s
tore
d in
a re
tieva
l sys
tem
or t
rans
mitt
ed in
any
form
or b
y an
y m
eans
with
out p
rior p
erm
issio
n in
writ
ing
of th
e pu
blish
er.
97
Social Studies - Grade 11 Term 3
Lesson 8 | Experiments
EXPERIMENTSExperiments in social science and natural science are not the same. In the natural sciences, we can control the environment and therefore the different variables. For example, if you wanted to see how fast an apple drops from a certain height, you could control the size and weight of the apple, the height and so on. However, in social experiments, where we are often studying human interactions, it is not possible to control different variables. In fact, at times we should not even try to control them because the object is to study the behaviour or the phenomenon in its natural setting.
How can you collect and present data from scientific experiments? You have done substantial work on the scientific method already. In this lesson, you will focus on collecting and presenting data from an experiment. As social scientist you still need to have a sound understanding of both these elements. The experiment of on the next page is a science experiment (not a social science). Complete the experiment on the next page, make sure you are prepared as there are time constraints with each step.

All rights reserved. No part of this bage m
ay be reproduced, stored in a retieval system or transm
itted in any form or by any m
eans without prior perm
ission in writing of the publisher.
All rights reserved. No part of this bage m
ay be reproduced, stored in a retieval system or transm
itted in any form or by any m
eans without prior perm
ission in writing of the publisher.
98
Social Studies - Grade 11 Term 3
Experiments (small groups of 3-4)
SPACESHIP To complete this experiment, you will need the following resources
ɮ 1 medium sized balloon – any shape is ok ɮ 1 long piece of strong string. Nylon strings are better, but any strong string will do.
(about 3-5 meters) ɮ 1 good plastic straw. Should easily fit over the string. ɮ Some tape and a felt-tip markers ɮ Pen and Paper to record the results. You can also record straight onto the laptop or
computer. ɮ If possible, you can also film or photograph the experiment
Activity 1: Application

All r
ight
s re
serv
ed. N
o pa
rt o
f thi
s ba
ge m
ay b
e re
prod
uced
, sto
red
in a
retie
val s
yste
m o
r tra
nsm
itted
in a
ny fo
rm o
r by
any
mea
ns w
ithou
t prio
r per
miss
ion
in w
ritin
g of
the
publ
isher
. Al
l rig
hts
rese
rved
. No
part
of t
his
bage
may
be
repr
oduc
ed, s
tore
d in
a re
tieva
l sys
tem
or t
rans
mitt
ed in
any
form
or b
y an
y m
eans
with
out p
rior p
erm
issio
n in
writ
ing
of th
e pu
blish
er.
99
Social Studies - Grade 11 Term 3
Lesson 8 | Experiments
Application
Task Brief (You have 15 minutes for this task)
Prepare
Use the string first, and tie one end to something that will not move easily. This can be a table leg, chair, or anything like that.
Feed the straw through the other end of the string. Now tie the remaining end to something that will not move easily. This can be a table leg, chair, etc. Make sure the string is tight.
Use the balloon and blow air into it until you feel it has enough. Do not blow too much air into the balloon, but enough so it can travel. Do not tie the balloon, instead keep it pinched. Draw a line next to where you have pinched the balloon and write air level 1.
Use the tape, and stick the balloon to the straw. See picture above
Hypotheses: Outline what you expect to happen when you carry out this experiment?
_____________________________________________________________________________________________________________
______________________________________________________________________________________________________________
______________________________________________________________________________________________________________
______________________________________________________________________________________________________________
______________________________________________________________________________________________________________
______________________________________________________________________________________________________________
______________________________________________________________________________________________________________
______________________________________________________________________________________________________________
______________________________________________________________________________________________________________
______________________________________________________________________________________________________________

All rights reserved. No part of this bage m
ay be reproduced, stored in a retieval system or transm
itted in any form or by any m
eans without prior perm
ission in writing of the publisher.
All rights reserved. No part of this bage m
ay be reproduced, stored in a retieval system or transm
itted in any form or by any m
eans without prior perm
ission in writing of the publisher.
100
Social Studies - Grade 11 Term 3
Experiment (you have 15 minutes for this task)
Conduct experiment: Your main objective is to measure how far the balloon rocket travels
Once everything is ready, let go of the balloon!
How far did it travel? Make sure you are recording this information. Repeat this at different air levels 6 more times. Increase the amount of air at every trial.
Draw a line next to where you have pinched the balloon and write air level 2. Once everything is ready, let go of the balloon!
How far did it travel? Make sure you are recording this information. Repeat this at the same air level 2 more times.
Activity 2: Application

All r
ight
s re
serv
ed. N
o pa
rt o
f thi
s ba
ge m
ay b
e re
prod
uced
, sto
red
in a
retie
val s
yste
m o
r tra
nsm
itted
in a
ny fo
rm o
r by
any
mea
ns w
ithou
t prio
r per
miss
ion
in w
ritin
g of
the
publ
isher
. Al
l rig
hts
rese
rved
. No
part
of t
his
bage
may
be
repr
oduc
ed, s
tore
d in
a re
tieva
l sys
tem
or t
rans
mitt
ed in
any
form
or b
y an
y m
eans
with
out p
rior p
erm
issio
n in
writ
ing
of th
e pu
blish
er.
101
Social Studies - Grade 11 Term 3
Lesson 8 | Experiments
Review the data you have recorded.
Turn these into tables. You can use the template provided below to show distance travelled in centimetres.
Air Level 1 Air Level 2
Trial 1
Trial 2
Trial 3
Dependent and Independent Variables
As you have probably worked out, the experiment is all about air pressure and thrust. As air comes out of the balloon, it pushes the balloon forward. This forward motion is called thrust. But, in this experiment, we are less concerned with the science, and more interested in how we collected, analysed and presented the data. From a research perspective, it is important to understand which factors we were studying.
Go back to the experiment in the last lesson.
Q1. What were you changing in the experiment?
______________________________________________________________________________________________________________
Q2. What result were you looking for?
______________________________________________________________________________________________________________
The variables you can change, in this case the amount of air in the balloon, is called the independent variable. The result or the variable affected by your actions is called the dependent variable. In this case, it was the how far the balloon was able to travel. At this stage of your study, this basic understanding of dependent and independent variables is enough. to The focus in this lesson is on analysing these results.
Activity 3: Concept Check
Activity 4: Concept Check

All rights reserved. No part of this bage m
ay be reproduced, stored in a retieval system or transm
itted in any form or by any m
eans without prior perm
ission in writing of the publisher.
All rights reserved. No part of this bage m
ay be reproduced, stored in a retieval system or transm
itted in any form or by any m
eans without prior perm
ission in writing of the publisher.
102
Social Studies - Grade 11 Term 3
Activity 5: Application and Reflection
Use the data table to make a lined graph on Excel. Make sure it is properly labelled. After completing the task discuss what do you see happening in the line graph?
Air Level Distance Travelled
Trial 1
Trial 2
Trial 3
Trial 4
Trial 5
Trial 6
WRITING UP EXPERIMENTS AND SHARING FINDINGS Once you are done with the experiment and your analyses, you need to present the results in a way that is appropriate to the method you are using. In experiments, results are expected to be presented in a report format. Once the report is written, scientists often use posters and power points to present to an audience. The posters, by themselves, or together with power points, are used to make the findings accessible to a wider audience. As you can imagine, some people may not want to read a lengthy report. So, posters and power points break down and summarise the information. This lesson focuses on constructing the report that provides a detailed account of the whole experiment and not just the findings.

All r
ight
s re
serv
ed. N
o pa
rt o
f thi
s ba
ge m
ay b
e re
prod
uced
, sto
red
in a
retie
val s
yste
m o
r tra
nsm
itted
in a
ny fo
rm o
r by
any
mea
ns w
ithou
t prio
r per
miss
ion
in w
ritin
g of
the
publ
isher
. Al
l rig
hts
rese
rved
. No
part
of t
his
bage
may
be
repr
oduc
ed, s
tore
d in
a re
tieva
l sys
tem
or t
rans
mitt
ed in
any
form
or b
y an
y m
eans
with
out p
rior p
erm
issio
n in
writ
ing
of th
e pu
blish
er.
103
Social Studies - Grade 11 Term 3
Lesson 8 | Experiments
Activity 7: Reflection
Brainstorm the main challenges in your experiment
You have competed the first few steps required to produce the report. For example, you have already decided on the type of table and graph you will use. We will now look at the main components of the report and write draw them out over the next few activities. By the end of this lesson you would have written up the report. You can then use this part of the unit (experiments) to further develop and use for your end of year project.
Optional Extension Activities

All rights reserved. No part of this bage m
ay be reproduced, stored in a retieval system or transm
itted in any form or by any m
eans without prior perm
ission in writing of the publisher.
All rights reserved. No part of this bage m
ay be reproduced, stored in a retieval system or transm
itted in any form or by any m
eans without prior perm
ission in writing of the publisher.
104
Social Studies - Grade 11 Term 3
Activity 8: Application
Activity 9: Application and Reflection
Complete Descriptive Summaries.
In this activity you will be working on developing and summarising data tables. Use the main data collected, and work completed in unit 1 to develop summary tables. You may want to separate the data. For example, look at the air levels and distance travelled separately. Develop these on excel so you can easily present the information in graphs.
ɮ Q1. Calculate the mean and median values. ɮ Q2. Calculate the range and frequency distribution. ɮ Q3. Provide a short description and relevance of each calculation ɮ Q4. Provide a short summary of the relationship between the depended and
independent variable.
These tasks should be done as one section. You have already completed similar exercise in earlier lessons. Apply your knowledge and understanding from those lessons to work on this task independently.
Write a Conclusion.
Even the simplest written conclusion for an experiment is much more than a summary of what happened. You need to think and reflect on the whole journey. You can answer the questions below individually, but then write them out as one main section together.
Q1. What was the purpose of this experiment?
______________________________________________________________________________________________________________
______________________________________________________________________________________________________________
______________________________________________________________________________________________________________

All r
ight
s re
serv
ed. N
o pa
rt o
f thi
s ba
ge m
ay b
e re
prod
uced
, sto
red
in a
retie
val s
yste
m o
r tra
nsm
itted
in a
ny fo
rm o
r by
any
mea
ns w
ithou
t prio
r per
miss
ion
in w
ritin
g of
the
publ
isher
. Al
l rig
hts
rese
rved
. No
part
of t
his
bage
may
be
repr
oduc
ed, s
tore
d in
a re
tieva
l sys
tem
or t
rans
mitt
ed in
any
form
or b
y an
y m
eans
with
out p
rior p
erm
issio
n in
writ
ing
of th
e pu
blish
er.
105
Social Studies - Grade 11 Term 3
Lesson 8 | Experiments
Q2. Describe your major findings?
______________________________________________________________________________________________________________
______________________________________________________________________________________________________________
Q3. Do the findings support your original hypothesis?
______________________________________________________________________________________________________________
______________________________________________________________________________________________________________
Q4. Do the findings fall within existing knowledge? Here you should find similar studies or information on motion (Air Pressure and Thrust) and use them as references to support your experiment.
______________________________________________________________________________________________________________
______________________________________________________________________________________________________________
References: ______________________________________________________________________________________________
Q5. Provide your own opinion and explanation of the findings.
______________________________________________________________________________________________________________
______________________________________________________________________________________________________________
______________________________________________________________________________________________________________
Q6. Which other factors would you include if you were doing a more comprehensive version of the same experiment?
______________________________________________________________________________________________________________
______________________________________________________________________________________________________________
______________________________________________________________________________________________________________

All rights reserved. No part of this bage m
ay be reproduced, stored in a retieval system or transm
itted in any form or by any m
eans without prior perm
ission in writing of the publisher.
All rights reserved. No part of this bage m
ay be reproduced, stored in a retieval system or transm
itted in any form or by any m
eans without prior perm
ission in writing of the publisher.
106
Social Studies - Grade 11 Term 3
Top and Tail it!
You are nearly there. Now you need to make sure the report has been formatted to an appropriate standard.
ɮ You must provide a short introduction and a section for references.
ɮ It is also important to provide a table of contents and figures.
ɮ Provide a short section on experiment designs and hypotheses. Most of this work
has already been completed for you. You just need to pull it together into one
comprehensive report.
ɮ Use the work completed in previous terms to decide on an appropriate format.
Activity 10: Application

Notes
______________________________________________________________________________________________________
_____________________________________________________________________________________________________________
_____________________________________________________________________________________________________________
_____________________________________________________________________________________________________________
_____________________________________________________________________________________________________________
_____________________________________________________________________________________________________________
_____________________________________________________________________________________________________________
_____________________________________________________________________________________________________________
_____________________________________________________________________________________________________________
_____________________________________________________________________________________________________________
_____________________________________________________________________________________________________________
_____________________________________________________________________________________________________________
_____________________________________________________________________________________________________________
_____________________________________________________________________________________________________________
_____________________________________________________________________________________________________________
_____________________________________________________________________________________________________________
_____________________________________________________________________________________________________________
_____________________________________________________________________________________________________________
_____________________________________________________________________________________________________________
_____________________________________________________________________________________________________________
_____________________________________________________________________________________________________________
_____________________________________________________________________________________________________________
All r
ight
s re
serv
ed. N
o pa
rt o
f thi
s ba
ge m
ay b
e re
prod
uced
, sto
red
in a
retie
val s
yste
m o
r tra
nsm
itted
in a
ny fo
rm o
r by
any
mea
ns w
ithou
t prio
r per
miss
ion
in w
ritin
g of
the
publ
isher
. Al
l rig
hts
rese
rved
. No
part
of t
his
bage
may
be
repr
oduc
ed, s
tore
d in
a re
tieva
l sys
tem
or t
rans
mitt
ed in
any
form
or b
y an
y m
eans
with
out p
rior p
erm
issio
n in
writ
ing
of th
e pu
blish
er.
107
Social Studies - Grade 11 Term 3
Lesson 8 | Experiments

108
LESSON 9: TERM RESEARCH COVID-19

109
Lesson Objective:
By the end of the lesson, students will: � demonstrate and test their abilities and
knowledge of collecting, analysing and presenting research data in different context
� have a developing sense of belonging to a common humanity, sharing values and responsibilities
� develop and apply values, attitudes and skills to manage and engage with diverse groups and perspectives
� understand responsibility at local, national and global levels for a more peaceful and sustainable world
� participate in, and contribute to, contemporary global issues at local, national and global levels as informed, engaged, responsible and responsive global citizens
Key Vocabulary
Hypothesis
Research Methodology
Recommendations
Implications
Literature Review

All rights reserved. No part of this bage m
ay be reproduced, stored in a retieval system or transm
itted in any form or by any m
eans without prior perm
ission in writing of the publisher.
All rights reserved. No part of this bage m
ay be reproduced, stored in a retieval system or transm
itted in any form or by any m
eans without prior perm
ission in writing of the publisher.
110
Social Studies - Grade 11 Term 3
Project Description: In this term, you have completed 3 major exercises that have required the collection and analysis of research. At times, you have also taken steps to present this research in the form of a report. The
end of term project requires you to apply the knowledge you gained from these mini-projects and explore the impact of COVID-19 at the local, national and global level. In small groups of 3 to 5, you will produce a short power point presentation to share your findings. Detailed guidelines are provided below. If your class has completed exercises alongside other subjects, then your teacher may ask you to present this as an integrated project. You research task is to explore the impact of COVID-19 on education and learning at the local, national and global level.
1. Outline the general impact of COVID-19 on education and learning at the local, national and global level.
2. How did your school manage expectations of different stakeholder? For example, students, parents, teacher, owners and the Government.
3. Which values, attitudes and skills were important to manage and engage with these stakeholders?
4. As global citizens which responsible actions were undertaken by students during the pandemic? Use examples from your school, nationally and globally.
5. If as a global community we were to face a similar situation again. What are some of the best examples at the local, national and global level that would ensure a more peaceful and sustainable world.

All r
ight
s re
serv
ed. N
o pa
rt o
f thi
s ba
ge m
ay b
e re
prod
uced
, sto
red
in a
retie
val s
yste
m o
r tra
nsm
itted
in a
ny fo
rm o
r by
any
mea
ns w
ithou
t prio
r per
miss
ion
in w
ritin
g of
the
publ
isher
. Al
l rig
hts
rese
rved
. No
part
of t
his
bage
may
be
repr
oduc
ed, s
tore
d in
a re
tieva
l sys
tem
or t
rans
mitt
ed in
any
form
or b
y an
y m
eans
with
out p
rior p
erm
issio
n in
writ
ing
of th
e pu
blish
er.
111
Social Studies - Grade 11 Term 3
Lesson 9 | Term Research COVID-19
Project Steps:
The main research question has four distinct sub-questions. Please note sub-questions 2 and 3 are covering the same topic area. The first step would be to form groups and divide the topics between group members. You can use the action plan template provided below to share responsibilities and plan completion.
Actions Sub-tasksPerson (s)
responsibleKey Dates
Define the research topic
Outline possible secondary sources and literature review
Define initial Problem statement
Outline research question/s
Identify appropriate types of research to answer the main and sub-questions
Identify suitable Research methods to answer the main and sub-questions
What types of Data will you collect
Which Data collection techniques will you use
What sampling strategies will you use
Once you have conducted the research and analysed the data. Report your findings in the form of a short 5-7 minutes presentation to the class.

112
LESSON 10: FINAL REVIEW

113
Lesson Objective:
By the end of the lesson, students will:
� check their understanding of lessons six through eight.
� reflect on areas for improvement.
Key Vocabulary
Review keywords for lessons six through eight.
Important Note: The activities provided below serve as a review and do not represent the full scope of materials for the final examination. In order to succeed in the final examination students should ensure they have a sound understanding of key concepts in all in Lessons.

All rights reserved. No part of this bage m
ay be reproduced, stored in a retieval system or transm
itted in any form or by any m
eans without prior perm
ission in writing of the publisher.
All rights reserved. No part of this bage m
ay be reproduced, stored in a retieval system or transm
itted in any form or by any m
eans without prior perm
ission in writing of the publisher.
114
Social Studies - Grade 11 Term 3
How does descriptive analysis for each individual combinations of variables differ?
_____________________________________________________________________________________________________________
_____________________________________________________________________________________________________________
_____________________________________________________________________________________________________________
_____________________________________________________________________________________________________________
_____________________________________________________________________________________________________________
_____________________________________________________________________________________________________________
_____________________________________________________________________________________________________________
_____________________________________________________________________________________________________________
Identify at least 3 benefits of Research
1. _____________________________2. _____________________________3. _____________________________4. _____________________________
Tick the appropriate box to indicate whether you agree or disagree with statements below.
Statements Agree Disagree
Accurate predictions about the number of beds can help the hospital order the right amount of beds?
Accurate predictions about the number of beds can help the hospital serve patients better?
Accurate predictions about the number of beds can help the hospital advertise?

All r
ight
s re
serv
ed. N
o pa
rt o
f thi
s ba
ge m
ay b
e re
prod
uced
, sto
red
in a
retie
val s
yste
m o
r tra
nsm
itted
in a
ny fo
rm o
r by
any
mea
ns w
ithou
t prio
r per
miss
ion
in w
ritin
g of
the
publ
isher
. Al
l rig
hts
rese
rved
. No
part
of t
his
bage
may
be
repr
oduc
ed, s
tore
d in
a re
tieva
l sys
tem
or t
rans
mitt
ed in
any
form
or b
y an
y m
eans
with
out p
rior p
erm
issio
n in
writ
ing
of th
e pu
blish
er.
115
Social Studies - Grade 11 Term 3
Lesson 10 | Final Review
Replicate the graphs below on an excel sheet. Make sure you are able to use the labels in the same way.
Sharjah Dubai
Q2 - Current Branch
8 12
Use this space to write a short description of what the Pie Chart is telling you?
Rating 1 Rating 2 Rating 3 Rating 4 Rating 5
Q3 - Manager Rating in May 2019 4 5 3 3 5

All rights reserved. No part of this bage m
ay be reproduced, stored in a retieval system or transm
itted in any form or by any m
eans without prior perm
ission in writing of the publisher.
All rights reserved. No part of this bage m
ay be reproduced, stored in a retieval system or transm
itted in any form or by any m
eans without prior perm
ission in writing of the publisher.
116
Social Studies - Grade 11 Term 3
Review the “How to guides” in lesson 7 that outline what to do before and during the interview. Highlight the most important actions in each guide.
Using the space below explain the key difference a research needs to consider before and after the interview.
_______________________________________________________________________________________________________________
_______________________________________________________________________________________________________________
_______________________________________________________________________________________________________________
_______________________________________________________________________________________________________________
_______________________________________________________________________________________________________________
_______________________________________________________________________________________________________________
_______________________________________________________________________________________________________________
_______________________________________________________________________________________________
Using the experiment you completed in lesson 8. Describe what do you see happening between the independent (amount of air) and dependent variables (travel distance). What is the relationship between the two variables?
_____________________________________________________________________________________________________________
_____________________________________________________________________________________________________________
_____________________________________________________________________________________________________________
_____________________________________________________________________________________________________________
_____________________________________________________________________________________________________________
_____________________________________________________________________________________________________________
_____________________________________________________________________________________________________________
_____________________________________________________________________________________________________________

Notes
______________________________________________________________________________________________________
_____________________________________________________________________________________________________________
_____________________________________________________________________________________________________________
_____________________________________________________________________________________________________________
_____________________________________________________________________________________________________________
_____________________________________________________________________________________________________________
_____________________________________________________________________________________________________________
_____________________________________________________________________________________________________________
_____________________________________________________________________________________________________________
_____________________________________________________________________________________________________________
_____________________________________________________________________________________________________________
_____________________________________________________________________________________________________________
_____________________________________________________________________________________________________________
_____________________________________________________________________________________________________________
_____________________________________________________________________________________________________________
_____________________________________________________________________________________________________________
_____________________________________________________________________________________________________________
_____________________________________________________________________________________________________________
_____________________________________________________________________________________________________________
_____________________________________________________________________________________________________________
_____________________________________________________________________________________________________________
_____________________________________________________________________________________________________________
All r
ight
s re
serv
ed. N
o pa
rt o
f thi
s ba
ge m
ay b
e re
prod
uced
, sto
red
in a
retie
val s
yste
m o
r tra
nsm
itted
in a
ny fo
rm o
r by
any
mea
ns w
ithou
t prio
r per
miss
ion
in w
ritin
g of
the
publ
isher
. Al
l rig
hts
rese
rved
. No
part
of t
his
bage
may
be
repr
oduc
ed, s
tore
d in
a re
tieva
l sys
tem
or t
rans
mitt
ed in
any
form
or b
y an
y m
eans
with
out p
rior p
erm
issio
n in
writ
ing
of th
e pu
blish
er.
117
Social Studies - Grade 11 Term 3
Lesson 10 | Final Review

118
GLOSSARY

abstract a summary of the contents of a book, article, or speech.
action plan a proposed strategy or course of action.
analysis detailed examination of the elements or structure of something
annotation a note by way of explanation or comment added to a text or diagram.
appendices a section or table of subsidiary matter at the end of a book or document.
attributes a section or table of subsidiary matter at the end of a book or document
attitudes how a person thinks or feels about something
assumptions something that is accepted as true or as certain to happen, without proof
authentic when something is undisputed and genuine
KEYWORD MEANING
119

background research also called secondary research and literature review. it is the first research the researcher does to learn about the topic selected for research
bibliography a systematic description of books, their authorship, printing, publication, editions
categorical questions questions that often have an accompanying list of categories or alternative responses
characteristics a feature or quality belonging typically to a person, place, or thing and serving to identify them.
cluster sampling a probability sampling technique where researchers divide the population into multiple groups
components a part or element of a larger whole
consistent doing something in the same way over time, especially so as to be fair or accurate
KEYWORD MEANING
All rights reserved. No part of this bage m
ay be reproduced, stored in a retieval system or transm
itted in any form or by any m
eans without prior perm
ission in writing of the publisher.
All rights reserved. No part of this bage m
ay be reproduced, stored in a retieval system or transm
itted in any form or by any m
eans without prior perm
ission in writing of the publisher.
120
Social Studies - Grade 11 Term 3

convenience sampling a type of non-probability sampling method where the sample is taken from a group of people easy to contact
correlation a mutual relationship or connection between two or more things
copyrighted when someone’s idea or an author›s work is legally protected by law and others cannot use without permission
data collection the process of gathering and measuring information on targeted variables
deadlines project targets that are set in the research schedule
deductive related to using principles of logic to figure something out
descriptive describing or classifying in an object, situation or sample
disaggregation the act of separating something (a sample) from the whole
KEYWORD MEANING
All r
ight
s re
serv
ed. N
o pa
rt o
f thi
s ba
ge m
ay b
e re
prod
uced
, sto
red
in a
retie
val s
yste
m o
r tra
nsm
itted
in a
ny fo
rm o
r by
any
mea
ns w
ithou
t prio
r per
miss
ion
in w
ritin
g of
the
publ
isher
. Al
l rig
hts
rese
rved
. No
part
of t
his
bage
may
be
repr
oduc
ed, s
tore
d in
a re
tieva
l sys
tem
or t
rans
mitt
ed in
any
form
or b
y an
y m
eans
with
out p
rior p
erm
issio
n in
writ
ing
of th
e pu
blish
er.
121
Social Studies - Grade 11 Term 3
Glossary

encyclopaedias a book or set of books giving information on many subjects or on many aspects of one subject and typically arranged alphabetically
ethics principles of moral behaviour and practice that should be planned in any research project
evidence the available body of facts or information indicating whether a belief or proposition is true or valid
evaluate making a judgment, one that most likely results from some degree of analysis
examine to study something carefully in order to understand it
experimentation when a test is designed to examine variables that are actively manipulated, controlled, and measured in an effort to gather evidence to support or refute a claim
KEYWORD MEANING
All rights reserved. No part of this bage m
ay be reproduced, stored in a retieval system or transm
itted in any form or by any m
eans without prior perm
ission in writing of the publisher.
All rights reserved. No part of this bage m
ay be reproduced, stored in a retieval system or transm
itted in any form or by any m
eans without prior perm
ission in writing of the publisher.
122
Social Studies - Grade 11 Term 3

exploratory relating to or involving exploration or investigation.
expressions the body language or action of making known your thoughts or feelings
framework a basic structure underlying a system, concept, or text
frequency the rate at which something occurs over a particular period of time or in a given sample
hypothesis a proposed explanation made on the basis of limited evidence as a starting point for further investigation.
implications of research another common term used for implications is significance. this section in research would describe what impact your research might have on policy, future research
bivariate involving or depending on two variates
KEYWORD MEANING
All r
ight
s re
serv
ed. N
o pa
rt o
f thi
s ba
ge m
ay b
e re
prod
uced
, sto
red
in a
retie
val s
yste
m o
r tra
nsm
itted
in a
ny fo
rm o
r by
any
mea
ns w
ithou
t prio
r per
miss
ion
in w
ritin
g of
the
publ
isher
. Al
l rig
hts
rese
rved
. No
part
of t
his
bage
may
be
repr
oduc
ed, s
tore
d in
a re
tieva
l sys
tem
or t
rans
mitt
ed in
any
form
or b
y an
y m
eans
with
out p
rior p
erm
issio
n in
writ
ing
of th
e pu
blish
er.
123
Social Studies - Grade 11 Term 3
Glossary

inductive using a particular set of facts or ideas to form a general principle
inquiry an act of asking for information and/or official investigation
interpret to explain the meaning of information or actions
interrelationships the way in which each of two or more things is related to the other or others
interval questions these questions measures variables that exist along a common scale at equal intervals
investigate to carry out a systematic or formal inquiry to discover and examine the facts
irrelevant something not connected with or relevant to something
iterative process re-repeating something with slight improvements in the process until the desired result is achieved
KEYWORD MEANING
All rights reserved. No part of this bage m
ay be reproduced, stored in a retieval system or transm
itted in any form or by any m
eans without prior perm
ission in writing of the publisher.
All rights reserved. No part of this bage m
ay be reproduced, stored in a retieval system or transm
itted in any form or by any m
eans without prior perm
ission in writing of the publisher.
124
Social Studies - Grade 11 Term 3

literature review background research of previous studies on the topic
measurement the size, length, or amount of something, as established by measuring
methodical doing something according to a systematic or established procedure
mixed methods a research study that uses both quantitative and qualitative methods
multivariate involving more than two variable quantities
narrative a person’s view of events or story of connected events
nominal number a number used only as a name, or to identify something
non-probability sampling
non-probability sampling is a sampling technique where the odds of any member being selected for a sample cannot be calculated
KEYWORD MEANING
All r
ight
s re
serv
ed. N
o pa
rt o
f thi
s ba
ge m
ay b
e re
prod
uced
, sto
red
in a
retie
val s
yste
m o
r tra
nsm
itted
in a
ny fo
rm o
r by
any
mea
ns w
ithou
t prio
r per
miss
ion
in w
ritin
g of
the
publ
isher
. Al
l rig
hts
rese
rved
. No
part
of t
his
bage
may
be
repr
oduc
ed, s
tore
d in
a re
tieva
l sys
tem
or t
rans
mitt
ed in
any
form
or b
y an
y m
eans
with
out p
rior p
erm
issio
n in
writ
ing
of th
e pu
blish
er.
125
Social Studies - Grade 11 Term 3
Glossary

neutral impartial or unbiased
objectives aims of a research project
omission to leave out something
ordinal numbers a number defining the position of something in a series, such as ‘first’, ‘second’, or ‘third’
participants a person who takes part in something
perceived to come to an opinion about something, or have a belief about something
percent distributions a frequency distribution in which the individual class frequencies are expressed as a percentage of the total frequency equated to 100
plagiarism cheating in academic work by copying and not giving reference to work cited and used as one’s own
phenomenon a fact or situation that is observed to exist or happen
KEYWORD MEANING
All rights reserved. No part of this bage m
ay be reproduced, stored in a retieval system or transm
itted in any form or by any m
eans without prior perm
ission in writing of the publisher.
All rights reserved. No part of this bage m
ay be reproduced, stored in a retieval system or transm
itted in any form or by any m
eans without prior perm
ission in writing of the publisher.
126
Social Studies - Grade 11 Term 3

prediction when someone says a thing with happen, or a forecast
primary research a type of research where researchers to collect data directly
primary sources primary sources are immediate, first-hand accounts of a topic, from people who had a direct connection with it
qualitative research that is based on non-numerical data where the researcher is exploring in depth the opinions and experiences of the study participants
quantitative research that is based on numerical data where the researcher is interested in how many and how often a phenomenon happens
random something made, done, or happening without method or conscious decision
references sources used in the research
KEYWORD MEANING
All r
ight
s re
serv
ed. N
o pa
rt o
f thi
s ba
ge m
ay b
e re
prod
uced
, sto
red
in a
retie
val s
yste
m o
r tra
nsm
itted
in a
ny fo
rm o
r by
any
mea
ns w
ithou
t prio
r per
miss
ion
in w
ritin
g of
the
publ
isher
. Al
l rig
hts
rese
rved
. No
part
of t
his
bage
may
be
repr
oduc
ed, s
tore
d in
a re
tieva
l sys
tem
or t
rans
mitt
ed in
any
form
or b
y an
y m
eans
with
out p
rior p
erm
issio
n in
writ
ing
of th
e pu
blish
er.
127
Social Studies - Grade 11 Term 3
Glossary

realistic a sensible and practical idea of what can be achieved
referencing also known as referencing format or style which refers to the format of writing, citation, and research paper formatting required. common referencing formats are apa, mla, harvard, chicago, etc
reliability related to how confident a qualitative researcher is in the truth of research findings
replicate to make an exact copy or to reproduce something
representative sample a subset of a population that seeks to accurately reflect the characteristics of the larger group.
research context researcher provides background details about the setting of the research study assuming that the reader is not knowledgeable about the local setting
KEYWORD MEANING
All rights reserved. No part of this bage m
ay be reproduced, stored in a retieval system or transm
itted in any form or by any m
eans without prior perm
ission in writing of the publisher.
All rights reserved. No part of this bage m
ay be reproduced, stored in a retieval system or transm
itted in any form or by any m
eans without prior perm
ission in writing of the publisher.
128
Social Studies - Grade 11 Term 3

research design the strategy a researcher decides to use to collect data. this could include interviews, surveys, experiments, etc.
research methodology methods are either qualitative, quantitative or a mix of both
research process the research process involves identifying, locating, assessing, and analysing the information you need to support your research question
research proposal a summary paper for a proposed or suggested research project that needs approval before starting the research project
respondents a person who replies, supplies information
review of literature background research about a topic
sampling selecting a portion of the population, in your research area, which will be a representation of the whole population
KEYWORD MEANING
All r
ight
s re
serv
ed. N
o pa
rt o
f thi
s ba
ge m
ay b
e re
prod
uced
, sto
red
in a
retie
val s
yste
m o
r tra
nsm
itted
in a
ny fo
rm o
r by
any
mea
ns w
ithou
t prio
r per
miss
ion
in w
ritin
g of
the
publ
isher
. Al
l rig
hts
rese
rved
. No
part
of t
his
bage
may
be
repr
oduc
ed, s
tore
d in
a re
tieva
l sys
tem
or t
rans
mitt
ed in
any
form
or b
y an
y m
eans
with
out p
rior p
erm
issio
n in
writ
ing
of th
e pu
blish
er.
129
Social Studies - Grade 11 Term 3
Glossary
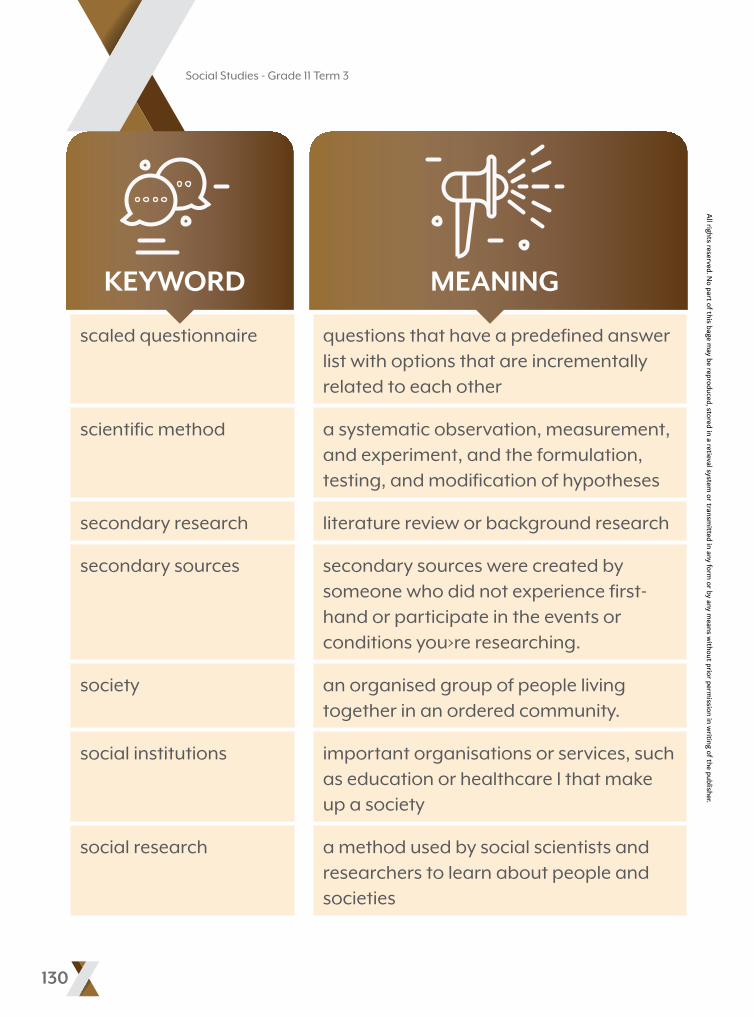
scaled questionnaire questions that have a predefined answer list with options that are incrementally related to each other
scientific method a systematic observation, measurement, and experiment, and the formulation, testing, and modification of hypotheses
secondary research literature review or background research
secondary sources secondary sources were created by someone who did not experience first-hand or participate in the events or conditions you›re researching.
society an organised group of people living together in an ordered community.
social institutions important organisations or services, such as education or healthcare l that make up a society
social research a method used by social scientists and researchers to learn about people and societies
KEYWORD MEANING
All rights reserved. No part of this bage m
ay be reproduced, stored in a retieval system or transm
itted in any form or by any m
eans without prior perm
ission in writing of the publisher.
All rights reserved. No part of this bage m
ay be reproduced, stored in a retieval system or transm
itted in any form or by any m
eans without prior perm
ission in writing of the publisher.
130
Social Studies - Grade 11 Term 3

social responsibility is a concept that say every person or organization has an responsibility to act for the benefit of society
social science the scientific study of human society and social relationships
stakeholders any person or entity that has an interest or effected by an issue
systematically doing something according to a fixed plan or system; methodically.
tabulation to arrange information is to organize it into a table
theoretical the theory of a subject or area of study rather than its practical application
transcribe put thoughts, speech, or data into written or printed form
unbiased showing no prejudice or favouritism for or against something; being impartial
KEYWORD MEANING
All r
ight
s re
serv
ed. N
o pa
rt o
f thi
s ba
ge m
ay b
e re
prod
uced
, sto
red
in a
retie
val s
yste
m o
r tra
nsm
itted
in a
ny fo
rm o
r by
any
mea
ns w
ithou
t prio
r per
miss
ion
in w
ritin
g of
the
publ
isher
. Al
l rig
hts
rese
rved
. No
part
of t
his
bage
may
be
repr
oduc
ed, s
tore
d in
a re
tieva
l sys
tem
or t
rans
mitt
ed in
any
form
or b
y an
y m
eans
with
out p
rior p
erm
issio
n in
writ
ing
of th
e pu
blish
er.
131
Social Studies - Grade 11 Term 3
Glossary

KEYWORD MEANING
unconscious an action that is done or existing without one realizing
univariate involving one variate or variable quantity
unravel to undo or investigate and solve or explain something complicated or puzzling
unstructured interview an interview in which there is no specific set of predetermined questions
variables an element, feature, or factor that is likely to change.
validity he quality of being logically or factually accurate
voluntary when a person acts or is involved in something with their own free will
All rights reserved. No part of this bage m
ay be reproduced, stored in a retieval system or transm
itted in any form or by any m
eans without prior perm
ission in writing of the publisher.
All rights reserved. No part of this bage m
ay be reproduced, stored in a retieval system or transm
itted in any form or by any m
eans without prior perm
ission in writing of the publisher.
132
Social Studies - Grade 11 Term 3

Notes
______________________________________________________________________________________________________
_____________________________________________________________________________________________________________
_____________________________________________________________________________________________________________
_____________________________________________________________________________________________________________
_____________________________________________________________________________________________________________
_____________________________________________________________________________________________________________
_____________________________________________________________________________________________________________
_____________________________________________________________________________________________________________
_____________________________________________________________________________________________________________
_____________________________________________________________________________________________________________
_____________________________________________________________________________________________________________
_____________________________________________________________________________________________________________
_____________________________________________________________________________________________________________
_____________________________________________________________________________________________________________
_____________________________________________________________________________________________________________
_____________________________________________________________________________________________________________
_____________________________________________________________________________________________________________
_____________________________________________________________________________________________________________
_____________________________________________________________________________________________________________
_____________________________________________________________________________________________________________
_____________________________________________________________________________________________________________
_____________________________________________________________________________________________________________
All r
ight
s re
serv
ed. N
o pa
rt o
f thi
s ba
ge m
ay b
e re
prod
uced
, sto
red
in a
retie
val s
yste
m o
r tra
nsm
itted
in a
ny fo
rm o
r by
any
mea
ns w
ithou
t prio
r per
miss
ion
in w
ritin
g of
the
publ
isher
. Al
l rig
hts
rese
rved
. No
part
of t
his
bage
may
be
repr
oduc
ed, s
tore
d in
a re
tieva
l sys
tem
or t
rans
mitt
ed in
any
form
or b
y an
y m
eans
with
out p
rior p
erm
issio
n in
writ
ing
of th
e pu
blish
er.
133
Social Studies - Grade 11 Term 3
Glossary

Notes
______________________________________________________________________________________________________
_____________________________________________________________________________________________________________
_____________________________________________________________________________________________________________
_____________________________________________________________________________________________________________
_____________________________________________________________________________________________________________
_____________________________________________________________________________________________________________
_____________________________________________________________________________________________________________
_____________________________________________________________________________________________________________
_____________________________________________________________________________________________________________
_____________________________________________________________________________________________________________
_____________________________________________________________________________________________________________
_____________________________________________________________________________________________________________
_____________________________________________________________________________________________________________
_____________________________________________________________________________________________________________
_____________________________________________________________________________________________________________
_____________________________________________________________________________________________________________
_____________________________________________________________________________________________________________
_____________________________________________________________________________________________________________
_____________________________________________________________________________________________________________
_____________________________________________________________________________________________________________
_____________________________________________________________________________________________________________
_____________________________________________________________________________________________________________
All rights reserved. No part of this bage m
ay be reproduced, stored in a retieval system or transm
itted in any form or by any m
eans without prior perm
ission in writing of the publisher.
All rights reserved. No part of this bage m
ay be reproduced, stored in a retieval system or transm
itted in any form or by any m
eans without prior perm
ission in writing of the publisher.
134
Social Studies - Grade 11 Term 3

Notes
______________________________________________________________________________________________________
_____________________________________________________________________________________________________________
_____________________________________________________________________________________________________________
_____________________________________________________________________________________________________________
_____________________________________________________________________________________________________________
_____________________________________________________________________________________________________________
_____________________________________________________________________________________________________________
_____________________________________________________________________________________________________________
_____________________________________________________________________________________________________________
_____________________________________________________________________________________________________________
_____________________________________________________________________________________________________________
_____________________________________________________________________________________________________________
_____________________________________________________________________________________________________________
_____________________________________________________________________________________________________________
_____________________________________________________________________________________________________________
_____________________________________________________________________________________________________________
_____________________________________________________________________________________________________________
_____________________________________________________________________________________________________________
_____________________________________________________________________________________________________________
_____________________________________________________________________________________________________________
_____________________________________________________________________________________________________________
_____________________________________________________________________________________________________________
All r
ight
s re
serv
ed. N
o pa
rt o
f thi
s ba
ge m
ay b
e re
prod
uced
, sto
red
in a
retie
val s
yste
m o
r tra
nsm
itted
in a
ny fo
rm o
r by
any
mea
ns w
ithou
t prio
r per
miss
ion
in w
ritin
g of
the
publ
isher
. Al
l rig
hts
rese
rved
. No
part
of t
his
bage
may
be
repr
oduc
ed, s
tore
d in
a re
tieva
l sys
tem
or t
rans
mitt
ed in
any
form
or b
y an
y m
eans
with
out p
rior p
erm
issio
n in
writ
ing
of th
e pu
blish
er.
135
Social Studies - Grade 11 Term 3
Glossary

Notes
______________________________________________________________________________________________________
_____________________________________________________________________________________________________________
_____________________________________________________________________________________________________________
_____________________________________________________________________________________________________________
_____________________________________________________________________________________________________________
_____________________________________________________________________________________________________________
_____________________________________________________________________________________________________________
_____________________________________________________________________________________________________________
_____________________________________________________________________________________________________________
_____________________________________________________________________________________________________________
_____________________________________________________________________________________________________________
_____________________________________________________________________________________________________________
_____________________________________________________________________________________________________________
_____________________________________________________________________________________________________________
_____________________________________________________________________________________________________________
_____________________________________________________________________________________________________________
_____________________________________________________________________________________________________________
_____________________________________________________________________________________________________________
_____________________________________________________________________________________________________________
_____________________________________________________________________________________________________________
_____________________________________________________________________________________________________________
_____________________________________________________________________________________________________________
All rights reserved. No part of this bage m
ay be reproduced, stored in a retieval system or transm
itted in any form or by any m
eans without prior perm
ission in writing of the publisher.
All rights reserved. No part of this bage m
ay be reproduced, stored in a retieval system or transm
itted in any form or by any m
eans without prior perm
ission in writing of the publisher.
136
Social Studies - Grade 11 Term 3

Notes
______________________________________________________________________________________________________
_____________________________________________________________________________________________________________
_____________________________________________________________________________________________________________
_____________________________________________________________________________________________________________
_____________________________________________________________________________________________________________
_____________________________________________________________________________________________________________
_____________________________________________________________________________________________________________
_____________________________________________________________________________________________________________
_____________________________________________________________________________________________________________
_____________________________________________________________________________________________________________
_____________________________________________________________________________________________________________
_____________________________________________________________________________________________________________
_____________________________________________________________________________________________________________
_____________________________________________________________________________________________________________
_____________________________________________________________________________________________________________
_____________________________________________________________________________________________________________
_____________________________________________________________________________________________________________
_____________________________________________________________________________________________________________
_____________________________________________________________________________________________________________
_____________________________________________________________________________________________________________
_____________________________________________________________________________________________________________
_____________________________________________________________________________________________________________
All r
ight
s re
serv
ed. N
o pa
rt o
f thi
s ba
ge m
ay b
e re
prod
uced
, sto
red
in a
retie
val s
yste
m o
r tra
nsm
itted
in a
ny fo
rm o
r by
any
mea
ns w
ithou
t prio
r per
miss
ion
in w
ritin
g of
the
publ
isher
. Al
l rig
hts
rese
rved
. No
part
of t
his
bage
may
be
repr
oduc
ed, s
tore
d in
a re
tieva
l sys
tem
or t
rans
mitt
ed in
any
form
or b
y an
y m
eans
with
out p
rior p
erm
issio
n in
writ
ing
of th
e pu
blish
er.
137
Social Studies - Grade 11 Term 3
Glossary

Vocational Qualification
Diploma / Postgraduate Diploma
(2-3 years)
(3-5 years)
(2 years)
(3-4 years)
Bridging Program
Postgraduate Diploma / Applied Sciences(1-2 Years)
Joining Work
Continuous Education
LiteracyApplied Stream
General & Academic Stream
Home Schooling
Vocational Education and Development Centre
Education System in the UnitedArab Emirates
Doctorate Degree / Applied Sciences
Master’s Degree / Applied Sciences
Bachelor’s Degree / Applied Sciences
(2 years) (2 years)
(3-5 years)
Elite Program (Grades 5-8)Top 10 percent of students in national test scores
Ages 10-14 (4 years)
Kindergarten Ages 4-6 (not compulsory)Nursery/ Care Ages 0-4 (not compulsory)
Grades 5-8 Ages 10-14 (4 years)
Grades 1-4 Ages 6-9 (4 years)
(4-5 years)
(3-4 years)
Advanced University Enrollment(3 years)
Top 10 percent of students in
national test scoresApplied Technology
Secondary School Program
The Ministry coordinates with national higher education institutions to admit students in various majors in line with the needs of the labour market and future human development plans. Higher Education institutions also determine the number of students that can be admitted according to their capabilities, mission and goals. They also set the conditions for students’ admission to various programmes according to the stream they graduated from, the levels of their performance in the secondary stage, and their results from the Emirates Standard Assessment Test.
Integration and coordination between General and Higher Education systems allow for the approval and calculation of school study courses within university studies according to the school stream and university specialisation, which reduces the duration of
university studies.
Postgraduate Diploma(1-2 year)
Postgraduate Diploma(1 year)
Master’s Degree Master’s Degree
Doctorate Degree
Cycle 2
Cycle 1
Early Childhood
Dual DegreeBachelor’s / Master’s
Bachelor’s Degree / Applied Sciences Bachelor’s Degree
Cycle 3 / Secondary Stage
Grades 9-12 Ages 14-18 (4 years)
Academic StreamsTechnical & Vocational StreamsBa
sic
Educ
atio
n
UAE
Nat
ional
Qua
lifica
tions
Fra
mew
ork
Leve
ls 1-
4
UAE
Nat
ional
Qua
lifica
tions
Fra
mew
ork
Leve
ls 5-
6
UAE
Nat
ional
Qua
lifica
tions
Fra
mew
ork
Leve
ls 7-
8
UAE
Nat
ional
Qua
lifica
tions
Fr
amew
ork L
evel
9UA
E N
ation
al Q
ualifi
catio
ns
Fram
ewor
k Lev
el 10
Inte
rnat
iona
l Cl
assi
ficat
ions
In
tern
atio
nal
Clas
sific
atio
ns
Inte
rnat
iona
l Cl
assi
ficat
ions
In
tern
atio
nal
Clas
sific
atio
ns
Inte
rnat
iona
l Cl
assi
ficat
ions
In
tern
atio
nal
Clas
sific
atio
ns
Inte
rnat
iona
l Cl
assi
ficat
ions
In
tern
atio
nal
Clas
sific
atio
ns
Theoretical Starting Age
3
6
12
12
18
18
22
24
EliteAdvancedGeneralTechnical Advanced
Technical General
Specialised Academies
Applied

Hybrid education in the Emirati school
Within the strategic dimension of the Ministry of Education’s development plans and its endeavor to diversify education channels and overcome all the challenges that may prevent it, and to ensure continuity in all circumstances, the Ministry has implemented a hybrid education plan for all students at all levels of education.
Study PlanPre-
kindergarten/ kindergarten
Cycle 1 Cycle 2 Cycle 3
School learning
e-learning
ü ü ü
ü
ü
ü
ü ü ü ü
- -Direct
Self
Channels for obtaining a textbook:
Electronic units