3 stroke - university of birmingham
TRANSCRIPT

d:/postscript/03-CHAP3_1.3D – 27/1/4 – 9:27
[This page: 141]
3 StrokeJonathan Mant, Derick Wade and Simon Winner
1 Summary
Introduction
Stroke accounts for 11% of all deaths in England and Wales, and is also an important cause of morbidity,
since the majority of patients survive their first stroke, often with significant disability. The significance
of stroke as a major health care problem has been recognised in recent government white papers, which
have set targets for reductions in stroke mortality. Standard five of the National Service Framework (NSF)
for older people states that: ‘The NHS will take action to prevent strokes, working in partnership with other
agencies where appropriate. People who are thought to have had a stroke have access to diagnostic services,
are treated appropriately by a specialist stroke service, and subsequently, with their carers, participate in a
multidisciplinary programme of secondary prevention and rehabilitation.’There have been important advances in the evidence base for the prevention, treatment and
rehabilitation of stroke in the last decade. Commissioners of health care face important decisions about
how to implement this evidence and comply with the NSF and how to allocate priorities to different
aspects of stroke care. This chapter aims to provide the background information to support such decision
making.
Sub-categories
There are several different ways of categorising the problems related to stroke. From a perspective of health
care needs assessment, no single classification is ideal. A pragmatic solution is to use the following
sub-categories:
� People at high risk of stroke: This category has been included because stroke prevention should have a
key role in health strategies, exemplified by local Health Improvement Plans. Mortality targets set by
the government ensure that stroke prevention will remain a priority for Health Authorities and
Primary Care Groups/Trusts.
� Transient ischaemic attack (TIA): Defined as an acute loss of focal cerebral or ocular function with
symptoms lasting less than 24 hours, which is presumed after adequate investigation to be due to
embolic or thrombotic vascular disease.
� Stroke (acute phase): The World Health Organisation (WHO) defines stroke as a syndrome of rapidlydeveloping symptoms and signs of focal, and at times global, loss of cerebral function lasting more than
24 hours or leading to death, with no apparent cause other than that of vascular origin. Although
sub-arachnoid haemorrhage is included within this WHO definition, it is appropriately dealt with
separately (see below).

d:/postscript/03-CHAP3_1.3D – 27/1/4 – 9:27
[This page: 142]
� People with sequelae of stroke: Needs for rehabilitation and continuing care services relate to the
medium- and long-term consequences of stroke. Such patients also benefit from therapy aimed at the
reduction of risk of further stroke or other vascular events.
� Sub-arachnoid haemorrhage: This clinical syndrome is caused by blood in the sub-arachnoid space,typically due to leakage of blood from an aneurysm near the circle of Willis. While sub-arachnoid
haemorrhage may lead to cerebral infarction, the acute management is different from that for focal
stroke, and therefore it is useful to consider it as a separate sub-category.
Prevalence and incidence
Using data from a number of different sources, including the Health Survey for England, and UK-based
prevalence surveys and incidence studies, the following estimates of numbers of cases per 100 000
population in a year were made:
These estimates are based upon the population structure of England and Wales as a whole. The prevalence
and incidence of stroke rise with age, so these figures need to be adjusted for areas that have different age
distributions, such as retirement areas or new towns. The prevalence and incidence of stroke also depends
upon other population factors such as ethnic mix and socio-economic status.
Services available and their costs
Prevention of stroke
Both population-based strategies and approaches to reduce the risk in individuals at high risk of stroke are
used. Services available to treat people at high risk of stroke include: blood pressure reduction;anticoagulation for people in atrial fibrillation; investigation of transient ischaemic attack, and treatment
with carotid endarterectomy in appropriate cases. Aspirin is also indicated for many people at high risk of
stroke. Other relevant services include those related to smoking cessation, weight reduction and exercise
promotion.
142 Stroke
Table 1: Summary of epidemiology of stroke and risk factors for stroke in a population of 100,000.
Sub-category Expected number of newcases per year (incidence)
Expected number of existingcases (prevalence)
Risk factors for stroke
Atrial fibrillation 330 1,100
Hypertension (BP > 140/90) 34,000
Current smokers 28,000
Diabetes mellitus 2,000
Ischaemic heart disease 5,500
Transient ischaemic attack 35
Stroke 1,500
First stroke (excluding sub-arachnoid haemorrhage) 164
Recurrent stroke 57
People with moderate disability from stroke N/A 1,000
Sub-arachnoid haemorrhage 10

d:/postscript/03-CHAP3_1.3D – 27/1/4 – 9:27
[This page: 143]
Acute management and rehabilitation of stroke
The majority of patients with acute stroke are cared for initially in hospital, though a proportion remain at
home. Community services available to facilitate home care in different parts of the country include: rapid
response teams; hospital at home; day hospital; outpatient and domiciliary services. In hospital, patients
may be cared for in specialist facilities or on general wards. Types of specialist facility that are available
under the broad umbrella term of ‘stroke unit care’ include stroke teams, dedicated stroke units (which
may be for acute care and/or rehabilitation), and mixed rehabilitation units. Recent audits suggest that the
majority of patients are cared for on general wards. In some areas, intermediate care facilities such ascommunity hospitals and social rehabilitation units are available to facilitate transfer from hospital back
into the community. Approximately 19% of stroke survivors are transferred to long-term institutional
care.
Services for sub-arachnoid haemorrhage
Acute sub-arachnoid haemorrhage is usually managed in hospital. Both acute medical therapy, in the form
of nimodipine, and surgery (to repair underlying vascular defects) are available.
Costs of stroke care
Stroke has been estimated to account for between 4–6% of total NHS costs. It has been estimated that
approximately two-thirds of these costs arise from the treatment and care of people with ‘old’ strokes.
Effectiveness and cost-effectiveness
Population strategies to prevent stroke
Evidence from observational studies supports a number of population strategies to lower the incidence of
stroke, directed at reducing smoking, reducing socio-economic deprivation, lowering blood pressure and
encouraging healthy lifestyles.
Prevention in people at high risk of stroke
Treating hypertension, anticoagulating people in atrial fibrillation, treating people at high cardiovascularrisk with antiplatelet agents, treating people with vascular disease with statins, tight control of blood
glucose and blood pressure in diabetics, and performing carotid endarterectomy in people with
significant carotid artery stenosis are all approaches that have been demonstrated to be effective in
randomised controlled trials (RCTs). Evidence from observational studies supports the encouragement
of changes in lifestyle, such as stopping smoking, healthy diet, exercise and avoidance of excessive
alcohol consumption.
Acute treatment of stroke
There is good evidence that patients receiving organised inpatient or stroke unit care have lower mortality
than those cared for in other settings. While many pharmacological interventions in acute stroke have been
studied, aspirin and thrombolysis (in certain specific circumstances) are the only ones shown by RCTs to
be effective.
Stroke 143

d:/postscript/03-CHAP3_1.3D – 27/1/4 – 9:27
[This page: 144]
Stroke rehabilitation
There is good evidence that organised stroke care given by a co-ordinated specialist team reduces disability
and rates of institutionalisation. Within the overall package of stroke unit care, there is a growing evidence
base for individual components. There is now evidence from RCTs supporting the use of physiotherapy,
occupational therapy and family support for carers.
Treatment of sub-arachnoid haemorrhage
Nimodipine is effective in the treatment of acute sub-arachnoid haemorrhage.
Models of care and recommendations
Guidelines for stroke care
National guidelines and statements on stroke care have been produced by the Intercollegiate Working
Party on Stroke, the Edinburgh Consensus Meetings, and the Scottish Intercollegiate Guidelines Network(SIGN). These provide an excellent basis for considering the optimum pattern of stroke services for a
defined population.
The key components of a strategy for primary stroke prevention include: identification and treatment of
hypertension; identification and treatment of atrial fibrillation; careful control of hypertension in diabetes;
lifestyle advice with regard to smoking, diet, weight, and exercise; and treatment with a statin of patients
with known vascular disease and elevated cholesterol.
The same issues apply to treatment of people who have had a stroke or transient ischaemic attack (TIA),
but because the risks of subsequent strokes are high, each is of relatively greater importance. In addition,following ischaemic stroke, patients should be on aspirin, or another antiplatelet agent if aspirin-
intolerant. Patients with a TIA or minor stroke should be assessed rapidly for eligibility for carotid
endarterectomy, which should be performed in a centre with a low complication rate. This might
necessitate referral to regional or sub-regional units.
There is consensus that the vast majority of patients with acute stroke should initially be assessed in
hospital. Aspirin is an effective acute treatment for ischaemic stroke, and is preferably administered after
brain imaging has been performed to rule out intracranial haemorrhage. Thrombolytic therapy is a
reasonable treatment to give in selected patients, but only in specialist centres in a carefully monitoredenvironment. Further research is required before such a model of care can be ‘rolled out’ to a wider
population.
There is strong evidence that acute care and rehabilitation of stroke patients is highly effective when
carried out in inpatient stroke units that offer an organised, multidisciplinary approach to care. All stroke
patients should have access to such care. The extent to which these results can be reproduced in other
settings, such as community hospitals, day hospitals and at home, have not yet been demonstrated. While
some studies have been carried out looking at early discharge schemes, the precise contribution that these
should make has still to be defined. Nevertheless, it is impractical to expect stroke units (with an averageunit size of 6–15 beds) to cater for the needs of a typical district general hospital catchment area serving a
population of 300 000, which can anticipate having on average 30 patients with stroke in hospital at a
time. Therefore, different models of DGH care that conform to the broader definition of ‘stroke unit care’
need to be employed, and locality-based models of intermediate care need to be developed and evaluated.
144 Stroke
d:/postscript/03-CHAP3_1.3D – 27/1/4 – 9:27
[This page: 145]
Towards a quantified model for stroke care
With regard to services specifically aimed at stroke prevention, in a typical population of 100 000 it is
estimated that in a year:
� 539 of the estimated 1100 patients in atrial fibrillation will need anticoagulation
� 99 patients will need rapid neurological assessment and or assessment for eligibility for carotid
endarterectomy
� 14 patients will need carotid endarterectomy.
With regard to acute stroke treatment and rehabilitation, in a typical population of 100 000 which suffers
221 first or recurrent strokes in a year it is estimated that:
� 12 hospital beds will be required (within a setting that conforms to stroke unit care)� access to neurosurgical services is required for patients with sub-arachnoid haemorrhage and patients
with stroke who develop hydrocephalus
� access to community-based specialist rehabilitation services is required – the size of these will depend
upon the extent to which hospital-based or community-based rehabilitation is the preferred model
within a given area.
Priorities for stroke care
Within the optimum model for stroke care promoted by national guidelines, priority should be given to
establishment of stroke units and developing models of care that permit care of equivalent quality to stroke
unit care to be applied to a larger proportion of stroke patients. In hospital, this will mean ensuring co-
ordinated, multidisciplinary specialist care in settings other than stroke units, such as neurological and
geriatric rehabilitation wards. With regard to stroke prevention, simple interventions such as aspirin in
appropriate patients are highly cost-effective. Anticoagulation for atrial fibrillation and carotid endarter-ectomy in selected patients are also cost-effective treatments, though the former has greater potential, both
in terms of numbers of strokes that might be prevented and relative cost (approximately £4000 versus
£28 000 per stroke prevented). More effective treatment of hypertension is the strategy that has the most
potential for reducing stroke incidence, but the relative cost-effectiveness is critically dependent upon
whether older or newer antihypertensive agents are used.
2 Introduction
Stroke as a major health issue
Stroke is a major health problem in the UK. It accounted for over 56 000 deaths in England and Wales in 1999,which represents 11% of all deaths.1 The majority of patients survive a first stroke, often with significant
morbidity. Overall ithasbeenestimatedthat caring forpeoplewithstrokeaccounts for4–6%ofthe total NHS
budget.2,3 While there is evidence that age-specific mortality from stroke has been declining in recent years,1
this is unlikely to result in any decline in need for services, since this in part reflects better survival following
stroke. Furthermore, ageing of the population will offset any age-specific decline in incidence.
International comparisons of stroke mortality
The burden of stroke in terms of mortality in the UK can be set in a worldwide context. An analysis of
World Health Organisation (WHO) data shows that mortality is lowest in affluent industrialised
Stroke 145

d:/postscript/03-CHAP3_1.3D – 27/1/4 – 9:27
[This page: 146]
countries, and that UK mortality is broadly similar to that in other Western European countries.4 For
example, the mortality rate for men aged 35–74 in 16 Western European countries ranges from 34 per
100 000 (Switzerland) to 162 per 100 000 (Portugal). The UK is ranked ninth in this set of countries, with a
mortality of 65 per 100 000. International comparisons of case fatality (i.e. whether or not strokes thatoccur are fatal) give a slightly different picture, with the UK tending to have higher case fatality than other
areas of Western Europe.5,6 It is difficult to disentangle whether the differences in case fatality are due to
differences in methods of data collection, case-mix, or care provided. High case fatality but average
mortality from stroke (as experienced in the UK) taken at face value would imply lower incidence, but this
is not borne out by comparative incidence studies.6,7 This would suggest that the likeliest explanation for
the discrepancy is methodological artefact (which may affect either or both case fatality and mortality).
Stroke and government policy
The importance of stroke has been stressed in government policy over the last decade. Two white papers,
the Health of the Nation3 and Saving Lives: Our Healthier Nation,8 set targets for reductions in stroke
mortality. There is a chapter on stroke in the National Service Framework (NSF) for older people in which
standard five aims ‘to reduce the incidence of stroke in the population and ensure that those who have had
a stroke have prompt access to integrated stroke care services’.9 The standard given is that: ‘The NHS will
take action to prevent strokes, working in partnership with other agencies where appropriate. People whoare thought to have had a stroke have access to diagnostic services, are treated appropriately by a specialist
stroke service, and subsequently, with their carers, participate in a multidisciplinary programme of
secondary prevention and rehabilitation.’
The implementation of the NSF standard sets a challenge. The information in this chapter illustrates the
dimensions of the task ahead to implement the NSF standard. The chapter summarises the epidemiology
of stroke (section 4), the current pattern of stroke services (section 5), the evidence of effectiveness of
services and interventions (section 6), and models of care to achieve the aim of the NSF (section 7).
Key issues
Within a publicly financed health care system with limited resources, a key issue is how best to distribute
the health care resources that are available for stroke care. As in other areas of health care, there is
controversy over which part of the system is in most need of extra resources. Should the emphasis be on
hospital-based or community-based services? On services for prevention or treatment? On acute
treatments or longer-term rehabilitation? These questions have no simple answers, and the solutions liein getting the balance right between these different facets of stroke services. One aim of this chapter is to
provide the background information that will help commissioners of health care services to make rational
choices in these difficult areas.
There have been significant improvements in the evidence base for stroke in the last decade. Effective
strategies are available to prevent stroke, and to treat and rehabilitate stroke patients. However, audits
suggest that many people with stroke are not receiving optimal care.10 This raises important issues of
implementation. The Intercollegiate Working Party (IWP) for Stroke has prepared multidisciplinary
guidelines for stroke care which reflect this evidence base,11 and a key question for commissioners of healthcare is how best to support implementation of these guidelines, which have been explicitly incorporated
into the National Service Framework.
The data that are available from epidemiological studies are only of limited value for a health care needs
assessment. While there are now reasonable data on the incidence and prevalence of stroke, data on the
146 Stroke

d:/postscript/03-CHAP3_1.3D – 27/1/4 – 9:27
[This page: 147]
incidence and prevalence of disability and impairment, which is a stronger predictor of the need for
rehabilitation and continuing care services, are limited. Therefore, there is a danger that needs assessment
(and hence service provision) can become too focused on the needs of people with acute stroke, and less on
their rehabilitation and longer-term care needs.
3 Sub-categories
Stroke is a neurological impairment of sudden onset which is caused by a disruption of the blood supply to
the brain. Stroke is an umbrella term that includes different pathologies and clinical syndromes. This can
lead to some confusion in the literature. In this chapter, for pragmatic reasons that are explained below,
stroke is distinguished from sub-arachnoid haemorrhage and from transient ischaemic attack (see ‘Sub-
categories used in this chapter’ below for definitions of these conditions that are used in this chapter). In
fact, the standard definition of stroke12 includes sub-arachnoid haemorrhage, but because the clinical
syndrome of sub-arachnoid haemorrhage is quite distinct from stroke and is managed in a different way, inthis chapter sub-arachnoid haemorrhage is considered separately. The standard definition of stroke
excludes transient ischaemic attack on the basis of duration of symptoms: to be labelled ‘a stroke’,
symptoms have to last for more than 24 hours, otherwise the label ‘transient ischaemic attack’ applies.
However, the underlying pathology is the same, and the management in terms of secondary prevention is
identical. The following section reviews the different ways in which stroke can be sub-classified and
explains why the sub-categories used in this chapter have been selected.
Possible sub-categorisations
Stroke can be sub-categorised in different ways: by pathological type; by pathological cause; by associated
risk factors; by prognosis; by anatomical site; or by impact on disability and handicap. From the
perspective of a health care needs assessment, none of these sub-categorisations is entirely satisfactoryon its own.
Pathological type
There are two major pathological types of stroke: cerebral infarction and intra-cerebral haemorrhage. A
third important acute cerebrovascular disease is sub-arachnoid haemorrhage, which may or may not resultin a clinical stroke. The vast majority of stroke is cerebral infarction. For example, in the Oxford
Community Stroke Project, 81% of first strokes were cerebral infarction, 10% primary intracerebral
haemorrhage, 5% sub-arachnoid haemorrhage, and 5% of uncertain type.13 The pathological type of
stroke is of prognostic significance (see Table 2 overleaf ) and of clinical significance in that there are some
differences in the acute management of patients with intracerebral haemorrhage and cerebral infarction
(see sections 5 and 6). Sub-arachnoid haemorrhage presents and is managed differently from the other
acute cerebrovascular diseases.
While it is useful to distinguish the pathological types of stroke, the exercise is of only limited utility inhealth care needs assessment. The pathological type is only a very crude predictor of disability and
handicap, and these are important determinants of medium- and long-term health care needs. Routine
data sets do not discriminate well between types,14 so practical ability to sub-categorise to this level of detail
is limited.
Stroke 147

d:/postscript/03-CHAP3_1.3D – 27/1/4 – 9:27
[This page: 148]
Pathological cause
The sequence of events leading to permanent brain damage varies considerably, and the underlying
mechanisms are interrelated and can lead from one to another (see Figure 1). The principal pathologicaltypes of stroke are associated with different underlying causes. Cerebral infarction is usually due to
thrombosis or embolism, though it can also be a consequence of intracerebral haemorrhage or sub-
arachnoid haemorrhage. Embolism may arise either from the heart or from atheromatous arteries. The
distinction between thrombosis and embolism and identifying the source of the embolus is of potential
relevance in targeting secondary prevention, and for clinical trials of acute treatments. However, accurate
classification is usually arbitrary – presence of a source of embolus, for example, does not prove that a
stroke had an embolic cause. A classification of sub-type of ischaemic stroke based on presumed
underlying pathological cause was proposed by the TOAST (Trial of ORG10172 in Acute StrokeTreatment) investigators: large artery atherosclerosis; cardio-embolism; small-vessel occlusion; stroke
of other determined aetiology; stroke of undetermined aetiology.15 This classification is difficult to apply.
The TOAST investigators found that the initial clinical impression of stroke sub-type only agreed with final
determination of sub-type (incorporating all investigation results and performed three months after
stroke) in 62% of patients, and 15% of patients did not have a clear aetiological sub-type even at three
months.16 Use of modern magnetic resonance imaging techniques can substantially improve the early
classification of stroke sub-type.17 US data from the Stroke Data Bank of the National Institute of
148 Stroke
Table 2: Case fatality rates by pathological type of stroke: adapted from Bamford et al.13
Stroke type Mortality at one month (95% CI) Mortality at one year (95% CI)
Cerebral infarction 10% (7–13) 23% (19–27)
Primary intracerebral haemorrhage 50% (38–62) 62% (43–81)
Sub-arachnoid haemorrhage 46% (29–63) 48% (24–72)
Uncertain type 77% (46–100) 84% (52–100)
All 19% (16–22) 31% (27–35)
INTRACEREBRALHAEMORRHAGE
Arterial disease
Haematologicaldisease/abnormality
Arterial thrombosis
Arterial embolism
Cardiac disease
Cerebral aneurysm
Arterio-venousmalformation
distant
localCEREBRALINFARCTION
SUBARACHNOIDHAEMORRHAGE
Direct braindamage
Hydrocephalus
Secondary to vasospasm
Secondary to vasospasm
Figure 1: Pathological categorisation of stroke.

d:/postscript/03-CHAP3_1.3D – 27/1/4 – 9:27
[This page: 149]
Neurological and Communicative Disorders and Stroke and the Framingham study suggest that, using the
TOAST classification:18 60% of ischaemic stroke is attributed to an embolic cause; 25% of ischaemic
stroke to small-vessel occlusion (lacunar stroke); and 15% of ischaemic stroke to large vessel athero-
thrombosis.Simple classification of the pathological cause of the stroke is also of prognostic relevance. Follow-up of
patients with ischaemic stroke in Rochester, Minnesota found that this classification predicted risk of
stroke recurrence at one month (but not in the long term), and long-term (five-year) survival.19
Intracerebral haemorrhage may occur as part of sub-arachnoid haemorrhage, but more commonly
occurs on its own. The usual causes are vasculopathy secondary to hypertension or vascular disease,
intracranial aneurysm (usually associated with sub-arachnoid haemorrhage), and arterio-venous mal-
formations.
Sub-arachnoid haemorrhage is often due to leakage from an intracranial aneurysm, but may also occuras a result of arterio-venous malformations or other vascular abnormalities such as angiomas.
Approximately 20% of sub-arachnoid haemorrhage has no demonstrable underlying cause.20,21
Associated risk factors
Several medical conditions increase risk of stroke, such as hypertension, atrial fibrillation, diabetes,ischaemic heart disease, and carotid artery stenosis. Aspects of lifestyle modify stroke risk, such as diet,
smoking, alcohol, and exercise (see section 4). Knowledge of the prevalence of such factors and the strength
of their association with stroke is relevant for a disease prevention needs assessment. Estimates can be
made of the relative contribution of each risk factor to the overall burden of stroke, which in turn can
inform prioritisation of stroke prevention initiatives (see section 7).
Prognosis
Prognosis following stroke can be described in terms of survival, risk of a further stroke (recurrence), or
extent of long-term disability. Prognostic factors are different for each of these. A number of studies have
derived models for predicting outcome of stroke in terms of survival and/or disability.22–25 These models
tend to use a combination of some or all of past medical history (e.g. previous stroke; diabetes),
demographic variables (age, sex), and early clinical features (e.g. impaired consciousness; urinary
incontinence). Prognosis influences need for health services, so a prognosis-based sub-categorisationcould be of value. However, predicting outcome for individuals is very difficult and for groups remains
crude. It is questionable whether complex multi-variate models are significantly more useful than simple
univariate predictors such as level of consciousness or incontinence.22,25
Prognostic models have been applied to the process of adjusting data sets for differences in case-mix,
which is important for interpreting variations in outcome.26,27 As such, the models are of possible value in
monitoring the quality of stroke services (see section 8).
Anatomical site
Bamford et al., using data from the Oxford Community Stroke Project, defined four sub-categories of
cerebral infarction on the basis of presenting symptoms and signs: lacunar infarcts (LACI); total anteriorcirculation infarcts (TACI); partial anterior circulation infarcts (PACI); and posterior circulation infarcts
(POCI) – see Table 3 overleaf.28
While the classification is based upon bedside clinical features, the labels attached to each sub-category
are anatomical, which reflects the close correlation between symptoms and signs and site of cerebral
Stroke 149

d:/postscript/03-CHAP3_1.3D – 27/1/4 – 9:27
[This page: 150]
infarction. As shown in Table 4, this classification is of prognostic significance. A TACI is associated with
high mortality, and significant disability in most survivors. A PACI is associated with the highest risk of
early (i.e. within 3 months) recurrence of stroke. A patient with a POCI has the best chance of a good
recovery, and patients with a LACI the best chance of survival. The advantage of this classification is that ituses relatively simple clinical criteria. The disadvantages are that it does not extend to sub-arachnoid
haemorrhage or intracerebral haemorrhage, and that, for lacunar strokes, the relationship between clinical
classification and anatomical site may not be very close. For example, Toni et al. found that only 56%
(123/219) of patients with clinically defined lacunar strokes had anatomically defined lacunar strokes,
while 27% (47/170) of patients with anatomical lacunar strokes did not have clinical lacunar strokes.29
Nevertheless, as a clinical classification, the system remains of value.
Impact in terms of disability and handicap
Disability and handicap are important determinants of rehabilitation and care needs. A fuller discussion of
the concepts of disability and handicap, and their relationship to impairments, is given in Appendix 1.
Several measures are available and used either in routine clinical practice or for audit and researchpurposes.30,31 The Barthel Activities of Daily Living Index is perhaps the most commonly used measure of
150 Stroke
Table 3: The Oxford Community Stroke Project classification of sub-types of cerebral infarction.28
Lacunar infarcts (LACI) A pure motor stroke, a pure sensory stroke, a sensori-motor stroke, or an ataxic
hemiparesis.
Total anterior circulation
infarcts (TACI)
A combination of new higher cerebral dysfunction (e.g. dysphasia), homonymous
visual field defect and ipsilateral motor and/or sensory deficit of at least two areas
(out of face, arm and leg).
Partial anterior circulation
infarcts (PACI)
Only two of the three components of a TACI, or with higher cerebral dysfunction
alone, or with a motor/sensory deficit more restricted than those classified as LACI
(e.g. confined to one limb).
Posterior circulation
infarcts (POCI)
Any of: ipsilateral cranial nerve palsy with contralateral motor and/or sensory
deficit; bilateral motor and/or sensory deficit; disorder of conjugate eye movement;
cerebellar dysfunction; isolated homonymous visual field defect.
Table 4: Prognostic significance of the Oxford Community Stroke Project stroke sub-types (Bamfordet al.).28
Case fatality (%)Functionally dependent
Dead or dependent(Rankin 3–5) (%)
1 month 6 mths 1 year 1 month 6 mths 1 year1 month 6 mths 1 year
LACI 2 7 11 36 26 28 38 34 40
TACI 39 56 60 56 39 36 96 96 96
PACI 4 10 16 39 34 29 44 45 45
POCI 7 14 19 31 18 19 38 32 38
All 10 18 23 39 29 28 50 48 51

d:/postscript/03-CHAP3_1.3D – 27/1/4 – 9:27
[This page: 151]
disability (see Table 5).32 This gives a disability score from 0 (severe disability) to 20 (independent), and
can be sub-divided into groups. It has limitations, in that it has floor and ceiling effects, and is insensitive to
small differences.30 It describes disability at a given point in time, and while this is of relevance to current
health care needs, it is only a weak predictor of future disability.
Several scales include elements of both disability and handicap. One of the simplest of these is the Rankin
scale, usually used in modified form with six grades,13 from no symptoms to severe disability (see Table 5).
This scale has the virtue of simplicity and is therefore suitable for large-scale epidemiological studies and
clinical trials. It is often collapsed down to two levels. For example, in the Oxford Community Stroke
Project it was reduced to ‘functionally independent’ (grades 0–2) and ‘functionally dependent’ (grades3–5) (see Table 4). Measures of handicap may focus on single dimensions such as social activities (e.g. the
Frenchay Activities Index)33 or address handicap more broadly. An example of the latter is the London
Handicap Scale,34 which measures handicap using the six dimensions of the WHO classification.35
Measures of this type are of value in clinical trials and audits and could have a role in local health care needs
assessments where primary data are being collected, but because they are not in routine use, they cannot
usefully form the basis of sub-categorisation for the purposes of this chapter.
Sub-categories used in this chapter
Need for health care is defined both in terms of the incidence and prevalence of a condition, and the
effectiveness of services to treat that condition (see An introduction to HCNA). It follows that the mostuseful sub-categorisation of stroke would be into categories for which there were data available for both
epidemiology and effectiveness. The sub-categories used in this chapter reflect this pragmatic reasoning,
rather than being underpinned by a firm theoretical basis. They do not follow any single one of the
categorisations described above. Nevertheless, the preceding discussion is important to underline the
Stroke 151
Table 5: Examples of disability measures: the Barthel Index32 and the Modified Rankin Scale.13
Modified Rankin Scale
0 No symptoms
1 Minor symptoms which do not interfere with lifestyle
2 Minor handicap: symptoms which lead to some restriction in lifestyle but do not interfere with the patient’s
capacity to look after themselves
3 Moderate handicap: symptoms which significantly restrict lifestyle and prevent totally independent existence
4 Moderately severe handicap: symptoms which clearly prevent independent existence though not needing
constant attention
5 Severe handicap: totally dependent, requiring constant attention night and day
Barthel Activities of Daily Living (ADL) Index
Score from 0–20, on the basis of assessment of ten different items:
Bowel control (score 0–2); Bladder control (score 0–2); Grooming (score 0 or 1); Toilet use (score 0–2); Feeding
(score 0–2); Ability to transfer from bed to chair and vice versa (score 0–3); mobility (score 0–3); dressing (score
0–2); ability to climb stairs (score 0–2); bathing (score 0 or 1).
Reliability depends upon accurate application of standardised definitions.

d:/postscript/03-CHAP3_1.3D – 27/1/4 – 9:27
[This page: 152]
limitations of the classification that will be used, to raise issues that are of importance in considering local
health care needs assessments, and to highlight alternative sub-classifications that would be of value if data
were available.
The sub-categories that are used in this chapter are:
� people at high risk of stroke
� transient ischaemic attack
� stroke (acute phase)
� people with sequelae of stroke� sub-arachnoid haemorrhage.
People at high risk of stroke
This category has been included since stroke prevention should have a key role in health strategy, such as
local Health Improvement Plans. Indeed, the mortality targets set by the government ensure that strokeprevention will remain a priority for Health Authorities and Primary Care Groups.8 For discussion of who
is at high risk of stroke, and therefore included in this sub-category, see section 4.
Transient ischaemic attack
This is a particular sub-group within the high risk group. A transient ischaemic attack (TIA) may be
defined as an acute loss of focal cerebral or ocular function with symptoms lasting less than 24 hours which,after adequate investigation, is presumed to be due to embolic or thrombotic vascular disease.36 The
distinction between TIA and stroke is one of duration of symptoms, with 24 hours representing a
watershed between the two. In a significant minority of patients (14% in one series), patients with a clinical
TIA have suffered a cerebral infarct in the appropriate area as demonstrated by CT scan.37 The relevance of
including TIA as a sub-category is that patients with a recent TIA are at high risk of suffering a completed
stroke (see section 4). Some patients with a carotid territory TIA (as opposed to vertebro-basilar territory
TIA) will benefit from carotid endarterectomy to reduce this risk (section 6). Therefore the incidence of
TIA predicts need for health services aimed at assessing whether such patients would be suitable candidatesfor endarterectomy, and indeed need for the operation itself. The distinction between TIA and minor
stroke is arbitrary, and in practical terms for a health care needs assessment TIA should be considered with
minor stroke. However, since most of the available epidemiological data separates TIA from minor stroke,
the sub-category of TIA on its own is used for pragmatic reasons.
Stroke (acute phase)
Stroke may be defined as a ‘syndrome of rapidly developing symptoms and signs of focal, and at times
global, loss of cerebral function lasting more than 24 hours or leading to death, with no apparent cause
other than that of vascular origin’.12 This definition includes sub-arachnoid haemorrhage, which is a
cause of global loss of cerebral function. However, sub-arachnoid haemorrhage will be considered as a
separate category for the purposes of this chapter (see below). Patients who suffer a stroke need four types
of service: acute treatment; secondary prevention; rehabilitation; and continuing care. Unfortunately,none of the sub-categorisations of stroke discussed above adequately predicts need for all these categories
of service. Acute treatment and secondary prevention needs are largely determined by stroke incidence,
whereas rehabilitation and continuing care needs relate to severity of stroke and persistence of symptoms,
whether defined in terms of impairment, disability or handicap.
152 Stroke

d:/postscript/03-CHAP3_1.3D – 27/1/4 – 9:27
[This page: 153]
People with sequelae of stroke
Given that needs for rehabilitation and continuing care services relate to the sequelae of stroke, it is
important to have a sub-category that reflects this. The American Heart Association has classified the
consequences of stroke in terms of six categories of impairment: motor; sensory; visual; language;
cognition; and affect.38 There are some data on the prevalence of these impairments following stroke, so
this categorisation has some utility for the purposes of health care needs assessment.
Sub-arachnoid haemorrhage
Sub-arachnoid haemorrhage is characterised clinically by a history of acute onset of headache, meningism,
and photophobia, often associated with loss of consciousness with no history of trauma.13 This clinical
syndrome is caused by blood in the sub-arachnoid space, typically due to leakage of blood from an
intracranial aneurysm near the circle of Willis. While sub-arachnoid haemorrhage may lead to cerebral
infarction due to an intracerebral component of haemorrhage or associated spasm of blood vessels, the
acute management is different from that for focal stroke, and therefore it is useful to consider it as a
separate sub-category.The chapter will also make use of the available routine classification systems for stroke. These include the
International Classification of Disease (ICD) codes and the Health Care Resource Group Codes (HRGs).
Therefore, it is useful to outline how these systems classify stroke.
International Classification of Disease (ICD) codes
Routine NHS data such as mortality and hospital episode statistics utilise the International Classificationof Disease (ICD) codes. Until recently, data have been coded using the ICD-9 system,39 but a newer system
has been developed, ICD-10.40 The ICD codes use a classification based on a mixture of pathological type,
cause, and anatomical site (see Table 6 overleaf ). The principal ICD-9 codes encompassing stroke are
430–438, but if information is imprecise, then strokes are occasionally placed under less specific codes.41
Commonly, codes 430–438 are combined to give an overall code group for cerebrovascular disease
incidence or mortality. It should be noted that these codes include diagnoses that are not strictly included
in clinical definitions of stroke, such as transient cerebral ischaemia, sub-dural haemorrhage and cerebral
arteritis.Table 6 also illustrates the extent of use of these codes, by showing the number of deaths coded to each
three-digit classification in England and Wales in 1998. Approximately two-thirds of stroke deaths were
coded as ‘acute but ill-defined cerebrovascular disease’. In a study of coding of acute stroke in Oxford
hospitals, it was found that 89% of patients who died or discharged with a diagnosis of stroke confirmed
through a prospective stroke register were coded using ICD-9 code 436.41 Thus, however desirable sub-
classification of stroke might be using systems such as those outlined in ‘Possible sub-categorisations’
above, in practice, routine data sets do not provide sufficiently detailed diagnostic information to enable
their use.The equivalent alpha-numeric ICD-10 codes are shown in Table 7 overleaf. In ICD-10, cerebrovascular
diseases are covered by the codes I 60–I 69. The principal changes compared to ICD-9 are:
� transient cerebral ischaemia is now classified elsewhere� the four digit codes (not shown) allow more precise specification of anatomical site and of pathology
� occlusion and stenosis of pre-cerebral arteries now specifies ‘not resulting in cerebral infarction’
� a new code allowing for occlusion and stenosis of cerebral arteries that does not result in cerebral
infarction.
Stroke 153

d:/postscript/03-CHAP3_1.3D – 27/1/4 – 9:27
[This page: 154]
154 Stroke
Table 6: ICD-9 classification of stroke39 and coding of deaths from stroke in England and Wales 1998.14
Number of deathsin 1998 (% oftotal ‘stroke’)
430 Sub-arachnoid haemorrhage 2,686 (4.7)
431 Intracerebral haemorrhage 4,532 (7.9)
432 Other and unspecified intracranial
haemorrhage
432.0 Non-traumatic extradural
haemorrhage
415 (0.7)
432.1 Sub-dural haemorrhage
432.9 Unspecified intracranial
haemorrhage
433 Occlusion and stenosis of pre-cerebral
arteries
433.0 Basilar artery
433.1 Carotid artery
433.2 Vertebral artery
433.3 Multiple and bilateral
433.8 Other
433.9 Unspecified
222 (0.4)
434 Occlusion of cerebral arteries 434.0 Cerebral thrombosis
434.1 Cerebral embolism
434.9 Unspecified
4,644 (8.1)
435 Transient cerebral ischaemia 141 (0.2)
436 Acute but ill-defined cerebrovascular
disease
36,919 (64.2)
437 Other and ill-defined cerebrovascular
disease
437.0 Cerebral atherosclerosis
437.1 Other generalised ischaemic
cerebrovascular disease
437.2 Hypertensive encephalopathy
437.3 Cerebral aneurysm, non-ruptured
437.4 Cerebral arteritis
437.5 Moyamoya disease
437.6 Non-pyogenic thrombosis of
intracranial venous sinus
437.8 Other
437.9 Unspecified
7,453 (13.0)
438 Late effects of cerebrovascular disease 504 (0.9)
Table 7: ICD-10 classification of stroke.
I 60 Sub-arachnoid haemorrhage
I 61 Intracerebral haemorrhage
I 62 Other non-traumatic intracranial haemorrhage
I 63 Cerebral infarction
I 64 Stroke, not specified as haemorrhage or infarction
I 65 Occlusion and stenosis of pre-cerebral arteries, not resulting in cerebral infarction
I 66 Occlusion and stenosis of cerebral arteries, not resulting in cerebral infarction
I 67 Other cerebrovascular diseases
I 68 Cerebrovascular disorders in diseases classified elsewhere
I 69 Sequelae of cerebrovascular disease

d:/postscript/03-CHAP3_1.3D – 27/1/4 – 9:27
[This page: 155]
These modifications make it easier to differentiate between those conditions that result in cerebral
infarction (i.e. stroke) and those that do not.
Health care resource group codes (HRGs)
The NHS Executive has developed health care resource groups as a resource management tool. They group
together patients who are expected to consume similar amounts of health care resource. The groups are
defined on the basis of diagnoses (using the ICD codes described above) or procedures [using the Office of
Population Censuses and Surveys classification (OPCS-4)]. NHS reference costs provide data on the
average costs for each HRG (see section 5). Table 8 lists the HRG codes and labels for procedures and
conditions of particular relevance to stroke. The categories are broad. For example, one would anticipate a
very large range of costs within the category of A22, depending upon factors such as the degree of disability
and whether or not a patient survived. Such wide variation in costs is indeed seen (see ‘Costs of stroke care’in section 5).
World Health Organisation classifications of impairment,disability and handicap (ICFDH, ICF)
The classifications of stroke considered so far in this section have mostly focused on the underlying
pathology. This is appropriate when considering health care needs for prevention and acute treatment, but
less so when considering rehabilitation and continuing care needs. Rehabilitation can be defined as an
Stroke 155
Table 8: Health Resource Group codes relevant to stroke.
HRG code HRG label Procedures/conditions included
A01 Intracranial procedures except trauma – 1 Drainage of extra-dural space
A02 Intracranial procedures except trauma – 2 Drainage of sub-dural space
A03 Intracranial procedures except trauma – 3 Operations on aneurysm of cerebral artery
(excision or ligation); ligation of carotid artery;
drainage of sub-arachnoid space; evacuation of
haematoma (intracerebral; cerebellar)
A04 Intracranial procedures except trauma – 4 Operations on aneurysm of cerebral artery
(clipping; obliteration)
A19 Haemorrhagic cerebrovascular disorders Sub-arachnoid haemorrhage; intracerebral
haemorrhage
A20 Transient ischaemic attack, aged > 69 or with
complications
TIA
A21 Transient ischaemic attack, aged < 70 with no
complications
TIA
A22 Non-transient stroke or cerebrovascular
accident, aged > 69 or with complications
Cerebral infarction; stroke not specified as
haemorrhage or infarct
A23 Non-transient stroke or cerebrovascular
accident, aged < 70 with no complications
Cerebral infarction; stroke not specified as
haemorrhage or infarct
Q05 Extracranial or upper limb arterial surgery Carotid artery surgery, including
endarterectomy
d:/postscript/03-CHAP3_1.3D – 27/1/4 – 9:27
[This page: 156]
active problem-solving and educational process which focuses on the patient’s disability (activities affected) and
which aims to maximise the patient’s social participation while minimising both the patient’s somatic and
psychological pain and distress and the distress of and stress on family members. This definition of
rehabilitation is based upon the WHO model of impairment, disability and handicap. The originalWHO model was published in 1980, but has now been updated as the International Classification of
Functioning, Disability and Health.42 For discussion of the WHO models, see Appendix 1. The key ways in
which the updated model (ICF) has changed from the original model are that:
� the terms impairment, disability and handicap are replaced by new terms (functions, activities and
participation) which extend their meanings to include positive experiences
� environmental factors are explicitly incorporated in the model.
4 Prevalence and incidence
People at high risk of stroke
People may be at higher risk of stroke owing to inherent factors that cannot be altered, such as age, sex,family history and ethnicity. The effect of these will be considered under the epidemiology of stroke in
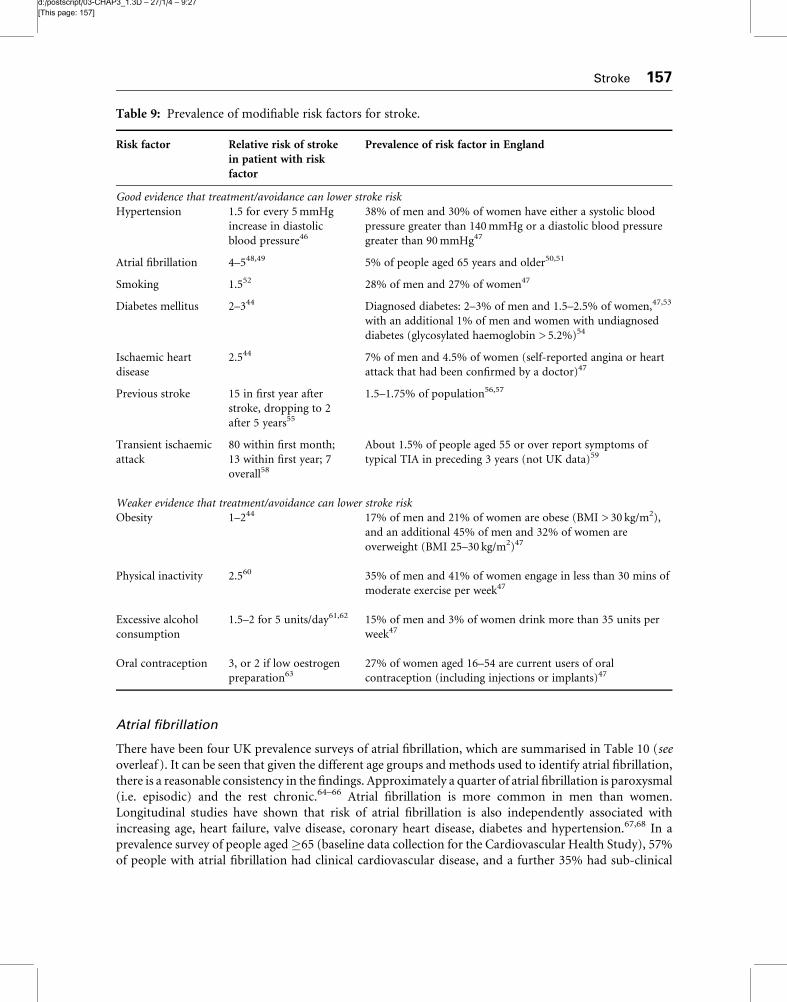
‘Stroke’, below. It is possible to produce long lists of potentially modifiable risk factors for stroke.
However, these lists are based largely on associations observed in epidemiological studies, and the
relationship between the risk factor and stroke is not necessarily causal, and may simply be due to
confounding.43–45 Table 9 (see overleaf ) shows the more important modifiable risk factors. It has been
divided into those factors where there is reasonable evidence that treatment or removal of the risk factor
does lead to a reduction in stroke risk, and those where the evidence is less certain. A summary of
the evidence that treatment/avoidance of these factors is effective in reducing stroke risk is provided insection 6.
While some of these risk factors (e.g. atrial fibrillation) are either present or absent (‘dichotomous
variables’), others, such as hypertension and obesity, are continuous variables. Table 9 presents the data
using well accepted (but arbitrary) cut-offs between what is ‘normal’ and ‘abnormal’ which can be used to
define a ‘higher risk’ individual. However, the lower the level of blood pressure, the lower the risk of
stroke.46 This is part of the rationale behind strategies to achieve whole population risk reduction (see
‘Prevention of stroke’ in section 5).
The importance of each of the risk factors in population terms depends upon three factors: howstrong the association with stroke is (i.e. the relative risk), how common the risk factor is (i.e. the
prevalence) and how common the disease is in the population group (i.e. the absolute risk). Thus,
among the risk factors in the top half of Table 9, hypertension and smoking are the most important
factors, given their high prevalence. Similarly, in the second half of the table, the potential importance of
physical inactivity and obesity is underlined by high prevalence. Conversely, transient ischaemic attack is
less important because it is relatively uncommon, though the high relative risk emphasises its importance
for the individuals in whom it occurs. Oral contraception is of relatively minor importance in population
terms as a risk factor for stroke since it is used in a population in whom the absolute risk of stroke is verylow.
Several of the risk factors shown in Table 9 (hypertension, diabetes, ischaemic heart disease, obesity) are
dealt with in other chapters in the health care needs assessment series, so will not be considered further
here. An important risk factor that does need some further consideration is atrial fibrillation.
156 Stroke
d:/postscript/03-CHAP3_1.3D – 27/1/4 – 9:27
[This page: 157]
Atrial fibrillation
There have been four UK prevalence surveys of atrial fibrillation, which are summarised in Table 10 (see
overleaf ). It can be seen that given the different age groups and methods used to identify atrial fibrillation,
there is a reasonable consistency in the findings. Approximately a quarter of atrial fibrillation is paroxysmal
(i.e. episodic) and the rest chronic.64–66 Atrial fibrillation is more common in men than women.
Longitudinal studies have shown that risk of atrial fibrillation is also independently associated with
increasing age, heart failure, valve disease, coronary heart disease, diabetes and hypertension.67,68 In a
prevalence survey of people aged�65 (baseline data collection for the Cardiovascular Health Study), 57%
of people with atrial fibrillation had clinical cardiovascular disease, and a further 35% had sub-clinical
Stroke 157
Table 9: Prevalence of modifiable risk factors for stroke.
Risk factor Relative risk of strokein patient with riskfactor
Prevalence of risk factor in England
Good evidence that treatment/avoidance can lower stroke risk
Hypertension 1.5 for every 5 mmHg
increase in diastolic
blood pressure46
38% of men and 30% of women have either a systolic blood
pressure greater than 140 mmHg or a diastolic blood pressure
greater than 90 mmHg47
Atrial fibrillation 4–548,49 5% of people aged 65 years and older50,51
Smoking 1.552 28% of men and 27% of women47
Diabetes mellitus 2–344 Diagnosed diabetes: 2–3% of men and 1.5–2.5% of women,47,53
with an additional 1% of men and women with undiagnosed
diabetes (glycosylated haemoglobin > 5.2%)54
Ischaemic heart
disease
2.544 7% of men and 4.5% of women (self-reported angina or heart
attack that had been confirmed by a doctor)47
Previous stroke 15 in first year after
stroke, dropping to 2
after 5 years55
1.5–1.75% of population56,57
Transient ischaemic
attack
80 within first month;
13 within first year; 7
overall58
About 1.5% of people aged 55 or over report symptoms of
typical TIA in preceding 3 years (not UK data)59
Weaker evidence that treatment/avoidance can lower stroke risk
Obesity 1–244 17% of men and 21% of women are obese (BMI > 30 kg/m2),
and an additional 45% of men and 32% of women are
overweight (BMI 25–30 kg/m2)47
Physical inactivity 2.560 35% of men and 41% of women engage in less than 30 mins of
moderate exercise per week47
Excessive alcohol
consumption
1.5–2 for 5 units/day61,62 15% of men and 3% of women drink more than 35 units per
week47
Oral contraception 3, or 2 if low oestrogen
preparation6327% of women aged 16–54 are current users of oral
contraception (including injections or implants)47

d:/postscript/03-CHAP3_1.3D – 27/1/4 – 9:27
[This page: 158]
cardiovascular disease (abnormal findings on echocardiography or carotid ultrasound).69 In other words,
atrial fibrillation may be regarded in most cases as a manifestation of underlying cardiovascular disease.
Data from the Framingham study suggest that the prevalence of atrial fibrillation has risen over time, from
3.2% in men aged 65–84 in 1968 to 9.1% in 1989.67
The best estimate of the prevalence of atrial fibrillation comes from a synthesis of four large population-
based surveys carried out in the USA and Australia.70 The results of this synthesis are consistent with the
UK estimates shown in Table 10. Therefore, in Table 11, the age-specific prevalence rates derived fromthese four population surveys are applied to the population structure of England and Wales14 in order to
obtain best estimates of UK age-specific numbers of cases of atrial fibrillation. It can be seen from Table 11
158 Stroke
Table 10: English prevalence surveys of atrial fibrillation.
Study Population Method ofidentifying AF
Results
Sudlow et al.50 Random sample of 4,843
people aged¼ 65 drawn from HA
register of 26 practices in
Northumberland
ECG Overall prevalence: 4.7%
65–74: 3.5% men, 2.4% women;
75þ: 10% men, 5.6% women
Connell and Gray64 Single practice in Gateshead
(n¼ 9,162)
From GP case
notes, some
verified by ECG
Overall prevalence: 91/9,162 (1%);
76% chronic, 24% paroxsymal
Wheeldon et al.51 Single practice in Sheffield: all
patients aged �65 (n¼ 1,422)
ECG Overall prevalence: 5.4%;
75þ: 6.6%
Lip et al.65 2 Birmingham practices
(n¼ 16,519)
From GP case
notes
Prevalence: 50þ: 2.4%; 73%
chronic, 27% paroxysmal
Table 11: Estimate of age-specific numbers of cases of atrial fibrillation in England and Wales.
Age group Age-specificprevalence rate
Population of England& Wales (1000s)
No of cases of AF(1000s)
% of all AF
40–44 0.1% 3,479.8 3.5 0.6%
45–49 0.3% 3,403.8 10.2 1.7%
50–54 0.5% 3,500.1 17.5 2.9%
55–59 0.8% 2,709.4 21.7 3.6%
60–64 1.5% 2,489.9 37.3 6.2%
65–69 3.0% 2,314.7 69.4 11.6%
70–74 5.0% 2,085.7 104.3 17.4%
75–79 7.0% 1,781.2 124.7 20.8%
80–84 10% 1,089.6 109.0 18.2%
85–89 10% 669 66.9 11.2%
90þ 10% 347.7 34.8 5.8%
All ages 1.1% 52,427.9
> 40 2.5% 23,870.9 599.3
> 65 6.1% 85%
> 75 8.6% 56%

d:/postscript/03-CHAP3_1.3D – 27/1/4 – 9:27
[This page: 159]
that the prevalence of atrial fibrillation rises with age, and over half (56%) of people with atrial fibrillation
are aged 75 or over. A recent (1996–7) prevalence survey of diagnosed atrial fibrillation based upon data
from a large health maintenance organisation in Canada found similar rates to those shown in Table 11.71
Given that this survey would have omitted people with undiagnosed atrial fibrillation – in England this isabout a quarter of all people with AF72 – this provides a hint that perhaps age-specific prevalence of atrial
fibrillation is rising.
There have been two incidence studies of atrial fibrillation: Framingham and the Cardiovascular Health
Study, neither of which are UK-based.68,73 In the Cardiovascular Health Study, the incidences for men
aged 65–74 and 75–84 were 17.6 and 42.7 per 1000 person years, and for women 10.1 and 21.6.
Framingham results were similar, but with smaller differences between men and women. In the
Framingham study, during 40 years of follow up, 621 people out of 5209 developed atrial fibrillation.
Atrial fibrillation in this cohort was associated with a 1.5- (men) to 1.9-fold (women) increased risk ofmortality after adjustment for pre-existing cardiovascular disease.74 The median survival of people aged
55–64 in atrial fibrillation was 12.6 years for men and 12.1 years for women, as compared with 18.1 years
and 21.3 years respectively for people not in atrial fibrillation. Similar excess in adjusted mortality for
people in atrial fibrillation has been reported from a smaller cohort (87 patients in AF) in Western
Australia.75
There is a strong independent association between atrial fibrillation and stroke. Two cohort studies have
reported relative risks of stroke in ‘lone’ atrial fibrillation (i.e. with no other evidence of cardiovascular
disease) of between 4 and 5.48,49 Furthermore, data from Framingham suggests that strokes occurring withatrial fibrillation are more severe and more likely to be fatal.76 The Oxford Community Stroke Project
reported a higher 30-day case fatality rate for cerebral infarction associated with atrial fibrillation (23%) as
compared to sinus rhythm (8%).77 The proportion of strokes in the population that are attributable to
atrial fibrillation rises with age. Arrhythmia is associated with 30.7% and accounts for 23.5% of strokes in
people aged 80–89, as compared to 8.5% and 2.8% respectively in 60–69 year olds.73 Analysis of the Stroke
Data Bank of the US National Institute of Neurological and Communicative Disorders and Stroke
suggested that 9% of all ischaemic stroke is due to atrial fibrillation.18
Risk of stroke in patients with atrial fibrillation has been consistently found in several studies to beindependently associated with increasing age, previous stroke or TIA, and hypertension.78–80 Recent heart
failure has been found to increase risk in some studies79 but not others.78,80 Being female78,80,81 or
diabetic78 have also been identified as independent risk factors in some studies. Echocardiographic features
such as global left ventricular dysfunction and left atrial size also predict stroke risk in atrial fibrillation,
after clinical factors have been taken into account.82
Other risk factors for stroke
In addition to the risk factors for stroke considered in Table 9, there are several other factors that have been
found to be associated with stroke risk, listed in Table 12 (see overleaf ).44,83
Two factors in this table that have received some attention in terms of stroke prevention strategies in
recent years, and are therefore worth considering in slightly more detail, are hypercholesterolaemia, and
asymptomatic carotid artery stenosis.
Cholesterol and risk of stroke
There is no strong evidence of any independent association between serum cholesterol and risk of stroke.84
Despite this, an overview of cholesterol lowering with statin drugs found that treatment with statins
reduces risk of stroke.85 There are possible explanations for this apparent contradiction. Firstly, there is
some evidence that low cholesterol is associated with increased risk of haemorrhagic stroke,86 so it may be
Stroke 159

d:/postscript/03-CHAP3_1.3D – 27/1/4 – 9:27
[This page: 160]
that this masks a positive association between serum cholesterol and risk of ischaemic stroke. Secondly, it
may be that statins lower stroke risk indirectly by lowering risk of myocardial infarction, which is an
established risk factor for stroke. Thirdly, it may be that statins do not reduce stroke risk by lowering
cholesterol, but by some other mechanism. As will be discussed in section 6, the evidence for cholesterol
lowering to prevent stroke is strongest for patients with existing coronary heart disease, so in the context of
the epidemiology of risk factors for stroke, serum cholesterol is of most relevance in this sub-group ofpatients.
Asymptomatic carotid artery stenosis
Atherosclerosis of the internal carotid artery is an important cause of stroke. Epidemiological data suggest
that it is responsible for 9% of all ischaemic stroke.18 When associated with symptoms of transient
ischaemic attack, severe carotid artery stenosis (i.e. 70–99% stenosis) is associated with a 20% risk of major
stroke in three years.87,88 However, asymptomatic stenosis carries a lower risk of stroke. The risk ofipsilateral stroke or death in the medical control group of the Asymptomatic Carotid Artery Stenosis trial
was 11% after 5 years.89 Patients with an asymptomatic stenosis of 60–99% are at twice the risk of a first
stroke as compared to patients with stenosis of less than 60%.90 However, approximately 45% of strokes in
this population are attributable to other pathology, such as small vessel occlusion and emboli from a
cardiac source.90,91 Furthermore, this population is at high risk of ischaemic heart disease. Indeed, Ogren
et al. found no association between asymptomatic carotid stenosis and risk of stroke in a cohort of men
born in 1914, which was perhaps due to the high mortality from ischaemic heart disease in those men with
severe carotid stenosis.92 Therefore, the relevance of the prevalence of asymptomatic carotid artery stenosisis perhaps more in relation to cardiovascular disease prevention strategies in general than it is to stroke
prevention. The evidence for carotid endarterectomy to prevent stroke in asymptomatic carotid artery
stenosis will be considered in section 6.
Transient ischaemic attack
While there have been a number of studies worldwide of the epidemiology of transient ischaemic attack,the most robust study in the UK is the Oxfordshire Community Stroke Project, carried out between 1981
and 1986. The age-specific annual incidence rates derived from this study are shown in Table 13.93 The
overall incidence is similar in males and females, though the incidence in 55–84 year olds is higher in men
than in women. Oxfordshire has one of the lowest death rates from stroke in the UK, and so it is likely that
160 Stroke
Table 12: Other risk factors for stroke.
Other specific cardiac factors Infective endocarditis; mitral stenosis; recent large myocardial infarction; left
ventricular hypertrophy; cardiomyopathy
Haematological factors Sickle cell disease; raised packed cell volume; hypercoagulability, including raised
fibrinogen
Biochemical factors Hyperhomocysteinaemia; hypercholesterolaemia
Clinical factors Migraine; snoring
Dietary factors Low potassium; low fruit and vegetable intake
Other factors Asymptomatic carotid artery stenosis; major life events

d:/postscript/03-CHAP3_1.3D – 27/1/4 – 9:27
[This page: 161]
TIA incidence is higher elsewhere in the country. Approximately 80% of the TIAs were in the carotiddistribution, and 20% in the vertebro-basilar distribution, which is similar to findings elsewhere.94,95
A much higher incidence of transient ischaemic attack (1.9 per 1000 per year) was recently reported
from the General Practice Research Database (GPRD).96 This probably reflects considerable misclassifica-
tion error. For example, the prevalence of stroke recorded in this data set is only a sixth of what has been
recorded in population surveys (see ‘Prevalence of stroke’ below), and many people with a label of transient
ischaemic attack turn out to have other diagnoses.97
As shown in Table 9, a transient ischaemic attack is associated with a very high risk of stroke (relative
risk of 80, 95% confidence interval: 34–158) in the first month following the event.58 This falls to a relativerisk of 13 in the first year, and to 7 in the first seven years. In absolute terms, this equates to a 4.4%
(95% CI: 1.5–7.3%) risk of stroke in the first month, an 11.6% (95% CI: 6.9–16.3%) risk in the first
year, and a 29.3% (95% CI: 21.3–37.3%) risk in the first five years, with an average annual risk of
6%.58 People with TIA are also at significant risk of myocardial infarction, with an approximate
annual risk of 2.4%.58
For a health care needs assessment, it is the incidence of transient ischaemic attacks rather than
prevalence that is of most interest, because this will dictate the need for carotid endarterectomy (see
sections 6 and 7). The prevalence (i.e. the number of people who have had a history of a TIA) is relevant inthat it highlights a group of people who are at high risk of future stroke, and therefore targets for secondary
prevention. Unfortunately, there are no good UK-based estimates of the prevalence of transient ischaemic
attack. In a Dutch study carried out between 1990 and 1993, the prevalence of a history of symptoms
suggestive of a transient ischaemic attack within the last three years (assessed by a trained study physician)
was 3.7% of men and 2.9% of women aged 55 or over. However, the prevalence was 50% lower if only
people with classical features of a transient ischaemic attack were included.59 In the Atherosclerosis Risk
In Communities (ARIC) Study set in the United States between 1987 and 1989, 3% of people aged
45–64 reported the occurrence of symptoms during their life which were classified by diagnosticalgorithm as being due to a transient ischaemic attack.98 Both these prevalence estimates are higher than
would be anticipated from the Oxford Community Stroke Project, or from other incidence studies,94,95
which suggests some over-ascertainment, possibly due to difficulty of accurate assessment of past
symptoms.
Stroke 161
Table 13: Age/sex-specific annual incidence rates with 95% confidence
intervals (per 1000 population) for transient ischaemic attack in the
Oxfordshire Community Stroke Project, 1981–86.
Age band Males Females Persons
< 15 0.00 0.00 0.00
15–44 0.02 (0.00–0.04) 0.02 (0.00–0.04) 0.02 (0.01–0.03)
45–54 0.25 (0.06–0.44) 0.26 (0.07–0.45) 0.25 (0.12–0.39)
55–64 1.22 (0.77–1.66) 0.63 (0.31–0.94) 0.92 (0.65–1.19)
65–74 2.43 (1.68–3.17) 0.90 (0.47–1.33) 1.61 (1.20–2.03)
75–84 3.01 (1.79–4.23) 2.29 (1.45–3.13) 2.57 (1.87–3.27)
85þ 0.70 (0.00–2.07) 2.87 (1.26–4.49) 2.32 (1.09–3.67)
All ages 0.39 (0.31–0.46) 0.31 (0.24–0.38) 0.35 (0.30–0.40)

d:/postscript/03-CHAP3_1.3D – 27/1/4 – 9:27
[This page: 162]
Stroke
Incidence of first stroke
There have been several studies worldwide of stroke incidence.7 This report will focus on three incidencestudies of first ever stroke in England: the Oxford Community Stroke Project (OCSP),99 the South London
Stroke Register (SLSR)100 and the East Lancashire Study (ELS).101 The methodology of these studies is
summarised in Table 14 and the resulting age-specific incidence rates are shown in Table 15. In these
studies, cases of sub-arachnoid haemorrhage were included under the broad umbrella of ‘stroke’.
The all age (standardised) rates at the bottom of Table 15 reflect the overall incidence rate that would have
occurred if the age-specific incidence rates are experienced in England and Wales as a whole. Thus,
162 Stroke
Table 14: English studies of first stroke incidence.
Numberof strokes
Period ofstudy
Population Method of case ascertainment
OCSP 675 1981–86 All patients registered
with 50 GPs (10
practices) in
Oxfordshire (total
population: 105,476)
1 GPs notified all possible strokes.
2 Admission and casualty registers of Oxford
hospitals reviewed.
3 Oxford Record Linkage study enabled
identification of those who died or were
discharged from Oxford hospitals with stroke.
4 Death certificates and post-mortem reports
reviewed. Possibles reviewed by a study
neurologist as soon as possible either at home,
in hospital, or in a special outpatient clinic.
CT scan or post-mortem was sought in every
case.
ELS 642 1994–95 All patients registered
with 93 practices in East
Lancashire (total
population: 405,272)
1 GPs notified all possible strokes.
2 Ward log books of local hospitals checked
monthly.
3 Discharge diagnoses from routine hospital
coding.
4 Death certificates reviewed.
5 Rehabilitation and support service staff were
asked to report possible strokes. GP case notes
or FHSA records reviewed of possibles.
SLSR103 1,254 1995–98 Residents of 22 wards of
Lambeth, Southwark
and Lewisham Health
Commission (total
population: 234,533)
12 notification sources: A&E records; hospital
wards; brain imaging requests; death certificates;
coroner’s records; GPs; hospital medical staff;
community therapists; bereavement officers;
hospital-based stroke registers; GP computer
records; others: notification by patients or
relatives.
Possibles reviewed by a study physician within
48 hours where possible. Outpatient and
domiciliary visits offered.

d:/postscript/03-CHAP3_1.3D – 27/1/4 – 9:27
[This page: 163]
depending upon which incidence study is used, the incidence of first stroke in England seems to lie between
1.65 and 2.17 per 1000 population. The standardised rates are all higher than the crude rates because these
three studies were carried out in populations that overall are younger than England and Wales as a whole.
They differ from the previously published standardised rates because a different standard population was
used. For example, the OCSP standardised its rates using the 1981 England and Wales population, and
quoted an all age (standardised) rate of 2.0.99 The higher rate shown in Table 15 reflects changes to the age
structure of England and Wales that have occurred between 1981 and 1998. In other words, assumingstable age-specific incidence, there would have been an 8.05% rise in the overall incidence of stroke
between 1981 and 1998 due to ageing of the population. It is notable that the Oxfordshire rates are higher
than those observed in East Lancashire and South London. Oxfordshire has a lower standardised mortality
ratio (SMR) for stroke than the other districts: the SMR for Oxfordshire over the period 1993–95 was 90, as
compared to 98 in Lambeth, Southwark and Lewisham and 104 in East Lancashire.102 Therefore, unless
case fatality is significantly lower in Oxfordshire than in the other districts, Oxfordshire is unlikely to have
a higher incidence than the other areas. Two possible explanations for the observed rates are differences in
case ascertainment, and secular changes in stroke incidence.The methods of case ascertainment in the three studies are summarised in Table 14. It is conceivable that
case ascertainment was more complete in Oxfordshire than in the other areas, given that the Oxfordshire
study population was smaller, and the GPs involved all had to be ‘enthusiastic’ to collaborate.99 There was
also a significant ‘carrot’ for GPs to notify patients, namely rapid review by a study neurologist and access
to CT scanning. Research nurses visited practices at least once a week. The South London and East
Lancashire studies both aimed to recruit from defined geographical areas, and therefore will have included
GPs of varying degrees of enthusiasm. South London compensated for this by having many different
methods of identifying possible cases, and also offered early assessment by a specialist. Minor strokes aremost likely to be missed by community registers, since such cases may not be admitted to hospital,104 and
the duration of symptoms/residual disability will be shorter. Some evidence that the Oxford Community
Stroke Project did indeed detect a higher proportion of minor strokes is provided by the case fatality in the
Stroke 163
Table 15: Age-specific annual incidence of first stroke (per 1000 population) in three English populations,
with 95% confidence intervals.
Age group Oxfordshire East Lancashire South London
< 15 0.03 0.01 (0.00–0.04)
15–24 0.06 0.03 (0.00–0.07)
25–34 0.08 0.12 (0.08–0.18)
35–44 0.23 0.30 (0.21–0.42)
< 45 0.09 (0.06–0.13)
< 50 0.09 (0.06–0.13)
50–54 0.88 (0.49–1.26)
45–54 0.57 (0.35–0.79) 0.87 (0.68–1.10)
55–64 2.91 (2.37–2.45) 1.69 2.19 (1.88–2.53)
65–74 6.90 (5.93–7.87) 4.67 4.96 (4.44–5.51)
75–84 14.34 (12.49–16.19) 10.64 9.34 (8.41–10.34)
85þ 19.87 (15.78–23.95) 20.86 19.72 (17.08–22.65)
All age (crude) 1.60 (1.48–1.72) 1.58 (1.46–1.71) 1.33 (1.26–1.41)
All age (standardised) 2.17* 1.65* 1.74**
Notes: *Age- and sex-standardised to England and Wales, 199814 ; **age-standardised to England and Wales, 1998.

d:/postscript/03-CHAP3_1.3D – 27/1/4 – 9:27
[This page: 164]
three studies. 30-day case fatality in the OCSP was 19%,13 as compared to 26% in South London103 and
34% in East Lancashire (see ‘Survival following stroke’ below).101
The Oxfordshire study was performed a decade before the other studies, so the observed difference may
reflect a decline in age-specific incidence of stroke in the intervening decade. There have been significantreductions in age-specific stroke mortality over this period,1 and it is likely that this in part reflects decline
in incidence (see ‘Trends in stroke incidence and mortality’, below).
While the overall rate of stroke was different in the three studies, the general pattern of an increasing
incidence with age is similar. The expected number of new first strokes in a population of 100 000 with the
age- and sex-specific structure of England and Wales is shown in Table 16, based on the age- and sex-
specific incidence rates of the OCSP. Two estimates are made. In the first, (A), it is assumed that there has
been no reduction in age-specific incidence between 1981–86 and the present day and in the second, (B), it
is assumed that there has been a 20% reduction in age-specific incidence. These show that although theage-specific rates are generally higher in men than women, more women than men would be expected to
have a stroke, owing to the longer life expectancy of women. 81% of strokes (175/216) would be
anticipated to occur in people aged 65 or over. The anticipated stroke rate is between 174 and 216 per
100 000 population, depending upon what assumption is made about change in age-specific incidence
rates. If a 20% reduction in incidence is assumed since the time that the OCSP was carried out and the
present day, then the overall incidence rate matches the rate for the South London Stroke Register (1.74 per
1000 – see Table 15). Capture–recapture analysis of the South London register results suggests that it is
extremely unlikely that it could be under-counting by as much as 20% (which would be the implication ifassumption (A) was adopted).105 Therefore, the range 1.74–2.16 per 100 000 seems a plausible range of
likely stroke incidence, taking all the UK-specific epidemiological data that are available into account. In
estimating stroke incidence in a local population, once age structure has been taken into account, it is also
important to take into account factors such as ethnic mix (see ‘Ethnicity and stroke’ below) and other
socio-demographic factors (see ‘Other factors affecting stroke incidence’ below).
Incidence of recurrent stroke
While the key incidence studies of stroke have focused on incidence of first stroke, in terms of a health care
needs assessment recurrent stroke is of equal importance. The OCSP showed that the risk of suffering a
164 Stroke
Table 16: Estimated numbers of new first strokes in a typical population of 100,000 in England and Wales.
Age Males FemalesTotalnumber ofOCSP Popn Number of
strokesOCSP Popn Number of
strokes strokesrate rate(/1000)
A B(/1000)
A B A B
< 45 0.08 31,235 2 2 0.11 29,872 3 3 5 5
45–54 0.67 6,579 4 4 0.46 6,589 3 2 7 6
55–64 3.47 4,900 17 14 2.35 5,017 12 9 29 23
65–74 8.11 3,890 32 25 5.84 4,503 26 21 58 46
75–84 15.87 2,123 34 27 13.39 3,352 45 36 79 63
85þ 18.42 514 9 8 20.36 1,425 29 23 38 31
Total 49,241 98 80 50,758 118 94 216 174
Note: Number of strokes in A assumes stable incidence between 1981–86 (i.e. when OCSP was performed) and
present day; B assumes 20% decline in age-specific incidence over this time period.

d:/postscript/03-CHAP3_1.3D – 27/1/4 – 9:27
[This page: 165]
recurrence within five years of a first stroke was 30% (95% CI: 20–39%).55 The East Lancashire Study
identified 642 first strokes and 290 recurrent strokes.101 In other words, using the East Lancashire data, it
would be necessary to inflate the estimated numbers of stroke in a population by as much as 45%. Recent
estimates in the US of the ‘inflation factor’ for recurrent strokes vary from 30%106 to 43%.107 In the WHOMONICA project, the ‘inflation factor’ was 20%.108 This is lower than the other studies, probably because
it was set in younger populations – the study population was aged 35–64 years. The proportion of recurrent
strokes that might be anticipated depends upon factors such as the age of the population (older age means
more recurrent stroke), and ethnic mix.107
Prevalence of stroke
Surveys carried out in Newcastle and North Yorkshire found the prevalence of stroke to be between 1.5 and
1.75%.56,57 Prevalence of stroke in adults (aged 16 or over) in the Health Survey from England in 1998 was
found to be 2.1 per 1000 in women and 2.3 per 1000 in men.47 Prevalence rises with age: 9–10% of peopleaged 75 or over have had a stroke. The prevalence of stroke recorded in general practice is much lower than
this. Data from the General Practice Research Database (GPRD) suggests that the prevalence is only 2.3 per
1000.109 The discrepancy probably reflects both under-recording in GP records and that the stroke had to
be recorded between 1994 and 1998 to be included. Interestingly, the recording of TIA in this database is
much higher than one would anticipate from epidemiological studies (see ‘Transient ischaemic attack’
above).
Survival following stroke
Survival following first stroke in the three British-based epidemiological studies is shown in Table 17. The
almost two-fold variation between Oxfordshire and East Lancashire either reflects differences in case
ascertainment, or differences in survival. The likeliest explanation is that the OCSP had better
ascertainment of minor stroke due to differences in study design (see ‘Incidence of first stroke’ above).After the first year, non-stroke cardiovascular disease is the commonest cause of death in stroke
survivors.110
Prognosis is worse for recurrent stroke – in the US, two-year case fatality of first stroke is 43%, as comparedto 52% for recurrent stroke.111
Ethnicity and stroke
Risk of death from stroke in Britain is higher in minority ethnic groups. An analysis of death by country of
birth for the period 1989–92 found that mortality was highest among those born in West Africa and
Stroke 165
Table 17: Case fatality following first stroke.
Time after stroke OCSP ELS SLSR
28 days 19% 34% 26%
90 days 40% 33%
180 days 37%
1 year 31%
Notes: OCSP: Oxfordshire Community Stroke Project; ELS: East
Lancashire Study; SLSR: South London Stroke Register.

d:/postscript/03-CHAP3_1.3D – 27/1/4 – 9:27
[This page: 166]
the Caribbean, but was also significantly raised in those from South Asia, Ireland and Scotland (seeTable 18).112
In the South London Stroke Register, the age- and sex-adjusted incidence of stroke was 2.2 times higher
in people of African or Caribbean origin as compared to the white population, but case fatality was similar
in the different populations.103 Similar differences in stroke incidence by ethnicity have been observed in
the United States.107
Other factors affecting stroke incidence
There are wide variations in stroke mortality throughout England and Wales. Standardised mortality
ratios (SMRs) for stroke in Health Authorities in England and Wales in 1993–95 varied from 74 (95% CI:
67–81) in Redbridge and Waltham Forest to 130 (95% CI: 121–139) in Wigan and Bolton.102 Socio-economic deprivation appears to be an important factor underlying this variation.113,114 Regional
differences in lifestyle (see Table 9 for other factors associated with risk of stroke) may also account for
some of the observed variation. There is also some evidence that adverse socio-economic circumstances in
childhood may influence subsequent risk of mortality from stroke.115
Trends in stroke incidence and mortality
Age-specific mortality from stroke in England and Wales has been declining throughout the twentieth
century.116 For example, in 65–74 year old men, there was an average annual reduction in stroke mortality
of 1.5% per year from 1901 to 1939, 0.1% per year from 1940 to 1967, and 2.2% per year from 1968 to 1991.Between 1986 (the last year of the OCSP) and 1999, age-adjusted mortality from stroke fell by 42% in men
and by 32% in women.1 The changes in age-specific mortality rates over this period are shown in Figures 2
and 3 (see overleaf ).
Between 1986 and 1999, there have continued to be falls in mortality in all ages, but these have been
more pronounced in the older age groups, and there is a hint that the decline in mortality has slowed in the
younger age groups since 1993 (Figure 2). There are three major categories of explanation for this observed
fall in mortality: artefact; decline in incidence; or decline in case fatality. While there are important errors
in the death certification of stroke,118 artefactual changes in how doctors have been recording death isunlikely to explain the fall, since there have been similar declines in mortality from coronary heart disease,
which is the likeliest alternative cause to appear on the death certificate.1 Data on trends in incidence are
not available for England and Wales, so empirical evidence for a fall in incidence needs to be sought from
other countries. The evidence is mixed. For example, in Denmark there has been a 3% per annum decline
166 Stroke
Table 18: Standardised mortality ratios (and 95%
Confidence Intervals) for stroke in England and Wales
by country of birth, 1989–92.112
Country of birth Men Women
Total population 100 100
Scotland 125 (115–136) 125 (113–137)
Ireland 138 (128–148) 123 (113–133)
East Africa 114 (86–147) 122 (88–164)
West Africa 271 (210–344) 181 (118–265)
Caribbean 168 (151–186) 157 (136–179)
South Asia 155 (143–168) 141 (127–157)

d:/postscript/03-CHAP3_1.3D – 27/1/4 – 9:27
[This page: 167]
Stroke 167
100,000
10,000
1000
85+ (M)85+ (F)75–84 (M)75–84 (F)65–74 (M)65–74 (F)
Dea
th r
ate
per
mill
ion
1986 1993 1999
Year
Figure 3: Trends in age-specific stroke mortality in England and Wales, ages 65 and over, 1986–99.1,14,117
1000
100
10
55–64 (M)55–64 (F)45–54 (M)45–54 (F)35–44 (M)35–44 (F)25–34 (M)25–34 (F)D
eath
rat
e pe
r m
illio
n
1986 1993 1999
Year
Figure 2: Trends in age-specific stroke mortality in England and Wales, ages 25–64, 1986–99.1,14,117

d:/postscript/03-CHAP3_1.3D – 27/1/4 – 9:27
[This page: 168]
in age-adjusted incidence between 1982 and 1991, but no overall decline in incidence due to demographic
change.119 In the WHO MONICA project (which covered stroke in people under the age of 65), incidence
declined in the majority of the populations studied (13/17 for men; 15/17 for women) between 1985 and
1990.120 In the Swedish MONICA site, while incidence fell in under 65s, it rose in 65–74 year olds.121 InNew Zealand, there was no consistent pattern of decline in age-specific incidence between 1981 and
1991,122 and in the US rates appear to have fallen between 1985 and 1989 in people aged over 70, and then
started to rise again.123 Data from Rochester, Minnesota, suggested that stroke rates rose between the 1970s
and 1980s, but were stable during the 1980s.124 There are more consistent international data to suggest that
there has been a decline in case fatality from stroke (i.e. improved survival after stroke), but not of
sufficient magnitude to explain the fall in stroke mortality in England and Wales.121,125–127 Therefore, the
most plausible explanation for the decline in stroke mortality is that there has been a decline in both
incidence and case fatality. To reflect this, the estimated numbers of new strokes in Table 16 includes anassumption (B) of a 20% decline in incidence between 1986 and 1989, as a partial explanation of the 42%
decline in mortality over the same time period.
People with sequelae of stroke
There are two ways of quantifying the sequelae of stroke. Either one can look at the proportion of people
who might be expected to have a specific problem after a given time following their stroke (the equivalentof incidence) or one can look at the frequency of stroke-related problems in a community at a given point
in time (a prevalence survey). Both have their uses in needs assessment, since the former will predict the
need for acute rehabilitation services, and the latter the need for long-term support.
Incidence of disability following stroke
There has been a lack of data on the incidence of disability following stroke. A summary of some UK-based
studies carried out in the 1980s is shown in Table 19.128 Recent data on the prevalence of acuteimpairments following first stroke from the South London Stroke Register showed that 21% of patients
had a normal Barthel score (see Table 5 for explanation), and 51% had severe disability (Barthel score
< 10).129 These results are similar to the acute prevalence data shown in Table 19. In the OCSP, 65% of
stroke survivors were functionally independent one year after their stroke.13
Prevalence of disability following stroke
A prevalence survey in North Yorkshire found that 33% of stroke survivors had some cognitiveimpairment, 27% a problem with their speech, and 12.5% difficulty swallowing.56 55% required help in
one or more activity of daily living. A prevalence survey in Newcastle reported 70% were dependent on
others (Modified Rankin score 3–5).57 Extrapolating these results to a population with a prevalence of
stroke of 1.5–1.75%, one would anticipate the prevalence of stroke with moderate residual disability to be
between 0.8% and 1.2%.
Time course of recovery following stroke
It is also useful to know the recovery pattern following stroke, since this will influence need for (and
appropriate timing of decisions about) institutional care. In the Copenhagen stroke study, it was found
that functional recovery (as measured by the Barthel Index, see Table 5) was completed within 13 weeks of
the stroke in 95% of patients. However, the more severe the stroke, the longer it took for recovery to take
168 Stroke

d:/postscript/03-CHAP3_1.3D – 27/1/4 – 9:27
[This page: 169]
place. Thus, it took up to 20 weeks before maximal recovery was achieved in patients with very severe
strokes.130
Mood disorders following stroke
Depression and anxiety are important sequelae of stroke.135 For example, in a follow up at six months of
patients admitted to hospital in Edinburgh who were entered into a trial to assess the effect of a stroke
family care worker, 22% were anxious (i.e. scored more than 8 on the HAD anxiety scale) and 20%
depressed (more than 8 on the HAD depression scale).136 Estimates of incidence differ between studies due
to variations in design, including in particular how depression is defined.135 For example, 60% of patients
in the Edinburgh study scored over 4 on the GHQ-30,136 and 54% of patients in the control group of astudy in Finland were classed as depressed (10 or more on the Beck Depression Inventory).137
Effect of stroke on informal carers
Stroke has important effects on the well-being of carers as well as patients. Care giving is associated with
significant strain, anxiety, and stress.138–141 A literature review reported the prevalence of depression in
carers of stroke patients to vary from 34% to 52%.142 A more recent study found a 17% prevalence ofdepression, a 37% prevalence of anxiety, and a 55% prevalence of an abnormal score (> 4) on the General
Health Questionnaire (GHQ–30) six months after stroke.143 These problems persist. In the Perth
Community Stroke Study, over half of carers of stroke survivors with residual moderate or severe
disability at one year had evidence of emotional distress, and the majority reported disruption of social
Stroke 169
Table 19: Acute (0–7 days), three-week and six-month impairment/disability rates.131–134
Phenomenon Acute 3 week 6 month
Impairments Initial loss/depression of consciousness 5% – –
Not oriented (or unable to talk) 55% 36% 27%
Marked communication problems (aphasia) 52% 29% 15%
Motor loss (partial or complete) 80% 70% 53%
Disabilities Incontinent of faeces 31% 13% 7%
Incontinent of urine 44% 24% 11%
Needs help grooming (teeth, hair, face) 56% 27% 13%
Needs help with toilet/commode 68% 39% 20%
Needs help with feeding 68% 38% 33%
Needs help moving from bed to chair 70% 42% 19%
Unable to walk independently indoors 73% 40% 15%
Needs help dressing 79% 51% 31%
Needs help bathing 86% 65% 49%
Very severely dependent 38% 13% 4%
Severely dependent 20% 13% 5%
Moderately dependent 15% 15% 12%
Mildly dependent 12% 28% 32%
Physically independent 12% 31% 47%
Note: The acute figures are of limited accuracy as many patients were not assessed within the first week. Many of these
were very ill and probably very dependent. Consequently the figures relating to acute disability are minimum
estimates.

d:/postscript/03-CHAP3_1.3D – 27/1/4 – 9:27
[This page: 170]
activities (79%) and leisure time (55%).144 In a matched case-control study, spouses of patients with stroke
were significantly more likely to be depressed than controls 1–3 years after stroke.145
Sub-arachnoid haemorrhage
The overall incidence of sub-arachnoid haemorrhage in the Oxford Community Stroke Project was 10 per
100 000 per year.13 This is consistent with international studies, though these show a wide variation in
incidence from 2 to 22 per 100 000.146 In a study in New Zealand, at least 68% of cases were associated with
an underlying intracranial aneurysm or arterio-venous malformation.20 Mortality from sub-arachnoid
haemorrhage is high. In the New Zealand study, 36% had died within 48 hours of presentation, and 57%
within one year. In the OCSP, 46% were dead within one month, and 48% within one year.
Summary of epidemiology of stroke at level of Primary Care Group
Table 20 shows that from a primary care perspective, the vast bulk of the workload is concerned withprevention and long-term care. A GP with a list size of 2000 would only expect to see one case of sub-
arachnoid haemorrhage every five years, fewer than one transient ischaemic attack per year, and three
patients with a first stroke and one patient with a recurrent stroke per year. On the other hand, each GP
would expect to have 22 patients with atrial fibrillation under their care, and 20 patients who have
moderate disability from a stroke.
170 Stroke
Table 20: Summary of epidemiology of stroke and risk factors for stroke in a population of 100,000and for a GP with a list size of 2,000.
Sub-category Expected number of newcases per year (incidence)
Expected number ofexisting cases (prevalence)
For a GP For a PCG For a GP For a PCG
Risk factors for stroke
Atrial fibrillation
Hypertension (BP > 140/90)
Current smokers
Diabetes mellitus
Ischaemic heart disease
7 330 22
680
560
40
110
1,100
34,000
28,000
2,000
5,500
Transient ischaemic attack 0.7 35
Stroke 30 1,500
First stroke (excluding sub-arachnoid
haemorrhage)
Recurrent stroke
3
1
164
57
People with moderate disability from stroke 20 1,000
Sub-arachnoid haemorrhage 0.2 10
Notes: PCG¼Primary Care Group, with a population of 100,000; numbers of first strokes derived from
assumption B in Table 16.

d:/postscript/03-CHAP3_1.3D – 27/1/4 – 9:27
[This page: 171]
5 Services available and their costs
This section describes the types of service and intervention that are available for stroke care and gives
data as to how widely they are used. It does not comment on whether they are effective (this is covered in
section 6), whether they should or should not be available (covered in section 7), or whether the utilisation
rate is appropriate. To interpret whether or not the utilisation rate is appropriate, it is important to
consider both the effectiveness and cost-effectiveness of the intervention.
Prevention of stroke
Rose identified two complementary strategies for disease prevention: the population approach, whereby
the aim is to reduce the level of risk in the whole population, and the ‘high risk’ approach, which aims to
focus attention on reducing risk in individuals known to be at higher risk of the disease.147 ‘High risk’
individuals in this context include: people at high risk of stroke; people with transient ischaemic attack;
and people with previous stroke.
Population strategies
These include both strategies to make environmental and socio-economic conditions more favourable to
health, and strategies to influence behaviour in such a way that ‘healthy’ choices are more likely to be made.
Such approaches overlap. For example, provision of no-smoking areas both makes the environment
healthier and may discourage people from smoking. The population strategies relevant to strokehighlighted in the white paper Saving Lives: Our Healthier Nation are summarised in Table 21.8
Stroke 171
Table 21: Population strategies highlighted in Saving Lives: Our Healthier Nation.
Local players and communities Government and national players
Social and economic Tackle social exclusion
Provide incentives to employees to
cycle or walk to work
Raise cost of smoking through taxation
Tackle joblessness, social exclusion and poor
education
Environmental Provide smoke-free environments
Reduce stress at work
Provide safe cycling and walking routes
Personal behaviour Enforce ban on illegal sale of cigarettes
to children
Improve access to affordable food in
deprived areas
Provide facilities for physical activity
Encourage development of healthy schools and
workplaces
Control advertising and promotion of cigarettes
Develop healthy living centres
Ensure access to and availability of foods for a
healthy diet
Provide information about health risks of
smoking, poor diet and lack of exercise
Health services Encourage health care professionals to give
advice on healthier living
d:/postscript/03-CHAP3_1.3D – 27/1/4 – 9:27
[This page: 172]
Prevention in people at high risk of stroke
Hypertension, diabetes, and ischaemic heart disease are dealt with in other chapters in this series of health
care needs assessments. Workers in primary care are well placed to offer appropriate lifestyle advice (diet;
smoking; alcohol; weight; exercise).
For people in atrial fibrillation, the principal treatments to reduce stroke risk are anticoagulation with
warfarin, usually with a target INR (International Normalised Ratio) of 2.5, or use of an antiplatelet agent,
commonly aspirin, with newer alternatives available such as clopidogrel. Treatment with warfarin requires
regular blood tests in order to ensure that the INR is near the target. Traditionally, INR has been monitoredin hospital-based anticoagulation clinics, but newer models are emerging, including monitoring in
primary care,148 use of computerised decision support software to regulate dosing,149 and patient self-
management of INR.150
UK-based audits have shown that the majority of patients in atrial fibrillation are treated with aspirin
rather than warfarin. Estimates of the proportion of people in atrial fibrillation on warfarin vary between
21% and 36%.50,51,64,65 Warfarin is used less often in elderly people. For example, Sudlow et al. found that
only 17% of patients in atrial fibrillation over the age of 74 were on warfarin.50 This reluctance by clinicians
to use warfarin in elderly patients is also reflected in US data.151–153 Analysis of the National AmbulatoryCare Surveys suggests that while warfarin use increased in the USA between 1989 and 1993 (from 13% to
40% of patients in atrial fibrillation), there has been no further rise in warfarin use between 1993 and 1996
(33% of patients in 1996 were on warfarin).154 As in the other studies, the National Ambulatory Care
Surveys showed that warfarin was less likely to be used in the very elderly.
Echocardiography is sometimes used to increase the precision of estimating risk of stroke in atrial
fibrillation. In a study in West Birmingham, Lip et al. found that about a fifth of patients in atrial
fibrillation had had an echocardiograph performed.65
Prevention in people who have had a transient ischaemic attack or stroke
Interventions commonly used are summarised in Table 22.
A survey conducted by the Stroke Association (1378 respondents) found that after a stroke 63% were
taking aspirin, 23% were not taking aspirin because of a contraindication, and 14% were not taking aspirin
but had no contraindication.155 While this survey is difficult to interpret owing to a low response rate (less
than 34%), it does echo other audits of aspirin use. For example, out of 198 men in the British Regional
Heart Study with a history of stroke or transient ischaemic attack, only 80 (40%) were taking aspirin whensurveyed in 1992.156 Analysis of the General Practice Research Database (GPRD) found that between 1992
172 Stroke
Table 22: Secondary prevention in people who have had a transient ischaemic attack or stroke.
Lifestyle advice Diet; smoking; alcohol; weight; exercise, where appropriate
Blood pressure reduction
Antiplatelet agents Most commonly aspirin; other agents such as dipyridamole and clopidogrel are also
used
Anticoagulation For patients in atrial fibrillation and those with certain types of valvular heart disease,
and for those where the stroke was considered cardio-embolic in origin
Statins For patients with known coronary heart disease
Carotid endarterectomy For patients with significant (> 70%) carotid artery stenosis on the same side
Note: Effectiveness of these interventions is discussed in section 6.

d:/postscript/03-CHAP3_1.3D – 27/1/4 – 9:27
[This page: 173]
and 1996 around 37% of patients with a diagnosis of TIA were on aspirin, and 17% of patients with a
diagnosis of stroke.96 A survey of aspirin use in patients identified from GP registers as having coronary
heart disease found that 63% were taking aspirin.157
Given the high relative risk of stroke early after a transient ischaemic attack (see Table 9), systems havebeen developed for ‘fast track assessment’ of patients with a transient ischaemic attack. These include
urgent neurology outpatient assessment, and express carotid duplex services.158 A substantial proportion
of people referred with a transient ischaemic attack either do not have this diagnosis confirmed, or do not
proceed to surgery. In a review of 332 patients referred to a regional neurovascular clinic, in only 60% of
cases did the neurologist agree with the diagnosis.97 In the first year of an express carotid duplex
service in Gloucester, 90 scans were performed, and 14% of these patients went on to have a carotid
endarterectomy.158 The median gap between onset of symptoms and surgery for these patients was 51 days.
An audit of 709 carotid endarterectomies performed in 1994 by 59 participating surgeons in the UK andIreland found that the mean ipsilateral stenosis was 82% (range: 30%–99%).159 A study in Wessex reported
that in 1995–96, the crude rate of carotid endarterectomy was 8.9 per 100 000 population, but estimated
that need for the operation was at a level of 15.3 per 100 000.160 A study of national carotid endarterectomy
rates based on Hospital Episode Statistics (HES) found that, between 1990 and 1995, rates increased from
1.2 per 100 000 to 4.8 per 100 000.161
Acute management and rehabilitation of stroke
Patients with acute stroke are treated and rehabilitated in a variety of different settings, as illustrated inFigure 4.
Stroke 173
Patient has acute stroke
Admission to hospital Stays at home
Stroke unit
Geriatric/neurorehabilitation ward
General medicalward
Long-term care:Nursing homeResidential home
Intermediate care facility:Community hospitalNursing home (short stay)Social rehabilitation unit
Return home
+/– Supporteddischarge schemes
Supported bystroke team
Community services:Rapid response teamHospital at homeDay hospitalOutpatientsDomiciliary care
+/–
+/–
+/–
Figure 4: Patient pathways for stroke.

d:/postscript/03-CHAP3_1.3D – 27/1/4 – 9:27
[This page: 174]
There is wide variation between localities in the proportion of patients with acute stroke who are admitted
to hospital. 55% of people with first stroke were admitted to hospital in the OCSP,162 70% in the East
Lancashire Study,101 71–78% of patients under the age of 75 across three districts in Southern
England,163,164 and 84% of patients on the South London Stroke Register.100 The proportion in theOCSP admitted to hospital is lower than the others probably both because in this study there was more
complete ascertainment of minor strokes and because neurologists would visit patients at home or see
them in an outpatient clinic. Also, it was carried out earlier than the other studies, and there may have been
changes in admission patterns over time. Schemes such as ‘rapid response teams’, ‘hospital at home’165 and
day hospital services have been developed to facilitate keeping people at home. In Oxfordshire, whether or
not someone was admitted depended both upon the severity of stroke, and whether or not the patient lived
alone.162 The principal reason given by GPs for requesting admission to hospital was for nursing or social
care (a factor in 87% of admissions).
Diagnosis of stroke
The diagnosis of stroke can be made on clinical grounds based on history and bedside signs, and this
clinical diagnosis is reasonably accurate in that investigations such as cranial imaging seldom showunexpected alternative pathological diagnoses (see discussion in ‘Diagnosis’ in section 6).166 The majority
of patients admitted to hospital with stroke will have a CT scan or other type of brain imaging primarily to
exclude or demonstrate cerebral haemorrhage.167,168
Acute treatments
Treatments available for acute stroke are reviewed in section 6. With the exception of aspirin, acute drug
treatments such as heparin and thrombolytic therapies (not licensed in Europe for acute stroke) are used
only rarely. A Stroke Association survey of consultants caring for stroke patients carried out during 1998
found that 94.1% ‘rarely or never used thrombolysis’.167 In patients who cannot swallow, 60% of
consultants start feeding within the first week, usually (90%) with a naso-gastric tube. If unsafe swallowing
persists, 75% of consultants favour use of percutaneous endoscopic gastrotomy (PEG).
Stroke unit care
Among patients admitted to hospital, a major distinction is whether patients are treated on a stroke unit,
or in a general medical ward. The term ‘stroke unit’ care has come to be synonymous with ‘organisedin-patient’ care.169 This implies care by a co-ordinated, multidisciplinary team including nurses and
doctors. Under this broad umbrella, several types of ‘stroke unit’ have been defined:170
� stroke ward: geographically defined area where stroke patients receive stroke unit care� stroke team: a mobile team delivering stroke unit care to patients in a variety of wards; this does not
always include a specialist nurse
� dedicated stroke unit: a disease-specific stroke unit managing only stroke patients
� mixed assessment/rehabilitation unit: a generic disability unit (which fulfils the definition of a stroke
unit) specialising in the management of disabling illnesses including stroke; for example, this would
include geriatric and neurological rehabilitation wards
� acute stroke unit: a stroke unit accepting patients acutely and continuing for several days (usually < 1
week)� combined acute/rehabilitation stroke unit: a stroke unit accepting patients acutely but continuing care
for several weeks if necessary
� rehabilitation stroke unit: a stroke unit accepting patients after a delay of 1–2 weeks and continuing
care for several weeks if necessary.
174 Stroke

d:/postscript/03-CHAP3_1.3D – 27/1/4 – 9:27
[This page: 175]
From responses to the Stroke Association survey of consultant physicians in the UK it was estimated that in
1998 approximately half of stroke patients were cared for in an organised stroke service.167 In the National
Sentinel Audit for stroke, which carried out a case note review of 6894 consecutive stroke patients admitted
to 197 trusts in England, Wales and Northern Ireland during 1998, the proportion of patients receivingstroke unit care was lower.10 18% of patients were shown to spend more than half of their inpatient stay on
a stroke unit, 15% on a rehabilitation unit, and 67% on general wards. This general pattern of results is
consistent with the Clinical Standards Advisory Group (CSAG) review of stroke services in a small random
sample of 13 districts and boards in the UK that was carried out during 1996–97. Out of 20 trusts that
provided rehabilitation services for people with stroke, 13 had a designated stroke service, of which nine
could be classified as stroke units.168 CSAG noted that there ‘was rarely a full multidisciplinary team
capable of working in a patient’s home’.
The Stroke Association survey (1998) found that the majority of consultants admit stroke patients to anacute admission ward – only 12% admit directly to a stroke unit.167 75% of consultants had access to
specialised stroke services – either a defined unit, or a multidisciplinary stroke team. The majority of the
stroke units were rehabilitation units, but a minority of consultants (17%) had access to acute stroke units,
or to combined acute/rehabilitation units (16%). Access to acute stroke unit care was much higher in
Scotland (41%) and Northern Ireland (52%) than England (29%) and Wales (21%).
In terms of what is different about the medical components of stroke unit care as compared to general
ward care supported by a specialist stroke team, Evans et al. reported that stroke unit care was associated
with more intensive monitoring, greater use of oxygen and antipyretics, measures to reduce aspiration,and early nutrition.171
Components of the multidisciplinary team
A key feature of stroke unit, or ‘organised’, care is access to a multidisciplinary team. The component parts
of this team for a ten-bedded unit are summarised in Table 23 (see overleaf ).170 The National Sentinel
Audit for stroke found that while the majority of trusts had access to core professional staff, otherprofessionals were not necessarily available – for example, only 29% had support from a clinical
psychologist.10 The Stroke Association consultant survey found that a third of consultants did not have
access to a multidisciplinary team for their stroke patients.167
Surgical intervention in acute stroke
Neurosurgeons offer two relevant interventions (excluding treatment of sub-arachnoid haemorrhage):evacuation of intracerebral haemorrhage; and the treatment of acute hydrocephalus arising from cerebellar
haemorrhage or infarction. Both these operations are uncommon in the UK. There is uncertainty over the
value of the former, though it is quite widely used in some countries, such as Japan; the latter is accepted
practice, but acute hydrocephalus is a relatively uncommon complication.
Length of stay
In the National Sentinel Audit, the mean age of patients admitted to hospital with stroke was 75 years, with
a 28% mortality at 30 days.10 For those discharged alive, the median length of stay was 21 days. The mean
length of stay (including deaths) in a study in Dublin was 31 days,172 which is similar to the average in
Oxfordshire (unpublished data held on file from the Oxford Stroke Register, 1995).
Stroke 175

d:/postscript/03-CHAP3_1.3D – 27/1/4 – 9:27
[This page: 176]
Community services
These services may be used either to help people with stroke avoid hospital admission, or to support people
with stroke after transfer out of hospital. A review of community-based rehabilitation services carried out
by the Audit Commission in twelve different areas of England and Wales reported that 80% of localities
had access to day hospitals and 50% to a multidisciplinary team.173 While most such teams include
physiotherapy and occupational therapy, the other professional groups (including nursing and medical)
were only represented in a minority.174
Intermediate care facilities
There are several definitions of ‘intermediate care’.175 Perhaps the most useful definition for the purposes
of this chapter is: ‘a service that meets the needs of those who because of their age or psychosocial
circumstances would benefit from an extended period of rehabilitation from a multidisciplinary team
following acute illness or treatment which could not be reasonably provided in their own homes, in anacute hospital or in a specialist unit.’176 The National Service Framework for Older People describes
intermediate care as a bridge between acute hospital, and primary and community care, and gives its aim as
‘to provide integrated services to promote faster recovery from illness, prevent unnecessary acute hospital
admissions, support timely discharge and maximise independent living’.9 In the context of stroke care,
176 Stroke
Table 23: Multidisciplinary involvement in with typical WTE staff for a ten-bedded stroke unit
(after Langhorne and Dennis170).
Professional WTE*
Core team Physicians
Nurses
Physiotherapists
Occupational therapists
Speech and language therapists
Social workers
Consultant: 0.5–1 wte
Junior medical: 0.4–0.8 wte
7–12 wte
1–2 wte
0.9–1.3 wte
0.2–0.6 wte
< 0.4–0.7 wte
Other professionals Audiologist
Chaplain
Chiropodist
Clinical psychologist
Dentist
Dietician
Orthoptist
Pharmacist
Other medical/surgical consultants Neurosurgeon
Psychiatrist
Ophthalmologist
Radiologist
Rheumatologist
Vascular surgeon
* WTE¼whole time equivalent.

d:/postscript/03-CHAP3_1.3D – 27/1/4 – 9:27
[This page: 177]
they have a potential role for patients who ‘would otherwise face unnecessarily prolonged hospital stays . . .
[or] long-term residential care’.9
The Audit Commission identified social services residential rehabilitation schemes as an important
form of intermediate care. Half of the areas included in the Audit Commission review had socialrehabilitation schemes. Typically, such care is based in units that were previously local authority residential
homes. Costs tend to be shared between health and social services.173 Amounts of medical input vary.
Being ‘social’ rehabilitation schemes, users also have to pay a contribution.
Another form of intermediate care is the community hospital (CH).177,178 In 1993, there were around
350 community hospitals in the UK, with about 10 000 beds.176 Stroke is the commonest medical diagnosis
associated with CH admission.179
Long-term care
In the National Sentinel Audit, 74% of patients were discharged to independent or warden-controlled
housing, 7% were transferred to another hospital, and 19% were transferred into institutional care. There
were wide variations between different regions of the UK as to the proportion of patients discharged to
institutional care who had been admitted from home with a stroke (6–19%).180 These results are consistent
with an unpublished study (data held on file) of 532 consecutive stroke admissions in patients aged 65 or
over to acute hospitals in Oxfordshire. After six months, 228 (43%) were at home, 233 (44%) had died, 56(10%) were in residential care, and 15 (3%) were still in hospital (mostly a community hospital). This is the
equivalent of 19% of survivors being in institutional care. Surveys of nursing homes estimate that between
14%181 and 23%182 of beds in nursing homes are occupied by people who have had a stroke.
Carer support
Recognising the wider impact of stroke, services have been developed which target carers as well aspatients. These include specific single-faceted interventions such as information giving, educational
programmes and counselling,183 and more generic services where the aim is to provide information and
advice, emotional and social support, and liaison with health and social services. These generic services
have been variously called: ‘social work’,184 ‘specialist nurse support’,185 ‘family support organisation’186
and ‘family care work’.187
Services for sub-arachnoid haemorrhage (SAH)
Someone with a diagnosis of sub-arachnoid haemorrhage, which carries a high mortality (see section 4),
would be admitted to hospital. Investigations and treatments used are shown in Table 24 (see overleaf ).
Evidence of the effectiveness of these interventions is summarised in ‘Sub-arachnoid haemorrhage’ in
section 6.
Costs of stroke care
The overall costs of stroke care to the NHS are variously put at between 4%2 and 6%3 of the total
expenditure on the NHS. Bosanquet and Franks estimated that people who have had strokes accounted for
Stroke 177

d:/postscript/03-CHAP3_1.3D – 27/1/4 – 9:27
[This page: 178]
£2318 million in 1995–96, which is the equivalent of 5.8% of total NHS and social services expenditure.188
They estimated that £758 million of this was attributable to the cost of treating new patients, and £1560
million to the cost of treatment of ‘old patients’ (i.e. costs attributable to long-term care, community
support and acute admissions for recurrent strokes). If the costs of informal care are also taken into
account (estimated at £672 million), then the total cost would rise to £2990 million.188
Publication of the NHS reference costs allows simple estimates to be made of some of the hospital-
related components of care. The relevant health resource group (HRG) codes (see ‘Health care resource
group codes (HRGs)’ in section 3) and their costs for 1999 are shown in Table 25. This shows the average
cost of a Finished Consultant Episode (FCE) in NHS trusts in England. FCEs can be difficult to interpret,because a patient may have several FCEs over the course of a single admission. For example, over a six-
month period in one study, 470 FCEs relating to stroke were identified, which corresponded to 318
separate admissions – an average of 1.5 FCEs per admission.41 There is very wide variation in costs of an
FCE between different trusts. Thus, for example, while the average cost of an FCE for an admission with
stroke in someone aged 70 or over was £2099, the range for the middle 50% of trusts was from £1179 to
£2729, and the total range was from £45 to £16 415!189 The wide range illustrates some of the current
limitations of use of HRGs in this context. It is not clear to what extent the wide range reflects erroneous
data or differences in case-mix between different trusts. Use of the range for the middle 50% of trusts (asshown in Table 25) gives a more conservative estimate of the spread of cost. However, estimates from
research studies suggest that the total cost of an individual stroke case admitted to hospital in the UK is
between £5800 and £8500 (1996–7 prices)170,190 which falls outside this range.
6 Effectiveness and cost-effectiveness
Important sources of data on evidence of effectiveness of stroke services include: the Cochrane Library
(see Appendix 2); the Royal College of Physicians’ National Clinical Guidelines for Stroke;11 Clinical
Evidence;191 and the review by the NHS Centre for Reviews and Dissemination of systematic reviews of
178 Stroke
Table 24: Management of sub-arachnoid haemorrhage: possible investigations and treatments.
1 To make diagnosis Brain imaging
Lumbar puncture
CT scan
MRI scan
2 To search for cause of haemorrhage Vascular imaging Angiography
MR angiography
CT angiography
Transcranial colour-coded duplex
sonography
3 Treatment of acute haemorrhage Evacuation of intracerebral
haematoma
4 Prevention of re-bleeding Medical therapy Antifibrinolytic drugs
Surgical therapy Clipping of aneurysm
Interventional radiology Coil embolisation
5 Prevention of secondary cerebral ischaemia Medical therapy Nimodipine

d:/postscript/03-CHAP3_1.3D – 27/1/4 – 9:27
[This page: 179]
research relevant to the ‘wider public health’ agenda.192 This section draws heavily on these sources, with
reference to more recent specific studies where relevant.
Population strategies to prevent stroke
Rees et al. recently reviewed the evidence relevant to government policy on heart disease and stroke.193
Their conclusions are summarised below.
Prevention of smoking
Raising the cost of cigarettes through taxation reduces consumption.194 The effect is greater on women and
younger people, but it creates financial hardship for poorer sections of society.195 Provision of smoke-free
workplaces196 and control of advertising197 both reduce overall tobacco consumption. School-based
programmes which employ social reinforcement techniques198 and mass media campaigns199 may both
be effective at reducing uptake in young people. Health education campaigns that simply provide
information tend to be effective only in higher socio-economic groups.200
Socio-economic deprivation
Evidence on the direct health effects of income supplementation is lacking, since the trials that were
performed did not use suitable health outcome measures.201 Structural and legislative measures are most
effective at reducing health inequalities.200
Stroke 179
Table 25: NHS reference costs relevant to stroke (1999).189
HRG code Mean cost of FCE(range for middle 50% of trusts)
Non-electiveinpatient
Electiveinpatient
Carotid artery stenosisQ05 (carotid artery surgery including endarterectomy) £1,767 (895–2,132) £1,940 (833–2,075)
Transient ischaemic attackA20 (age > 69 or with complications) £918 (686–1,395) £1,384 (556–1,739)
A21 (age < 70 with no complications) £624 (459–1,068) £1,461 (502–1,413)
StrokeA22 (age > 69 or with complications) £2,099 (1,179–2,729) £2,635 (911–3,365)
A23 (age < 70 with no complications) £1,623 (1,004–2,240) £2,096 (677–2,142)
A19 (includes intracerebral haemorrhage) £1,413 (928–2,004) £1,918 (652–2,415)
A03 (includes evacuation of intracerebral/cerebellar haematoma) £3,870 (1,141–4,223) £3,502 (1,013–3,717)
Sub-arachnoid haemorrhageA19 (includes sub-arachnoid haemorrhage) £1,413 (928–2,004) £1,918 (652–2,415)
A03 (includes drainage of sub-arachnoid space; excision/ligation
of cerebral artery aneurysm)
£3,870 (1,141–4,223) £3,502 (1,013–3,717)
A04 (includes clipping/obliteration of cerebral artery aneurysm) £5,365 (1,347–6,089) £4,715 (1,070–5,370)
Note: Bold costs indicate more usual type of admission.

d:/postscript/03-CHAP3_1.3D – 27/1/4 – 9:27
[This page: 180]
Healthy lifestyle
A systematic review of exercise health promotion strategies concluded that public health strategies aimed
at changing the environment to encourage walking and cycling would reach a greater proportion of the
inactive population than strategies aimed at increasing use of exercise facilities.202
While eating more fresh fruit and vegetables has been shown to be associated with a lower risk of
stroke,203 health effects of changes in consumption have not been demonstrated through trials. Public
health strategies to reduce salt consumption such as reducing salt content in processed foods may have an
impact on blood pressure (see chapter on hypertension).204
Prevention in people at high risk of stroke
The evidence for treatments to reduce risk of stroke in different categories of people is summarised in
Table 26. Treatment of hypertension, diabetes and ischaemic heart disease is covered in more detail in
other chapters. The grading of the quality of evidence takes into account both the nature of the evidence
180 Stroke
Table 26: Effectiveness of treatments to reduce risk in high risk individuals.
Risk group Intervention Reduction in stroke risk Quality ofevidence*
Hypertension Lowering blood
pressure
35–40% with a mean reduction of 5–6 mmHg in
diastolic blood pressure209A1
Atrial fibrillation Adjusted dose warfarin 59%, with mean achieved INR from 2.0–2.6210 A1
Aspirin 20–22%, with doses in trials varying between
50 mg and 1,300 mg/day210,211B1
Warfarin versus
aspirin
32–36% reduction if treated with warfarin in
preference to aspirin210,212B1
Carotid artery stenosis
(asymptomatic)
Carotid
endarterectomy
27–38% reduction in risk of ipsilateral stroke or
perioperative stroke or death after mean of
3 years follow-up213,214
C1
People at high
vascular risk**
Aspirin 27% reduction in risk of MI, stroke or vascular
death; 31% reduction in risk of non-fatal stroke215
There is no evidence that higher doses (e.g.
300 mg/day) are any more effective than lower
doses (e.g. 75 mg/day)216
A1
Thienopyridine
derivatives (ticlopidine
and clopidogrel) in
preference to aspirin
12% reduction if treated with a thienopyridine
in preference to aspirin217,218C1
Statin therapy See text for discussion of MRC/BHF heart
protection study
Ischaemic heart
disease
Lowering cholesterol
with statins
29% reduction if treated with a statin219 A1
Notes: * See introductory chapter to HCNA series for grading used; ** Including peripheral vascular disease,
ischaemic heart disease and cerebrovascular disease.

d:/postscript/03-CHAP3_1.3D – 27/1/4 – 9:27
[This page: 181]
(grade 1–4) and the size of the effect (A–E). The definitions are given in the introductory chapter to this
series. The size of the effect incorporates both relative effect (reduction in stroke risk – as shown in
Table 26) and absolute effect. Thus, carotid endarterectomy in asymptomatic individuals has been graded
C since asymptomatic carotid artery stenosis does not confer significant stroke risk, so the benefits of theoperation in absolute terms are small.90 The published evidence that statins reduce stroke risk is derived
largely from two cardiovascular secondary prevention studies – the Cholesterol and Recurrent Events
(CARE) Study205 and the Scandinavian Simvastatin Survival Study (4S).206 Therefore, cholesterol
lowering has been included as a treatment in people with ischaemic heart disease. However, the indications
for statins will widen as a result of the recently reported but unpublished MRC/BHF Heart Protection
study. This trial involved 20 000 volunteers who were at increased risk of coronary heart disease, regardless
of baseline cholesterol level. The results presented at the 2001 American Heart Association Scientific
Meeting showed that treatment with statins reduces the risk of heart attacks and strokes ‘by at least one-third, not just in people who already have coronary disease, but also in those who have diabetes, narrowing
of arteries in their legs or a previous history of stroke’.207
With regard to lifestyle interventions to reduce risk of stroke (e.g. smoking cessation, weight loss,
healthy diet, exercise, control of alcohol consumption), there is little direct evidence from trials that such
interventions are effective. Justification for their use is through extrapolation from observational studies
that demonstrate associations between the risk factor and stroke, and that changes in risk factor status are
associated with better outcome (quality of evidence: B2). Observational evidence suggests that moderate
alcohol consumption may actually protect against ischaemic stroke.208
Prevention in people who have had a stroke or transient ischaemic attack
Lowering blood pressure
A meta-analysis of individual patient data on the effects of lowering blood pressure of patients with
hypertension and a history of stroke, who had been included in randomised controlled trials of the effects
of antihypertensive therapy, found risk of subsequent stroke was reduced by 28% (95% CI: 61–85%)
(quality of evidence: A1).220 The benefits of lowering blood pressure in people with stroke have been
confirmed by the PROGRESS trial, which showed similar effects (28% reduction in stroke risk) in both
hypertensive and non-hypertensive stroke patients.221,222 The trial also showed that the more intensive thetreatment, the larger was the effect. Thus, giving combination therapy (an ACE inhibitor plus a thiazide
diuretic) achieved greater reductions in blood pressure (mean reduction: 12/5 mmHg) and stroke risk
(43%) compared with a single agent (ACE inhibitor) (5/3 mmHg reduction in blood pressure, and 5%
reduction in stroke risk). These findings are consistent with observational data showing that the lower the
diastolic blood pressure, the lower the risk of a second stroke.223
Treatment of atrial fibrillation
For secondary prevention in atrial fibrillation, warfarin reduces risk of stroke by 68%, a similar order of
magnitude to that achieved in primary prevention.210 Due to the higher risks of stroke in people who have
already had a stroke, the benefits of warfarin over aspirin in absolute terms are higher than for primary
prevention.
Stroke 181

d:/postscript/03-CHAP3_1.3D – 27/1/4 – 9:27
[This page: 182]
Carotid endarterectomy for symptomatic carotid artery stenosis
In patients with severe carotid artery stenosis (> 80% in the European Carotid Surgery Trial (ECST),
which is the equivalent of > 70% in the North American Symptomatic Carotid Endarterectomy Trial
(NASCET) ) surgery reduces the risk of disabling stroke or death by 48% (95% CI: 27–73%) (quality of
evidence: A1).224 In patients with moderate stenosis (ECST 70–79%; NASCET 50–69%) surgery reduces
risk of stroke or death by 27% (95% CI: 15–44%) (quality of evidence: B1). In patients with lesser stenoses,
surgery increases the risk of stroke or death by 20% (95% CI: 0–44%) (quality of evidence: E1).224 The
benefits of carotid endarterectomy are outweighed by the harm if the surgical complication rate exceeds6%.224 A variety of surgical techniques are used for carotid endarterectomy, but there is insufficient
evidence to favour one approach over another.225–31 The recently reported CAVATAS trial found that
endovascular treatment (i.e. percutaneous transluminal balloon angioplasty with stents also used in some
patients) achieved similar results to carotid endarterectomy in terms of ipsilateral stroke recurrence three
years after the intervention (hazard ratio: 1.04; 95% CI: 0.63–1.70).232 However, the confidence intervals
are wide, and one year after treatment severe (70–99%) ipsilateral stenosis was more common in the
endovascular group (14% versus 4%). Endovascular techniques have evolved since this study was initiated,
with greater experience of use of stents. The ongoing CREST (Carotid Revascularisation Endarterectomyversus Stenting Trial) and International Carotid Stenting Study (ICSS) will provide further data to clarify
whether or not endovascular procedures are as effective as carotid endarterectomy.233,234
A post hoc sub-group analysis of the North American Symptomatic Carotid Endarterectomy
(NASCET) trial found that the absolute benefits of surgery were significantly greater in elderly people.
The absolute risk reduction of ipsilateral ischaemic stroke for people with 70–99% stenosis was 28.9%
[Number Needed to Treat (NNT) = 3] in people aged 75 or over, as compared to 15.1% (NNT = 7) in
people aged 65–74 and 9.7% (NNT = 10) in people aged under 65.235 Furthermore, the absolute risk
reduction was significant in older patients (aged 75 or over) with lesser degrees of stenosis (50–69%). Thisfinding is supported by pooling of data from the Carotid Endarterectomy Trialists’ Collaboration
(CETC).236
There are some observational data to suggest that surgeons who perform very few carotid endarter-
ectomies per year (less than 5) achieve worse outcomes, and that hospitals with greater through-put (over
100 operations per year) achieve better results237 (quality of evidence: B2).
Antiplatelet agents
Aspirin is effective in secondary prevention of stroke, despite causing a small increase in risk of
haemorrhagic stroke.215 The size of the risk reduction is similar to that achieved by primary prevention
(Table 26). Thienopyridines (clopidogrel; ticlopidine) are effective alternatives.218 Whether or not adding
dipyridamole to aspirin increases the effectiveness, as has been suggested by one trial, the European StrokePrevention Study (ESPS-2),238 is currently being reviewed by the Antithrombotic Trialists Collabora-
tion.239 The combination of clopidogrel and aspirin has been shown to be more effective than aspirin alone
in preventing vascular events in patients with acute coronary syndrome and in patients undergoing
percutaneous coronary interventions.240,241
Statin therapy
The unpublished MRC/BHF Heart Protection study provides evidence of the effectiveness of statin use in
people who have had a stroke (see ‘Prevention in people at high risk of stroke’ above).
182 Stroke

d:/postscript/03-CHAP3_1.3D – 27/1/4 – 9:27
[This page: 183]
Ineffective therapies
Long-term anticoagulation in people with non-embolic stroke (in the absence of atrial fibrillation or
valvular heart disease) confers no benefit, but does increase risk of bleeding.242 In a recently reported trial
which compared warfarin to aspirin for prevention of recurrent ischaemic stroke in patients who had a
prior non-cardioembolic stroke, non-significant advantages in terms of lower stroke rates and major
haemorrhage were found for aspirin over warfarin (stroke rates: 16% versus 18%; major haemorrhage
rates: 1.5% versus 2.2%).243
Acute treatment of stroke
Diagnosis
The accuracy of clinical diagnosis depends upon the setting and the time after onset of symptoms when the
diagnosis is made. A study in Ohio found that 62 out of 86 (72%) patients diagnosed as having had a stroke
or TIA by ambulance personnel had this diagnosis confirmed in hospital.244 A study in Los Angeles found
higher levels of accuracy were achieved by ambulance personnel in association with the use of a screening
instrument (the Los Angeles Prehospital Stroke Screen – the LAPSS). 86% of patients diagnosed as havinghad a stroke on the LAPSS had this diagnosis confirmed in hospital.245 Estimates of the accuracy of
diagnosis in Accident and Emergency vary between a predictive value of 81 and 95%.246,247 The main
source of error is distinguishing stroke from other causes of acute neurological deficit, such as post-ictal
deficits, systemic infection, tumours and toxic metabolic disturbances. In the OCSP, out of 325 patients
diagnosed as having a ‘clinically definite first stroke’ by an experienced physician after admission, only 5
turned out to have different final diagnoses (2 sub-dural; 2 glioma; 1 metastasis).248 Only 3 out of 411
patients diagnosed as not having had a stroke were subsequently found (on the basis of CT scan or autopsy)
to have had one. Infarcts on a CT scan are most apparent after a few days, though up to half of patients witha clinically definite stroke will not have a diagnostic lesion on a CT scan.249
In their review of the evidence, the Intercollegiate Working Party for Stroke concluded that little
directed research has been carried out to assess the process of diagnosis for stroke, and that: ‘No research
has evaluated critically the role of brain imaging.’11 There are three reasons for performing brain imaging
(CT or MRI scan) in acute stroke: to identify other causes for the symptoms (as discussed in the preceding
paragraph); to exclude cerebral haemorrhage; and to assess eligibility for thrombolysis in centres where
this is given.
CT scanning (or other brain imaging) has a role to differentiate cerebral infarction from haemorrhage,since this will help determine both acute treatment and secondary prevention strategy. In this regard, case
series show that it becomes more difficult to distinguish cerebral haemorrhage from cerebral infarction as
time elapses after the stroke, and that, after two weeks, the scan may be classified incorrectly.250 While
early CT can accurately identify intracerebral haemorrhage, it can be difficult to differentiate between a
primary intracerebral haemorrhage (PICH) and haemorrhagic transformation of an infarct (HTI). The
possibility of mistaking a an HTI for a PICH reduces the earlier that the CT scan is performed.248
As acute treatments which require early intervention become available (see below), early clinical
diagnosis may be less adequate. For example, in a series of 70 patients who were examined within 6 hours ofonset of symptoms, and diagnosed at that time as having had an anterior circulation stroke, 6 were found
to have different final diagnoses (3 metabolic upset; 1 migraine; 1 alcohol withdrawal; 1 hysteria).251
Furthermore, of the 64 patients who did have a stroke, in 15 it was not an anterior circulation stroke, but
something else (e.g. intracerebral haemorrhage; small vessel occlusion).
Stroke 183

d:/postscript/03-CHAP3_1.3D – 27/1/4 – 9:27
[This page: 184]
Echocardiography can identify cardiac sources of embolus in patients with stroke and clinical evidence
of cardiac disease. There is evidence from observational studies that patients with intracardiac thrombus
benefit from anticoagulation.252
Acute interventions
A large number of interventions in acute stroke have been reviewed by the Cochrane Stroke Group.
Interventions that show some promise, but for which there is insufficient evidence of effectiveness to
recommend them currently outside clinical trials, include cooling therapy (on the basis of patho-
physiology)253 and fibrinogen depleting agents (ancrod).254 Treatments that are in common use in severalparts of the world for which no evidence of effectiveness was found include: anticoagulants for acute
stroke,255 including low molecular weight heparins;256 deliberate lowering of blood pressure in acute
stroke;257 and surgery for primary supratentorial intracerebral haemorrhage.258
Two interventions for which there is some evidence of beneficial effect are antiplatelet therapy and
thrombolysis. Aspirin, at a dose of 160–300 mg daily, started within 48 hours of onset of symptoms, leads
to a small but significant reduction in risk of death or dependency (6% risk reduction) (quality of evidence:
C1).259 Thrombolysis increases risk of death, but reduces dependency in survivors so that, overall, risk of
death or dependency is reduced.260 By the end of follow-up, thrombolysis administered within 6 hours ofonset of stroke resulted in a 17% reduction in the odds of death of dependency. Indirect comparison of the
different thrombolytic agents that have been used in trials suggests that recombinant tissue Plasminogen
Activator is associated with fewer deaths and greater chance of a good outcome (alive and independent)
(quality of evidence: B1).260 Interpretation of the data on thrombolysis remains controversial. In the US,
thrombolysis is more widely accepted as a ‘proven’ treatment on the basis of the National Institute of
Neurological Disorders and Stroke (NINDS) trial, which found a better chance of a good outcome in
patients treated with tissue Plasminogen Activator (tPA) at both 3261 and 12 months after the stroke.262,263
However, other trials, such as the European Co-operative Acute Stroke trials (ECASS I and II), did not findthat t-PA was effective.264,265 The conclusion of the Cochrane review of this evidence was that:
The data are promising and may justify the use of thrombolytic therapy with intravenous recombinant
tissue Plasminogen Activator in experienced centres in selected patients. However, the widespread use ofthrombolytic therapy in routine clinical practice at this time cannot be supported. Further trials will be
needed to identify which patients are most likely to benefit from treatment and the environment in which
it may best be given, before thrombolytic therapy should be adopted on a wider scale.260
Organisation of stroke care
Organised inpatient care in stroke units leads to better survival, less dependency, and greater likelihood of
patients living at home after one year as compared to conventional inpatient care. The odds of death or
institutionalised care at final follow-up (median one year) were reduced by 24% (greater than the effect of
any individual drug), and the odds of death or dependency by 25% in patients who received stroke unit
care.169 Stroke unit care is not associated with any increase in length of hospital stay. There is no evidence
that services which aim to avoid hospital admission for stroke patients can achieve the same benefits as
in-patient stroke units.165 A trial comparing stroke unit care with general ward care with stroke team
support, or domiciliary stroke care with specialist team support, found significantly better outcomes forthe group that received inpatient stroke unit care as compared to the other models of care (which loosely fit
under the broad definition of ‘organised’ stroke care).266
There is no evidence from randomised trials as to how soon after their stroke patients should be
admitted to stroke units. The poorer survival in UK hospitals, as compared to some European centres
184 Stroke

d:/postscript/03-CHAP3_1.3D – 27/1/4 – 9:27
[This page: 185]
which are associated with more intensive management of the early phases of acute stroke, has been cited as
circumstantial evidence for the importance of more intensive acute stroke care (quality of evidence: B3).267
Models of care that support early discharge from hospital reduce length of stay, but the effects on patient
and carer outcomes and on overall costs of this approach are unclear.268,269 For example, a London studyshowed that community-based rehabilitation (after, on average, 34 days in hospital) can achieve similar
outcomes in terms of activities of daily living at one year as slightly longer periods in hospital,(average 40
days), though patients in the early discharge group were found to have higher levels of anxiety.270 There are
similar uncertainties over the effects of day hospital rehabilitation.271
Stroke rehabilitation
The overall package of ‘stroke unit care’, as outlined in ‘Acute management and rehabilitation of stroke’ in
section 5, is effective, which is evidence for the role of rehabilitation in stroke as a whole. This rehabilitation
is multidisciplinary. The evidence for the individual components of the rehabilitation process is reviewed
below. In general, the evidence for the individual components is a lot weaker than the evidence for the
rehabilitation process as a whole. However, demonstrating that one part of the system looked at in
isolation does not work is not evidence that that part is not necessary for the effective provision ofrehabilitation.272
Treatment of swallowing difficulties
Observational studies using historical controls suggest that recognising and treating swallowing difficulties
in stroke patients will reduce risk of pneumonia.273 However, there is a lack of evidence available to guidecare and feeding of these patients.274 Percutaneous endoscopic gastrostomy (PEG) feeding may improve
outcome and nutrition as compared with naso-gastric tube feeding, but this is based on two small trials
only.274,275
Physiotherapy
A systematic review of randomised trials of physiotherapy after stroke identified seven trials involving 597
patients.276 Patients who received more intensive physiotherapy did better in terms of a composite
outcome of death or deterioration at the end of follow-up (OR 0.54; 95% CI: 0.34–0.85). A separate meta-
analysis reached similar conclusions.277 Since these reviews, a randomised trial of physiotherapy with three
groups (arm training; leg training; and a control group) in 101 patients with severe disability following a
middle cerebral artery stroke, demonstrated that greater intensity of rehabilitation improved functional
recovery and health-related functional status.278 There is a growing evidence base looking at specific
interventions such as electrical stimulation for the prevention and treatment of post-stroke shoulderpain,279 and electromyographic feedback to improve limb function,280 but clear conclusions about the
effectiveness or otherwise of these interventions cannot be drawn.
Speech and language therapy
There is too little evidence from randomised controlled trials about the effects of speech and language
therapy after stroke to draw any conclusions as to whether it is effective or ineffective.281 A systematic
review of observational studies concluded that intensive targeted therapy is effective for some specific
dysphasic syndromes (quality of evidence: B2).282
Stroke 185

d:/postscript/03-CHAP3_1.3D – 27/1/4 – 9:27
[This page: 186]
Occupational therapy
Recent randomised controlled trials have demonstrated the effectiveness of domiciliary occupational
therapy for stroke, both in patients who stay at home283 and patients after discharge from hospital.284 A
meta-analysis of controlled studies (including some randomised trials) of occupational therapy for older
people (i.e. not just stroke patients) found some evidence in support of occupational therapy in other
settings, such as nursing homes and psychogeriatric wards.285
Treatment of post-stroke depression
Trials have been performed of both pharmacological and psychological treatments of post-strokedepression. A recent systematic review concluded that patients with depressive symptoms after
stroke do respond to short-term treatment with antidepressants, but that there is a lack of trials of
sufficient size to draw conclusions as to the role of psychological treatments in post-stroke depression.135
Integrated care pathways
One approach to achieving co-ordinated care that has been tried is the integrated care pathway, in which a
co-ordinator or case manager is responsible for ensuring that patient care follows a pre-defined template.
In one trial, this approach was compared to a conventional multidisciplinary approach in which
individualised care objectives were set depending upon patient progress. However, the integrated carepathway approach was found to be associated with slower recovery and poorer quality of life scores.286
Late rehabilitation
Most research on rehabilitation has been directed at therapy in the first few months following stroke. One
trial of physiotherapy for patients who had a stroke at least a year earlier found that minimal late
intervention could lead to small improvements in mobility, but the improvements were not maintained.287
(quality of evidence: C1–2) A small trial of more intensive therapy found that this led to reduceddependence and increased social function – an effect that appeared to be sustained.288
Family support services
There is no evidence that family care workers can reduce the emotional impact of stroke for patients,289 but
there is consistent evidence from two randomised controlled trials that provision of such services can lead
to significant psychosocial benefits for carers.186,187
Other services
Many other aspects of stroke care have been evaluated. For example, trials of information provision290 and
of educational programmes291 for patients and carers have been performed, but have not demonstrated
any clear benefits.292 Two small trials provide some evidence that cognitive rehabilitation may improve
alertness and sustained attention for patients with attention deficits, but there is insufficient data to
conclude whether or not this leads to any improved functional independence.293 It is unclear whethercognitive rehabilitation has any effects on memory deficits following stroke.294
There is little research to support the provision of most equipment such as walking sticks, frames or even
wheelchairs. However, in many cases the benefits are so obvious that research is not likely to be sensible
(e.g. provision of a wheelchair to someone unable to walk). Ankle/foot orthoses have been researched a
186 Stroke

d:/postscript/03-CHAP3_1.3D – 27/1/4 – 9:27
[This page: 187]
little, and there is some evidence from non-randomised studies that they facilitate walking.295 However,
this was not confirmed in a more recent randomised study.296
Sub-arachnoid haemorrhage
Investigations in sub-arachnoid haemorrhage
These have recently been reviewed by van Gijn and Rinkel.297 CT scans detect the characteristic appearance
of blood in the basal cisterns. However, false positive diagnoses are possible on CT if there is generalised
brain oedema leading to venous congestion in the sub-arachnoid space. CT scanning within 12 hours is
98% sensitive (i.e. will miss 2% of patients with sub-arachnoid haemorrhage).298 MRI scanning is as
accurate as CT scanning in the early stages, but is better than CT at detecting extravasated blood later on.297
Lumbar puncture can exclude sub-arachnoid haemorrhage in patients with a negative scan, but a
traumatic tap (i.e. the lumbar puncture needle entering a vein) can be mistaken for blood in the sub-
arachnoid space. The risks of this are reduced the later after the onset of symptoms that the lumbar
puncture is performed, since this allows xanthochromia (caused by lysis of red cells in the cerebrospinal
fluid) to develop, which gives a characteristic appearance to the fluid.297
Angiography is the gold standard for detecting aneurysms, but has a 1.8% rate of neurological
complications.299 Techniques such as MR angiography and CT angiography are nearly as accurate as
angiography and are safer.297
Treatment of sub-arachnoid haemorrhage
Case series and a small randomised controlled trial suggest that surgical evacuation of large haematomas in
the acute phase may improve survival and outcome (quality of evidence: B2).297
There are medical, surgical and endovascular approaches aimed at preventing re-bleeding. A review of
antifibrinolytic therapy (e.g. tranexamic acid) found no evidence of benefit, with an odds ratio of pooroutcome of 1.05 (95% CI: 0.72–1.26).300 However, the reviewers noted that the trials were performed
more than 10 years ago, and that new strategies might overcome the ischaemia-inducing potential of the
treatment. Operative clipping of the aneurysm is standard practice (quality of evidence: B3). A Cochrane
review identified one randomised controlled trial addressing the timing of surgery after aneurysmal sub-
arachnoid haemorrhage.301,302 Patients operated on late had more re-bleeding and delayed ischaemia, but
this was not apparent if the patient was on nimodipine. The Cochrane reviewers concluded that timing of
surgery was not a critical factor in determining outcome following sub-arachnoid haemorrhage, based on
the limited evidence available. An alternative to surgery is the use of coil embolisation to pack theaneurysm.303 To date, there is insufficient evidence to judge the value of coil embolisation as compared to
surgical intervention.297 One randomised trial (n¼ 109) has been published which compared coil
embolisation to surgical ligation of ruptured intracranial aneurysm, and found no difference in clinical
outcome at three months between the groups.304 The ongoing MRC-funded International Sub-arachnoid
Aneurysm Trial (ISAT) is a randomised trial comparing neurosurgical clipping with endovascular coil
treatment for ruptured cerebral aneurysm causing acute sub-arachnoid haemorrhage. It is anticipated that
this trial will report in 2002.
With regard to prevention of secondary cerebral ischaemia, a systematic review of calcium antagonistsin sub-arachnoid haemorrhage found that nimodipine is effective in reducing risk of poor outcome (death
or severe disability), achieving a risk reduction of 18% (95% CI: 7–28%).305 Other neuroprotective agents
have been evaluated, but no clear-cut evidence of benefit has been found for any of these.304 Other aspects
of the medical management of sub-arachnoid haemorrhage, such as avoidance of treatment of
Stroke 187

d:/postscript/03-CHAP3_1.3D – 27/1/4 – 9:27
[This page: 188]
hypertension in the acute phase and prevention of hypovolaemia through use of intravenous saline are
currently justified on the basis of the underlying patho-physiology (quality of evidence: B3).297
Cost-effectiveness studies
Two systematic reviews have recently summarised the economic evaluations of stroke care that have been
performed.306,307 Both reviews commented that the overall quality of the evaluations tended to be poor.
Two areas for which a number of cost-effectiveness studies were found were carotid endarterectomy and
anticoagulation in atrial fibrillation.
Cost-effectiveness of carotid endarterectomy
Two studies were identified that examined the cost-effectiveness of carotid endarterectomy for symp-tomatic carotid artery stenosis. In one study, carotid endarterectomy was found to be the dominant
strategy (i.e. to lead to cost savings and better outcome),308 while in the other the cost per QALY was $4715,
at 1998 prices.309 However, neither of these studies took into account the cost of identifying which patients
with symptoms are suitable for surgery. If this is taken into account, the cost per QALY rises to $46 746, at
1998 prices.310
Two studies looked at the cost-effectiveness of the procedure for asymptomatic carotid artery stenosis,
but came up with very divergent estimates: $8484 and $60 605 per QALY, at 1998 prices.309,311 Neither of
these considered the additional costs of screening to identify carotid stenosis in asymptomatic patients.Four studies which have included these costs give very variable estimates of the cost-effectiveness, ranging
from a simple injunction not to do it (on the basis that screening programmes are more costly and lead to
worse outcomes than not screening) to a cost of $41 864 per QALY, at 1998 prices.307
Cost-effectiveness of anticoagulation in atrial fibrillation
Two cost-effectiveness analyses of anticoagulation in atrial fibrillation both concluded that warfarin was
highly cost-effective, except in people at low risk of stroke, with a cost per QALY of $9200, at 1998 prices, in
patients at medium risk of stroke, and was cost saving (i.e. better outcome at lower cost) in patients at highrisk of stroke.312,313 Lightowlers and McGuire, whose study was based in the UK, estimated that the cost
per life-year gained free from stroke over 10 years ranged from�£400 (i.e. resource saving) to £13 000. The
frequency of anticoagulation monitoring was the factor that most influenced the results.313
An economic evaluation of primary care-based anticoagulation management as compared to traditional
hospital-based care found that it was more expensive (£170 per annum per patient compared to £69),314
but the higher cost needs to be set against the potential for improved control.148
7 Models of care and recommendations
In a rational health care system, need for stroke services is dictated by how common stroke is, and what can
be done to either prevent it, and treat, rehabilitate or care for people who suffer a stroke. In this section, the
interpretation of the evidence base for stroke services is considered by reviewing the various guidelines thathave recently been published in the UK for stroke. The National Service Framework recommendations
conform to these guidelines, and are summarised at the end of each relevant sub-section. Secondly, the
implications of full implementation of these guidelines are considered by outlining the number of patients
that might be expected in a given population. Next, priorities for stroke service development are
188 Stroke

d:/postscript/03-CHAP3_1.3D – 27/1/4 – 9:27
[This page: 189]
considered, taking into account current uptake of services, how effective they are, and the population to
which they are applicable.
Guidelines for stroke care
Evidence-based guidelines have been produced by a number of different organisations in the UK. These
include the North of England evidence-based guideline development project,315 the Scottish Intercollegi-
ate Guidelines Network (SIGN),316 the Royal College of Physicians of Edinburgh Consensus Conferences
(ECC) on stroke,317 and the Intercollegiate Working Party (IWP) for stroke which produced the National
Clinical Guidelines.11 There have been no UK-based guidelines on primary prevention of stroke, but therehas been a recent statement from the Stroke Council of the American Heart Association, so this has been
included in this analysis.43 While there are some differences in detail, these guidelines are broadly in
agreement with each other. They are summarised below, and differences are discussed.
Primary prevention of stroke
For the primary prevention of stroke, the guidelines of the American Heart Association, which are
summarised in Table 27, are mostly uncontroversial. The recommendations in the top half of the table are
Stroke 189
Table 27: Summary of guidance for primary prevention of stroke.
Hypertension ‘Regular screening for hypertension (at least every two years in adults) and
appropriate management.’ (AHA)
Smoking ‘Smoking cessation for all current smokers is recommended.’ (AHA)
Diabetes ‘Careful control of hypertension in both type 1 and type 2 diabetics is recommended.
Glycemic control is recommended to reduce microvascular complications.’
Asymptomatic carotid
stenosis
‘Endarterectomy may be considered in patients with high grade asymptomatic
carotid stenosis performed by a surgeon with < 3% morbidity/mortality rate.’ (AHA)
Atrial fibrillation ‘Antithrombotic therapy (warfarin or aspirin) should be considered for patients with
non-valvular atrial fibrillation based on an assessment of their risk of embolism and
risk of bleeding complications.’ (AHA)
‘Higher risk patients should be considered for warfarin at a target INR of 2.5. Aspirin
may be a safer alternative to warfarin in some of these patients.’ (SIGN)
Hyperlipidaemia ‘Patients with known coronary heart disease and elevated LDL cholesterol levels
should be considered for treatment with a statin.’ (AHA)
Obesity ‘Weight reduction in overweight persons in recommended.’ (AHA)
Physical inactivity ‘Regular exercise (30 minutes of moderate intensity activity daily).’ (AHA)
Poor diet/nutrition ‘At least five daily servings of fruit and vegetables.’ (AHA)
Alcohol abuse ‘No more than 2 drinks per day for men and 1 drink per day for non-pregnant
women.’ (AHA)
Hyperhomocysteinaemia ‘Use of folic acid and B vitamins may be considered.’ (AHA)
Oral contraceptive use ‘Oral contraceptives should be avoided in women with additional risk factors (e.g.
cigarette smoking or prior thromboembolic events).’ (AHA)
Notes: AHA: American Heart Association;43 SIGN: Scottish Intercollegiate Guidelines Network.324
d:/postscript/03-CHAP3_1.3D – 27/1/4 – 9:27
[This page: 190]
derived from randomised controlled trial evidence; in the lower half of the table reasonable extrapolations
from observational studies are made.
One area where the guideline differs from UK practice is carotid surgery for asymptomatic carotid artery
stenosis. Cost-effectiveness studies have demonstrated that it is not cost-effective to screen forasymptomatic lesions,307 so the issue is really whether patients who incidentally are found to have carotid
artery stenosis should be operated on. The operation, while effective, only confers a small reduction in
absolute risk. Therefore, the skill of the surgeon is critically important, since a high complication rate
would outweigh the potential benefits of surgery. UK guidelines such as SIGN and the Edinburgh
Consensus Conferences have avoided making specific recommendations about carotid artery surgery in
this circumstance.318,319
Another area of controversy is the optimal treatment of atrial fibrillation. A recent review has challenged
the accepted orthodoxy that warfarin is the preferred treatment to aspirin.212 Warfarin is more effectivethan aspirin, but the latter is safer. Therefore, the treatment decision depends upon assessment of both
stroke risk and haemorrhage risk in individual patients. Decision analysis can be a useful tool to guide
therapeutic decisions in individual patients.320 However, there are important gaps in the evidence, most
notably with regard to treatment in the elderly, who are both at higher risk of stroke and at higher risk of
haemorrhage.321 The Birmingham Atrial Fibrillation Treatment of the Aged (BAFTA) randomised
controlled trial has been set up to address this issue.322 The wording of both the AHA and SIGN statements
reflect this uncertainty, though other guidelines have been more forceful in advocating warfarin therapy.323
Guidelines will need to be updated once the results of the MRC/BHF heart protection study have beenpublished, to reflect the wider indications for statins.207
INSF implementation
The NSF for older people requires that general practices should build on registers developed for the
coronary heart disease NSF, and develop a systematic approach for:
� identifying those at high risk of stroke
� identifying and recording modifiable risk factors of people at high risk of stroke
� providing and documenting the delivery of appropriate advice, support and treatment
� offering a regular review to those at risk of stroke.
Prevention in people who have had a TIA or stroke
The guidance issued by SIGN, the Intercollegiate Working Party (IWP) and the Edinburgh Consensus
Conferences (ECC) for secondary prevention are mostly in agreement with each other (see Table 28).
These guidelines were produced prior to both the publication of the PROGRESS trial222 and thecompletion of the MRC/BHF heart protection study.207 One implication of PROGRESS is that it is worth
lowering blood pressure in people who have had a stroke whether or not they are defined as being
hypertensive. While the PROGRESS trial used two specific agents (the diuretic indapamide and the ACE
inhibitor perindopril), the reductions in stroke risk observed are of the order of magnitude that would be
anticipated given the blood pressure reductions that were achieved, so the result is probably generalisable
to blood pressure-lowering regimes in general (including non-pharmacological approaches). A second
implication is that it may be worth lowering blood pressure as much as can be tolerated. Once the MRC/
BHF heart protection study has been published, statin use in stroke patients will need to be incorporatedinto guidelines.
All patients should have their blood pressure checked, and be started on an antiplatelet agent. There is
some controversy over what dose of aspirin should be used. There is no evidence that higher doses (e.g.
300 mg/day) are any more effective than lower doses (e.g. 75 mg/day).326 There is also some disagreement
190 Stroke

d:/postscript/03-CHAP3_1.3D – 27/1/4 – 9:27
[This page: 191]
as to the role of alternative antiplatelet agents. While the guidelines agree that the high cost of clopidogrel
excludes it from being an appropriate first line agent, recommendations on the use of aspirin in
combination with dipyridamole differ. It would seem sensible to await the conclusions of the
Antithrombotic Trialists Collaboration239 before recommending combination therapy on the basis of
one trial which has been subject to some criticism.327 It is plausible that combination therapy ofclopidogrel and aspirin will have a role, given the success of this combination in ischaemic heart disease,
for example in ‘aspirin failures’ – i.e. people who suffer recurrent strokes/TIAs while on aspirin. The
Stroke 191
Table 28: Summary of guidance for secondary prevention of stroke.
Hypertension ‘All patients should have their blood pressure checked, and hypertension persisting
for over one month should be treated.’ (IWP)
‘Control of hypertension . . . should be advocated once the initial event has
stabilised.’ (SIGN)325
Antiplatelet therapy ‘All patients not on anticoagulation should be taking aspirin (50–300 mg) daily, or a
combination of low dose aspirin and dipyridamole modified release. Where patients
are aspirin-intolerant an alternative antiplatelet agent (clopidogrel 75 mg daily or
dipyridamole MR 200 mg twice daily) should be used.’ (IWP)
‘Antiplatelet therapy, normally aspirin (75–300 mg/day), should be prescribed as
early as possible.’
‘Dipyridamole or clopidogrel should be considered as an alternative to aspirin in
patients with contraindications to aspirin, or who are intolerant of aspirin.’
‘Dipyridamole should be considered in addition to aspirin, especially in patients with
recurrent stroke or TIA despite aspirin.’ (SIGN)
‘Treatment should be with 75–150 mg aspirin, continued long term.’
‘Clopidogrel and the combination of aspirin and modified release dipyridamole are . . .
alternatives.’
‘Insufficient evidence in view of cost to justify clopidogrel or dipyridamole as first
line treatment.’ (ECC)
Anticoagulation ‘In the presence of atrial fibrillation, mitral valve disease, prosthetic heart valves or
within 3 months of myocardial infarction, anticoagulation should be considered for
all patients who have ischaemic stroke.’ (IWP)
‘Warfarin should be considered for use in patients with non-valvular atrial
fibrillation . . . after cardio-embolic stroke from valvular heart disease and recent
myocardial infarction.’ (SIGN)
‘Patients who have had a TIA or ischaemic stroke and are in atrial fibrillation should
be considered for long-term treatment with warfarin (Target INR 2.5).’ (ECC)
Carotid endarterectomy ‘Any patient with a carotid artery area stroke, and minor or absent residual
disability, should be considered for carotid endarterectomy.’ (IWP)
‘Carotid endarterectomy has a role in preventing stroke in patients with recent
(within 6 months) carotid territory symptoms in association with severe stenosis of
the ipsilateral carotid artery, and who are fit for surgery. Surgery should be targeted
at patients at highest risk of further stroke, and performed as soon as possible after
the initial event.’ (ECC)
Other risk factors ‘All patients should be assessed and treated for other vascular risk factors and advised
about lifestyle factors.’ (IWP)
Notes: IWP: Intercollegiate Working Party for Stroke National Clinical Guidelines;11 SIGN: Scottish Intercollegiate
Guidelines Network; ECC: Edinburgh Consensus Conferences on stroke.

d:/postscript/03-CHAP3_1.3D – 27/1/4 – 9:27
[This page: 192]
different guidelines are in agreement as to the role of warfarin post-stroke (indicated in atrial fibrillation,
recent myocardial infarction and in the presence of valvular heart disease), and on the role of carotid
endarterectomy. With regard to this latter procedure, the guidelines appropriately emphasise the
importance of early investigation after a TIA or minor stroke because of the high risk of early recurrencein a patient with a significant carotid artery stenosis.
Acute treatment of stroke
Recommendations on acute management of patients with stroke are summarised in Table 29. Despite the
absence of direct research evaluating the role of brain imaging, the guidelines all recommend that CT (or
MRI) scans should be performed on all patients, ideally within 48 hours (or 24 according to the Edinburgh
Consensus statement). The rationale for early CT scanning is to identify non-stroke pathology,
differentiate haemorrhage from infarct, and identify possible indications for neurosurgical intervention.
CT scanning cannot make a reliable positive diagnosis of stroke.248 Early CT scanning is essential to
exclude haemorrhage where acute medical interventions such as thrombolysis are being considered. The
necessity to perform a CT scan before administering aspirin is uncertain and opinion varies, thoughaspirin is likely to do some harm if given to someone who has had an intracerebral haemorrhage.
Use of aspirin in acute stroke is uncontroversial. Trials have demonstrated efficacy using both 160 mg
and 300 mg doses.259 The UK recommendations on thrombolysis are conservative compared to North
American practice, but are an appropriate reflection of the available evidence (N.B. thrombolysis is not
currently licensed for use in acute stroke in Europe).260 The SIGN and IWP guidelines differ on the role of
neurosurgery for cerebral haemorrhage. There are insufficient data from trials to recommend whether
neurosurgery should or should not be used.258 The recommendation on compression stockings by the
IWP is an extrapolation from evidence on the role of compression stockings to prevent deep veinthrombosis (DVT) in patients undergoing various kinds of surgery, and not based on trials in stroke
patients.328
There is a general consensus that in order to treat people with acute stroke in a way that is consistent with
the guidelines, patients should be urgently referred to specialist secondary care services, and that patients
with moderate or severe symptoms should be admitted to hospital (to a stroke unit). Within hospital, there
is consensus on the basis of physiological principles, that stroke patients should be monitored and treated
for fever, hyperglycaemia, dehydration and hypoxia, and that their airways should be maintained and risks
of aspiration minimised.267
NSF implementation
The NSF makes specific recommendations for the management of acute stroke:
� a brain scan within 48 hours
� aspirin, if a diagnosis of haemorrhage is unlikely.
It also makes more general observations about the importance of appropriate management of the general
condition of a stroke patient (such as hydration; hyperglycaemia; blood pressure, etc.).
Organisation of stroke care
A key component of recommendations on organisation of stroke care is the importance of stroke units. This
recommendation has a strong evidence base.169 However, the stroke unit trials included a heterogeneous setof patterns of care, and so it is difficult to be prescriptive about what constitutes ‘stroke unit care’, and a range
of models are available that probably meet the relevant criteria (see ‘Stroke unit care’ in section 5). There is a
difference in emphasis between the IWP and the ECC regarding the appropriate setting for acute care and
rehabilitation. This will in part have been influenced by the publication of a trial of alternative strategies for
192 Stroke

d:/postscript/03-CHAP3_1.3D – 27/1/4 – 9:27
[This page: 193]
Stroke 193
Table 29: Summary of guidance on acute treatment of stroke.
Diagnosis ‘Stroke is primarily a clinical diagnosis. Confirmation, using imaging, will be needed
if there are unusual clinical features.’
‘The diagnosis should always be reviewed by a neurologist or physician with special
interest in stroke.’ (IWP)
Setting for acute care ‘Patients should only be managed at home if: acute care guidelines can be followed;
care services are able to provide adequate and flexible support within 24 hours; the
services delivered at home are part of a specialist stroke service. Otherwise, patients
should be admitted to hospital for initial care and assessment.’ (IWP)
CT scanning/brain
imaging
‘Brain imaging is required as a matter of urgency if: there is a clinical deterioration
in the patient’s condition; sub-arachnoid haemorrhage is suspected; hydrocephalus
secondary to intracerebral haemorrhage is suspected; trauma is suspected; the patient
is on anticoagulant treatment, or has a known bleeding tendency.’
‘Brain imaging should be undertaken in all patients within 48 hours unless there are
good clinical reasons for not doing so.’ (IWP)
‘All patients with acute stroke should undergo CT brain scanning as soon as possible
– preferably within 48 hours – and no later than seven days.’ (SIGN)
‘All patients with symptoms suggestive of a stroke should be referred to the stroke
service for assessment, including CT brain scan, ideally within 24 hours.’ (ECC)
Aspirin ‘300 mg should be given as soon as possible after the onset of stroke symptoms (if a
diagnosis of haemorrhage is considered unlikely).’ (IWP)
‘Early treatment with aspirin (150–300 mg daily) is recommended, starting as soon as
intracranial haemorrhage is excluded by CT brain scanning.’ (SIGN)
‘Should be commenced within 48 hrs, or as soon as the diagnosis of cerebral
infarction has been made (dose: 150–300 mg).’ (ECC)
Thrombolytic therapy ‘Thrombolytic treatment with tissue Plasminogen Activator (tPA) should be given
only in a specialist centre, within 3 hours of stroke onset (when haemorrhage has
been definitely excluded).’ (IWP)
‘It is reasonable to use thrombolytic therapy (for example rtPA) in highly selected
patients in a carefully monitored environment.’ (ECC)
Other drug therapies ‘No other drug treatment aimed at treatment of the stroke should be given unless a
part of a randomised controlled trial.’ (IWP)
Neurosurgery ‘Neurosurgical opinion should be sought for cases of hydrocephalus.’ (IWP)
‘Urgent neurosurgical assessment should be available for selected patients, such as
those with large cerebellar infarcts or hydrocephalus, and for selected cases of
cerebral haemorrhage.’ (SIGN)
Compression stockings ‘Where stroke has caused weak or paralysed legs, full length compression stockings
should be applied (unless contraindicated) to prevent venous thrombosis.’ (IWP)
‘Physical methods of preventing DVT in stroke patients should be evaluated.’ (ECC)
Other ‘There should be local policies for the early management of hypertension,
hyperglycaemia, hydration and pyrexia.’ (IWP)
Notes: IWP: Intercollegiate Working Party for Stroke; SIGN: Scottish Intercollegiate Guidelines Network; ECC:
Edinburgh Consensus Conferences on stroke.

d:/postscript/03-CHAP3_1.3D – 27/1/4 – 9:27
[This page: 194]
stroke care,266 which preceded the November 2000 Edinburgh Consensus meeting, but came after the IWP
had published its report. The general consensus now, echoed in the NSF for older people, is that people with
acute stroke should be admitted to hospital.
With regard to setting for subsequent specialist rehabilitation, the trials of early discharge provide someevidence that community-based rehabilitation can achieve similar results to hospital-based care.
Community-based rehabilitation services are an important part of a comprehensive service for stroke
patients, but need to be linked to the specialist stroke services.
Both SIGN and ECC make recommendations on the importance of early assessment of patients with
suspected TIAs in order to identify patients who might benefit from carotid endarterectomy (see Table 30).
194 Stroke
Table 30: Summary of guidance on organisation of stroke care.
Services for patients with
suspected TIAs
‘Patients with suspected TIA or minor stroke who are not admitted to hospital
should have rapid access for urgent assessment and investigation (CT brain scanning,
carotid doppler examination and echocardiography).’ (SIGN)
‘For patients with symptoms suggestive of TIA, all clinicians should have rapid access
to specialist advice and investigation. If assessment in a neurovascular clinic is agreed
to be appropriate by the referring clinician and the specialist, this should be carried
out within a week.’ (ECC)
Stroke services ‘Every organisation involved in the care of stroke patients over the first six months
should ensure that stroke patients are the responsibility of and are seen by services
specialising in stroke and rehabilitation.’
‘The stroke service should comprise: a geographically identified unit; a co-ordinated,
multidisciplinary team; staff with specialist expertise in stroke and rehabilitation;
education programmes for staff, patients and carers; agreed protocols for common
problems.’ (IWP)
‘We emphasise the importance, and urge the further development, of well organised
and co-ordinated stroke services.’ (ECC)
Hospital services ‘Acute in-patient care for patients with major stroke should be organised as a
multidisciplinary stroke service based in designated units.’ (SIGN)
‘Any patient with moderate or severe symptoms should be referred with the
expectation of admission to a stroke unit.’
‘Strong evidence exists in favour of care being provided in dedicated stroke units.’
(ECC)
Community services ‘Specialist day hospital rehabilitation or specialist domiciliary rehabilitation can be
offered to outpatients with equal effect.’
‘Patients not admitted to hospital should be seen by a specialist rehabilitation team.’
(IWP)
‘Community-based rehabilitation services should develop partnerships with stroke
services.’ (ECC)
Setting for rehabilitation ‘Specialist stroke services can be delivered to patients, after the acute phase, equally
effectively in hospital or in the community, provided that the patient can transfer
from bed to chair before going home.’ (IWP)
‘Management in a stroke unit which combines both acute assessment and the full
range of rehabilitation should be the pathway of choice.’
‘For those patients able to be rehabilitated at home . . . this is preferred by some
patients.’ (ECC)
Notes: IWP: Intercollegiate Working Party for Stroke; SIGN: Scottish Intercollegiate Guidelines Network; ECC:
Edinburgh Consensus Conferences on stroke.

d:/postscript/03-CHAP3_1.3D – 27/1/4 – 9:27
[This page: 195]
This model of care has not been formally evaluated, but has logic given that surgery is of greatest benefit the
earlier that it is performed.
NSF implementation
The NSF recommends:
� urgent referral of patients with suspected TIA to a rapid response neurovascular clinic, managed by a
clinician with expertise in stroke for investigation and treatment
� that all patients who may have had a stroke will usually require urgent hospital admission; that they
should be treated by specialist stroke teams within designated stroke units.
Stroke rehabilitation
Of the guideline groups, the IWP is the only one so far to have focused on the specifics of rehabilitation
(Table 31). While the evidence base for some of the recommendations is lacking (see section 6), they reflect
a broad based consensus of opinion.
Stroke 195
Table 31: Summary of guidance on rehabilitation.
Multidisciplinary
assessment
‘A multidisciplinary assessment using a formal procedure or protocol should be undertaken
and documented in the notes within 24–48 hours of admission. The protocol should include
assessment of: consciousness level; swallowing; pressure sores risk; nutritional status; cognitive
impairment; communication; the patient’s needs in relation to moving and handling.’ (IWP)
‘Rehabilitation following stroke is an interdisciplinary process.’ (ECC)
Management ‘Protocols should be adhered to for: management of urinary and faecal incontinence and
constipation; nutritional support and enteral feeding; prevention and management of
shoulder pain; discharge planning.’
‘Goal-setting should involve the patient, and family if appropriate.’ (IWP)
Therapists ‘Patients with specific communication difficulties should be assessed by a speech and language
therapist for their suitability for intensive therapy.’ (IWP)
‘A physiotherapist with expertise in neurodisability should co-ordinate therapy to improve
movement performance of patients with stroke.’ (IWP)
‘All patients with difficulties in activities of daily living should be assessed by an occupational
therapist with specialist knowledge in neurological disability.’ (IWP)
Mood ‘Patients would be screened for emotionalism, depression and anxiety within the first month
of stroke, and their mood kept under review. When diagnosed, an antidepressant should be
considered.’ (IWP)
‘There is evidence to support an individual intervention which could be drawn from the
following: antidepressants for depression or emotionalism; psychological therapies; support
approaches (including patient and carer support groups).’ (ECC)
Notes: IWP: Intercollegiate Working Party for Stroke; ECC: Edinburgh Consensus Conferences on stroke.

d:/postscript/03-CHAP3_1.3D – 27/1/4 – 9:27
[This page: 196]
NSF Implementation
The NSF recommends:
� early, expert and intensive rehabilitation in a hospital stroke unit� that a stroke care co-ordinator should:
� co-ordinate assessment and individual care plans
� ensure arrangement for support and secondary prevention are in place prior to discharge
� ensure efficient flow of relevant information to community-based professionals� ensure smooth transfer between care settings
� ensure needs for home adaptations are identified and met prior to discharge.
While the actions and tasks specified by the NSF are important, there is no evidence that making use of aspecialist stroke care co-ordinator is the best way of achieving them. Indeed, the limited evidence available
suggests that some models that use a stroke co-ordinator may be harmful.286 Stroke care co-ordinators
have not been evaluated in this role, and alternative approaches adopted by district stroke services may be
as effective at lower cost.
Carers and families
NSF recommendations
The NSF recommends:
� patients and carers should be involved in planning their care and safe discharge from hospital
� patients and carers should be provided with a named stroke care co-ordinator they can contact.
Again, there is no evidence to support the NSF’s recommendation of using a stroke care co-ordinator to
support patients and carers after transfer out of hospital. What is needed is an organisation or service or
contact point to enable patients and carers to access support services after leaving hospital.
Continuing care
The NSF recommends: ‘Recovery from stroke can continue over a long time, and rehabilitation should
continue until it is clear that maximum recovery has been achieved. Some patients will need ongoingsupport, possibly for many years. These people and their carers should have access to a stroke care co-
ordinator who can provide advice, arrange reassessment when needs or circumstances change, co-ordinate
196 Stroke
Table 32: Summary of guidance on services for carers and families.
Management ‘Carers should receive all necessary equipment and training in moving and handling, in order
to position and transfer the patient safely in the home environment.’ (IWP)
Information ‘Families should be given information on the nature of stroke and its manifestations and on
relevant local and national services, and patients and carers should be involved in decisions.’
(IWP)
Carer stress ‘Stroke services must be alert to the likely stress on carers.’ (IWP)
Family support ‘Family support workers should be involved to help reduce carer distress.’ (IWP)
‘Carers may experience considerable stress and there is evidence that this can be reduced by
interventions such as family support services.’ (ECC)

d:/postscript/03-CHAP3_1.3D – 27/1/4 – 9:27
[This page: 197]
long-term support, or arrange for specialist care. Following a stroke, any patient reporting a significant
disability at six months should be reassessed and offered further targeted rehabilitation if this can help
them to recover further function.’9
Towards a quantified model for stroke care
Synthesising the epidemiology of stroke with the recommendations of the various expert committees
that have reviewed the evidence on stroke care, it is possible to define what the ideal level of service
provision might be for stroke care for a given population. This is summarised in Figures 5 and 6 for a
‘typical’ population of 100 000 based on UK data. Figure 5 focuses on services to prevent stroke (both
primary and secondary prevention), and Figure 6 (see overleaf ) on the treatment and rehabilitation
needs of people with stroke.
Stroke 197
PRIMARY CARE
Predisposing factors managed in primary care or inliaison with non-stroke-specific secondary care services
Predisposing factors where specialist stroke services are involved
Smoking (28,000); Hypertension (34,000); Diabetes mellitus (3,000);Ischaemic heart disease (5,500)
Atrial fibrillation (1,100) Symptoms of possibleTIA (58/yr)
Minor stroke (41/yr)
Rapid neurological assessmentTIA confirmed for 35/yr
Assessment for eligibilityfor carotid endarterectomy
(78/yr)
Eligible for warfarin– so need anticoagulation
monitoring (539)
Eligible for carotidendarterectomy–
so need operation (14/yr)
Numbers in brackets indicate likely number of prevalent or incident (per year) patients.See ‘Summary of epidemiology of stroke at level of Primary Care Group’ above for numbers.See text for further explanation.
Figure 5: Estimate of ideal level of service provision for a population of 100,000: prevention of stroke.

d:/postscript/03-CHAP3_1.3D – 27/1/4 – 9:27
[This page: 198]
Prevention services
Much of the disease prevention activity that is carried out in primary care is not specific to stroke, though it
has an important impact on stroke incidence as discussed in section 4. The specific areas of disease
prevention that impinge upon specialist services are atrial fibrillation and assessment of suitability for
carotid endarterectomy (see Figure 5). From a prevalence survey of atrial fibrillation performed in
Northumberland, it was estimated that 49% of people in atrial fibrillation were eligible for anticoagulation
based upon criteria from a pooled analysis of trial results.50 Therefore, of the estimated 1100 people with
atrial fibrillation in a population of 100 000, approximately 561 should be on aspirin and 539 on warfarin.
Thus, provision should be available to monitor the anticoagulation (whether in primary care or in hospitalanticoagulation clinics) of 540 patients per 100 000 population. It is difficult to estimate how many
patients in primary care present with a possible TIA, given that the epidemiological data are based on
confirmed TIAs. However, if a 40% misdiagnosis rate of GPs is assumed,97 then a rapid access neurological
assessment clinic would need to see 58 patients per year with suspected TIA (and possibly more with minor
stroke if these were not admitted to hospital). Using the methodology of Ferris et al.160 applied to the
population estimates summarised in ‘Summary of epidemiology of stroke at level of Primary Care Group’
198 Stroke
Patient has acute stroke
Admission to hospital Stays at home
Stroke unit
Geriatric/neurorehabilitation ward
General medicalward
Long-term care:Nursing homeResidential home
Intermediate care facility:Community hospitalNursing home (short stay)Social rehabilitation unit
Return home
Supporteddischarge schemes
Supported bystroke team
Community services:Rapid response teamHospital at homeDay hospitalOutpatientsDomiciliary care
+/–
–
–
+++
+
+
++
+++
Bold arrows reflect desired pathway.+ indicates that the proportion of patients who follow this pathway should be increased.– indicates that the proportion of patients who follow this pathway should be reduced.
Figure 6: Ideal service provision for a population of 100,000: acute treatment and rehabilitation of stroke.

d:/postscript/03-CHAP3_1.3D – 27/1/4 – 9:27
[This page: 199]
in section 4, it can be estimated that 14 carotid endarterectomies per 100 000 population would represent
optimum provision.
Treatment and rehabilitation services
It is more difficult to present a single model of treatment and rehabilitation services. While there is strong
consensus on the importance of stroke units and the value of a co-ordinated, multidisciplinary approach,
the optimum mix of hospital- as opposed to community-based services will depend upon the locality
(urban or rural), and on what services are already present. While the current evidence favours inpatientrehabilitation, there have been few trials that have directly compared inpatient to outpatient rehabilita-
tion.268 The emphases of the guidelines are shown in Figure 6. In essence, they recommend that a greater
proportion of patients should be admitted to hospital, and of those, more should receive their
rehabilitation on a stroke unit. With regard to the numbers involved, 221 people per 100 000 might be
expected to have a stroke per annum (including recurrent strokes) – see ‘Summary of epidemiology of
stroke at level of Primary Care Group’ in section 4. If 20% of these are assumed to die early, and if 70% of
the remainder are assumed to have a moderate or severe stroke (i.e. will require admission to a stroke unit
for rehabilitation), and if the average length of stay is assumed to be 30 days,172 then this equates to a needfor a 12-bedded stroke unit per 100 000 population, assuming 85% bed occupancy (which will allow for
some fluctuation in numbers). Most of the stroke units included in the systematic review of their
effectiveness were of similar size (6–15 beds),170 but are likely to have served far larger catchment
populations (300 000þ). Therefore, a model of care whereby the majority of stroke patients are admitted
to a stroke unit is not sustainable without radical organisational change within the hospital sector. This
raises the question of whether locality-based rehabilitation in intermediate care facilities might not be an
appropriate model of care. Such intermediate care facilities would need to specialise in stroke, and would
need to treat sufficient numbers of patients to develop and maintain that expertise, which in turn meansthat the locality service would need to have a sufficiently large catchment area. Such models have not been
evaluated, and trials of this pattern of care versus stroke units in district general hospitals need to be
performed.
A stroke service also requires access to neurosurgical expertise for the management of patients with sub-
arachnoid haemorrhage, and those with stroke who develop complications such as hydrocephalus that
require neurosurgical intervention.
Continuing care
Most of the research on models of care is directed at treating ‘incident’ cases of stroke – i.e. the acute
treatment and rehabilitation needs of people in the early phases after stroke (perhaps up to one year).
However, from a primary care perspective, the needs of incident cases are dwarfed by those of prevalent
cases. How best to meet the long-term needs of patients with stroke is an under-researched area, and
models of care that address these needs should be developed and evaluated. As noted above, the NSF
recommends use of stroke co-ordinators. The National Clinical Guidelines for Stroke make the followingrecommendations.11
� Any patient with disability at 6 months or later after stroke should be assessed for a period of further
targeted rehabilitation to be given where appropriate.� Patients and their carers should have their individual psychosocial and support needs reviewed on a
regular basis.
� Health and social services professionals should ensure that patients and their families have information
about the statutory and voluntary organisations offering services specific to these needs.
Stroke 199

d:/postscript/03-CHAP3_1.3D – 27/1/4 – 9:27
[This page: 200]
Standard three of the National Service Framework for older people relates to intermediate care.9 The
standard is that: ‘Older people will have access to a new range of intermediate care services at home or in
designated care settings, to promote their independence by providing enhanced services from the NHS and
councils to prevent unnecessary hospital admission and effective rehabilitation services to enable earlydischarge from hospital and to prevent premature or unnecessary admission to long-term residential care.’
It is difficult to quantify the longer term needs of stroke survivors, but on the basis of data from the
OCSP (see ‘Survival following stroke’ and ‘Incidence of disability following stroke’ in section 4) that 70%
of stroke patients survive to one year, and that 35% of these patients remain functionally dependent, it can
be estimated that about 54 new stroke patients per 100 000 population will require continuing care (either
institutional or domiciliary) one year after their stroke. The actual level of service needed will be greater
than this, since it relates to prevalent rather than incident cases. Prevalence surveys of disability suggest that
in a population of 100 000 one might anticipate 1000 stroke survivors with residual disability. In theabsence of an evidence base, it is difficult to be prescriptive about what services should be available. Such
services need to be considered within the broader context of disability management and services for elderly
people.
Priorities for stroke care
The quantified model described in ‘Towards a quantified model for stroke care’, above, is of an ‘ideal’service, which ignores financial constraints and cost-effectiveness. These aspects cannot be ignored when
considering what should be the highest priorities in developing local services. What is most relevant in this
context is the marginal benefit (i.e. the impact of moving from the current service provision to the
optimum) of each service development. This can be approximated by estimating the gap between current
service provision and the optimal service, what it would cost to fill that gap, and what would be the
outcome in terms of health benefits.
Stroke prevention
In Table 33, the effects of each intervention, in terms of number of strokes that would be prevented, is
estimated by using the typical rate of stroke that occurred in the control groups of the trials on which
evidence of effectiveness is based. The table does not directly try to evaluate the relative cost-effectiveness of
different interventions, but rather, the impact of full implementation of current recommendations.
Table 33 can only offer a crude estimate of the relative value of prioritising each of the intervention
strategies, since it would be possible to increase the relative cost-effectiveness of each of the interventions
by targeting them at individuals who had the most to gain. For example, while the average number neededto operate on to prevent a stroke with carotid endarterectomy in the European Carotid Surgery Trial was
14, this could be reduced to 3, if operations were only performed on particular high risk individuals.331
Secondly, only some of the direct costs are included. Thus, for hypertension, only the cost of the drugs are
considered, and not the costs of assessment and monitoring. Similarly, for carotid endarterectomy, only
the costs of the operation itself are taken into account. The costs of anticoagulation, on the other hand, are
derived from studies that will have given a more accurate assessment of total costs. Thirdly, the table does
not take account of the costs of treating strokes. Thus, it is not possible to draw any conclusions as to the
overall cost-effectiveness of each of the interventions as compared with not implementing them.Nevertheless, it is possible to draw some tentative conclusions from the table as to the relative priority
that should be accorded to increasing uptake of each of the stroke prevention strategies.
In terms of cost per stroke averted, optimising uptake of aspirin is much the most cost-effective strategy.
Next comes use of anticoagulation in atrial fibrillation, followed by treating hypertensive patients with
200 Stroke

d:/postscript/03-CHAP3_1.3D – 27/1/4 – 9:27
[This page: 201]
Stroke 201
Tab
le33
:E
stim
ate
of
mar
gin
alco
sts
and
ben
efits
of
op
tim
isin
gse
rvic
ep
rovi
sio
nto
pre
ven
tst
rok
e.
Inte
rven
tio
nC
urr
ent
up
tak
e*/1
00,0
00
Est
imat
edo
pti
mal
up
tak
e*/1
00,0
00
Sh
ort
fall
/100
,000
Co
sto
ftr
eatm
ent
per
per
son
/yea
rR
isk
of
stro
ke
off
trea
tmen
t(p
.a.)
Nu
mb
ero
fst
rok
esp
reve
nte
dp
.a.
ifsw
itch
fro
mcu
rren
tto
op
tim
alca
re**
Co
stp
erst
rok
ep
reve
nte
d
Ach
ieve
tigh
tco
ntr
ol
of
BP
of
peo
ple
alre
ady
on
trea
tmen
t
2,71
84
79,
591
6,87
3†
Lo
w£1
9
Hig
h£1
163
29
(dru
gco
sts
on
ly)
0.3%
84
7.2
£18,
095
£110
,476
Tre
ath
yper
ten
sio
nin
peo
ple
no
to
ntr
eatm
ent
9,59
136
,545
26,9
54L
ow
£19
Hig
h£1
16
(dru
gco
sts
on
ly)
0.3%
38.4
£18,
095
£110
,476
An
tico
agu
late
elig
ible
pat
ien
tsin
AF
253
539
286
£70–
803
14
,32
03.
3%3
30
5.6
£3,8
50
Asp
irin
for
pat
ien
tsw
ith
CH
Do
rA
Fn
ot
on
war
fari
n
4,41
07,
000
2,59
0£1
2.9%
21
515
.8£1
64
Asp
irin
po
st-s
tro
ke
945
1,50
055
5£1
6%5
59.
0£6
2
Car
oti
den
dar
tere
cto
my
914
5£1
,940
(co
sts
of
op
erat
ion
on
ly)
17%
ove
r
5yr
s33
10.
35o
ver
5yr
s
£27,
700
No
tes:
*Der
ived
fro
md
ata
inse
ctio
ns
4an
d5;
**d
eriv
edfr
om
risk
red
uct
ion
sq
uo
ted
inse
ctio
n6;
†lo
wes
tim
ate:
der
ived
fro
mco
sto
fge
ner
ic‘o
ld’
anti
hyp
erte
nsi
veag
ents
:th
iazi
des
and
bet
a-b
lock
ers;
hig
hes
tim
ate:
der
ived
fro
mn
ewer
anti
hyp
erte
nsi
veag
ents
.

d:/postscript/03-CHAP3_1.3D – 27/1/4 – 9:27
[This page: 202]
low-cost generic agents (beta-blocker or thiazide), per the British Hypertension Society guidelines (low-
cost option in Table 32).332 The costs of identifying and following up such people are not taken into
account. The former could be minimised if best use is made of the potential for opportunistic screening.
The next priority would be improving access to carotid endarterectomy. Optimising treatment ofhypertensives using newer agents (high-cost option in Table 32) would appear to be a much lower
priority. The most important strategy in terms of reducing the number of strokes is the initiation of
treatment in hypertensive people not currently on medication.
Maximal implementation of all these strategies might be estimated to reduce the incidence of stroke by
about 0.74/1000, which would reduce the total age-adjusted incidence of stroke by about a third. This is
less than the 40% target that has been set by government.8 To achieve these targets, lifestyle factors such as
smoking, physical activity and diet (see Tables 9 and 12) must also be tackled. Population-based
approaches that aim to reduce the level of a risk factor in the whole population rather than simply inhigh risk individuals also need to be considered. For example, Rose estimated that a 5% lowering of blood
pressure in the UK population would result in a 30% reduction in stroke incidence, whereas treating
everyone with a diastolic blood pressure above 100mmHg would only reduce incidence by 15%.147
An analysis of secondary prevention of stroke strategies performed by Hankey and Warlow suggested
that in terms of cost per stroke prevented, simple advice to stop smoking was the most cost-effective
strategy, and carotid endarterectomy the least cost-effective.333 Table 34 summarises their results. In the
table, the relative cost-effectiveness of clopidogrel and carotid endarterectomy have been reversed as
compared with how they appeared in the original publication. This is to compensate for the fact thatendarterectomy is a one-off procedure with long-term benefit, whereas medical therapies need to be long-
term to sustain benefit.
Stroke treatment and rehabilitation
Hankey and Warlow looked at acute treatment strategies – also shown in Table 34. They concluded that the
highest priority should be to establish a stroke unit that delivers organised stroke care through a
202 Stroke
Table 34: Summary of Hankey and Warlow’s analysis of cost (in Aus$) per stroke prevented (secondaryprevention) or per death/dependency avoided (acute stroke treatment) – adapted from Hankey and
Warlow.333
Cost
Acute stroke treatment Stroke unit ?0
Aspirin 83
Thrombolysis with tPA 36,000
Secondary stroke prevention Smoking cessation: advice 0
Diuretics for hypertension 1,350
Aspirin for sinus rhythm 2,000
Anticoagulation for AF > 1,200
ACE inhibitor for hypertension 18,000
Aspirin and dipyridamole for sinus rhythm 18,500
Smoking cessation: nicotine patches 19,600
Statins for hypercholesterolaemia 41,000
Carotid endarterectomy for severe symptomatic
stenosis to prevent one stroke per year for three years
182,000
Clopidogrel for all in sinus rhythm 74,000

d:/postscript/03-CHAP3_1.3D – 27/1/4 – 9:27
[This page: 203]
multidisciplinary team. Since they postulate (rather optimistically) that a stroke unit could be set up by
redistributing existing secondary care resources, this strategy comes out as highly cost-effective, since it has
no additional costs attached to it.
With regard to treatment and rehabilitation, it is more difficult to identify relative priorities, since amore sophisticated outcome measure than strokes avoided needs to be used, and the data that are available
tend to focus on discrete medical treatments rather than patterns of care. Nevertheless, the establishment
of stroke units, as emphasised in the guidelines considered earlier in this section and recommended by
Hankey and Warlow, can be considered a first priority.
Conclusions
The key components of a strategy for primary stroke prevention include: identification and treatment of
hypertension; identification and treatment of atrial fibrillation; careful control of hypertension in diabetes;
lifestyle advice with regard to smoking, diet, weight, and exercise; and treatment with a statin of patients
with known coronary heart disease and elevated cholesterol.
The same issues apply to secondary prevention, but because the risks of subsequent strokes are high,
each is of relatively greater importance and effectiveness. In addition, patients should be on aspirin, oranother antiplatelet agent if aspirin-intolerant. Patients with a TIA or minor stroke should be assessed
rapidly for carotid endarterectomy, which should be performed in a centre with a low complication rate.
This might necessitate use of regional or sub-regional units.
There is consensus that the vast majority of patients with acute stroke should initially be assessed in
hospital. Aspirin is an effective acute treatment for ischaemic stroke, and is preferably administered after
brain imaging has been performed to rule out intracerebral haemorrhage. Thrombolytic therapy is a
reasonable treatment to give in selected patients, but only in specialist centres in a carefully monitored
environment. Further research is required before such a model of care can be ‘rolled out’ to a widerpopulation.
There is strong evidence that acute care and rehabilitation of stroke patients is best carried out in stroke
units that offer an organised, multidisciplinary approach to care. All stroke patients should have access to
such care. The extent to which rehabilitation should be performed in central stroke units and the extent to
which it can be performed as effectively in community settings has to be resolved. Community-based
rehabilitation has not been demonstrated to be as effective as stroke unit care, but it is impractical to expect
existing models of stroke unit care (with an average unit size of 6–15 beds) to cater for the needs of a typical
DGH catchment area. Therefore, locality-based models of intermediate care need to be developed andevaluated.
8 Approaches to audit and outcome measures
Several publications have given advice on the appropriate mechanisms of audit of stroke care, and what
measures to use for this. The purpose of this section is to summarise these recommendations and targets.
Saving Lives: Our Healthier Nation
The target of this government white paper is to reduce the death rate from coronary heart disease and stroke
and related diseases in people under 75 years by at least two-fifths by 2010 – saving 200 000 lives in total.8
Stroke 203

d:/postscript/03-CHAP3_1.3D – 27/1/4 – 9:27
[This page: 204]
This is a useful target for monitoring the overall impact on health of a wide variety of factors. The value
of this indicator is that it broadens the perspective beyond the health services to other factors that influence
health, such as lifestyle and socio-economic circumstances.
The National Service Framework for older people
This includes milestones that the NHS is required to meet in developing stroke services.
� April 2002: Every general hospital which cares for people with stroke will have plans to introduce a
specialised stroke service model from 2004.
� April 2003: Every hospital which cares for people with stroke will have established clinical audit systems
to ensure delivery of the National Clinical Guidelines for stroke care.
� April 2004: PCG/Ts will have ensured that:
� every general practice, using protocols agreed with local specialist services, can identify and treat
patients identified as being at risk of a stroke because of high blood pressure, atrial fibrillation or
other risk factors
� every general practice is using a protocol agreed with local specialist services for the rapid referral
and management of those with transient ischaemic attack (TIA)� every general practice can identify people who have had a stroke and is treating them according to
protocols agreed with local specialist services
� every general practice has established clinical audit systems for stroke.
� April 2004: 100% of all general hospitals which care for people with stroke will have a specialised stroke
service as described in the stroke service model.
Outcome indicators for stroke
A working group for the Department of Health reviewed the possible value of a series of 24 health outcomeindicators for stroke.334 Their recommendations are summarised in Table 35. They categorised the
indicators into five types:
� A: to be implemented generally on a routine basis
� B: to be implemented generally by periodic survey� C: to be implemented where local circumstances allow on a routine basis
� D: to be implemented where local circumstances allow by periodic survey
� E: to be developed further either because the link with effectiveness is not clear or because the indicator
specification is incomplete.
When interpreting variations in health outcome indicators, four major categories of explanation need to
be considered: differences in measurement technique; chance; differences in case-mix; and differences in
quality of care. Process measures (such as use of aspirin) are more sensitive to genuine differences in the
quality of care than outcome measures (such as hospital specific mortality), and are easier to interpret,
provided that there is a proven link between process and outcome.335
204 Stroke

d:/postscript/03-CHAP3_1.3D – 27/1/4 – 9:27
[This page: 205]
Stroke 205
Table 35: Summary of recommendations of working group on health outcome indicators for stroke.
Topic area Indicator Cat
Reduction/avoidance of
risk of first/subsequent
stroke
Incidence of hospitalised stroke
Population-based incidence of stroke
Percentage of GP patients with BP recorded in previous 5 years
A
C
A
Median and inter-quartile range of systolic BP within a GP population B
Percentage of GP patients identified as hypertensive whose most recent
systolic BP is less than 160 mmHg
C
Percentage of GP patients who have a prescription for aspirin therapy at six
months after non-haemorrhagic stroke
B
Percentage of GP patients with atrial fibrillation who have a prescription for
anticoagulant therapy
D
Reduction of death from
stroke
Case fatality rate within 30 days of a hospital admission for stroke
Case fatality rate within 30 days of stroke (in-patient or community-based
treatment)
A
C
Population-based mortality rates A
Reduction/avoidance of
complications from
stroke
Percentage of patients for whom a formal swallowing assessment is
undertaken within 24 hrs of stroke
Incidence of pressure sores during in-patient stay within a hospital population
with stroke
E
A
Percentage of patients within a community provider population who, six
months following stroke, have one or more pressure sores
B
Rate of emergency re-admissions within 30 days of discharge with a diagnosis
of stroke
D
Improving function and
well-being after stroke
Multiprofessional involvement in the week following admission with stroke
Distribution of Barthel ADL score at discharge form hospital with stroke
B
A
Distribution of Barthel ADL score six months after stroke B
Assessment of aphasia six months after stroke E
Assessment of outdoor mobility six months after stroke E
Assessment of social functioning six months after stroke E
Assessment of depression six months after stroke E
Change in Barthel ADL score between discharge and six months after stroke D
Percentage of people admitted with stroke who return to pre-admission
category of residence
A
Percentage of people who live in pre-admission category of residence six
months after stroke
B
Percentage of people not hospitalised living in pre-stroke category of residence
six months after stroke
D
Patients’ or carers’ knowledge of available health and social services – six
months after stroke
E
Patient satisfaction six months after stroke E
Carer burden six months after stroke E

d:/postscript/03-CHAP3_1.3D – 27/1/4 – 9:27
[This page: 206]
The National Sentinel Audit for stroke
The Royal College of Physicians developed an audit tool for stroke under the guidance of the
Intercollegiate Working Party.10 This audit covered the organisation and facilities for treating stroke,
the case-mix of admitted patients, and the process of care with regard to initial assessment, rehabilitation,
secondary prevention, discharge planning, communication with carers, and follow-up and review. This
model of audit provides a useful tool for monitoring the hospital care of stroke patients, offering the
opportunity for comparative data between trusts (as in the national audit that the Royal College of
Physicians carried out), or comparisons within the same trust over time.
9 Research priorities
Prevention of stroke
The NSF is promoting the introduction of care pathways which enable rapid investigation of patients with
possible TIA and minor stroke. Such models have an underlying rationale, but have not been evaluated.
Formal testing would enhance plans to implement this initiative.
Acute stroke treatments
As noted in the Edinburgh Consensus statement: ‘While trials of the efficacy of novel drugs in acute stroke
and secondary prevention are vital, there is an urgent need for greater funding for non-drug treatment and,
in particular, into aspects of stroke service delivery and organisation.’317 While acute drug treatments for
stroke are emerging, such as aspirin and thrombolysis in specific circumstances, there are major non-pharmacological questions to address. These include issues around the general management of acute
stroke patients, such as how intensively they should be monitored, and how early rehabilitation should
start. Cost-effectiveness of different intensities of acute care needs to be evaluated.
Rehabilitation
There is a growing evidence base for stroke rehabilitation. Some of the most important evidence comes
from evaluations of complex packages of care, such as stroke units. It has been argued that studies that are
focused on the specific components of rehabilitation, which include precise definitions of what is involved,
are needed to complement this research.336 Thus, rather than simply asking general research questions
such as: ‘Does physiotherapy improve outcome following stroke?’, more specific questions that detail the
amount and type of physiotherapy, the specific nature of the problem that the physiotherapy is to address
(e.g. shoulder pain), need to be answered.However, there is just as significant a role for research that focuses on the overarching activities and
processes that are central to the nature of rehabilitation.337 Thus, the research agenda should aim to:
� investigate ways to improve goal-setting and assessment
� understand the interrelationships between disease, impairment and contextual factors, and the
interrelationship between disability and participation
� investigate ways of modifying behaviour (i.e. optimising activity) in the context of disabling illness.
206 Stroke

d:/postscript/03-CHAP3_1.3D – 27/1/4 – 9:27
[This page: 207]
Organisation and models of stroke care
While it is clear that stroke units are an effective model for the delivery of hospital-based care for patients
with stroke, stroke units as currently constituted (5–15 bedded units) will not be able to cope with the
stroke workload of a typical DGH (25–35 stroke inpatients at any one time).10 Therefore, new models need
to be developed and evaluated that can offer alternatives to stroke unit care of equal efficacy. These might
include intermediate care facilities, such as community hospitals, locality-based stroke rehabilitation
units, or other community-based facilities such as domiciliary teams and day hospital services. The one
trial that compared hospital stroke unit care to alternative models of multidisciplinary care found thatoutcome was significantly worse in those patients not randomised to stroke unit care, but this trial cannot
be generalised to all settings, or indeed all non-stroke unit models of care. Further trials are needed
comparing different models against what is now the recognised standard of care in an inpatient stroke unit.
Research has tended to focus on treatment of incident rather than prevalent stroke patients, i.e. care in
the first year following stroke, rather than long-term support. Models need to be developed and tested that
provide long-term support to stroke patients. These should include models that are not stroke-specific, but
focus on the more general issues of disability management. The stroke co-ordinator promoted by the NSF
for older people is one such model, but it needs formal evaluation. Another model that has been promotedis regular patient reassessment.338 However, the frequency and nature of these contacts need to be
defined.339 Other models might include general practice-based packages of care for patients identified as
having had past strokes. Development of such models would be timely, given the requirement of the NSF
for general practices to develop stroke registers.
Level of funding of stroke research
Rothwell points out that there are major disparities in the level of research funding, comparing the three
major causes of death and disability in the world: heart disease, cancer and stroke.340 Most research
funding comes from disease-specific charity organisations, non-disease-specific funding bodies (govern-
ment or charity) and from industry (pharmaceutical). Between them, these funding bodies spend
significantly more on research into heart disease and cancer than into stroke. He recommends that
non-disease-specific research funding bodies, such as the Medical Research Council, the Wellcome Trust
and the National Co-ordinating Centre for Health Technology Assessment, should take these disparitiesinto account when deciding upon their own priorities.
Stroke 207

d:/postscript/03-CHAP3_1.3D – 27/1/4 – 9:27
[This page: 208]
Appendix 1: The WHO ICIDH-2 model of illness, now theICF model
The WHO ICIDH model
In 1980 the World Health Organisation (WHO) published an International Classification of Impairments,
Disabilities and Handicaps (ICIDH) which was based upon earlier work.1–3 It was conceived of as being
complementary to the International Classification of Diseases (ICD), which is essentially a classification of
disease (pathology). The ICIDH classification has not been as widely used as the ICD, but there certainly
have been publications both researching into it and using it; Badley4 stated that over 1000 articles had been
published relating to its use at that time.In 2000 a new revision was finalised, and the new classification is known as the International
Classification of Functioning, Disability and Health (ICF) but is still also referred to as the ICIDH-2. It
does not differ greatly in most respects, but it does add one further dimension and it has changed some of
the terminology. The new dimension is one of context; it emphasises that all ill people must be seen within
a context – as described below. The new terminology is to use the words ‘activities’ and ‘participation’ in
place of disability and handicap respectively.
The model is still an incomplete model of illness, especially in missing out the whole domain of
‘quality of life’. It is also not easy to draw distinctions between the levels using the definitions, andthe classification itself is probably not usable in any routine sense. The model currently on the web
site (http://www3.who.int/icf/icftemplate.cfm accessed 29/11/01) has an overview table shown below
(Table A1.1).
208 Stroke
Table A1.1: The ICF overview table.
Functioning and disability Contextual factors
Components Body structures
and functions
Activities and
participation
Environmental
factors
Personal factors
Domains Body structures
Body functions
Life areas
Tasks, actions
External influences
on functioning and
disability
Internal influences
on functioning and
disability
Constructs Change in body
functions
(physiological)
Change in body
structures
(anatomical)
Capacity: Executing
tasks in a standard
environment
Performance: Executing
tasks in current
environment
Facilitating or
hindering impact
of features of the
physical, social and
attitudinal world
Impact of the
attributes of the
person
Positive aspects Functional and
structural integrity
Activities
Participation
Facilitators Not applicable
Impairment Activity limitation
Participation limitation
Barriers/hindrances Not applicable

d:/postscript/03-CHAP3_1.3D – 27/1/4 – 9:27
[This page: 209]
This appendix elaborates on the model, hopefully clarifying it so that it is easily understood. The ideas
put forward here were used as the basis for the National Clinical Guidelines for Stroke, and have been
discussed in other articles5 (Wade 2001). Tables A1.2 and A1.3 give the overview.
Although not explicitly published as a framework for rehabilitation, the WHO ICIDH has beendeveloped as such (see Tables A1.2, below and A1.3 overleaf ). The WHO ICIDH model considers that any
disease (i.e. pathology) may cause or be associated with abnormalities at three higher levels: abnormalities
of the person; alterations in behaviour; and changes in social position. These are referred to respectively as:
impairments; disabilities; and handicaps. (In the ICF they are referred to as: impairments; activitylimitations; and participation limitations.) To make the model more complete one must incorporate
disease or pathology, which refers to abnormalities at the level of the organ. A brief description and
discussion of the four descriptive levels follows. Next the model should incorporate the environment or
context and the ICF does this. Finally quality of life is included in the amended model, drawing on ideasdiscussed by Post et al.6
Stroke 209
Table A1.2: Rehabilitation model – the WHO ICIDH-2 framework.
Level of illness
Term Synonym Comment
Pathology Disease/diagnosis Refers to abnormalities or changes in the structure and/or
function of an organ or organ system
Impairment Symptoms/signs Refers to abnormalities or changes in the structure and/or
function of the whole body set in personal context
Activity
(was disability)
Function/observed
behaviour
Refers to abnormalities, changes or restrictions in the interaction
between a person and his/her environment or physical context(i.e. changes in the quality or quantity of behaviour)
Participation
(was handicap)
Social positions/roles Refers to changes, limitations, or ‘abnormalities’ in the positionof the person in their social context
Contextual factors
Domain Examples Comment
Personal Previous illness Primarily refers to attitudes, beliefs and expectations often
arising from previous experience of illness in self or others, but
also to personal characteristics
Physical House, local shops, carers Primarily refers to local physical structures but also includes
people as carers (not as social partners)
Social Laws, friends, family Primarily refers to legal and local cultural setting, including
expectations of important others
Note: This model is usually prefaced with the words: ‘In the context of illness, . . . ’.

d:/postscript/03-CHAP3_1.3D – 27/1/4 – 9:27
[This page: 210]
210 Stroke
Table A1.3: Expanded model of illness.
System Experience/location:
Subjective/internal Objective/external
Level of illness
Person’s organpathology
DiseaseLabel attached by person, usually
on basis of belief
DiagnosisLabel attached by others, usually on
basis of investigation
Person’s bodyimpairment
SymptomsSomatic sensation, experienced
moods, thoughts, etc.
SignsObservable abnormalities (absence
or change), explicit or implicit
Person in environmentbehaviour
Perceived abilityWhat person feels they can do, and
feeling about quality of
performance
Disability/activitiesWhat others note person does do,
quantification of that performance
Person in societyroles
Role satisfactionPerson’s judgement (valuation) of
their own role performance (what
and how well)
Handicap/participationJudgement (valuation) of important
others (local culture) on role
performance (what and how well)
Context of illness
Internal,personal context
PersonalityPerson’s beliefs, attitudes,
expectations, goals, etc.
Past historyObserved/recorded behaviour prior
to and early on in this illness
External,physical context
SaliencePerson’s attitudes towards specific
people, locations, etc.
ResourcesDescription of physical (buildings,
equipment, etc.) and personal
(carers, etc.) resources available
External,social context
Local cultureThe people and organisations
important to person, and their
culture, especially family and people
in same accommodation
SocietyThe society lived in and the laws,
duties and responsibilities expected
from and the rights of members of
that society
Totality of illness
Quality of lifeSummation of effects
HappinessPerson’s assessment of and reaction
to achievement or failure of
important goals and sense of being
a worthwhile person
StatusSociety’s judgement on success in
life; material possessions

d:/postscript/03-CHAP3_1.3D – 27/1/4 – 9:27
[This page: 211]
Pathology
Much illness can be traced to abnormalities within organs in the body. Organs may function abnormally
for several reasons. Trauma may cause destruction of part or all of the organ. Disruption of the blood
supply may cause reduced function or complete death of some of the organ. Micro-organisms may damage
or destroy part or all of the organ. The cells of the organ may change their function due to alterations in
their genetic control, causing (for example) tumour formation or the production of more or less of their
normal product. In nerve cells especially, the properties of the cell membrane might be altered subtly so
that the cell changes its behaviour. In all these ways, and in many other ways, the function of the organ canbe disturbed.
Within this level there are of course many sub-divisions and categorisations. Some of the categories
relate to presumed aetiology: congenital or acquired; due to infectious agents or physical agents, etc. Some
classifications give biochemical detail, others give structural detail, and yet others give macroscopic details.
However the common feature is that all these sub-categories are within the organ, and often within the cell.
Impairment
Just as cells and tissues come together to form unitary structures known as organs, so organs and organsystems (such as the cardiovascular system or endocrine system) come together to form a single structure,
the organism or body. Abnormalities that arise at the level of the organism are referred to as impairments.
Individual impairments may arise from more than one pathology. More importantly, some patients may
only experience an impairment when they have two or more pathologies; this appearance of abnormalities
independent of specific components is the essence of a higher order system. For example osteoarthritis of a
hip may be asymptomatic until there is extra stress upon the hip, as might occur if the patient has a stroke
(a second pathology) or moves to live somewhere where she can only have a bath, not a shower (an
environmental or contextual change).
Disability, or functional limitations
The third level to be affected is the interaction that occurs between a person and his or her environment.
This interaction is best described as behaviour. The WHO ICIDH refers to change in the third level as
disability (or now refers to it more accurately as activity limitations). The other phrase used by many
people to refer to changes in behaviour is the functional consequences of a disease. In practice the changes
are almost always measured or conceived of in terms of dependence, either upon other people or upon
special equipment.Disability is therefore considered to refer to alterations in the quality or quantity of an individual’s goal-
directed behaviour, or their activities. In other words, a person may need to change the way they achieve
their goals, or may achieve them more slowly, or may depend upon special equipment, or may not be able
to achieve them at all. All these changes are ‘disabilities’, although they are more accurately and
appropriately referred to as changes in behaviour or activity at the level of disability.
Handicap
Handicap is the most difficult concept to define and measure. It is best considered as referring to changes inor restrictions on the person’s social position and social role functioning in some way. Handicap is
ultimately a personal matter. How someone feels changed or restricted by their illness in terms of their
social position and social role functioning can only be judged by that individual in conjunction with the
people who are directly involved with that person.
Stroke 211
d:/postscript/03-CHAP3_1.3D – 27/1/4 – 9:27
[This page: 212]
The revised ICIDH refers to this level as the level of participation, and this also emphasises the fact that
this level refers to or describes the person’s participation in or involvement in social (culturally
determined, personally important) activities.
A simplified analysis
This model can easily be simplified, and perhaps clarified in the following way. The fundamental unit of
behaviour is the individual (human) person. Abnormalities in that person’s organs or an abnormality of
the organism itself therefore directly affect the ‘behavioural unit’, restricting or altering its abilities.
Therefore pathology and impairment form one level concerning the individual person who then interacts
with his/her environment.
The observed behaviour (i.e. the interaction between the person and his/her environment) can then beanalysed in two ways. The first is descriptively, usually focusing on independence and normality, where
change is referred to as disability. The second is in terms of the meaning attached to that behaviour by the
person and by others, where any change in the meaning attributed to behaviour (which may itself have
changed) may be referred to as handicap. The ICF implicitly recognises this distinction, putting body
structures and functions together and activities and participation together (Table A1.1).
Context
The revised ICIDH has added a vital further dimension, that of context. As soon as one considers
behaviour and participation in society, it is necessary to consider not only the individual but their
environment. Furthermore, one cannot only consider the physical environment but one must also
consider the personal environment (other people), the legal environment, and the cultural environment
(expectations of relevant other people). The WHO ICIDH also considers, correctly, that the person’s ownpersonal history is an important part of the context.
Thus, for simplicity, the context of an illness can be divided into three:
� personal: the individual’s own previous experiences and current expectations� physical: the structures around the person, both near and far
� social: the influence of other people including the influence of society as manifest in its laws and
customs.
This may be too simple, but it does cover the main areas and it does emphasise that one must look wellbeyond the disease itself when considering its management.
Summary and conclusion
In summary, illness can be analysed thus. A person is a behavioural unit, and changes within the person
(i.e. pathology) may affect the person’s range of intrinsic functions and skills (i.e. give impairments),
thereby influencing and constraining his behaviour and behavioural repertoire. However, while the person
lives, s/he will interact with the environment. The behaviour can be observed and described, which
constitutes the description at the level of ‘disability’; furthermore, that behaviour will have meaning
attributed to it by the person and by relevant others, which then constitutes the person’s state at the level of
handicap.
It must be emphasised that the WHO ICF is a descriptive model. Its whole intention is to allow adescription and classification of an individual’s state or circumstances. This is necessary for rehabilitation,
but not sufficient. Several other factors need to be considered when analysing a patient’s situation. These
include the context of the illness (i.e. the past history of the illness, the patient’s stage in life, the family’s
involvement), the patient’s desires or life philosophy, and the patient’s reactions to the illness.
212 Stroke

d:/postscript/03-CHAP3_1.3D – 27/1/4 – 9:27
[This page: 213]
Furthermore, the clinicians must take into account the context of the person: the physical environment,
the personal environment, the local social facilities, financial considerations, the legal situation, etc. A
comprehensive awareness of illness needs to recognise these ‘hidden variables’.
General insights from the model
This model is not simply of academic interest: it leads to many useful insights. Although hopefully many of
these will be apparent, a brief resume of the more important lessons will be given here.
Time, and the focus of attention
Initially, in managing any illness, it is both necessary and correct to devote most resources to establishing
the underlying pathology (if any), because there may be specific treatments available. Furthermore, the
pathology has a major influence on determining prognosis. However, even in the initial stages changes in
behaviour are important; for example, the patient may need care (usually nursing care) because of
dependence (i.e. disability).
Once the pathology is established and treated, attention should rapidly switch to the level of disability.At first, this attention may relate to the patient, but soon attention must broaden to include the patient’s
normal (home) environment (family, house, etc.). Later still, the focus of attention should be move on to
consider social roles (i.e. handicap) and to investigate the social environment.
An important corollary of this change in focus over time is an exponential increase in timescales.
Pathologically-centred processes occur in short timescales – minutes, hours or, at most, days. Processes
relating to behaviour take weeks, months or years to be complete. And processes relating to handicap may
take years, decades or even centuries to finish, because they often involve changing society as much as
changing the person.
Patient and environment
This model forcibly reminds us that patients are people, coming from their own physical and social
environment. Therefore, as attention moves from pathology to handicap, so attention must move from the
ill individual to the physical, personal and social environment of that individual. Disability and handicap
can only be considered in the context of the individual person’s own environment – their family, their
friends, their workmates, their home, etc. Rehabilitation must take this into account.
Hospital systems
Hospitals have increasingly had to cope with a mixture of processes, some relating to pathology and some
relating to disability. This mixing of pathologically-centred processes with behaviour-centred processes
leads to an obvious conflict between two different systems, because the former takes place in a short
timescale, the latter in a long timescale. In other words, there are two systems (pathological diagnosis/
treatment, and disability diagnosis/treatment) trying to run at greatly different speeds within a single
system (the hospital). The conflicts are obvious; patients are usually labelled ‘bed-blockers’ or ‘patientswith social problems’.
Furthermore, hospitals provide an environment quite alien to most people, and certainly divorced from
a patient’s reality. Therefore, it is difficult to judge or treat disability accurately in a hospital setting,
especially when considering any behaviour beyond the most basic, such as feeding.
Stroke 213

d:/postscript/03-CHAP3_1.3D – 27/1/4 – 9:27
[This page: 214]
One solution may be for hospitals to disentangle the two major processes occurring here, having
relatively few beds devoted to high-speed, high-tech medicine and surgery and a much greater number of
beds in a separate location devoted to recuperation and (where needed) active rehabilitation. These might
be termed ‘complex care wards’.
Interventions
It seems logical, and it is probably true, that interventions will be more effective the closer they are to the
root cause of an illness. In other words, where an illness can be traced to a specific pathology, it is
considered more efficient to ‘cure’ that pathology than to give symptomatic treatment (i.e. to treat
impairments). However, it is important to remember that the price of achieving a cure of the pathology
may sometimes be a much higher level of impairment, disability or handicap.
The model also reminds us that interventions should not only be directed at the patient. It is often more
important and more effective to alter the environment. This might include: rehousing; providing a
wheelchair; teaching relatives how to transfer the patient; and teaching work colleagues how tocommunicate with the individual. It may also include changing the environment to reduce or remove
factors causing the illness itself, for example, increasing the tax on cigarettes or alcohol.
Loose relationships
It must be emphasised that, though the various systems interact with each other, the relationships are only
general and are not tight. In other words, in most instances a fixed pathological lesion does not equate with
a defined impairment; a defined impairment does not equate with a definite level of dependence; nor does
a specific level of disability equate to a fixed handicap. There are major opportunities for clinically silent
pathology, impairment or disability.Equally importantly, the effects of abnormalities can jump levels. For example, a right hemianopia (an
impairment) may cause no disability, but if the person is a car driver then the person may lose their driving
licence and hence their job. The fact that the effects of any specific pathology, impairment or disability can
vary so much means that there is ample opportunity for intervention to ameliorate the consequences.
The nature and strength of the interrelationships between the different levels of illness has only recently
been investigated to a significant degree.7–10 There is an urgent need to investigate these relationships
systematically, especially to study the importance and effects of any interaction between different
impairments, so that rehabilitation interventions can be more rationally targeted.11,12 The effects ofintervening variables also need to be researched.13
Measures
Many measures used in health care consist of two or more items which are amalgamated to form a single
scale or score. Much has been written about the process of constructing health measures.14–16 This model
emphasises two specific considerations.
The component items of a measure should all relate to (come from) the same level. Some measures fail
to observe this rule, and their validity and utility must be questionable. One widely used measure illustrates
this. The Oxford Handicap Scale17 contains one question on impairment (‘Does the patient have anyresidual symptoms?’) and most of the other questions concentrate upon reduced mobility (a disability).
The scale does not touch on handicap despite its name. Any measure which mixes items from different
levels, for example, pathology items with impairment items, or impairment items with disability items,
must be considered intrinsically invalid.14
214 Stroke

d:/postscript/03-CHAP3_1.3D – 27/1/4 – 9:27
[This page: 215]
Secondly, when evaluating a service, one must choose measures that assess outcome at the appropriate
level. The levels of interest to most patients are those of handicap and disability. Another area of interest is
that of well-being, which is probably close to quality of life.
Observation versus implication
Another way to consider the model is in terms of those characteristics of an illness that can be observed,
and are externally verifiable, and those characteristics which are simply deduced or implied.
All behaviour is externally observable and thus objective and verifiable. We can state whether someone
does actually dress independently, walk fast, talk, undertake work, etc. Opinions may vary on the quality of
the behaviour (e.g. its standard), but there is external evidence which can (for example) be recorded on a
videotape.Opinions may differ significantly about the reasons for the observed abnormalities and also about
whether someone ‘should’ be more or less competent. Nonetheless, measures of disability are usually
objective, provided those measures record actual behaviour observed in the relevant setting and do not
attempt to qualify the observations or to interpret them.
Handicap, in contrast, is almost all implied; most of the ideas are externally imposed constructs. We may
say externally that we believe that an individual is acting the roles of mother, wife and housekeeper. The
person concerned, however, may see herself as a servant and slave, or as a boss, or in other ways (e.g. as a
daughter). There is no externally verifiable truth.A few impairments may be externally observable. For example, a reduced range of passive movement or a
facial disfigurement are both easily verified externally. However, most are implied constructs, particularly
in the field of neurology. Weakness (reduced voluntary motor power) is perhaps objective but the label
applied (e.g. upper motor neurone weakness) is often a construct deduced from other evidence. Often,
there is little disagreement with such an obvious label as weakness (though pain in the limb may contribute
to the weakness), but other frequently used labels such as spastic weakness, apraxia, spasticity, or neglect
are all much less certain.
Furthermore, in neurological practice, many of the impairments are deduced from behaviouralobservations, even if the behaviour is controlled and constrained so as to highlight postulated impairments.
For example, neglect may be diagnosed as a result of performance (behaviour) on a series of tests (a test
battery), or aphasia after performance on another series of tests. However, it is well recognised that other
impairments can cause failure on the tests: blindness is an obvious example; neglect can cause a reduced
score on some tests of aphasia;18 and aphasia makes it difficult to test visual fields and many other areas.
Thus, this model suggests that, contrary to popular belief, measures of disability are generally objective,
whereas statements about pathological diagnosis and symptoms and signs are often much more subjective,
depending upon deductions made by an observer who may be biased. Studies on the reliability of objectiveneurological examination of patients after stroke emphasise the unreliable (subjective) nature of many of
these observations.19,20
Normality
Most measures assume a normal state, usually as a standard against which the patient is judged. However,
it is often difficult to know what is normal in many situations. At the level of disability, the concept of
normal becomes almost redundant. In Western culture at least, most people take personal responsibilityfor dressing, feeding, toileting and walking, but the individual chooses almost all other behaviour, and may
choose not to undertake many behaviours (e.g. cooking, driving a car). At the level of handicap, it must be
accepted that role performance is unique and can only be compared with the individual’s past roles and
with the expectations of the person and their social circle (family, friends, colleagues, etc.).
Stroke 215

d:/postscript/03-CHAP3_1.3D – 27/1/4 – 9:27
[This page: 216]
Therefore, the term normal is difficult to use. It may be better to talk instead of change, and sometimes
the actual state will fall outside generally accepted normal limits for that individual. For some items no
normal limits will exist; for some they will depend upon personal, cultural or other characteristics; and for
some the limits will be quite closely defined and will be common to more or less everyone.
Prognosis
Prognosis is usually related to the pathology because the pathology determines the prognostic field for that
illness. If two people have foot drop, the prognosis will be different if one has motor neurone disease and
the other a recent stroke. Within a disease group there will be differences between patients, but knowing
the pathology will enable one to determine the correct prognostic items.
Therefore, it is essential to know pathology when giving a prognosis, both because it determines theprognosticfieldandbecause itoftendetermineswhichobservationscanbeusedasspecificprognostic factors.
Thus, in terms of the model, a change in one system (at one level) may not determine specific changes at
other levels but may nonetheless have a pervasive influence upon future performance in other levels.
The rehabilitation team
The successful management of an illness requires involvement and intervention at all levels affected by that
illness. Once a stroke has stabilised, all other factors up to and including housing and employment need to
be considered and acted upon. If not, the management of the illness will not be considered successful by the
patient.
Therefore this model shows that the team of people needed to help anyone with an illness is likely to
include a wide range of professions so that all aspects of the illness can be covered. Furthermore, in chronic
illness it is likely that any effective team will normally span a variety of agencies and departments, such ashealth, social services, employment, education and housing (depending upon the country).
Patient goals
This model reminds us that, when considering rehabilitation, it is vital to take into account the goals of the
patient. Indeed, it is often also important to take into account the goals of the family and sometimes the
goals of other carers, funding agencies, etc.
The vocabulary
It is noticeable that the terms used (pathology, impairment, disability and handicap) are all negative. They
all relate to the abnormal state. They do not have positive counterparts. None of the terms used now started
with their current meaning.
216 Stroke

d:/postscript/03-CHAP3_1.3D – 27/1/4 – 9:27
[This page: 217]
References
1 Nagi S. An epidemiology of disability among adults in the USA. MMFQ/Health and Society, 1976,
pp. 439–67.
2 Duckworth D. The need for a standard terminology and classification of disablement. In: Granger CV,
Gresham GE (eds). Functional Assessment in Rehabilitation Medicine. Baltimore: Williams and Wilkins,
1984, pp. 1–13.
3 Granger CV. A conceptual model for functional assessment. In: Granger CV, Gresham GE (eds).Functional Assessment in Rehabilitation Medicine. Baltimore: Williams and Wilkins, pp. 14–25.
4 Badley EM. An introduction to the concepts and classifications of the international classification of
impairments, disabilities and handicaps. Disability and Rehabilitation 1993; 15: 161–78.
5 Wade DT, de Jong BA. Recent advances in rehabilitation. BMJ 2000; 320: 1385–8.
6 Post MWM, de Witte LP, Schrijvers AJP. Quality of life and the ICIDH: towards an integrated
conceptual model for rehabilitation outcomes research. Clinical Rehabilitation 1999; 13: 5–15.
7 Farmer JE, Eakman AM. The relationship between neuropsychological functioning and instrumental
activities of daily living following acquired brain injury. Applied Neuropsychology 1995; 2: 107–15.8 Heinemann AW, Linacre JM, Wright BD, Hamilton BB, Granger C. Relationships between
impairment and physical disability as measured by the Functional Independence Measure. Archives
of Physical Medicine and Rehabilitation 1993; 74: 566–73.
9 McSweeny AJ, Grant I, Heaton RK, Prigitano GP, Adams KM. Relationship of neuropsychological
status to everyday functioning in healthy and chronically ill persons. Journal of Clinical and
Experimental Neuropsychology 1985; 7: 281–91.
10 Wade DT, Legh-Smith J, Langton Hewer R. Depressed mood after stroke: a community study of its
frequency. British Journal of Psychiatry 1987; 151: 200–5.11 Wade DT. Epidemiology of disabling neurological disease: how and why does disability occur? Journal
of Neurology, Neurosurgery, and Psychiatry 1996; 61: 242–9.
12 Whyte J. Toward a methodology for rehabilitation research. American Journal of Physical Medicine and
Rehabilitation 1994; 73: 428–35.
13 Peters DJ. Disablement observed, addressed, and experienced: integrating subjective experience into
disablement models. Disability and Rehabilitation 1996; 18: 593–603.
14 Wade DT. Measurement in Neurological Rehabilitation. Oxford: Oxford University Press, 1992.
15 Bowling A. Measuring Disease. Buckingham: Open University Press, 1995.16 McDowell I, Newell C. Measuring Health. A Guide to Rating Scales and Questionnaires. Oxford: Oxford
University Press, 1987.
17 van Swieten JC, Koudstall PJ, Visser MC, Schouten HJA, van Gijn J. Interobserver agreement for the
assessment of handicap in stroke patients. Stroke 1988; 19: 604–77.
18 Al-Khawaja I, Wade DT, Collin CF. Bedside screening for aphasia: a comparison of two methods.
Journal of Neurology 1996; 243: 201–4.
19 Tomasello F, Mariana F, Fieschi C et al. Assessment of interobserver differences in the Italian
multicentre study on reversible cerebral ischaemia. Stroke 1982; 13: 32–4.20 Goldstein LB, Bertels C, Davis JN. Interrater reliability of the NIH stroke scale. Archives of Neurology
1989; 46: 660–2.
Stroke 217
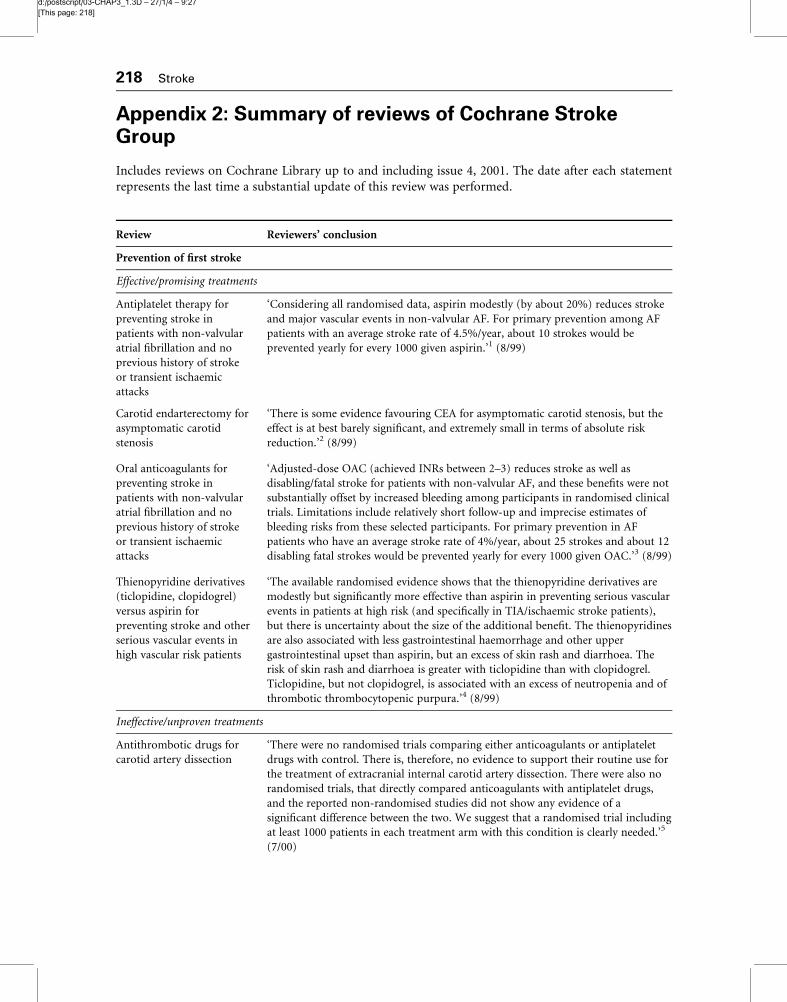
d:/postscript/03-CHAP3_1.3D – 27/1/4 – 9:27
[This page: 218]
218 Stroke
Appendix 2: Summary of reviews of Cochrane StrokeGroup
Includes reviews on Cochrane Library up to and including issue 4, 2001. The date after each statement
represents the last time a substantial update of this review was performed.
Review Reviewers’ conclusion
Prevention of first stroke
Effective/promising treatments
Antiplatelet therapy for
preventing stroke in
patients with non-valvular
atrial fibrillation and no
previous history of stroke
or transient ischaemic
attacks
‘Considering all randomised data, aspirin modestly (by about 20%) reduces stroke
and major vascular events in non-valvular AF. For primary prevention among AF
patients with an average stroke rate of 4.5%/year, about 10 strokes would be
prevented yearly for every 1000 given aspirin.’1 (8/99)
Carotid endarterectomy for
asymptomatic carotid
stenosis
‘There is some evidence favouring CEA for asymptomatic carotid stenosis, but the
effect is at best barely significant, and extremely small in terms of absolute risk
reduction.’2 (8/99)
Oral anticoagulants for
preventing stroke in
patients with non-valvular
atrial fibrillation and no
previous history of stroke
or transient ischaemic
attacks
‘Adjusted-dose OAC (achieved INRs between 2–3) reduces stroke as well as
disabling/fatal stroke for patients with non-valvular AF, and these benefits were not
substantially offset by increased bleeding among participants in randomised clinical
trials. Limitations include relatively short follow-up and imprecise estimates of
bleeding risks from these selected participants. For primary prevention in AF
patients who have an average stroke rate of 4%/year, about 25 strokes and about 12
disabling fatal strokes would be prevented yearly for every 1000 given OAC.’3 (8/99)
Thienopyridine derivatives
(ticlopidine, clopidogrel)
versus aspirin for
preventing stroke and other
serious vascular events in
high vascular risk patients
‘The available randomised evidence shows that the thienopyridine derivatives are
modestly but significantly more effective than aspirin in preventing serious vascular
events in patients at high risk (and specifically in TIA/ischaemic stroke patients),
but there is uncertainty about the size of the additional benefit. The thienopyridines
are also associated with less gastrointestinal haemorrhage and other upper
gastrointestinal upset than aspirin, but an excess of skin rash and diarrhoea. The
risk of skin rash and diarrhoea is greater with ticlopidine than with clopidogrel.
Ticlopidine, but not clopidogrel, is associated with an excess of neutropenia and of
thrombotic thrombocytopenic purpura.’4 (8/99)
Ineffective/unproven treatments
Antithrombotic drugs for
carotid artery dissection
‘There were no randomised trials comparing either anticoagulants or antiplatelet
drugs with control. There is, therefore, no evidence to support their routine use for
the treatment of extracranial internal carotid artery dissection. There were also no
randomised trials, that directly compared anticoagulants with antiplatelet drugs,
and the reported non-randomised studies did not show any evidence of a
significant difference between the two. We suggest that a randomised trial including
at least 1000 patients in each treatment arm with this condition is clearly needed.’5
(7/00)

d:/postscript/03-CHAP3_1.3D – 27/1/4 – 9:27
[This page: 219]
Review Reviewers’ conclusion
Treatment of acute stroke
Effective/promising treatments
Antiplatelet therapy for
acute ischaemic stroke
‘Antiplatelet therapy with aspirin, 160 to 300 mg daily, given orally (or per rectum
in patients who cannot swallow), and started within 48 hours of onset of presumed
ischaemic stroke reduces the risk of early recurrent ischaemic stroke without a
major risk of early haemorrhagic complications and improves long-term outcome.’6
(5/99)
Thrombolysis for acute
ischaemic stroke
‘Thrombolytic therapy increases deaths within the first 7 to 10 days, and deaths
at final follow-up. Thrombolytic therapy also significantly increases symptomatic
and fatal intracranial haemorrhage. These risks are offset by a reduction in
disability in survivors, so that there is, overall, a significant net reduction in the
proportion of patients dead or dependent in activities of daily living. The data
from trials using intravenous recombinant tissue Plasminogen Activator (tPA),
from which there is the most evidence on thrombolytic therapy so far, suggest
that it may be associated with less hazard and more benefit. There was
heterogeneity between the trials and the optimum criteria to identify the
patients most likely to benefit and least likely to be harmed, the agent, dose,
and route of administration, are not clear. The data are promising and may
justify the use of thrombolytic therapy with intravenous recombinant tPA in
experienced centres in selected patients. However, the widespread use of
thrombolytic therapy in routine clinical practice at this time cannot be
supported. Further trials will be needed to identify which patients are
most likely to benefit from treatment and the environment in which it
may best be given, before thrombolytic therapy should be adopted on
a wider scale.’7 (7/99)
Ineffective/unproven treatments
Anticoagulants for acute
ischaemic stroke
‘Immediate anticoagulant therapy in patients with acute ischaemic stroke is
not associated with net short- or long-term benefit. The data from this review
do not support the routine use of any type of anticoagulant in acute ischaemic
stroke.’8 (2/99)
Calcium antagonists for
acute ischaemic stroke
‘No evidence is available to justify the use of calcium antagonists in patients with
acute ischaemic stroke.’9 (10/99)
Cooling therapy for acute
stroke
‘There is currently no evidence from randomised trials to support the routine use
of physical or chemical cooling therapy in acute stroke. Since experimental studies
showed a neuroprotective effect of hypothermia in cerebral ischaemia, and
hypothermia appears to improve the outcome in patients with severe closed head
injury, trials with cooling therapy in acute stroke are warranted.’10 (5/99)
Corticosteroids for acute
ischaemic stroke
‘There is not enough evidence to evaluate corticosteroid treatment for people with
acute presumed ischaemic stroke.’11 (10/98)
Fibrinogen-depleting agents
for acute ischaemic stroke
‘Although ancrod appears to be promising, it is not possible to draw reliable
conclusions from the available data.’12 (11/96)
Gangliosides for acute
ischaemic stroke
‘There is not enough evidence to conclude that gangliosides are beneficial in acute
stroke. Caution is warranted because of reports of sporadic cases of Guillain-Barre
syndrome after ganglioside therapy.’13 (8/00)
Stroke 219

d:/postscript/03-CHAP3_1.3D – 27/1/4 – 9:27
[This page: 220]
220 Stroke
Review Reviewers’ conclusion
Treatment of acute stroke
Ineffective/unproven treatments Continued.
Glycerol for acute stroke ‘This systematic review suggests a favourable effect of glycerol treatment on short-
term survival in patients with probable or definite ischaemic stroke but the
magnitude of the treatment effect may be minimal (as low as a 3% reduction in
odds). Due to the relatively small number of patients and that the trials have been
performed in the pre-CT era, the results must be interpreted cautiously. The lack of
evidence of benefit in long-term survival does not support the routine or selective
use of glycerol treatment in patients with acute stroke.’14 (5/00)
Haemodilution for acute
ischaemic stroke
‘The overall results of this review are compatible both with a modest benefit and a
moderate harm of haemodilution therapy for acute ischaemic stroke. As used in the
randomised trials, this therapy has not been proven to improve survival or
functional outcome.’15 (8/99)
Interventions for
deliberately altering blood
pressure in acute stroke
‘There is not enough evidence to evaluate the effect of altering blood pressure on
outcome during the acute phase of stroke. Oral CCBs, ACE inhibitors and glyceryl
trinitrate all appear to lower blood pressure in patients with acute stroke.’16 (2/01)
Interventions for dysphagia
in acute stroke
‘Too few studies have been performed, and these have involved too few patients.
PEG feeding may improve outcome and nutrition as compared with NGT feeding.
Further research is required to assess how and when patients are fed, and the effect
of swallowing or drug therapy on dysphagia.’17 (3/99)
Low molecular weight
heparins or heparinoids
versus standard
unfractionated heparin for
acute ischaemic stroke
‘Low molecular weight heparin or heparinoid appear to decrease the occurrence of
deep vein thrombosis compared to standard unfractionated heparin, but there are
too few data to provide reliable information on their effect on other important
outcomes, including death and intracranial haemorrhage.’18 (8/01)
Mannitol for acute stroke ‘There is currently not enough evidence to decide whether the routine use of
mannitol in acute stroke would result in any beneficial or harmful effect. The
routine use of mannitol in all patients with acute stroke is not supported by any
evidence from randomised controlled clinical trials. Further trials are needed to
confirm or refute the routine use of mannitol in acute stroke.’19 (10/00)
Nitric oxide donors
(nitrates), L-arginine, or
nitric oxide synthase
inhibitors for acute
ischaemic stroke
‘There is currently no evidence from randomised trials on the effects of nitric oxide
donors, L-arginine, or nitric oxide synthase inhibitors in patients with acute
ischaemic stroke.’20 (8/97)
Pentoxifylline,
propentofylline and
pentifylline for acute
ischaemic stroke
‘There is not enough evidence to assess the effectiveness and safety of
methylxanthines after acute ischaemic stroke.’21 (6/96)
Piracetam for acute
ischaemic stroke
‘There is some suggestion of an unfavourable effect of piracetam on early death, but
this may have been caused by baseline differences in stroke severity in the trials.
Piracetam does not appear to reduce dependency for stroke patients.’22 (1/99)
Prostacyclin and analogues for acute ischaemic stroke

d:/postscript/03-CHAP3_1.3D – 27/1/4 – 9:27
[This page: 221]
Stroke 221
‘Too few patients have been studied in randomised trials to allow conclusions to be drawn about the effect of
prostacyclin treatment on survival of people with acute stroke.’23 (1/98)
Review Reviewers’ conclusion
Treatment of acute stroke
Ineffective/unproven treatments Continued.
Surgery for primary
supratentorial intracerebral
haemorrhage
‘There is not enough evidence to evaluate the effect of craniotomy or stereotactic
surgery, or endoscopic evacuation in patients with supratentorial intracerebral
haematoma.’24 (12/98)
Theophylline,
aminophylline, caffeine and
analogues for acute
ischaemic stroke
‘There is not enough evidence to assess whether theophylline or its analogues
reduce mortality or morbidity, or are safe, in people with acute ischaemic stroke.’25
(3/99)
Thrombolysis (different
doses, routes of
administration and agents)
for acute ischaemic stroke
‘There is not enough evidence to conclude whether lower doses of thrombolytic
agents might be safer or more effective than higher doses in acute ischaemic stroke.
It is not possible to conclude whether one agent might be better than another, or
which route of administration might be best. No comparative data for
streptokinase have been found.’26 (4/98)
Tirilazad for acute
ischaemic stroke
‘Tirilazad mesylate increased the combined end-point of ‘death or disability’ by
about one-fifth, but did not alter case fatality, when given to patients with acute
ischaemic stroke. Although further trials of tirilazad are now not warranted,
analysis of individual patient data from the trials may help elucidate why tirilazad
appears to worsen outcome in acute ischaemic stroke.’27 (7/01)
Vasoactive drugs for acute
stroke
‘There is not enough evidence reliably to evaluate the effect of altering blood
pressure on outcome after acute stroke. CCBs, beta-blockers, and probably ACE
inhibitors, prostacyclin and nitric oxide, each lowered BP during the acute phase of
stroke. In contrast, magnesium, naftidrofuryl and piracetam had little or no effect
on BP.’28 (4/00)
Vinpocetine for acute
ischaemic stroke
‘There is not enough evidence to evaluate the effect of vinpocetine on survival or
dependency of patients with acute stroke.’29 (7/97)
Treatment of sub-arachnoid haemorrhage
Effective/promising treatments
Calcium antagonists for
aneurysmal sub-arachnoid
haemorrhage
‘Calcium antagonists reduce the proportion of patients with poor outcome and
ischaemic neurological deficits after aneurysmal SAH; the risk reduction for case
fatality alone is not statistically significant. The results for ‘poor outcome’ are
statistically robust, but depend mainly on trials with oral nimodipine; the evidence
for nicardipine and AT877 is inconclusive. The intermediate factors through which
nimodipine exerts its beneficial effect after aneurysmal SAH remain uncertain.’30
(7/99)
Ineffective/unproven treatments
Antifibrinolytic therapy for
aneurysmal sub-arachnoid
haemorrhage
‘Antifibrinolytic treatment does not appear to benefit people with aneurysmal sub-
arachnoid haemorrhage. However, the trials were all done more than 10 years ago.
New strategies may counteract the ischaemia-inducing potential of antifibrinolytic
treatment and lead to improved outcome. A trial of combined antifibrinolytic and
anti-ischaemia treatment is underway.’ (7/98)
Circulatory volume expansion for aneurysmal sub-arachnoid haemorrhage

d:/postscript/03-CHAP3_1.3D – 27/1/4 – 9:27
[This page: 222]
222 Stroke
The effects of volume expansion therapy have not been studied properly in patients with aneurysmal sub-
arachnoid haemorrhage. At present, there is no sound evidence for or against the use of volume expansion therapy
in patients with aneurysmal sub-arachnoid haemorrhage.31 (7/99)
Review Reviewers’ conclusion
Treatment of sub-arachnoid haemorrhage
Ineffective/unproven treatments Continued.
Timing of surgery for
aneurysmal sub-arachnoid
haemorrhage
‘Based upon the limited randomised controlled evidence available, the timing of
surgery was not a critical factor in determining outcome following a sub-arachnoid
haemorrhage. Since the publication of the only randomised controlled study in
1989, techniques for the treatment of sub-arachnoid haemorrhage have progressed,
questioning the validity of the conclusions in the modern era. Currently, most
neurovascular surgeons elect to operate within 3 or 4 days of the bleed in good
grade patients to minimise the chances of a devastating re-bleed. However, the
treatment of patients in poorer grades warrants further scrutiny in a randomised
controlled trial.’32 (11/00)
Secondary prevention of stroke
Effective/promising treatments
Anticoagulants for
preventing stroke in
patients with non-
rheumatic atrial fibrillation
and a history of stroke or
transient ischaemic attacks
‘The evidence suggests that anticoagulants are beneficial, without serious adverse
effects, for people with non-rheumatic atrial fibrillation and recent cerebral
ischaemia.’33 (2/95)
Anticoagulants versus
antiplatelet therapy for
preventing stroke in
patients with non-
rheumatic atrial fibrillation
and a history of stroke or
transient ischaemic attacks
‘The evidence from one trial suggests that anticoagulant therapy can benefit people
with non-rheumatic atrial fibrillation and recent cerebral ischaemia. Aspirin may be
a useful alternative if there is a contraindication to anticoagulant therapy. The risk
of adverse events appears to be higher with anticoagulant therapy than aspirin.’34
(2/95)
Antiplatelet therapy for
preventing stroke in
patients with non-
rheumatic atrial fibrillation
and a history of stroke or
transient ischaemic attacks
‘Aspirin may reduce the risk of vascular events in people with non-rheumatic atrial
fibrillation, but the effect shown in the single trial was not statistically significant.’35
(2/95)
Carotid endarterectomy for
symptomatic carotid
stenosis
Carotid endarterectomy reduced the risk of disabling stroke or death for patients
with stenosis exceeding ECST-measured 70% or NASCET-measured 50%. This
result is generalisable only to surgically fit patients operated on by surgeons with
low complication rates (less than 6%).36 (3/99)
Ineffective/unproven treatments
Anticoagulants for
preventing recurrence
following ischaemic stroke
or transient ischaemic attack
‘There appears to be no clear benefit from long-term anticoagulant therapy in
people with non-embolic presumed ischaemic stroke or transient ischaemic attack.
There appears to be a significant bleeding risk associated with anticoagulant
therapy.’37 (9/97)
Anticoagulants (oral)
versus antiplatelet therapy
for preventing further
vascular events after transient ischaemic attack or minor stroke of presumed arterial
origin

d:/postscript/03-CHAP3_1.3D – 27/1/4 – 9:27
[This page: 223]
Stroke 223
‘For the secondary prevention of further vascular events after transient ischaemic attack or minor stroke of
presumed arterial origin, there is insufficient evidence to justify the routine use of low intensity oral anticoagulants
(INR 2.0 – 3.6). More intense anticoagulation (INR 3.0 – 4.5) is not safe and should not be used in this setting.’38
(12/99)
Review Reviewers’ conclusion
Secondary prevention of stroke
Ineffective/unproven treatments Continued.
Eversion versus
conventional carotid
endarterectomy for
preventing stroke
‘Eversion CEA may be associated with low risk of arterial occlusion and re-stenosis.
However, numbers are too small to definitively assess benefits or harms. Reduced
re-stenosis rates did not appear to be associated with clinical benefit in terms of
reduced stroke risk, either perioperatively or later. Until further evidence is
available, the choice of the CEA technique should depend on the experience and
familiarity of the individual surgeon.’39 (8/00)
Local versus general
anaesthesia for carotid
endarterectomy
‘There is not enough evidence from randomised trials comparing carotid
endarterectomy performed under local as opposed to general anaesthetic. Non-
randomised studies suggest potential benefits with local anaesthetic. However these
studies are likely to be significantly biased.’40 (8/96)
Patch angioplasty versus
primary closure for carotid
endarterectomy
‘Limited evidence suggests that carotid patch angioplasty may lower the risk of
perioperative arterial occlusion and re-stenosis. It is unclear whether this reduces
the risk of death or stroke.’41 (5/96)
Patches of different types
for carotid patch
angioplasty
‘There is not enough evidence to differentiate between venous and synthetic patches
in carotid endarterectomy.’42 (5/96)
Percutaneous transluminal
angioplasty and stenting for
vertebral artery stenosis
‘There is no evidence as yet to assess the effects of percutaneous transluminal
angioplasty for vertebral artery stenosis.’43 (5/97)
Percutaneous transluminal
angioplasty and stenting for
carotid artery stenosis
‘There is no evidence as yet to assess the relative effects of carotid percutaneous
transluminal angioplasty in people with carotid stenosis.’44 (7/97)
Routine or selective carotid
artery shunting for carotid
endarterectomy (and
different methods of
monitoring in selective
shunting)
‘The data presently available are too limited to either support or refute the use of
routine or selective shunting in carotid endarterectomy. Large scale randomised
trials using no shunting as the control group are required. No one method of
monitoring in selective shunting has been shown to produce better outcomes.’45
(12/94)
Organisation of stroke care
Effective/promising treatments
Organised inpatient (stroke
unit) care for stroke
‘Stroke patients who receive organised inpatient care in a stroke unit are more
likely to be alive, independent, and living at home one year after the stroke. The
apparent benefits are not restricted to any particular sub-group of patients or
model of stroke unit care. No systematic increase was observed in the length of
inpatient stay.’46 (10/98)
Ineffective/unproven treatments
Services for helping acute
stroke patients avoid
hospital admission

d:/postscript/03-CHAP3_1.3D – 27/1/4 – 9:27
[This page: 224]
‘There is currently no evidence from clinical trials to support a radical shift in the care of acute stroke patients
from hospital-based care.’47 (5/99)
Services for reducing duration of hospital care for acute stroke patients
‘ESD services provided for a selected group of stroke patients can reduce the length of hospital stay. However, the
relative risks and benefits and overall costs of such services remain unclear.’48 (5/99)
Review Reviewers’ conclusion
Rehabilitation following stroke
Effective/promising treatments
Cognitive rehabilitation for
attention deficits following
stroke
‘There is some indication that training improves alertness and sustained attention
but no evidence to support or refute the use of cognitive rehabilitation for attention
deficits to improve functional independence following stroke.’49 (5/00)
Ineffective/unproven treatments
Cognitive rehabilitation for
memory deficits following
stroke
‘There is insufficient evidence to support or refute the effectiveness of cognitive
rehabilitation for memory problems after stroke.’50 (2/00)
Electrical stimulation for
preventing and treating
post-stroke shoulder pain
‘The evidence from randomised controlled trials so far does not confirm or refute
that electrical stimulation around the shoulder after stroke influences reports of
pain, but there do appear to be benefits for passive humeral lateral rotation. A
possible mechanism is through the reduction of glenohumeral subluxation. Further
studies are required.’51 (4/99)
Information provision for
stroke patients and their
care givers
‘The results of the review are limited by the variable quality of the trials and the
wide range of outcome measures used. The general effectiveness of information has
not been conclusively demonstrated. Future work should address the expressed
needs of patients and carers and seek to identify appropriate teaching strategies
which can be successfully implemented within clinical practice’52 (1/01)
Pharmacological treatment
for aphasia following stroke
‘The main conclusion of this review is that drug treatment with piracetam may be
effective in the treatment of aphasia after stroke. Further research is needed to
explore the effects of drugs for aphasia, in particular piracetam. If a trial is done,
this must be large enough to have adequate statistical power. The safety of the drug
should be of primary interest. Researchers should examine the long-term effects of
this treatment, and whether it is more effective than speech and language
therapy.’53 (7/01)
Speech and language
therapy for aphasia
following stroke
‘The main conclusion of this review is that speech and language therapy treatment
for people with aphasia after a stroke has not been shown either to be clearly
effective or clearly ineffective within a RCT. Decisions about the management of
patients must therefore be based on other forms of evidence. Further research is
required to find out if effectiveness of speech and language therapy for aphasic
patients is effective. If researchers choose to do a trial, this must be large enough to
have adequate statistical power, and be clearly reported.’54 (7/99)
Speech and language
therapy for dysarthria due
to non-progressive brain
damage
‘There is no evidence of the quality required by this review to support or refute the
effectiveness of Speech and Language Therapy interventions for dysarthria following
non-progressive brain damage. There is an urgent need for good quality research in
this area.’55 (9/00)
224 Stroke

d:/postscript/03-CHAP3_1.3D – 27/1/4 – 9:27
[This page: 225]
Citations of Cochrane Reviews
1 Benavente O, Hart R, Koudstaal P, Laupacis A, McBride R. Antiplatelet therapy for preventing stroke
in patients with non-valvular atrial fibrillation and no previous history of stroke or transient ischemic
attacks (Cochrane Review). In: The Cochrane Library, 4. Oxford: Update Software, 2000.
2 Chambers BR, You RX, Donnan GA. Carotid endarterectomy for asymptomatic carotid stenosis(Cochrane Review). In: The Cochrane Library, 4. Oxford: Update Software, 2000.
3 Benavente O, Hart R, Koudstaal P, Laupacis A, McBride R. Oral anticoagulants for preventing stroke in
patients with non-valvular atrial fibrillation and no previous history of stroke or transient ischemic
attacks (Cochrane Review). In: The Cochrane Library, 4. Oxford: Update Software, 2000.
4 Hankey GJ, Sudlow CLM, Dunbabin DW. Thienopyridine derivatives (ticlopidine, clopidogrehl)
versus aspirin for preventing stroke and other serious vascular events in high vascular risk patients
(Cochrane Review). In: The Cochrane Library, 4. Oxford: Update Software, 2000.
5 Lyrer P, Engelter S. Antithrombotic drugs for carotid artery dissection (Cochrane Review). In: TheCochrane Library, 4. Oxford: Update Software, 2000.
6 Gubitz G, Sandercock P, Counsell C. Antiplatelet therapy for acute ischaemic stroke (Cochrane
Review). In: The Cochrane Library, 4. Oxford: Update Software, 2000.
7 Wardlaw JM, del Zoppo G, Yamaguchi T. Thrombolysis for acute ischaemic stroke (Cochrane
Review). In: The Cochrane Library, 4. Oxford: Update Software, 2000.
8 Gubitz G, Counsell C, Sandercock P, Signorini D. Anticoagulants for acute ischaemic stroke (Cochrane
Review). In: The Cochrane Library, 4. Oxford: Update Software, 2000.
9 Horn J, Limburg M. Calcium antagonists for acute ischemic stroke (Cochrane Review). In: TheCochrane Library, 4. Oxford: Update Software, 2000.
10 Correia M, Silva M, Veloso M. Cooling therapy for acute stroke (Cochrane Review). In: The Cochrane
Library, 4. Oxford: Update Software, 2000.
11 Qizilbash N, Lewington SL, Lopez-Arrieta JM. Corticosteroids for acute ischaemic stroke (Cochrane
Review). In: The Cochrane Library, 4. Oxford: Update Software, 2000.
12 Liu M, Counsell C, Wardlaw J. Fibrinogen depleting agents for acute ischaemic stroke (Cochrane
Review). In: The Cochrane Library, 4. Oxford: Update Software, 2000.
13 Candelise L, Ciccone A. Gangliosides for acute ischaemic stroke (Cochrane Review). In: The CochraneLibrary, 4. Oxford: Update Software, 2000.
14 Righetti E, Celani MG, Cantisani T, Sterzi R, Boysen G, Ricci S. Glycerol for acute stroke (Cochrane
Review). In: The Cochrane Library, 4. Oxford: Update Software, 2000.
15 Asplund K, Israelsson K, Schampi I. Haemodilution for acute ischaemic stroke (Cochrane Review). In:
The Cochrane Library, 4. Oxford: Update Software, 2000.
16 Blood pressure in Acute Stroke Collaboration (BASC). Interventions for deliberately altering blood
pressure in acute stroke (Cochrane Review). In: The Cochrane Library, 4, 2001. Oxford: Update
Software, 2000.17 Bath PMW, Bath FJ, Smithard DG. Interventions for dysphagia in acute stroke (Cochrane Review). In:
The Cochrane Library, 4. Oxford: Update Software, 2000.
18 Counsell C, Sandercock P. Low-molecular-weight heparins or heparinoids versus standard unfractio-
nated heparin for acute ischaemic stroke (Cochrane Review). In: The Cochrane Library, 4, 2001.
Oxford: Update Software, 2000.
19 Bereczki D, Liu M, do Prado GF, Fekete I. Mannitol for acute stroke (Cochrane Review). In: The
Cochrane Library, 4, 2001. Oxford: Update Software, 2000.
20 Bath FJ, Butterworth RJ, Bath PMW. Nitric oxide donors (nitrates), L-arginine, or nitric oxidesynthase inhibitors for acute ischaemic stroke (Cochrane Review). In: The Cochrane Library, 4. Oxford:
Update Software, 2000.
Stroke 225

d:/postscript/03-CHAP3_1.3D – 27/1/4 – 9:27
[This page: 226]
21 Bath PMW, Bath FJ, Asplund K. Pentoxifylline, propentofylline and pentifylline for acute ischaemic
stroke (Cochrane Review). In: The Cochrane Library, 4. Oxford: Update Software, 2000.
22 Ricci S, Celani MG, Cantisani AT, Righetti E. Piracetam for acute ischaemic stroke (Cochrane Review).
In: The Cochrane Library, 4. Oxford: Update Software, 2000.23 Bath PMW, Bath FJ. Prostacyclin and analogues for acute ischaemic stroke (Cochrane Review). In: The
Cochrane Library, 4. Oxford: Update Software, 2000.
24 Prasad K , Shrivastava A. Surgery for primary supratentorial intracerebral haemorrhage (Cochrane
Review). In: The Cochrane Library, 4. Oxford: Update Software, 2000.
25 Mohiuddin AA, Bath FJ, Bath PMW. Theophylline, aminophylline, caffeine and analogues for acute
ischaemic stroke (Cochrane Review). In: The Cochrane Library, 4. Oxford: Update Software, 2000.
26 Liu M, Wardlaw J. Thrombolysis (different doses, routes of administration and agents) for acute
ischaemic stroke (Cochrane Review). In: The Cochrane Library, 4, 2000.27 The Tirilazad International Steering Committee. Tirilazad for acute ischaemic stroke (Cochrane
Review). In: The Cochrane Library, 4, 2001. Oxford: Update Software, 2000.
28 The Blood pressure in Acute Stroke Collaboration (BASC). Vasoactive drugs for acute stroke
(Cochrane Review). In: The Cochrane Library, 4. Oxford: Update Software, 2000.
29 Bereczki D, Fekete I. Vinpocetine for acute ischaemic stroke (Cochrane Review). In: The Cochrane
Library, 4. Oxford: Update Software, 2000.
30 Feigin VL, Rinkel GJE, Algra A, Vermeulen M, van Gijn J. Calcium antagonists for aneurysmal sub-
arachnoid haemorrhage (Cochrane Review). In: The Cochrane Library, 4. Oxford: Update Software,2000.
31 Feigin VL, Rinkel GJE, Algra A, van Gijn J. Circulatory volume expansion for aneurysmal sub-
arachnoid hemorrhage (Cochrane Review). In: The Cochrane Library, 4. Oxford: Update Software,
2000.
32 Whitfield PC, Kirkpatrick PJ. Timing of surgery for aneurysmal sub-arachnoid haemorrhage
(Cochrane Review). In: The Cochrane Library, 4, 2001. Oxford: Update Software, 2000.
33 Koudstaal PJ. Anticoagulants for preventing stroke in patients with nonrheumatic atrial fibrillation
and a history of stroke or transient ischemic attacks (Cochrane Review). In: The Cochrane Library, 4.Oxford: Update Software, 2000.
34 Koudstaal PJ. Anticoagulants versus antiplatelet therapy for preventing stroke in patients with non-
rheumatic atrial fibrillation and a history of stroke or transient ischemic attacks (Cochrane Review). In:
The Cochrane Library, 4. Oxford: Update Software, 2000.
35 Koudstaal PJ. Antiplatelet therapy for preventing stroke in patients with nonrheumatic atrial
fibrillation and a history of stroke or transient ischemic attacks (Cochrane Review). In: The Cochrane
Library, 4. Oxford: Update Software, 2000.
36 Cina CS, Clase CM, Haynes RB. Carotid endarterectomy for symptomatic carotid stenosis (CochraneReview). In: The Cochrane Library, 4. Oxford: Update Software, 2000.
37 Liu M, Counsell C, Sandercock P. Anticoagulants for preventing recurrence following ischaemic stroke
or transient ischaemic attack (Cochrane Review). In: The Cochrane Library, 4. Oxford: Update
Software, 2000.
38 Algra A, De Schryver ELLM, van Gijn J, Kappelle LJ, Koudstaal PJ. Oral anticoagulants versus
antiplatelet therapy for preventing further vascular events after transient ischaemic attack or minor
stroke of presumed arterial origin (Cochrane Review). In: The Cochrane Library, 4, 2001. Oxford:
Update Software, 2000.39 Cao PG, De Rango P, Zannetti S, Giordano G, Ricci S, Celani MG. Eversion versus conventional
carotid endarterectomy for preventing stroke (Cochrane Review). In: The Cochrane Library, 4, 2001.
Oxford: Update Software, 2000.
226 Stroke

d:/postscript/03-CHAP3_1.3D – 27/1/4 – 9:27
[This page: 227]
40 Tangkanakul C, Counsell C, Warlow C. Local versus general anaesthesia for carotid endarterectomy
(Cochrane Review). In: The Cochrane Library, 4. Oxford: Update Software, 2000.
41 Counsell C, Salinas R, Warlow C, Naylor R. Patch angioplasty versus primary closure for
carotid endarterectomy (Cochrane Review). In: The Cochrane Library, 4. Oxford: Update Software,2000.
42 Counsell C, Warlow C, Naylor R. Patches of different types for carotid patch angioplasty (Cochrane
Review). In: The Cochrane Library, 4. Oxford: Update Software, 2000.
43 Crawley F, Brown MM. Percutaneous transluminal angioplasty and stenting for vertebral artery
stenosis (Cochrane Review). In: The Cochrane Library, 4. Oxford: Update Software, 2000.
44 Crawley F, Brown MM. Percutaneous transluminal angioplasty and stenting for carotid artery stenosis
(Cochrane Review). In: The Cochrane Library, 4. Oxford: Update Software, 2000.
45 Counsell C, Salinas R, Naylor R, Warlow C. Routine or selective carotid artery shunting for carotidendarterectomy (and different methods of monitoring in selective shunting) (Cochrane Review). In:
The Cochrane Library, 4. Oxford: Update Software, 2000.
46 Stroke Unit Trialists’ Collaboration. Organised inpatient (stroke unit) care for stroke (Cochrane
Review). In: The Cochrane Library, 4. Oxford: Update Software, 2000.
47 Langhorne P, Dennis MS , Kalra L, Shepperd S, Wade DT, Wolfe CDA. Services for helping acute
stroke patients avoid hospital admission (Cochrane Review). In: The Cochrane Library, 4. Oxford:
Update Software, 2000.
48 Early Supported Discharge Trialists. Services for reducing duration of hospital care for acute strokepatients (Cochrane Review). In: The Cochrane Library, 4. Oxford: Update Software, 2000.
49 Lincoln NB, Majid MJ, Weyman N. Cognitive rehabilitation for attention deficits following stroke
(Cochrane Review). In: The Cochrane Library, 4. Oxford: Update Software, 2000.
50 Majid MJ, Lincoln NB, Weyman N. Cognitive rehabilitation for memory deficits following stroke
(Cochrane Review). In: The Cochrane Library, 4. Oxford: Update Software, 2000.
51 Price CIM, Pandyan AD. Electrical stimulation for preventing and treating post-stroke shoulder pain
(Cochrane Review). In: The Cochrane Library, 4. Oxford: Update Software, 2000.
52 Forster A, Smith J, Young J, Knapp P, House A, Wright A. Information provision for stroke patientsand their caregivers (Cochrane Review). In: The Cochrane Library, 4. Oxford: Update Software, 2000.
53 Greener J, Enderby P, Whurr R. Pharmacological treatment for aphasia following stroke (Cochrane
Review). In: The Cochrane Library, 4, 2001. Oxford: Update Software, 2000.
54 Greener J, Enderby P, Whurr R. Speech and language therapy for aphasia following stroke (Cochrane
Review). In: The Cochrane Library, 4. Oxford: Update Software, 2000.
55 Sellars C, Hughes T, Langhorne P. Speech and language therapy for dysarthria due to non-progressive
brain damage (Cochrane Review). In: The Cochrane Library, 4, 2001. Oxford: Update Software, 2000.
Stroke 227

d:/postscript/03-CHAP3_1.3D – 27/1/4 – 9:27
[This page: 228]
References
1 Office for National Statistics. Mortality statistics: cause. Review of the Registrar General on deaths by
cause, sex and age, in England & Wales, 1999. Series DH2 no. 26. London: The Stationery Office, 2000.
2 Office for Health Economics. Stroke. 1988.3 Secretary of State for Health. The Health of the Nation: a strategy for health in England. Cm 1986.
London: HMSO, 1992.
4 Sarti C, Rastenyte D, Cepaitis Z, Tuomilehto J. International trends in mortality from stroke, 1968 to
1994. Stroke 2000; 31: 1588–1601.
5 Wolfe CDA, Tilling K, Beech R, Rudd AG for the European BIOMED Group. Variations in case
fatality and dependency from stroke in Western and Central Europe. Stroke 1999; 30: 350–6.
6 Wolfe CDA, Giroud M, Kolominsky-Rabas P et al. for the European Registries of Stroke (EROS)
Collaboration. Stroke 2000; 31: 2074–9.7 Sudlow CLM, Warlow CP. Comparable studies of the incidence of stroke and its pathological types.
Results from an international collaboration. Stroke 1997; 28: 491–9.
8 Secretary of State for Health. Saving Lives: Our healthier nation. Cm. 4386. London: The Stationery
Office, July 1999.
9 National Health Service Executive. National Service Framework for Older People. London:
Department of Health, March 2001.
10 Rudd AG, Irwin P, Rutledge Z et al. The national sentinel audit for stroke: a tool for raising standards
of care. J R Coll Lond 1999; 33: 460–4.11 Intercollegiate Working Party for Stroke. National Clinical Guidelines for Stroke. London: Clinical
Effectiveness & Evaluation Unit, Royal College of Physicians, March 2000.
12 Hatano S. Experience from a multicentre stroke register: a preliminary report. Bull World Health
Organ 1976; 54: 541–53.
13 Bamford J, Sandercock P, Dennis M, Burn J, Warlow C. A prospective study of acute cerebrovascular
disease in the community: the Oxfordshire Community Stroke – 1981–86. 2. Incidence, case fatality
rates and overall outcome at one year of cerebral infarction, primary intracerebral and sub-arachnoid
haemorrhage. J Neurol Neurosurg Psychiatry 1990; 53: 16–22.14 Office for National Statistics. Mortality statistics: cause. Review of the Registrar General on deaths by
cause, sex and age, in England & Wales, 1998. Series DH2 no. 25. London: The Stationery Office, 1999.
15 Adams HJ, Bendixen BH, Kappelle LJ et al. Classification of sub-type of acute ischaemic stroke.
Definitions for use in a multi-centre clinical trial. Stroke 1993; 24: 35–41.
16 Madden KP, Karanjia PN, Adams HP, Clarke WR, and the TOAST investigators. (Accuracy of initial
stroke subtype diagnosis in the TOAST study. Neurology 1995; 45: 1975–9.
17 Lee LJ, Kidwell CS, Alger J et al. Impact on stroke subtype diagnosis of early diffusion-weighted
magnetic resonance imaging and magnetic resonance angiography. Stroke 2000; 31: 1081–9.18 Kistler JP, Furie KL. Carotid endarterectomy revisited. New Engl J Med 2000; 342: 1743–5.
19 Petty GW, Brown RD, Whisnant JP et al. Ischaemic stroke subtypes: a population based study of
functional outcome, survival and recurrence. Stroke 2000; 31: 1062–8.
20 Bonita R, Thomson S. Sub-arachnoid hemorrhage: epidemiology, diagnosis, management, and
outcome. Stroke 1985; 16: 591–4.
21 Locksley HB. Report on the co-operative study of intracranial aneurysms and sub-arachnoid
haemorrhage, V,I: natural history of sub-arachnoid haemorrhage, intracranial aneurysms and
arteriovenous malformations. J Neurosurg 1966; 25: 219–39.22 Taub NA, Wolfe CDA, Richardson E, Burney PGJ. Predicting the disability of first time stroke
sufferers at 1 year. Stroke 1994; 25: 352–7.
228 Stroke

d:/postscript/03-CHAP3_1.3D – 27/1/4 – 9:27
[This page: 229]
23 Henon H, Godefroy O, Leys D, Mounier-Vehier F, Lucas C, Rondepierre P, Duhamel A, Pruvo
JP. Early predictors of death and disability after acute cerebral ischemic event. Stroke 1995; 26:
392–8.
24 Hier DB, Edelstein G. Deriving clinical prediction rules from stroke outcome research. Stroke 1991;22: 1431–6.
25 Gladman JRF, Harwood DMJ, Barer DH. Predicting the outcome of acute stroke: prospective
evaluation of five multivariate models and comparison with simple methods. J Neurol Neurosurg
Psychiatry 1992; 55: 347–351.
26 Davenport RJ, Dennis MS, Warlow CP. Effect of correcting outcome data for case-mix: an example
from stroke medicine. British Medical Journal 1996; 312: 1503–5.
27 Rothwell P. Interpretation of variations in outcome in audit of clinical interventions. Lancet 2000;
355: 4–5.28 Bamford J, Sandercock P, Dennis M, Burn J, Warlow C. Classification and natural history of clinically
identifiable subtypes of cerebral infarction. Lancet 1991; 337: 1521–6.
29 Toni D, Duca RD, Fiorelli M, Sacchetti ML, Bastianello S, Giubilei F, Martinazzo C, Argentino C.
Pure motor hemiparesis and sensorimotor stroke. Accuracy of very early clinical diagnosis of lacunar
strokes. Stroke 1994; 25: 92–6.
30 Wade DT. Measurement in neurological rehabilitation. Oxford: Oxford University Press, 1992.
31 Stojcevic N, Wilkinson P, Wolfe C. Outcome measurement in stroke patients. In: Wolfe C, Rudd A,
Beech R (eds). Stroke services & research: an overview with recommendations for future research.London: The Stroke Association, 1996, pp. 261–80.
32 Wade DT, Collin C. The Barthel ADL Index: a standard measure of physical disability? Int Disab
Studies 1988; 10: 64–7.
33 Holbrook M, Skilbeck CE. An activities index for use with stroke patients. Age Ageing. 1983; 12:
166–70.
34 Harwood RH, Ebrahim S. Manual of the London Handicap Scale. Nottingham: University of
Nottingham, 1995.
35 World Health Organisation. International classification of impairments, disabilities and handicaps.Geneva: WHO, 1980.
36 Dennis MS, Bamford JM, Sandercock PAG, Warlow CP. Incidence of transient ischemic attacks in
Oxfordshire, England. Stroke 1989; 20: 333–9.
37 Laloux P, Jamart J, Meurisse H et al. Persisting perfusion defect in transient ischaemic attacks: a new
clinically useful sub-group? Stroke 1996; 27: 425–30.
38 Kelly-Hayes M, Robertson JT, Broderick JP et al. The American Heart Association Stroke Outcome
Classification. Stroke 1998; 29: 1274–80.
39 World Health Organisation. International classification of disease, 9th revision. London: HMSO, 1977.40 World Health Organisation. International classification of disease, 10th revision. Geneva: WHO,
1992.
41 Mant J, Mant F, Winner S. How good is routine information? Validation of coding for acute stroke in
Oxford hospitals. Health Trends 1998; 29: 96–9.
42 World Health Organisation. International Classification of Functioning, disability and health. ICF.
Geneva: WHO, May 2001.
43 Goldstein LB, Adams R, Becker K et al. Primary prevention of ischaemic stroke. A statement for
health care professionals from the Stroke Council of the American Heart Association. Stroke 2001; 32:280–99.
44 Ebrahim S, Harwood R. Stroke epidemiology, evidence, and clinical practice, 2nd edition. Oxford:
Oxford University Press, 1999.
45 Warlow CP. Epidemiology of stroke. Lancet 1998; 352 (Suppl. 3): 1–4.
Stroke 229

d:/postscript/03-CHAP3_1.3D – 27/1/4 – 9:27
[This page: 230]
46 MacMahon S, Peto R, Cutler J et al. Blood pressure, stroke, and coronary heart disease, pt 1,
prolonged differences in blood pressure: prospective observational studies corrected for the
regression dilution bias. Lancet 1990; 335: 765–74.
47 Erens B, Primatesta P (eds). Health Survey for England: Cardiovascular disease 1998. London: TheStationery Office, 1999.
48 Brand FN, Abbott RD, Kannel WB, Wolf PA. Characteristics and prognosis of lone atrial fibrillation:
30 year follow up in the Framingham Study. JAMA 1985; 254: 3449–53.
49 Kopecky SL, Gersh BJ, McGoon MD et al. Lone atrial fibrillation in elderly persons: a marker for
cardiovascular risk. Arch Intern Med 1999; 159: 1118–22.
50 Sudlow S, Thomson R, Thwaites B et al. Prevalence of atrial fibrillation and eligibility for
anticoagulants in the community. Lancet 1998; 352: 1167–71.
51 Wheeldon NM, Tayler DI, Anagnostou E et al. Screening for atrial fibrillation in primary care. Heart1998; 79: 50–5.
52 Shinton R, Beevers G. Meta-analysis of relation between cigarette smoking and stroke. BMJ 1989; 298:
789–94.
53 Gatling W, Budd S, Walters D, Mullee MA, Goddard JR, Hill RD. Evidence of an increasing
prevalence of diagnosed diabetes mellitus in the Poole area from 1983 to 1996. Diabetic Med 1998; 15:
1015–21.
54 Bennett N, Dodd T, Flatley J, Freeth S, Boiling K. Health survey for England 1993. London: HMSO.
55 Burn J, Dennis M, Bamford J et al. Long term risk of recurrent stroke after a first ever stroke: theOxfordshire Community Stroke Project. Stroke 1994; 25: 333–7.
56 Geddes J, Fear J, Tennant A et al. Prevalence of self reported stroke in a population in northern
England. J Epidemiol Commun Hlth 1996; 50: 140–3.
57 O’Mahony P, Thomson RG, Dobson R et al. The prevalence of stroke and associated disability.
Journal of Public Health Medicine 1999; 21: 166–71.
58 Dennis M, Bamford J, Sandercock P, Warlow C. Prognosis of transient ischaemic attacks in the
Oxfordshire Community Stroke Project. Stroke 1990; 21: 848–53.
59 Bots ML, van der Wilk EC, Koudstaal PJ et al. Transient neurological attacks in the generalpopulation: prevalence, risk factors, and clinical relevance. Stroke 1997; 28: 768–73.
60 Wolfe C, Stojcevice N, Stewart J. The effectiveness of measures aimed at reducing the incidence
of stroke. In: Wolfe C, Rudd A, Beech R (eds). Stroke services & research: an overview with
recommendations for future research. London: The Stroke Association, 1996, pp. 39–86.
61 Hart CL, Smith GD, Hole DJ, Hawthorne VM. Alcohol consumption and mortality from all causes,
coronary heart disease, and stroke: results from a prospective cohort study of Scottish men with 21
years of follow up. BMJ 1999; 318: 1725–9.
62 Sacco RL, Elkind M, Boden-Albala B et al. The protective effect of moderate alcohol consumption onischaemic stroke. JAMA 1999; 281: 53–60.
63 Gillum LA, Mamidipudi SK, Johnston SC. Ischaemic stroke risk with oral contraceptives: a
meta-analysis. JAMA 2000; 284: 72–8.
64 O’Connell J, Gray CS. Atrial fibrillation and stroke prevention in the community. Age and Ageing
1996; 25: 307–9.
65 Lip GYH, Golding DJ, Nazir M et al. A survey of atrial fibrillation in general practice: the West
Birmingham Atrial Fibrillation Project. BJGP 1997; 47: 285–9.
66 Levy S, Maarek M, Cournel P et al. Characterisation of different subsets of atrial fibrillation inGeneral Practice in France. The ALFA study. Circulation 1999; 99: 3028–35.
67 Kannel WB, Wolf PA, Benjamin EJ, Levy D. Prevalence, incidence, prognosis, and pre-
disposing conditions for atrial fibrillation: population based estimates. Am J Cardiol 1998; 82:
2N–9N.
230 Stroke

d:/postscript/03-CHAP3_1.3D – 27/1/4 – 9:27
[This page: 231]
68 Psaty BM, Manolia TA, Kuller LH et al. Incidence of and risk factors for atrial fibrillation in older
adults. Circulation 1997; 96: 2455–61.
69 Furberg CD, Psaty BM, Manolio TA et al. Prevalence of atrial fibrillation in elderly subjects (the
Cardiovascular Health Study). AmJ Card 1994; 74: 236–41.70 Feinberg WM, Blackshear JL, Laupacis A et al. Prevalence, age distribution and gender of patients
with atrial fibrillation. Archives of Int Med 1995; 155: 469–73.
71 Go AS, Hylek EM, Phillips KA et al. Prevalence of diagnosed atrial fibrillation in adults. National
implications for rhythm management and stroke prevention: the anticoagulation and risk factors in
atrial fibrillation (ATRIA) study. JAMA 2001; 285: 2370–5.
72 Sudlow M, Rodgers H, Kenny RA, Thomson R. Population based study of use of anticoagulants
among patients with atrial fibrillation in the community. BMJ 1997; 314: 1529–30.
73 Wolf PA, Abbott RD, Kannel WB. Atrial fibrillation: a major contributor to stroke in the elderly, TheFramingham Study. Arch Intern Med 1987; 147: 1561–4.
74 Benjamin EJ, Wolf PA, D’Agostino RB et al. Impact of atrial fibrillation on the risk of death: the
Framingham Heart Study. Circulation 1998; 98: 946–52.
75 Lake FR, Cullen KJ, de Klerk NH et al. Atrial fibrillation and mortality in an elderly population. Aust
NZJ Med 1989; 19: 321–6.
76 Lin H-J, Wolf PA, Kelly-Hayes et al. Stroke severity in atrial fibrillation. Stroke 1996; 27:
1760–4.
77 Sandercock P, Bamford J, Dennis M et al. Atrial fibrillation and stroke: prevalence in different types ofstroke and influence on early and long term prognosis (Oxfordshire community stroke project). BMJ
1992; 305: 1460–5.
78 Atrial Fibrillation Investigators. Risk factors for stroke and efficacy of antithrombotic therapy in atrial
fibrillation. Analysis of pooled data from five randomised controlled trials. Arch Intern Med. 1994;
154: 1449–57.
79 SPAF Investigators. Predictors of thrombo-embolism in atrial fibrillation: clinical features of patients
at risk. Ann Intern Med 1992; 116: 1–5.
80 Hart RG, Pearce LA, McBride R et al. Factors associated with ischaemic stroke during aspirin therapyin atrial fibrillation: analysis of 2012 participants in the SPAF I-III clinical trials. Stroke 1999; 30:
1223–9.
81 SPAF III Writing Committee. Patients with nonvalvular atrial fibrillation at low risk of stroke during
treatment with aspirin. JAMA 1998; 279: 1273–7.
82 SPAF Investigators. Predictors of thromboembolism in atrial fibrillation: II echocardiographic
features of patients at risk. Ann Intern Med 1992; 116: 6–12.
83 Wolf PA. Prevention of stroke. Lancet 1998; 352: (sIII) 15–18.
84 Prospective Studies Collaboration. Cholesterol, diastolic blood pressure, and stroke: 13,000 strokes in450,000 people in 45 prospective cohorts. Lancet 1995; 346: 1647–53.
85 Hebert PR, Gaziano JM, Chan KS, Hennekens CH. Cholesterol lowering with statin drugs, risk of
stroke, and total mortality. JAMA 1997; 278: 313–21.
86 Iso H, Jacobs DR Jr, Wentworth D et al. for the MRFIT Research Group. Serum cholesterol levels and
six year mortality from stroke in 350,977 men screened for the Multiple Risk Factor Intervention
Trial. N Engl J Med 1989; 320: 904–10.
87 European Carotid Surgery Trialists’ Collaborative Group. MRC European Carotid Surgery Trial:
interim results for symptomatic patients with severe (70–99%) or with mild (0–29%) carotidstenosis. Lancet 1991; 337: 1235–43.
88 North American Symptomatic Carotid Endarterectomy Trial Collaborators. Beneficial effect of
carotid endarterectomy in symptomatic patients with high-grade carotid stenosis. N Engl J Med 1991;
325: 445–53.
Stroke 231

d:/postscript/03-CHAP3_1.3D – 27/1/4 – 9:27
[This page: 232]
89 Executive Committee for the Asymptomatic Carotid Atherosclerosis Study. JAMA 1995; 273:
1421–8.
90 Inzitari D, Eliasziw M, Gates P et al. The causes and risk of stroke in patients with asymptomatic
internal-carotid artery stenosis. N Engl J Med 2000; 342: 1693–700.91 Barnett HJM, Gunton RW, Eliasziw et al. Causes and severity of ischaemic stroke in patients with
internal carotid artery stenosis. JAMA 2000; 283: 1429–36.
92 Ogren M, Hedblad B, Isacsson S-O et al. Ten year cerebrovascular morbidity and mortality in 68 year
old men with asymptomatic carotid stenosis. BMJ 1995; 310: 1294–8.
93 Dennis MS, Bamford JM, Sandercock PAG, Warlow CP. Incidence of transient ischaemic attack in
Oxfordshire, England. Stroke 1989; 20: 333–9.
94 Sempere AP, Duarte J, Cabezas C, Claveria LE. Incidence of transient ischaemic attacks and minor
ischaemic strokes in Segovia, Spain. Stroke 1996; 27: 667–71.95 Brown RD Jr, Petty GW, O’Fallon WM et al. Incidence of transient ischaemic attack in Rochester,
Minnesota, 1985–9. Stroke 1998; 29: 2109–13.
96 Gibbs RGJ, Newson R, Lawrenson R et al. Diagnosis and initial management of stroke and transient
ischemic attack across UK Health Regions from 1992 to 1996. Experience of a national primary care
database. Stroke 2001; 32: 1085–90.
97 Martin PJ, Young G, Enevoldson TP, Humphrey PR. Overdiagnosis of TIA and minor stroke:
experience at a regional neurovascular clinic. QJM 1997; 90: 759–63.
98 Toole JF, Lefkowitz DS, Chambless LE et al. Self-reported transient ischaemic attack and strokesymptoms: methods and baseline prevalence. The ARIC Study 1987–89. Am J Epidemiol 1996; 144:
849–56.
99 Bamford J, Sandercock P, Dennis M et al. A prospective study of acute cerebrovascular disease in the
community: the Oxfordshire Community Stroke Project 1981–86. 1. Methodology, demography and
incident cases of first ever stroke. J Neurol Neurosurg Psychiatry 1988; 51: 1373–80.
100 Stewart JA, Dundas R, Howard RS et al. Ethnic differences in incidence of stroke: prospective study
with stroke register. BMJ 1999; 318: 967–71.
101 Du X, Sourbutts J, Cruickshank K et al. A community based stroke register in a high risk area forstroke in north west England. J Epidemiol Community Health 1997; 51: 472–8.
102 National Institute of Epidemiology. Public Health Common Data set 1996. Guildford: University of
Surrey, March 1997.
103 Wolfe CDA, Rudd AG, Howard R et al. The incidence and case fatality rates of stroke in a multi ethnic
population. The South London Stroke Register. Journal of Neurology, Neurosurgery & Psychiatry 2002;
72: 211–16.
104 Bamford J, Sandercock P, Warlow C, Gray M. Why are patients with acute stroke admitted to
hospital? BMJ 1986; 292: 1369–72.105 Tilling K, Sterne JAC, Wolfe CDA. Estimation of the incidence of stroke using a capture-recapture
model including co-variates. International Journal of Epidemiology 2001; 30: 1351–9.
106 Williams GR, Jiang JG, Matchar DB, Samsa GP. Incidence and occurrence of total (first ever and
recurrent) stroke. Stroke 1999; 30: 2523–8.
107 Broderick J, Brott T, Kothari R et al. The Greater Cincinnati/ Northern Kentucky Stroke Study.
Preliminary first ever and total incidence rates of stroke among blacks. Stroke 1998; 29: 415–21.
108 Thorvaldsen P, Asplund K, Kuulasmaa K et al. for the WHO MONICA project. Stroke incidence, case
fatality, and mortality in the WHO MONICA project. Stroke 1995; 26: 361–7.109 Office for National Statistics. Key health statistics from general practice 1998. Series MB6 no. 2.
London: National Statistics, 2000.
110 Dennis MS, Burn JPS, Sandercock PAG et al. Long term survival after first ever stroke: the
Oxfordshire Community Stroke Project. Stroke 1993; 24: 796–800.
232 Stroke

d:/postscript/03-CHAP3_1.3D – 27/1/4 – 9:27
[This page: 233]
111 Samsa GP, Bian J, Lipscombe J, Matchar DB. Epidemiology of recurrent cerebral infarction. A
medicare claims-based comparison of first and recurrent strokes on 2 year survival and cost. Stroke
1999; 30: 338–49.
112 Wild S, McKeigue P. Cross sectional analysis of mortality by country of birth in England & Wales,1970–92. BMJ 1997; 314: 705–10.
113 Maheswaran R, Elliott P, Strachan DP. Socioeconomic deprivation, ethnicity, and stroke mortality in
Greater London and south east England. J Epidemiol Community Health 1997; 51: 127–31.
114 Ebrahim S. Stroke mortality – secular and geographic trends: comment on papers by Maheswaran
and colleagues. J Epidemiol Community Health 1997; 51: 132–3.
115 Smith GD, Hart C, Blane D, Hole D. Adverse socioeconomic conditions in childhood and cause
specific adult mortality: prospective observational study. BMJ 1998; 316: 1631–5.
116 Charlton J, Murphy M, Khaw K et al. Cardiovascular diseases. In: Charlton J, Murphy M (eds). TheHealth of Adult Britain, vol. 2. London: The Stationery Office, 1997, pp. 76–81.
117 Office for National Statistics. Mortality statistics: cause. Review of the Registrar General on deaths
by cause, sex and age, in England & Wales, 1986. Series DH2 no. 13. London: The Stationery Office,
1988.
118 Corwine LI, Wolf PA, Kannel WB et al. Accuracy of death certification of stroke: the Framingham
study. Stroke 1982; 13: 818–21.
119 Thorvaldsen P, Davidesen M, Bronnum-Hansen H, Schroll M for the Danish MONICA Study Group.
Stable stroke occurrence despite incidence reduction in an aging population. Stroke 1999; 30:2529–34.
120 Thorvaldsen P, Kuulasmaa K, Rajakangas AM et al. for the WHO MONICA project. Stroke trends in
the WHO MONICA project. Stroke 1997; 28: 500–6.
121 Stegmayr B, Asplund K, Wester PO. Trends in incidence, case-fatality rate, and severity of stroke in
Northern Sweden, 1985–91. Stroke 1994; 25: 1738–45.
122 Bonita R, Broad JB, Beaglehole R. Changes in stroke incidence and case-fatality in Auckland, New
Zealand, 1981–91. Lancet 1993; 342: 1470–3.
123 May DS, Kittner SJ. Use of medicare claims data to estimate national trends in stroke incidence,1985–1991. Stroke 1994; 25: 2343–7.
124 Brown RD, Whisnant JP, Sicks JD et al. Stroke incidence, prevalence and survival: secular trends in
Rochester Minnesota through 1989. Stroke 1996; 27: 373–380.
125 Shahar E, McGovern PG, Sprafka M et al. Improved survival of stroke patients during the 1980s. The
Minnesota Stroke Survey. Stroke 1995; 26: 1–6.
126 Barker WH, Mullooly JP. Stroke in a defined elderly population, 1967–85. A less lethal and disabling
but no less common disease. Stroke 1997; 28: 284–290.
127 May DS, Casper ML, Croft JB, Giles WH. Trends in survival after stroke among Medicarebeneficiaries. Stroke 1994; 25: 1617–22.
128 Wade DT. Stroke (acute cerebrovascular disease). In: Stevens A, Raftery J (eds). Health care needs
assessment, vol. 1. Oxford: Radcliffe Medical Press, 1994, pp. 111–255.
129 Lawrence ES, Coshall C, Dundas R et al. Estimates of the prevalence of acute stroke impairments and
disability in a multiethnic population. Stroke 2001; 32: 1279–84.
130 Jorgensen HS, Nakayama H, Raaschou HO et al. Outcome and time course of recovery in stroke.
Part II: Time course of recovery. The Copenhagen Stroke Study. Arch Phys Med Rehabil 1995; 76:
406–12.131 Wade DT, Skilbeck CE, Langton-Hewer R. Selective cognitive losses after stroke. Frequency, recovery
and prognostic importance. Int Disability Stud 1989; 11: 34–9.
132 Wade DT, Langton-Hewer R. Outcome after an acute stroke: urinary incontinence and loss of
consciousness compared in 532 patients. QJ Med 1985; 221: 347–52.
Stroke 233

d:/postscript/03-CHAP3_1.3D – 27/1/4 – 9:27
[This page: 234]
133 Wade DT, Langton-Hewer R. Functional abilities after stroke: measurement, natural history and
prognosis. J Neurol, Neurosurg Psychiatry 1987; 50: 177–82.
134 Wade DT, Langton-Hewer R, David RM, Enderby P. Aphasia after stroke: natural history and
associated deficits. J Neurol, Neurosurg, Psychiatry 1986; 49: 11–16.135 House AO, Hackett ML, Anderson CS. Effects of antidepressants and psychological therapies for
reducing the emotional impact of stroke. Proceed Royal Coll of Phys of Edin 2001; 31(58): 50–60.
136 Dennis M, O’Rourke S, Lewis S et al. Emotional outcomes after stroke: factors associated with poor
outcome. J Neurol Neurosurg Psychiatry 2000; 68: 47–52.
137 Kotila M, Numminen H, Waltimo O, Kaste M. Depression after stroke: results of the FINNSTROKE
study. Stroke 1998; 29: 368–72.
138 Greveson G, James O. Improving long term outcome after stroke – the views of patients and carers.
Health Trends 1991; 23: 161–2.139 Blake H, Lincoln N. Factors associated with strain in co-resident spouses of patients following stroke.
Clinical Rehabilitation 2000; 14: 307–14.
140 Wade DT, Legh-Smith J, Hewer RA. Effects of living with and looking after survivors of a stroke. BMJ
1986; 293: 418–20.
141 Scholte op Reimer WJM, de Haan RJ, Rijnders PT, Limburg M, van den Bos GAM. The burden of
caregiving in partners of long term stroke survivors. Stroke 1998; 29: 1605–11.
142 Han B, Haley WE. Family Caregiving for patients with stroke: review and analysis. Stroke 1999; 30:
1478–85.143 Dennis M, O’Rourke S, Lewis S, Sharpe M, Warlow C. A quantitative study of the emotional outcome
of people caring for stroke survivors. Stroke 1998; 29: 1867–72.
144 Anderson CS, Linto J, Stewart-Wynne EG. A population based assessment of the impact and burden
of caregiving for long term stroke survivors. Stroke 1995; 26: 843–9.
145 Carnwath TCM, Johnson DAW. Psychiatric morbidity among spouses of patients with stroke. BMJ
1987; 294: 409–11.
146 Ingall T, Asplund K, Mahonen M, Bonita R for the WHO MONICA Project. A multinational
comparison of sub-arachnoid hemorrhage epidemiology in the WHO MONICA Stroke Study. Stroke2000; 31: 1054–61.
147 Rose GR. The strategy for preventive medicine. Oxford: Oxford University Press, 1992.
148 Fitzmaurice DA, Hobbs FDR, Murray ET et al. Oral anticoagulation management in primary care
with the use of computerised decision support and near patient testing. A randomised controlled
trial. Arch Intern Med 2000; 160: 2343–8.
149 Fitzmaurice DA, Hobbs FD, Delaney BC, Wilson S, McManus R. Review of computerized decision
support systems for oral anticoagulation management. Br J Haematol 1998; 102: 907–9.
150 Ansell JE, Patel N, Ostrovsky D, Nozzolillo E, Peterson AM. Long term patient self management oforal anticoagulation. Arch Intern Med 1995; 155: 2185–9.
151 Whittle J, Wickenheiser L, Venditti LN. Is warfarin underused in the treatment of elderly persons with
atrial fibrillation? Arch Intern Med 1997; 157: 441–5.
152 Munschauer FE, Priore RL, Hens M, Castilone A et al. Thromboembolism prophylaxis in chronic
atrial fibrillation: practice patterns in community and tertiary care hospitals. Stroke 1997; 28:
72–6.
153 Bratzler D et al. Warfarin use in medicare patients with atrial fibrillation. Arch Intern Med 1997; 157:
1613–17.154 Stafford RS, Singer DE. Recent national patterns of warfarin use in atrial fibrillation. Circulation 1998;
97: 1231–3.
155 Whincup P. Preventing recurrent strokes: are opportunities being missed? London: Stroke Association,
1997.
234 Stroke
d:/postscript/03-CHAP3_1.3D – 27/1/4 – 9:27
[This page: 235]
156 McCallum AK, Whincup PH, Morris RW et al. Aspirin use in middle aged men with cardiovascular
disease: are opportunities being missed? British Journal of General Practice 1997; 47: 417–21.
157 Campbell NC, Thain J, Deans HG, Ritchie LD, Rawles JM. Secondary prevention in coronary heart
disease: baseline survey of provision in general practice. BMJ 1998; 316: 1430–4.158 Bhatti TS, Harradine K, Davies B et al. First year of a fast track carotid duplex service. Journal of the
Royal College of Surgeons of Edinburgh 1999; 44: 307–9.
159 McCollum PT, da Silva A, Ridler BD, de Cossart L. Carotid endarterectomy in the UK and Ireland:
audit of 30 day outcome. The Audit Committee for the Vascular Surgical Society. Eur J Vasc Endovasc
Surg 1997; 14: 386–91.
160 Ferris G, Roderick P, Smithies A et al. An epidemiological needs assessment of carotid endarter-
ectomy in an English health region. Is the need being met? BMJ 1998; 317: 447–51.
161 Gibbs RGJ, Todd J-C, Irvine C et al. Relationship between the regional and national incidence oftransient ischaemic attack and stroke and performance of carotid endarterectomy. Eur J Vasc
Endovasc Surg 1998; 16: 47–52.
162 Bamford J, Sandercock P, Warlow C, Gray M. Why are patients with acute stroke admitted to
hospital? BMJ 1986; 292: 1369–72.
163 Wolfe CD, Taub NA, Bryan S et al. Variations in the incidence, management and outcome of stroke in
residents under the age of 75 in two health districts of southern England. J Public Health Med 1995; 17:
411–18.
164 Wolfe CDA, Taub NA, Woodrow J et al. Patterns of acute stroke care in three districts of southernEngland. J Epidemiol Community Health 1993; 47: 144–8.
165 Langhorne P, Dennis MS, Kalra L, Shepperd S, Wade DT, Wolfe CDA. Services for helping acute
stroke patients avoid hospital admission (Cochrane Review). In: The Cochrane Library, 4. Oxford:
Update Software, 2000.
166 Bamford J. Clinical examination in diagnosis and subclassification of stroke. Lancet 1992; 339: 400–2.
167 Ebrahim S, Redfern J. Stroke care – a matter of chance. A national survey of stroke services. London:
Stroke Association, 1999.
168 Clinical Standards Advisory Group. Report on Clinical Effectiveness using stroke care as an example.London: The Stationery Office, 1998.
169 Stroke Unit Trialists’ Collaboration. Organised inpatient (stroke unit) care for stroke (Cochrane
Review). In: The Cochrane Library, 4. Oxford: Update Software, 2000.
170 Langhorne P, Dennis M (eds). Stroke units: an evidence based approach. London: BMJ Books, 1998.
171 Evans A, Perez I, Harraf F et al. Can differences in management processes explain different outcomes
between stroke unit and stroke team care? Lancet 2001; 358: 1586–92.
172 Fan CW, MCDonnell R, Johnson Z et al. Hospital based stroke care in Ireland: results from one
regional register. Irish Journal of Medical Science 2000; 169: 30–3.173 Audit Commission. The way to go home: rehabilitation and remedial services for older people. The Audit
Commission for Local Authorities and the National Health Service in England & Wales, London,
2000.
174 Enderby P. A survey of community rehabilitation in the United Kingdom, University of Sheffield,
1999.
175 Newman P. Aspects of intermediate care: a literature review. Anglia & Oxford Regional Office,
September 1997.
176 McCormack B. The developing role of community hospitals: an essential part of a quality service.Quality in Health Care 1993; 2: 253–8.
177 Ritchie LD, Robinson K. Community hospitals: new wine in old bottles. British Journal of General
Practice 1998; 38: 1039–40.
Stroke 235
d:/postscript/03-CHAP3_1.3D – 27/1/4 – 9:27
[This page: 236]
178 Treasure RAR, Davies JAJ. Contribution of a general practitioner hospital: a further study. BMJ 1990;
300: 644–6.
179 Tomlinson J, Raymond NT, Field D, Botha JL. Use of general practitioner beds in Leicestershire
community hospitals. British Journal of General Practice 1995; 45: 399–403.180 Rudd AG, Irwin P, Rutledge Z et al. Regional variations in stroke care in England, Wales and
Northern Ireland: results from the National Sentinel Audit of Stroke. Clinical Rehabilitation 2001; 15:
562–72.
181 Office of Population Censuses & Surveys. Survey of disability in Great Britain. Report no 1. London:
HMSO, 1985.
182 Barer DH. Stroke in Nottingham: the burden of nursing care. Clin Rehabil 1991; 5: 103–10.
183 Knapp P, Young J, House A, Forster A. Non-drug strategies to resolve psycho-social difficulties after
stroke. Age and Ageing 2000; 29: 23–30.184 Christie D, Weigall D. Social work effectiveness in two-year stroke survivors: a randomised controlled
trial. Community Health Studies 1984; 8: 26–32.
185 Forster A, Young J. Specialist nurse support for patients with stroke in the community: a randomised
controlled trial. BMJ 1996; 312: 1642–6.
186 Mant J, Carter J, Wade DT, Winner S. Family support for stroke: a randomised controlled trial. Lancet
2000; 356: 808–13.
187 Dennis M, O’Rourke S, Slattery J, Staniforth T, Warlow C. Evaluation of a stroke family care worker:
results of a randomised controlled trial. BMJ 1997; 314: 1071–7.188 Bosanquet N, Franks P. Stroke care: reducing the burden of disease. London: The Stroke Association,
1998.
189 NHS Executive. NHS Reference Costs 1999. NHS Executive, 2000.
190 Caro JJ, Huybrechts KF, Duchesne I for the Stroke Economic Analysis Group. Management patterns
and costs of acute ischemic stroke: an international study. Stroke 2000; 31: 582–90.
191 Barton S (ed.). Clinical evidence: a compendium of the best available evidence for effective health care,
issue 4. London: BMJ Publishing Group, December 2000.
192 Contributors to the Cochrane Collaboration and the NHS Centre for Reviews and Dissemination.Evidence from systematic reviews of research relevant to implementing the ‘wider public health’ agenda.
York: NHS Centre for Reviews and Dissemination, August 2000.
193 Rees K, Lawlor DA, Ebrahim S, Mant J. A national contract on heart disease and stroke. In:
Contributors to the Cochrane Collaboration and the NHS Centre for Reviews and Dissemination.
Evidence from systematic reviews of research relevant to implementing the ‘wider public health’ agenda.
York: NHS Centre for Reviews and Dissemination, August 2000.
194 Chaloupka FJ, Wechsler H. Price, tobacco control policies and smoking among adults. Journal of
Health Economics 1997; 16: 359–73.195 Choi BCK, Ferrence RG, Pack AWP. Evaluating the effects of price on the demand for tobacco products:
review of methodologies and studies. Ontario Tobacco Research Unit, 1997.
196 Chapman S, Borland R, Scollo M, Brownson RC, Dominello A, Woodward S. The impact of smoke-
free workplaces on declining cigarette consumption in Australia and the United States. American
Journal of Public Health 1999; 89: 1018–23.
197 Smee C. Effect of tobacco advertising on tobacco consumption: a discussion document reviewing the
evidence. London: Department of Health, 1992.
198 NHS Centre for Reviews and Dissemination. Preventing the uptake of smoking in young people.Effective Health Care 1999; 5: 12.
199 Sowden AJ, Arblaster L. Mass media interventions for preventing smoking in young people
(Cochrane Review) In: The Cochrane Library, Issue 1, 2000. Oxford: Update Software, 2000.
236 Stroke

d:/postscript/03-CHAP3_1.3D – 27/1/4 – 9:27
[This page: 237]
200 Gepkens A, Gunning SL. Interventions to reduce socioeconomic health differences: A review of the
international literature. European Journal of Public Health 1996; 6: 218–26.
201 Connor J. Randomised studies of income supplementation: a lost opportunity to assess health
outcomes. Journal of Epidemiology and Community Health 1999; 53: 725–30.202 Hillsdon M, Thorogood M. A systematic review of exercise promotion strategies. British Journal of
Sports Medicine 1996; 30: 84–9.
203 Ness A, Powles J. Fruit and vegetables, and cardiovascular disease: a review. International Journal of
Epidemiology 1997; 26: 1–13.
204 Marshall T. Exploring a fiscal food policy: the case of diet and ischaemic heart disease. BMJ 2000; 320:
301–5.
205 Plehn JF, Davis BR, Sacks FM et al. Reduction of stroke incidence after myocardial infarction with
pravastatin. The Cholesterol and Recurrent Events Study (CARE). Circulation 1999; 99: 216–23.206 Scandinavian Simvastatin Survival Study Group. Randomised trial of cholesterol lowering in 4444
patients with coronary heart disease: the Scandinavian Simvastatin Survival Study. Lancet 1994; 344:
1383–9.
207 Kmietowicz Z. Statins are the new aspirin, Oxford researchers say. BMJ 2001; 323: 1145.
208 Doll R, Peto R, Hall E, Wheatley K, Gray R. Mortality in relation to consumption of alcohol: 13 years’
observations on male British Doctors. BMJ 1994; 309: 911–18.
209 Collins R, Peto R. Antihypertensive drug therapy: effects on stroke and coronary heart disease. In:
Swales JD (ed.). Textbook of Hypertension. Oxford: Blackwell Scientific Publications, 1994,pp. 1156–64.
210 Hart RG, Benavente O, Mcbride R, Pearce LA. Antithrombotic therapy to prevent stroke in patients
with atrial fibrillation: a meta-analysis. Ann Intern Med 1999; 131: 492–501.
211 Benavente O, Hart R, Koudstaal P, Laupacis A, McBride R. Antiplatelet therapy for preventing stroke
in patients with non-valvular atrial fibrillation and no previous history of stroke or transient ischemic
attacks (Cochrane Review). In: The Cochrane Library, 4. Oxford: Update Software, 2000.
212 Taylor FC, Cohen H, Ebrahim S. Systematic review of long term anticoagulation or antiplatelet
treatment in patients with non-rheumatic atrial fibrillation. BMJ 2001; 322: 321–6.213 Chambers BR, You RX, Donnan GA. Carotid endarterectomy for asymptomatic carotid stenosis
(Cochrane Review). In: The Cochrane Library, 4. Oxford: Update Software, 2000.
214 Benavente O, Moher D, Pham B. Carotid endarterectomy for asymptomatic carotid stenosis: a
meta-analysis. BMJ 1998; 317: 1477–80.
215 Antiplatelet Trialists’ Collaboration. Collaborative overview of randomised trials of antiplatelet
therapy – 1: Prevention of death, myocardial infarction, and stroke by prolonged antiplatelet therapy
in various categories of patients. BMJ 1994; 308: 81–106.
216 Johnson ES. A metaregression analysis of the dose-response effect of aspirin on stroke. Archives ofInternal Medicine 1999; 159: 1248–53.
217 Hankey GJ, Sudlow CLM, Dunbabin DW. Thienopyridines or aspirin to prevent stroke and other
serious vascular events in patients at high risk of vascular disease? A systematic review of the evidence
from randomised trials. Stroke 2000; 31: 1779–84.
218 Hankey GJ, Sudlow CLM, Dunbabin DW. Thienopyridine derivatives (ticlopidine, clopidogrel)
versus aspirin for preventing stroke and other serious vascular events in high vascular risk patients
(Cochrane Review). In: The Cochrane Library, 4. Oxford: Update Software, 2000.
219 Hebert PR, Gaziano JM, Sau Chan K, Hennekens CH. Cholesterol lowering with statin drugs, risk ofstroke, and total mortality. An overview of randomised trials. JAMA 1997; 278: 313–21.
220 Gueyffier F, Boissel J-P, Boutitie F et al. for the INDANA Project collaborators. Effect of
antihypertensive treatment in patients having already suffered from stroke: gathering the evidence.
Stroke 1997; 28: 2557–62.
Stroke 237

d:/postscript/03-CHAP3_1.3D – 27/1/4 – 9:27
[This page: 238]
221 PROGRESS Management Committee. Blood pressure lowering for the secondary prevention of
stroke: rationale and design of PROGRESS. J Hypertension 1996; 14 (Suppl. 2): S41–6.
222 PROGRESS Collaborative Group. Randomised trial of a perindopril-based blood-pressure lowering
regimen among 6105 individuals with previous stroke or transient ischaemic attack. Lancet 2001; 358:1033–41.
223 Rodgers A, MacMahon S, Gamble G et al. for the UK TIA Collaborative Group. Blood pressure and
risk of stroke in patients with cerebrovascular disease BMJ 1996; 313: 147.
224 Cina CS, Clase CM, Haynes RB. Carotid endarterectomy for symptomatic carotid stenosis (Cochrane
Review). In: The Cochrane Library, 4. Oxford: Update Software, 2000.
225 Cao PG, De Rango P, Zannetti S, Giordano G, Ricci S, Celani MG. Eversion versus conventional
carotid endarterectomy for preventing stroke (Cochrane Review). In: The Cochrane Library, Issue 1,
2001. Oxford: Update Software.226 Tangkanakul C, Counsell C, Warlow C. Local versus general anaesthesia for carotid endarterectomy
(Cochrane Review). In: The Cochrane Library, 4. Oxford: Update Software, 2000.
227 Counsell C, Salinas R, Warlow C, Naylor R. Patch angioplasty versus primary closure for
carotid endarterectomy (Cochrane Review). In: The Cochrane Library, 4. Oxford: Update Software,
2000.
228 Counsell C, Warlow C, Naylor R. Patches of different types for carotid patch angioplasty (Cochrane
Review). In: The Cochrane Library, 4. Oxford: Update Software, 2000.
229 Crawley F, Brown MM. Percutaneous transluminal angioplasty and stenting for vertebral arterystenosis (Cochrane Review). In: The Cochrane Library, 4. Oxford: Update Software, 2000.
230 Crawley F, Brown MM. Percutaneous transluminal angioplasty and stenting for carotid artery
stenosis (Cochrane Review). In: The Cochrane Library, 4. Oxford: Update Software, 2000.
231 Counsell C, Salinas R, Naylor R, Warlow C. Routine or selective carotid artery shunting for carotid
endarterectomy (and different methods of monitoring in selective shunting) (Cochrane Review). In:
The Cochrane Library, 4. Oxford: Update Software, 2000.
232 CAVATAS investigators. Endovascular versus surgical treatment in patients with carotid stenosis in
the Carotid and Vertebral Artery Transluminal Angioplasty Study (CAVATAS): a randomised trial.Lancet 2001; 357: 1729–37.
233 Spence D, Eliasziw M. Endarterectomy or angioplasty for treatment of carotid stenosis? Lancet 2001;
357: 1722–3.
234 Stroke Editorial Office. Major Ongoing Stroke Trials. Stroke 2001; 32: 1449–57.
235 Alamowitch S, Eliasziw M, Algra A et al. for the NASCET Group. Risk, causes, and prevention of
ischaemic stroke in elderly patients with symptomatic internal carotid artery stenosis. Lancet 2001;
357: 1154–60.
236 Rothwell PM. Carotid endarterectomy and prevention of stroke in the very elderly. Lancet 2001; 357:1142–3.
237 Hannan EL, Popp J, Tranmer B et al. Relationship between provider volume and mortality for carotid
endarterectomies in New York State. Stroke 1998; 29: 2292–7.
238 Diener HC, Cunha L, Forbes C, et al. ESPS 2: dipyridamole and acetylsalicylic acid in the secondary
prevention of stroke. J Neurol Sci 1996; 143: 1–13.
239 Sudlow C, Baigent C on behalf of the Antithrombotic Trialists Collaboration. Different antiplatelet
regimens in the prevention of vascular events among patients at high risk of stroke: new evidence
from the antithrombotic trialists’ collaboration. Cerebrovasc Dis 1998; 8 (Suppl. 4): 68.240 Yusuf S, Zhao F, Mehta SR et al. for the Clopidogrel in Unstable Angina to Prevent recurrent Events
Trial Investigators (CURE). Effects of clopidogrel in addition to aspirin in patients with acute
coronary syndromes without ST-elevation. New Engl J Med 2001; 345: 494–502.
238 Stroke

d:/postscript/03-CHAP3_1.3D – 27/1/4 – 9:27
[This page: 239]
241 Mehta SR, Yusuf S, Peters RJG et al. for the CURE Investigators. Effects of pretreatment with
clopidogrel and aspirin followed by long term therapy in patients undergoing percutaneous coronary
intervention: the PCI-CURE study. Lancet 2001; 358: 527–33.
242 Liu M, Counsell C, Sandercock P. Anticoagulants for preventing recurrence following ischaemicstroke or transient ischaemic attack (Cochrane Review). In: The Cochrane Library, 4. Oxford: Update
Software, 2000.
243 Mohr JP, Thompson JLP, Lazar RM et al. for the Warfarin-Aspirin Recurrent Stroke Study Group. A
comparison of warfarin and aspirin for the prevention of recurrent ischaemic stroke. New Engl J Med
2001; 345: 1444–51.
244 Kothari R, Barsan W, Brott T et al. Frequency and accuracy of prehospital diagnosis of acute stroke.
Stroke 1995; 26: 937–41.
245 Kidwell C, Starkman S, Eckstein M et al. Identifying stroke in the field: prospective validation of theLos Angeles Prehospital Stroke Screen (LAPSS). Stroke 2000; 31: 71–6.
246 Libman RB, Wirkowski E, Alvir J, Rao TH. Conditions that mimic stroke in the emergency
department. Arch Neurol 1995; 52: 1119–22.
247 Kothari RU, Brott T, Broderick JP, Hamilton CA. Emergency physicians: accuracy in the diagnosis of
stroke. Stroke 1995; 26: 2238–41.
248 Sandercock P, Molyneux A, Warlow C. Value of computed tomography in patients with stroke:
Oxfordshire Community Stroke Project. BMJ 1985; 290: 193–7.
249 Davenport R, Dennis M. Neurological emergencies: stroke. J Neurol Neurosurg Psychiatry 2000; 68:277–88.
250 Dennis MS, Bamford JM, Molyneux AJ, Warlow CP. Rapid resolution of signs of primary
intracerebral haemorrhage in computed tomograms of the brain. BMJ 1987; 295: 379–81.
251 Allder S, Moody AR, Martel AL et al. Limitations of clinical diagnosis in acute stroke. Lancet 1999;
354: 1523.
252 Kapral MK. Preventive health care, update 2: Echocardiography for the detection of a cardiac
source of embolus in patients with stroke. Canadian Medical Association Journal 1999; 161:
989–96.253 Correia M, Silva M, Veloso M. Cooling therapy for acute stroke (Cochrane Review). In: The Cochrane
Library, 4. Oxford: Update Software, 2000.
254 Liu M, Counsell C, Wardlaw J. Fibrinogen depleting agents for acute ischaemic stroke (Cochrane
Review). In: The Cochrane Library, 4. Oxford: Update Software, 2000.
255 Gubitz G, Counsell C, Sandercock P, Signorini D. Anticoagulants for acute ischaemic stroke
(Cochrane Review). In: The Cochrane Library, 4. Oxford: Update Software, 2000.
256 Counsell C, Sandercock P. Low-molecular-weight heparins or heparinoids versus standard un-
fractionated heparin for acute ischaemic stroke (Cochrane Review). In: The Cochrane Library, 4.Oxford: Update Software, 2000.
257 Blood pressure in Acute Stroke Collaboration (BASC). Interventions for deliberately altering blood
pressure in acute stroke (Cochrane Review). In: The Cochrane Library, 4. Oxford: Update Software,
2000.
258 Prasad K, Shrivastava A. Surgery for primary supratentorial intracerebral haemorrhage (Cochrane
Review). In: The Cochrane Library, 4. Oxford: Update Software, 2000.
259 Gubitz G, Sandercock P, Counsell C. Antiplatelet therapy for acute ischaemic stroke (Cochrane
Review). In: The Cochrane Library, 4. Oxford: Update Software, 2000.260 Wardlaw JM, del Zoppo G, Yamaguchi T. Thrombolysis for acute ischaemic stroke (Cochrane
Review). In: The Cochrane Library, 4. Oxford: Update Software, 2000.
261 National Institute of Neurological Disorders and Stroke rt-PA Study Group. Tissue Plasminogen
Activator for acute ischemic stroke. New Engl J Med. 1995; 333: 1581–7.
Stroke 239
d:/postscript/03-CHAP3_1.3D – 27/1/4 – 9:27
[This page: 240]
262 Kwiatkowski TG, Libman RB, Frankel M et al. for the NINDS study group. Effects of tissue
Plasminogen Activator for acute ischemic stroke at one year. N Engl J Med 1999; 340: 1781–7.
263 Wood AJJ. Treatment of acute ischemic stroke. New Engl J Med 2000; 343: 710–22.
264 Hacke W, Kaste M, Fieschi C et al. Intravenous thrombolysis with recombinant tissue PlasminogenActivator for acute hemispheric stroke. JAMA 1995; 274: 1017–25.
265 Hacke W, Kaste M, Fieschi C et al. Randomized double blind placebo controlled trial of thrombolytic
therapy with intravenous alteplase in acute ischaemic stroke (ECASS II). Lancet 1998; 352: 1245–51.
266 Kalra L, Evans A, Perez I et al. Alternative strategies for stroke care: a prospective randomized
controlled trial. Lancet 2000; 356: 894–9.
267 Wolfe C, Rudd A, Dennis M, Warlow C, Langhorne P. Taking acute stroke care seriously. BMJ 2001;
323: 5–6.
268 Early Supported Discharge Trialists. Services for reducing duration of hospital care for acute strokepatients (Cochrane Review). In: The Cochrane Library, 4. Oxford: Update Software, 2000.
269 Weir RP. Rehabilitation of cerebrovascular disorder (stroke): early discharge and support: a critical
review of the literature. Christchurch: New Zealand Health Technology Assessment, 1999.
270 Rudd AG, Wolfe CDA, Tilling K, Beech R. Randomised controlled trial to evaluate early discharge
scheme for patients with stroke. BMJ 1997; 315: 1039–44.
271 Dekker R, Drost EA, Groothoff JW, Arendzen JH, van Gijn JC, Eisma WH. Effects of day-hospital
rehabilitation in stroke patients: a review of randomized clinical trials. Scandinavian Journal of
Rehabilitation Medicine 1998; 30: 87–94.272 Wade DT. Research into the black box of rehabilitation: the risks of a type III error. Clinical
Rehabilitation 2001; 15: 1–4.
273 Agency for Health Care Policy and Research (AHCPR). Diagnosis and treatment of swallowing
disorders (dysphagia) in acute-care stroke patients. Rockville, MD: Agency for Health Care Policy and
Research, 1999.
274 Bath PMW, Bath FJ, Smithard DG. Interventions for dysphagia in acute stroke (Cochrane Review).
In: The Cochrane Library, 4. Oxford: Update Software, 2000.
275 Norton B, Homer-Ward M, Donnelly MT, Long RG, Homes GKT. A randomised prospectivecomparison of percutaneous endoscopic gastrostomy and nasogastric tube feeding after acute
dysphagic stroke. BMJ 1996; 312: 13–16.
276 Langhorne P, Wagenaar R, Partridge C. Physiotherapy after stroke: more is better? Physiotherapy
Research International 1996; 1(2): 75–88.
277 Kwakkel G, Wagenaar RC, Koelman TW, Lankhorst GJ, Koetsier JC. Effects of intensity of
rehabilitation after stroke: a research synthesis. Stroke 1997; 28(8): 1550–6.
278 Kwakkel G, Wagenaar RC, Twisk KWR et al. Intensity of leg and arm training after primary middle-
cerebral artery stroke: a randomised controlled trial. Lancet 1999; 354: 191–6.279 Price CIM, Pandyan AD. Electrical stimulation for preventing and treating post-stroke shoulder pain
(Cochrane Review). In: The Cochrane Library, 4. Oxford: Update Software, 2000.
280 Moreland JD, Thomson MA, Fuoco AR. Electromyographic biofeedback to improve lower
extremity function after stroke: a meta-analysis. Archives of Physical Medicine & Rehabilitation
1998; 79: 134–40.
281 Greener J, Enderby P, Whurr R. Speech and language therapy for aphasia following stroke (Cochrane
Review). In: The Cochrane Library, 4. Oxford: Update Software, 2000.
282 Enderby P, Emerson J. Speech and language therapy: does it work? BMJ 1996; 312: 1655–8.283 Walker MF, Gladman JRF, Lincoln NB, Siemonsa P, Whiteley T. Occupational therapy for stroke
patients not admitted to hospital: a randomised controlled trial. Lancet 1999; 354: 278–80.
284 Gilbertson L, Langhorne P, Walker A, Allen A, Murray GD. Domiciliary occupational therapy for
patients with stroke discharged from hospital: randomised controlled trial. BMJ 2000; 320: 603–6.
240 Stroke

d:/postscript/03-CHAP3_1.3D – 27/1/4 – 9:27
[This page: 241]
285 Carlson M, Fanchiang S-P, Zemke R, Clark F. A meta-analysis of the effectiveness of occupational
therapy for older persons. American Journal of Occupational Therapy 1996; 50: 89–98.
286 Sulch D, Perez I, Melbourn A, Kalra L. Randomised controlled trial of integrated (managed) care
pathway for stroke rehabilitation. Stroke 2000; 31: 1929–34.287 Wade DT, Collen FM, Robb GF, Warlow CP. Physiotherapy intervention late after stroke and
mobility. BMJ 1992; 304: 609–613.
288 Werner RA, Kessler S. Effectiveness of an intensive outpatient rehabilitation program for postacute
stroke patients. American Journal of Phys Med & Rehabil 1996; 75: 114–120.
289 Mant J. Overview of the evidence for Stroke Family Care Workers. Proceedings of the Royal College of
Physicians of Edinburgh 2001; 31: S8: 44–9.
290 Mant J, Carter J, Wade DT, Winner S. The impact of an information pack on patients with stroke and
their carers: a randomised controlled trial. Clinical Rehabilitation 1998; 12: 465–76.291 Rodgers H, Atkinson C, Bond S et al. Randomised controlled trial of a comprehensive stroke
education program for patients and caregivers. Stroke 1999; 30: 2585–91.
292 Knapp P, Young J, House A, Forster A. Non-drug strategies to resolve psycho-social difficulties after
stroke. Age and Ageing 2000; 29: 23–30.
293 Lincoln NB, Majid MJ, Weyman N. Cognitive rehabilitation for attention deficits following stroke
(Cochrane Review). In: The Cochrane Library, 4. Oxford: Update Software, 2000.
294 Majid MJ, Lincoln NB, Weyman N. Cognitive rehabilitation for memory deficits following stroke
(Cochrane Review). In: The Cochrane Library, 4. Oxford: Update Software, 2000.295 Lehmann JF, Condon SM, Price R, DeLateur BJ. Gait abnormalities in hemiplegia: their correction by
ankle-foot orthoses. Arch Phys Med Rehabil 1987; 68: 763–71.
296 Beckerman H, Becher J, Lankhorst GJ, Verbeek ALM. Walking ability of stroke patients: efficacy of
thermocoagulation of tibial nerve blocking and a polypropylene ankle foot orthosis. Arch Phys Med
Rehabil 1996; 77: 1144–51.
297 Van Gijn J, Rinkel GJE. Sub-arachnoid haemorrhage: diagnosis, causes and management. Brain 2001;
124: 249–78.
298 Van der Wee N, Rinkel GJ, Hasan D, van Gijn J. Detection of sub-arachnoid haemorrhage on earlyCT: is lumbar puncture still needed after a negative scan? J Neurol Neurosurg Psychiatry 1995; 58:
357–9.
299 Cloft HJ, Joseph GJ, Dion JE. Risk of cerebral angiography in patients with sub-arachnoid
haemorrhage, cerebral aneurysm and arteriovenous malformation: a meta-analysis. Stroke 1999;
30: 317–20.
300 Roos YBWEM, Rinkel GJE, Vermeulen M, Algra A, van Gijn J. Antifibrinolytic therapy for
aneurysmal sub-arachnoid haemorrhage (Cochrane Review). In: The Cochrane Library, 4. Oxford:
Update Software, 2000.301 Ohman J, Heiskanen O. Timing of operation for ruptured supratentorial aneurysms: a prospective
randomised study. Journal of Neurosurgery 1989; 70: 55–60.
302 Whitfield PC, Kirkpatrick PJ. Timing of surgery for sub-arachnoid haemorrhage (Cochrane review).
In: The Cochrane Library, Issue 2, 2001. Oxford: Update Software.
303 Byrne JV, Sohn MJ, Molyneux AJ. Five year experience in using coil embolization for ruptured
intracranial aneurysms: outcomes and incidence of late rebleeding. J Neurosurg 1999; 90: 656–63.
304 Vanninen R, Koivisto T, Saari T et al. Ruptured intracranial aneurysms: acute endovascular
treatment with electrolytically detachable coils: a prospective randomised study. Radiology 1999;211: 325–336.
305 Feigin VL, Rinkel GJE, Algra A, Vermeulen M, van Gijn J. Calcium antagonists for aneurysmal sub-
arachnoid haemorrhage (Cochrane Review). In: The Cochrane Library, 4. Oxford: Update Software,
2000.
Stroke 241

d:/postscript/03-CHAP3_1.3D – 27/1/4 – 9:27
[This page: 242]
306 Evers A, Ament A, Blaauw G. Economic evaluation in stroke research: a systematic review. Stroke
2000; 31: 1046–53.
307 Holloway RG, Benesch CG, Rahilly CR, Courtright CE. A systematic review of cost-effectiveness
research of stroke evaluation and treatment. Stroke 1999; 30: 1340–9.308 Nussbaum ES, Heros RC, Erickson DL. Cost-effectiveness of carotid endarterectomy. Neurosurgery
1996; 38: 237–44.
309 Kuntz KM, Kent KC. Is carotid endarterectomy cost-effective? Circulation 1996; 94 (Suppl. 2):
194–8.
310 Matchar DB, Pauk JS, Lipscomb J, Moore WS (ed.). A health policy perspective on carotid
endarterectomy: cost, effectiveness and cost-effectiveness. Philadelphia, Pa: WB Saunders, 1996,
pp. 680–9.
311 Cronenwett JL, Birkmeyer JD, Nackman GB et al. Cost-effectiveness of carotid endarterectomy inasymptomatic patients. J Vasc Surg 1997; 25: 298–311.
312 Gage BF, Cardinalli AB, Albers GW, Owens DK. Cost-effectiveness of warfarin and aspirin for
prophylaxis of stroke in patients with nonvalvular atrial fibrillation. JAMA 1995; 274: 1839–45.
313 Lightowlers S, McGuire A. Cost-effectiveness of anticoagulation in non-rheumatic atrial fibrillation
in the primary prevention of ischemic stroke. Stroke 1998; 29: 1827–32.
314 Parry D, Fitzmaurice D, Raftery J. Anticoagulation management in primary care: a trial-based
economic evaluation. British Journal of Haematology 2000; 111: 530–3.
315 Eccles M, Freemantle N, Mason J and the North of England Aspirin Guideline Development Group.North of England evidence based guideline development project: guideline on the use of aspirin as
secondary prophylaxis for vascular disease in primary care. BMJ 1998; 316: 1303–9.
316 Scottish Intercollegiate Guidelines Network. SIGN Guidelines: An introduction to SIGN methodology
for the development of evidence based clinical guidelines. SIGN Publication No 38. Edinburgh: 1999.
317 Royal College of Physicians of Edinburgh. Consensus statement: stroke treatment and service delivery.
RCPE, Edinburgh, November 2000.
318 Scottish Intercollegiate Guidelines Network. Management of carotid stenosis and carotid endarter-
ectomy. Pilot edition. SIGN Publication No 14. Edinburgh: 1997.319 Royal College of Physicians of Edinburgh. Consensus conference on medical management of stroke 26 &
27th May 1998 – consensus statement (updated November 2000). Royal College of Physicians of
Edinburgh, 2000.
320 Thomson R, Parkin D, Eccles M et al. Decision analysis and guidelines for anticoagulant therapy to
prevent stroke in patients with atrial fibrillation. Lancet 2000; 355: 956–62.
321 Palaretti G, Hirsh J, Legnani C et al. Oral anticoagulation treatment in the elderly: a nested
prospective case control study. Arch Intern Med. 2000; 160: 470–8.
322 Fitzmaurice DA, Mant J, Murray ET, Hobbs FDR. Anticoagulation to prevent stroke in atrialfibrillation. BMJ 2000; 321: 1156.
323 Goreclick PB, Sacco RL, Smith DB et al. Prevention of a first stroke: a review of guidelines and a
multidisciplinary consensus statement from the National Stroke Association. JAMA 1999; 281:
1112–20.
324 Scottish Intercollegiate Guidelines Network. Antithrombotic therapy. SIGN Publication No 36.
Edinburgh: 1999.
325 Scottish Intercollegiate Guidelines Network. Management of patients with stroke 1: assessment,
investigation, immediate management and secondary prevention. Pilot edition. SIGN Publication No13. Edinburgh: 1997.
326 Johnson ES. A meta-regression analysis of the dose-response effect of aspirin on stroke. Archives of
Internal Medicine 1999; 159: 1248–53.
327 Barnett HJM, Eliasziw M, Meldrum HE. Prevention of ischaemic stroke. BMJ 1999; 318: 1539–43.
242 Stroke

d:/postscript/03-CHAP3_1.3D – 27/1/4 – 9:27
[This page: 243]
328 Wells PS, Lensing AW, Hirsh J. Graduated compression stockings in the prevention of post-operative
venous thrombo-embolism: a meta-analysis. Arch Intern Med 1994; 154: 67–72.
329 BNF Editorial staff. British National Formulary 40. BMA and Royal Pharmaceutical Society of Great
Britain, September 2000.330 Hart RG, Pearce LA, McBride R et al. Factors associated with ischaemic stroke during aspirin therapy
in atrial fibrillation. Analysis of 2012 participants in the SPAF I-III clinical trials. Stroke 1999; 30:
1223–9.
331 Rothwell PM, Warlow CP. Prediction of benefit from carotid endarterectomy in individual patients: a
risk modelling study. Lancet 1999; 353: 2105–10.
332 Ramsay LE, Williams B, Johnston GD et al. British Hypertension Society guidelines for hypertension
management 1999: summary. BMJ 1999; 319: 630–5.
333 Hankey GJ, Warlow CP. Treatment and secondary prevention of stroke: evidence, costs, and effectson individuals and populations. Lancet 1999; 354: 1457–63.
334 Rudd A, Goldacre M, Amess M et al. (eds). Health outcome indicators: stroke. Report of a working
group to the Department of Health. Oxford: National Centre for Health Outcomes Development,
1999.
335 Mant J, Hicks N. Detecting differences in quality of care: the sensitivity of measures of process and
outcome in treating acute myocardial infarction. BMJ 1995; 311: 793–6.
336 Pomeroy VM, Tallis RC. Need to focus research in stroke rehabilitation. Lancet 2000; 355: 836–7.
337 Wade DT. Research into rehabilitation: what is the priority? Clinical Rehabilitation 2001; 15: 229–32.338 The King’s Fund. Consensus conference: Treatment of stroke. BMJ 1988; 297: 126–8.
339 Young JB. The primary care stroke gap. British Journal of General Practice 2001; 51: 788–801.
340 Rothwell PM. The high cost of not funding stroke research: a comparison with heart disease and
cancer. Lancet 2001; 357: 1612–16.
Stroke 243

d:/postscript/03-CHAP3_1.3D – 27/1/4 – 9:27
[This page: 244]