3 ways to improve your regression - salford...
TRANSCRIPT

3 Ways to Improve Your Regression:Part 1
January 20, 2016
Outline
• What is OLS?o A review
• Common issues in standard linear regression
• Solutions to OLS
o Nonlinear regression splines
o Stochastic gradient boosting
o Random Forests
• Applied example - concrete strength
• Case studies and other applications
• Questions
• Part 2: advanced techniques, automation
Salford Systems © 2016 2
What is OLS?
Salford Systems © 2016 3
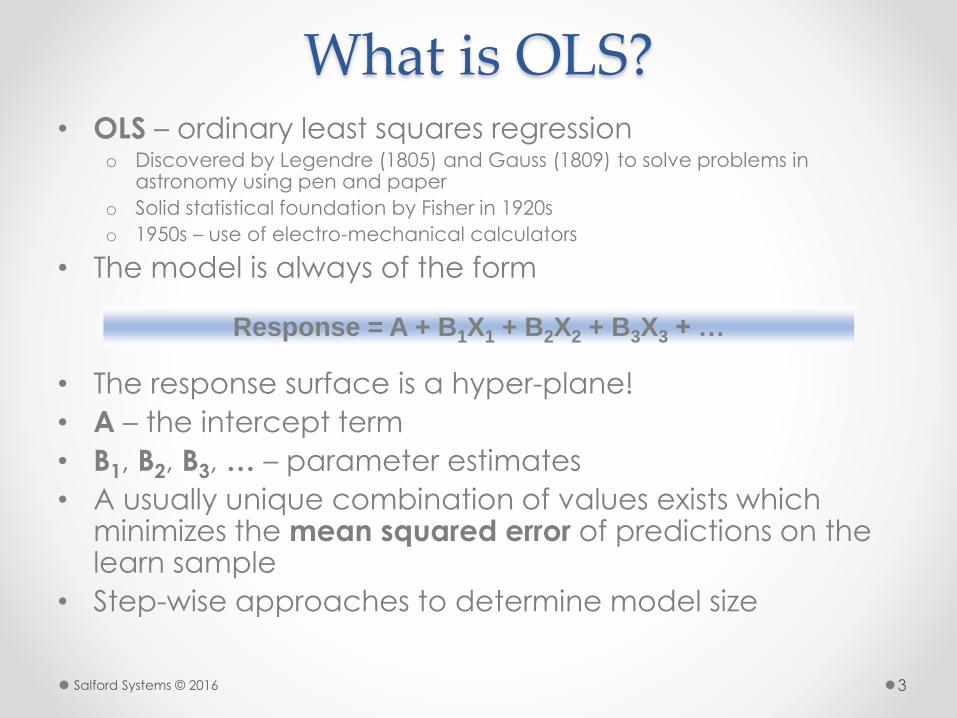
• OLS – ordinary least squares regressiono Discovered by Legendre (1805) and Gauss (1809) to solve problems in
astronomy using pen and paper
o Solid statistical foundation by Fisher in 1920s
o 1950s – use of electro-mechanical calculators
• The model is always of the form
• The response surface is a hyper-plane!
• A – the intercept term
• B1, B2, B3, … – parameter estimates
• A usually unique combination of values exists which minimizes the mean squared error of predictions on the learn sample
• Step-wise approaches to determine model size
Response = A + B1X1 + B2X2 + B3X3 + …
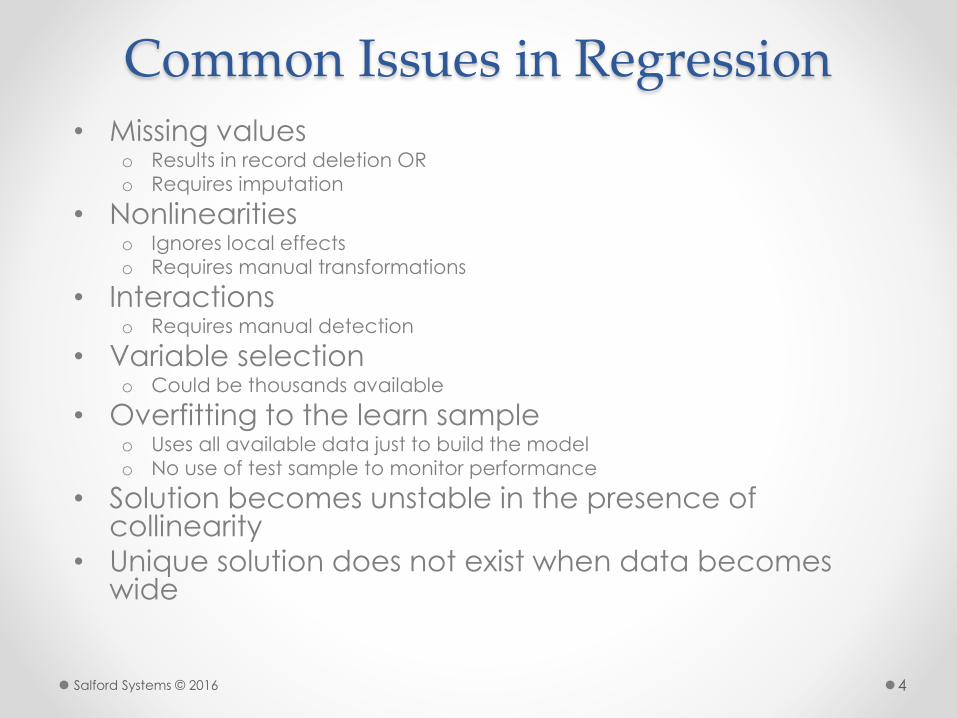
Common Issues in Regression• Missing values
o Results in record deletion OR
o Requires imputation
• Nonlinearitieso Ignores local effects
o Requires manual transformations
• Interactionso Requires manual detection
• Variable selectiono Could be thousands available
• Overfitting to the learn sampleo Uses all available data just to build the model
o No use of test sample to monitor performance
• Solution becomes unstable in the presence of collinearity
• Unique solution does not exist when data becomes wide
Salford Systems © 2016 4

Solutions to OLS Problems
1) Nonlinear regression splines
2) Stochastic gradient boosting
3) Random Forests
• These methods automatically perform what OLS
does not:o Variable selection
o Missing value handling
o Nonlinearity detection
o Interaction detection
• Use of a test sample prevents overfitting
• Collinearity is not an issue
Salford Systems © 2016 5

Concrete Strength• Simple civil engineering example to illustrate
shortcomings of OLS
• Target: o STRENGTH
o Compressive strength of concrete ranging from 2-82 megapascals
• Predictors:o CEMENT
o BLAST_FURNACE_SLAG
o FLY_ASH
o WATER
o SUPERPLASTICIZER
o COARSE_AGGREGATE
o FINE_AGGREGATE
o AGE
I-Cheng Yeh, "Modeling of strength of high performance concrete using artificial neural networks," Cement and Concrete Research, Vol. 28, No. 12, pp. 1797-1808 (1998)
Salford Systems © 2016 6
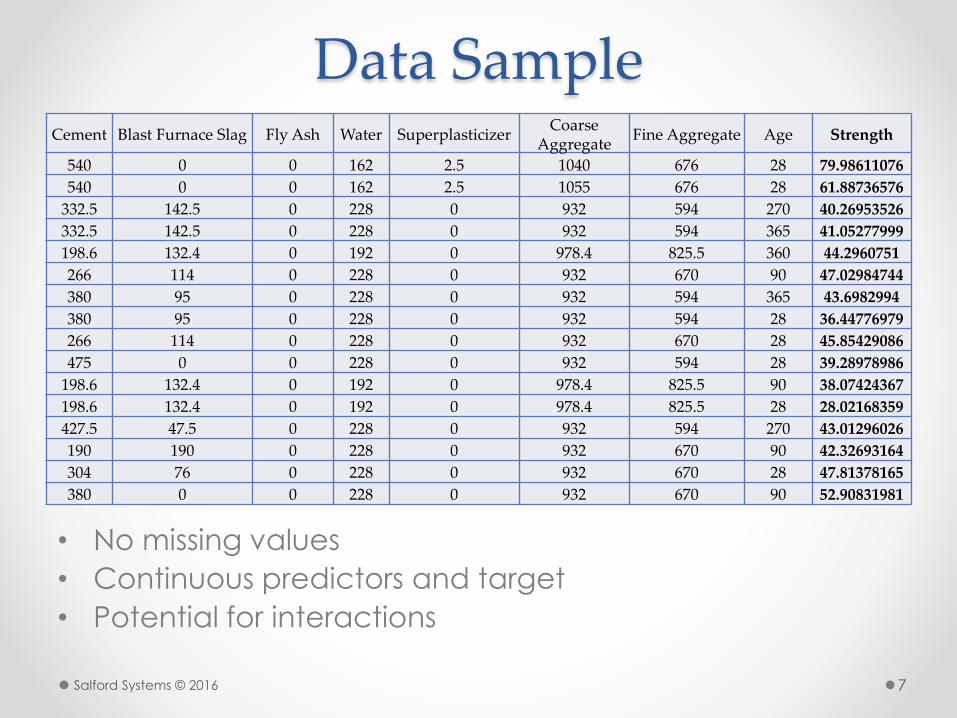
Data Sample
Salford Systems © 2016 7
Cement Blast Furnace Slag Fly Ash Water SuperplasticizerCoarse
AggregateFine Aggregate Age Strength
540 0 0 162 2.5 1040 676 28 79.98611076
540 0 0 162 2.5 1055 676 28 61.88736576
332.5 142.5 0 228 0 932 594 270 40.26953526
332.5 142.5 0 228 0 932 594 365 41.05277999
198.6 132.4 0 192 0 978.4 825.5 360 44.2960751
266 114 0 228 0 932 670 90 47.02984744
380 95 0 228 0 932 594 365 43.6982994
380 95 0 228 0 932 594 28 36.44776979
266 114 0 228 0 932 670 28 45.85429086
475 0 0 228 0 932 594 28 39.28978986
198.6 132.4 0 192 0 978.4 825.5 90 38.07424367
198.6 132.4 0 192 0 978.4 825.5 28 28.02168359
427.5 47.5 0 228 0 932 594 270 43.01296026
190 190 0 228 0 932 670 90 42.32693164
304 76 0 228 0 932 670 28 47.81378165
380 0 0 228 0 932 670 90 52.90831981
• No missing values
• Continuous predictors and target
• Potential for interactions
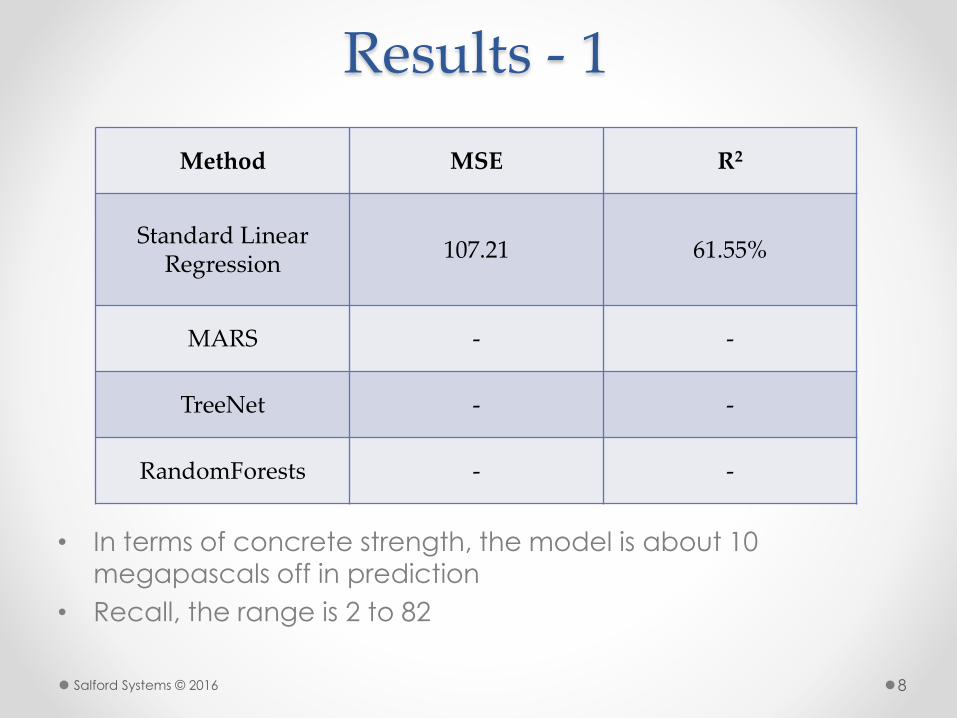
Results - 1
Method MSE R2
Standard Linear Regression
107.21 61.55%
MARS - -
TreeNet - -
RandomForests - -
Salford Systems © 2016 8
• In terms of concrete strength, the model is about 10
megapascals off in prediction
• Recall, the range is 2 to 82
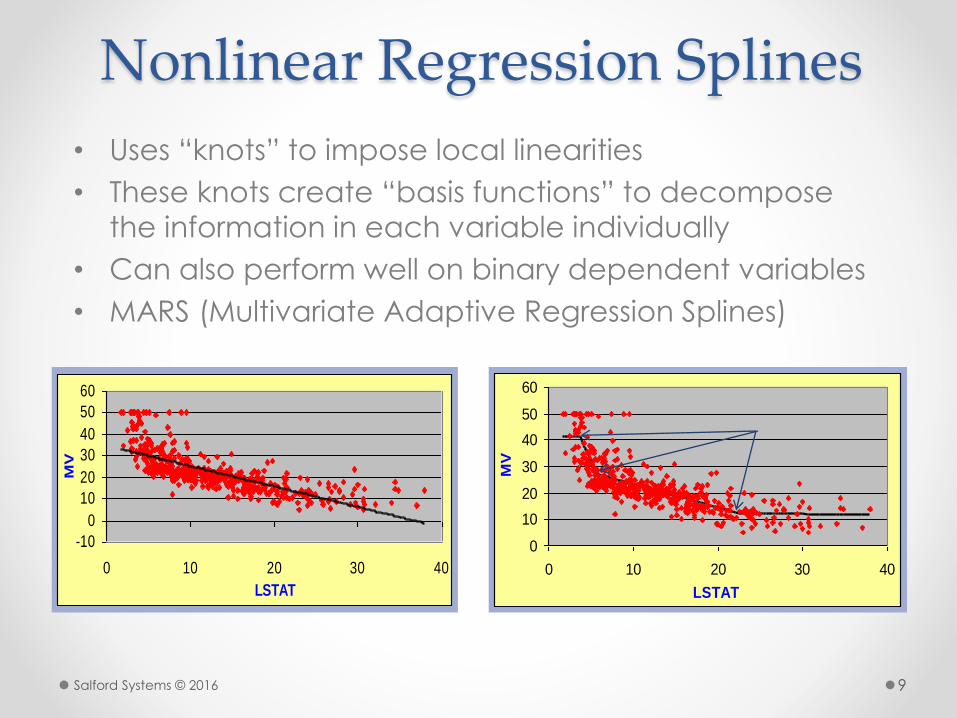
Nonlinear Regression Splines
• Uses “knots” to impose local linearities
• These knots create “basis functions” to decompose
the information in each variable individually
• Can also perform well on binary dependent variables
• MARS (Multivariate Adaptive Regression Splines)
0
10
20
30
40
50
60
0 10 20 30 40
LSTAT
MV
-10
0
10
20
30
40
50
60
0 10 20 30 40
LSTAT
MV
Salford Systems © 2016 9
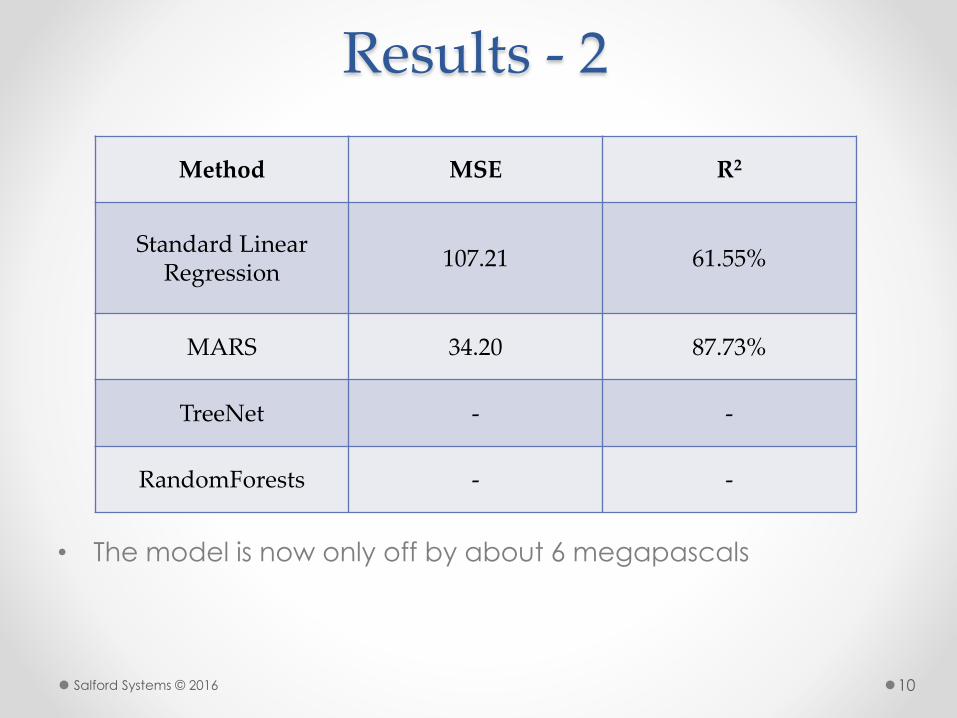
Results - 2
Method MSE R2
Standard Linear Regression
107.21 61.55%
MARS 34.20 87.73%
TreeNet - -
RandomForests - -
Salford Systems © 2016 10
• The model is now only off by about 6 megapascals
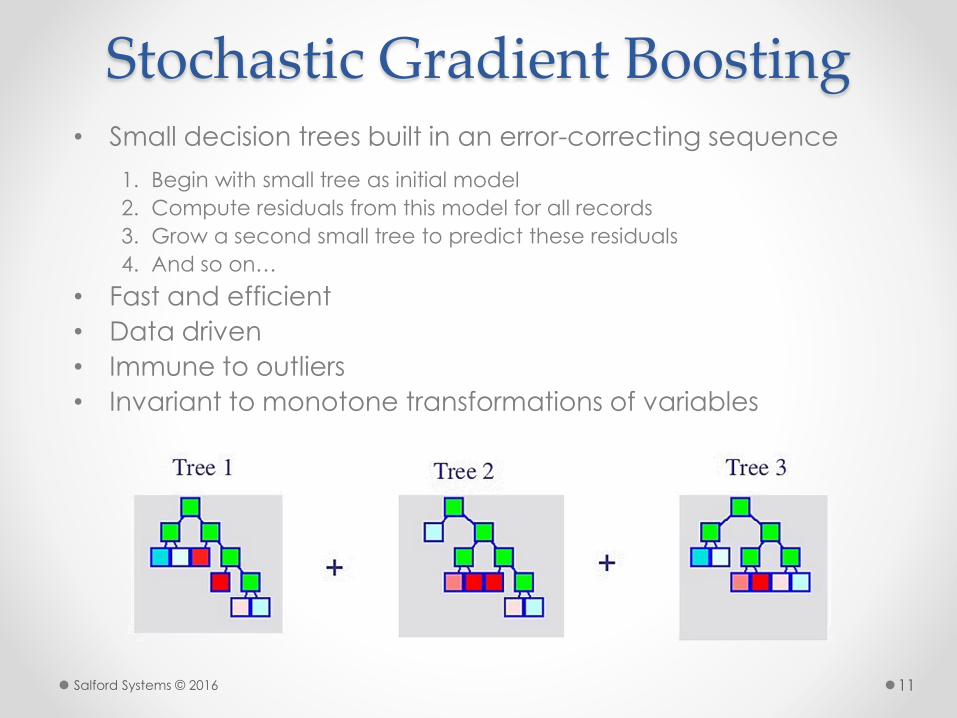
Stochastic Gradient Boosting• Small decision trees built in an error-correcting sequence
1. Begin with small tree as initial model
2. Compute residuals from this model for all records
3. Grow a second small tree to predict these residuals
4. And so on…
• Fast and efficient
• Data driven
• Immune to outliers
• Invariant to monotone transformations of variables
Salford Systems © 2016 11

Results - 3
Method MSE R2
Standard Linear Regression
107.21 61.55%
MARS 34.20 87.73%
TreeNet 37.47 86.56%
RandomForests - -
Salford Systems © 2016 12
• The model is still only off by about 6 megapascals
Random Forests
• Ensemble of trees built on bootstrap samples
• Algorithm:o Each tree is grown on a bootstrap sample from the learning data
o During tree growing, only P predictors are selected and tried at each node
o By default, P is the square root of total predictors
• The overall prediction is determined by averaging
• Law of Large Numbers ensures convergence
• The key to accuracy is low correlation and bias
• To keep bias low, trees are grown to maximum depth
• All major advantages of a single tree are preserved
Salford Systems © 2016 13

Final Results*
Method MSE R2
Standard Linear Regression
107.21 61.55%
MARS 34.20 87.73%
TreeNet 37.47 86.56%
RandomForests 25.54 90.84%
*Results will vary depending on parameters, testing methods, random seeds, etc.
Salford Systems © 2016 14
• The model is now only off by about 5 megapascals

Case Studies and Other Applications
• Epidemiology
• Real Estate
• Ecology
• Public Health
• Marketing
• Finance
• A Comparison of Standard Regression and MARS in the Development of a Model of Obesity
• Modeling Biodiversity Data in a Spatial GIS-Environment: MARS and Beyond
• Prediction of FICO Scores using TreeNet
• Predicting Product Sales (grocery chain)
Salford Systems © 2016 15

Part 2• Nonlinear regression splines
o Interpreting splines in OLS form
o Plotting
o Interaction detection
• Stochastic gradient boostingo Partial dependency plots
o Spline approximations
o Interaction control language
• More examples and case studies
Salford Systems © 2016 16

Questions?
• Follow-up email:o Recording of webinar
o PowerPoint slides
o SPM 30-day trial download instructions
o Tutorial with concrete dataset
• Part 2: Next Wednesday, January 27 @ 10 AM
• CSP: San Diego 2/18-2/20
Salford Systems © 2016 17